Embed Size (px)
Citation preview

Chapter 1
Monitoring The Weather
Weather StudiesIntroduction to Atmospheric Science
American Meteorological Society
Credit: This presentation was prepared for AMS by Michael Leach, Professor of Geography at New Mexico State University - Grants
2
Case-in-Point There have been monumental advances in monitoring of weather– Case-in-point – the
blizzard of 1888
– A similar storm in December 2000 Still lacked data on sea
surface temperatures –overestimated snowfall
– Today, though not exact, we are much better at monitoring and forecasting weather Satellites
Radiosondes
Surface observationsThe Blizzard of 1888

3
Driving Question
What are some basic characteristics of the
atmosphere and weather?
– This chapter will introduce and describe some
of the tools and basic understandings that will
guide your investigation of the atmosphere

4
Weather and Climate
Weather is the state of the atmosphere at some place and time
– Described with quantitative variables Temperature, humidity, cloudiness, precipitation, wind speed,
wind direction
– Meteorology is the study of the atmosphere and the processes that cause weather
Climate is weather conditions at some locality averaged over a specified time period– Climate is an average of the weather, figured over the
last 30-years and updated every decade
– A locale’s climate also includes weather extremes
5
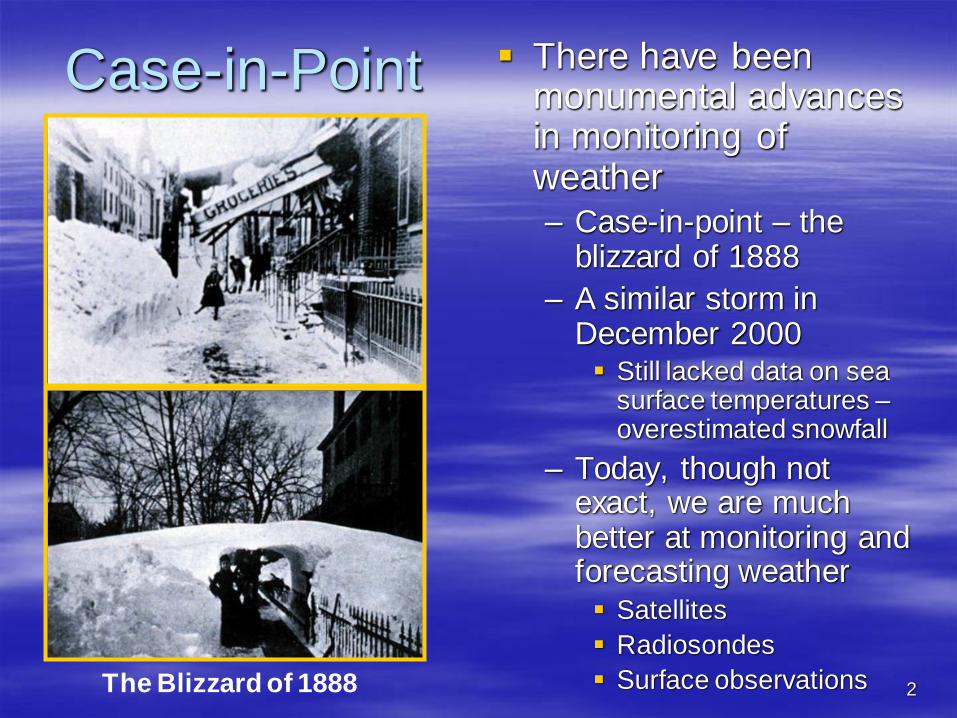
Sources of Weather Information
Television
– The Weather Channel and local newscasts
Radio– NOAA Weather Radio
Continuous broadcasts repeated every 4 - 6 minutes
Interrupted with warnings
and watches
The Internet

6
Weather Systems and Weather Maps
Weather info received via TV,
radio, or the Internet includes
– Weather maps
National
Regional
– Satellite/radar images
– Data on current/past
conditions
– Weather forecasts
Short-term
– 24 – 48 hours
Long-term
– Up to 7 days or longer Automated Surface Observing
System (ASOS)

7
Pressure Systems2 Types
High Pressure
Systems, or
“Anticyclones”
Low Pressure
Systems, or
“Cyclones”
8
Pressure Systems, Continued High and low refer to air pressure
– High pressure area is relatively high compared to surrounding air
– Low pressure area is relatively low compared to surrounding air
Highs– Fair weather
– Clockwise rotation of sinking air (in Northern Hemisphere)
– Generally track toward the east and southeast
Lows– Stormy weather
– Counterclockwise rotation of rising air (in Northern Hemisphere)
– Generally track toward the east and northeast
– Lows tracking across the northern U.S. or southern Canada produce less moisture than lows tracking across the southern U.S.
– Weather to the west and north – usually cold
– Weather to the south and east – usually warm

9
Pressure Systems, ContinuedHigh and Low Pressure Centers
Arrows indicate surface horizontal winds

10
Air Masses
Huge volume of air covering thousands of square kilometers
Horizontally relatively uniform in characteristics– Temperature
– Humidity
Gathers characteristics from its source region– Cold, dry air masses form at higher latitudes over
continents
– Cold, humid air masses form at higher latitudes over maritime surfaces
– Warm, dry air masses form over continents in subtropical regions
– Warm, humid air masses form near the equator or in the subtropics over maritime surfaces

11
FrontsWarm Front
© American Meteorological Society
Cold Front

12
Characteristics of Air Masses & Fronts Polar air masses are colder in winter, and milder in
summer
Tropical air masses have less seasonal variation, due to nearly uniform sunlight duration and intensity
Air masses modify as they move away from source region– Starts taking on the characteristics of the area it is passing over
Fronts are 3-dimensional– Where the front intersects the earth surface is shown with the front
symbol on the map
Warm front clouds and precipitation occur over a wide band, and may occur over 1 to 2 days– Usually light precipitation
Cold front clouds and precipitation occur over a narrow band, and may occur over minutes to hours– May be very heavy precipitation

13
Characteristics of Air Masses &
Fronts, Continued Wind directions are different on the two sides of a
front
Some fronts have no clouds or precipitation.– Passage indicated by wind shift, and
temperature/humidity changes
In summer, temperature can be nearly the same on both sides of a cold front– Difference will be humidity
Fronts are anchored to lows on a weather map.– Counterclockwise flow brings contrasting air masses
together to form fronts
Thunderstorms/severe weather often occur in the warm, humid air mass located between the cold and warm front

14
Other Weather Characteristics In coastal areas
– Lake/sea breezes may lower summer temperatures
– May push 10-50 km (6 -30 miles) inland from the coast/shore
Heavy lake-effect snow on Great Lakes or Great Salt Lake– Late fall and winter
– Downwind (eastern and southern shores)
Central U.S.– Most common location of tornadoes in the spring
Thunderstorms– Common in FL, western High Plains and eastern slopes of the
Rockies
– Rare along Pacific Coast and in HI
Tropical storms and hurricanes impact Atlantic and Gulf coasts– Mostly August through October
– Rare on West Coast

15
Describing the State of the AtmosphereWhat do Forecasters Tell Us?
Maximum Temperature– Usually occurs in early to mid-afternoon
Minimum temperature– Usually occurs around sunrise
Dewpoint (frost point)– The temperature at which air must be cooled at constant pressure
to become saturated with water vapor and for dew (or frost) to form
Relative humidity– A percentage; the ratio of the actual concentration of the water
vapor component of air compared to the concentration the air would have if saturated with water vapor
Relative humidity will change throughout the day as the temperature varies
Generally highest around sunrise and lowest when warmest
Precipitation amounts– General rule – 10” of snow = 1” of precipitation
16
Describing the State of the AtmosphereWhat do Forecasters Tell Us? (Continued)
Air Pressure– And its tendency (rising or falling)
– Falling may indicate approaching cold front
Wind direction and speed– Wind direction is the direction wind is blowing from
Example; a west wind is blowing from the west, toward the east
Sky cover– Fraction of the sky covered in clouds
NWS Weather watch – issued when hazardous weather is considered possible
NWS Weather warning – issued when hazardous weather is imminent or actually taking place

17
Weather Satellite Imagery
Two major types of satellite orbits
– Geostationary
High orbits
– 36,000 km (22,300 miles) high
Orbits planet at same rate as Earth’s rotation and in same
eastward direction
Currently 2 of these provide a complete view of much of N.
America and adjacent oceans to latitudes of about 60 degrees
– Positioned over equator at 750 W longitude, 1350 W longitude
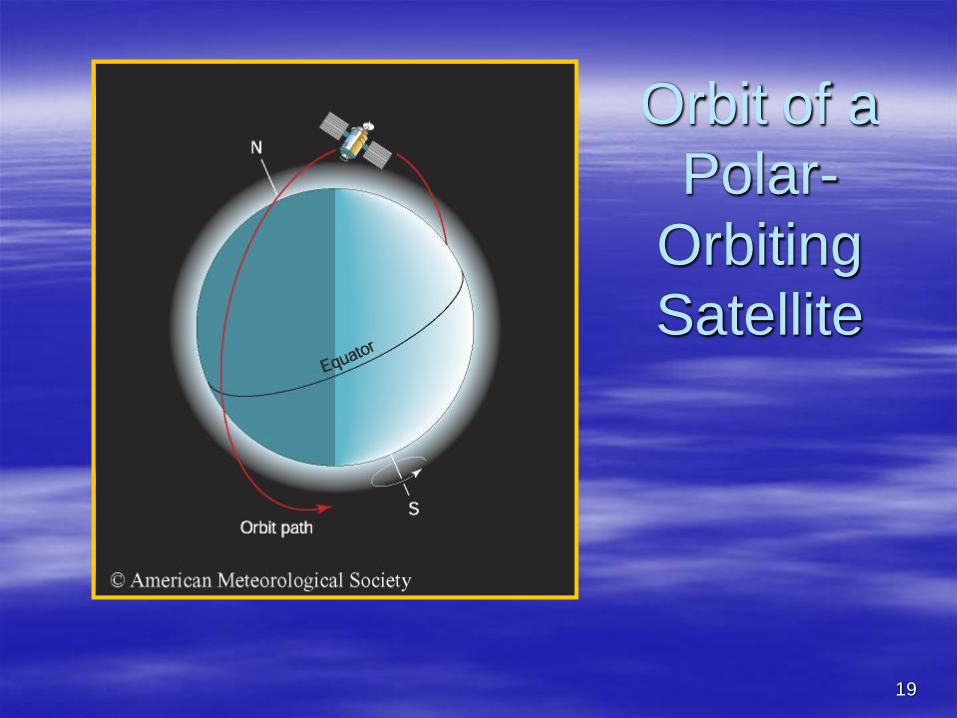
– Polar orbiting
Low orbits
– 800-1000 km (~500-600 miles) high
Provides overlapping north-south strips of images
Passes over the same point twice every 24 hours

18
Orbit of a Geostationary Satellite
19
Orbit of a
Polar-
Orbiting
Satellite

20
Visible– Black and
white photograph of the planet
– Only available during daylight hours
– Highly reflective surfaces appear bright white and less reflective surfaces are darker
Weather Satellite Imagery

21
Infrared– Available
anytime, not just during daylight
– Provides temperature comparison of features within image
– Whiter = colder Higher cloud
tops appear whiter, because they are colder
Weather Satellite Imagery

22
Water vapor imagery
– Enables tracking of plumes of moisture
– Shades of white = increasing moisture
– Upper-level clouds appear milky to bright white
Weather Satellite Imagery

23
Weather Radar Complements
satellite
surveillance
Doppler radar
detects
movement
– Excellent tool
to forecast
tornadoes

24
Combination of Images Composite of
IR and Radar

25
Sky Watching You can determine much about the weather by
watching the sky
Clouds are aggregates of tiny water droplets, ice
crystals, or some combination of both
– A cloud in contact with the ground is fog
– Cloud forms:
Stratiform clouds are sheet-like clouds formed in horizontal layers
– Form where air ascends gradually over a broad region
Cumuliform clouds are puffy, like cotton balls
– More vigorous ascent of air over a smaller area
– Under the right conditions can build vertically into a
cumulonimbus (thunderstorm) cloud
The appearance of high, wispy, feather-like clouds (composed of
ice) in the western sky is often the first sign of an approaching
warm front

26
Cloud Forms These high thin cirrus clouds appear fibrous
because they are composed of mostly tiny
ice crystals

27
Cloud Forms These relatively low clouds are composed of
tiny water droplets and have more sharply
defined edges than ice-crystal clouds

28
Cloud Forms Fair weather cumulus clouds are most
common during the warmest time of day and
then vaporize after sunset

29
Cloud Forms Clouds of vertical development
– Merging and vertically-growing cumulus clouds
Can become Cumulonimbus clouds
– Nimbo, nimbus prefix or suffix = rain producing
– These clouds always produce lightning and sometimes
heavy rain, hail, or strong and gusty surface winds

30
Cloud Forms
Clouds may move in different directions at
different altitudes
– Indicates horizontal wind shifts with altitude

Essay: Weather Maps, Historical
Perspective
U.S. Army Signal Corps weather map dated 1 September 1872


![Thermophysicalpropertiesofdryandhumidair ... · range of temperature and pressure. Data on gW of compressed humid air [7], humid nitrogen, humid argon, and humid carbon dioxide [9]](https://img.pdfslide.us/doc/110x75/5e626081cfea87225a37645c/thermophysicalpropertiesofdryandhumidair-range-of-temperature-and-pressure.jpg)