Embed Size (px)
Citation preview
Fort Hays State University Fort Hays State University
FHSU Scholars Repository FHSU Scholars Repository
Master's Theses Graduate School
Spring 2011
Geoenabling A Rural Community Through Web GIS: A Case Study Geoenabling A Rural Community Through Web GIS: A Case Study
Of The City Of Hays, Ellis County Kansas Of The City Of Hays, Ellis County Kansas
Eamonn W. Coveney Fort Hays State University
Follow this and additional works at: https://scholars.fhsu.edu/theses
Part of the Geology Commons
Recommended Citation Recommended Citation Coveney, Eamonn W., "Geoenabling A Rural Community Through Web GIS: A Case Study Of The City Of Hays, Ellis County Kansas" (2011). Master's Theses. 138. https://scholars.fhsu.edu/theses/138
This Thesis is brought to you for free and open access by the Graduate School at FHSU Scholars Repository. It has been accepted for inclusion in Master's Theses by an authorized administrator of FHSU Scholars Repository.
Geoenabling a Rural Community Through Web GIS:
A Case Study of the City of Hays,
Ellis County Kansas
being
A Thesis Presented to the Graduate Faculty
of the Fort Hays State University in
Partial Fulfillment of the Requirements for
the Degree of Master of Science
by
Eamonn W. Coveney
B.S., Fort Hays State University
Date ___________________________ Approved __________________________ Major Professor
Approved __________________________ Chair, Graduate Council

i
ABSTRACT
The objective of this study was to describe the internet GIS implementation in the
City of Hays and Ellis County, Kansas, then compare it to examples of implementation
from other similar communities. Geospatial resources were consolidated from both
agencies and used to develop two web mapping applications for employee and public
access. Both mapping applications were developed on the ArcGIS Server platform using
the .NET Web Application Developer Framework. In addition, a HTML website was
developed to accommodate common data requests and an online map repository.
The implementation approach of the City of Hays and Ellis County is similar to
the reviewed community case studies, though additional Python and JavaScript
programming was required to accommodate the needs of both agencies. Follow-up
interviews indicate that the implementation of the online web mapping application has
yielded a savings in office labor, time and revenue for city/county staff members, and
provides easy data access for the staff and citizens of the City of Hays and Ellis County.

ii
ACKNOWLEDGMENTS
To my family, who have always remained at my side, and continue to motivate
me to better myself. I am eternally grateful for the support and encouragement you have
provided me.
To my instructors, who have help shape the way I perceive the world. I am
thankful for the ideologies you have distilled in me, your ever-present enthusiasm, and
guiding my academic and professional development.
To the City of Hays and Ellis County, for providing me the resources and
technical support to document your system integration. It was a pleasure working with
such knowledgeable staff from both agencies, and I hope future opportunities present
themselves.
iii
TABLE OF CONTENTS
Page
ABSTRACT.........................................................................................................................i
ACKNOWLEDGMENTS.................................................................................................ii
TABLE OF CONTENTS.................................................................................................iii
LIST OF TABLES.............................................................................................................v
LIST OF FIGURES..........................................................................................................vi
LIST OF APPENDIXES................................................................................................viii
OVERVIEW.......................................................................................................................1
The Internet and GIS............................................................................................1
Study Area..............................................................................................................2
GIS Application in the City of Hays and Ellis County.......................................3
OBJECTIVES....................................................................................................................5
Summary.................................................................................................................5
APPROACH.......................................................................................................................7
City of Hays / Ellis County Implementation Criteria.........................................7
Establishing Familiarity with Current GIS Environment.................................7
Identifying Common Goals and Limitations.......................................................8
Development and Instantiation of Internet GIS System....................................8
Literature Review & Implementation Comparison............................................8
LITERATURE REVIEW...............................................................................................10
Evolution of Internet GIS....................................................................................10
iv
Data Standards.....................................................................................................11
Web Mapping Applications................................................................................12
Benefits and Limitations of Web Mapping Technologies................................13
Stages of Implementation....................................................................................16
Planning................................................................................................................16
Analysis.................................................................................................................17
Design....................................................................................................................17
Construction.........................................................................................................18
Implementation....................................................................................................19
Examples of Community Implementation.........................................................20
ANALYSIS.......................................................................................................................23
Establishing Familiarity with Current Environment
(Planning & Analysis)..........................................................................................23
Identifying Common Goals and Limitations (Design)......................................25
Development of Internet GIS System (Construction & Implementation)......27
SUMMARY......................................................................................................................34
LITERATURE CITED...................................................................................................40
v
LIST OF TABLES
Table 1 – Available software licenses and GIS software experience...........................47
Table 2 – 2009 City of Hays home page visitor statistics –
http://www.haysusa.com.................................................................................48
Table 3 – GIS Data Server and GIS Web Server hardware specifications................49
Table 4 – Internal and external web mapping application visitor statistics
(months 1-4)....................................................................................................50
vi
LIST OF FIGURES
Figure 1 – City of Hays/Ellis County network diagram..............................................51
Figure 2 – Requested GIS content and user functionality recorded at departmental
staff meetings................................................................................................52
Figure 3 – Data layers required to meet user requests and functionality...................53
Figure 4 – All web services components in the DMZ: The most secure web
configuration (Peters, 2009).........................................................................54
Figure 5 – GIS Data Server and GIS Web Server network integration.....................55
Figure 6 – Display Transaction Rates vs. Chipset Speed (Peters, 2008).....................56
Figure 7 – GIS Data Server: geodatabase schema and network data resources.......57
Figure 8 – Map document developed for web mapping application...........................58
Figure 9 – Example of HTML/JavaScript code for hyperlinks to external online data
resources........................................................................................................59
Figure 10 – Data in geodatabase and external data resources accessed using the
“Identify” tool...............................................................................................60
Figure 11 – Internal web mapping application visitor statistics for January 2010 –
April 2010....................................................................................................61
Figure 12 – Misalignments present between data layers from different
agencies........................................................................................................62
Figure 13 – External web mapping application visitor statistics for
April 2010 – July 2010................................................................................63
vii
Figure 14 – Directory of digital map files created by City of Hays/Ellis County staff
members – www.geodataportal.net/maps.................................................64
Figure 15 – Directory of web services published through ArcGIS Server Manager –
www.geodataportal.net/webservices_available........................................65
Figure 16 – Contact Information page published to GIS Web Server –
www.geodataportal.net/contact.................................................................66
Figure 17 – Requests page published to GIS Web Server –
www.geodataportal.net/requests...............................................................67
viii
LIST OF APPENDIXES
Appendix A – What is GIS?............................................................................................69
Appendix B – County Department Uses for GIS..........................................................72
Appendix C – Sample questions asked during departmental interviews...................76
Appendix D – ArcGIS Server 10 Functionality Matrix...............................................77
Appendix E – County’s GIS site ready for April 5 unveiling......................................79
Appendix F – Geoprocessing tool and Python script....................................................80
Appendix G – Glossary....................................................................................................86
1 OVERVIEW
The intent of this research was to compare the approach taken by the City of Hays
and Ellis County in developing an online geographic information system (GIS), to
approaches taken by other government locales and recommended industry trends. Over
the past decade, Internet-based GIS has become an increasingly popular delivery
mechanism for government agencies to distribute public information. Comparing local
implementation strategies to those of similar agencies and industry trends allows the City
of Hays and Ellis County to maximize system efficiency, assists with future application
development, and ensures current security design conforms with recommended
configurations.
The Internet and GIS
The Internet has transformed the way that geographic content is delivered,
viewed, and used. Through the Internet, geographic information, applications, and
standards have been developed, providing the means for end users to connect and share
geographic information at a new level of simplicity. Moreover, the ability to create and
disseminate geographic information from a variety of additional platforms include:
personal computers, GPS units, cellular phones, and other mobile devices. Geographic
information can be shared in real-time utilizing the Internet over cellular networks, and
may be accessed in remote locations void of cellular availability through satellite
modems (Lyle and Mulcare, 2006).
The Internet serves as a medium to distribute and share geographic content both at
the global scale and at the local government level. Live and static geographic content are
1

2 used in conjunction and compared with each other for a variety of applications in
commercial, private, and public sectors. Real-time location-based services are used as a
marketing avenue for commercial companies by targeting consumers with geographically
relevant advertisements; in the transportation industry for delivery scheduling, fleet
management, vehicle tracking and vehicle routing; in the government sector for records
management or public safety applications such as severe weather mitigation and
response, or may be used by the general public for in-car navigation or recreational
purposes like route tracking and geocaching events (Dumitrescu and Fuciu, 2010;
Mitchell, 1998).
Web GIS has become an affordable solution for local governments to publicize
and disseminate geographic information (Richardson, 2010). By making data and other
geographic resources available online, local governments are able to distribute
information without having to generate hardcopy or digital reproductions. This yields
savings in materials and labor, software licensing fees, and offers a significant time
savings for the end-user requesting the information. Access to local government
information using the Internet has become a common public service practice in many
agencies, and has numerous advantages compared to traditional hardcopy data
distribution (AGIMO, 2003).
Study Area
Ellis County, located at the intersection of I-70 and U.S. 183, has the largest
county population in northwest Kansas with a 2009 estimate of nearly 28,000 residents
(U.S. Census Bureau, 2009). The City of Hays, incorporated in May of 1885, is the
2

3
largest municipality in Ellis County with an estimated population of approximately
20,000, and also serves as the county seat (U.S. Census Bureau, 2000). In addition to
having the largest regional population, Ellis County functions as a regional economic hub
with its top employers in retail, education, healthcare and services sectors (Ellis County
Coalition for Economic Development, 2009).
Ellis County outperforms most Kansas counties in the Kansas Department of
Revenue’s 2009 County Trade Pull Factors (CTPF) – a measure of the relative strength of
a community’s retail business, calculated by dividing the per capita sales tax of a county
by the statewide per capita sales tax. A high CTPF is a good indicator of future market
growth and community expansion, and GIS has proven to be a valuable tool in managing
the planning and development of urban expansion (Maantay and Ziegler, 2006). Ellis
County ranks second out of 105 counties with a CTPF of 1.60, indicating local businesses
are drawing over one third of consumer trade from outside Ellis County borders (Kansas
Department of Revenue, 2010).
GIS Application in the City of Hays and Ellis County
The City of Hays and Ellis County have been using GIS in a variety of daily
workflows across several departments including property valuations, property taxation,
911 call plotting and infrastructure planning/development. Geospatial datasets are
typically generated and maintained by the governing department that uses the information
on a day-to-day basis.
The datasets developed by various departments in Ellis County and the City of
Hays were not readily available to all departments, between organizations, or shared with

4
the general public. Requests made for geospatial data were typically provided in
hardcopy format, requiring office visits or incurring postage fees. Additionally, the City
of Hays and Ellis County currently had no effective electronic delivery format; CD-
ROMs and DVDs were generated by some departments, but available electronic data was
usually not generated per request, rather, several data discs were created at once
(generally bi-annually), which degraded the temporal accuracy of the information.
GIS information obtained from the City of Hays and Ellis County also had
inherent problems when the data was used in the same geospatial software environment.
Different departments utilize different map projections, have different database schemas,
update information on different schedules, and identify equivalent physical features with
differing unique identifiers. This causes problems with overlaying different datasets,
cross-referencing datasets, updating datasets and joining database information from other
sources.
The City of Hays and Ellis County have agreed to pursue an Internet-based GIS
system that combines information from a variety of in-house data sources and external
data sources with the goal of creating an all-inclusive geographic information system that
may be accessed and shared by city and county employees as well as the general public.
This study will compare the steps taken in the local online GIS implementation with
approaches taken in similar communities.
5
OBJECTIVES
Summary
The objectives of this study were to describe the implementation of Internet GIS
in the City of Hays and Ellis County, Kansas; determine common industry standards
towards implementation; and compare findings with the approach taken in the City of
Hays and Ellis County. According to Harnish-Doucet and Wright (2007), a suitable
system should assist city and county staff and commissions with decision making,
promote inter-departmental convenience and efficiency and support daily workflows.
Furthermore, it should provide accurate and timely data access to support departmental
functions, improve accessibility of city/county information to the public, and encourage
data sharing between city and county entities.
Specific to Ellis County and the City of Hays, geospatial information contributed
from different departments had to: exist in the same software environment, use similar
map projections for data overlay applications, provide options for posting data updates at
unscheduled intervals, and support a common identification field for cross-referencing or
joining separate datasets together for analysis. In this study, the following system
components implemented in the City of Hays and Ellis County are described:
A repository of commonly requested digital maps in a format easily
viewed and reproduced by the end user.
Online GIS data viewer including data related to the City of Hays and
Ellis County, with simple query and search capabilities.
An interface allowing end users to download or connect to geospatial

6
datasets for use in a variety of GIS applications.
Method for submitting unique digital and/or hardcopy requests.
To determine common industry standards towards implementation, a literature
review was completed to identify suggested implementation phases and common
implementation approaches in other local government agencies. Findings in the literature
review are compared with the approach taken in the City of Hays and Ellis County.

7
APPROACH
City of Hays / Ellis County Implementation Criteria
Before developing the online GIS for the City of Hays and Ellis County, a set of
criteria were created to guide system implementation. To determine the most effective
approach to creating a GIS that addressed the needs of the City of Hays and Ellis County,
the following criteria were developed based on previous research and examples of
successful implementation:
Inventory current use and application of GIS in the City of Hays and Ellis
County and examine available data resources.
Interview individual city and county department staff members to identify
common goals and issues regarding the current use and future of GIS in
the City of Hays and Ellis County.
Formulate an approach towards implementation of an Internet-based GIS
and put the proposed system into service.
Determine results of the implementation and propose methods for future
improvement.
Establishing Familiarity with Current GIS Environment
Because the proposed GIS was heavily reliant on the existing city/county network
architecture, initial interviews were held with the City of Hays and Ellis County
Information Technology (IT) staff. The objective of the interviews was to gain a thorough
understanding of the city/county network configuration, how the two networks
communicate with each other, and typical hardware specifications for personal computers

8
connecting to these networks. Software licenses were examined along with currently
developed geographic datasets and their respective network locations.
Identifying Common GIS Goals and Limitations
Individual departmental meetings were conducted with city and county staff to
identify shared perceptions of GIS use in Ellis County, and what changes could be made
to promote efficiency and enhance user involvement. Staff members were asked to
identify goals, deficiencies, and limitations of their current system, and how a browser-
based GIS could assist them in daily workflows. Responses were recorded documenting
data types, data locations, update schedules, and departmental workflows. Findings were
summarized to identify common goals and support software platform selection.
Development and Instantiation of Internet GIS System
Departmental meetings yielded several commonalities that assisted with software
selection, hardware selection and web application development. Data resources identified
at staff meetings were assembled in a single geodatabase and used as source data for the
web mapping application. Additional geospatial data and maps were collected and
organized into network directories for easy retrieval.
Hardware/software selections were made based upon departmental interview
responses, industry trends, and examples of successful implementation. A web mapping
application was developed and tested on the City of Hays and Ellis County local area
network (LAN), and later deployed on the World Wide Web for public access.
Literature Review & Implementation Comparison
A literature review of current Internet GIS trends and benefits, implementation in

9
local government and common implementation stages was completed in order to identify
the best practices pertaining to online GIS implementation. The literature review focused
on methods and practices for constructing an Internet-based GIS system for local
government. In addition, data standards and trends are investigated along with GIS
implementation guides produced by communities similar in nature to the City of Hays
and Ellis County. These findings are compared with the approach taken by the City of
Hays and Ellis County.
10
LITERATURE REVIEW
Both the Internet and Geographic Information Systems have served as
information delivery mechanisms for over three decades (Leiner et al., 2010; Mark et al.,
1997). Since the advent of the World Wide Web twenty years ago (Berners-Lee et al.,
1992), web mapping applications have evolved from static HTML maps to 3-dimensional
virtual globes, providing end users with easy-to-use interfaces and seamless access to a
variety of data sources (Plewe, 2007). Today, user-generated content has become
prevalent among many web mapping applications, providing a dynamic environment
where users may contribute, update and share both map content and location-based
information via the Internet (Helft, 2009). Many small, rural communities have taken
advantage of GIS, which has become an integral part of daily government work
functions. Many of these local governments utilize online mapping applications as a tool
to disseminate information for a broad variety of applications (Tunceli et al., 2003).
Evolution of Internet GIS
Peng and Tsou (2003) define Internet GIS (also known as Web GIS) as a
“network-based geographic information service that utilizes both wired and wireless
Internet access to deliver geographic information, analytical tools and GIS services.” GIS
has slowly transitioned from existing exclusively on mainframe computers and servers,
later becoming available on desktop computers, and finally to distributed GIS Internet
connections. Today, Internet GIS data connections may be accessed through web
browsers on lightweight computer platforms and mobile devices (Peng and Tsou, 2003).
With this transition, GIS no longer requires proprietary software installation, and
11
therefore has become more accessible to a broader audience, specifically Internet users
(Sahin and Gumusay, 2008).
As the popularity and use of GIS grew, spatial databases applied different data
schemas and formats to geo-referenced information. Web GIS has further promoted a
large number of GIS users to generate spatial information on different platforms, which
has resulted in interoperability issues when working with data generated from different
sources (Stoimenov et al., 2005). Data available online as web services may be easily
combined in an online mapping application for analysis, regardless of differences in data
format. In particular, disaster management information combines different data models
and formats, and has a heavy dependence on real-time data feeds and mobile access,
making it an ideal candidate for web mapping application platforms (Associated Press,
2004; Sahin and Gumusay, 2008).
Data Standards
Over the past decade, several data standards have been developed for transferring
geographically referenced information across Internet connections, and are used for data
interoperability across different software platforms and applications (Open Geospatial
Consortium, 2011). Using OGC standards, developers and users use common interfaces
to create and share spatial information and geographic analysis tools that may be
interpreted by different web mapping applications, desktop applications, and Internet
mashups (Sahin and Gumusay, 2008). As related to this study, the data service standards
include (OGC, 2011):
Keyhole Markup Language (KML): an XML language focused on geographic
12
visualization, including annotation of maps and images for encoding
representations of geographic data for display in an earth browser.
Web Coverage Service (WCS): a standard interface and operations that
enables interoperable access to content such as satellite images, digital aerial
photos, digital elevation data, and other phenomena represented by values at
each measurement point.
Web Feature Service (WFS): a feature access service but also includes
elements of a feature type service, a coordinate conversion/transformation
service and geographic format conversion service. Allows clients to only
retrieve or modify the data they are seeking, rather than retrieving additional
unwanted data.
Web Map Service (WMS): HTTP interface for requesting geo-registered map
images from one or more distributed geospatial databases. A WMS request
defines the geographic layer(s) and area of interest to be processed, the
transparency of layers, and the returned format (i.e. JPEG, PNG, etc.).
Web Mapping Applications
Internet GIS viewers, or web mapping applications have existed since the early
90’s, with one of the earliest examples being the Xerox Palo Alto Research Center
(PARC) Map Viewer in 1993, which allowed users to turn on and off layers, change
projections, and add place marks to the display, using nothing more than HTTP, HTML,
and PERL scripts (Putz, 1994). In the past, many Internet map viewers employed reduced
dimensions when compared to modern map pages. This is primarily a consequence of
13
limitations in monitor size, network speeds, and screen real-estate, as developers aimed to
maximize map performance while also accommodating advertisements (Haklay et al.,
2008).
As early as 1998, reports forecasted “new virtual ‘worlds’” to be mapped,
analyzed, and manipulated’ (MacEachren, 1998). In mid-2005, Google launched a free
3D mapping project called Google Earth, based on technology originally developed by
Keyhole Incorporated in 2001, and allowed users to seamlessly navigate from space to
street level perspectives and overlay multiple data layers with geographic reference
(Google Press Center, 2005). Shortly after, Microsoft announced the availability of
Virtual Earth 3D (now known as Bing Maps 3D) (Microsoft News Center, 2006). Today,
end users and local communities can develop their own map services and render them in
lightweight web mapping applications, or may import these services into virtual globes
such as Google Earth or Bing Maps 3D to view their data in a virtual 3D environment
(Holmes, 2005; ESRI, 2009).
Benefits and Limitations of Web Mapping Technologies
Web mapping technologies provide an effective means of distributed data access,
especially when compared to hardcopy media, or digital media stored in centralized
information systems (Tsou, 2004). Over the past decade, the number of Internet
connectivity options and available bandwidth has increased, providing new options for
online public participation and community collaboration using web GIS (Banger, 2002,
Haklay et al., 2008). Internet access is also becoming more prevalent at public access
terminals in educational facilities, libraries and municipal centers, further broadening the

14
availability of web mapping application access (Carver et al., 2001). Moreover, the data
is available 24 hours a day, 7 days a week; web mapping applications have a larger
temporal availability than data resources available only during regular operational hours
(Kingston et al., 2000).
Several authors have demonstrated the value of web GIS in public participation
and policy making, and how collaboration efforts are supported by the availability of
geographically relevant information to the audience (Hoyt et al., 2005; Kingston, 2007;
Kyem and Saku, 2009; Yaakup et al., 2004). Web GIS provides upper-level government
decision makers perspectives from local communities (Daun-Barnett and Affolter-Caine,
2005), and allows smaller rural communities with less monetary resources access to data
visualization tools previously available only to urban areas with larger budgetary reserves
(Fulcher and Kaukinen, 2004).
Many web mapping applications are browser-based, and are generally easier to
use than traditional desktop GIS applications which reduce learning curves and results in
lower training costs (Hogan, 1999). Results from a study done by Carver et al. (2001)
show that many users show proficiency in navigating simple web mapping pages, but
more complex web mapping environments, especially 3-dimensional map environments
can often be confusing for many first-time users.
Posting data updates is easier in a server-client environment as data changes only
need to take place on the server, and are then reflected to clients during their next session,
or as the browser is refreshed (ESRI, 2009). This allows web mapping applications to
have frequent update intervals and display current and real-time data, such as election
15
results (Neumann, 2008).
Multiple map layers from a variety of Internet GIS servers may be used in the
same browser-based web mapping application, regardless of the software platform the
application is running on (Vermes, 2006). This requires that the map services comply
with OGC specifications, but allows users to share data and processing power,
eliminating the users need for high-end workstations, client-side licensing and complex
data conversions (Haklay et al., 2008). This yields both cost and time savings to the end
user, and promotes collaboration and sharing of geospatial data (Jackson and Rambeau,
2010).
While there are benefits to using server-client architecture, limitations also exist.
A web mapping application requires an active Internet connection, and if the connection
is lost, the web mapping session terminates. Dynamic and cached information generated
during a web mapping session, such as display extents, query and geoprocessing results,
may be lost if there is an interruption in Internet connectivity during a user session
(Kolbe et al., 2005).
While the ability to generate and modify geospatial information through web
mapping applications is possible, it is typically recommended for ‘lightweight’ editing
and geoprocessing tasks. ‘Heavier’ editing, such as topological edits and complex
geoprocessing functions, are recommended to be completed on dedicated machines with
local or network data sources because of processing and bandwidth requirements
(Hopkins, 2010).
Under a server-client architecture, users only obtain the segments of information

16
they request, not the dataset in its entirety. This can be problematic if the comprehensive
dataset is needed for additional study or specific geoprocessing tools are not available
through the web mapping application (Rao and Vinay, 2009).
Stages of Implementation
A large volume of web GIS implementation literature is available describing
design and integration strategies for Internet GIS into small local governments. Many
implementation guides share commonalities, which have been summarized in this study
and compared to the Internet GIS implementation in the City of Hays and Ellis County.
Implementation and system design documents were reviewed and summarized from
communities of similar size, nature and complexity to the City of Hays and Ellis County.
Based on this review, the following implementation stages were derived:
Planning
Analysis
Design
Construction
Implementation
Planning
The first stage in web GIS implementation is becoming familiar with the
organization’s current environment. The first priority should be familiarization with
organizational staff. This may be completed by reviewing job descriptions and
conducting face-to-face meetings (Parr, 2008). Interviewing department staff provides
insight into the departmental functions and responsibilities. Staff members have unique

17
end-user perspectives and their involvement during the planning stage is crucial in
ensuring user requirements are fulfilled. For staff members not familiar with GIS and its
applications, a description of geospatial technology and applications should be provided
so that staff members may effectively participate in implementation discussions (Somers,
2001). To define the scope of GIS goals, individual departmental meetings should be
held to identify how GIS fits into current projects, and to draft procedures for GIS
implementation into daily workflows (PAR, 2007).
Analysis
The analysis stage includes identifying all current and future GIS users and
applications. This is completed through interviewing current and potential users, and
creating a list of functionality requirements (Alesheikh et al., 2002). During the interview
process, an inventory of data and software licenses should be completed, along with
documenting user’s GIS familiarity and applicable training (Parr, 2008). Department staff
can provide insight into currently developed datasets, and Information Technology (IT)
staff members are a good source of geospatial data repository and their network locations
(GeoNorth, 2007). An audit of current software licenses may be accomplished by
contacting IT staff and contracted software vendors (Harnish-Doucet and Wright, 2007).
Information gathered during the analysis stage will assist in design formulation and
system implementation (Somers, 2001).
Design
After departmental interviews have been completed, commonalities between
departmental GIS goals and specific GIS requirements can be identified and used in the

18
development of design and implementation plans (Somers, 2001). The design process
involves determining all related departmental goals and needs, and establishing a
hardware and software configuration to support user needs and meet departmental
requirements (Peters, 2008). Data inventory and departmental workflow documentation
assists in formulating a structure to the GIS database and security configurations
(Somers, 2001).
Requested user functions and operational needs should be reviewed to direct the
development of the web mapping application (Alesheikh et al., 2002). IT staff can
provide insight into software compatibility, system integration, and applying appropriate
security measures for installed hardware (Peters, 2008). The results of the design stage
should include: a conceptual GIS database design, including relevant data sources;
requirements for the web mapping application that meet operational needs and a systems
implementation plan that details how the GIS will integrate with the pre-existing network
architecture (GeoNorth, 2007).
Construction
In the construction phase, hardware and software components are acquired and
assembled into a system that meets the needs of the organization. The construction phase
process is drawn directly from the requirements developed in the analysis and design
stages (Somers, 2001). Hardware selection should take into consideration current network
architecture and should be implemented in a fashion that preserves or enhances network
security provisions and data protection, redundancy, and integrity (Peters, 2008). When
selecting a software platform for the GIS, organizational training and licenses should be

19
reviewed, and a platform should be chosen that integrates well with pre-existing software
experience and recorded departmental workflows (Rao and Vinay, 2009; PAR, 2007).
Geospatial data should be collected and arranged in a logical structure that
conforms to agency structure and workflows. If data resources are distributed among
departments, a centralized data repository can be created and maintained with available
software technologies (Peters, 2008). A centralized data repository will provide data
redundancy, and employing spatial databases provides quality control parameters that
ensure data integrity among source files (Peters, 2008; Holmes, 2005). Spatial database
schemas should be carefully developed and organized such that they adopt a structure
that may be easily maintained by individual agency departments (Holmes, 2005).
Standard data naming conventions should be used and be identifiable by all users (PAR,
2007).
Data resources, particularly those that support Internet access, are vulnerable to
unauthorized access and other security threats (Peters, 2008). It is recommended that
agency IT staff be consulted about hardware and that software network integration and
security considerations are reviewed before system implementation (Peters, 2008).
Implementation
In the implementation stage, web services and mapping applications are
developed and deployed, and end-user training and system maintenance intervals are
reviewed and scheduled. Initial mapping applications should be built with the most
widely used data sets and expanded to be more inclusive with time. Typically there are
too many datasets, application features, and system components to implement at once;

20
early deployment and easy-to-use applications will build familiarity and acceptance of
the system (Somers, 2001).
Once initial products are released, feedback may be gathered from users to help
guide further development of the application (Holmes, 2005). The accuracy and
timeliness of data updates is crucial in forming user confidence in the system, so data
update tasks and intervals should be discussed early after deployment (Somers, 2001).
The system is not complete after it is put into operation however; it is the
commencement of the next phase of the system lifecycle which includes ongoing
enhancements, data updates, and user training (Alesheikh et al., 2002). Guidelines for
system updates and data contributor procedures should be established and clearly
outlined (Peters, 2008). To increase system usage and grow the user base, training
sessions should be held to familiarize users with available content and features (Somers,
2001; PAR, 2007). Feedback gathered at user trainings may be used to further enhance
the system (PAR, 2007).
Examples of Community Implementation
Several implementation guides were reviewed from communities with similar
department and service structure to those of the City of Hays and Ellis County, KS. The
implementation guides include:
City of Loveland, CO (population 62,000) – Developing and Maintaining and
Enterprise GIS in a Full-service Municipal Government Environment
(Holmes, 2005). The City of Loveland is located in north-central Colorado
along the Front Range of the Rocky Mountains. Loveland is home to several

21
post-secondary schools, a regional airport, and is the second largest city in
Larimer County after Fort Collins. Loveland’s population has been steadily
increasing over the past decade, and recently incorporated the intersection of
Interstate 25 and U.S. Highway 34 leading to the development of several
events centers, shopping centers, and a medical center near the interchange
(Loveland Chamber of Commerce and Visitor’s Center, 2010). The
department structure of the City of Loveland is most similar to that of the City
of Hays and Ellis County when compared to the other reviewed case studies.
City of Tigard, OR (population 49,100) – GIS System Architecture Design and
Application Design (GeoNorth, 2007; US Census Bureau, 2009). The City of
Tigard is located approximately 10 miles southwest from downtown Portland,
and has the one of the lowest tax bases in the Portland metropolitan area. The
City of Tigard was incorporated in 1961, and has incorporated area of nearly
twelve square miles. Rail transportation has been an important part of the
community’s growth, from the Oregon Electric Railway built in 1910 to the
TriMet transportation system, which provides low-cost mass transit for the
citizens of Tigard to most of Portland’s metropolitan area (City of Tigard,
2010).
City of Rome, NY (population 34,220) – GIS Implementation Plan: City of
Rome (PAR, 2007; US Census Bureau, 2009). The City of Rome is located in
north-central New York State, and is closest in population to the City of Hays
and Ellis County of the three reviewed case studies. The City of Rome was

22
incorporated in 1870, and early growth may be attributed to the development
of the Erie Canal, which was started in Rome in 1817. The City of Rome is
home to Griffiss International Airport, a decommissioned United States Air
Force base used for support activities, aerial refueling, and electronic research
(Rome Area Chamber of Commerce, 2010).
These community implementation guides, in addition to general best practice GIS
implementation guides and whitepapers (Somers, 2001; Alesheikh et al., 2002; Harnish-
Doucet and Wright, 2007; Parr, 2008; Peters, 2008; Rao and Vinay, 2009), were
compared with each other to identify common GIS development stages.
23
ANALYSIS
Establishing Familiarity with Current Environment (Planning & Analysis)
Findings from the literature review indicate that the first step in developing an
online GIS system is becoming familiar with the organization’s current environment
through staff interviews, documenting departmental workflows, and reviewing network
structure. Before departmental interviews were scheduled, job descriptions were obtained
for all positions in the City of Hays and Ellis County. Job descriptions were reviewed and
conclusions were drawn on the applicability of GIS to various positions throughout both
organizations.
Information gathered from job descriptions was used to draft a document ‘What is
GIS’ intended to familiarize employees with GIS, and how GIS may be applied to their
specific organizational duties. ‘What is GIS?’ and ‘County Department Uses for GIS’
(Allen and Harnish-Doucet, 2006) were included as email attachments to staff members
when scheduling meeting dates and locations (Appendix 1, 2). During departmental
meetings, PowerPoint presentations and question-and-answer periods were provided to
assist staff members not familiar with GIS technology in contributing to discussions.
As suggested by Parr (2008), Information Technology departments were
interviewed first so that GIS software purchases and maintenance agreements could be
reviewed. A license audit was conducted to identify the total number of GIS software
licenses, license types, and which city/county computers the licenses are assigned to.
Current maintenance agreements and license counts were verified with software vendors.
A summary of available software licenses for the City of Hays and Ellis County may be
24
found in Table 1. The assessment of preexisting software licenses and end-user software
familiarity assisted in the selection of an online GIS platform.
Supervisory information technology staff were asked to provide a summary of
current end-user hardware and software specifications. While an overall PC specification
summary was not available, IT supervisors acknowledged that all computers on the
city/county networks met the following minimum specifications:
Operating System: Windows XP
Processor Speed: 1 gigahertz (GHz)
Random-access Memory (RAM): 512 megabyte (MB)
Hard Disk Space: 40 gigabytes (GB)
Information Technology staff provided Internet traffic statistics for the City of
Hays home page. Statistics such as network connection speeds, browser types, screen
resolutions, and bit depths were collected. Recorded traffic information was summarized
(Table 2) to determine typical public sector computer system specifications to ensure the
selected GIS platform and mapping application would be compatible with users visiting
city and county web pages. Internet traffic statistics were not available for the Ellis
County homepage.
Network structure was discussed with IT staff and documented by constructing a
network diagram (Figure 1). The diagram provided visual reference for identifying user
connections, existing GIS data repositories, bandwidth allocation, security safeguards and
IP packet routing. The network diagram assisted in the design process and was also used
in on-site department meetings to describe the GIS implementation.
25
Interviewing all current and potential users is considered to be an important step
in the planning process (Alesheikh et al., 2002; GeoNorth, 2007). User training, GIS
familiarity and departmental software licenses were confirmed with each department’s
staff (Table 1). Department employees were questioned about project workflows, project
timelines, available geospatial datasets, and how current and future projects could be
supported through an online GIS system. Staff members were asked to brainstorm
specific tools and web mapping application functionality that would support their daily
operations and any current or future projects. Users responsible for generating GIS data
were involved in a discussion regarding GIS database structure, and what types of
database schemas would best fit their current workflows. A list of sample questions asked
during departmental interviews may be found in Appendix 3. Responses were recorded
during departmental interviews, and later used to support online GIS platform selection.
Identifying Common Goals and Limitations (Design)
Interview responses and network resource information should be summarized so
that any commonly requested datasets, application functionality, or network deficiencies
can be identified (Peters, 2008). Based on the interview process, few departments were
associated with GIS data generation, and many departments functioned strictly as data
users. Interview results showed that 2-3 departments generated most of the geospatial
data, thereby supporting the data needs of the remaining departments. The most widely
used datasets were identified for each department, and common public data requests were
also noted. Commonly requested datasets, along with requested user functionality is
summarized in Figure 2.

26
While many departments host online data retrieval systems, staff members
expressed interest in consolidating access to these resources through a single interface.
Data formats and storage locations were reviewed to ensure appropriate network
resources could be allocated and the selected software platform would integrate into
existing data flows. Data layers required to meet the requested user functionality were
summarized by department (Figure 3).
Platform selection should be based on staff responses, should fit into an
organizations daily workflows and current project, support available software licenses
and PC hardware specifications, and easily integrate with the organizations network
(Holmes, 2005; PAR, 2007). As determined from the visitor site statistics from the City
of Hays (Table 2) and the average PC specifications collected from city/county IT
departments, average public users and organization staff would be supported by
implementing ArcGIS Server and a Web Application Developer Framework (ADF)
mapping application. In addition, the ArcGIS Server suite was an ideal match to
budgetary resources, staff training and software familiarity (Table 1), and requested user
functionality (Figure 2).
ArcGIS Server has the ability to convert native Map Documents (.mxd) into Web
Mapping Services, thereby allowing pre-existing map files generated by the City of Hays
and Ellis County to be shared in an online environment without data format conversion.
IT staff was consulted to grant appropriate network privileges to access source data so
that department-generated data could be replicated on to the implemented GIS server. It
was agreed that GIS data would be collected and assembled using a filing structure that

27
separated source data by department. A draft geodatabase schema was developed to
support multi-source datasets that included separate feature datasets for different source
locations. The database structure would allow differing update schedules, differing map
projections, and support topological editing in the geodatabase.
It was found during IT staff interviews that the City of Hays and Ellis County do
not host any web pages in house; rather, all city/county Internet content is hosted by
outside vendors. This required that the system implementation include a web-server
component that may be accessed from the city/county networks. The most secure
configuration, suggested by Peters (2009), includes two servers; one server accessible by
network users that houses GIS data, and a second web server separated from the network
by a firewall (Figure 4). This configuration is similar to the dual-server system
implemented by the City of Tigard (GeoNorth, 2007), and to the system implementation
completed by the City of Loveland, which includes a separate server to support Internet
users (Holmes, 2005).
City of Hays and Ellis County network structure was reviewed, and IT staff
agreed to develop a De-Militarized Zone (DMZ) on their networks to support a web
server, and place an internal GIS data server on the Ellis County network. Both servers
were licensed with ArcGIS Server so that datasets could be developed and tested
internally, and upon successfully meeting quality control guidelines, may be transferred
to the web server for public access.
Development of Internet GIS System (Construction & Implementation)
Two servers were procured by the City of Hays and Ellis County to support the
28
online GIS system. The first server, a Dell PowerEdge 2950, was implemented as the GIS
Data Server for internal access, and therefore needed to be able to support more strenuous
tasks such as multi-user editing, concurrent data connections, replication, and an internal
development web mapping application. The second server, a Lenovo ThinkServer
RD120, was implemented as the GIS Web Server, with the specific function of
supporting the online web mapping application. Because of the anticipated increased user
load on the GIS Data Server, a better quality server with superior hardware specifications
was implemented. A summary of server hardware specifications may be found in Table
3.
Both servers were installed in Ellis County’s server rack, located in the Ellis
County Courthouse. Ellis County’s network structure supported the addition of both
servers while allowing City of Hays staff direct access to the GIS Data Server. The web
server was placed in a DMZ, and through firewall IP packet filtering and routing rules,
only one-way communication (initiated by the GIS Data Server) was permitted (Figure
5).
A variety of ArcGIS Server platforms are available (Appendix 4), but after
comparing requested user functionality and the estimated number of concurrent system
users, the ArcGIS Server Workgroup Standard software package was best scaled to
organization user counts. This software package will support 10 simultaneous
connections to the geodatabase, with a maximum database storage capacity of 10GB –
sufficient for the needs of the City of Hays and Ellis County’s staff size and online GIS
implementation.

29
Based on total annual visitors to the City of Hays homepage, it was anticipated
that there would be fewer than 30 visitors per hour to the online mapping application
(Table 1). According to Peters (2008), both servers fall within acceptable performance
thresholds to support 30 users per hour in an ArcGIS Server Standard deployment based
on their chipset’s speed (Figure 6).
The geodatabase schema discussed with city/county data developers was designed
and implemented on the GIS Data Server using ArcCatalog. As recommended by the City
of Rome’s GIS Implementation Plan (PAR, 2007), the structure of this geodatabase lends
itself to being easily updated by city/county staff as data is logically structured by
department and update intervals. For instance, the ‘Base’ feature dataset is updated by
City of Hays Public Works department on a monthly basis, while the ‘Parcels’ feature
dataset is updated by Ellis County’s Appraiser’s Office bi-weekly. By segregating feature
classes into separate feature datasets, data was more easily aggregated from source files
across the two networks. The implemented geodatabase schema and network data
resource diagram may be found in Figure 7.
A default .NET installation of the ArcGIS Server runtime was installed on the
GIS Data Server and GIS Web Server. Installation options were carefully monitored
during software installation to ensure directory structure remained identical on both
servers to ensure a seamless replication environment. Because city/county staff lacked
web-programming experience, the ArcGIS Server Web Application Developer
Framework for the Microsoft .NET Framework (.NET Web ADF) was also installed on
both servers. The .NET Web ADF includes a web-mapping application template, which
30
may be populated with data layers using a step-by-step interface in ArcGIS Server
Manager, and without any web application programming required (ESRI, 2010).
In addition to publishing the web mapping application, ArcGIS Server also
publishes a directory of all data layers in OGC-compliant formats including KML, WCS,
WMS and WFS. These data layer services may be accessed using a variety of software
platforms including, but not limited to ArcMap, ArcGIS Explorer, ArcGIS Explorer
Online, AutoCAD, Google Earth, and standard Internet browsers (ESRI, 2010).
An ESRI map document (.mxd) was created that contained the most requested
and widely used data layers in the City of Hays and Ellis County (Figure 8). ArcGIS
Server Manager was used to convert the .mxd directly into a web mapping application.
While the ArcGIS Server Manager interface was used to publish the web mapping
application and add/configure search tools, additional HTML and JavaScript was added
to the “identify” tool results to hyperlink the mapping application to other online
resources (Figure 9). Hyperlinked data resources, along with data housed in the
geodatabase, may be accessed using the “identify” tool in the web mapping application
interface (Figure 10).
Once the web mapping application was deployed on the GIS Data Server, its
availability was announced for employee access. Each of the city and county departments
was revisited and provided with a brief web mapping application training session. Over
the following four months, the internal web mapping application was tested by City of
Hays and Ellis County staff members.
User traffic was monitored using SmarterStats Free Edition, a web analytics
31
program that summarizes site activity and visitor traffic (Figure 11). The first four
months of internal site visitor statistics may be found in Table 4. During the four-month
testing period, any site issues or suggested enhancements were submitted via email by
users.
Through user feedback, the most common issues identified included inaccuracies
in source data, discrepancies between data layers, and map application lease time. These
issues were addressed accordingly by correcting departmental source data and extending
the web mapping application lease time on the server. Several requests were made for
additional layer search functionality, so “search subdivisions”, “search roads”, and
“search quarter section” tools were added using the ArcGIS Server Manager interface.
Upon successful testing by City of Hays and Ellis County staff members, the
geodatabase and web mapping application were replicated from the GIS Data Server to
the GIS Web Server. To prevent any outside Internet traffic from requiring accessing to
the GIS Data Server, all dependent files, including property images, subdivision scans,
and digital portable document files were also replicated to the GIS Web Server. Directory
structure remained identical on both servers so that additional changes would not have to
be made to the geodatabase or web mapping application after replication. Replication was
accomplished using Microsoft SyncToy, a free utility created by Microsoft that searches
and updates changes between two file directories. The Microsoft SyncToy utility was
scheduled for weekly one-way data replication from the GIS Data Server to the GIS Web
Server.
Once the data had been replicated to the GIS Web Server, a real-world IP address
32
was assigned to the server to provide an Internet connection to the World Wide Web.
Internet Information Services 7 (IIS7) was activated on the GIS Web Server, and used to
direct incoming Internet traffic on port 80 to the replicated web mapping application
instance. Because SmarterStats Free Edition is limited to a single web page, Google
Analytics was used to monitor site traffic on the GIS Web Server. A Google Analytics
tracking script was inserted at the end of the page code, and a free Google account was
created to access site activity statistics (Figure 12).
Many departments developing geospatial data also generate copies of maps and
other cartographic products in digital format. During departmental interviews, there was a
common request that these electronic documents be available through the Internet in
addition to the web mapping application. A directory was created on the GIS Web Server
and populated with digital map files from city/county networks.
A basic HTML website was created so that the electronic documents may be
easily navigated by users. JavaScript was used to render document previews and
hyperlink to electronic map documents generated by city/county departments (Figure 13).
The HTML website also provides a list of hyperlinks to all web services published by the
city and county through the ArcGIS Server web services directory (Figure 14). To extend
the opportunity for public users to submit suggestions, comments, request site
enhancements or additional data, two additional HTML pages were created. A “Contact”
and “Requests” page provide users with options for requesting digital and hardcopy data
in addition to contact information for city/county GIS staff (Figures 15-16).
An organization-neutral domain name, “www.geodataportal.net”, was registered

33
to the GIS Web Server’s real-world IP address. The web mapping application and HTML
page hosted on the GIS Web Server was tested to ensure all application tools and website
features were functioning properly, and that the site was accessible using the registered
domain name. After successfully testing the web mapping application, a press hearing
was held to announce the launch of the site. A press release statement was printed on the
front page of the local newspaper two weeks before the external website launch to notify
the general public of the site’s availability (Appendix 5).

34
SUMMARY
In this study the City of Hays and Ellis County online GIS implementation was
described and compared to common implementation methods identified in current
literature. Literature sources included other local government case studies and
implementation strategies proposed by industry software vendors and user groups. In
general, the approach taken by the City of Hays and Ellis County conforms to suggested
implementation approaches found in the literature review and many of the results from
implementing an Internet GIS are similar to those found in reviewed community case
studies.
Two web mapping applications were implemented in the City of Hays and Ellis
County: one accessible only by city/county staff members through the city/county
network, and one accessible to citizens through the Internet. As noted by the City of
Loveland (Holmes, 2005), running two simultaneous web mapping applications ensures
that down time is limited to a single server at a time, and produces an environment where
new application functionality and data layers may be tested before public release. The
dual-server configuration has proven to be a suitable development environment for the
City of Hays and Ellis County, while also providing adequate network security.
A HTML page was developed in addition to the web mapping applications to
support electronic document retrieval requested from city/county departments. While
reviewed case studies indicated that other government agencies allowed users to print
content from their web mapping applications, they did not develop a separate online
repository for commonly requested maps. City and county office staff have indicated that
35
the online map repository is a valuable resource as they can defer public data requestors
to the website for commonly requested map products, which has resulted in saved time,
labor, and resources for both staff and requestors.
Because the implemented system is browser-based, any user with Internet access
may visit the website and navigate GIS content through the web mapping application.
Site traffic data shows that over the first four months of implementation, both websites
averaged over 500 visitors per month (Table 4). Visitor counts on the internal employee
web mapping application dropped in the month of April when compared to previous
months (Figure 11), which may be attributed to the availability of the public access web
mapping application which was launched April 5. The public access application may
have been used by city and county staff in place of the internal web mapping application
because it is accessible online, and its availability is not limited to the city or county
network. It was estimated the GIS Web Server would have to support fewer than 8 users
per hour based on average visitor activity on the City of Hays homepage. This estimate
proved to be accurate, with initial visitor counts averaging around 24 page visits per day.
After the online web mapping application had been available for 4 months, staff
members asked about the functionality, usability and integration of the mapping
applications. In general, staff members indicated that the web mapping applications had
great value, both in their specific job responsibilities, and to outside agencies and citizens
requesting information. Several departments reported that over 50% of information
requests could be deferred to the web mapping application, which led to a reduction in
office labor and material costs.

36
When questioned about the usability of the applications interface, users familiar
with GIS software indicated that the transition to using the web mapping application was
virtually seamless, with little or no difficulty accessing desired information. Responses
from users less familiar with GIS software generally said it took less than 15 minutes to
become familiar with site navigation and tool functionality. Others indicated that the
availability of a ‘Help’ link provided them with the necessary instruction to navigate the
site and locate relevant information. All respondents acknowledged that the web-based
platform provided faster access to data sources than desktop GIS platforms, and typically
was more inclusive in regard to data layers than departmental GIS files.
Several departments maintain software license agreements strictly for viewing
geospatial data. These departments are currently re-evaluating their software license
agreements with the availability of web mapping application, which provides the data-
viewing functionality required by department employees. A reduction in software
maintenance agreements would lead to cost savings in departmental licensing fees. In
addition, three departments access the web mapping application using in-vehicle consoles
over mobile Internet connections, reducing the number of return office visits to acquire
property information through traditional GIS software.
While the ArcGIS Server platform is advertised as a complete solution to
seamlessly transfer map data to the internet, incorporating all requested information into
the web mapping application required additional programming. HTML and JavaScript
code had to be implemented to link online data resources with web mapping application
resources. In addition, the Ellis County Appraiser’s Office draws parcel boundaries and
37
assigns parcel identification numbers within the AutoCAD Map 3D software
environment.
In order to generate layer files compatible with the ArcGIS Server platform, a
geoprocessing tool was developed using ESRI’s ModelBuilder and Python scripting. The
tool allows users to select AutoCAD parcel files, then choose a parcel attribute resource
such as a table or database. Running the tool converts the AutoCAD file into a feature
class, corrects polygon geometry errors, and joins parcel attribute data, such as addresses,
owner names, and tax units, to parcel polygon features (Appendix 6).
Data layers were contributed from different agencies, which resulted in layer
overlay issues between separate datasets. For example, the City of Hays tries to preserve
street right-of-way when drawing property boundaries, whereas Ellis County tries to
preserve property dimensions when drawing property boundaries (Figure 12). It was
assumed that this would be an inherent problem when working with data from multiple
agencies, and was addressed by developing the geodatabase schema and mapping
application layer structure in a way to incorporate both layers with the ability to turn on
and off each layer depending on user’s required information. Data overlay issues were
explained during user training sessions so that staff members were aware of the matter,
and so that data layers were being used for the correct application.
Because multiple agency data layers can be overlayed in the same software
environment, the quality of GIS data has been improved since the implementation of the
web mapping application. City and county departments overlay datasets from both
organizations in the same application, and may visually cross reference them for any
38
discrepancies. Errors in datasets have been identified and corrected through this method,
further improving the accuracy and integrity of data in the system and in city/county
departments.
It was found in other case studies that geodatabase replication, a feature available
in ESRI software suites, was used to update information within geodatabases. The
geodatabase replication feature proved to be problematic because of city/county network
security policies. In addition, both the geodatabase and dependant files such as property
images and scanned plats had to be replicated. Microsoft SyncToy was used in place of
ESRI’s geodatabase replication functionality because it allows entire directories to be
synchronized and operated under enforced security policies.
Future work may entail ongoing system maintenance, additional data inclusion,
and further web mapping application development. Ongoing interviews and user
feedback would provide insight into the usage and applicability of the mapping
application, and additional tools and functionality can be developed based on user
responses.
Constructing a map cache, or set of pre-rendered layer images, would allow for
faster web mapping application display, and could be implemented to enhance the
mapping application’s performance. Generating a map cache would require that all map
layers be segregated into individual web map services, not combined in a single web
service as in the city/county’s implementation. Segregating layers into individual web
services would also support the development of new specialized mapping applications
that combine only pertinent web services and serve a specific purpose, such as utility or

39
parcel mapping. A mapping application designed for a specific purpose can incorporate
specialized tools and typically has higher clarity with the omission of unnecessary
information (ESRI, 2009).
Implementing a web-based GIS system is relatively low cost compared to
traditional desktop software licensing, which may have greater appeal to community
commissioners. In the case of the City of Hays and Ellis County, the ArcGIS Server
platform was easier to justify to city/county commissions as it provides data viewing
capabilities to all agency staff members, previously only available to staff with desktop
software, for the same cost as two desktop licenses. In addition, the implementation made
data resources available to the public that were otherwise unavailable, or required a
specific office request to obtain.
40
LITERATURE CITED
Alesheikh, A. A., Helali, H. and Behroz, H. A. 2002. Web GIS: Technologies and its
Applications. Symposium on Geospatial Theory, Processing and Applications.
Ottawa, Canada. July 8-11, 2002. 9 pp.
Allen, R. and Harnish-Doucet, K. 2006. County Department Uses for GIS. The Kansas
Collaborative. Retrieved from: http://www.thekansascollaborative.com/
resources/County_Uses_GIS.pdf
Associated Press (AP). 2004. City Governments Map Trends. Associated Press, February
01, 2004. Retrieved from: http://www.wired.com/science/discoveries/ news/
2004/02/62131
Australian Government Information Management Office (AGIMO) - National Office of
the Information Economy. 2003. E-Government Benefits Study. Retrieved from:
http://www.agimo.gov.au/archive/__data/assets/file/0012/16032/ benefits.pdf
Banger, S. 2002. Integrating GIS with Web for Public Participation. GIS Development.
Retrieved from: http://www.gisdevelopment.net/technology/gis/ techgi0058.html
Berners-Lee, T., Cailliau, R., Groff, J.F. and Pollermann, B. 1992. World-Wide Web:
The Information Universe. Electronic Networking, vol. 2, no. 1, pgs. 52-58.
Carver, S., Evans, A., Kingston, R. and Turton, I. 2001. Public participation, GIS, and
cyberdemocracy: evaluating on-line spatial decision support systems.
Environment and Planning B: Planning and Design, vol. 28, pgs. 907-921.
City of Tigard. 2010. It’s All About Tigard. Retrieved from: http://www.tigard-
or.gov/community/about_tigard/default.asp
41
Daun-Barnett, N. and Affolter-Caine, B. 2005. Utilizing Geographic Information Systems
(GIS) to Influence State Policy: A new descriptive, diagnostic, and analytical tool
for higher education. ASHE Public Policy Conference, Philadelphia, PA.
November 10, 2005. Retrieved from: http://www.thenationalforum.org/Docs/
PDF/GIS.pdf
Dumitrescu, L. and Fuciu, M. 2010. The Role of Database Marketing in the
Operationalization of the Services Relationship Marketing. Management and
Marketing Journal, University of Craiova, vol. 1, pgs. 15-24.
Ellis County Coalition for Economic Development. 2009. Major Employers. Retrieved
from: http://www.haysamerica.net/index.asp?DocumentID=72
ESRI. 2009. Best Practices for Creating an ArcGIS Server Web Mapping Application for
Municipal/Local Government. ESRI White Paper. Retrieved from:
http://www.esri.com/library/whitepapers/pdfs/creating-arcgisserver-web-
mapping.pdf
ESRI. 2010. ArcGIS Server 10 Functionality Matrix. Retrieved from:
http://www.esri.com/library/brochures/pdfs/arcgis-server-functionality-matrix.pdf
ESRI. 2010. Web ADF 10 for Microsoft .NET Framework. Retrieved from:
http://help.arcgis.com/en/sdk/10.0/serveradf_net/conceptualhelp/index.html
Fulcher, C. L. and Kaukinen, C. E. 2004. Visualizing the Infrastructure of US Healthcare
Using Internet GIS: A Community Health Informatics Approach for Reducing
Health Disparities. MEDINFO 2004, pgs. 1197-1201.
GeoNorth. 2007. City of Tigard GIS System Architecture Design and Application Design.
42
Retrieved from: http://www.tigard-or.gov/maps/docs/ sys_arch_app_design.pdf
Google Press Center. 2005. Google Launches 3D Mapping and Search Product [press
release June 28, 2005]. Retrieved from: http://www.google.com/press/pressrel/
google_earth.html
Haklay, M., Singleton, A. and Parker, C. 2008. Web Mapping 2.0: The Neogeography of
the GeoWeb. Geography Compass, vol. 2, pgs. 2011-2039.
Harnish-Doucet, K. and Wright, J. 2007. Guidebook for County Geographic Information
Systems (GIS) Implementation. The Kansas Collaborative. Retrieved from:
http://www.thekansascollaborative.com/resources/ GuidebookforCountyGIS2.pdf
Helft, M. 2009. Online Maps: Everyman Offers New Directions. The New York Times.
November 17, 2009, pg A1.
Hogan, C. L. 1999. Mapping on the Web Using MapInfo Products. GIS Development.
Retrieved from: http://www.gisdevelopment.net/technology/gis/ techgi0022.htm
Holmes, S. 2005. The LOGIC System: Developing and Maintaining and Enterprise GIS
in a Full-service Municipal Government Environment. Retrieved from:
http://www.cityofloveland.com/IT/GIS/publications/CityOfLoveland_ESIGAwar
dApplication.pdf
Hopkins, D. 2010. Web Editing Using ArcGIS Server 10, ESRI Live Training Seminar,
10/01/2010. http://training.esri.com/campus/seminars/index.cfm
Hoyt, L., Khosla, R. and Canepa, C. 2005. Leaves, Pebbles, and Chalk: Building a Public
Participation GIS in New Delhi, India. Journal of Urban Technology, vol. 12, no.
1, pgs. 1-19.

43
Jackson, J. and Rambeau, R. 2010. Consumer Mapping: Will it Make a Difference to GIS
and Surveying? Professional Surveyor Magazine, vol. 30, no. 10, pgs 30-46.
Kansas Department of Revenue. 2010. County Trade Pull Factors: Annual Report for
Fiscal Year 2009. Issued July 2010.
Kingston, R. 2007. Public Participation in Local Policy Decision-making: The Role of
Web-based Mapping. The Cartographic Journal, vol. 44, pgs. 138-144.
Kingston, R., Carver, S., Evans, A. and Turton, I. 2000. Web-Based Public Participation
Geographical Information Systems: An Aid to Local Environmental Decision-
Making. Computers, Environment and Urban Systems, vol. 24, pgs 109-125.
Kolbe, T., Steinrucken, J. and Plumer, L. 2005. Cooperative Public Web Maps.
International Cartographic Conference, Durban, South Africa. August 10-16,
2003. Retrieved from: http://icaci.org/documents/ICC_proceedings/ICC2003/
Papers/338.pdf
Kyem, P. A. K. and Saku, J. C. 2009. Web-Based GIS and the Future of Participatory
GIS Applications Within Local and Indigenous Communities. The Electronic
Journal on Information Systems in Developing Countries, vol. 38, pgs. 1-16.
Leiner, B. M., Cerf, V. G., Clark, D. D., Kahn, R. E., Kleinrock, L., Lynch, D. C., Postel,
J., Roberts, L. G. and Wolff, S. 2010. A Brief History of the Internet. The Internet
Society. Retrieved from: http://www.isoc.org/Internet/history/brief.shtml
Loveland Chamber of Commerce and Visitor’s Center. 2010. History of Loveland.
Retrieved from: http://www.loveland.org/Loveland_History
Lyle, S. D. and Mulcare, D. M. 2006. Space Based Real-Time Kinematic GPS for
44
National Geodetic Survey Texas Height Modernization. Online Journal of Space
Communication, issue 9. Retrieved from: http://spacejournal.ohio.edu/issue9/ pdf/
Space-Based-RTK.pdf
Maantay, J. and Ziegler, J. 2006. GIS for the Urban Environment. Redlands, California:
ESRI Press. 596 pp.
MacEachren, A. M. 1998. Cartography, GIS, and the World Wide Web. Progress in
Human Geography, vol. 22, 4, pgs. 575-585.
Mark, D. M., Chrisman, N., Frank, A. U., McHaffie, P. H. and Pickles, J. 1997. The GIS
History Project. UCGIS Summer Assembly, Bar Harbor, Maine. June 15-21, 1997.
Retrieved from: http://www.ncgia.buffalo.edu/gishist/bar_harbor.html
Microsoft News Center. 2006. Microsoft Adds 3-D City Models to Live Search [press
release November 6, 2006]. Retrieved from: http://www.microsoft.com/presspass/
press/2006/nov06/11-06ve3dlaunchpr.mspx
Mitchell, A. 1998. Zeroing In: Geographic Information Systems at Work in the
Community. Redlands, California: ESRI Press. 114 pp.
Neumann, A. 2008. Web Mapping and Web Cartography. Encyclopedia of GIS. New
York, New York: Springer Science and Business Media. 1370 pp.
Open Geospatial Consortium. 2011. OGC Standards and Specifications. Retrieved from:
http://www.opengeospatial.org/standards/
PAR Government Systems Corporation. 2007. GIS Implementation Plan City of Rome.
Retrieved from: http://www.orps.state.ny.us/lis/rfa/CityRome.pdf
Parr, B. 2008. A Strategic Approach to a New Organization: How to Hit the Ground

45
Running in Your New Position. ArcUser Magazine, vol. 11, no. 2, pgs. 40-41.
Peng, Z. and Tsou, M. 2003. Internet GIS: Distributed Geographic Information Services
for the Internet and Wireless Networks. Hoboken, New Jersey: John Wiley &
Sons. 720 pp.
Peters, D. 2008. Building a GIS: System Architecture Design Strategies for Managers.
Redlands, California: ESRI Press. 292 pp.
Peters, D. 2009. System Design Strategies: 26th Edition. ESRI Technical Reference
Document. Retrieved from: http://www.esri.com/library/whitepapers/pdfs/
sysdesign.pdf
Plewe, B. 2007. Web Cartography in the United States. Cartography and Geographic
Information Science, April. 3 pgs.
Putz, Steve. 1994. Interactive Information Services Using World-Wide Web Hypertext.
First International Conference on World-Wide Web, Geneva Switzerland. May
25-27, 1994. 10 pp.
Rao, S. and Vinay, S. 2009. Choosing the Right Frameworks for an Informed Enterprise
Web GIS Solution, Center for International Earth Science Information Network.
Retrieved from: http://ciesin.columbia.edu/binaries/web/global/ news/2010/s-
rao_gisframe-paper-jan2010.pdf
Richardson, J. 2010. GIS in Modern Local Authorities. GEOconnexion International
Magazine, July/August 2010, pgs. 28-30.
Rome Area Chamber of Commerce. 2010. Rome Area Chamber of Commerce 2010
Membership Directory &Community Guide, August 1, 2010. 40pp.
46
Sahin, K. and Gumusay, M. U. 2008. Service Oriented Architecture (SOA) Based Web
Services for Geographic Information Systems. The International Archives of the
Photogrammetry, Remote Sensing and Spatial Information Services, vol. 37, pgs.
625-630.
Somers, R. 2001. Quick Guide to GIS Implementation and Management. Park Ridge, IL:
Urban and Regional Information Systems Association (URISA) Retrieved from:
http://www.urisa.org/files/publications/quick_guide_gis_impl_mgmt/
quick_guide_gis_impl.pdf
Stoimenov, L., Stanimirovic, A. and Djordjevic-Kajan, S. 2005. Geographic Information
System Interoperability in Local Community Environment. From Pharaohs to
Geoinformatics, Cairo, Egypt. April 16-21, 2005. Retrieved from:
http://www.fig.net/pub/cairo/papers/ts_41/ts41_02_stoimenov_etal.pdf
Tsou, M. 2004. Present Realities and the Future of Internet GIS. GIS Development.
Retrieved from: http://www.gisdevelopment.net/magazine/years/2004/july/29.asp
Tunceli, O., Collins, T. and Goetz, S. 2003. GIS and Your Community. The Northeast
Regional Center for Rural Development, Pennsylvania State University. Retrieved
from: http://www.cas.nercrd.psu.edu/GIS/gis.pdf
U.S. Census Bureau. 2000. Profile of General Demographic Characteristics: 2000.
Retrieved from: http://censtats.census.gov/data/KS/1602031100.pdf
U.S. Census Bureau. 2009. U.S. Census Bureau QuickFacts: State and County
QuickFacts. Retrieved from: http://quickfacts.census.gov/qfd/states/20000.html
Vermes, J. 2006. Is Web Technology Disrupting Traditional GIS? GPS World,
47
September 1, 2006. Retrieved from: http://www.gpsworld.com/gis/integration-
and-standards/is-web-technology-disrupting-traditional-gis-7460
Weber, G. 2010. County’s GIS Site Ready for April 5 Unveiling. Hays Daily News.
March 23, 2010, p. A1.
Yaakup, A., Bakar, Y. A. and Sulaiman, S. 2004. Web-based GIS for Collaborative
Planning and Public Participation Toward Better Governance. GIS Development.
Retrieved from: http://www.gisdevelopment.net/proceedings/gisdeco/2004/paper/
ahrispf.htm
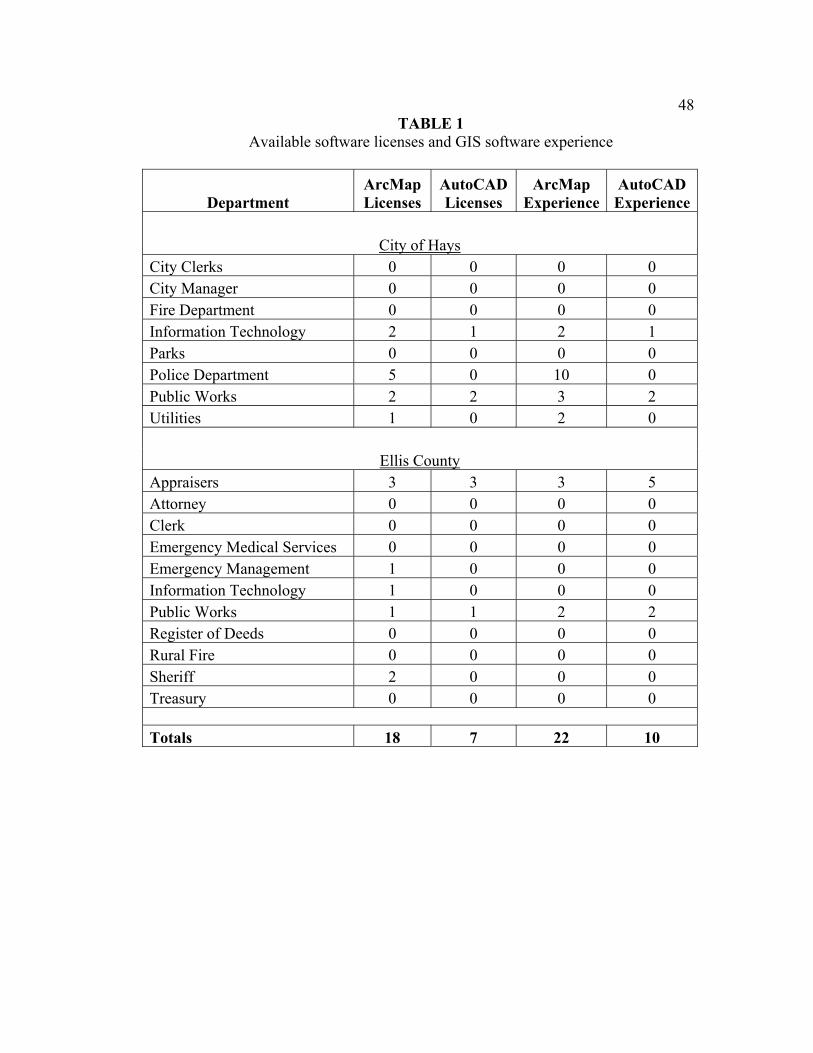
48
TABLE 1 Available software licenses and GIS software experience
Department ArcMap Licenses
AutoCAD Licenses
ArcMap Experience
AutoCAD Experience
City of Hays
City Clerks 0 0 0 0 City Manager 0 0 0 0 Fire Department 0 0 0 0 Information Technology 2 1 2 1 Parks 0 0 0 0 Police Department 5 0 10 0 Public Works 2 2 3 2 Utilities 1 0 2 0
Ellis County Appraisers 3 3 3 5 Attorney 0 0 0 0 Clerk 0 0 0 0 Emergency Medical Services 0 0 0 0 Emergency Management 1 0 0 0 Information Technology 1 0 0 0 Public Works 1 1 2 2 Register of Deeds 0 0 0 0 Rural Fire 0 0 0 0 Sheriff 2 0 0 0 Treasury 0 0 0 0 Totals 18 7 22 10
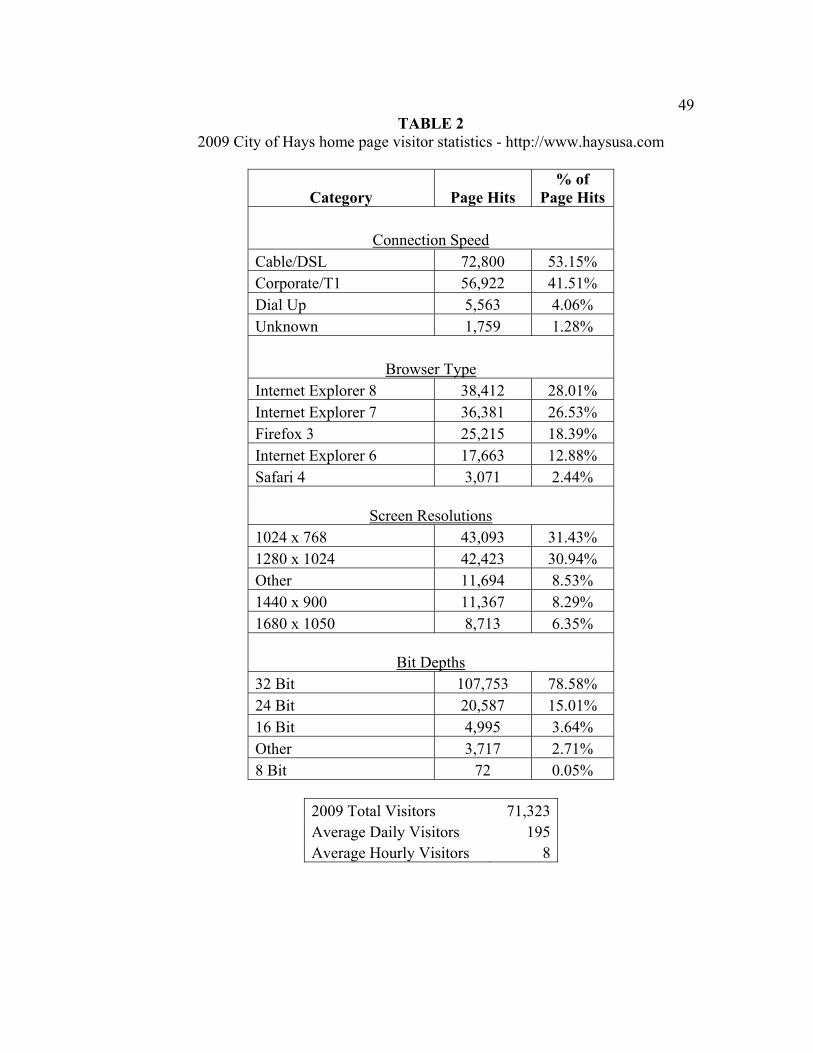
49
TABLE 2 2009 City of Hays home page visitor statistics - http://www.haysusa.com
Category Page Hits % of
Page Hits
Connection Speed Cable/DSL 72,800 53.15% Corporate/T1 56,922 41.51% Dial Up 5,563 4.06% Unknown 1,759 1.28%
Browser Type Internet Explorer 8 38,412 28.01% Internet Explorer 7 36,381 26.53% Firefox 3 25,215 18.39% Internet Explorer 6 17,663 12.88% Safari 4 3,071 2.44%
Screen Resolutions 1024 x 768 43,093 31.43% 1280 x 1024 42,423 30.94% Other 11,694 8.53% 1440 x 900 11,367 8.29% 1680 x 1050 8,713 6.35%
Bit Depths 32 Bit 107,753 78.58% 24 Bit 20,587 15.01% 16 Bit 4,995 3.64% Other 3,717 2.71% 8 Bit 72 0.05%
2009 Total Visitors 71,323Average Daily Visitors 195Average Hourly Visitors 8
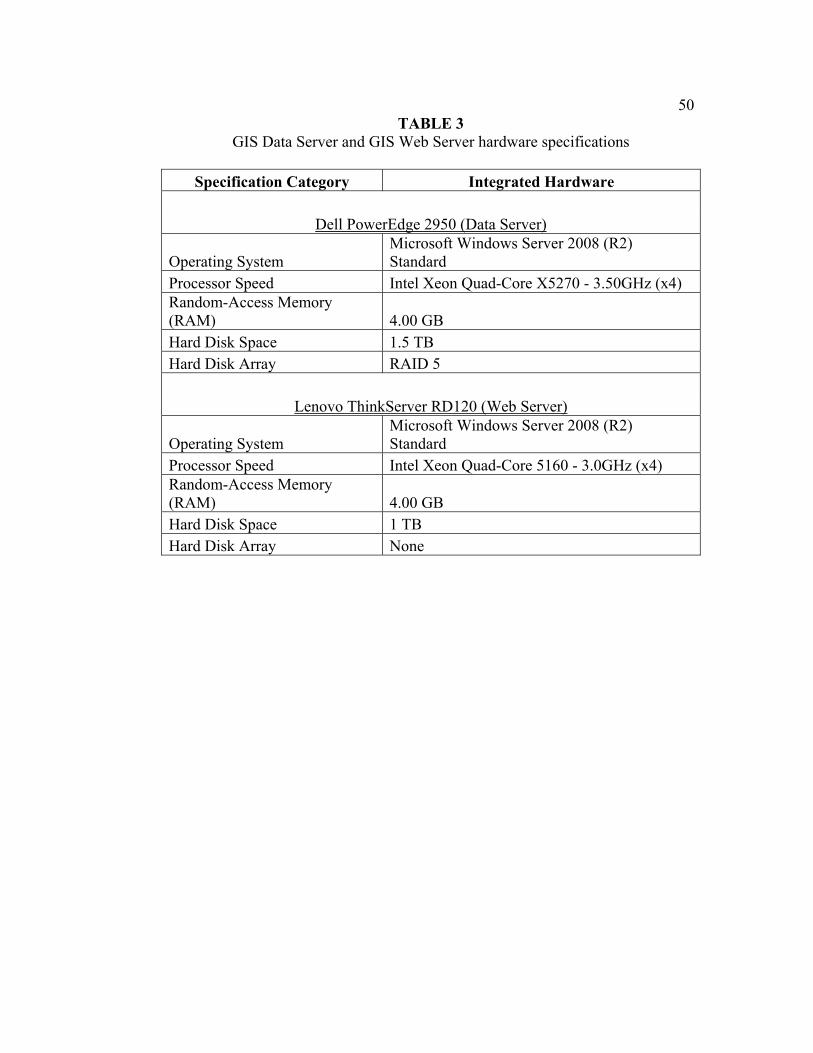
50
TABLE 3 GIS Data Server and GIS Web Server hardware specifications
Specification Category Integrated Hardware
Dell PowerEdge 2950 (Data Server)
Operating System Microsoft Windows Server 2008 (R2) Standard
Processor Speed Intel Xeon Quad-Core X5270 - 3.50GHz (x4) Random-Access Memory (RAM) 4.00 GB Hard Disk Space 1.5 TB Hard Disk Array RAID 5
Lenovo ThinkServer RD120 (Web Server)
Operating System Microsoft Windows Server 2008 (R2) Standard
Processor Speed Intel Xeon Quad-Core 5160 - 3.0GHz (x4) Random-Access Memory (RAM) 4.00 GB Hard Disk Space 1 TB Hard Disk Array None
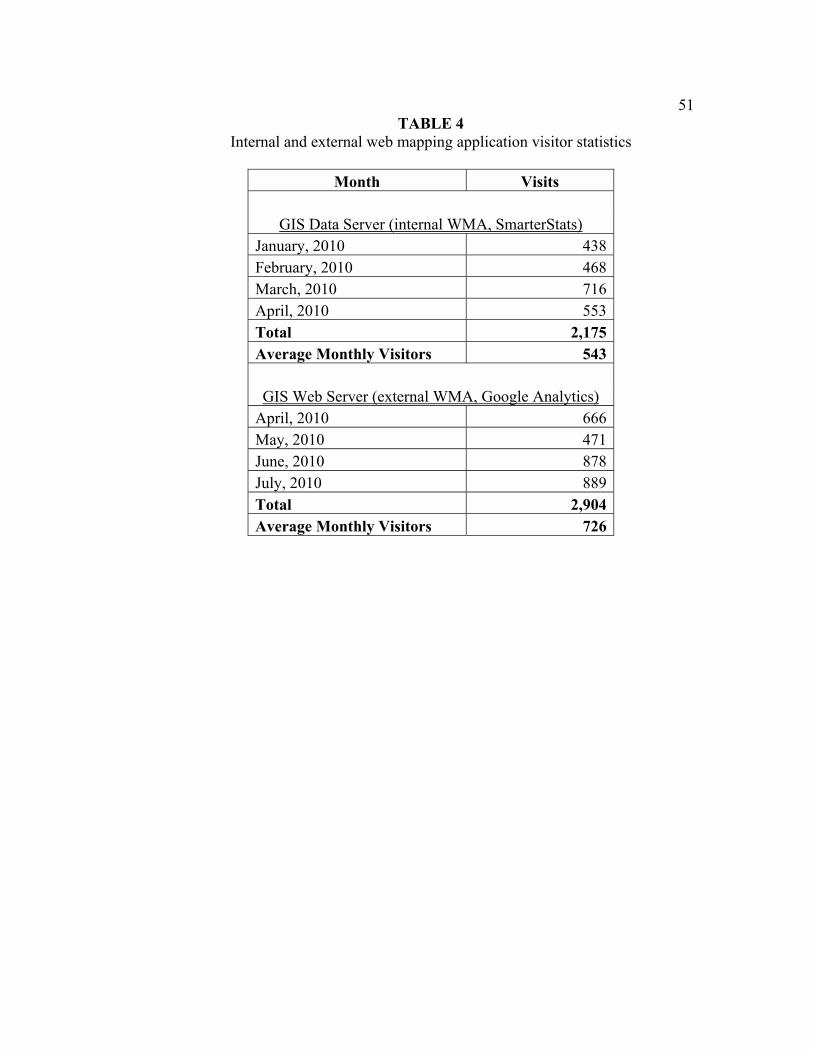
51
TABLE 4 Internal and external web mapping application visitor statistics
Month Visits
GIS Data Server (internal WMA, SmarterStats)
January, 2010 438 February, 2010 468 March, 2010 716 April, 2010 553 Total 2,175 Average Monthly Visitors 543 GIS Web Server (external WMA, Google Analytics)
April, 2010 666 May, 2010 471 June, 2010 878 July, 2010 889 Total 2,904 Average Monthly Visitors 726
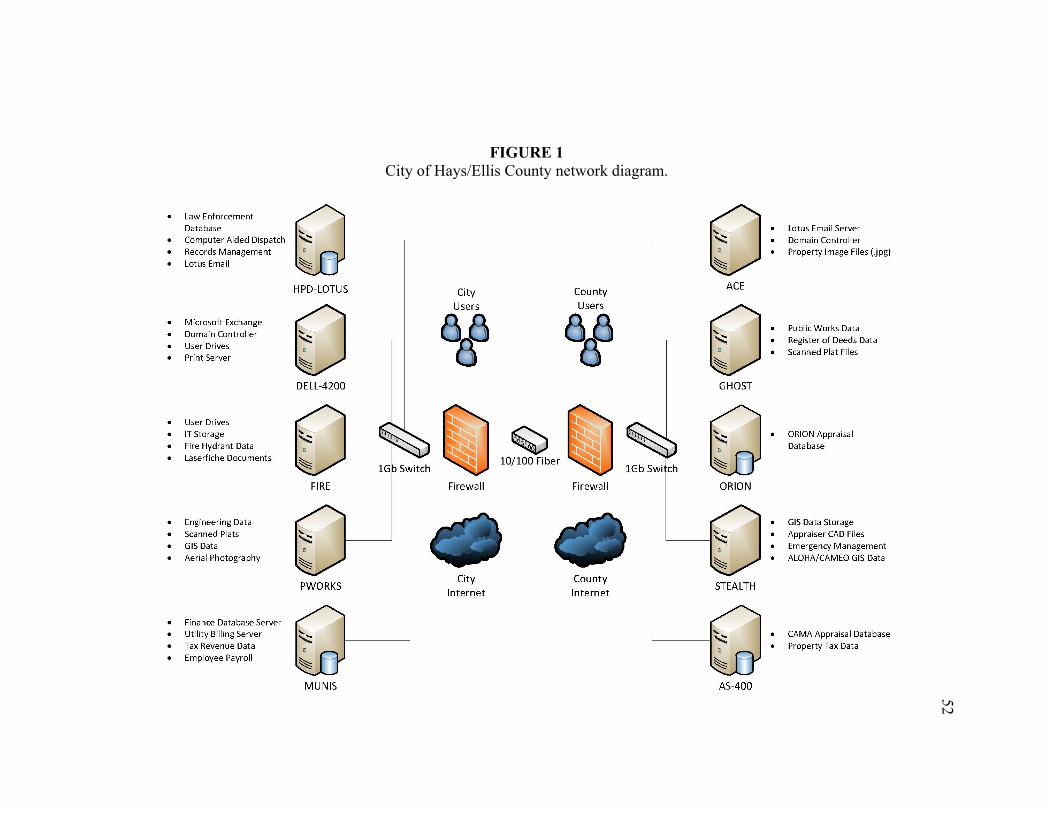
FIGURE 1 City of Hays/Ellis County network diagram.
52
. Law Enforcement Database . Lotus Email Server . Computer Aided Dispatch . Domain Controller . Records Management 0 . Property Image Files (.jpg) . Lotus Email
HPD-LOTUS City County ACE
. Microsoft Exchange Public Works Data . . Domain Controller Register of Deeds Data . . User Drives 0 . Scanned Plat Files . Print Server
DELL-4200 GHOST
. User Drives . IT Storage . ORION Appraisal . Fire Hydrant Data Database . Laserfiche Documents
FIRE ORION
. Engineering Data . GIS Data St orage . Scanned Plats . Appraiser CAD Files . GIS Data 0 . Emergency Management . Aeria I Photography . ALOHA/CAMEO GIS Data
PWORKS City County
STEALTH Internet Intern et
. Finance Data base Server
• Utility Billing Server • CAMA Appraisa l Database . Tax Revenue Data . Property Tax Data . Employee Payroll
MUNIS AS-400
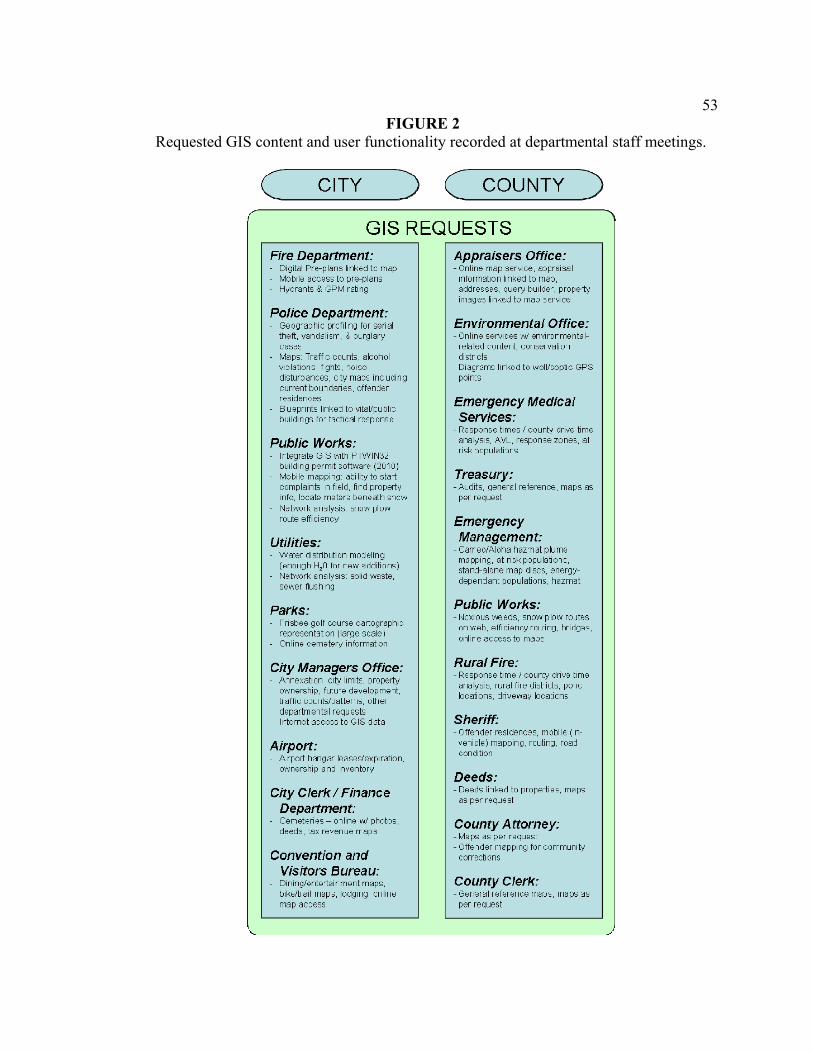
53FIGURE 2
Requested GIS content and user functionality recorded at departmental staff meetings.
C __ C_ITY __ ) C __ C_OU_N_T_Y _)
GIS REQUESTS Fire Department:
Digital Pre-plans linked tc map Mobile access to pre-plans
- H,crants & GPM reting
Police Department: Geog-mhic prcfil n,, for serial theft, van,j,:;lisn-, « JLrglary (;c:l:::i::cl~ Maps Traffc count3. alcohol violations fghts, 1oico disturJances, cty maJc incuding current bou1dariEs. offen:iu residene:es Bueprintc linkej to vital/r;ubli~ hllil,iinQS fo- tadirnl racrrnnsA
Public Works: lrtegrate G::; 1/\'ith PI Wl~J::l2 building permit aoftware (201 OJ Mobile mappi1g: atili:y to stai complaints n field, fird propertv info, locate meter, beneath s1cw NalNor k artalysis. srtov\' µluw route efficiency
Utilities: VVa:er distribution mojeling (eno1Joh H2 n for r Aw arlrtitions) NetNork 0n ,lysis: solid w,ste, seV\'er flush ng
Parks: ,risbee gol1 course car:ographio represent,ton 11arqe scale I Online cematgry in format on
City Managers Office: A1re:rntion city limitc. property ownership, fu:u-e davelop me 1t, l1 aflic CJLI ib/J~lle1 · is, ol11e1 departme1t3I requEsts lrtornot <lXOSG t o GIS ,kto
Airport: A rr,ort hAngAr IAasaslAxr,iration, ownership anj nventory
City Clerk I Finance Department: Cen eteri es - 01 line w/ photos, deeds, :a:< revenue rraps
Convention and Visitors Bureau: Dining/gntg iairmgnt maps , lJike/L1 c,il r1Jc1µ,, lullyirilJ crilirte map ac:Ess
Appraisers Office: - Online map service, a)i;raisal
intorm3tion linked to ma), addresses, query builde-, propeiy in-,~ges lin-<.:td to ma.:.i st::r\iice
Environmental Office: - Online ser-Mes w! envirnrmental-
relc1Leu lUrtlertl, """'"' vc1Liu I
distr els Dia,rcmc lirl<od to well/septic GPS poin:s
Emergency Medical services:
- Response times/ county drive time analysis, AVL, respome zone3, at risk :icpulati-:ws
Treasury: -ALdits, qenErel reference, maps as
per request
Emergency Management:
- Carrea/Aloha haz-nat plume mappin,, c,t riol< p)r:ulc,tio1c, stanj-3lone map discs, onergv-depen:lan: populations. hazm,t
Public Works: -1-.Jcxious weeds, snow plow roJtes
on l'iAh. Affi r,ienr,y COi rinQ. hrirloac. Oil li i-e access to ma Jc
Rural Fire: - Response time I coun:y driva time
ar1c1lysis, rurc1I fire llisL·1cLs, µu-,c locations. jJive\tla:; loca:icns
Sheriff: - one1 der resi dencos, m obi IE ( n-
ve1i cle) m3ppin g, rcutinJ. roa:l condition
Deeds: - Deeds li1ked to propeiies, maps
as par req_,est
County Attorney; - lv1aps as per reques: - Offe1der r1cpping for co1rn1unity
corrections
county Clerk~ -GE:! r1::!1::.1I rl:!rE:!r t r1c:e rr1c:u~. 111<::1µs ::1:::;
per request
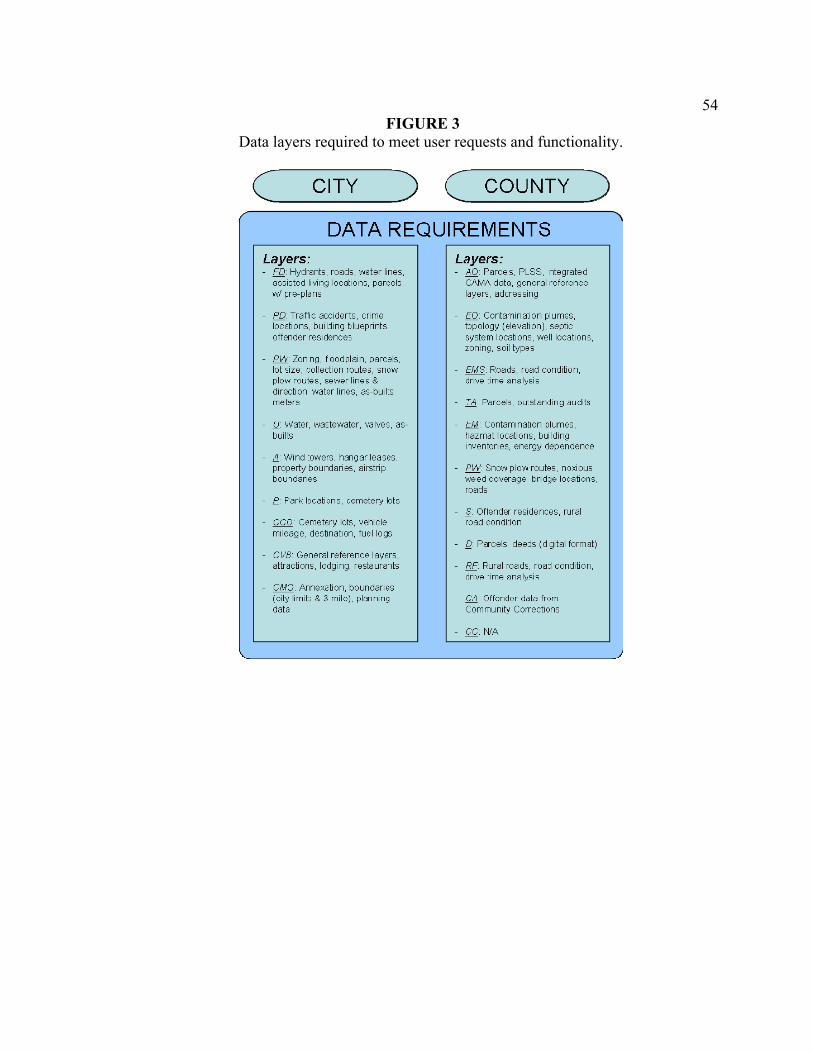
54FIGURE 3
Data layers required to meet user requests and functionality.
( _ _ C_IT_Y _ ) ( _ _ C_OU_N_T_Y _)
DATA REQUIREMENTS Layers: - FD Hydrants, roads, water lines,
accictcd living locations, porcclc w/ i:re-pla ns
- PD Traffic acciderts, crime loc2tions, bui ljing blueprints offender residence,
- PW Zon ng. foodplain. parc,ls. lot size, collection route,, snow plow routes, sewer lines & direction water lines, as-buil:s met,rs
- Y. water, wastewater, valves, as-builts
- A Wind :owers. hangar leases. property boundaries, airstrip bou1daries
- E. Park locations, cemetery lots
- cco: cemetery lots, vehicle mileage, destination, fuel logs
- CVB General reference layers, attractions, lodging, restaura1ts
- CM'J Annex2tion, boundaries (city limit & 3 mile). plmning data
Layers: AO Parces, PLSS, ntegrated CAM/, date, gen crnl ro foronco layers, a deres sing
EO Conta11ina:ion plumEs, tJpology (elevation), septic system locations, well locations, zoning, soil types
EMS Roads, road condition, drive :ime analysis
7A Parcels, ou:standing audits
t::M contamInatIon plumes, hazmat locations, building i1ventories, energy dependence
PW Snow plow routes, noxious weed coverage brid;ie locations, roads
£ Offender residences, rural road condi:i on
Q_ Parcels deejs [ d gItal format)
RF Rural roads, roaj condition, JrivA ·imA ~milysis
CA Offender data from Community Corrections
CC N/A
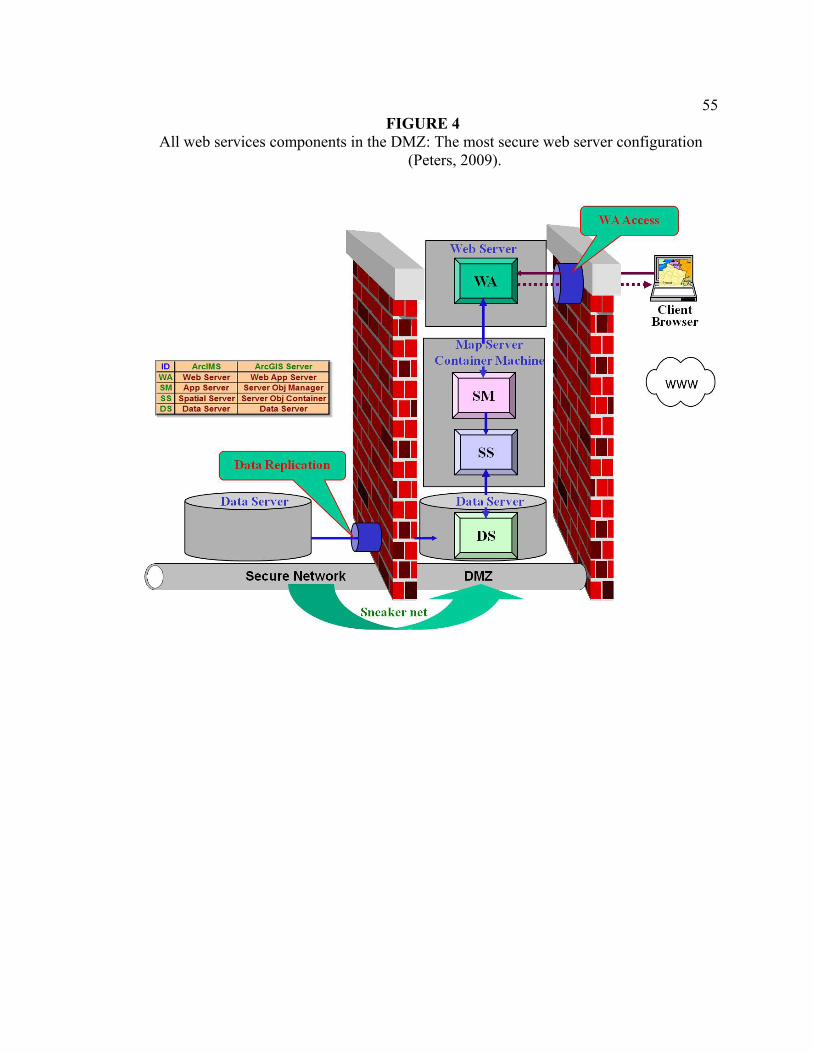
55FIGURE 4
All web services components in the DMZ: The most secure web server configuration (Peters, 2009).
ID ArclMS WA Web Server SM App Server ss SDatial Server OS Data Server
0
ArcGIS Server Web ADD Server
Server Obj Manager Server Obi Container
Data Server
\Yeh Sernr
WA
l\fap Sernr Container l\Iachin
SlVI
ss
Data Server
DS
e
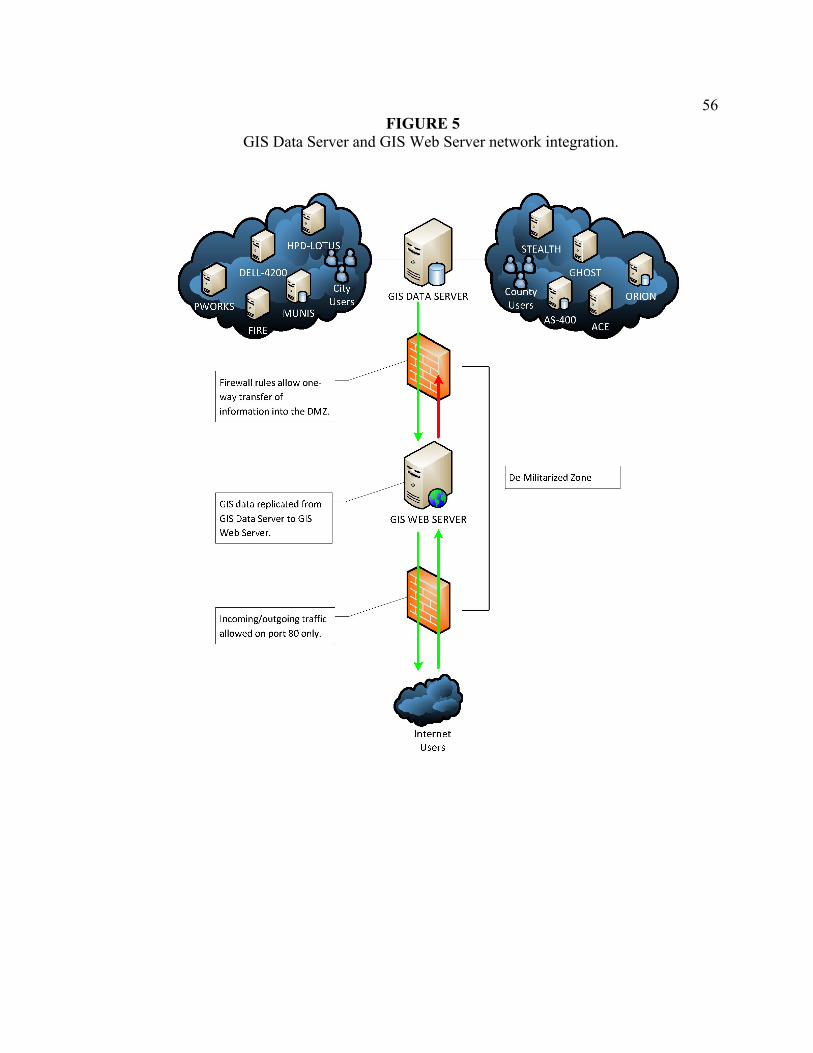
56FIGURE 5
GIS Data Server and GIS Web Server network integration.
Firewall rules allow one-way transfer of information into the DMZ.
G IS data replicated from G IS Data Server to G IS Web Server.
Incoming/outgoing traffic allowed on port 80 only.
GIS WEB SERVER
Internet Users
De-Militarized Zone
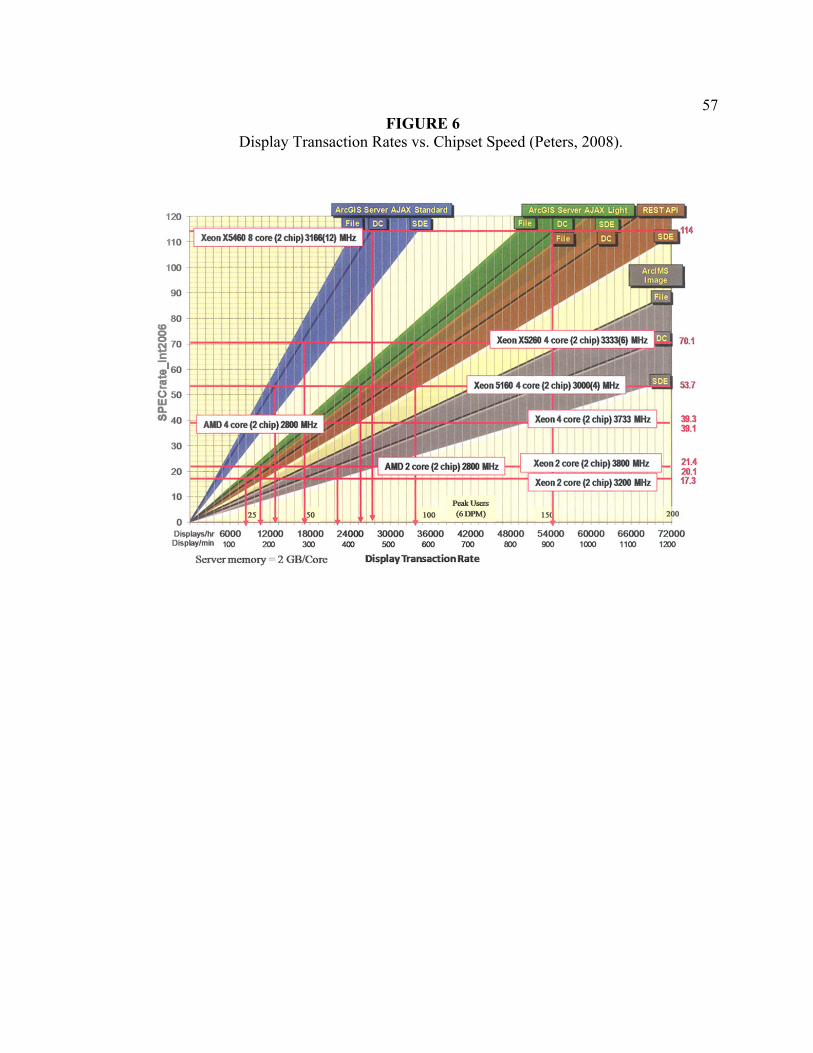
57FIGURE 6
Display Transaction Rates vs. Chipset Speed (Peters, 2008).
120
110
1: 1 80
co
~70 C: -;,60 -"' ... 0 50 w Q. (I) 40
30
20
10 Peak Usm;
50 100 (6DPM) 0 Displays/hr 6000 12000 18000 24000 30000 36000 42000 Display/min 100 200 300 400 500 600 700
Server memory = 2 GB/Core Display Transaction Rate
Xeon 2 core (2 chip) 3800 MHz
Xeon 2 core (2 chip) 3200 MHz
15
48000 54000 60000 66000 800 900 1000 1100
200
39.3 39.1
21.4 20.1 17.3
72000 1200
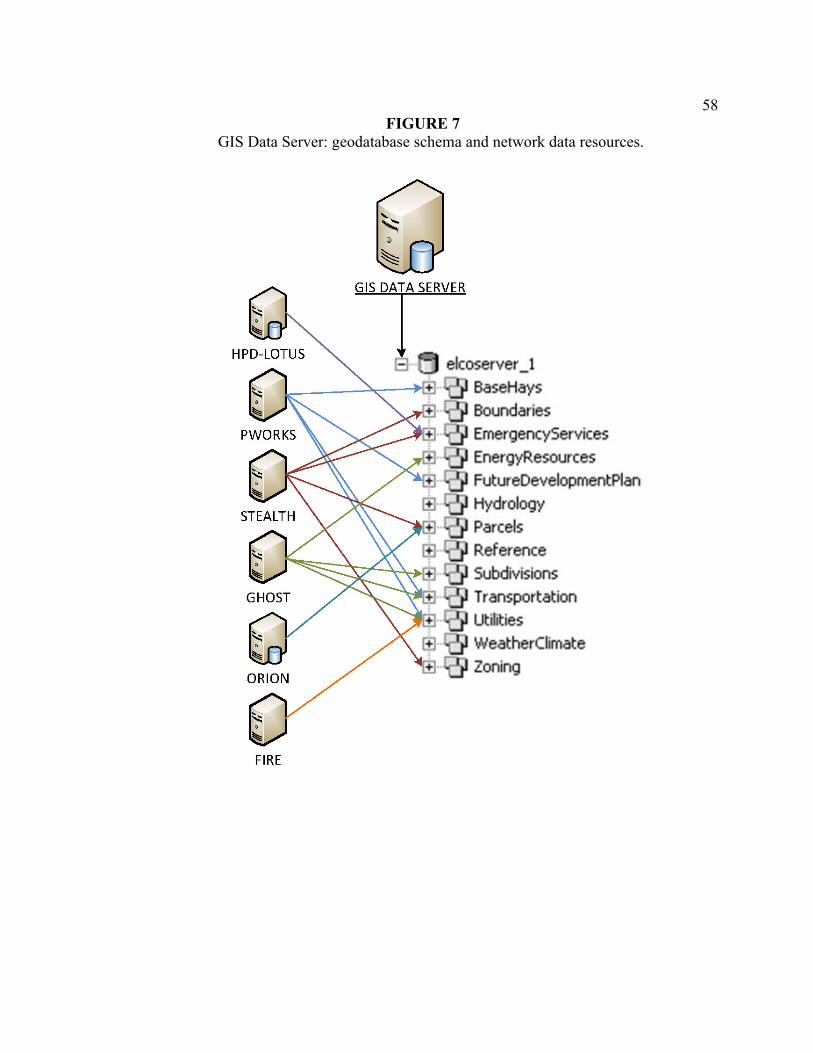
58FIGURE 7
GIS Data Server: geodatabase schema and network data resources.
FIRE
GIS DATA SERVER
elcoserver _1 BaseHays
l Boundaries + 3) EmergencyServices
EnergyResources FutureDevelopmentPlan
t Hydrology Parcels
Zoning
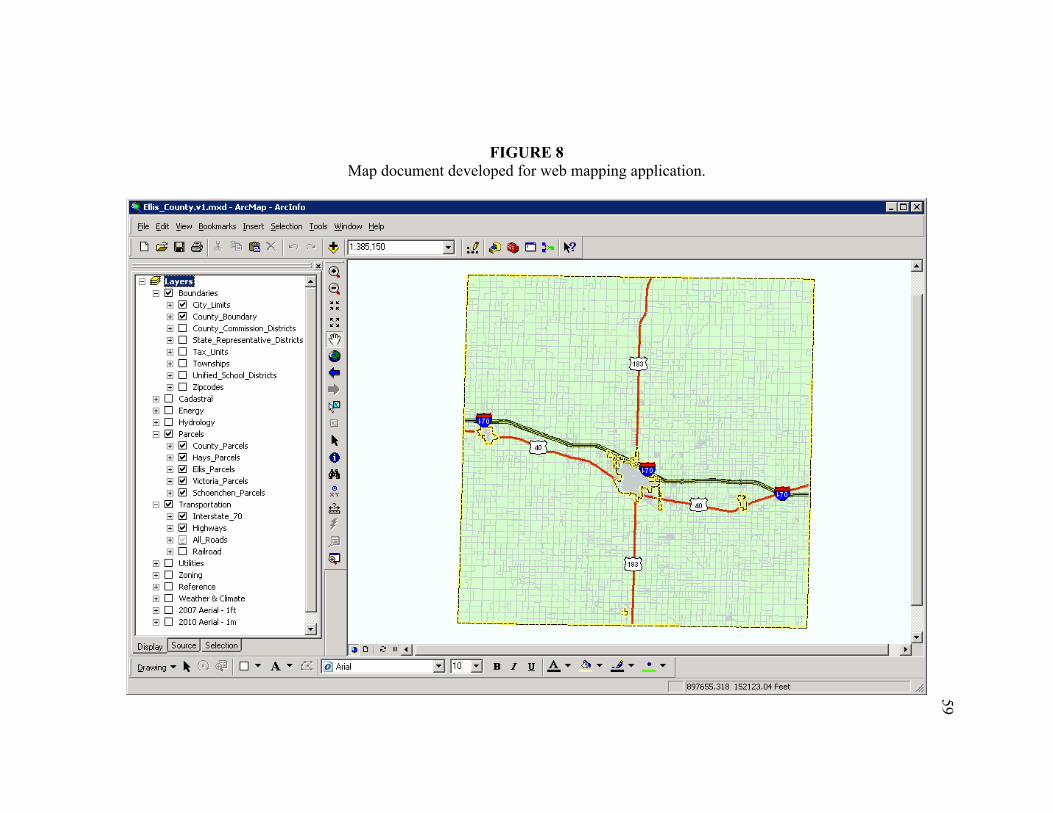
FIGURE 8 Map document developed for web mapping application.
59
'- Elhs_County.vl.mHd - ArcMap - Arclnfo ll!l@EJ J E,ile ~dit ~iew ~ookmarks !nsert 2election Iools ~indow tfelp
B S1 . B Boundaries
1±1 li2I City _Limits 1±1 li2I County _Boundary 1±1 D County_Commission_Districts 1±1 D State _Representative _Districts 1±1 D T ax_Units 1±1 D Townships 1±1 D Unified_School_Districts 1±1 D Zipcodes
1±1 D Cadastr al 1±1 D Energy 1±1 D Hydrology B li2I Parcels
1±1 ll!I County _parcels 1±1 li2I Hays_parcels 1±1 li2I Ellis_parcels 1±1 Victoria_Parcels 1±1 Schoenchen_Parcels
B Transportation 1±1 li2I Interstate _70 I±} 1i2J Highways 1±1 AII_Roads 1±1 D Railroad
1±1 D Utilities 1±1 D Zoning 1±1 D Reference 1±1 D Weather & Climate 1±1 D 2007 Aerial - 1ft 1±1 D 2010 Aerial - Im ..:.J
"' XY
=
Display Source Selection lt c I 11 i.!_) Qr awing • 8 <fi3 I D • A • IZ 11.;,IQJ,,_Ar_:_ial _ _.:__-=:=.=:..:J=· ;-;j;::1 o=..:J=,-B- I- Y1 I-A;-•- &:;--•- ---;.l;-•--•- ·' I _____________
I iB97655.31B 152123.04 Feet
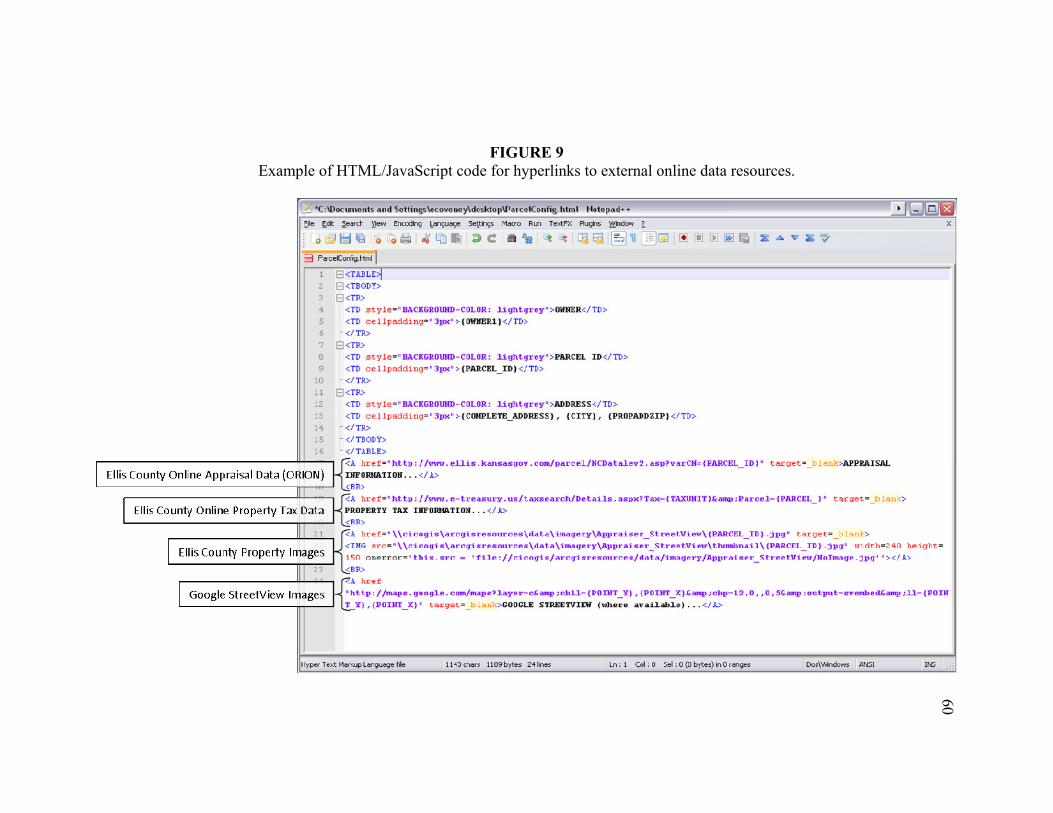
FIGURE 9 Example of HTML/JavaScript code for hyperlinks to external online data resources.
60
'C:\Oocun,ents and SeUings\ecoveaey\desktop\ParcelConfig .html · Not epad0
Elle ~ch )Jew Eneodlng languai,e 5eltJngs Macro Rlln TextFX fluglns ~ndow l
o a s '3 o o ;: Cb n ., c a ,. -t C!1 Iii 11 ~ !ID oo oo IE Iii Ii z A "" z ·~ Pa-celCon'ig.ttml I
1 !il<TABLE>j 2 ~ <TBOD':'> 3 ~ <TR> 4 5 6 7 8 9
10 11 12 13 14 15 16
I Ellis County Online Appraisal Data (ORION)
11 1 -I Ellis County Online Property Tax Data
I 21
I Ellis County Property Images
I :'
<TD style="BACKGROUllD- COLOR: l.ightqrey"> Ol!NER</ TD> <TD c:ellpadding=" 3px" > { O\fllERl }</TD> <ITR>
~ <TR> <TD sty le• " BACKGROUllD- COLOR: l.ightqrey">PARCEL ID </ TD> <TD c:ellpadding="31>x" > {PARCEL_ I D} </ TD> <ITR>
~ <TR> <TD s ty le• " BACKGROUllD- COLOR: l.ightqrey" >ADDRESS</TD> <TD c:ellpadding="3px" > {COHPLETE_ ADDRESS} , {CITY) , {PROPADDZIP} </TD> <ITR> <ITBODY> <IT.lBLE> <A href=" http:/ /wvm. ellis . kansaS!JOY. com/parc eJ./l!CDatal.ev2. asp?varCII= {PARCEL_ ID J " target= _b lank>APPRAISAL I NFORNATI ON . . . </ A> <BR> <A hre t • "http://mm.e- treasury.us/ t axsearch/Details .aspx?Tax- (TAXUlUTJ&amv:Parce l • (PARCEL_}" t a rCJ!!e t • _blank> PROPERTY TAX IIIFORMA.TION . . . </ A> <BR'>
'<A href=" \ \cicogis\arcgisresources\data\imagery\Appraiser_S t,:eetVi eu\ {PARCEL_ I»} .jpg" tar,;,et= _blank> < IMG ~re• • \ \ o i r.ngi sr:\airo 11i srfl!sr:nnrnl! s:\d-'tA\imAgil'!ry\Appraii sr:l!r _St.r~P.t.Vi &tM\t.hnmbna i 1\{PARCF.I._ TD} . jp!J" 1,1 i drh • ?.40 hfll,1,:Jhr.• 150 oner r or= ' this . src = ·~i1e://oico9is/arc~isresources/dat~/i.Jnagery/Avvraiser_ StreetView/No1Jnaue .jvu 1 • > </A> <BP.'> <A. href
X
I Google StreetView Images • h ttp:/ /JMf/S. googl.e. oomfmaps? l.ayer- 0,anq, ;obll.- {PODIT _ Y> , (POilrr _ X)'amp ;obp- 12, 0, , 0, 5&a,np; out.put.- syembecl.& ;l.l.- (POIII T Y }, (POXIIT_X)' tar~et=_bla.nlt>GOOGLE STR.EETVXEW (wh e r e avail.abl.o ) . . . </A>
Hype, Text Mor"'-'P l"'1guoge file I 143 ch<,r, 1189byte s 21 lines ln; I Col; 0 Sel ; 0 (0 byte s) in O renges Dos\\l-,lndows ANSI ·~
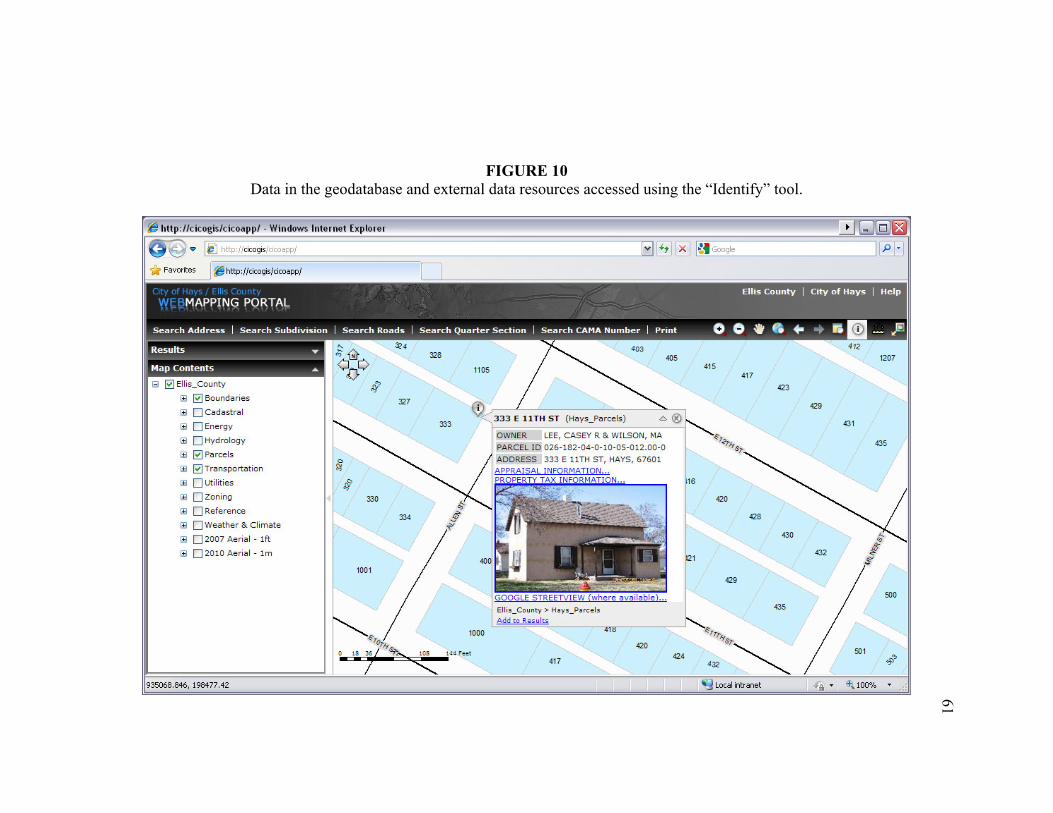
FIGURE 10
Data in the geodatabase and external data resources accessed using the “Identify” tool.
61
:IJ http://cicogis/cicoapp/ - Windows Internet Explorer
!vi~~ =l~l=-G_o....cog_le _______ ___,l[m
328 1207 11 05 415
417 423
l±l Boundaries 327 429 l±l o cadastral
l±l O Energy 333 431
l±l O Hydrology LEE, CASEY R & WILSON, MA ~,:q., 435 l±l Parcels
"s,-C
l±l Transportation
l±l O Utilities 16
l±l o zoning 330 420 l±l O Reference
334 l±l D Weather & Climate
l±l D 2007 Aerial - 1ft
l±l 0 2010 Aerial · l m 432
1001 429
500 435
~,o,..,_, 1000 12,,,., 420 "s,-~
0 !S ,., !CS 144.f~d 424 501
7 <::: 417 4:JZ ~ '>
935068.846, 198477.42 Local intranet -"a • @.. 100% .
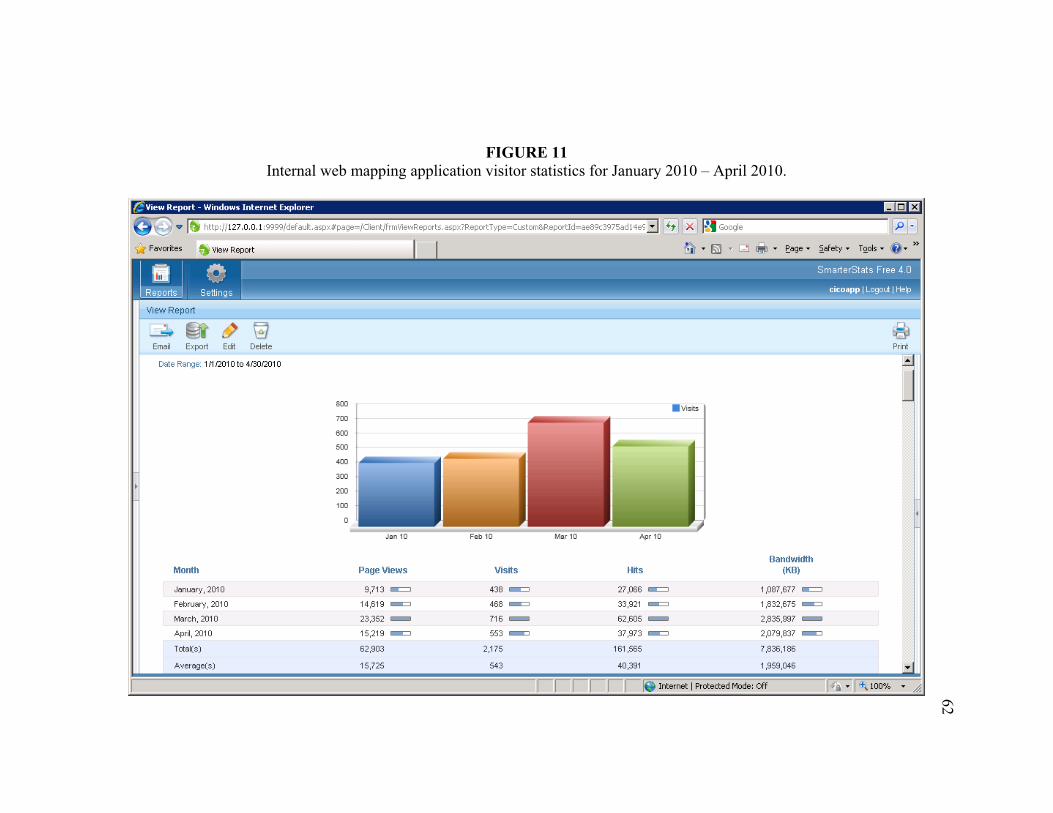
62
FIGURE 11 Internal web mapping application visitor statistics for January 2010 – April 2010.
{;V,ew Report - Wmdows Internet EHplorer ll!l@EJ -.. jfj http:/1127 ,0,0.1 :9999/def ault .aspx#page=/Client/frmViewReports.aspx>ReportType=Custom&Reportld=ae89c3975ad I 4eS ..:J l~I Google
tr Favorites View Report
View Report
Email Export Edtt Delete
Dote Range: 1f1/2010 to 4/30/2010
Month
January, 201 0
February, 201 0
March, 2010
April, 2010
Total(s)
Average(s)
800
700
800
500
400
300
200
100
0
Jan 10 Feb 10
Page Views Vis~s
9,713 -=:, 438 -=:,
14,619 -=:, 468 -=:,
23,352 - 716 -15,219 -=:, 553 _,, 62,903 2,175
15,725 543
Mar 10 Apr 10
H~s
27,066 -=:,
33,921 -=::,
62,605 -37,973 -=:,
161,565
40,391
• Iii! • 'G:I iii • e,age • :i,afety • Tg,ols • ~ - »
Bandwidth (KB)
1 ,087 ,677 -=:,
1,832,675 -==>
2,835,997 -
2,079,837 -=> 7,836,186
1,959,046
arterStats Free 4.0
cicoapp I Logout I Help
n 11111 I& Internet I Protected Mode: Off ~l~ t00% • A<
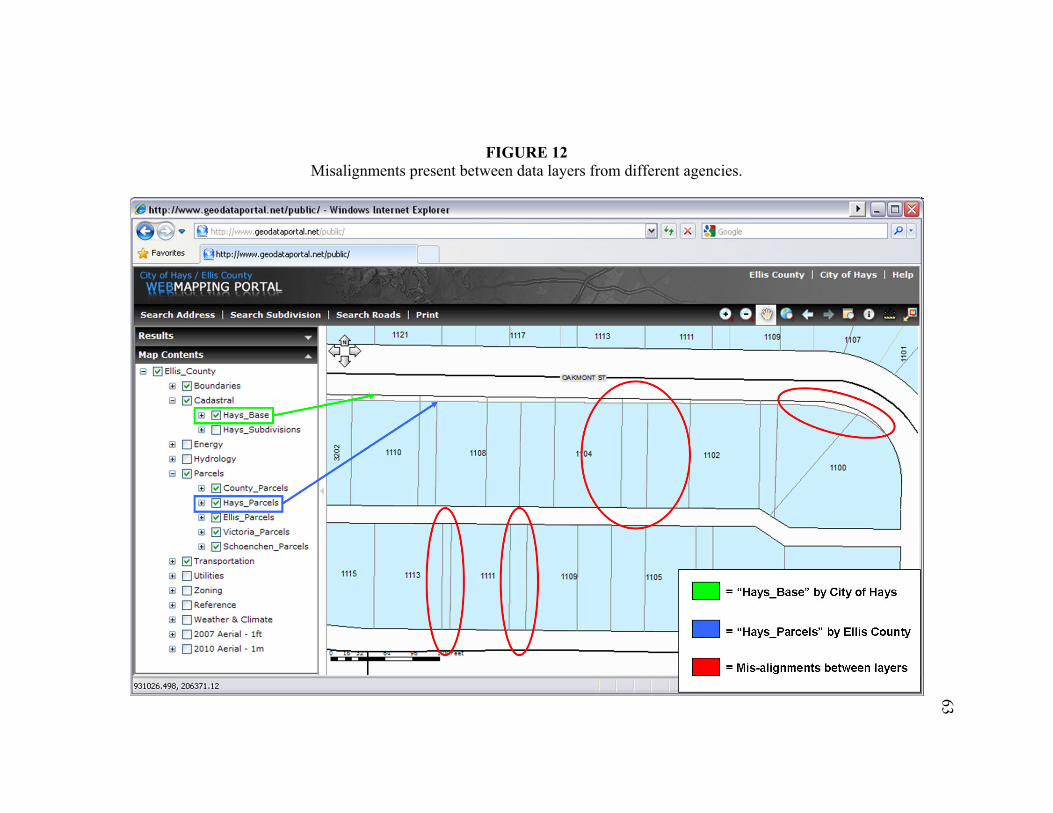
FIGURE 12 Misalignments present between data layers from different agencies.
63
l/; http://www.geodataportal.net/public/ · Windows Internet Explorer
~~---ge_od_a_ta_po_ r_ta_l._ne_t ________________________ ~[v_j ·~ X ~l·'=I _G_oog_ le __________ ~I P •
Boundaries 13 Cadastral
13 Parcels
Tra nsportation 0 Utilities o z oning D Reference D Weather & Climate D 2007 Aerial • 1ft D 2010 Aerial · lm
931026.498, 206371. 12
1115 1113 1111 110 1105
1102 1100
D = "Hays_Base" by City of Hays
- = "Hays_Parcels" by Ellis County
- = Mis-alignments between layers
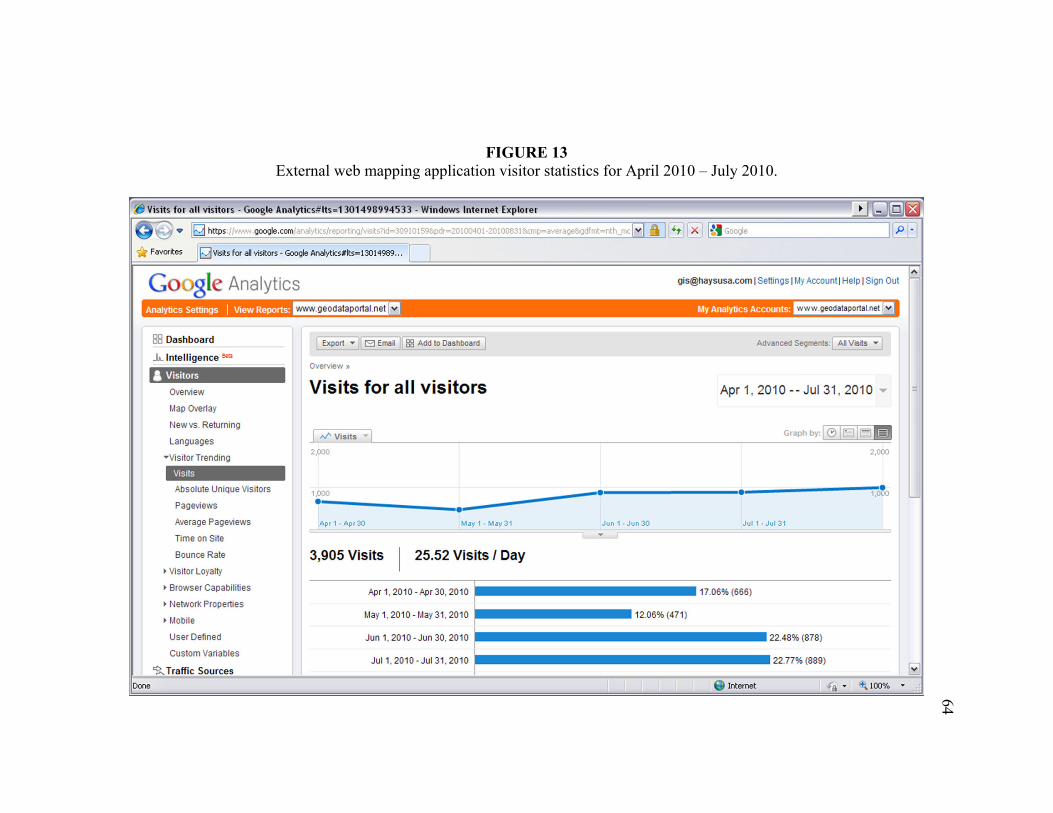
FIGURE 13 External web mapping application visitor statistics for April 2010 – July 2010.
64
'1J Visits for a ll visitors - Google Analytics;;lts - 1301498994533 - Windows Internet Explore r
lb3 https google.com ·s/r .s 1 HS • ..,.. .JIL 4Ul • ~11 al _ ~rage&Qdfmt•ntt [vj Q +t X ""''~=t _G_oog_l_e _________ ___.l p •
* Favorites [;;a visits for all vis~ors - Google Analytics#lts=l3014989 ...
Go gle Analytics [email protected] I Settmgs I IAy Account I Help I Sign Out
--------Analytics Settings I View Reports: www.geodataportal.net I My AnalytJcs Accounts:
Done
88 Dashboard
.1.. Inte ll igenc e """
I Visitors
Overview
Map Overlay
Newvs. Returning
Languages
? Visitor Trending
VIsIts
Absolute Unique Visitors
Pageviews
Average Pageviews
Time on Site
Bounce Rate
• Visitor Loyalty
• Browser Capabilities
• Network Properties
• l,lobile
User Defined
Custom Variables
'S-Traffic Sources
Export T IS::! Emal 88 Add to Dashboard
Overview•
Visits for all visitors
j ,./' Visits 2,000
Advanced Segments Al Visits T
Apr1 , 2010-- Jul31, 2010
Graph by: 2,000 1,000 -----------·-----------·----------~1~.~ ··--------·
Apr 1 - Apr30 May 1 - May 31
3,905 Visits 25.52 Visits / Day
Apr 1, 2010 - Apr 30, 2010
I.lay 1, 2010 - !day 31, 2010
Jun 1, 2010 -Jun 30, 2010
Jul 1, 2010-Jul31, 2010
Jun 1 . Jun 30
12.06% (471)
Jul 1 , Jul 3 1
17.06% (666)
Internet
22.48% (878)
22.77% (889)
..... . 11-., 100% • El
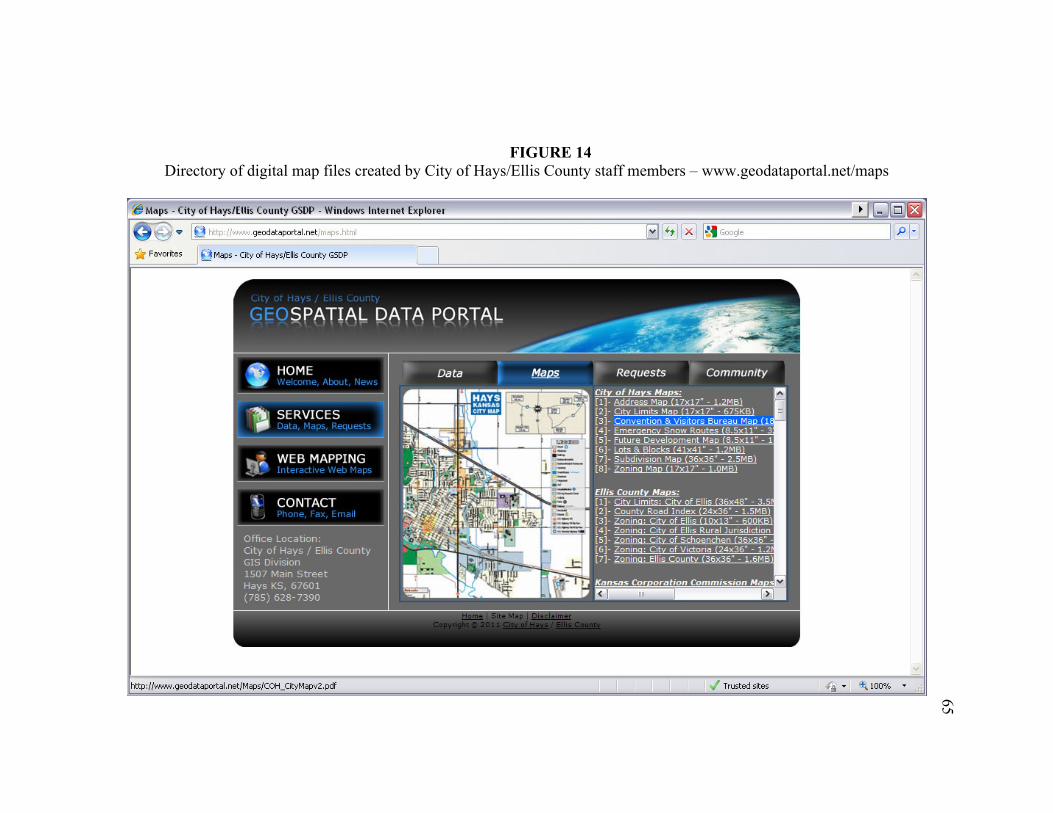
65
FIGURE 14 Directory of digital map files created by City of Hays/Ellis County staff members – www.geodataportal.net/maps
:IJ Maps - City of Hays/Ellis County GSDP - Windows Internet Explorer
O"@.., IB http://www.geodataportal.net/maps.html H~@ =l~l=-G_oo--'-gl_e _______ __.l lfil ~avorites
http://www.geodataportal.net/Maps/COH_CityMapv2.pdf ./ Trusted sites -l'a • 100%
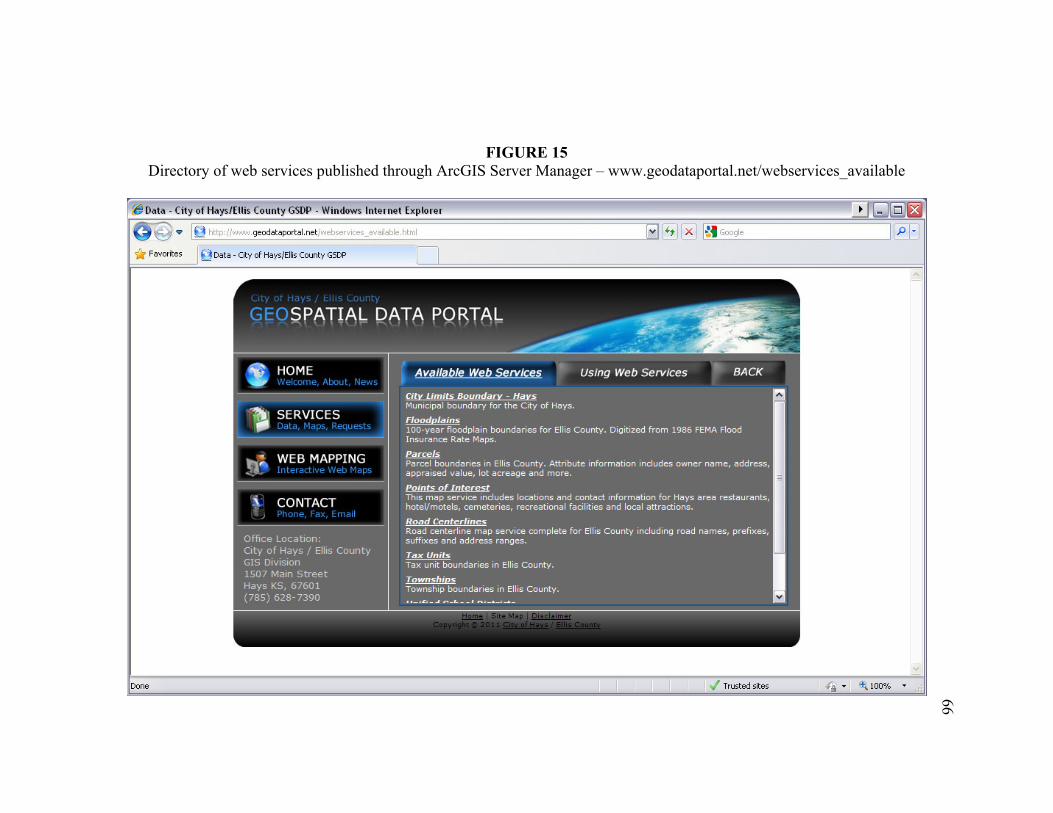
FIGURE 15 Directory of web services published through ArcGIS Server Manager – www.geodataportal.net/webservices_available
66
{IJ Data - City of Hays/Ellis County GSDP - Windows Internet Explorer
O"@.., IB http://www.geodataportal.net/webservices_available.html H~@ =l~l=-G_oo--'-gl_e _______ __.l lfil ~avorites
Done ./ Trusted sites -l'a • E!l. 100% •
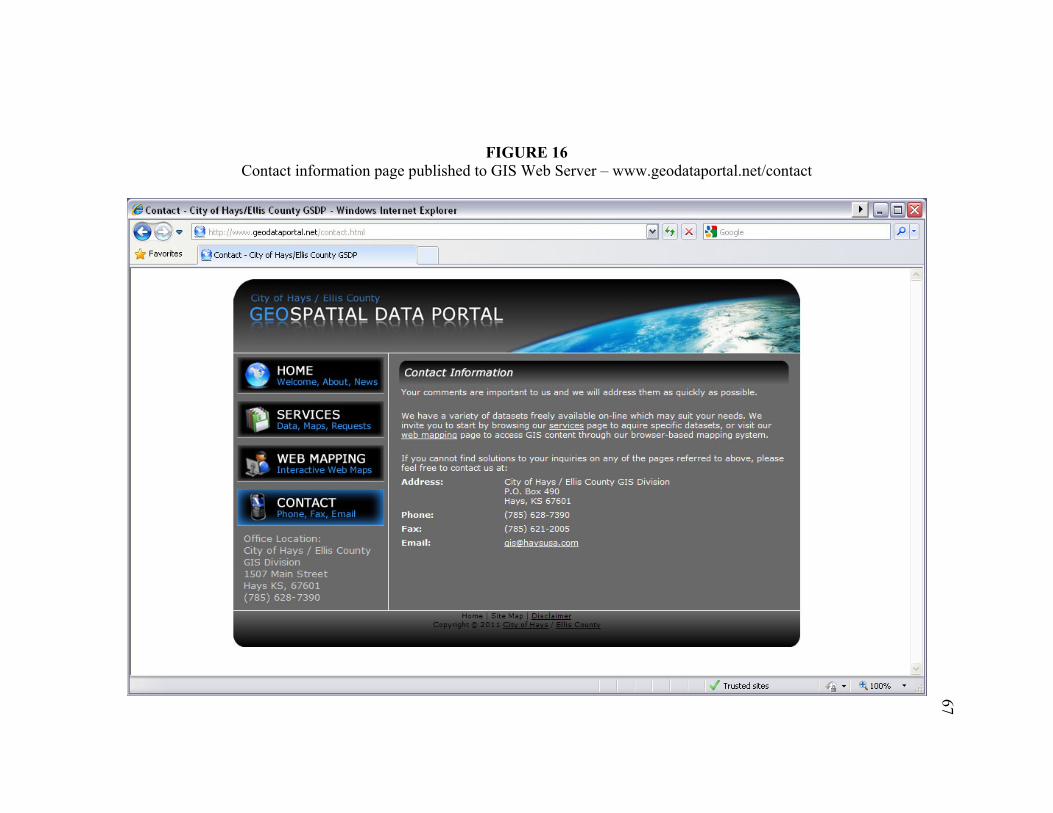
FIGURE 16 Contact information page published to GIS Web Server – www.geodataportal.net/contact
67
:IJ Contact - City of Hays/Ellis County GSDP - Windows Internet Explorer
O"@ .., I f3 http://www.geodataportal.net/contact.html H~@ =l~l=-G_oo--'-gl_e _______ __.l lfil ~avorites
./ Trusted sites -l'a • E!l. 100% •
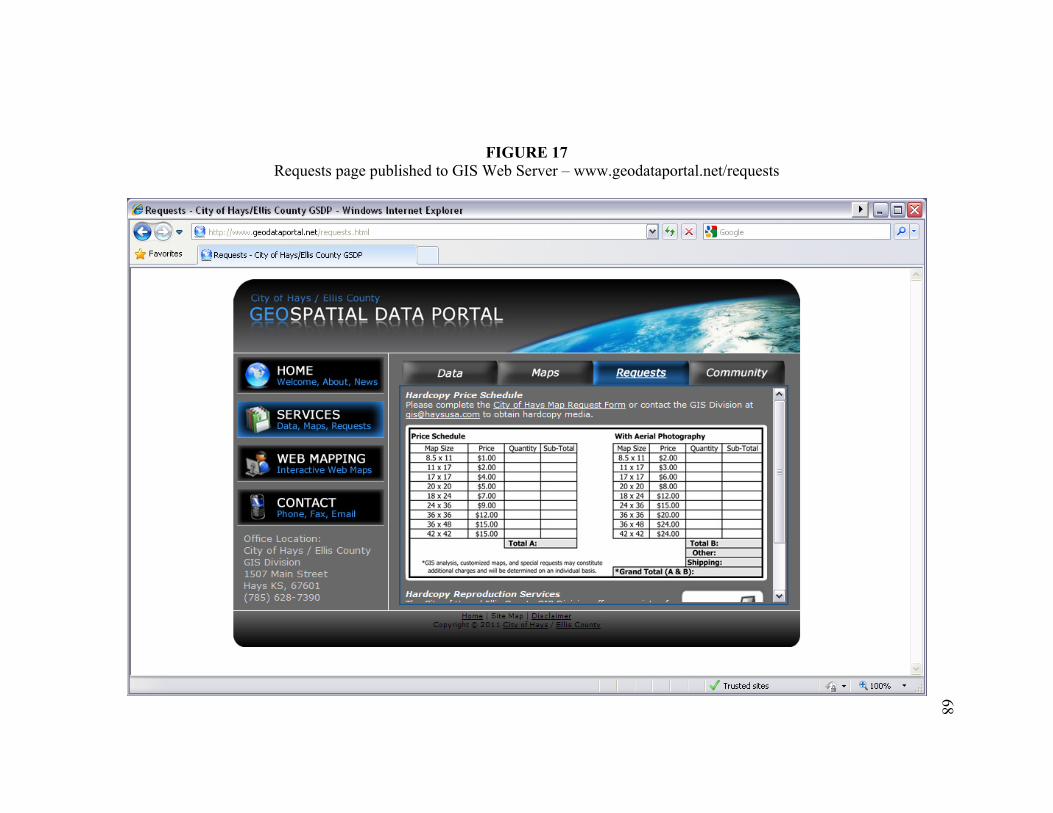
FIGURE 17 Requests page published to GIS Web Server – www.geodataportal.net/requests
68
rfJ Requests - City of Hays/Ellis County GSDP - Windows Internet [ xplo.-e.-
O'@ .., I t3 http://www.geodataportal.net/requests.html H~ @ c:ch~l=-G_oo-'-gl_e _______ __.l lfil if ~avontes
./ Trusted sites ~ 100%
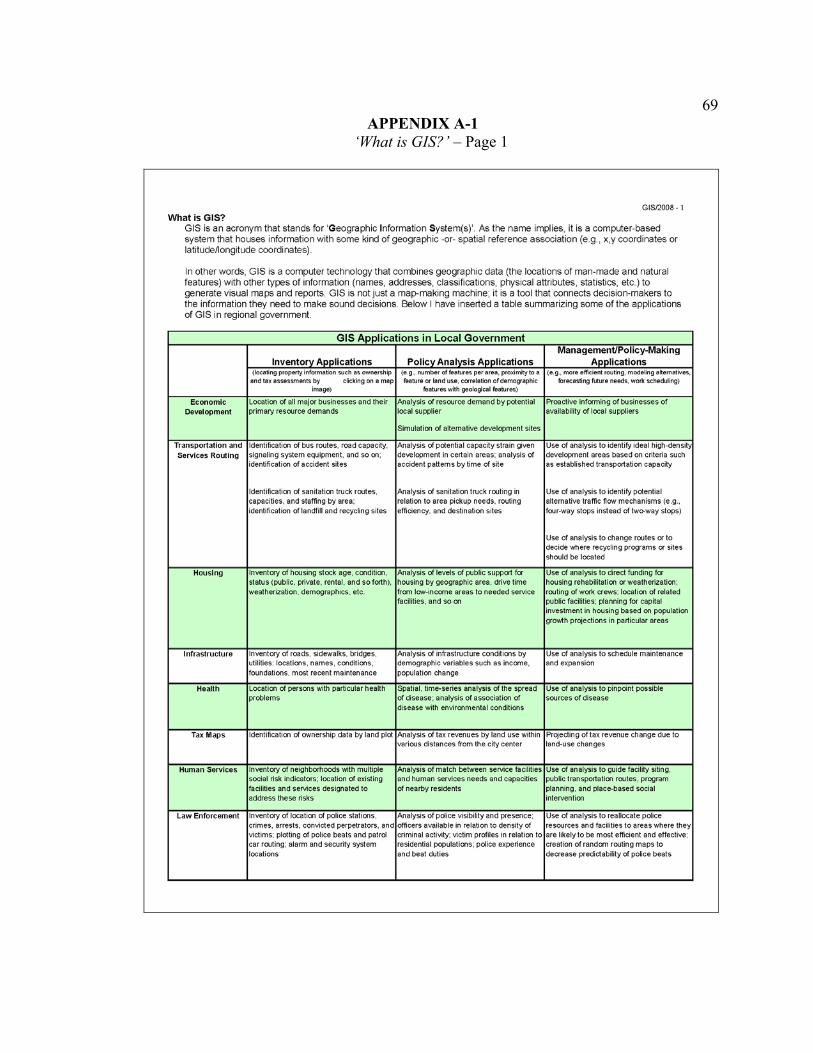
69APPENDIX A-1
‘What is GIS?’ – Page 1
GIS/2008 • I What is GIS?
GIS is an acronym that stands for 'Geographic Information System(s)' . As the name implies, it is a computer-based system that houses information with some kind of geographic -or- spatial reference association (e.g., x,y coordinates or latitudeAongitude coordinates).
In other words, GIS is a computer technology that combines geographic data (the locations of man-made and natural features) with other types of information (names, addresses, classifications, physical attributes, statistics, etc.) to generate visual maps and reports. GIS is not just a map-making machine; it is a tool that connects decision-makers to the information they need to make sound decisions. Below I have inserted a table summarizing some of the applications of GIS in regional government.
GIS Applications in Local Government Management/Policy-Making
Inventory Applications Policy Analysis Appl ications Applications ( locating ptop«ty information such as ownership (e .9-. numbe, of feature-!i: per area, proximity to a (e.g., morwi efficient routing, modeling alternatives,
and tax assessments by clicking on a map featurt!I or land use, carelation of demogaphic foleeasting future needs, wane scheduling) image) ft!aturM with geologir;al reatures)
Economic Location of all major businesses and their Analysis of resource demand by pctential Proactive infaming of businesses of Oe\/Glopment primary resource demands local supplier availability ol local suppliers
Simulatioo of alternative development sites
Transportation and ldentificatioo of bus routes. road capacity, Analysis of potential capacity strain given Use of analysis to identify ideal high-densicy Services Routing signaling system equipment. and so on; development in certain areas; analysis of development areas based on criteria such
identification of accident sites accident patterns by lime of site as established transportation capacity
ldentificatioo of sanitatioo trud< routes, Analysis of sanitation truck routing il Use of analysis to identify potential capacities. and staffing by area; relatioo 10 area pickup needs, routing allemative traffic flow mechanisms (e.g., idenlificatton of landfill and recycling sites efficiency. and destination sites foor-way stops instead of two-way slops)
Use of analysis to change routes or to decide where recycling programs or sites should be located
Housing Inventory of housing stock age, cooditioo , Analysis of levels ol public supp<>1 fo, Use of analysis to direct funding fo, status (public, private. rental. and so f<>1h), housing by geographic area, drive time housing rehabilitation o, weatherizatioo; weatherization. demographics , etc. from low-income areas lo needed service routing of work crews: location of related
facilities. and so oo public facilities: planning for capital investment in housing based on population growth projections in particular areas
Infrastructure Inventory of roads, sidewalks. bridges, Analysis of infrastructure conditioos by Use of analysis to schedule maintenance utilities: locations, names, condit ions, demographic variables such as income, and expansion foundations. most recent maintenance populalioo change
Health Location of persoos with particular health Spalial, lime-series analysis of the spread Use of analysis to pinpoint possible problems of disease ; analysis of association of soorces of disease
disease with enviroomentar conditioos
Tax Maps Identification of ownership data by land pie( Analysis of lax revenues by land use with in Projecting of tax revenue change due to various distances from the city center land-use changes
Human services Inventory of neighbor1loods with multiple Analysis of match between service facilities Use of analysis to guide facility siting, social risk indicators; location of existing and human services needs and capacities public transportation rootes , program facilities an d services designated to of nearby residents planning , and place-based social address these risks intervention
Law Enforcement Inventory of localioo of police statioos , Analysis of police visibility and presence: Use of analysis to reallocate police crimes, arrests. convicted perpetrators. 1;1nd officers 1;1vailable in relation to density of re sources and facilities to areas where lhey victims: plotting of police beats and patrol criminal activity: victim profiles in relation to are likely to be most efficient and effective: ca r routing: alarm and security system residential populatioos: poiice experience creation of randan routing maps to locations and beat dulies decrease predicta.bl ity of police beats
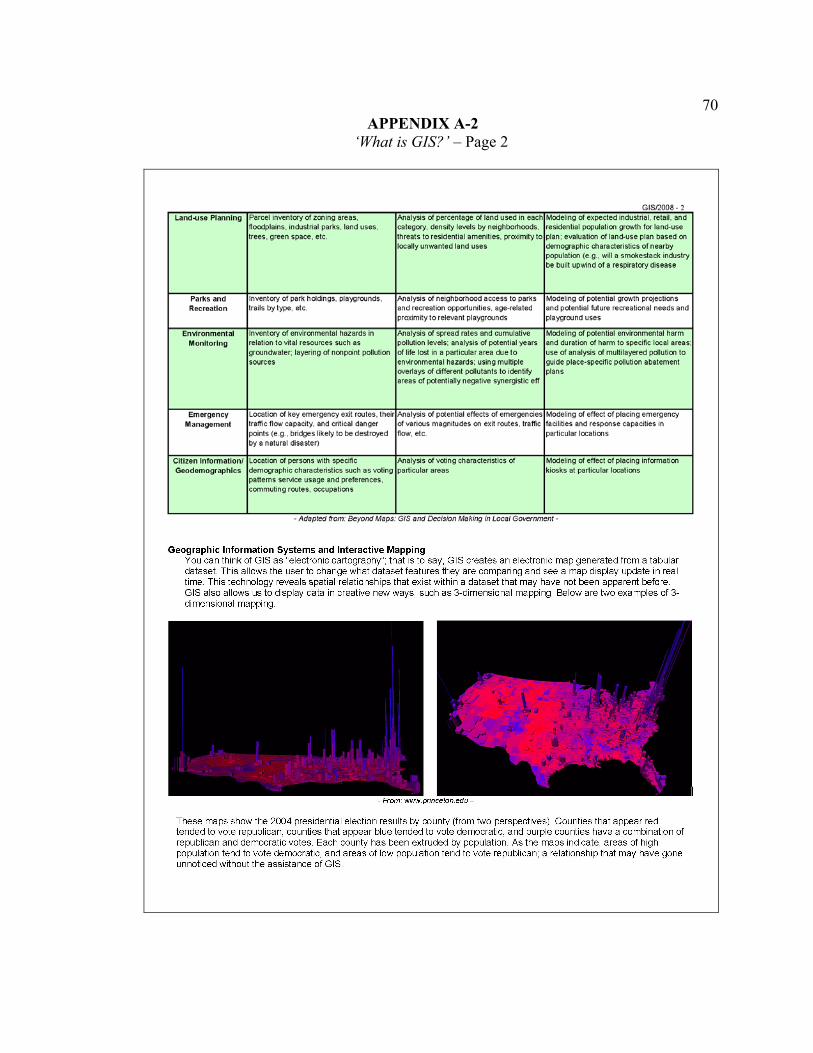
70APPENDIX A-2
‘What is GIS?’ – Page 2
GIS/2008- l Land-<.1s0 Planning Parcel inventory of zoning areas. Analysis of percenlage of land used in each Mocleling of expected industrial, retail. and
floodplains. industrial parks, land uses. calegory. density levels by neighborhoods. residential population grONth for land-use trees, green space. etc. threats lo residenlial amenil ies. proximity to plan : evaluation of land-use plan based on
locally unwanted land uses demographic characteristics of nearby population (e.g., will a smokestack industry be built upv.;nd of a respiratory disease
Parks and Inventory of park holdings, playgrounds . Analysis of neighborhood access to parks Modeling of potential growth projections Recreation trails by type. etc. and recreation opportunities , age-related and potential future recreational needs and
proximity to relevant playgrounds playgroond uses
Environmental Inventory of environmental hazards in Al\alysis of spread rates and cumulative Modeling of potential environmental harm Monitoring relation to vital resources such as pollution levels; analysis of pc:tential years and du ration of harm to specific local areas:
groundwater: layering of non point pollution of life lost in a particular area due to use of analysis of multi layered pollution to sources en~roomental hazards; using multiple guide place-specific pol lution abatement
overtay!; of different pdtutants to identify plans areas of polentially negative synergistic eff
Emergency Loeation of key emergency exit routes . their Al>alysis of pO!ential effec ts of emergencies Modeling of effect of placing emergency M anage ment traffic flow capacity. and critical danger of various magniludes on exit routes, traffic facilities and response capacities in
points (e.g .. bridges likely to be destroyed now. etc. particular locations by a natural disaster)
Citizen Information/ Location of persoos with specific Analysis of voling characterislics of Modeling of effect of placing information Geo demographics demographic characterist ics such as voting particu lar areas kiosks at particular locations
patterns service usage and preferences, commuting routes . occupations
- Adapted from: Beyond Maps: GIS and Decrsron Making in Local Government -
Geographic Information Systems and Interactive Mapping You can think of GIS as "electronic cartography"; that is to say, G IS creates an electronic map generated from a tabular dataset This allows the user to change what dataset features they are comparing and see a map display update in rea l time. This technology reveals spatial relationships that exist within a dataset that may have not been apparent before. GIS also allows us to display data in creative new ways, such as 3-dimensional mapping. Below are two examples of 3-dimensional mapping.
- From: www. princeton.edu -
These maps show the 2004 presidentia l election results by county (from two perspectives). Counties that appear red tended to vote republican, counties that appear blue tended to vote democratic, and purple counties have a combination of republican and democratic votes. Each county has been extruded by population. As the maps indicate, areas of high population tend to vote democratic, and areas of low population tend to vote republ ican; a re lationship that may have gone unnoticed without the assistance of GIS.

71APPENDIX A-3
‘What is GIS?’ – Page 3
GIS/2008- 3 Real World Examples of Internet-Based GIS
Below are a few links that show how some local governments are currently using web-based GIS. As you will notice, some of the sites are far more developed than others. To load these links in your default bfowser (though some may only work in IE), hold down the CTRL key on you keyl:xlard while you click the link. For many of these sites, you w ill have to agree to a data disclaimer before entering the mapping application.
Quick-Start Tutorial GIS data is organized into layers, and the sites below allow you to turn visible layers "on" and "off'. Checking a l:xlx and refreshing the map will add the layer to your map, un-checking a layer wil l remove it from your map display. You also have the option to set one layer to "active". The active layer will display information associated with it when using the "identify' tool (see below).
The three most common tools used in interactive mapping are the "Zoom In/Ou / ~ . and the "Identify" O tool Choose the identify tool and select an object on the map (this object must be part of the active layer) to display any attribute information associated with that feature
Websites Link #1 : Many of these sites have a common interface system consisting of a series of buttons. For a quick tutorial and list of button functions please click "Link #1"
-hftp://pro~ies.c-ciarn .clllWebsitelinformalion/ArclMS_ Too/borlnfo.htm -
Link #2: This is the City of Salina's Publ ic Access Mapping site. The upper-right hand corner of the viewer allows you to choose between three maps: Utilities, General , and Planning. By selecting one of these options, the viewer automatically selects a pre-defined set of visible layers. Layers can manually be turned on or off below.
- http:J/66.210.12.106 -
.b.iD..!Ll& Broome County's Unified Parcel Information System. This system houses a tremendous amount of data including land assessments, tax maps, addresses, and zoning.
- http.J/broomegis.co.broome.ny.usANebsite/GJSWeblgisapps.htm.
Wisconsin County Web Mapping Sites. This site contains links to online mapping applications for almost every county in Wisconsin. Some are better than others ..
- http::llboastal.lic.wisc.edulwisconsin--imsANisconsin-ims.htm -
When viewing these sites, I ask that you be thinking about how GIS could benefit your department, what types of information and interfaces you would like to see, and to record and email me any ideas/questions you may have.
Thank you, Eamonn Coveney GIS Specialist/ I.T. Division [email protected] (785) 628-7390
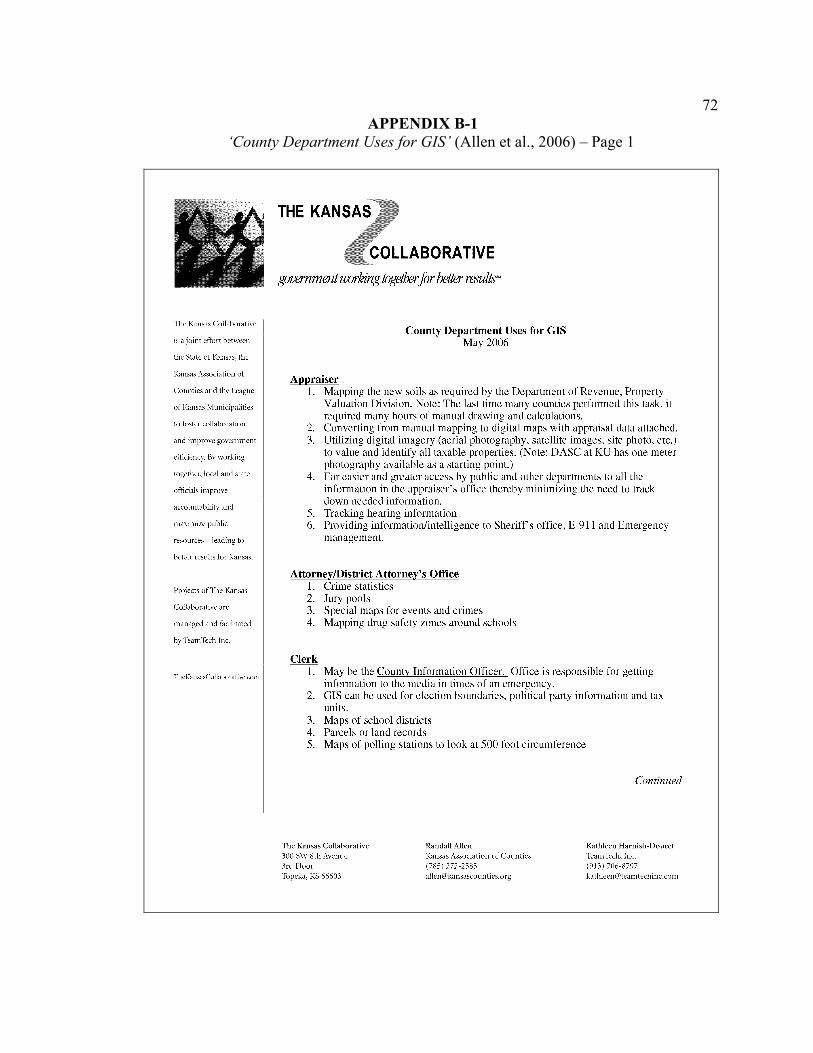
72APPENDIX B-1
‘County Department Uses for GIS’ (Allen et al., 2006) – Page 1
The Kansas Collaborative
is a joint effort between
the State of Kansas, the
Kansas Association of
Counties and the League
of Kansas Municipalities
to foster collaboration
and improve government
efficiency. By working
together, local and state
officials improve
accountability and
maximize public
resources - leading to
better results for Kansas.
Projects of The Kansas
Collaborative are
managed and facilitated
by Team Tech Inc.
TheKansasCollaborative.com
THE KANSA5'
E,oLLABORA TIVE fJJl)(?rflmenl working together for better rrmJlsw
Appraiser
County Department Uses for GIS May 2006
1. Mapping the new soils as required by the Department of Revenue, Property Valuation Division. Note: The last time many counties performed this task, it required many hours of manual drawing and calculations.
2. Converting from manual mapping to digital maps with appraisal data attached. 3. Utilizing digital imagery (aerial photography, satellite images, site photo, etc.)
to value and identify all taxable properties. (Note: DASC at KU has one meter photography available as a starting point.)
4. For easier and greater access by public and other departments to all the information in the appraiser's office thereby minimizing the need to track down needed information.
5. Tracking hearing information 6. Providing information/intelligence to Sheriff's office, E-911 and Emergency
management.
Attorney/District Attorney's Office 1. Crime statistics 2. Jury pools 3. Special maps for events and crimes 4. Mapping drug safety zones around schools
Clerk 1. May be the County Information Officer. Office is responsible for getting
information to the media in times of an emergency. 2. GIS can be used for election boundaries, political party information and tax
units. 3. Maps of school districts 4. Parcels or land records 5. Maps of polling stations to look at 500 foot circumference
The Kansas Collaborative 300 SW 8th Avenue 3rd Floor Topeka, KS 66603
Randall Allen Kansas Association of Counties (785) 272-2585 [email protected]
Continued
Kathleen Harnish-Doucet TeamTech, Inc. (913) 706-8797 [email protected]
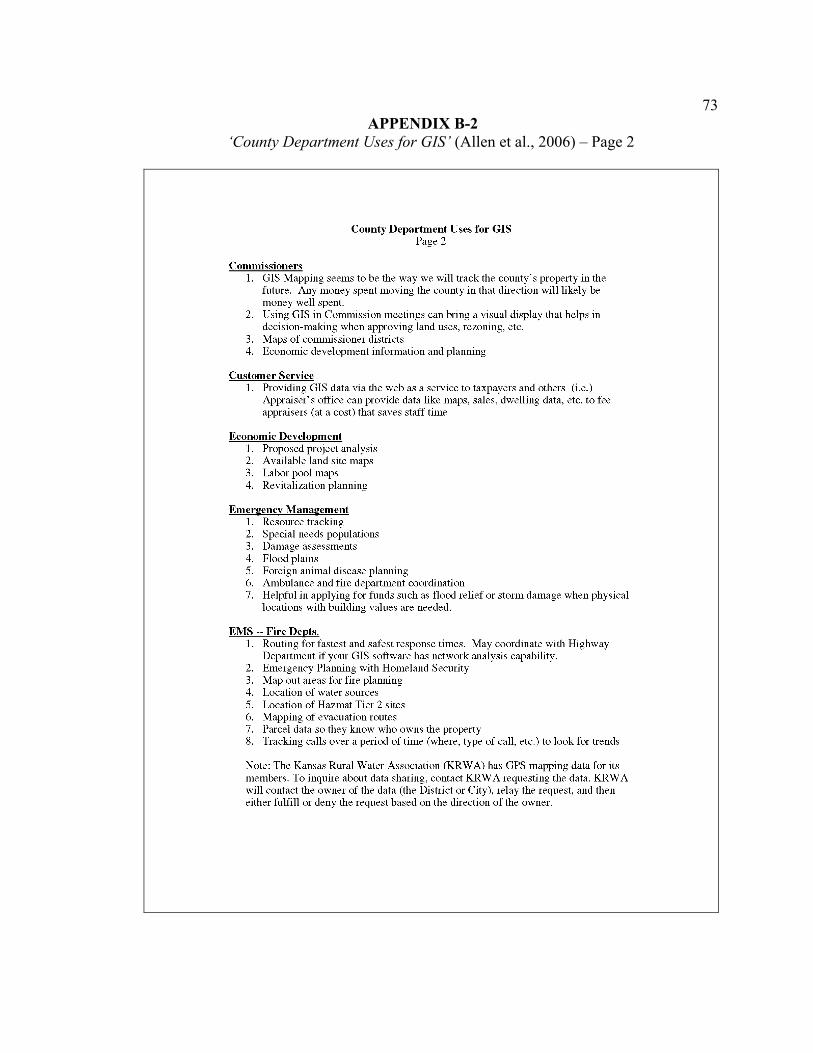
73APPENDIX B-2
‘County Department Uses for GIS’ (Allen et al., 2006) – Page 2
Commissioners
County Department Uses for GIS Page2
1. GIS Mapping seems to be the way we will track the county's property in the future. Any money spent moving the county in that direction will likely be money well spent.
2. Using GIS in Commission meetings can bring a visual display that helps in decision-making when approving land uses, rezoning, etc.
3. Maps of commissioner districts 4. Economic development information and planning
Customer Service 1. Providing GIS data via the web as a service to taxpayers and others (i.e.)
Appraiser's office can provide data like maps, sales, dwelling data, etc. to fee appraisers (at a cost) that saves staff time
Economic Development 1. Proposed project analysis 2. Available land site maps 3. Labor pool maps 4. Revitalization planning
Emergency Management 1. Resource tracking 2. Special needs populations 3. Damage assessments 4. Flood plains 5. Foreign animal disease planning 6. Ambulance and fire department coordination 7. Helpful in applying for funds such as flood relief or storm damage when physical
locations with building values are needed.
EMS -- Fire Depts. 1. Routing for fastest and safest response times. May coordinate with Highway
Department if your GIS software has network analysis capability. 2. Emergency Planning with Homeland Security 3. Map out areas for fire planning 4. Location of water sources 5. Location ofHazmat Tier 2 sites 6. Mapping of evacuation routes 7. Parcel data so they know who owns the property 8. Tracking calls over a period of time (where, type of call, etc.) to look for trends
Note: The Kansas Rural Water Association (KRWA) has GPS mapping data for its members. To inquire about data sharing, contact KRW A requesting the data. KRW A will contact the owner of the data (the District or City), relay the request, and then either fulfill or deny the request based on the direction of the owner.

74APPENDIX B-3
‘County Department Uses for GIS’ (Allen et al., 2006) – Page 3
Highway Department
County Department Uses for GIS Page 3
1. Road Signs -- their location, condition, replacement schedules 2. Map roads in County for public use, i.e. farmers, hunters, etc. 3. Track bridge and road repairs, replacements, roads closed 4. Coordinate information with EMS for emergency routing 5. Track utility lines to be located when doing construction on roads 6. Map elevations 7. Track road types and surface 8. Pavement management 9. Track load limits on bridges 10. Track events i.e. accidents 11. Traffic counts 12. Motor grater routes 13. Snow removal, sanding and salting routes and schedules
Health Department 1. Coordinate emergency planning for Homeland Security with Emergency
Management, Sheriff and other county departments 2. Add a layer of public health emergency supply locations, decontamination
facilities in the county, control center, and facilities to be used in emergencies 3. Location of day care centers, homebound individuals, nursing homes, points of
distribution sites, etc. 4. Track communicable disease outbreaks and map contamination, isolation and
quarantine areas 5. Mapping of all septic systems, lagoons and wells 6. Mapping of children with elevated lead levels 7. Mapping of mosquito treatment sites 8. Mapping of dead bird calls for West Nile surveillance 9. Mapping of bioterrorism items
Planning and Zoning 1. Zoning changes 2. Land use 3. Variance requests and reviews 4. Notification letters 5. Building permits 6. Addressing 7. Sub-divisions
Sanitarian 1. Source water protection areas 2. Location of sewer lines and storm water/drainage ditches

75APPENDIX B-4
‘County Department Uses for GIS’ (Allen et al., 2006) – Page 4
Sheriff
County Department Uses for GIS Page4
1. Routing for fastest and safest response times. Should be coordinated with Highway Department through GIS network.
2. Mapping special crime areas 3. Mapping drug safety zones around schools 4. Crime analysis 5. Aerial photography for setting up surveillance
Treasurer 1. Delinquent tax sales 2. Knowing the taxing units 3. Sales tax collection and distribution, destination-based allocation 4. Addressing
Register of Deeds 1. Subdivision maps are an important use for GIS. 2. Tracking right of ways 3. Location of pipelines 4. Lot splits and plats 5. Tracking oil and gas leases 6. Archival function, i.e. scanning old maps
Weed Department 1. Coordinate fields and pastures to be sprayed with landowners by using GIS
produced maps 2. Track noxious weeds and their control in the county by mapping weed locations 3. Location where herbicides have been applied
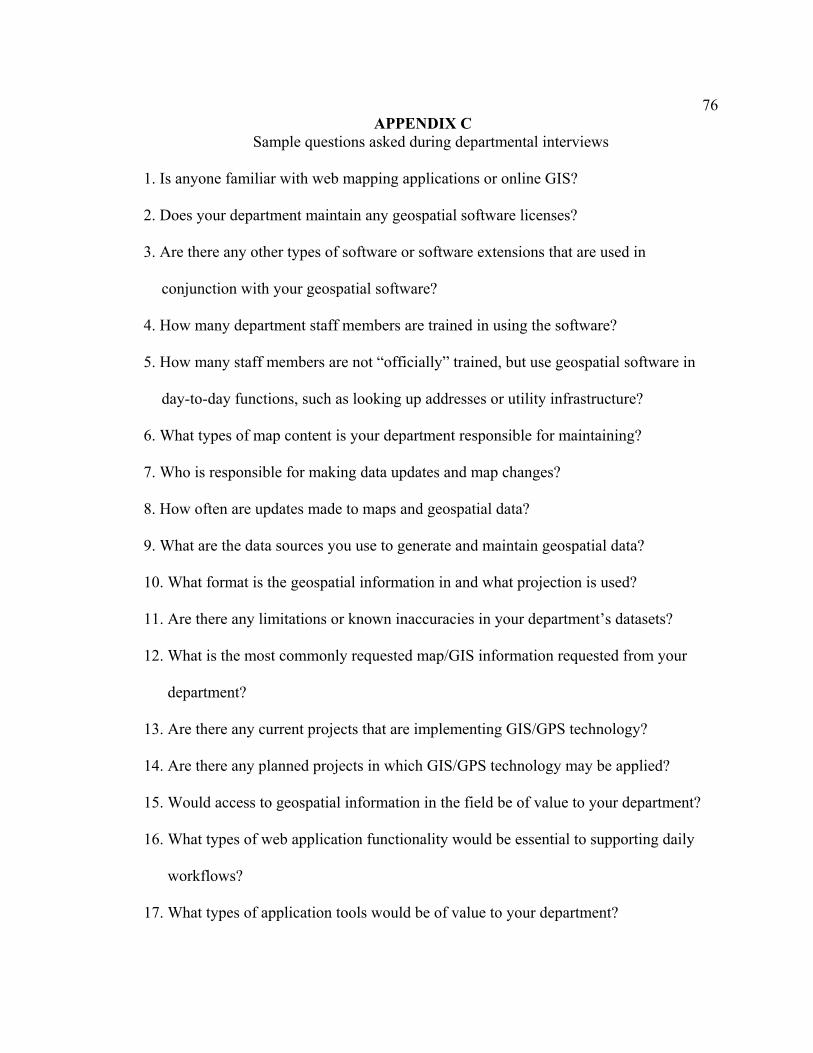
76APPENDIX C
Sample questions asked during departmental interviews
1. Is anyone familiar with web mapping applications or online GIS?
2. Does your department maintain any geospatial software licenses?
3. Are there any other types of software or software extensions that are used in
conjunction with your geospatial software?
4. How many department staff members are trained in using the software?
5. How many staff members are not “officially” trained, but use geospatial software in
day-to-day functions, such as looking up addresses or utility infrastructure?
6. What types of map content is your department responsible for maintaining?
7. Who is responsible for making data updates and map changes?
8. How often are updates made to maps and geospatial data?
9. What are the data sources you use to generate and maintain geospatial data?
10. What format is the geospatial information in and what projection is used?
11. Are there any limitations or known inaccuracies in your department’s datasets?
12. What is the most commonly requested map/GIS information requested from your
department?
13. Are there any current projects that are implementing GIS/GPS technology?
14. Are there any planned projects in which GIS/GPS technology may be applied?
15. Would access to geospatial information in the field be of value to your department?
16. What types of web application functionality would be essential to supporting daily
workflows?
17. What types of application tools would be of value to your department?
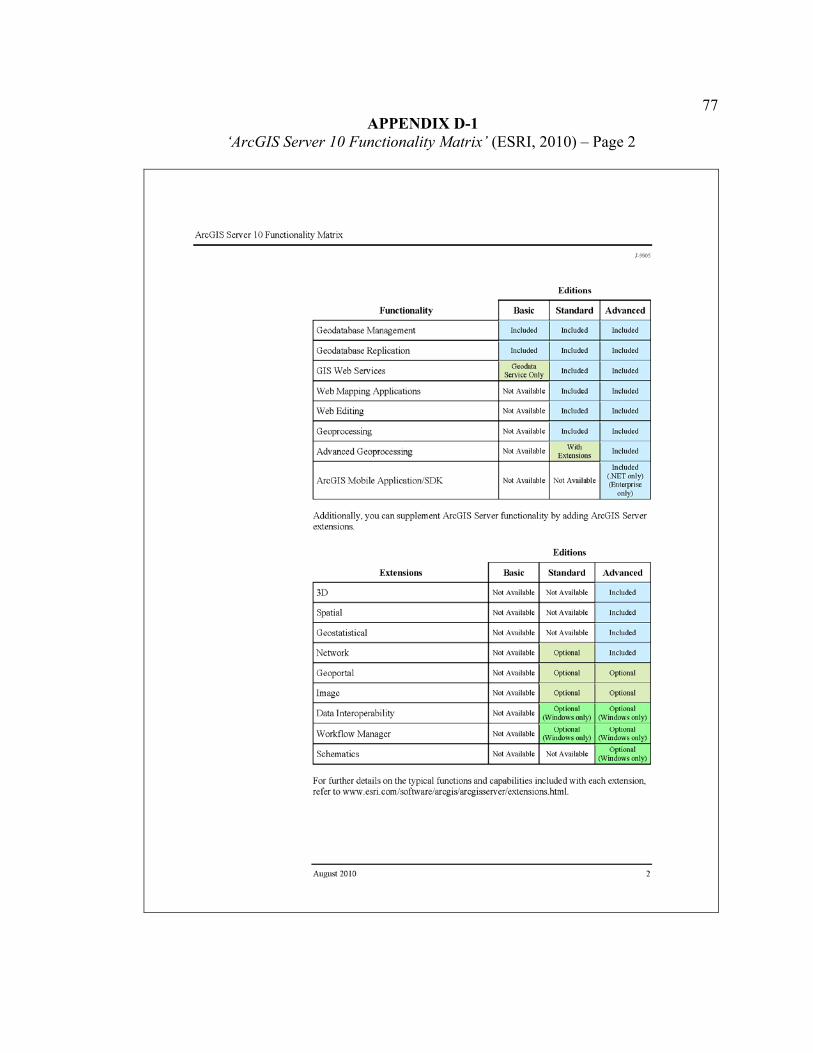
77APPENDIX D-1
‘ArcGIS Server 10 Functionality Matrix’ (ESRI, 2010) – Page 2
ArcGIS Server IO f unct ionality Matr~'<
J.sieos
Edilions
Funcliona lily Basic Sl:mdard Adva nced
Geodatabase Management h1cludcd lncludcd lncluded
Gcodatabase Replication lncluded lncludcd Included
GIS Web Services Gtod•t• Included Included Savi cc Only
Web !lapping Applications Not Ava ilable lncludcd Included
Web Editing Not AwilalJlc lncludcd lncluded
Geoprocessing Not Ava ilable lncludcd Included
Advanced Geoprocessing Not Avs ilable With lncluded Exlcnsions Included
ArcGIS Mobile pplication/SDK Not Avs ihtble ot Awil!j)Je (.NET onl y) (Entcrprise
only)
. dditionally, you can supplement ArcGl S Server functionality by adding ArcGIS Server e>..'1ensions.
Editions
Extensions Basic Stnndnrd Advanced
3D ot Available: Not Available Included
Spatial ot Available NOi A vai I able Included
Geostatistical ot Available Not A vai I able Included
INenvork ot A vailablc Oplional Included
Geoportal ot Available Optional Optiona.l
Image ot A va.ilable Oplional Opliooal
Data Interoperability ot Available Opt ional Optional (Windows only> \Windows only)
WorkOow Manager ot Available Opl ional Opt ional ~ indows on ly) (Windows on ly)
Schematics ot Available Not A vai lablc Optional t\\1i11 dows only)
For further details on the typical functions and capabilities included with each extension, refer to www .csri.com/softwarc/arcgi:Jarcgisscrverlcxtcnsions.htm l.
August 20 10
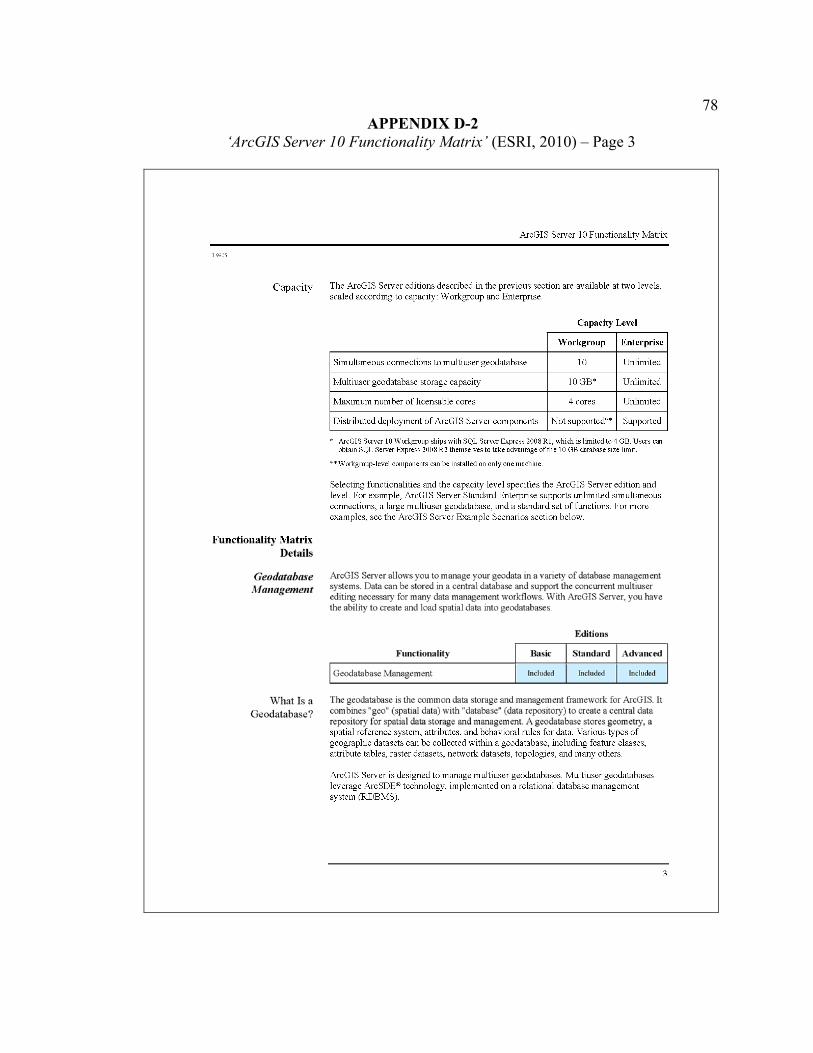
78APPENDIX D-2
‘ArcGIS Server 10 Functionality Matrix’ (ESRI, 2010) – Page 3
J.980'5
Capacity
Functionality Mattix Details
Geodarabase Ma11a 0 eme11t
What Is a Geodatabase?
ArcGIS Server 10 Functionality Matrix
The ArcGIS Server editions described in the previous section are available at two levels, scaled according to capacity: W orkgroup and Enterprise.
Capacity Level
Workgroup Enterprise
Simultaneous connections to multiuser geodatabase 10 Unlimited
Multiuser geodatabase storage capacity I OGB• Unlimited
Maximum number of licensable cores 4 cores Unlimited
Distributed deployment of ArcGIS Server components Not supported•• Supported
ArcGIS Server 10 Workgroup ships with SQL Senrer Express 2008 Rl , whidi is limited to 4 GB. Users can obtain SQL Server Express 2008 R2 themselves to take advantage of lhe 10 GB database size limit.
>1°" Workgroup-level components can be installed on only one machine.
Selecting functionalities and the capacity level specifies the ArcGIS Server edition and level. For example, ArcGIS Server Standard Enterprise supports unlimited simultaneous connections, a large multiuser geodatabase, and a standard set of functions . For more examples, see the ArcGIS Server Example Scenarios section below.
ArcCJS Server allows you to manage your geodata in a variety of database management systems. Data can be stored in a central database and support the concurrent multiuser edit ing necessary for many data management work Oows. W ith ArcGTS Server, you have the abi lity to create and load spatia l data i.nto geodatabases.
Editions
Functionality Jl.;sic Standard Advanced
I Geodal.;base Management lncluded lnch.1ded Included
The geodatabase is the common data storage and managem ent framework for ArcGIS. It combines •geo" (spatial data) with "database" (data repository) to create a central data repository for spatial data storage and management. A geodatabasc stores geometry, a spatial reference system, attributes, and behavioral rules for data. Various types of geographic datasets can be collected within a geodatabase, including feature classes, attribute tables, raster datasets, network datasets, topologies, and many others.
ArcGIS Server is designed to manage multiuser geodatabases. Multiuser geodatabases leverage ArcSDE~ technology, implemented on a relational database management system (RDBMS).

79APPENDIX E
‘County’s GIS site ready for April 5 unveiling’ press release (Weber, 2010) – Page A1
'!8---Camp
arllclas Docuu,;:NI S O
AIJ8cHMJ7 0(AfH CNW OOC IC"'3 ·-,~ ..
weather watcll
TCH!ll• Cuurr ,. __ -lal\t' # I JII -·-" 'Hl'-""'1301; Notti. .. , .... 15 1020 ..,.+• n u ....,.,._ ,._, HDN "'l"r,,
.I.II IJII. ·-.. _ 75e
T UESDAY, M ARCH 23, 2010
Obama signs bill 9VOARL.£HE$UP£Jl'-ILlf --WAS/-llNGTON-Ao.aden1&n.dr.ObiuJ111'0
~hiahtahb((ftploninMay~7,IO tt.lka.,.,._t-;,,.,Dhdplc,,iwrh,-althc:ao..-~~snallbutin_..andfNni~
)ftdonghoallhtaff ..... .ti..uldna,.-li,allrrd ....... .... Th.,Hoi..,L,,1r:s...d.1•wced'? l9-'?IZ of~,;h,r..__,.en110U1dtt-1eand••de"'""ll ... n- U0 Rq,ul,K- .... win fa>Ur ! O ..,nd m11_h.........,..n1brr.-a&,,dodC:O.W,-•i-d tlwbUI.Anrbil>orau-Wl-,~H-•p•m!ltt"'mo<l)' b.:bdolf1Mnutll(l:.,.11inJ1t-,,.-,-.1d>:onrio • .t..pci<,dpublo.c.
H-.,,,!SenatrO.-...t.e,'-:l<,dthr i,;u. ..... 11 ....... ......__l"'Of*"..4-lw..ttha..t •~hawklUdw,dObar,,,.,j<,uwdhirn1od.yfot 1be~rt'•1>012Yin,ht£-, R,,c,m.Aftuwwd,Ol,ama and"Mh<lfllw Mldi,,-M11dfd 1odw ln1otrior-O.-pa,-trr'M'n1br:ui..--i:..rni..tn1,on.
lhel0-yta,;S938billoonbill1ooto.n..1bt m•-,...hd.cheS.nadr...-"inO.-"'''*"~•"'nlualy...;Ji..,....,,d~ra{ll'IOS2 1nlbonuni.-.umtA.nonc-~r..s..-..i bud5'ldt6o1tandt,..,.ou:hi,....,.,.,.. ..,.,. .. P""'Ypn,c!ic"asdou)-in!l.,.....,,.!!",ol""'fR wuhrlCl#lr\g..,.dolprobl,,m,;,
Actllbtp1~·wt,...,O-,,.., ... ,_,.
A_,.-,mo--411t.rH-O.n,oa,,ow,mab- a >en<•ofd,a,,ge,0 1ho-RVWlbilW:U~T.!0-~11.llgotilOdlt Senao,,...t..~d.t..1,tuildhr5"'u•arty•1oday.
Cil)',1-.whtttwapr.-.dtmwilcandid.trhe#I-
Hays High wins three DECA titles 9\'ClNoaGJiil'Ul.08111:Etl --'"'.__ .. J-..!_l..., _.......,,__ i-u,..,"-"',.r....n..,mn,,-ic, ... i..,,, r,.,,...._.. •. ,...._~ ........ .,_
<1,;Jn\....., ..... .., ... ... n~ .. !iir~ 11-., .. ...i.....,.......,. .. ,nort i.. ~).:::--.-llq"'~ .. t~ f~:!:::::::.. .. ,~,\ _..,J"t,,u.n11 .. 1t..,..Hlit,!wt""11 on;.\11..-l. .. ,,tf"','17-lh•IIIUIM>l ...... ----11 ....... 1 ..
O.id ..... tl,,d8 _ __.......... J;w"'I ---·-·~~ .. " ..... 1wllffl111C.-,l'.\owif1J!m-t•~t' -""""9"--~1ri:.-.--.1-•.Fi:¥, .... lll'f-f-dllll!I»" pn,nn .. ... t ="~~~h·~;:.11 ~;:,-~~·-·~ .... - ovaluaitlon oheot "ilt1.a-f'"'b-
;:',.,;:, .. :.,~;- from stale and ~~~".1_::,.-.;:-••JU1-•ilrwP'--..,. • eewherewe loat m.,1111-1ur11_..ldlool pa~~~:ro~:11 :e\e:: \natw:u,,.c.t,bv,. on ltlrom lhere. t1~•1',run,d :=:j:'"1"'~· rm ru11y1oOklng ~..:.,.~::,:~~ ..,_.,. _... W...n, forward lo d ........ o1.1L
Jt•~!;-'.!:.... (na.::),.. ~i'.:!"1t;.I~~""~ =:::...~...::.. ltlpllfd,- ~::::~'3, s,,. ........ T"""-n. ... ,~ .. .._.,1;0,....~,.11~,.r.1
'°'""-'lro,..~10.-...,;,,.....i_,.,_ 1t-hr ... 1np ... -'-Sctann,
""ll,,np,,_.,... • ...,..,. ... • .,,.1:r. :=:::~~~~ ... ci:;::.,• ~,,i:,tw~MtW...it·.,... .... ., ~bo111Ml~hwd~~l$!"l 10!1111'«'flt-M
il.¥1"" ......... n..,1,;1_,..-:!l<'-.,_,.. ,.__,. .... ~""...,.:11-1i-iJ- ... lalo<-~
11--fMPbrilro...i_....,_
... ,i1:s,,.,..,...,..,..tll ....... ,dl;:,, 1-...+,,,,Y:,ll,,,ol.,l.6,..,,l,.J.,1h,11ep 10 .. -at-. •,au
~1twoPOOMUNM-1,""".....,~14' _,.1™1,~t,,ffl,,.,.. ...... "-"-""'"'1-1\f" '"',;;'I~•,;-.• ...................... _..,,!l....,wti,, .. -bt.--Mo...1 -t."1i., .. -1..,. .. ~,.,t._, .,_.J'mrftlrtklolb'tt:~111~>• ...
StcNEAI.TM, AI
County's GIS site ready for April 5 unveiling
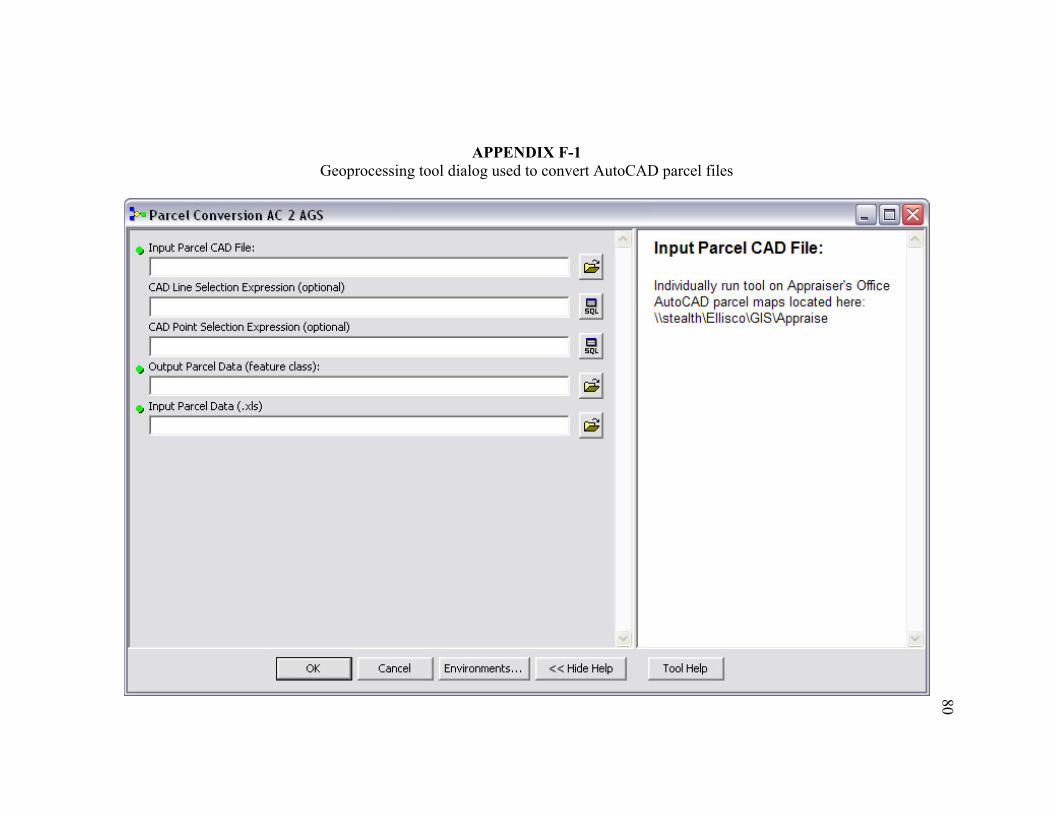
APPENDIX F-1 Geoprocessing tool dialog used to convert AutoCAD parcel files
80
Parcel Conve1·sion AC 2 AGS
<!> Input Parcel CAD File:
I CAD Line Selection Expression (optional)
I CAD Point Selection Expression (optional)
I o Output Parcel Data (feature class):
I <!> Input Parcel Data (.xis)
I
OK Cancel Environments .. , ) <<Hide Help
Input Parcel CAD File:
Individually run tool on Appraise~s Office AutoCAD parcel maps located here: \\stealth\Ellisco\GIS\Appraise
Tool Help
-
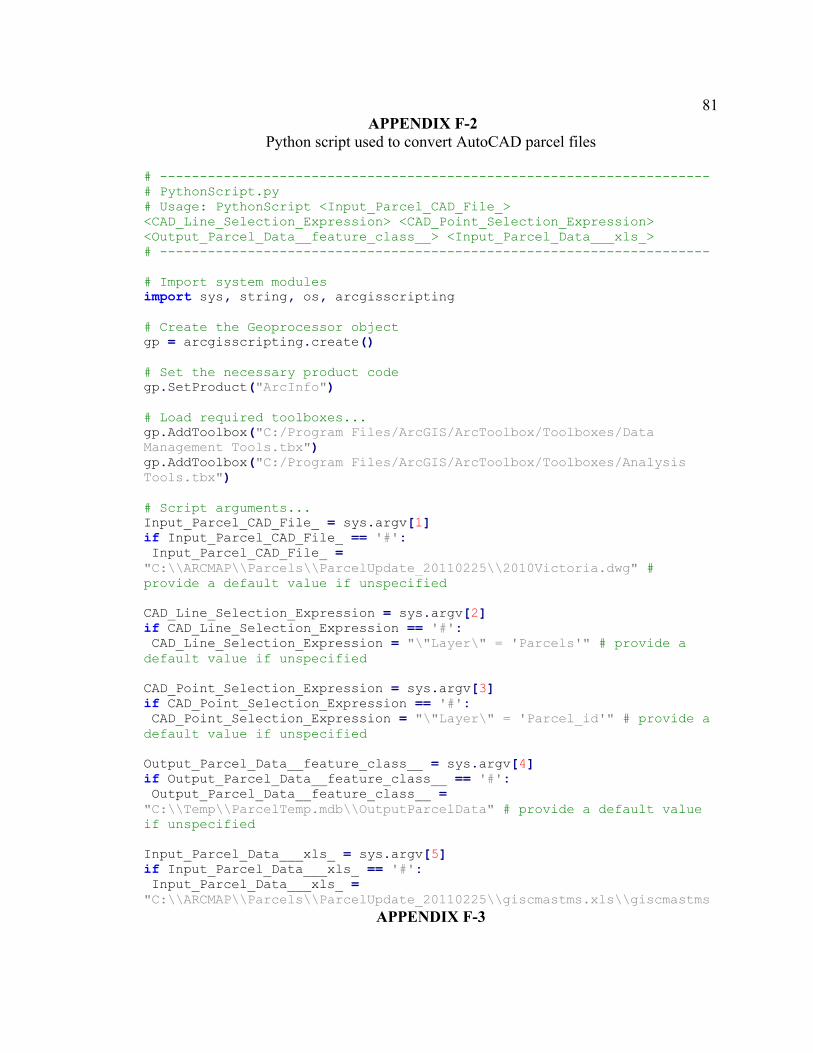
81APPENDIX F-2
Python script used to convert AutoCAD parcel files
# --------------------------------------------------------------------- # PythonScript.py # Usage: PythonScript <Input_Parcel_CAD_File_> <CAD_Line_Selection_Expression> <CAD_Point_Selection_Expression> <Output_Parcel_Data__feature_class__> <Input_Parcel_Data___xls_> # --------------------------------------------------------------------- # Import system modules import sys, string, os, arcgisscripting # Create the Geoprocessor object gp = arcgisscripting.create() # Set the necessary product code gp.SetProduct("ArcInfo") # Load required toolboxes... gp.AddToolbox("C:/Program Files/ArcGIS/ArcToolbox/Toolboxes/Data Management Tools.tbx") gp.AddToolbox("C:/Program Files/ArcGIS/ArcToolbox/Toolboxes/Analysis Tools.tbx") # Script arguments... Input_Parcel_CAD_File_ = sys.argv[1] if Input_Parcel_CAD_File_ == '#': Input_Parcel_CAD_File_ = "C:\\ARCMAP\\Parcels\\ParcelUpdate_20110225\\2010Victoria.dwg" # provide a default value if unspecified CAD_Line_Selection_Expression = sys.argv[2] if CAD_Line_Selection_Expression == '#': CAD_Line_Selection_Expression = "\"Layer\" = 'Parcels'" # provide a default value if unspecified CAD_Point_Selection_Expression = sys.argv[3] if CAD_Point_Selection_Expression == '#': CAD_Point_Selection_Expression = "\"Layer\" = 'Parcel_id'" # provide a default value if unspecified Output_Parcel_Data__feature_class__ = sys.argv[4] if Output_Parcel_Data__feature_class__ == '#': Output_Parcel_Data__feature_class__ = "C:\\Temp\\ParcelTemp.mdb\\OutputParcelData" # provide a default value if unspecified Input_Parcel_Data___xls_ = sys.argv[5] if Input_Parcel_Data___xls_ == '#': Input_Parcel_Data___xls_ = "C:\\ARCMAP\\Parcels\\ParcelUpdate_20110225\\giscmastms.xls\\giscmastms
APPENDIX F-3
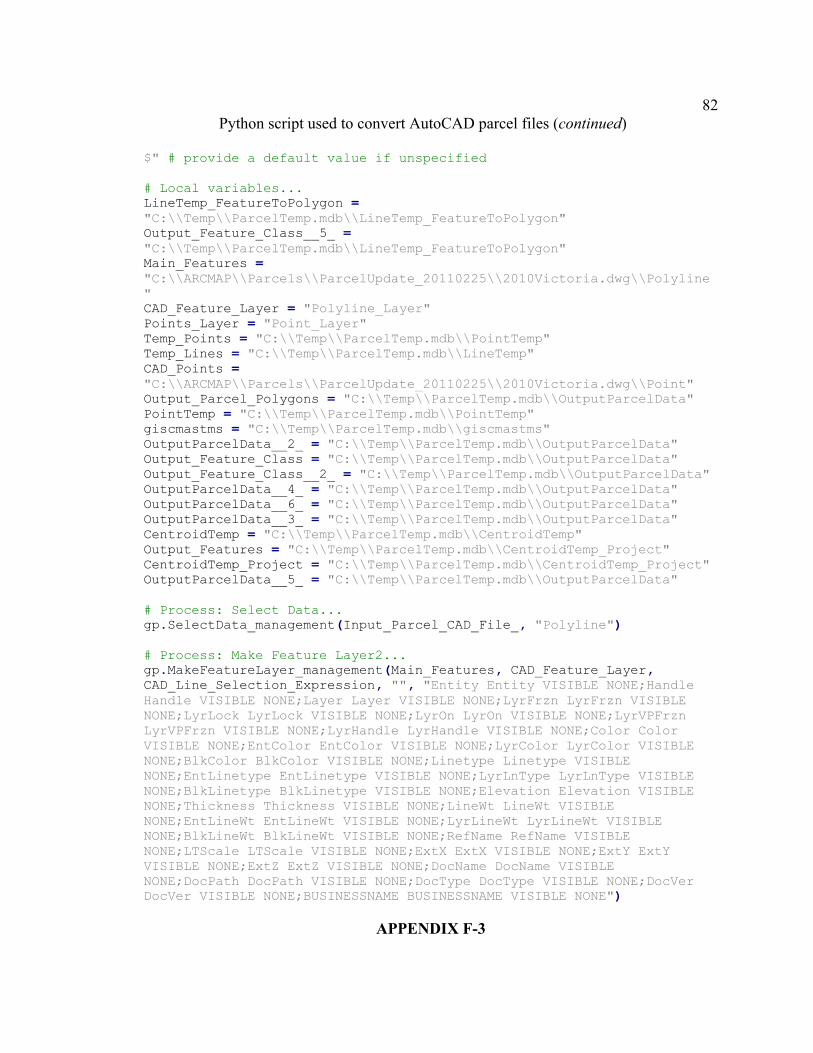
82Python script used to convert AutoCAD parcel files (continued)
$" # provide a default value if unspecified # Local variables... LineTemp_FeatureToPolygon = "C:\\Temp\\ParcelTemp.mdb\\LineTemp_FeatureToPolygon" Output_Feature_Class__5_ = "C:\\Temp\\ParcelTemp.mdb\\LineTemp_FeatureToPolygon" Main_Features = "C:\\ARCMAP\\Parcels\\ParcelUpdate_20110225\\2010Victoria.dwg\\Polyline" CAD_Feature_Layer = "Polyline_Layer" Points_Layer = "Point_Layer" Temp_Points = "C:\\Temp\\ParcelTemp.mdb\\PointTemp" Temp_Lines = "C:\\Temp\\ParcelTemp.mdb\\LineTemp" CAD_Points = "C:\\ARCMAP\\Parcels\\ParcelUpdate_20110225\\2010Victoria.dwg\\Point" Output_Parcel_Polygons = "C:\\Temp\\ParcelTemp.mdb\\OutputParcelData" PointTemp = "C:\\Temp\\ParcelTemp.mdb\\PointTemp" giscmastms = "C:\\Temp\\ParcelTemp.mdb\\giscmastms" OutputParcelData__2_ = "C:\\Temp\\ParcelTemp.mdb\\OutputParcelData" Output_Feature_Class = "C:\\Temp\\ParcelTemp.mdb\\OutputParcelData" Output_Feature_Class__2_ = "C:\\Temp\\ParcelTemp.mdb\\OutputParcelData" OutputParcelData__4_ = "C:\\Temp\\ParcelTemp.mdb\\OutputParcelData" OutputParcelData__6_ = "C:\\Temp\\ParcelTemp.mdb\\OutputParcelData" OutputParcelData__3_ = "C:\\Temp\\ParcelTemp.mdb\\OutputParcelData" CentroidTemp = "C:\\Temp\\ParcelTemp.mdb\\CentroidTemp" Output_Features = "C:\\Temp\\ParcelTemp.mdb\\CentroidTemp_Project" CentroidTemp_Project = "C:\\Temp\\ParcelTemp.mdb\\CentroidTemp_Project" OutputParcelData__5_ = "C:\\Temp\\ParcelTemp.mdb\\OutputParcelData" # ocess: Select Data.. Pr .gp.SelectData_management(Input_Parcel_CAD_File_, "Polyline") # Process: Make Feature Layer2... gp.MakeFeatureLayer_management(Main_Features, CAD_Feature_Layer, CAD_Line_Selection_Expression, "", "Entity Entity VISIBLE NONE;Handle Handle VISIBLE NONE;Layer Layer VISIBLE NONE;LyrFrzn LyrFrzn VISIBLE NONE;LyrLock LyrLock VISIBLE NONE;LyrOn LyrOn VISIBLE NONE;LyrVPFrzn LyrVPFrzn VISIBLE NONE;LyrHandle LyrHandle VISIBLE NONE;Color Color VISIBLE NONE;EntColor EntColor VISIBLE NONE;LyrColor LyrColor VISIBLE NONE;BlkColor BlkColor VISIBLE NONE;Linetype Linetype VISIBLE NONE;EntLinetype EntLinetype VISIBLE NONE;LyrLnType LyrLnType VISIBLE NONE;BlkLinetype BlkLinetype VISIBLE NONE;Elevation Elevation VISIBLE NONE;Thickness Thickness VISIBLE NONE;LineWt LineWt VISIBLE NONE;EntLineWt EntLineWt VISIBLE NONE;LyrLineWt LyrLineWt VISIBLE NONE;BlkLineWt BlkLineWt VISIBLE NONE;RefName RefName VISIBLE NONE;LTScale LTScale VISIBLE NONE;ExtX ExtX VISIBLE NONE;ExtY ExtY VISIBLE NONE;ExtZ ExtZ VISIBLE NONE;DocName DocName VISIBLE NONE;DocPath DocPath VISIBLE NONE;DocType DocType VISIBLE NONE;DocVer DocVer VISIBLE NONE;BUSINESSNAME BUSINESSNAME VISIBLE NONE")
APPENDIX F-3
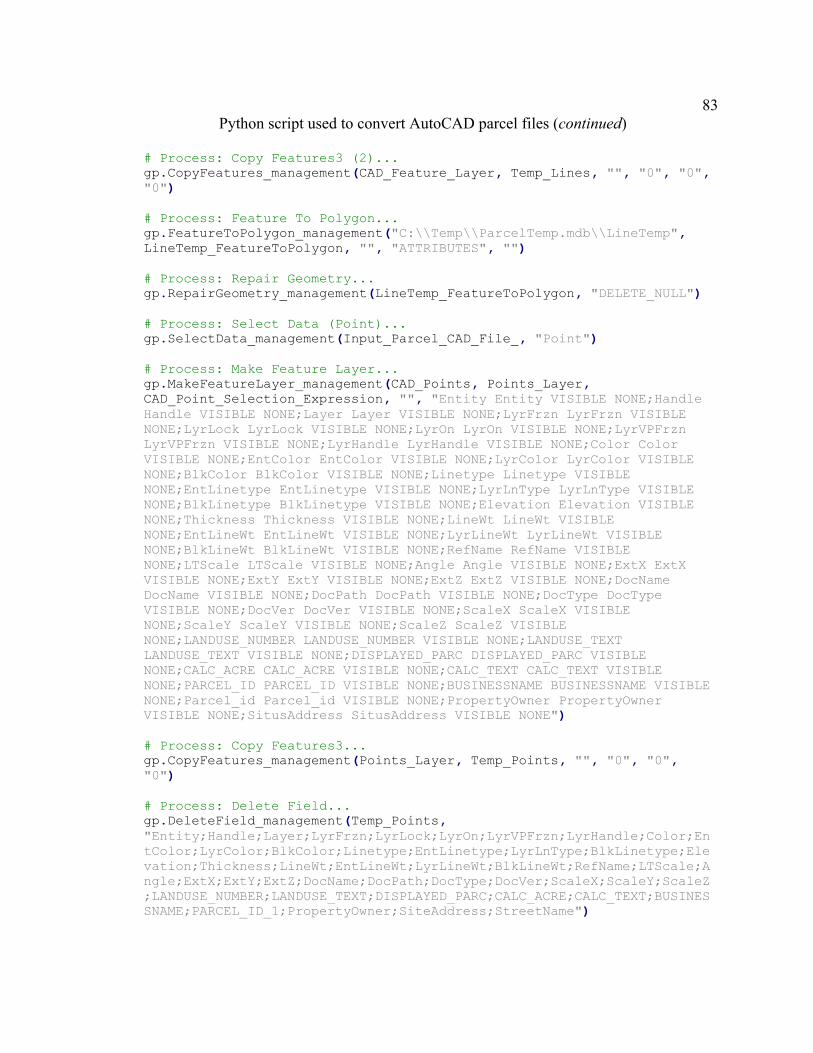
83Python script used to convert AutoCAD parcel files (continued)
# Process: Copy Features3 (2)... gp.CopyFeatures_management(CAD_Feature_Layer, Temp_Lines, "", "0", "0", "0") # Process: Feature To Polygon... gp.FeatureToPolygon_management("C:\\Temp\\ParcelTemp.mdb\\LineTemp", LineTemp_FeatureToPolygon, "", "ATTRIBUTES", "") # Process: Repair Geometry... gp.RepairGeometry_management(LineTemp_FeatureToPolygon, "DELETE_NULL") # Process: Select Data (Point)... gp.SelectData_management(Input_Parcel_CAD_File_, "Point") # Process: Make Feature Layer... gp.MakeFeatureLayer_management(CAD_Points, Points_Layer, CAD_Point_Selection_Expression, "", "Entity Entity VISIBLE NONE;Handle Handle VISIBLE NONE;Layer Layer VISIBLE NONE;LyrFrzn LyrFrzn VISIBLE NONE;LyrLock LyrLock VISIBLE NONE;LyrOn LyrOn VISIBLE NONE;LyrVPFrzn LyrVPFrzn VISIBLE NONE;LyrHandle LyrHandle VISIBLE NONE;Color Color VISIBLE NONE;EntColor EntColor VISIBLE NONE;LyrColor LyrColor VISIBLE NONE;BlkColor BlkColor VISIBLE NONE;Linetype Linetype VISIBLE NONE;EntLinetype EntLinetype VISIBLE NONE;LyrLnType LyrLnType VISIBLE NONE;BlkLinetype BlkLinetype VISIBLE NONE;Elevation Elevation VISIBLE NONE;Thickness Thickness VISIBLE NONE;LineWt LineWt VISIBLE NONE;EntLineWt EntLineWt VISIBLE NONE;LyrLineWt LyrLineWt VISIBLE NONE;BlkLineWt BlkLineWt VISIBLE NONE;RefName RefName VISIBLE NONE;LTScale LTScale VISIBLE NONE;Angle Angle VISIBLE NONE;ExtX ExtX VISIBLE NONE;ExtY ExtY VISIBLE NONE;ExtZ ExtZ VISIBLE NONE;DocName DocName VISIBLE NONE;DocPath DocPath VISIBLE NONE;DocType DocType VISIBLE NONE;DocVer DocVer VISIBLE NONE;ScaleX ScaleX VISIBLE NONE;ScaleY ScaleY VISIBLE NONE;ScaleZ ScaleZ VISIBLE NONE;LANDUSE_NUMBER LANDUSE_NUMBER VISIBLE NONE;LANDUSE_TEXT LANDUSE_TEXT VISIBLE NONE;DISPLAYED_PARC DISPLAYED_PARC VISIBLE NONE;CALC_ACRE CALC_ACRE VISIBLE NONE;CALC_TEXT CALC_TEXT VISIBLE NONE;PARCEL_ID PARCEL_ID VISIBLE NONE;BUSINESSNAME BUSINESSNAME VISIBLE NONE;Parcel_id Parcel_id VISIBLE NONE;PropertyOwner PropertyOwner VISIBLE NONE;SitusAddress SitusAddress VISIBLE NONE") # Process: Copy Features3... gp.CopyFeatures_management(Points_Layer, Temp_Points, "", "0", "0", "0") # ocess: Delete Field.. Pr .gp.DeleteField_management(Temp_Points, "Entity;Handle;Layer;LyrFrzn;LyrLock;LyrOn;LyrVPFrzn;LyrHandle;Color;EntColor;LyrColor;BlkColor;Linetype;EntLinetype;LyrLnType;BlkLinetype;Elevation;Thickness;LineWt;EntLineWt;LyrLineWt;BlkLineWt;RefName;LTScale;Angle;ExtX;ExtY;ExtZ;DocName;DocPath;DocType;DocVer;ScaleX;ScaleY;ScaleZ;LANDUSE_NUMBER;LANDUSE_TEXT;DISPLAYED_PARC;CALC_ACRE;CALC_TEXT;BUSINESSNAME;PARCEL_ID_1;PropertyOwner;SiteAddress;StreetName")
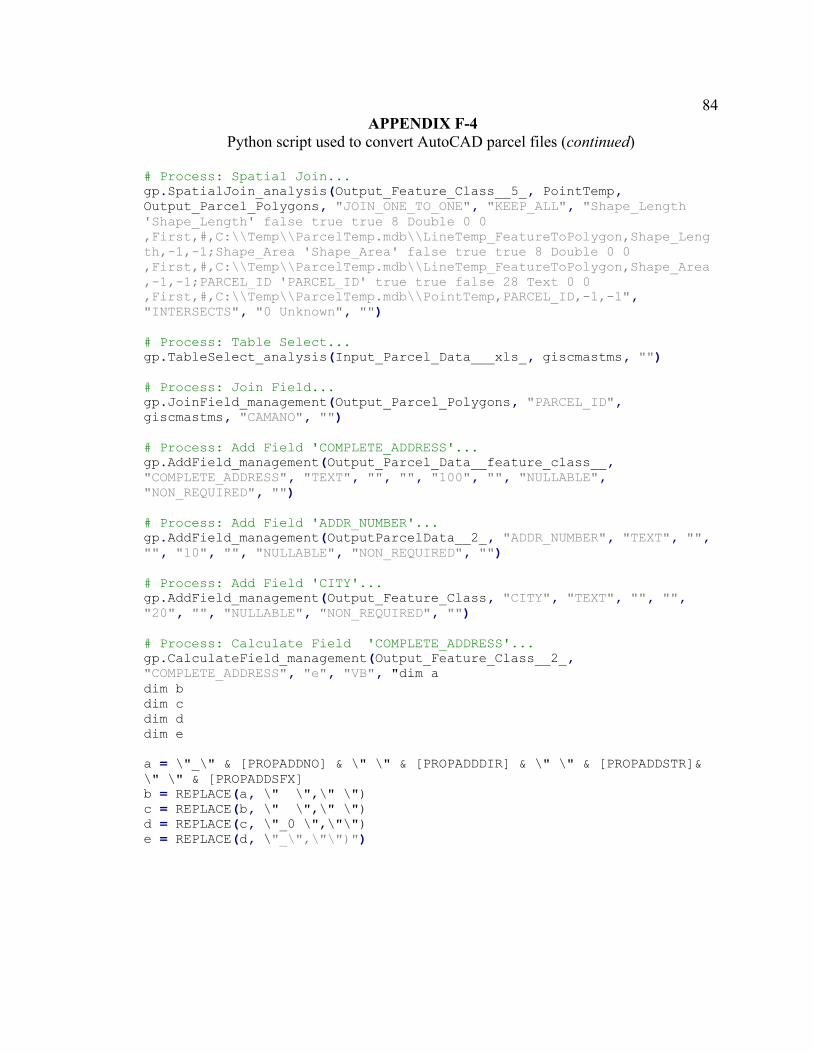
84APPENDIX F-4
Python script used to convert AutoCAD parcel files (continued)
# Process: Spatial Join... gp.SpatialJoin_analysis(Output_Feature_Class__5_, PointTemp, Output_Parcel_Polygons, "JOIN_ONE_TO_ONE", "KEEP_ALL", "Shape_Length 'Shape_Length' false true true 8 Double 0 0 ,First,#,C:\\Temp\\ParcelTemp.mdb\\LineTemp_FeatureToPolygon,Shape_Length,-1,-1;Shape_Area 'Shape_Area' false true true 8 Double 0 0 ,First,#,C:\\Temp\\ParcelTemp.mdb\\LineTemp_FeatureToPolygon,Shape_Area,-1,-1;PARCEL_ID 'PARCEL_ID' true true false 28 Text 0 0 ,First,#,C:\\Temp\\ParcelTemp.mdb\\PointTemp,PARCEL_ID,-1,-1", "INTERSECTS", "0 Unknown", "") # Process: Table Select... gp.TableSelect_analysis(Input_Parcel_Data___xls_, giscmastms, "") # Process: Join Field... gp.JoinField_management(Output_Parcel_Polygons, "PARCEL_ID", giscmastms, "CAMANO", "") # Process: Add Field 'COMPLETE_ADDRESS'... gp.AddField_management(Output_Parcel_Data__feature_class__, "COMPLETE_ADDRESS", "TEXT", "", "", "100", "", "NULLABLE", "NON_REQUIRED", "") # Process: Add Field 'ADDR_NUMBER'... gp.AddField_management(OutputParcelData__2_, "ADDR_NUMBER", "TEXT", "", "", "10", "", "NULLABLE", "NON_REQUIRED", "") # Process: Add Field 'CITY'... gp.AddField_management(Output_Feature_Class, "CITY", "TEXT", "", "", "20", "", "NULLABLE", "NON_REQUIRED", "") # Process: Calculate Field 'COMPLETE_ADDRESS'... gp.CalculateField_management(Output_Feature_Class__2_, "COMPLETE_ADDRESS", "e", "VB", "dim a dim b dim c dim d dim e a = \"_\" & [PROPADDNO] & \" \" & [PROPADDDIR] & \" \" & [PROPADDSTR]& \" \" & [PROPADDSFX] b = REPLACE(a, \" \",\" \") c = REPLACE(b, \" \",\" \") d = REPLACE(c, \"_0 \",\"\") e = REPLACE(d, \"_\",\"\")")
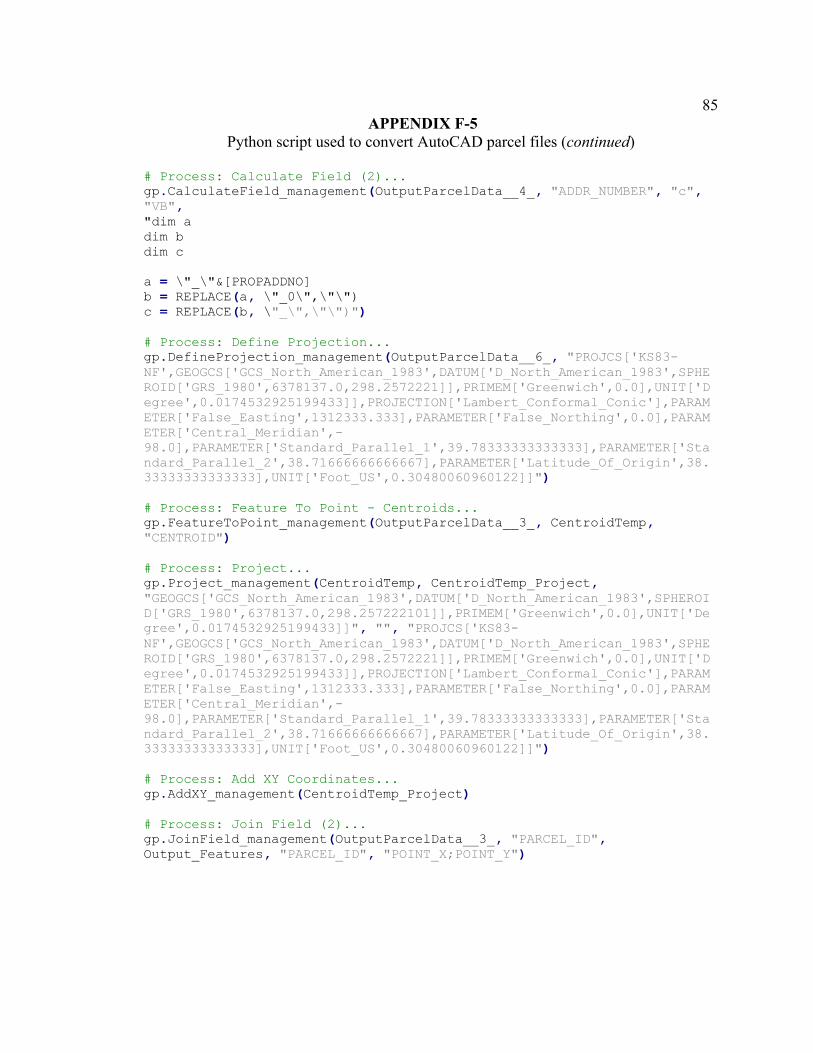
85APPENDIX F-5
Python script used to convert AutoCAD parcel files (continued)
# Process: Calculate Field (2)... gp.CalculateField_management(OutputParcelData__4_, "ADDR_NUMBER", "c", "VB", "dim a dim b dim c a = \"_\"&[PROPADDNO] b = REPLACE(a, \"_0\",\"\") c = REPLACE(b, \"_\",\"\")") # Process: Define Projection... gp.DefineProjection_management(OutputParcelData__6_, "PROJCS['KS83-NF',GEOGCS['GCS_North_American_1983',DATUM['D_North_American_1983',SPHEROID['GRS_1980',6378137.0,298.2572221]],PRIMEM['Greenwich',0.0],UNIT['Degree',0.0174532925199433]],PROJECTION['Lambert_Conformal_Conic'],PARAMETER['False_Easting',1312333.333],PARAMETER['False_Northing',0.0],PARAMETER['Central_Meridian',-98.0],PARAMETER['Standard_Parallel_1',39.78333333333333],PARAMETER['Standard_Parallel_2',38.71666666666667],PARAMETER['Latitude_Of_Origin',38.33333333333333],UNIT['Foot_US',0.30480060960122]]") # Process: Feature To Point - Centroids... gp.FeatureToPoint_management(OutputParcelData__3_, CentroidTemp, "CENTROID") # Process: Project... gp.Project_management(CentroidTemp, CentroidTemp_Project, "GEOGCS['GCS_North_American_1983',DATUM['D_North_American_1983',SPHEROID['GRS_1980',6378137.0,298.257222101]],PRIMEM['Greenwich',0.0],UNIT['Degree',0.0174532925199433]]", "", "PROJCS['KS83-NF',GEOGCS['GCS_North_American_1983',DATUM['D_North_American_1983',SPHEROID['GRS_1980',6378137.0,298.2572221]],PRIMEM['Greenwich',0.0],UNIT['Degree',0.0174532925199433]],PROJECTION['Lambert_Conformal_Conic'],PARAMETER['False_Easting',1312333.333],PARAMETER['False_Northing',0.0],PARAMETER['Central_Meridian',-98.0],PARAMETER['Standard_Parallel_1',39.78333333333333],PARAMETER['Standard_Parallel_2',38.71666666666667],PARAMETER['Latitude_Of_Origin',38.33333333333333],UNIT['Foot_US',0.30480060960122]]") # Process: Add XY Coordinates... gp.AddXY_management(CentroidTemp_Project) # Process: Join Field (2)... gp.JoinField_management(OutputParcelData__3_, "PARCEL_ID", Output_Features, "PARCEL_ID", "POINT_X;POINT_Y")

86APPENDIX G
Glossary
ArcCatalog – an application that provides a catalog window used to organize and manage
various types of geographic information for ArcGIS software. ArcCatalog is used
to organize GIS contents, manage geodatabase schemas and manage GIS servers
(ESRI, 2010 - http://help.arcgis.com/en/arcgisdesktop/10.0/help/index.html#/
What_is_ArcCatalog).
ArcGIS Server – server geographic information system software developed by ESRI. is
Used for creating and managing GIS Web services, applications, and data
(Wikipedia, 2010 - http://en.wikipedia.org/wiki/ArcGIS_Server).
ArcGIS Server Manager – a Web application that supports publishing services,
administering the GIS server, creating Web applications, and publishing ArcGIS
Explorer maps on a server (ESRI, 2010 - http://webhelp.esri.com/arcgisserver/
9.3.1/dotNet/index.htm#components_of_server.htm).
Data Layer – the visual representation of a geographic dataset in any digital map
environment (ESRI, 2010 - http://resources.arcgis.com/glossary/term/605).
Database Schema – the tables, the fields in each table, the relationships between fields
and tables, and the grouping of objects within the database (ESRI, 2010 - http://
resources.arcgis.com/glossary/term/841).
De-Militarized Zone (DMZ) – a network that exists between two other networks
separated by firewalls. Typically the other two networks do not trust each other
(Microsoft, 2010 - http://support.microsoft.com/kb/191146).
Feature Class – a collection of geographic features with the same geometry type (such as
87point, line, or polygon), the same attributes, and the same spatial reference
stored in a geodatabase (ESRI, 2010 -
http://resources.arcgis.com/glossary/term/480).
Feature Dataset – a collection of feature classes stored together that share the same spatial
reference (ESRI, 2010 - http://resources.arcgis.com/glossary/term/482).
Firewall – a device that allows users network access and prevents unauthorized network
traffic based on a set of filtering rules known as permissions.
Geodatabase – database or file structure used primarily to store, query, and manipulate
spatial data. Geodatabases store geometry, a spatial reference system, attributes,
and behavioral rules for data (ESRI, 2010 - http://resources.arcgis.com/ glossary/
term/512).
Geoprocessing Tool – a tool that can create or modify spatial data, including analysis
functions (overlay, buffer, slope), data management functions (add field, copy,
rename), or data conversion functions (ESRI, 2010 - http://resources.arcgis.com/
glossary/term/1482).
GIS Web Server – hardware placed in de-militarized zone used for hosting replicated
geospatial information services and web mapping applications made available
through the Internet.
GIS Data Server – hardware used to aggregate geospatial information from network
source files and support internal network web mapping applications.
Google Analytics – a free service offered by Google that generates detailed statistics
about the visitors to a website (Wikipedia, 2010 - http://en.wikipedia.org/wiki/
88Google_Analytics).
Hyperlink – hyperlink (or link) is a word, group of words, or image that you can click on
to jump to a new web page, new document or a new section within the current
document (W3Schools, 2010 - http://www.w3schools.com/site/site_glossary.asp).
Hypertext Markup Language (HTML) – the most prominently used scripting language in
developing web pages (Wikipedia, 2010 - http://en.wikipedia.org/wiki/HTML).
Internet GIS – a network-based geographic information service that utilizes both wired
and wireless Internet access to deliver geographic information, analytical tools
and GIS services (Peng et al., 2003).
Internet Information Services (IIS) – a web server application for Windows operating
systems. Developed by Microsoft. (W3Schools, 2010 - http://
www.w3schools.com/site/site_glossary.asp).
JavaScript – a scripting language that runs within a Web browser and interacts with
HTML code to enable Web developers to add functionality to their Web sites
(ESRI, 2010 - http://resources.arcgis.com/glossary/term/1642).
Local Area Network (LAN) – a computer network that connects computers and devices
in a limited geographical area such as home, school, computer laboratory or office
building (Wikipedia, 2010 - http://en.wikipedia.org/wiki/Local_area_network).
Map Cache – a set of pre-rendered image tiles drawn from a map layer at different scales.
Allows for faster layer rendering as data layers do not have to be redrawn on each
request.
Mashup – web application that combines data from two or more preexisting sources to
89create a new derivative product.
Microsoft SyncToy – a free application that synchronizes files and folders between
locations (Microsoft, 2010 - http://www.microsoft.com/downloads/en/
details.aspx).
Modelbuilder – the interface used to build and edit geoprocessing models in ArcGIS
(ESRI, 2010 - http://resources.arcgis.com/glossary/term/1265).
.NET Web Application Developer Framework (.NET ADF) – enables you to
integrate GIS data and capabilities into your Web applications. The ADF
includes a set of Web controls, classes, frameworks and APIs that may be used to
build Web mapping applications (ESRI, 2010 - http://edndoc.esri.com/arcobjects/
9.2/NET_Server_Doc/developer/ADF/adf_overview.htm).
Port 80 – the port that a web server listens to or expects to receive traffic from a Web
client. Port 80 is the standard port used by web servers and http (Webservio, 2010
- www.webservio.net/ hosting/glossary.html).
Replication – a means of copying and distributing data from one database to local,
remote, or mobile users and then synchronizing between these databases for
consistency (ESRI, 2010 - http://resources.arcgis.com/glossary/term/2867).
SmarterStats – a website statistics and search engine optimization software that provides
detailed web analytics for website visitor traffic and helps improve search engine
ranking (SmarterTools, 2010 - www.smartertools.com/smarterstats/web-analytics-
seo-software.aspx).
Topological Editing – editing that takes into account the spatial relationships between
90connecting or adjacent features in a geographic data layer (for example, arcs,
nodes, polygons, and points) (ESRI, 2010 - http://resources.arcgis.com/glossary/
term/658).
Web GIS – see ‘Internet GIS’
Web Mapping Application – a Web based, interactive map that allows you to display and
query the layers on the map. (ESRI, 2010 - http://resources.arcgis.com/glossary/
term/2999).
Web Service – a software component accessible over the World Wide Web for use in
other applications. Web services are built using industry standards and are not
dependent on any particular operating system or programming language, allowing
access to them through a wide range of applications (ESRI, 2010 -
http://resources.arcgis.com/glossary/term/1332).