Embed Size (px)
Citation preview
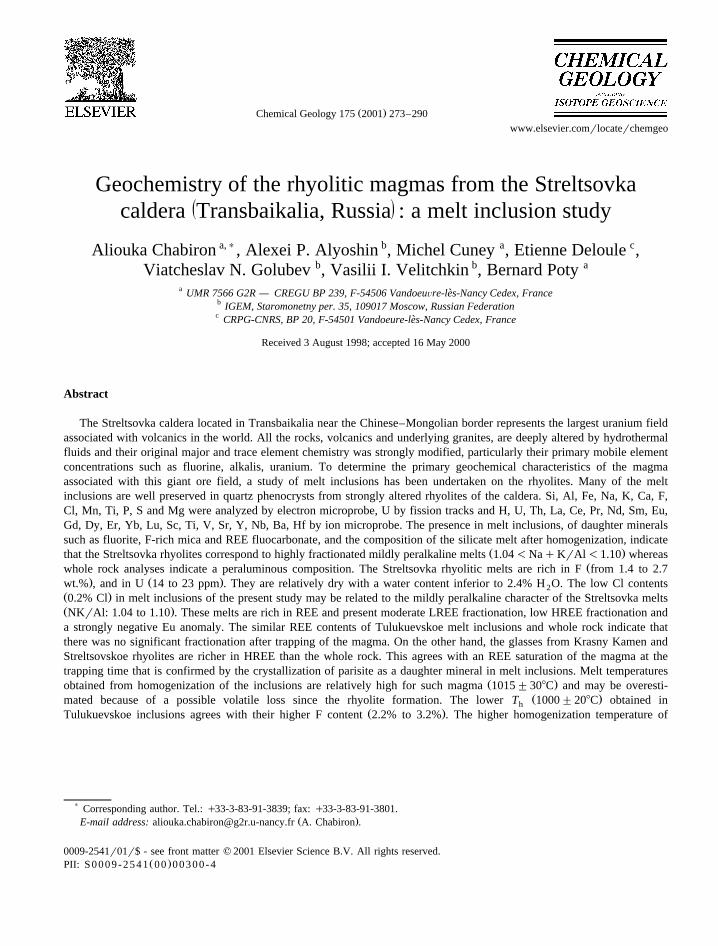
Ž .Chemical Geology 175 2001 273–290www.elsevier.comrlocaterchemgeo
Geochemistry of the rhyolitic magmas from the Streltsovkaž /caldera Transbaikalia, Russia : a melt inclusion study
Aliouka Chabiron a,), Alexei P. Alyoshin b, Michel Cuney a, Etienne Deloule c,Viatcheslav N. Golubev b, Vasilii I. Velitchkin b, Bernard Poty a
a UMR 7566 G2R — CREGU BP 239, F-54506 VandoeuÕre-les-Nancy Cedex, France`b IGEM, Staromonetny per. 35, 109017 Moscow, Russian Federationc CRPG-CNRS, BP 20, F-54501 Vandoeure-les-Nancy Cedex, France`
Received 3 August 1998; accepted 16 May 2000
Abstract
The Streltsovka caldera located in Transbaikalia near the Chinese–Mongolian border represents the largest uranium fieldassociated with volcanics in the world. All the rocks, volcanics and underlying granites, are deeply altered by hydrothermalfluids and their original major and trace element chemistry was strongly modified, particularly their primary mobile elementconcentrations such as fluorine, alkalis, uranium. To determine the primary geochemical characteristics of the magmaassociated with this giant ore field, a study of melt inclusions has been undertaken on the rhyolites. Many of the meltinclusions are well preserved in quartz phenocrysts from strongly altered rhyolites of the caldera. Si, Al, Fe, Na, K, Ca, F,Cl, Mn, Ti, P, S and Mg were analyzed by electron microprobe, U by fission tracks and H, U, Th, La, Ce, Pr, Nd, Sm, Eu,Gd, Dy, Er, Yb, Lu, Sc, Ti, V, Sr, Y, Nb, Ba, Hf by ion microprobe. The presence in melt inclusions, of daughter mineralssuch as fluorite, F-rich mica and REE fluocarbonate, and the composition of the silicate melt after homogenization, indicate
Ž .that the Streltsovka rhyolites correspond to highly fractionated mildly peralkaline melts 1.04-NaqKrAl-1.10 whereasŽwhole rock analyses indicate a peraluminous composition. The Streltsovka rhyolitic melts are rich in F from 1.4 to 2.7
. Ž .wt.% , and in U 14 to 23 ppm . They are relatively dry with a water content inferior to 2.4% H O. The low Cl contents2Ž .0.2% Cl in melt inclusions of the present study may be related to the mildly peralkaline character of the Streltsovka meltsŽ .NKrAl: 1.04 to 1.10 . These melts are rich in REE and present moderate LREE fractionation, low HREE fractionation anda strongly negative Eu anomaly. The similar REE contents of Tulukuevskoe melt inclusions and whole rock indicate thatthere was no significant fractionation after trapping of the magma. On the other hand, the glasses from Krasny Kamen andStreltsovskoe rhyolites are richer in HREE than the whole rock. This agrees with an REE saturation of the magma at thetrapping time that is confirmed by the crystallization of parisite as a daughter mineral in melt inclusions. Melt temperatures
Ž .obtained from homogenization of the inclusions are relatively high for such magma 1015"308C and may be overesti-Ž .mated because of a possible volatile loss since the rhyolite formation. The lower T 1000"208C obtained inh
Ž .Tulukuevskoe inclusions agrees with their higher F content 2.2% to 3.2% . The higher homogenization temperature of
) Corresponding author. Tel.: q33-3-83-91-3839; fax: q33-3-83-91-3801.Ž .E-mail address: [email protected] A. Chabiron .
0009-2541r01r$ - see front matter q 2001 Elsevier Science B.V. All rights reserved.Ž .PII: S0009-2541 00 00300-4
( )A. Chabiron et al.rChemical Geology 175 2001 273–290274
Ž .Krasny Kamen inclusions also agrees with the lower F content 0.6% to 0.8% . q 2001 Elsevier Science B.V. All rightsreserved.
Keywords: U deposits; Russia; Rhyolites; Melt inclusions; Fission tracks; Ion microprobe
1. Introduction
In the Streltsovka caldera, all the volcanics andunderlying granites are deeply altered by hydrother-
Ž .mal fluids Andreeva et al., 1990,1996 . Despite theexistence of numerous bore-holes drilled down to2700 m, fresh volcanic or plutonic material is excep-tional. The original chemistry of the rocks wasstrongly modified, especially their primary uraniumconcentrations and mobile constituents such as H O,2
F, Cl, CO and alkalis. The analyses of the altered2
volcanics give wrong information on the originalchemistry of the source magma. Only weakly mobileelements such as Ti, Nb, Th, REE, or silicate meltstrapped as magmatic inclusions in quartz phenocrystsmay provide reliable information about the originalchemistry of the magma. With the development ofthe microanalytical tools, melt inclusions may pro-vide invaluable information about the pristine chemi-cal and physical characteristics of the magmas. It isnow possible to determine their volatile content,trace element concentrations with a precision down
Žto a few parts per million Anderson et al., 1989;Hervig et al., 1989; Skirius et al., 1990; Webster and
.Duffield, 1991, 1994 . The study of the water con-tent in glass has an exceptional progress with in-
Žfrared spectroscopy Stolper, 1982; Newman et al.,1986; Silver and Stolper, 1989; Silver et al., 1990;
.Zhang et al., 1997 but a limited number of studieson melt inclusions is presently available in the litera-
Ž .ture Anderson et al., 1989 because large inclusionsize and specific preparation are necessary. Somestudies have determined water content with sec-
Ž .ondary ion mass spectrometry SIMS by measuringq ŽH Kovalenko et al., 1988, Webster and Duffield,
.1991,1994; Webster et al., 1997 .In the present study, we have determined major
elements by electron microprobe and trace element,Rare earth and H O contents by ion microprobe and2
U content by fission tracks. Rhyolites from theStreltsovka caldera were investigated from severallava sheets and extrusive bodies at the TulukuevskoeŽ . Ž .seven samples and Krasny Kamen four samples
Ž .open pits and Streltsovskoe mine one sample . Theobjective of this paper is to examine and characterizethe original chemistry of the rhyolite associated withthe uranium ore field from the Streltsovka caldera.
2. Geologic setting of the Streltsovka caldera
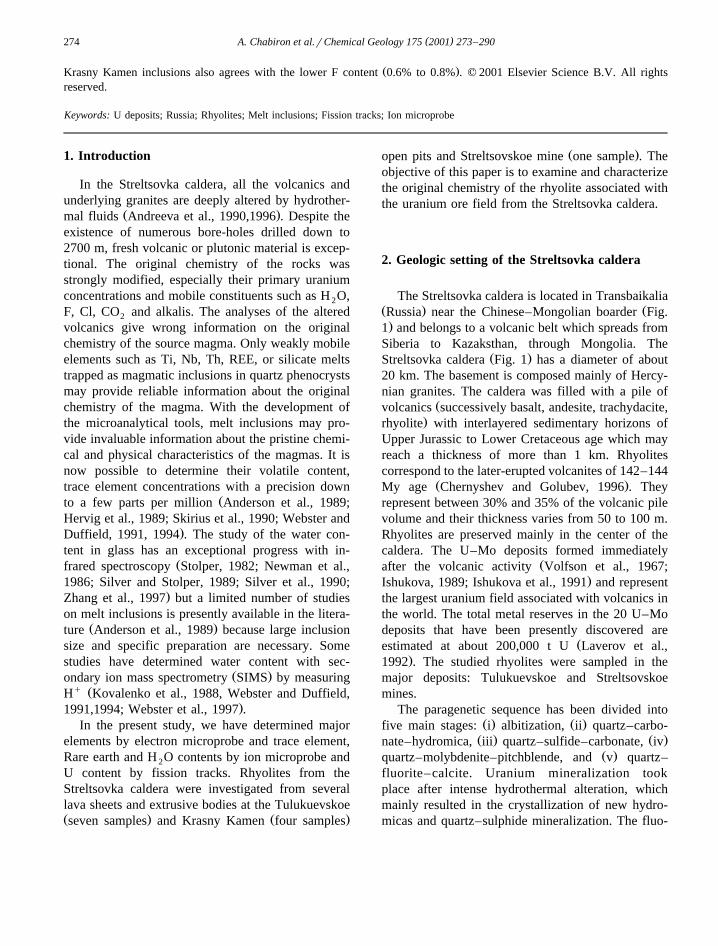
The Streltsovka caldera is located in TransbaikaliaŽ . ŽRussia near the Chinese–Mongolian boarder Fig..1 and belongs to a volcanic belt which spreads from
Siberia to Kazaksthan, through Mongolia. TheŽ .Streltsovka caldera Fig. 1 has a diameter of about
20 km. The basement is composed mainly of Hercy-nian granites. The caldera was filled with a pile of
Žvolcanics successively basalt, andesite, trachydacite,.rhyolite with interlayered sedimentary horizons of
Upper Jurassic to Lower Cretaceous age which mayreach a thickness of more than 1 km. Rhyolitescorrespond to the later-erupted volcanites of 142–144
Ž .My age Chernyshev and Golubev, 1996 . Theyrepresent between 30% and 35% of the volcanic pilevolume and their thickness varies from 50 to 100 m.Rhyolites are preserved mainly in the center of thecaldera. The U–Mo deposits formed immediately
Žafter the volcanic activity Volfson et al., 1967;.Ishukova, 1989; Ishukova et al., 1991 and represent
the largest uranium field associated with volcanics inthe world. The total metal reserves in the 20 U–Modeposits that have been presently discovered are
Žestimated at about 200,000 t U Laverov et al.,.1992 . The studied rhyolites were sampled in the
major deposits: Tulukuevskoe and Streltsovskoemines.
The paragenetic sequence has been divided intoŽ . Ž .five main stages: i albitization, ii quartz–carbo-Ž . Ž .nate–hydromica, iii quartz–sulfide–carbonate, iv
Ž .quartz–molybdenite–pitchblende, and v quartz–fluorite–calcite. Uranium mineralization tookplace after intense hydrothermal alteration, whichmainly resulted in the crystallization of new hydro-micas and quartz–sulphide mineralization. The fluo-
( )A. Chabiron et al.rChemical Geology 175 2001 273–290 275
Ž .Fig. 1. Geographic map and location of Krasnokamensk uranium city of the Streltsovka district and geological map of the StreltsovkaŽ .caldera adapted from unpublished IGEM internal report .
( )A. Chabiron et al.rChemical Geology 175 2001 273–290276
rite stage is characterized by argilization, quartz–fluorite, quartz–coffinite and quartz–zeolite–calcite
Ž .paragenesis Laverov et al., 1992 . The main ura-nium deposition occurred during the quartz–molybdenite–pitchblende stage. The most commonuranium mineral is pitchblende, which has a U–Pb
Žisotopic age of about 133"4 My Chernyshev and.Golubev, 1996 .
The present study is focused on the determinationof the initial rhyolite chemistry which representsbetween 30% and 35% of the volcanic pile volumeand hosts a large part of the uranium mineralization.
3. Sample preparation and analytical methods
3.1. Sample preparation
Volcanic rock samples were crushed: one partwas reduced to powder to be analyzed by ICP-ESand -MS and the other part was used to separate thequartz phenocrysts. Selected phenocrysts containing
Žmelt inclusions were mounted in epoxy resin before.or after heating and polished until the selected melt
inclusion was brought to the surface of the polishedchip in order to be able to analyze glass and daughterminerals. For fission track study, resin chips withmelt inclusions brought to the surface were covered
Ž . Žwith an external detector kapton Kleeman and.Lovering, 1967 . For heating-stage experiments, resin
chips were polished on both sides and quartz phe-Ž .nocrysts thick sections 200–600 mm thickness con-
taining the melt inclusions were extracted from theresin. Special care was taken to avoid inclusionscrosscutted by microfissures, fluid inclusion planesor presenting evidence of recrystallization for analy-ses and microthermometric experiments.
Homogenization of the inclusions was observedwith a Leitz Stage 1350 which may reach 13508C.The stage equipped with a Pt thermocouple wascalibrated using the following melting points of puresubstances: 1808C for Merck no. 9780; 3988C forpotassium dichromate; 5928C for barium nitrate;8018C for sodium chloride, and 10638C for gold.Reproducibility of the standard melting temperatureswas better than "108C. The inclusions were initiallyheated to 3008C over a few minutes, then after eachadditional 508C step, the temperature was maintained
during 30 min according to the procedure of Cloc-Ž .chiatti 1975 up to secondary gas bubble disappear-
ance. Then, additional 108C step of 30 min eachwere applied up to complete homogenization. Thehomogenization temperature T may be higher thanh
the real temperature of trapping, possibly by up toŽ .1008C Roedder, 1979 . Different parameters con-
tribute to this overestimation: highly viscous meltŽ .and loss of hydrogen Sobolev and Kostyuk, 1975 ,
and water from the inclusion. The largest inclusionsŽand the ones with complex shapes large
.surfacervolume ratios were not heated in order tominimize these problems. Further, to better deter-mine the homogenization temperature, tests weremade using 108C steps of 1 h from a temperature of1508C lower than homogenization temperature deter-mined during the first run using Clocchiatti’s proce-dure. During the second run, the homogenizationtemperature T may decrease of more than 508C.h
Therefore, all the temperatures determined from asingle run have been corrected of 508C.
3.2. Analytical methods
3.2.1. Electron microprobe analysisThe glass inclusions and their daughter minerals
were analyzed for Si, Al, Fe, Na, K, Ca, F, Cl, Mn,ŽTi, P, S and Mg by electron microprobe Cameca SX
.50 . An accelerating voltage of 15 kV, a low beamcurrent of 10 nA, a large beam diameter of 5–7 mmand a counting time of 6 s were chosen to avoidvolatilization of the alkalis from the melt inclusions.Series of analyses with increasing counting timewere made at the same point of glass to extrapolatealkalis content to 0-s counting time. The best analyti-cal conditions were obtained for a counting time of 6s for which the analytical uncertainty is less than 5%.For all other elements, a counting time of 10 or 20 swas used according to the concentration of the ana-lyzed element. One to four spots were analyzed onglass of each inclusion. To avoid an overlap with thehost quartz during analysis, measurements were madenear the center of the melt inclusions.
3.2.2. Fission track analysisThe U content of 26 melt inclusions was deter-
mined by fission track analyses. A Standard glassŽ .SRM 613 from the National Bureau of Standards
( )A. Chabiron et al.rChemical Geology 175 2001 273–290 277
Ž .NBS containing 37.38 ppm U was used for calibra-tion. The quartz grains mounted in epoxy resin andthe standards were irradiated in the Orphee nuclear´
Ž .reactor of Saclay France during 5 min with aneutron flux of 1.3=1013 n cmy2 sy1. Latent trackswere revealed through immersion in boiling bleachfor 8 min. The uranium content of each inclusion hasbeen calculated using the following equation:
C sC D P rD PŽ .u us i is is i
with C as the uranium content of the sample, C asu us
the uranium content of the standard, D as thei
induced fission track density per cubic centimeter ofthe sample, D as the induced fission track densityis
per cubic centimeter of the standard, and P rP asis i
the average length of fission fragments in the stan-dard and in the sample. For acid volcanic glasses, theratio is close to 1.
3.2.3. Ion microprobe analysisGlass inclusions were also analyzed for H, U, Th,
La, Ce, Pr, Nd, Sm, Eu, Gd, Dy, Er, Yb, Lu, Sc, Ti,V, Sr, Y, Nb, Ba, Hf using a Cameca IMS 3f ion
Ž .microprobe CRPG, Nancy, France . Analytical pro-Ž .cedure for trace elements Ti, V, Sr, Y, Nb, Ba, Hf
Ž .and REE follows Fahey et al. 1987 and HintonŽ . y1990 recommendations. A 10 kV O primary beamof 10 nA intensity was focussed to a spot of 10 mmin diameter. Secondary ions were accelerated to 4500eV and analyzed at a mass resolution of f500 withan energy filtering at y60"10 V. Forty-two differ-ent atomic masses were measured by peak switching,with counting times of 5 or 10 s on each peak andwaiting time of 1 s. Successive measurements werecumulated for 120 min for each analysis. This lowfiltering energy offered the advantage to keep thecounting rate high while removing complex molecu-lar interferences. Remaining interferences on REEŽ .LREE and Ba oxides interfering with HREE were
Žskipped out by deconvolution techniques Fahey et.al., 1987 after measuring 31 atomic masses from
138 to 180. Secondary ion currents were normalizedto Si, and secondary yields relative to Si determinedon standards. Standards for the elements measured
Žwith ion microprobe included synthetic glasses NBS.613 prepared by the National Institute of Standards
and Technology and another synthetic glass preparedŽby fusing a granitic rock powder 2665 with SiO :2
76.9%, Al O : 12.5%, Na O: 4.5%, K O: 4.3%,2 3 2 2.Fe O : 1.1% as major elements from Streltsovka2 3
with distilled H O in welded Pt capsule at 7808C2
and 2 kbar. Two cycles of crushing, melting andquenching were realized to homogenize elements inthe last glass. Major, minor and trace element con-tents in the standard glasses were measured by ICP-ES and -MS. U and Th were measured separatelyfollowing the same procedure.
The present ion microprobe procedure for H O2
determination is the same as described by Deloule etŽ .al. 1995 , using a working curve of HqrSiq vs.
Ž . Ž .H O wt.% rSiO wt.% based on the analysis of2 2
standards with known water content. A negativeprimary oxygen beam was focused to produce a10-mm diameter spot. The mass resolution was set at480. Hq, 28 Siq and 30Siq were measured by peakswitching. Counting times were 3 s on each peak andwaiting time of 1 s. Successive measurements wereaccumulated for 15 min on one sample position.
4. Description of the melt inclusions
The melt inclusions are relatively abundant inmost quartz phenocrysts of the rhyolites: for exam-ple, 30 inclusions were noted in a fragment of asingle phenocryst. Their shape varies from sphericalto hexagonal, but elongated and lobed inclusionswere also observed. Their size ranges from 10 to 250mm, but most are in the order of 10 to 90 mm. Somelarge inclusions are devitrified and opaque due torecrystallization and were not studied.
Ž .Two groups of inclusions were distinguished: 1Žthe smallest inclusions from 10 to 30 mm in diame-
.ter contain only two phases, a glass and a gasŽ . Ž .bubble; 2 the largest inclusions 30–250 mm are
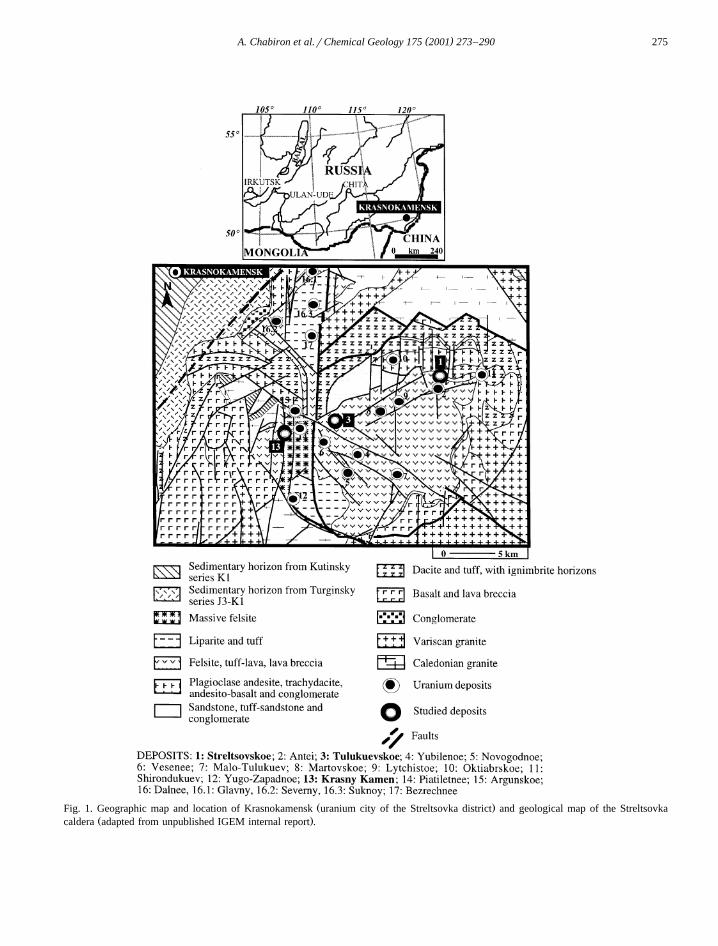
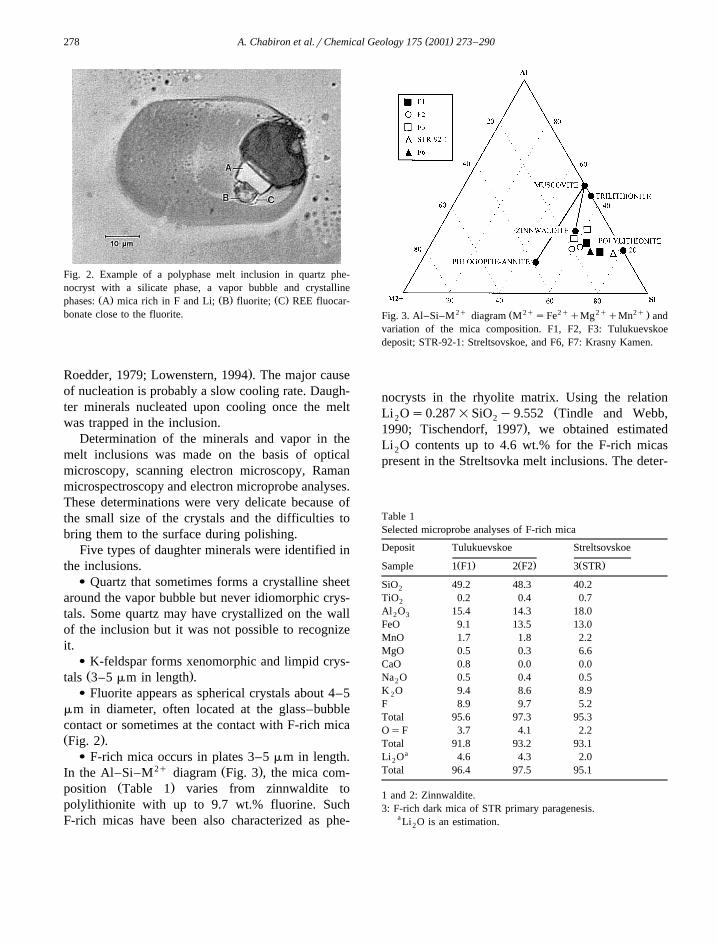
multiphase and contain a glass, a vapor bubble andŽ .one to several crystals Fig. 2 . In most cases, crys-
tals are located at the glass–bubble interface. Thecrystals are presumed to be daughter minerals be-cause they are present in relatively constant propor-tions in the different inclusions and they dissolvedbefore complete homogenization of the inclusions.
The occurrence or absence of daughter mineralsand vapor bubble in melt inclusions may be due todifferent parameters: cooling rate, viscosity of the
Žmelt and size of the inclusions Clocchiatti, 1975;
( )A. Chabiron et al.rChemical Geology 175 2001 273–290278
Fig. 2. Example of a polyphase melt inclusion in quartz phe-nocryst with a silicate phase, a vapor bubble and crystalline
Ž . Ž . Ž .phases: A mica rich in F and Li; B fluorite; C REE fluocar-bonate close to the fluorite.
.Roedder, 1979; Lowenstern, 1994 . The major causeof nucleation is probably a slow cooling rate. Daugh-ter minerals nucleated upon cooling once the meltwas trapped in the inclusion.
Determination of the minerals and vapor in themelt inclusions was made on the basis of opticalmicroscopy, scanning electron microscopy, Ramanmicrospectroscopy and electron microprobe analyses.These determinations were very delicate because ofthe small size of the crystals and the difficulties tobring them to the surface during polishing.
Five types of daughter minerals were identified inthe inclusions.
v Quartz that sometimes forms a crystalline sheetaround the vapor bubble but never idiomorphic crys-tals. Some quartz may have crystallized on the wallof the inclusion but it was not possible to recognizeit.
v K-feldspar forms xenomorphic and limpid crys-Ž .tals 3–5 mm in length .
v Fluorite appears as spherical crystals about 4–5mm in diameter, often located at the glass–bubblecontact or sometimes at the contact with F-rich micaŽ .Fig. 2 .
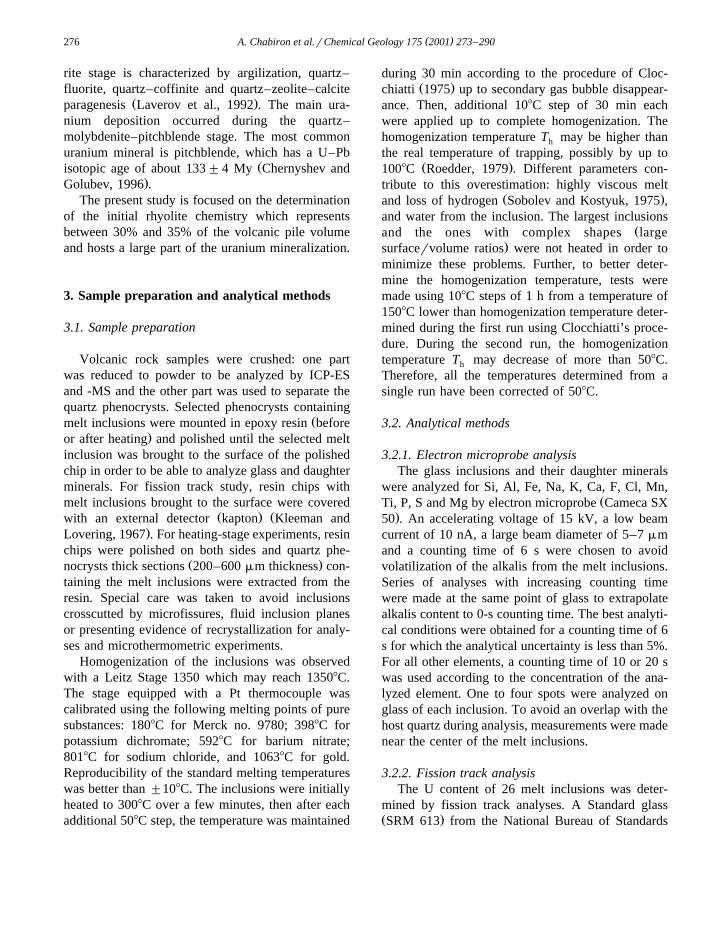
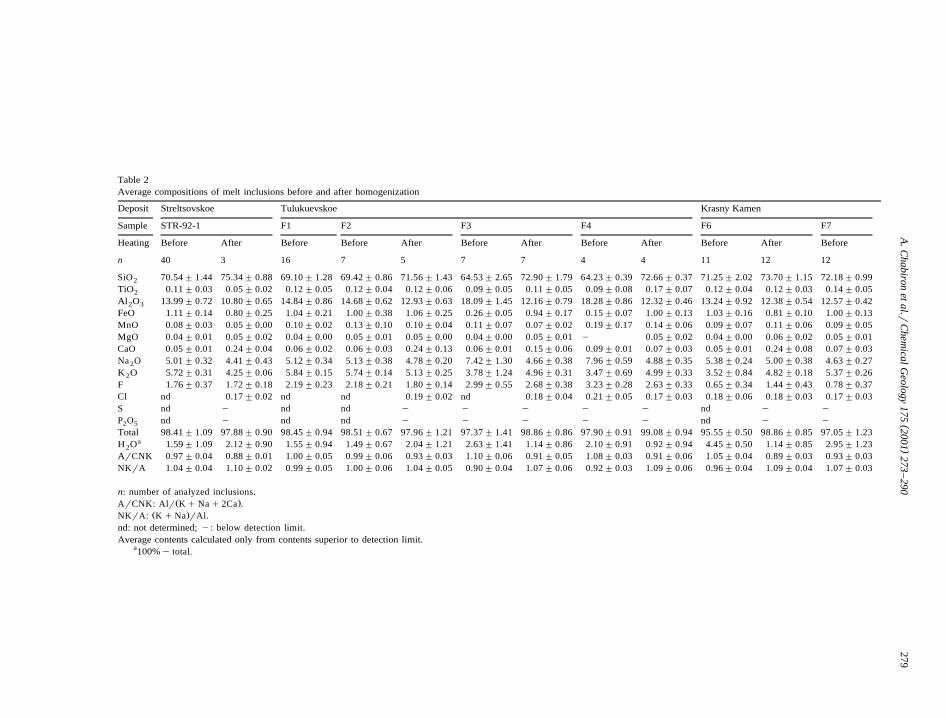
v F-rich mica occurs in plates 3–5 mm in length.2q Ž .In the Al–Si–M diagram Fig. 3 , the mica com-
Ž .position Table 1 varies from zinnwaldite topolylithionite with up to 9.7 wt.% fluorine. SuchF-rich micas have been also characterized as phe-
2q Ž 2q 2q 2q 2q .Fig. 3. Al–Si–M diagram M sFe qMg qMn andvariation of the mica composition. F1, F2, F3: Tulukuevskoedeposit; STR-92-1: Streltsovskoe, and F6, F7: Krasny Kamen.
nocrysts in the rhyolite matrix. Using the relationŽLi Os0.287=SiO y9.552 Tindle and Webb,2 2
.1990; Tischendorf, 1997 , we obtained estimatedLi O contents up to 4.6 wt.% for the F-rich micas2
present in the Streltsovka melt inclusions. The deter-
Table 1Selected microprobe analyses of F-rich mica
Deposit Tulukuevskoe Streltsovskoe
Ž . Ž . Ž .Sample 1 F1 2 F2 3 STR
SiO 49.2 48.3 40.22
TiO 0.2 0.4 0.72
Al O 15.4 14.3 18.02 3
FeO 9.1 13.5 13.0MnO 1.7 1.8 2.2MgO 0.5 0.3 6.6CaO 0.8 0.0 0.0Na O 0.5 0.4 0.52
K O 9.4 8.6 8.92
F 8.9 9.7 5.2Total 95.6 97.3 95.3OsF 3.7 4.1 2.2Total 91.8 93.2 93.1
aLi O 4.6 4.3 2.02
Total 96.4 97.5 95.1
1 and 2: Zinnwaldite.3: F-rich dark mica of STR primary paragenesis.
a Li O is an estimation.2
()
A.C
habironet
al.rC
hemicalG
eology175
2001273
–290
279
Table 2Average compositions of melt inclusions before and after homogenization
Deposit Streltsovskoe Tulukuevskoe Krasny Kamen
Sample STR-92-1 F1 F2 F3 F4 F6 F7
Heating Before After Before Before After Before After Before After Before After Before
n 40 3 16 7 5 7 7 4 4 11 12 12
SiO 70.54" 1.44 75.34" 0.88 69.10" 1.28 69.42" 0.86 71.56" 1.43 64.53" 2.65 72.90" 1.79 64.23" 0.39 72.66" 0.37 71.25" 2.02 73.70" 1.15 72.18" 0.992
TiO 0.11" 0.03 0.05" 0.02 0.12" 0.05 0.12" 0.04 0.12" 0.06 0.09" 0.05 0.11" 0.05 0.09" 0.08 0.17" 0.07 0.12" 0.04 0.12" 0.03 0.14" 0.052
Al O 13.99" 0.72 10.80" 0.65 14.84" 0.86 14.68" 0.62 12.93" 0.63 18.09" 1.45 12.16" 0.79 18.28" 0.86 12.32" 0.46 13.24" 0.92 12.38" 0.54 12.57" 0.422 3
FeO 1.11" 0.14 0.80" 0.25 1.04" 0.21 1.00" 0.38 1.06" 0.25 0.26" 0.05 0.94" 0.17 0.15" 0.07 1.00" 0.13 1.03" 0.16 0.81" 0.10 1.00" 0.13MnO 0.08" 0.03 0.05" 0.00 0.10" 0.02 0.13" 0.10 0.10" 0.04 0.11" 0.07 0.07" 0.02 0.19" 0.17 0.14" 0.06 0.09" 0.07 0.11" 0.06 0.09" 0.05MgO 0.04" 0.01 0.05" 0.02 0.04" 0.00 0.05" 0.01 0.05" 0.00 0.04" 0.00 0.05" 0.01 y 0.05" 0.02 0.04" 0.00 0.06" 0.02 0.05" 0.01CaO 0.05" 0.01 0.24" 0.04 0.06" 0.02 0.06" 0.03 0.24" 0.13 0.06" 0.01 0.15" 0.06 0.09" 0.01 0.07" 0.03 0.05" 0.01 0.24" 0.08 0.07" 0.03Na O 5.01" 0.32 4.41" 0.43 5.12" 0.34 5.13" 0.38 4.78" 0.20 7.42" 1.30 4.66" 0.38 7.96" 0.59 4.88" 0.35 5.38" 0.24 5.00" 0.38 4.63" 0.272
K O 5.72" 0.31 4.25" 0.06 5.84" 0.15 5.74" 0.14 5.13" 0.25 3.78" 1.24 4.96" 0.31 3.47" 0.69 4.99" 0.33 3.52" 0.84 4.82" 0.18 5.37" 0.262
F 1.76" 0.37 1.72" 0.18 2.19" 0.23 2.18" 0.21 1.80" 0.14 2.99" 0.55 2.68" 0.38 3.23" 0.28 2.63" 0.33 0.65" 0.34 1.44" 0.43 0.78" 0.37Cl nd 0.17" 0.02 nd nd 0.19" 0.02 nd 0.18" 0.04 0.21" 0.05 0.17" 0.03 0.18" 0.06 0.18" 0.03 0.17" 0.03S nd y nd nd y y y y y nd y yP O nd y nd nd y y y y y nd y y2 5
Total 98.41" 1.09 97.88" 0.90 98.45" 0.94 98.51" 0.67 97.96" 1.21 97.37" 1.41 98.86" 0.86 97.90" 0.91 99.08" 0.94 95.55" 0.50 98.86" 0.85 97.05" 1.23aH O 1.59" 1.09 2.12" 0.90 1.55" 0.94 1.49" 0.67 2.04" 1.21 2.63" 1.41 1.14" 0.86 2.10" 0.91 0.92" 0.94 4.45" 0.50 1.14" 0.85 2.95" 1.232
ArCNK 0.97" 0.04 0.88" 0.01 1.00" 0.05 0.99" 0.06 0.93" 0.03 1.10" 0.06 0.91" 0.05 1.08" 0.03 0.91" 0.06 1.05" 0.04 0.89" 0.03 0.93" 0.03NKrA 1.04" 0.04 1.10" 0.02 0.99" 0.05 1.00" 0.06 1.04" 0.05 0.90" 0.04 1.07" 0.06 0.92" 0.03 1.09" 0.06 0.96" 0.04 1.09" 0.04 1.07" 0.03
n: number of analyzed inclusions.Ž .ArCNK: Alr KqNaq 2Ca .
Ž .NKrA: KqNa rAl.nd: not determined; y: below detection limit.Average contents calculated only from contents superior to detection limit.
a100%y total.
( )A. Chabiron et al.rChemical Geology 175 2001 273–290280
mination of Li by laser ablation optical emissionŽspectroscopy is in progress Boiron, personal com-
.munication and the preliminary results confirm thepresence of several percent Li in these micas.
A REE fluocarbonate: associated with fluorite,Ž . Ž .tentatively identified as parisite Ce, La Ca CO F2 3 3 2
from semi-quantitative electron microprobe analysis.The occurrence of such a daughter mineral indicateshigh REE contents of the melt and its near saturationwith respect to parisite.
Potassium feldspar, biotite, fluorite, quartz andmagnetite were already described in melt inclusionsof quartz from Durben-Dort-Ula ongonitesŽ . Ž .Mongolia Naumov et al., 1984 . Some of theseminerals — feldspar, mica, magnetite and fluorite— have been also identified in the Spor Mountain
Ž .topaz rhyolites Tsareva et al., 1992 . An REE-richmineral in melt inclusions from the Harvey volcanic
Ž .suite Payette and Martin, 1986 has been describedas a trapped mineral but has been attributed to anREE-rich silicophosphate of britholite type.
CO has been identified in vapor bubbles by2
Raman spectroscopy.
5. Thermometry
The homogenization temperature T of a glassh
inclusion corresponds to the minimal temperature atwhich the glass, the mineral phases and the vaporbubble homogenize to a single phase. At Streltsovka,this temperature, obtained on 25 melt inclusionscorresponds to the disappearance of the vapor bubblesince daughter minerals dissolve before completehomogenization. For silicate-melt inclusions, the ho-mogenization temperature is close to the temperatureof melt trapping because of the low compressibility
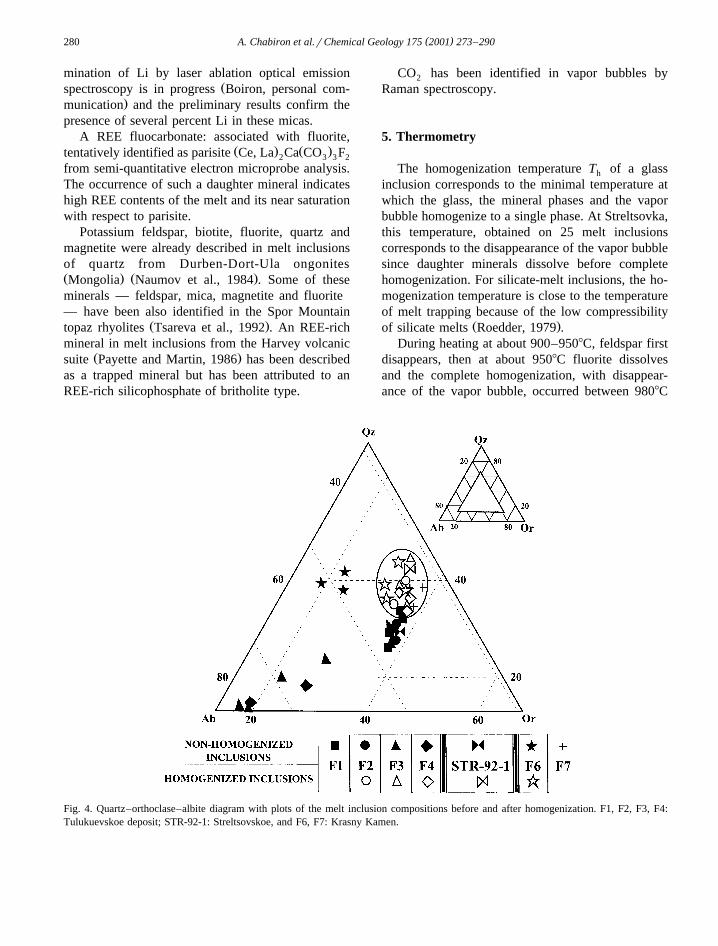
Ž .of silicate melts Roedder, 1979 .During heating at about 900–9508C, feldspar first
disappears, then at about 9508C fluorite dissolvesand the complete homogenization, with disappear-ance of the vapor bubble, occurred between 9808C
Fig. 4. Quartz–orthoclase–albite diagram with plots of the melt inclusion compositions before and after homogenization. F1, F2, F3, F4:Tulukuevskoe deposit; STR-92-1: Streltsovskoe, and F6, F7: Krasny Kamen.
( )A. Chabiron et al.rChemical Geology 175 2001 273–290 281
Table 3Whole rock analysis of rhyolites from Tulukuevskoe, KrasnyKamen and Streltsovskoe deposits
Deposit Tulukuevskoe Krasny Kamen Streltsovskoe
Sample F2 F3 F4 F6 STR
SiO 77.77 78.67 76.87 73.18 78.032
Al O 12.54 11.09 11.83 11.85 12.132 3
Fe O 1.20 1.04 1.10 2.99 1.312 3
MnO – – 0.03 0.04 0.04MgO 0.05 0.08 0.29 0.15 0.16CaO – 0.14 0.20 0.04 0.41Na O 3.90 0.15 2.34 1.67 0.952
K O 2.96 5.36 4.26 5.47 4.382
TiO 0.12 0.12 0.15 0.12 0.112
P O – – 0.18 0.07 –2 5
L.I. 1.36 2.51 2.09 3.25 2.31Total 99.90 99.16 99.34 98.83 99.83
L.I.: Loss Ignition.
and 10458C and more precisely at 1020"208C forStreltsovskoe from three inclusions, 1000"208C forTulukuevskoe from 13 inclusions and 1030"158C
Žfor Krasny Kamen from nine inclusions average:.1014"308C .
6. Composition of the melt inclusions
6.1. EÕolution of melt composition from non- tohomogenized inclusions
Compositions of melt inclusions were determinedby electron microprobe analysis on 97 inclusionsbefore homogenization and on 31 inclusions after
Ž .homogenization Table 2 . One to four spots wereanalyzed on each inclusion. In the quartz–ortho-
Ž .clase–albite diagram Fig. 4 , melt inclusion compo-sitions before homogenization are scattered due tothe variable degree of recrystallization of the glass.After homogenization, the data are clustered andshifted towards quartz-richer composition. The higherSi contents in homogenized glass are due to quartz
Table 4Ž . Ž .H O SIMS analyses contents of individual melt inclusions and major element electron microprobe analyses2
Deposit Tulukuevskoe Krasny Kamen
Sample F1 F2 F2 F3 F3 F4 F6 F6 F6
Homogenization Before Before After After After After Before After After
Ž .TH 8C 1000 1005 990 990 1015 1030
N8 inclusion 9 1 2 5 6 4 1 7 10
SiO 69.60 70.19 72.59 75.07 71.50 73.03 71.98 73.99 75.712
TiO 0.12 0.07 0.03 0.13 0.05 0.07 0.15 0.14 0.112
Al O 14.62 13.63 11.93 11.22 12.41 11.75 12.67 11.78 11.512 3
FeO 1.19 1.46 1.18 0.82 1.01 1.14 1.32 0.85 0.64MnO 0.15 0.17 0.15 0.08 0.07 0.13 0.23 0.04 0.14MgO – 0.05 0.05 – 0.06 0.03 – 0.07 0.04CaO – – 0.05 0.03 0.18 0.11 – 0.37 0.24Na O 5.01 5.05 4.92 4.36 4.59 4.74 5.62 4.75 4.832
K O 5.81 5.62 4.88 4.52 4.95 4.53 3.60 4.62 4.472
F 2.08 2.16 1.83 1.87 2.68 2.17 0.51 0.93 0.95Cl nd – 0.15 0.20 0.20 0.17 – 0.18 0.15S nd – – – – – – – –P O nd – – – – – – – –2 5
Total 98.58 98.40 97.76 98.30 97.70 97.87 96.08 97.72 98.79aH O 1.42 1.74 2.24 1.70 2.30 2.13 3.92 2.28 1.212bH O 1.31 1.07 1.98 2.05 2.17 2.40 3.73 2.03 0.572Ž .Alr NaqKq2Ca 1.01 0.95 0.89 0.93 0.94 0.91 0.96 0.87 0.87
Ž .NaqK rAl 0.99 1.06 1.12 1.08 1.04 1.08 1.04 1.09 1.11
a100%ymicroprobe total.b Ion microprobe analysis.
( )A. Chabiron et al.rChemical Geology 175 2001 273–290282
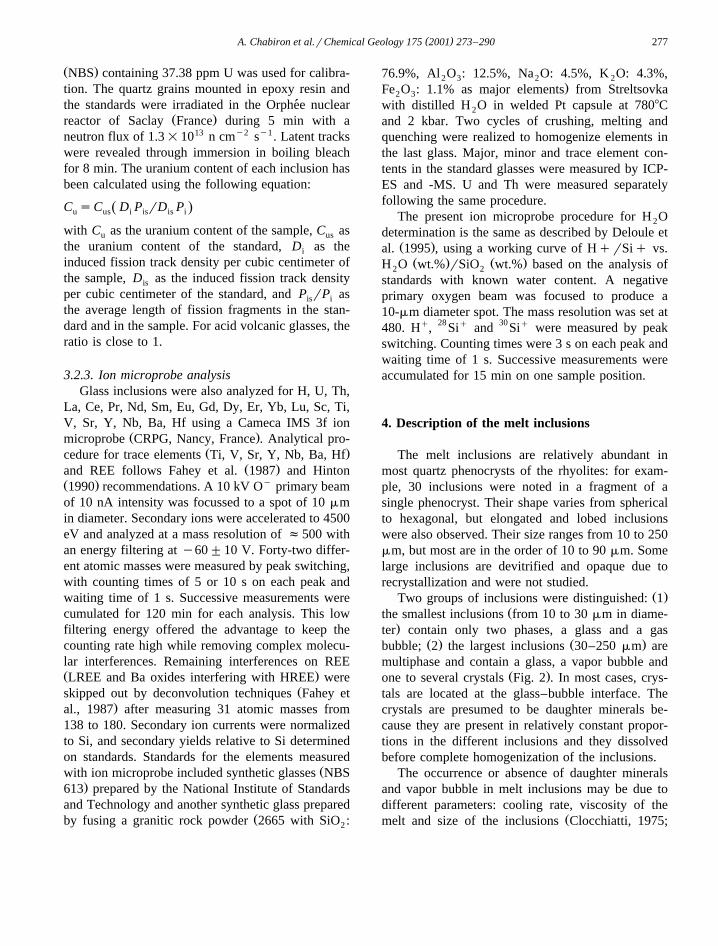
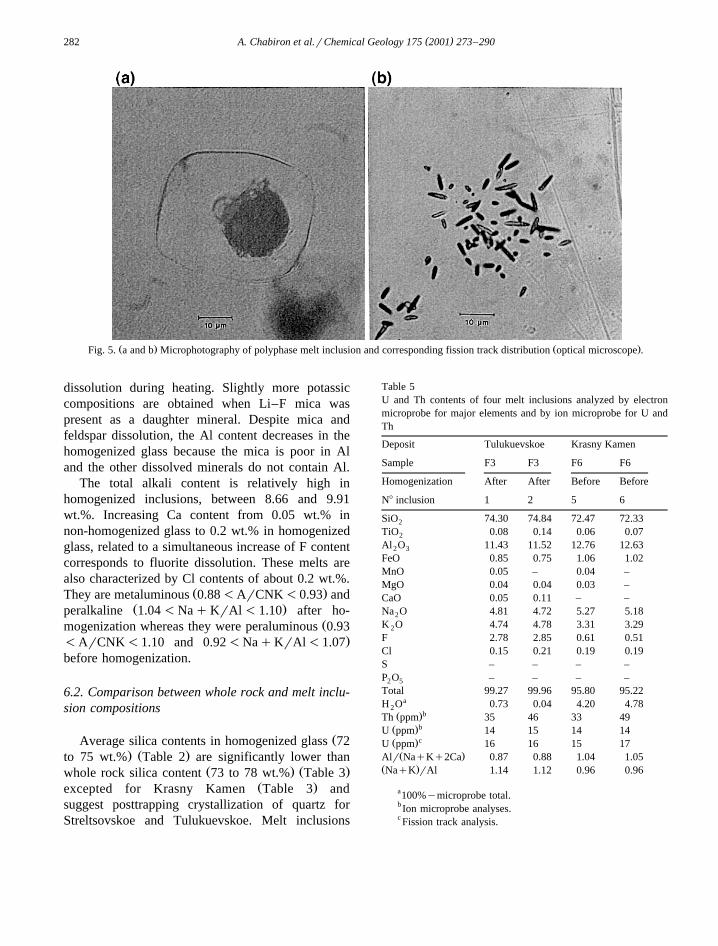
Ž . Ž .Fig. 5. a and b Microphotography of polyphase melt inclusion and corresponding fission track distribution optical microscope .
dissolution during heating. Slightly more potassiccompositions are obtained when Li–F mica waspresent as a daughter mineral. Despite mica andfeldspar dissolution, the Al content decreases in thehomogenized glass because the mica is poor in Aland the other dissolved minerals do not contain Al.
The total alkali content is relatively high inhomogenized inclusions, between 8.66 and 9.91wt.%. Increasing Ca content from 0.05 wt.% innon-homogenized glass to 0.2 wt.% in homogenizedglass, related to a simultaneous increase of F contentcorresponds to fluorite dissolution. These melts arealso characterized by Cl contents of about 0.2 wt.%.
Ž .They are metaluminous 0.88-ArCNK-0.93 andŽ .peralkaline 1.04-NaqKrAl-1.10 after ho-
Žmogenization whereas they were peraluminous 0.93.-ArCNK-1.10 and 0.92-NaqKrAl-1.07
before homogenization.
6.2. Comparison between whole rock and melt inclu-sion compositions
ŽAverage silica contents in homogenized glass 72. Ž .to 75 wt.% Table 2 are significantly lower than
Ž . Ž .whole rock silica content 73 to 78 wt.% Table 3Ž .excepted for Krasny Kamen Table 3 and
suggest posttrapping crystallization of quartz forStreltsovskoe and Tulukuevskoe. Melt inclusions
Table 5U and Th contents of four melt inclusions analyzed by electronmicroprobe for major elements and by ion microprobe for U andTh
Deposit Tulukuevskoe Krasny Kamen
Sample F3 F3 F6 F6
Homogenization After After Before Before
N8 inclusion 1 2 5 6
SiO 74.30 74.84 72.47 72.332
TiO 0.08 0.14 0.06 0.072
Al O 11.43 11.52 12.76 12.632 3
FeO 0.85 0.75 1.06 1.02MnO 0.05 – 0.04 –MgO 0.04 0.04 0.03 –CaO 0.05 0.11 – –Na O 4.81 4.72 5.27 5.182
K O 4.74 4.78 3.31 3.292
F 2.78 2.85 0.61 0.51Cl 0.15 0.21 0.19 0.19S – – – –P O – – – –2 5
Total 99.27 99.96 95.80 95.22aH O 0.73 0.04 4.20 4.782
bŽ .Th ppm 35 46 33 49bŽ .U ppm 14 15 14 14cŽ .U ppm 16 16 15 17
Ž .Alr NaqKq2Ca 0.87 0.88 1.04 1.05Ž .NaqK rAl 1.14 1.12 0.96 0.96
a100%ymicroprobe total.b Ion microprobe analyses.c Fission track analysis.
( )A. Chabiron et al.rChemical Geology 175 2001 273–290 283
from the Tulukuevskoe deposit have a compositionthat is considerably enriched in Al O , Na O, K O,2 3 2 2
FeO and F relatively to the host whole rock composi-tions. The variations of SiO , K O and FeO between2 2
glass and whole rocks are less important in the
Streltsovskoe rhyolite. The K O concentration is2
relatively constant and glass is depleted in Al O in2 3
comparison with the host whole rock. In KrasnyKamen melt inclusions, the concentrations of SiO2
and Al O are similar to their abundance in the2 3
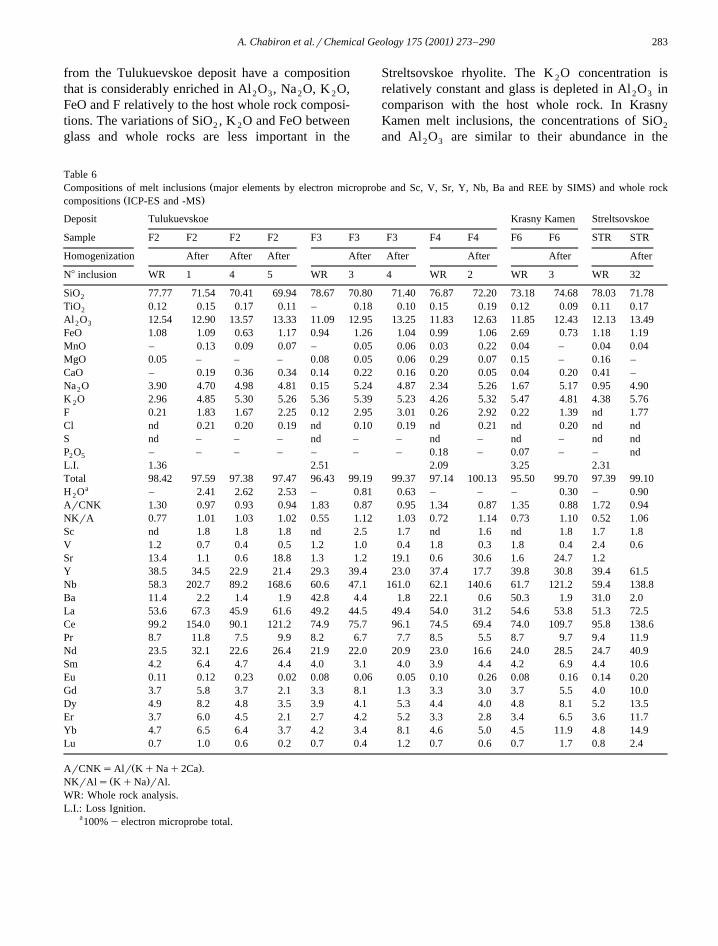
Table 6Ž .Compositions of melt inclusions major elements by electron microprobe and Sc, V, Sr, Y, Nb, Ba and REE by SIMS and whole rock
Ž .compositions ICP-ES and -MS
Deposit Tulukuevskoe Krasny Kamen Streltsovskoe
Sample F2 F2 F2 F2 F3 F3 F3 F4 F4 F6 F6 STR STR
Homogenization After After After After After After After After
N8 inclusion WR 1 4 5 WR 3 4 WR 2 WR 3 WR 32
SiO 77.77 71.54 70.41 69.94 78.67 70.80 71.40 76.87 72.20 73.18 74.68 78.03 71.782
TiO 0.12 0.15 0.17 0.11 – 0.18 0.10 0.15 0.19 0.12 0.09 0.11 0.172
Al O 12.54 12.90 13.57 13.33 11.09 12.95 13.25 11.83 12.63 11.85 12.43 12.13 13.492 3
FeO 1.08 1.09 0.63 1.17 0.94 1.26 1.04 0.99 1.06 2.69 0.73 1.18 1.19MnO – 0.13 0.09 0.07 – 0.05 0.06 0.03 0.22 0.04 – 0.04 0.04MgO 0.05 – – – 0.08 0.05 0.06 0.29 0.07 0.15 – 0.16 –CaO – 0.19 0.36 0.34 0.14 0.22 0.16 0.20 0.05 0.04 0.20 0.41 –Na O 3.90 4.70 4.98 4.81 0.15 5.24 4.87 2.34 5.26 1.67 5.17 0.95 4.902
K O 2.96 4.85 5.30 5.26 5.36 5.39 5.23 4.26 5.32 5.47 4.81 4.38 5.762
F 0.21 1.83 1.67 2.25 0.12 2.95 3.01 0.26 2.92 0.22 1.39 nd 1.77Cl nd 0.21 0.20 0.19 nd 0.10 0.19 nd 0.21 nd 0.20 nd ndS nd – – – nd – – nd – nd – nd ndP O – – – – – – – 0.18 – 0.07 – – nd2 5
L.I. 1.36 2.51 2.09 3.25 2.31Total 98.42 97.59 97.38 97.47 96.43 99.19 99.37 97.14 100.13 95.50 99.70 97.39 99.10
aH O – 2.41 2.62 2.53 – 0.81 0.63 – – – 0.30 – 0.902
ArCNK 1.30 0.97 0.93 0.94 1.83 0.87 0.95 1.34 0.87 1.35 0.88 1.72 0.94NKrA 0.77 1.01 1.03 1.02 0.55 1.12 1.03 0.72 1.14 0.73 1.10 0.52 1.06Sc nd 1.8 1.8 1.8 nd 2.5 1.7 nd 1.6 nd 1.8 1.7 1.8V 1.2 0.7 0.4 0.5 1.2 1.0 0.4 1.8 0.3 1.8 0.4 2.4 0.6Sr 13.4 1.1 0.6 18.8 1.3 1.2 19.1 0.6 30.6 1.6 24.7 1.2Y 38.5 34.5 22.9 21.4 29.3 39.4 23.0 37.4 17.7 39.8 30.8 39.4 61.5Nb 58.3 202.7 89.2 168.6 60.6 47.1 161.0 62.1 140.6 61.7 121.2 59.4 138.8Ba 11.4 2.2 1.4 1.9 42.8 4.4 1.8 22.1 0.6 50.3 1.9 31.0 2.0La 53.6 67.3 45.9 61.6 49.2 44.5 49.4 54.0 31.2 54.6 53.8 51.3 72.5Ce 99.2 154.0 90.1 121.2 74.9 75.7 96.1 74.5 69.4 74.0 109.7 95.8 138.6Pr 8.7 11.8 7.5 9.9 8.2 6.7 7.7 8.5 5.5 8.7 9.7 9.4 11.9Nd 23.5 32.1 22.6 26.4 21.9 22.0 20.9 23.0 16.6 24.0 28.5 24.7 40.9Sm 4.2 6.4 4.7 4.4 4.0 3.1 4.0 3.9 4.4 4.2 6.9 4.4 10.6Eu 0.11 0.12 0.23 0.02 0.08 0.06 0.05 0.10 0.26 0.08 0.16 0.14 0.20Gd 3.7 5.8 3.7 2.1 3.3 8.1 1.3 3.3 3.0 3.7 5.5 4.0 10.0Dy 4.9 8.2 4.8 3.5 3.9 4.1 5.3 4.4 4.0 4.8 8.1 5.2 13.5Er 3.7 6.0 4.5 2.1 2.7 4.2 5.2 3.3 2.8 3.4 6.5 3.6 11.7Yb 4.7 6.5 6.4 3.7 4.2 3.4 8.1 4.6 5.0 4.5 11.9 4.8 14.9Lu 0.7 1.0 0.6 0.2 0.7 0.4 1.2 0.7 0.6 0.7 1.7 0.8 2.4
Ž .ArCNKsAlr KqNaq2Ca .Ž .NKrAls KqNa rAl.
WR: Whole rock analysis.L.I.: Loss Ignition.
a100%yelectron microprobe total.
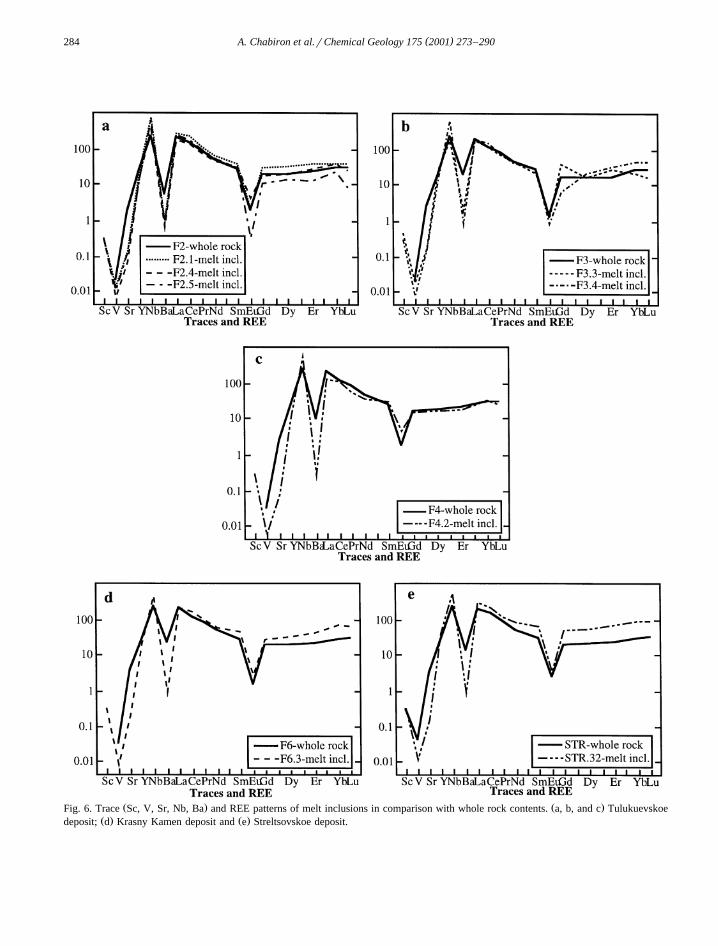
( )A. Chabiron et al.rChemical Geology 175 2001 273–290284
Ž . Ž .Fig. 6. Trace Sc, V, Sr, Nb, Ba and REE patterns of melt inclusions in comparison with whole rock contents. a, b, and c TulukuevskoeŽ . Ž .deposit; d Krasny Kamen deposit and e Streltsovskoe deposit.
( )A. Chabiron et al.rChemical Geology 175 2001 273–290 285
whole rock. K O content in glass seems to be lower2
than in host rock. Na O, FeO and F exhibit the same2
variations between glass and rock as in Streltsovskoeand Tulukuevskoe deposits.
6.3. Volatile contents
The differences between the sum of oxides andŽ .100% Table 2 is an indication of the volatileŽ .content H O, CO , F, Cl, S , especially water2 2
ŽAnderson, 1973; Sommer, 1977; Chaigneau et al.,.1980 and cumulative errors on the other elements as
well as Na, K volatilization during analysis. But, F,Cl and S were analyzed by electron microprobe andspecial care was taken to choose the best analyticalconditions to limit alkali volatilization. Thus, thedifference between the sum of oxides and 100%corresponds essentially to the water content of themelt for the present results. The average calculatedwater contents are about 2.4"1.1 wt.% before ho-mogenization and 1.5"0.6 wt.% after homogeniza-tion. Important variation between inclusions from asame sample is observed. Ion microprobe analysesŽ .Table 4 of H O content in 10 melt inclusions show2
a relatively good agreement with estimation fromelectron microprobe analyses. The H O content of2
four homogenized inclusions ranges from 2.0% to2.4%. In Krasny Kamen deposit, H O in three ho-2
mogenized inclusions, is between 0.6% and 2.0%.Thus, in the case of the Streltsovka rhyolitic meltinclusions, there is variation of H O content.2
6.4. U and trace element contents of the melt inclu-sions
Ž .Fission tracks Fig. 5 have been analyzed on 26magmatic non-homogenized inclusions from theStreltsovskoe mine and on 3 inclusions from theTulukuevskoe open pit. The U content in each inclu-
Žsion from Tulukuevskoe is highly reproducible 23."1 ppm , whereas U concentrations in melt inclu-
sions from Streltsovskoe exhibit some variabilityŽ .17"4 ppm . These U contents are higher and morehomogeneous than for whole rocks in which hetero-
Ž .geneous U concentrations from 6 to 28 ppm maybe explained by hydrothermal enrichment or leach-ing. U contents determined by ion microprobe aresimilar to the concentrations obtained by fission
Ž .track analysis, but about 1 ppm lower Table 5 .
Eight homogenized melt inclusions were largeenough to be analyzed by SIMS. They present simi-lar trace element and REE patterns as the whole
Ž .rocks Table 6; Fig. 6 . Trace element contents ofhomogenized melt inclusions may be higher or lower
Ž .than in whole rock Table 6 . Nb content is consider-ably higher in the glass of melt inclusions whereasSr and Ba, mobile elements, are strongly lower thanin their whole rock. Rare earth patterns in meltinclusions present moderate LREE fractionation, lowHREE fractionation and a strongly negative Euanomaly.
7. Discussion and conclusions
7.1. Thermometry
The studied melt inclusions are hosted in quartzcrystals, which are not intersected by fluid inclusionplanes and which, on the basis of observations atscales down to the back-scattered electron micro-probe, appear absolutely free of cracks. The lowvolatile content of the inclusions, the peralkalinenature of the glass and the homogeneity of the Udistribution at the scale of a single inclusion andbetween the inclusions represent strong evidences ofan efficient preservation of the initial melt composi-tion. Microfracturing of the inclusions will lead tohydration of the melt, a preferential removal ofalkalis inducing peraluminous composition and er-ratic redistribution of uranium. Thus leakage along
Ž .cracks Skirius et al., 1990 cannot have influencedhomogenization temperatures and glass composi-tions.
Ž .Homogenization temperatures T of melt inclu-h
sions in quartz from rhyolites in the literature areusually lower than those obtained for Streltsovkarhyolites. However, glass inclusions in the TaylorCreek rhyolite with metaluminous to weakly peralu-
Žminous magma compositions Webster and Duffield,.1994 , homogenized at temperatures ranging from
8908C to 9908C, at 4 kbar external pressure andpresent similar H O contents of 1.3"0.8 wt.%.2
Melt inclusions in the Harvey peraluminous rhyoliteŽ .Payette and Martin, 1986 required temperaturesabove 10008C, but these high temperatures wereexplained by fractures in the host quartz and leakageof the melt. Melt inclusions in quartz phenocrysts
( )A. Chabiron et al.rChemical Geology 175 2001 273–290286
Žfrom the metaluminous Bishop tuff Skirius et al.,.1990 homogenized at 8008C to 9008C and at about
Ž .2 kbar. Clocchiatti 1975 obtained T lower thanh
850–9008C for volatile-rich inclusions and T fromh
9008C to 12008C for volatile-poor inclusions in oldŽ .rhyolites. Takenouchi and Imai 1975 measured
similar T for rhyolites from Japan. Study of melth
inclusions in young pyroclastics in S. PietroŽ . Ž .Sardinia Vincent et al., 1981 gives a peralkalinenature and an homogenization temperature ranging
Žfrom 7808C to 8008C for higher Cl content 3900. Žppm but for much lower F concentration 3200.ppm than melt inclusions from Streltsovka.
The temperature variation observed for each local-ity in the Streltsovka caldera is higher than theprecision and the accuracy of the measurements.This variation may indicate that magmas at differentstages of evolution were trapped at different stagesof the crystallization. Homogenization temperature isalso function of water and F content and composition
Ž .of melt. The lower Th 1000"208C obtained inTulukuevskoe inclusions agrees with their higher F
Ž .content 2.2 to 3.2% . The higher homogenizationtemperature of Krasny Kamen inclusions also agrees
Ž .with the lower F content 0.6% to 0.8% . The hightemperatures obtained for the Streltsovka rhyoliticmelt also result from the relatively low average H O2
content of the magma, estimated from electron mi-croprobe analyses but also determined by ion micro-probe and the presence of CO in the fluid phase.2
However, this temperature may be overestimated ifthe volatile contents of inclusions were not pre-served, a problem that will be discussed in thefollowing section.
7.2. Composition of glass
A controversial problem in melt inclusion studiesis whether the composition determined on the glassinclusions represents effectively the composition ofthe original magma and at which stage of its frac-tionation. Melt composition of the inclusion may bemodified before or after trapping. Melt inclusionsintersected by microcracks generally recrystallizedhave been rejected from the present study and thusthe possibility of loss or gain of elements throughfractures is ruled out. Melt inclusion compositionsare homogeneous and relatively similar in all samples
of rhyolites whatever the deposit of the Streltsovkacaldera. Major element contents, and especially SiO2
concentration, of the majority of inclusions are com-patible with the crystallization of quartz from en-trapped melt, especially for Tulukuevskoe andStreltsovskoe samples. This phenomenon is already
Žwell known in other rhyolitic glass inclusions Cloc-.chiatti, 1975; Webster and Duffield, 1991, 1994 .
SiO variations show negative correlations of silica2
with Al O , Na O and K O for homogenized melt2 3 2 2
inclusions from Streltsovskoe, Tulukuevskoe andKrasny Kamen deposits. These variations confirmthe possibility of quartz crystallization from en-
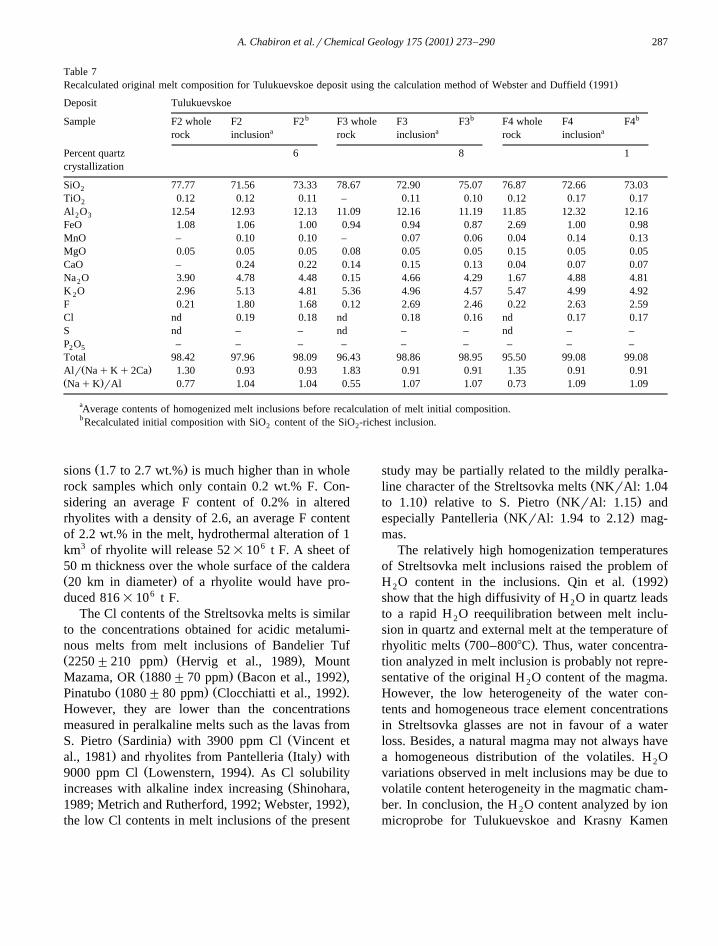
Ž .trapped melt Webster and Duffield, 1991, 1994 .We have used the calculation procedure of Webster
Ž .and Duffield 1991 to determine the amount ofquartz crystallized from melt and thus to obtaininitial trapped melt composition. The initial SiO2
content of trapped melt is assumed to be the onefound in the SiO -richest inclusion. Variations of2
SiO , Al O , Na O and K O in Streltsovka melt2 2 3 2 2
inclusions may be explained by 1 to 8 wt.% ofcrystallized quartz after melt trapping. Recalculatedmean melt inclusion compositions are noted in Table7. These results show a decrease of the concentrationof elements other than silica in the original magmacomposition resulting from quartz crystallizationfrom trapped melt. Despite of this correction, SiO2
contents of melt inclusions are still lower than wholerock contents. This difference may be also explainedby the melt fractionation after the inclusion trappingor may due to quartz phenocryst accumulation in thewhole rock samples.
The determination of the Streltsovka pristine per-alkaline rhyolitic melt composition from melt inclu-sion data presents a special interest, since mostrhyolitic melt inclusions reported in the literature areperaluminous. The rhyolitic melts of the Streltsovkacaldera are characterized by high F contents similarto those of potassium-rich metaluminous to mildly
Žperaluminous magmas from Taylor Creek Webster.and Duffield, 1994; Webster et al., 1995 or Harvey
Ž .Payette and Martin, 1986 . The F and REE contentsof the Streltsovka rhyolites give a good evaluation ofthe solubilities of these elements for mildly peralka-line melt at about 9508C because saturation is reachedfor fluorite and parisite in the studied melt inclusionsat this temperature. The F content in the melt inclu-
( )A. Chabiron et al.rChemical Geology 175 2001 273–290 287
Table 7Ž .Recalculated original melt composition for Tulukuevskoe deposit using the calculation method of Webster and Duffield 1991
Deposit Tulukuevskoeb b bSample F2 whole F2 F2 F3 whole F3 F3 F4 whole F4 F4
a a arock inclusion rock inclusion rock inclusion
Percent quartz 6 8 1crystallization
SiO 77.77 71.56 73.33 78.67 72.90 75.07 76.87 72.66 73.032
TiO 0.12 0.12 0.11 – 0.11 0.10 0.12 0.17 0.172
Al O 12.54 12.93 12.13 11.09 12.16 11.19 11.85 12.32 12.162 3
FeO 1.08 1.06 1.00 0.94 0.94 0.87 2.69 1.00 0.98MnO – 0.10 0.10 – 0.07 0.06 0.04 0.14 0.13MgO 0.05 0.05 0.05 0.08 0.05 0.05 0.15 0.05 0.05CaO – 0.24 0.22 0.14 0.15 0.13 0.04 0.07 0.07Na O 3.90 4.78 4.48 0.15 4.66 4.29 1.67 4.88 4.812
K O 2.96 5.13 4.81 5.36 4.96 4.57 5.47 4.99 4.922
F 0.21 1.80 1.68 0.12 2.69 2.46 0.22 2.63 2.59Cl nd 0.19 0.18 nd 0.18 0.16 nd 0.17 0.17S nd – – nd – – nd – –P O – – – – – – – – –2 5
Total 98.42 97.96 98.09 96.43 98.86 98.95 95.50 99.08 99.08Ž .Alr NaqKq2Ca 1.30 0.93 0.93 1.83 0.91 0.91 1.35 0.91 0.91
Ž .NaqK rAl 0.77 1.04 1.04 0.55 1.07 1.07 0.73 1.09 1.09
aAverage contents of homogenized melt inclusions before recalculation of melt initial composition.bRecalculated initial composition with SiO content of the SiO -richest inclusion.2 2
Ž .sions 1.7 to 2.7 wt.% is much higher than in wholerock samples which only contain 0.2 wt.% F. Con-sidering an average F content of 0.2% in alteredrhyolites with a density of 2.6, an average F contentof 2.2 wt.% in the melt, hydrothermal alteration of 1km3 of rhyolite will release 52=106 t F. A sheet of50 m thickness over the whole surface of the calderaŽ .20 km in diameter of a rhyolite would have pro-duced 816=106 t F.
The Cl contents of the Streltsovka melts is similarto the concentrations obtained for acidic metalumi-nous melts from melt inclusions of Bandelier TufŽ . Ž .2250"210 ppm Hervig et al., 1989 , Mount
Ž . Ž .Mazama, OR 1880"70 ppm Bacon et al., 1992 ,Ž . Ž .Pinatubo 1080"80 ppm Clocchiatti et al., 1992 .
However, they are lower than the concentrationsmeasured in peralkaline melts such as the lavas from
Ž . ŽS. Pietro Sardinia with 3900 ppm Cl Vincent et. Ž .al., 1981 and rhyolites from Pantelleria Italy with
Ž .9000 ppm Cl Lowenstern, 1994 . As Cl solubilityŽincreases with alkaline index increasing Shinohara,
.1989; Metrich and Rutherford, 1992; Webster, 1992 ,the low Cl contents in melt inclusions of the present
study may be partially related to the mildly peralka-Žline character of the Streltsovka melts NKrAl: 1.04
. Ž .to 1.10 relative to S. Pietro NKrAl: 1.15 andŽ .especially Pantelleria NKrAl: 1.94 to 2.12 mag-
mas.The relatively high homogenization temperatures
of Streltsovka melt inclusions raised the problem ofŽ .H O content in the inclusions. Qin et al. 19922
show that the high diffusivity of H O in quartz leads2
to a rapid H O reequilibration between melt inclu-2
sion in quartz and external melt at the temperature ofŽ .rhyolitic melts 700–8008C . Thus, water concentra-
tion analyzed in melt inclusion is probably not repre-sentative of the original H O content of the magma.2
However, the low heterogeneity of the water con-tents and homogeneous trace element concentrationsin Streltsovka glasses are not in favour of a waterloss. Besides, a natural magma may not always havea homogeneous distribution of the volatiles. H O2
variations observed in melt inclusions may be due tovolatile content heterogeneity in the magmatic cham-ber. In conclusion, the H O content analyzed by ion2
microprobe for Tulukuevskoe and Krasny Kamen
( )A. Chabiron et al.rChemical Geology 175 2001 273–290288
melts can be only considered as the lowest contentfor the original magma. Thus, it is difficult to evalu-ate the pressure at the time of trapping of the inclu-sion, using homogenization temperature and H O2
content.Trace element and REE contents show little varia-
tion between melt inclusions from all the samples.These differences may be related to a certain hetero-geneity of the melt at the scale of the caldera whichexplains content variations between inclusions. Partof the differences between whole rock and meltinclusion compositions is the chemical evolution re-sulting from magma fractionation after trapping ofthe inclusions. Melt inclusions may represent differ-ent fractionation degree of melt at the time of quartzcrystallization. The similar REE contents of Tu-lukuevskoe melt inclusions and whole rock indicatethat there was no significant fractionation after trap-ping of the magma. On the other hand, the glassesfrom Krasny Kamen and Streltsovskoe rhyolites arericher in HREE than the whole rock. This agreeswith an REE saturation of the magma at the trappingtime that is confirmed by the crystallization of parisiteas a daughter mineral in melt inclusions. Besides,REE contents decrease in melt with fractionation.This explains that melt inclusions from Krasny Ka-men and Streltsovskoe are richer in REE than wholerocks.
Ion microprobe analyses of some mobile traceŽ . Želements V, Sr, Ba in melt inclusions respectively
from 0.3 to 1 ppm; from 0.6 to 1.6 ppm; from 0.6 to.4.4 ppm indicate lower contents in melts than in
Žwhole rocks respectively from 1.2 to 2.4 ppm; from.13.4 to 30.6 ppm; from 11.4 to 50.3 ppm . As these
element have a crystalrmelt partition coefficienthigher than one, their enrichment in the whole rockresults from an input by hydrothermal fluids from
Žunderlying less fractionated volcanics trachytes,.basalts or from the granite basement. Nb contents
are very higher in melt inclusions than in wholerocks despite of its incompatibility in peralkalineliquids.
7.3. Conclusion
The study of melt inclusions is an original methodto provide information on the composition of primi-
tive magma, particularly when studied rocks arestrongly altered. Analyses of altered volcanics givewrong information on the original chemistry of thesource magma. Only weakly mobile elements suchas Ti, Nb, Th, REE may contribute to better knowthe rock geochemistry. The melt inclusion methodknew a rapid development in volcanology the lastdecade but has been rarely applied to metallogeny.This work shows that melt inclusion study could beused more often and whatever the type of deposit.This approach allows to obtain complete and verygood results about the initial composition: major,trace elements, volatiles and REE.
Analyses of melt inclusions in quartz from theStreltsovka altered rhyolites allowed to characterizethe chemistry of the Streltsovka rhyolitic magmasand particularly to obtain mobile element concentra-tions before any alteration. Then, the Streltsovka
Žmelts are mildly peralkaline 1.04-NaqKrAl-.1.10 whereas whole rock analyses indicated peralu-
minous composition. The Streltsovka rhyolitic meltsŽ . Žare rich in F from 1.4 to 2.7 wt.% , and in U 14 to
.23 ppm . They are relatively dry with water contentŽlower than 2.4% H O. The low Cl contents 0.2%2
.Cl in melt inclusions of the present study may bepartially related to the mildly peralkaline character of
Ž .the Streltsovka melts NKrAl: 1.04 to 1.10 . Thesemelts are rich in REE and present moderate LREEfractionation, low HREE fractionation and a stronglynegative Eu anomaly.
Acknowledgements
This work was performed within the frameworkof a scientific cooperation between IGEM andCREGU. This study was supported by CEA-DCCŽ .France . We thank M.C. Boiron for the help withthe Raman microspectrometry and C. Peiffert forglass standard making. The authors want to thank R.Clocchiatti, in particular, for the helpful discussionon this manuscript.
References
Anderson, A.T., 1973. The before-eruption water content of somehigh-alumina magmas. Bull. Volcanol. 37, 530–552.
Anderson, A.T., Newman, S., Williams, S.N., Druitt, T.H., Skir-
( )A. Chabiron et al.rChemical Geology 175 2001 273–290 289
ius, C., Stolper, E., 1989. H O, CO , Cl and gas in Plinian2 2
and ash flow Bishop rhyolite. Geology 17, 221–225.Andreeva, O.V., Alyeshin, A.P., Golovin, V.A., 1996. Vertical
zonality of ore formations in uranium deposits of Antei–Ž .Streltsovka Transbaikalia, Russia . Geol. Rudn. Mestorozhd.Ž .38, 396–411 in Russian .
Andreeva, O.V., Volfson, I.F., Golovin, V.A., Rossman, G.I.,1990. Behavior of uranium in the process of low-temperaturealteration of country rocks of uranium deposits. Geokhimiya 2,
Ž .206–215 in Russian .Bacon, C.R., Newman, S., Stolper, E., 1992. Water, CO , Cl, and2
F in melt inclusions in phenocrysts from three Holoceneexplosive eruptions, Crater Lake, Oregon. Am. Mineral. 77,1021–1030.
Chaigneau, M., Massare, D., Clocchiatti, R., 1980. Contribution al’etude des inclusions vitreuses et des elements volatils con-´ ´tenus dans les phenocristaux de quartz de roches volcaniques´acides. Bull. Volcanol. 43, 233–240.
Chernyshev, I.V., Golubev, V.N., 1996. The Strel’tsovskoe de-posit, Eastern Transbaikalia: isotope dating of mineralizationin Russia’s largest uranium deposit. Geokhimiya 10, 924–937Ž .in Russian .
Clocchiatti, R., 1975. Les inclusions vitreuses des cristaux dequartz. Etude thermo-optique et chimique. Applicationsgeologiques. Soc. Geol. Fr., Mem. 122, 96 pp.´
Clocchiatti, R., Mosbah, M., Massare, D., Papale, P., 1992.Comportement du chlore et de l’eau dans le reservoir magma-´tique superficiel du Pinatubo etudie a l’aide des inclusions´ ´ `vitreuses et fluides des quartz. BSV 28, 1–14.
Deloule, E., Paillat, O., Pichavant, M., Scaillet, B., 1995. Ionmicroprobe determination of water in silicate glasses: methodsand applications. Chem. Geol. 125, 19–28.
Fahey, A.J., Goswami, J.N., McKeegan, K.D., Zinner, E., 1987.26Al, 244Pu, 50Ti, REE, and trace element abundances inhibonite grains from CM and CV meteorites. Geochim. Cos-mochim. Acta 51, 329–350.
Hervig, R.L., Dunbar, N.W., Westrich, H.R., Kyle, P.R., 1989.Pre-eruptive water content of rhyolitic magmas as determinedby ion microprobe analyses of melt inclusions in phenocrysts.J. Volcanol. Geotherm. Res. 36, 293–302.
Hinton, R.W., 1990. Ion microprobe trace-element analysis ofsilicates: measurement of multi-element glasses. Chem. Geol.83, 11–25.
Ishukova, L.P., 1989. Geological structure of south-Priargun inTransbaikalia. Izv. Akad. Nauk SSSR, Geol. Ser. 8, 102–118Ž .in Russian .
Ishukova, L.P., Modnikov, I.S., Citchev, I.V., 1991. Uraniumore-forming systems of continental volcanism regions. Geol.
Ž .Rudn. Mestorozhd. 3, 16–25 in Russian .Kleeman, J.D., Lovering, J.F., 1967. Uranium distribution studies
by fission track registration in lexan plastic prints. At. EnergyAust. 10, 3–8.
Kovalenko, V.I., Hervig, R.L., Sheridan, M.F., 1988. Ion-micro-probe analyses of trace-elements in anorthoclase, hedenber-gite, aenigmatite, quartz, apatite and glass in pantellerite:evidence for high water contents in pantellerite melt. Am.Mineral. 73, 1038–1045.
Laverov, N.P., Velitchkin, V.I., Shumilin, M.V., 1992. Uraniumdeposits of the CIS: the main economic genetic types and their
Ž .distribution. Geol. Rudn. Mestorozhd. 2, 3–18 in Russian .Lowenstern, J.B., 1994. Chlorine, fluid immiscibility, and de-
gassing in peralkaline magmas from Pantelleria, Italy. Am.Min. 79, 353–369.
Metrich, N., Rutherford, M.J., 1992. Experimental study of chlo-rine in hydrous silicic melts. Geochim. Cosmochim. Acta 56,607–616.
Naumov, V.B., Kovalenko, V.I., Clocchiatti, R., Solovova, I.P.,1984. Parameters of crystallization and composition of phasesof the melt inclusions in quartz of ongorhyolites. Geokhimiya
Ž .4, 451–464 in Russian .Newman, S., Stolper, E., Epstein, S., 1986. Measurement of water
in rhyolitic glasses: calibration of an infrared spectroscopictechnique. Am. Mineral. 71, 1527–1541.
Payette, C., Martin, R.F., 1986. The Harvey Volcanic Suite, NewBrunswick: I. Inclusions of magma in quartz phenocrysts. Can.Mineral. 24, 557–570.
Qin, Z., Lu, F., Anderson Jr., A.T., 1992. Diffusive reequilibrationof melt and fluid inclusions. Am. Min. 77, 565–576.
Roedder, E., 1979. Origin and significance of magmatic inclu-sions. Bull. Mineral. 102, 487–510.
Shinohara, H., 1989. Partition of chlorine compounds betweensilicate melt and hydrothermal solutions. I. Partition of NaCl–KCl. Geochim. Cosmochim. Acta 53, 2617–2630.
Silver, L.A., Ihinger, P.D., Stolper, E., 1990. The influence ofbulk composition on the speciation of water in silicate glasses.Contrib. Mineral. Petrol. 104, 142–162.
Silver, L., Stolper, E., 1989. Water in albitic glasses. J. Petrol. 30,667–709.
Skirius, Ch.M., Peterson, J.W., Anderson Jr., A.T., 1990. Homog-enizing rhyolitic glass inclusions from the Bishop Tuff. Am.Mineral. 75, 1381–1398.
Ž .Sobolev, V.S., Kostyuk, V.P. Eds. 1975. Magmatic crystalliza-tion based on study of melt inclusions. Trudy Inst. Geol.
ŽGeofiz., Sib. Otd., Akad. Nauk SSSR 264 in Russian; transla-.tion in Fluid Inclusion Res. 9, 182–253 .
Sommer, M.A., 1977. Volatiles H O, CO and CO in silicate2 2
melt inclusions in quartz phenocrysts from the rhyolitic Ban-delier air-fall and ash-flow tuff, New Mexico. J. Geol. 85,423–432.
Stolper, E., 1982. Water in silicate glasses: an infrared spectro-scopic study. Contrib. Mineral. Petrol. 81, 1–17.
Takenouchi, S., Imai, H., 1975. Glass and fluid inclusions inacidic igneous rocks from some mining areas in Japan. Econ.Geol. 70, 750–769.
Tindle, A.G., Webb, P.C., 1990. Estimation of lithium contents intrioctahedral micas using microprobe data: application to mi-cas from granitic rocks. Eur. J. Mineral. 2, 595–610.
Tischendorf, G., 1997. On Li-bearing micas: estimating Li fromelectron microprobe analyses and an improved diagram forgraphical representation. Mineral. Mag. 61, 809–834.
Tsareva, G.M., Naumov, V.B., Kovalenko, V.I., Tsepin, A.I.,Babanskiy, A.D., 1992. Melt inclusion data on the composi-tion and crystallization conditions of the Spor Mountain topazrhyolites. Geochem. Int. 29, 93–102.
( )A. Chabiron et al.rChemical Geology 175 2001 273–290290
Vincent, D., Clocchiatti, R., Langevin, Y., 1981. Premier essai dedatation d’une formation pyroclastique par la methode des´traces de fission revelees dans les inclusions vitreuses des´ ´ ´phenocristaux de quartz. C. R. Acad. Sci. Paris, Ser. II 293,´229–234.
Volfson, F.I., Ishukova, L.P., Vichniakov, V.E., Palshin, I.G.,Shleider, V.A., Dronov, I.V., 1967. Location of hydrothermalmineralizations of uranium in structural superior level. Izv.
Ž .Akad. Nauk SSSR, Geol. Ser. 11, 114–134 in Russian .Webster, J.D., 1992. Water solubility and chlorine partitioning in
Cl-rich granitic systems: effects of melt composition at 2 kbarand 8008C. Geochim. Cosmochim. Acta 56, 679–687.
Webster, J.D., Congdon, R.D., Lyons, P.C., 1995. Determiningpre-eruptive compositions of late Paleozoic magma fromkaolinized volcanic ashes: analysis of glass inclusions in quartzmicrophenocrysts from Tonsteins. Geochim. Cosmochim. Acta59, 711–720.
Webster, J.D., Duffield, W.A., 1991. Volatiles and lithophileelements in Taylor Creek Rhyolite: constraints from glassinclusion analysis. Am. Mineral. 76, 1628–1645.
Webster, J.D., Duffield, W.A., 1994. Extreme halogen abundancesin tin-rich magma of the Taylor Creek rhyolite, New Mexico.Econ. Geol. 89, 840–850.
Webster, J.D., Thomas, R., Rhede, D., Forster, H.J., Steltmann,¨R., 1997. Melt inclusions in quartz from an evolved peralumi-nous pegmatite: geochemical evidence for strong tin enrich-ment in fluorine-rich and phosphorus-rich residual liquids.Geochim. Cosmochim. Acta 61 13, 2589–2604.
Zhang, Y., Belcher, R., Ihinger, P.D., Wang, L., Xu, Z., New-mann, S., 1997. New calibration of infrared measurement ofdissolved water in rhyolitic glasses. Geochim. Cosmochim.Acta 5, 3089–3100.