Embed Size (px)
Citation preview
Chemical Geology 360–361 (2013) 74–88
Contents lists available at ScienceDirect
Chemical Geology
j ourna l homepage: www.e lsev ie r .com/ locate /chemgeo
Geochemistry of Mesozoic and Cenozoic sediments in the northernQaidam basin, northeastern Tibetan Plateau: Implications forprovenance and weathering
Xing Jian a, Ping Guan a,⁎, Wei Zhang a,b, Fan Feng a
a Key Laboratory of Orogenic Belts and Crustal Evolution, Ministry of Education, School of Earth and Space Sciences, Peking University, Beijing 100871, PR Chinab Research Institute of Petroleum Exploration & Development, PetroChina, Beijing 100083, PR China
⁎ Corresponding author at: School of Earth and SpaBeijing, 100871, PR China. Tel.: +86 10 62754113.
E-mail addresses: [email protected] (X. Jian), pguanl@
0009-2541/$ – see front matter © 2013 Elsevier B.V. All rihttp://dx.doi.org/10.1016/j.chemgeo.2013.10.011
a b s t r a c t
a r t i c l e i n f oArticle history:Received 22 March 2013Received in revised form 7 October 2013Accepted 8 October 2013Available online 17 October 2013
Editor: L. Reisberg
Keywords:Qaidam basinProvenanceChemical weatheringPaleoclimateCIASource composition model
Whole-rock geochemical data of the Mesozoic and Cenozoic sediments in the northern Qaidam basin were usedto reconstruct the provenance and chemical weathering history. Based on the fairly uniform REE patterns andtrace element ratios, both the Mesozoic (LaCN/YbCN=10.37±1.75; Eu/Eu*=0.68±0.07; Th/Sc=1.11±0.38)and Cenozoic (LaCN/YbCN = 9.77± 0.62; Eu/Eu*= 0.69 ± 0.03; Th/Sc= 0.97± 0.14) mudstones were derivedfrom a similar source area with acidic-intermediate rocks as dominant contributors, and two modeled mixturescomposed of 60% granite, 35% quartzdiorite and 5% mafic rocks, and 55% granite, 40% quartzdiorite and 5%mafic rocks can be deduced as the potential source compositions for the Mesozoic and Cenozoic sediments,respectively. This conclusion is reinforced by the mudstone major element composition and sandstonepetrography. The Early–Middle Jurassic mudstones have relatively high K-corrected CIA (84–93) and PIA(88–99) values, indicating intense chemical weathering conditions;while the Late Jurassic to Cenozoic sedimentshave variable corrected CIA (51–85) and PIA (50–92) values, implying predominantly mild to moderateweathering conditions. The chemical weathering history suggests that a warm and humid climate prevailedduring the Early–Middle Jurassic, whereas a cool and semiarid to arid climate prevailed from the Late Jurassicup to now. This dramatic transition of climate may be attributed to multiple likely factors, including therestructuring of global atmospheric circulation patterns in response to the breakup of Pangea since Late Jurassic,and the orogenic rejuvenation and high elevation of the Qilian Mountains, northeastern Tibetan Plateau.Furthermore, the decreasing chemical weathering intensity over time indicates the increase of aridification andcooling of the climate culminating in the Late Cenozoic.
© 2013 Elsevier B.V. All rights reserved.
1. Introduction
TheQaidambasin is the largest high-altitude terrestrial petroliferousbasin in the northeastern Tibetan Plateau (Hanson et al., 2001; Cao et al.,2008) (Fig. 1). An exceptionally thick Mesozoic and Cenozoic sedi-mentary succession is presented in the basin, with an average thicknessup to 8km(Xia et al., 2001). This succession preserves detailed evidenceof the Mesozoic and Cenozoic tectonic and climatic history of theQaidam basin and related regions. Several significant geologic eventssuch as the collision between Indian and Eurasian plates (Yin andHarrison, 2000; Royden et al., 2008), the formation and uplift ofthe Tibetan Plateau (Harrison et al., 1992; Tapponnier et al., 2001;Wang et al., 2008; Clark, 2011) and the aridification of Central Asia(Kutzbach et al., 1993; Molnar et al., 1993; Ramstein et al., 1997; Anet al., 2001; Dupont-Nivet et al., 2007; Katz et al., 2008; Kent-Corson
ce Sciences, Peking University,
pku.edu.cn (P. Guan).
ghts reserved.
et al., 2009; Sun et al., 2010; Zhuang et al., 2011a; Miao et al., 2012)are likely recorded in the succession.
According to the sediment budget, the Mesozoic and Cenozoicmulti-stage tectonic uplift events (e.g. Ritts and Biffi, 2001; Zhuanget al., 2011b) and related denudation and unroofing would most likelylead to significant changes of the source rocks for the sediments in theQaidam basin. Thus provenance interpretations of these sedimentscan provide useful data for understanding the composition of orogenicbelt rocks in the northeastern Tibetan Plateau. Furthermore, the resultsof provenance analysis also have industrial implications, such as helpingto evaluate the relationship between source and sink (e.g. Morton et al.,2004, 2009), discriminating sedimentary systems and depositionalareas (e.g. Jian et al., 2013) and thus facilitating oil and gas explorationof the northern Qaidam basin. Although many studies focused on therocks of the current surrounding mountains of the basin (e.g. Songet al., 2005, 2009; Zhang et al., 2008; Mattinson et al., 2009; Menoldet al., 2009; Zhang et al., 2009), detailed provenance studies of thesediments are relatively scarce (e.g. Song B. et al., 2010a; Yang et al.,2013). Sandstone petrography anddetritalmineral isotope chronologicalstudies were reported by Ritts and Biffi (2001) and Rieser et al. (2005,

Fig. 1. (A) Tectonic location of the Qaidam basin in the northeastern Tibetan Plateau (modified from Tapponnier et al., 2001) and (B) geological setting of the northern Qaidam basin andsampling locations.
75X. Jian et al. / Chemical Geology 360–361 (2013) 74–88
2006a, 2006b). Their results indicated that the Mesozoic and Cenozoicsediments in the northeastern Qaidam were derived from the QilianMountains. Rieser et al. (2005) also reported some geochemical data ofmudstones, but they provided little interpretation.
Climatic conditions can control sedimentary environments, andthus influence the sediment generation in the basin. Mudstones, inparticular, as the primary hydrocarbon source rocks, are closelyconnected with the paleoclimatic conditions. Therefore, it is crucial toevaluate the Mesozoic and Cenozoic climatic history of the Qaidambasin. Previous climatic studies of the Qaidam basin mainly concen-trated on the stable isotopes of carbonate rocks (Kent-Corson et al.,2009; Rieser et al., 2009; Zhuang et al., 2011a; Miao et al., 2012) andthe pollen composition of sediments (Wang et al., 1999, 2005, 2007;Miao et al., 2011). These studies mainly focused on the Late Cenozoicaridification, which is generally attributed to the rapid and significantuplift of the Tibetan Plateau (Kutzbach et al., 1993; Molnar et al.,1993; An et al., 2001; Kent-Corson et al., 2009) and the land–searedistribution associated with the continental collision of Indiaand Eurasia (Ramstein et al., 1997; Fluteau et al., 1999). In contrast,climatic study of pre-Late Cenozoic sediments is comparatively scarce.Furthermore, chemical weathering of the Mesozoic and Cenozoic inthe northern Qaidam basin has received less attention. In addition, astudy of chemical weathering would be a useful complement to thepaleoclimatic reconstruction.
Chemical composition of siliciclastic sedimentary rocks is controlledby several factors from source to sink including source rock composition,physical and chemical weathering, erosion, transport, deposition andburial diagenesis (Johnsson, 1993). Previous studies have demonstratedthat the major elements of sedimentary rocks can be used as indicatorsof source rock character and tectonic setting (Bhatia, 1983; Roserand Korsch, 1986, 1988). However, their abundances are altered bychemical weathering in the source region (Nesbitt, 1979; McLennan,1989), and thus the major-element compositional changes thattake place during chemical weathering can be applied to evaluate theweathering history of sedimentary rocks and then to reconstruct thepaleoclimatic conditions (Nesbitt et al., 1980; Nesbitt and Young, 1982,1984; McLennan et al., 1993; Fedo et al., 1996, 1997; Young, 1999).Furthermore, major-element geochemical data should be used withcaution in provenance analysis and weathering reconstruction dueto element mobility during diagenesis (e.g. Nesbitt and Young, 1989;
Fedo et al., 1995). In contrast, several trace elements such as high fieldstrength elements (HFSEs), transition trace elements (TTEs) and rareearth elements (REEs) are considered to be chemically immobile andpreserve the signature of source rocks (Taylor and McLennan, 1985;McLennan, 1989; McLennan et al., 1993). These trace elements areused preferentially for chemical discrimination of sediment source andtectonic setting of sedimentary basins (e.g. Bhatia and Crook, 1986;Floyd and Leveridge, 1987; McLennan et al., 1993).
In this study, we primarily presentmajor, trace andREE geochemicaldata and relevant interpretations for the Mesozoic and Cenozoicsiliciclastic sediments in the northern Qaidam basin. Petrographicanalyses of selected sandstones are also performed. The aims are to:1) deduce the provenance of these sediments and reconstruct the poten-tial source rock compositions; 2) evaluate the chemical weatheringconditions and then reconstruct paleoclimatic evolution of the Qaidambasin.
2. Geological setting
The Qaidam basin lies in the northeastern corner of the TibetanPlateau (Fig. 1A) and covers approximately 120,000 km2. It sits2.7–3 km above sea level and contains an exceptionally thick Mesozoicand Cenozoic sedimentary succession of 3–16 km. A peculiar basin–range system is present in the northeastern Tibetan Plateau (Fig. 1A).The Qaidam basin is bounded by three large mountain ranges whichstand up to 5 km above sea level. To the south are Eastern KunlunMountains, Qilian Mountains are along the east, and Altun Mountainsare to the northwest (Fig. 1A).
The formation of the current Qaidam basin is regarded as the re-sult of the convergent system in the northeastern Tibetan Plateau(Tapponnier et al., 2001). Major tectonic events of the Qaidam basinand related areas are shown in Fig. 2. The Mesozoic tectonic settingsof the basin are often linked with the evolution of the Meso-Tethys,Neo-Tethys and the Mongol–Okhotsk Ocean and the collisions ofrelated blocks (Ritts and Biffi, 2001; Kravchinsky et al., 2002; Kappet al., 2007; Gehrels et al., 2011), while the Cenozoic tectonic evolutionof the basin is closely connected with the India–Eurasia collision as wellas associated rise, thickening, shortening and lateral extrusion of theTibetan Plateau (Harrison et al., 1992; Yue and Liou, 1999; Tapponnieret al., 2001; Yin et al., 2002; Yue et al., 2003; Royden et al., 2008).

Fig. 2.Mesozoic-Cenozoic stratigraphical framework, seismic reflectors (e.g. T0, T1), depositional environment and lithological description of the northernQaidambasin andmajor tectonicevents of this area. mud: mudstone, sand: sandstone, and the front number is the number of analyzed samples in this study. For the details of depositional environment, lithologicaldescription and tectonic events and the corresponding references, see Jian (2013).
76 X. Jian et al. / Chemical Geology 360–361 (2013) 74–88
Consequently, a series of thrust fold belts of NW–SE direction in thebasin (Fig. 1B) and reverse faults along Qilian Mountains and KunlunMountainswere developed, due to the continuous convergence betweenthe Indian and Eurasian plates (Yin and Harrison, 2000; Tapponnieret al., 2001; Yin et al., 2008).
The northern Qaidam basin is closely situated next to QilianMountains to the north. It can be divided into two parts: the westernarea and the eastern area. Several anticlinal belts developed in thewestern area, including the Lenghu, Maxian and Eboliang belts(Fig. 1B). Hundreds of hydrocarbon exploration wells have been drilledon the belts by PetroChina Qinghai Oilfield Company.
3. Stratigraphy of the northern Qaidam basin
The Mesozoic and Cenozoic strata were deposited mainly in afluvial–lacustrine depositional environment (Hanson et al., 2001; Rittsand Biffi, 2001; Xia et al., 2001; Zhuang et al., 2011b; Jian, 2013).Based on the basin-wide lithostratigraphic framework and the studiesof microfossils, magnetostratigraphy and isotope geochronology (Yeet al., 1993; Sun et al., 2005; Fang et al., 2007; Wang et al., 2007;Lu and Xiong, 2009), the Mesozoic and Cenozoic succession of theQaidam basin can be divided into the stratigraphic units shown inFig. 2, together with descriptions of the lithology and depositionalenvironment of each unit. J1 and J2 strata are characterized by graycoal-bearing siliciclastic deposits (Ritts and Biffi, 2001; Wang et al.,2005), J3 and K1 strata mainly consist of red sand-dominant deposits,while the Cenozoic (E1 + 2-Q) strata are composed of mixedevaporite–carbonate–siliciclastic deposits (Feng et al., 2013; Jian, 2013).
4. Sampling and analytical procedures
Eighty-three fresh sedimentary rock samples were collected fromeight outcrop sections and thirty drill holes for hydrocarbon exploration
in the northern Qaidam basin (Fig. 1B) for whole-rock geochemicalanalyses. The details of sample locations and lithology are presentedin Tables A1 and A2 (see Appendix A). To facilitate comparison, werefer to the psammitic sediment and pelitic sediment samples assandstones and mudstones in this study, respectively. Pelitic sedimentscomprise dominant mudstone and silty mudstone with subordinatecoal-bearing mudstone, Fe-bearing mudstone and limy mudstone. Incontrast, psammitic sediments include fine-grained to coarser-grainedsandstones. The number of mudstone and sandstone samples takenfrom each stratigraphical unit is presented in Fig. 2. Sandstone samplesand related mudstone samples were collected in pairs where possible,in order to aid in evaluating the similarities and differences related tograin size.
Samples for geochemical analysis were first crushed and thenpowdered to 200 mesh with an agate pulverizer. All sandstones andmudstones were made to thin sections for petrographic observations.The modal analysis of thirteen selected sandstone samples wasperformed using Gazzi–Dickinson method (Dickinson, 1985). At least400 points were counted for each sample.
Major elementswere determined byX-rayfluorescence spectrometry(XRF, Thermo Arl Advant XP+) at the Key Laboratory of Orogenic Beltsand Crustal Evolution, Ministry of Education, Peking University. Thesample powders and lithium metaborate flux were mixed in a 1:10ratio and fused at 1050 °C in a Pt–Au crucible. The resultant melt wascooled and then a glass disk was made for XRF analyses. The valuesof Loss on ignition (LOI) were obtained by measuring the weight lossafter heating the sample at 980 °C. The detailed analytical procedureswere given in Liu et al. (2012). The accuracy was estimated to be b2%for all major element oxides (except MnO (4%)) and was monitoredusing international standards GSR-4 and GSR-5 (Table 1).
The pre-treatment of samples for trace element geochemicalanalyses was also carried out at Peking University; the procedure is asfollows. First, powders were accurately weighed (25 mg) and placed

Table 1Themeasured and certified abundances of themajor, trace and rare earth elements for theanalyzed international standards.
GSR-5 (shale) GSR-4 (quartz sandstone)
Certified Measured Certified Measured
SiO2 59.23 59.33 90.36 90.31Al2O3 18.82 18.54 3.52 3.48Fe2O3(t) 7.60 7.63 3.22 3.38CaO 0.60 0.59 0.30 0.29MgO 2.01 1.98 0.08 0.12K2O 4.16 4.16 0.65 0.53Na2O 0.35 0.35 0.06 0.07MnO 0.02 0.02 0.02 0.02TiO2 0.66 0.66 0.26 0.26P2O5 0.16 0.16 0.22 0.22LOI 5.95 5.95 1.10 1.10Li 44 43.0 11.1 10.4Be 3 2.56 0.97 0.74Sc 18.5 17.9 4.2 3.68V 87 82.2 33 32.2Co 21 25.06 6.4 8.1Ga 26 23.8 5.3 4.86Rb 205 203 29 26.8Sr 90 90.6 58 63.9Y 26 25.3 21.5 21.1Zr 96 102 214 229Nb 14.3 13.6 5.9 5.84Cs 14 13.8 1.8 1.33Ba 450 438 143 128Hf 2.9 3.04 6.6 6.65Ta 0.9 0.83 0.38 0.39Pb 8.7 8.25 7.6 7.77Th 12.8 12.3 7 6.63U 1.5 1.46 2.1 2.04La 62 58.3 21 19.6Ce 109 113 48 45.8Pr 13.6 12.8 5.4 4.74Nd 48 49.2 21 19.8Sm 8.4 8.37 4.7 4.43Eu 1.7 1.79 1.02 0.96Gd 6.7 7.21 4.5 4.87Tb 1.02 0.99 0.79 0.73Dy 5.1 5.30 4.1 4.18Ho 0.98 1.01 0.75 0.79Er 2.7 2.82 2 2.19Tm 0.43 0.39 0.32 0.30Yb 2.6 2.55 1.9 1.91Lu 0.41 0.37 0.3 0.28
The values of major elements and trace elements are in wt.% and ppm, respectively.
77X. Jian et al. / Chemical Geology 360–361 (2013) 74–88
in high-pressure-resistant Savillex Teflon beakers, with a 1:1mixture ofHF-HNO3 and heated for 24 h at 80 °C, and then evaporated. Second,1.5ml HNO3, 1.5ml HF and 0.5ml HClO4 were added respectively aftersolutionswere evaporated to nearly dry, and the beakers with solutionswere capped for digestion within a high-temperature oven at 180 °Cfor at least 48 h until the samples were completely dissolved. Finally,the solutions were diluted with 1% HNO3 to 50 ml for determination.Trace elements, including REEs, were analyzed using an ELEMENTICP-MS (Finnigan-MAT Ltd. German) at the Research Institute ofUranium Geology (Beijing). International standards of GSR-4 andGSR-5 (Table 1) were used to monitor analytical quality. The accuracywas estimated to be b10% for all trace elements except Co (19%) andBe (15%).
5. Results
5.1. Sandstone petrography
The Mesozoic and Cenozoic sandstone petrographic observationsindicate that most detrital grains are poorly to moderately sorted,angular to subangular (Fig. 3). The point-counting data of sandstonethin sections are shown in Table 2. Overall, the Mesozoic sandstones
contain relatively abundant quartz (e.g. Fig. 3A–B), with a rangevarying from 61% to 84% (in Q–F–L diagram). Feldspars, dominatedby K-feldspar, vary from 6% to 33%. Lithic fragments, composed mainlyof metamorphic lithic fragments, are the least abundant components inthese sandstones, with abundance ranging from 5% to 16% (Table 2).In comparison, the Cenozoic sandstones are rich in lithic fragments(Fig. A1 in Appendix B), with a range of 19% to 45%, while quartz andfeldspars range from 46% to 70% and from 9% to 19%, respectively(Table 2). The lithic fragments are mainly derived from metamorphicsources composed of various metasedimentary rocks, including schistand phyllite (e.g. Fig. 3C–D).
5.2. Major element composition
The major element data are given in Table A3 (see Appendix A).Overall, mudstones show high Al2O3 abundances (4.82–29.09 wt.%,av. = 16.27 wt.%) and depletion in SiO2 (16.62–65.04 wt.%, av. =52.44 wt.%), whereas sandstones display depletion in Al2O3 (4.78–12.87wt.%, av.=8.92wt.%) and enrichment in SiO2 (48.46–85.85wt.%,av. = 71.01 wt.%). Therefore, mudstones plot predominantly in theshale field and secondly in the wacke field in the binary diagrambetween SiO2/Al2O3 and Fe2O3/K2O (Herron, 1988), whereas sandstonescan be classed as litharenite, arkose and wacke and subordinatesubarkose (Fig. A2 in Appendix B). It is worth noting that J1 and J2mudstones have higher Al2O3 and lower K2O and Na2O abundances(Figs. 4B–C, 7), compared to other mudstones.
The elemental compositions of all samples were normalized to theUpper Continental Crust (UCC) (Taylor and McLennan, 1985) compo-sition and are shown in Fig. A3 (see Appendix B). The result indicatesthat most of the Mesozoic mudstones are highly depleted in Naand Ca, slightly depleted in Si and enriched in Al. Comparatively theCenozoic mudstones are moderately depleted in Na, slightly depletedin Si and show unobvious enrichment of Al (Fig. A3 in Appendix B).Some samples display distinct enrichment of Ca (e.g. Samples H2-03,YCG-05 and YCG-37b (Table A3)). In contrast, the Mesozoic andCenozoic sandstones display enrichment of Si and depletion in Al, Naand K (Fig. 4).
5.3. Trace- and rare earth element composition
The trace- and rare earth element data are given in Tables A4 and A5(see Appendix A). Representative elements and ratios grouped bystratigraphical unit are shown in Fig. 5. The UCC-normalized plots forall analyzed samples are shown in Fig. A3 (Appendix B). Generally, theanalyzed mudstones have higher abundances of trace elements thansandstones, with the exception of Sr and Ba (probably due to relativelyhigh abundances of carbonate in sandstones). And mudstones havefairly small ranges of trace element ratios such as Th/Sc and Zr/Sc,whereas sandstones have variable element ratios (Figs. 4F and 5). It isremarkable that all mudstones show similar UCC-normalized trace-and rare earth elemental patterns, while sandstones display variablepatterns (Fig. A3 in Appendix B). Furthermore, theMesozoicmudstonesshow higher abundances of HFSEs, Th, U and REEs than the Cenozoicmudstones (Figs. 4–5).
REEs were further normalized to chondrites (McDonough and Sun,1995), and for comparative purposes the REEs of Post-ArcheanAustralian Shale (PAAS) and UCC were also plotted (Fig. 6). Most ofthe samples show similar patterns to PAAS and UCC, with clear LREEenrichment (LaN/YbN = 6.2–26.2, av. = 10.1), relatively flat HREE(GdN/YbN = 1.2–2.7, av. = 1.8). All mudstones display significantnegative Eu anomalies (Eu/Eu* = 0.57–0.82, av. = 0.69), whilesandstones show both negative and positive Eu anomalies (Eu/Eu* =0.62–1.18, av.=0.84). Moreover, mudstones show higher abundancesof REEs than sandstones (Figs. 4–9), with the ranges from 67.7 to399.9 ppm (av. = 201.5 ppm), and from 41.4 to 164.3 ppm (av. =101.6ppm), respectively.

Fig. 3.Representativephotomicrographsof sandstone samples. (A–B) J1 sandstoneswith highquartz abundances fromDMGSection (A) andXYSection (B); (C) E3 litharenite fromdrillingcore ofWell L87 in Lenghu Belts, characterized bymetasedimentary fragments; (D) N22 litharenite fromdrill core ofWell B1 inMaxian Belts. Q: quartz, P: plagioclase, Ch: chert, Sch: schistfragment, Phy: phyllite fragment, Ms: muscovite, C: carbonate.
78 X. Jian et al. / Chemical Geology 360–361 (2013) 74–88
6. Discussion
The chemical composition of siliciclastic sedimentary rocks resultsfrom the combined effects of several factors during sediment produc-tion and rock formation. The most commonly documented include,(1) source rock composition and tectonic setting (Bhatia and Crook,1986; Roser and Korsch, 1988); (2) chemical weathering duringthe whole sedimentary process and outcrop exposure (Nesbitt andYoung, 1982;); (3) grain-size effects due to hydraulic sorting duringsediment transport and deposition (McLennan, 1989; McLennan et al.,1993; Cullers, 1994a, b; Singh and Rajamani, 2001); and (4) burialdiagenesis and metamorphism (Fedo et al., 1995, 1996). The latterthree factors must be evaluated before drawing conclusions on prove-nance, paleoclimate and tectonic setting of the study area (e.g. Bocket al., 1998; Roddaz et al., 2006; Schoenborn and Fedo, 2011).
Table 2Raw point-counting data of sandstone thin sections.
Sample Unit Grain size Qm Qp K P Lv Lm
DMG-04 J1 c 170 32 48 14 17 3DMG-11 J1 m 195 4 60 48 6 1XY-06 J1 m 236 4 17 9 0 4Y-1 J2 m 323 2 13 10 5 2DMG-18 J2 f 184 5 26 12 0 1BSS-03 J3 m 165 18 27 13 5 3LLH-22 K f 138 11 35 24 5 2X6-02 E3 c 123 1 11 10 2 3MB1-01a E3 m 184 19 16 16 0 4B1-02a E3 c 175 12 20 34 26 4L87-08a N1 m 132 20 18 22 6 8NC1-02a N22 f 138 4 13 30 0 3B1-05a N22 f 104 18 4 21 4 11
Qm: monocrystalline quartz, Qp: polycrystalline quartz, K: K-feldspar, P: plagioclase, Lv: volca(carbonate not included), Ms: muscovite and biotite, MC: matrix and cement (including carbL= Lv+ Lm+Ls. f: fine sandstone; m: medium sandstone; c: coarse sandstone.
a The data are from Jian et al. (2013).
6.1. Sedimentary sorting
Hydrodynamical sorting controls the transport of sediments basedon grain size, shape and density, which results in a mineralogical andthus chemical differentiation. Studies on modern river bedload andsuspended load sediments have indicated that mineral sorting withinthe water column is a first order control on the chemical compositionof sediments (e.g. Garzanti et al., 2010, 2011; Bouchez et al., 2011;Lupker et al., 2011). This leads to a strong heterogeneity of the chemicalcomposition of sediments with different grain sizes. Therefore, it isnecessary to account for the effects of sedimentary sorting beforechemical weathering and provenance interpretation based on chemicaldata of sedimentary rocks.
Generally, coarse-grained sediments contain more quartz andfeldspar and have thus a low Al/Si ratio, while fine-grained sediments
Ls Ms MC O Total counts Q% F% L%
2 3 5 138 1 460 64 20 163 2 1 152 5 486 61 33 67 2 3 198 1 517 76 8 169 5 9 121 7 524 84 6 102 1 40 226 8 514 79 16 57 0 1 270 4 540 69 15 164 5 6 169 10 427 62 24 149 35 0 189 1 411 56 10 346 8 13 40 52 394 70 11 193 0 0 93 3 406 60 17 224 4 29 70 15 400 53 14 334 11 17 150 3 400 62 19 205 0 21 79 7 373 46 9 45
nic lithic fragments, Lm: metamorphic lithic fragments, Ls: sedimentary lithic fragmentsonates), O: others (e.g. heavy minerals and opaque minerals), Q = Qm+Qp, F = K+ P,

Fig. 4. Binary diagramsof representativemajor, trace elements and elemental ratio against Al2O3. Note thedistinct negative correlation for Al2O3 vs. SiO2, the significant positive correlationfor Al2O3 vs. REE and Zr, and no correlation for Al2O3 vs. Th/Sc.
79X. Jian et al. / Chemical Geology 360–361 (2013) 74–88
tend to be enriched in phylosilicates and clay minerals that havehigher Al/Si ratios (Fig. A2). Although most sandstones and mudstonesseemingly have similar REE patterns (Fig. 6), sandstones displaycomparatively low REE and other trace element abundances (e.g. Thand Zr) and high Eu/Eu* values (0.62–1.18) (Figs. 5 and A3). Thedepletion of trace elements in sandstones is likely caused by dilutionby quartz, while the distinct Eu anomalies result from the contributionof feldspar (Schnetzler and Philpotts, 1970; Taylor and McLennan,1985). The high ∑REE in mudstones can be attributed to enrich-ment of clays, evidenced by their high Al2O3 abundances (Fig. 4D).Furthermore, sandstones have wide ranges of elemental ratios(including Eu/Eu*, Figs. 5 and 7) due to elemental concentration byseveral specific minerals (for instance, the sandstones with highabundances of plagioclase generally show high Eu/Eu* values, andthe zircon-rich sandstones have high Zr/Sc values) or placer effectswith higher and more variable heavy mineral abundances, whereasmudstones have much smaller ranges of trace element ratios (e.g. Th/Sc, La/Th, Figs. 4F, 5 and 7). The similar chondrite-normalized REEpatterns (except the Eu anomalies) of sandstones and mudstones(Figs. 5–6) suggest that both sediment groups were likely derivedfrom the same source regions. Consequently, the preceding chemicaldifferentiation between mudstones and the associated sandstones canbe attributed to the effect of physical sorting rather thandifferent sourcerocks.
6.2. Chemical weathering
The influence of chemical weathering, diagenetic K-metasomatismas well as hydrodynamic sorting on the sedimentary rocks, can bevisualized in the Al2O3–(CaO* + Na2O)–K2O (Fig. 7, A–CN–K) ternarydiagram (Nesbitt and Young, 1984; Fedo et al., 1995; Nesbitt et al.,1996). Nesbitt andYoung (1984) proposed ideal (predicted)weatheringtrends (Line 2 in Fig. 7) of plutonic and volcanic rocks based onthermodynamic and kinetic considerations. The weathering trendfirst parallels the A–CN join because plagioclase is more susceptibleto chemical weathering than K-feldspar and thus is preferentiallydestroyed (Grant, 1963; Nesbitt and Young, 1989).
Furthermore, the Chemical Index of Alteration (CIA), devised byNesbitt and Young (1982), has been widely used to quantify the degreeof chemical weathering relative to the source and to reconstructthe paleoweathering conditions of ancient mudstones (e.g. Nesbittand Young, 1984; Fedo et al., 1995, 1996; Nesbitt et al., 1996;Bock et al., 1998; Roddaz et al., 2006; Schoenborn and Fedo, 2011).CIA = [Al2O3 / (Al2O3 + CaO* + Na2O + K2O) ∗ 100] in molecularproportions, where CaO* represents CaO content in the silicate fraction.In the absence of data on the carbonate content of the sediments, itis difficult to accurately estimate the silicate CaO content. Here weaccepted the value of CaO if the mole fraction of CaO≤ Na2O. On theother hand, if CaO N Na2O, then we assumed that the moles of silicate
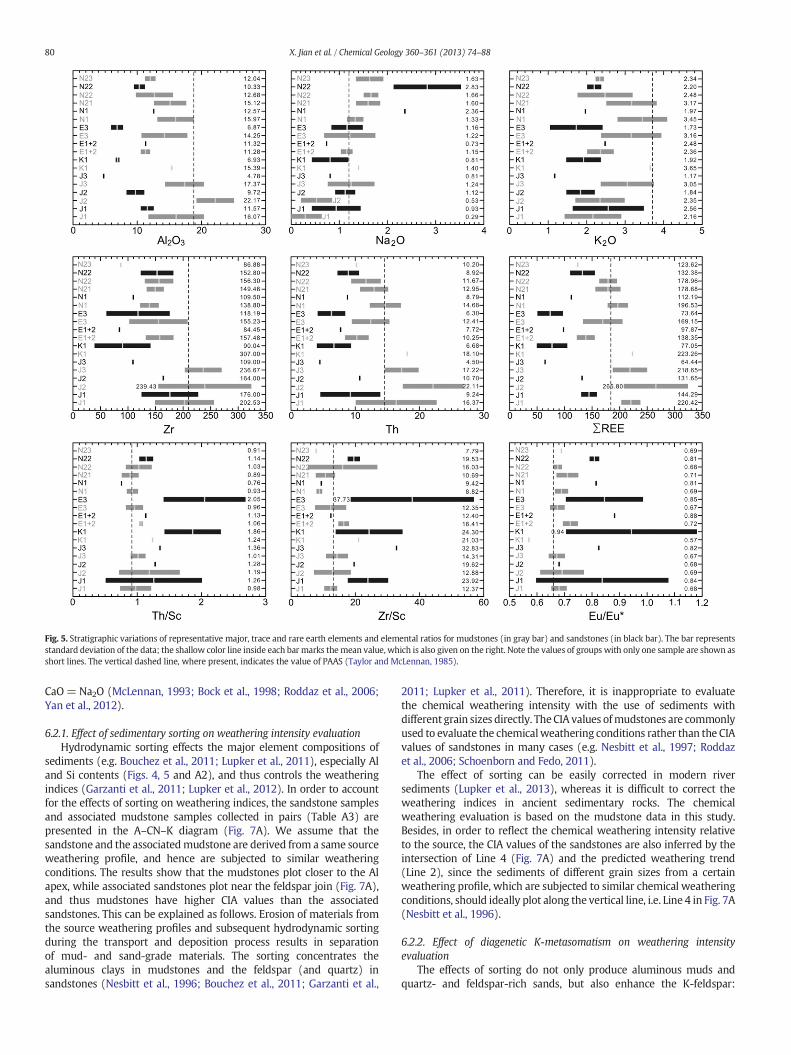
Fig. 5. Stratigraphic variations of representative major, trace and rare earth elements and elemental ratios for mudstones (in gray bar) and sandstones (in black bar). The bar representsstandard deviation of the data; the shallow color line inside each bar marks themean value, which is also given on the right. Note the values of groups with only one sample are shown asshort lines. The vertical dashed line, where present, indicates the value of PAAS (Taylor and McLennan, 1985).
80 X. Jian et al. / Chemical Geology 360–361 (2013) 74–88
CaO=Na2O (McLennan, 1993; Bock et al., 1998; Roddaz et al., 2006;Yan et al., 2012).
6.2.1. Effect of sedimentary sorting on weathering intensity evaluationHydrodynamic sorting effects the major element compositions of
sediments (e.g. Bouchez et al., 2011; Lupker et al., 2011), especially Aland Si contents (Figs. 4, 5 and A2), and thus controls the weatheringindices (Garzanti et al., 2011; Lupker et al., 2012). In order to accountfor the effects of sorting on weathering indices, the sandstone samplesand associated mudstone samples collected in pairs (Table A3) arepresented in the A–CN–K diagram (Fig. 7A). We assume that thesandstone and the associatedmudstone are derived from a same sourceweathering profile, and hence are subjected to similar weatheringconditions. The results show that the mudstones plot closer to the Alapex, while associated sandstones plot near the feldspar join (Fig. 7A),and thus mudstones have higher CIA values than the associatedsandstones. This can be explained as follows. Erosion of materials fromthe source weathering profiles and subsequent hydrodynamic sortingduring the transport and deposition process results in separationof mud- and sand-grade materials. The sorting concentrates thealuminous clays in mudstones and the feldspar (and quartz) insandstones (Nesbitt et al., 1996; Bouchez et al., 2011; Garzanti et al.,
2011; Lupker et al., 2011). Therefore, it is inappropriate to evaluatethe chemical weathering intensity with the use of sediments withdifferent grain sizes directly. TheCIA values ofmudstones are commonlyused to evaluate the chemicalweathering conditions rather than the CIAvalues of sandstones in many cases (e.g. Nesbitt et al., 1997; Roddazet al., 2006; Schoenborn and Fedo, 2011).
The effect of sorting can be easily corrected in modern riversediments (Lupker et al., 2013), whereas it is difficult to correct theweathering indices in ancient sedimentary rocks. The chemicalweathering evaluation is based on the mudstone data in this study.Besides, in order to reflect the chemical weathering intensity relativeto the source, the CIA values of the sandstones are also inferred by theintersection of Line 4 (Fig. 7A) and the predicted weathering trend(Line 2), since the sediments of different grain sizes from a certainweathering profile, which are subjected to similar chemical weatheringconditions, should ideally plot along the vertical line, i.e. Line 4 in Fig. 7A(Nesbitt et al., 1996).
6.2.2. Effect of diagenetic K-metasomatism on weathering intensityevaluation
The effects of sorting do not only produce aluminous muds andquartz- and feldspar-rich sands, but also enhance the K-feldspar:

Fig. 6.Chondrite-normalizedREE patterns of the (A)Mesozoic and (B) Cenozoic sedimentsof the northern Qaidam basin. Note the high similarity of LREE enrichment and thenegative Eu anomaly for mudstones of each group. The data of chondrite are fromMcDonough and Sun (1995).
Fig. 7.A–CN–K ternary diagrams for (A)mudstones and the associated sandstones in pairs(connected by dashed lines), all of the (B) Mesozoic and (C) Cenozoic mudstones (opensymbols) and sandstones (filled symbols). Solid line (Line 1) is the best-fit straightline through mudstones, and its intersection with feldspar (Pl-Kfs) join indicates thecomposition of unweathered source rock. Dashed lines with arrows (Line 2) are predictedweathering trends of the unweathered source rock. Line 2 emanates from theunweathered source and extends upwards parallel to the A–CN join until it interceptsthe A–K join, then follows the A–K join until the A apex. Correction for K metasomatismis made by projecting data points back onto ideal weathering pathway from K-apex(Line 3) (Fedo et al., 1995, 1997). In this study, for theMesozoic mudstones, CIAcorrected=[Al2O3 / (Al2O3+CaO*+Na2O) ∗ (100− 7.2)], for the Cenozoic mudstones, CIAcorrected=[Al2O3 / (Al2O3+CaO*+Na2O) ∗ (100−8.5)], where 7.2 and 8.5 represent the molecularpercent of K2O of the unweathered Mesozoic and Cenozoic source rocks, respectively.Note that it is not possible to make a meaningful correction for K-addition when thesamples plot above the predicted weathering trend. Vertical solid lines with arrows(Line 4) display the trends of sorting effects, therein, mudstones plot close to the A apex,while sandstones plot near the feldspar join. The inferred CIA values of sandstones arecalculated by the intersection of Lines 4 and 2. For the Mesozoic sandstones, CIAinferred=100 − 7.2 ∗ [(CaO* + Na2O + K2O) / K2O], for the Cenozoic sandstones, CIAinferred =100 − 8.5 ∗ [(CaO* + Na2O + K2O) / K2O]. The granite (Point a), quartzdiorite (Point b)and eclogite (Point c) data are from Meng and Zhang (2008), Wu et al. (2009) and Song S.et al. (2010b), respectively. Ka: kaolinite; Chl: chlorite; Gi: Gibbsite; Sm: smectite; Mu:muscovite; Pl: plagioclase; Kfs: K-feldspar.
81X. Jian et al. / Chemical Geology 360–361 (2013) 74–88
plagioclase ratios in sands relative to the source. According to the trendline of the effects of sorting in the A–CN–K diagram, sands also shouldhave greater Kfs:Pl ratios than the associated muds. However, ourinvestigation of mudstones and sandstone in pairs show that mostmudstones deviate from the trend line of the sorting effects (and thepredicted weathering trend), plot towards the K2O apex, and evenhave more potassium than the associated sandstones (Fig. 7A). Sortingof different size fractions cannot explain the distribution of the data.We advocate that diagenetic K-metasomatism (e.g. conversion ofaluminous clay minerals to illite (Fedo et al., 1995)) may stronglychange the bulk composition and results in the enrichment of K inmost mudstones (especially the Cenozoic mudstones, Fig. 7C). Thissuggestion is supported by our XRD data, which indicate that theseanalyzed mudstones have fairly low K-feldspar contents and high illitecontents (Jian, 2013). This means that the high K abundances of mostmudstones result from the contribution of illite rather than thecontribution of K-feldspar. Furthermore, it is remarkable that the degreeof K-metasomatism for J3 and the Cenozoic mudstones increased withAl content, whereasmostmudstones of J1 and J2 experienced relativelyless K-metasomatism. The differentiation may be attributed to thefeatures of formation waters (the J1 and J2 formation waters had lowK abundances (data from Qinghai Oilfield Company)).
Hence, the CIA values of mudstones must be corrected due tothe effects of K-addition. The procedure of subtracting additional Kand CIA correction is illustrated in Fig. 7B and C, and the results aregiven in Table A3. Additionally, K-corrected CIA values of mudstonesare approximately equal to the inferred CIA values of the associated

Fig. 8. K-corrected CIA (A) and PIA (B) values of mudstones of each stratigraphical unit. In this study, we classify chemical weathering conditions into three degrees: mild (CIA≈ 50–68,PIA≈ 50–69), moderate (CIA≈ 68–82, PIA≈ 69–86) and intense (CIA≈ 82–100, PIA≈ 86–100) degrees, respectively. Four modern profiles were used in comparison, including KaveriRiver silts (mild weathering) of southern India (Singh and Rajamani, 2001), Lavers Hill soil (mildweathering) of southeastern Australia (Duddy, 1980), Mallacoota Rivermuds (moderateweathering) of southeastern Australia (Nesbitt et al., 1996) and SanagaRiver laterite soils (intenseweathering), East Cameroon (Braun et al., 1997).Note that themain evolution of CIA andPIA values reveals the general decrease in chemical weathering intensity over the sedimentary record.
82 X. Jian et al. / Chemical Geology 360–361 (2013) 74–88
sandstones (Fig. 7A), which indirectly attests to the influence ofK-metasomatism.
Considering the K enrichment problem, Harnois (1988) proposed anew weathering index, i.e. Chemical Index of Weathering (CIW),which eliminates K2O from the equation (CIW = [Al2O3 / (Al2O3 +CaO*+Na2O) ∗ 100]). In the CIW calculation, the possibility that someAl may be included in K-feldpar is not taken into account, and thusthis approach is inappropriate when we want to quantify chemicalweathering intensity of K-feldspar-rich rocks. Fedo et al. (1995)proposed the Plagioclase Index of Alteration (PIA = [(Al2O3–K2O) /(Al2O3 + CaO* + Na2O–K2O) ∗ 100]) as an alternative to the CIW. Asplagioclase is abundant in the unweathered source rock (Fig. 7), thePIA is preferred for evaluation of chemical weathering intensity ofplagioclase in this study.
6.2.3. CIA and PIA values of mudstonesK-corrected CIA and PIA values of studied mudstones are shown in
Table A3 and Fig. 8. The J1 and J2 mudstones have PIA values rangingfrom 88 to 99. The CIA values of J1 and J2 mudstones range from 82to 93, with the averages of 88 (4 samples) and 87 (14 samples),respectively (Fig. 8), suggesting intense chemicalweathering conditionsduring the Early–Middle Jurassic. Some of these samples that plot near
Fig. 9. Plot of La/Th vs. Hf for source rock discrimination (after Floyd and Leveridge, 1987).Note that most samples fall into acidic arc source and some of them have high Hfabundances.
the A apex or A–K join (Fig. 7) could have undergone much moreintense weathering conditions because it is not possible to makea meaningful correction for subtracting additional K when samplesfall into this part of the A–CN–K diagram (Fig. 7). Furthermore, theenrichment of quartz and significant depletion of plagioclase and lithicfragments in most of the sandstones of J1 and J2 (Table 2) also indicateintense weathering. All these results demonstrate that the sedimentsweremainly derived from the upper zones (e.g. moderately to intenselyweathered Zone I and Zone II of Nesbitt et al., 1997) of a developedweathering profile (A weathering profile can be divided into severalzones (Nesbitt et al., 1997), therein the upper zones experience intensechemical weathering, whereas the lower zones experience relativelymild chemical weathering). We propose that their source areasexperiencedmature chemical weathering (characterized by the erosionof upper zones of a weathering profile and sediments composed ofstable detritus and aluminous clays). In contrast, the CIA values formudstones of J3, K1, E1 + 2, E3, N1 and N21 are variable and rangefrom 53 to 85 (Table A3, Fig. 8), with averages of 75, 71 (only onedatum for K1), 68, 71, 72, 67 respectively. These mudstones also havevariable PIA values ranging from 52 to 92 (Table A3, Fig. 8). Hence,both of these data suggest relatively mild to moderate chemicalweathering conditions during Late Jurassic to Early Miocene. Moreover,
Fig. 10. La–Th–Sc ternary diagram for the sediments. Note that most of the samples areplotted in the area between granite and quartzdiorite.

83X. Jian et al. / Chemical Geology 360–361 (2013) 74–88
N22 and N23mudstones have CIA values ranging from 51 to 68 (Fig. 8),with averages of 63 and 64 respectively. These mudstones also haverelatively low PIA values, with a range of 50 to 70, which impliesmild weathering conditions since Middle Miocene. Such weatheringconditions coincide with the high abundances of lithic fragments(Table 2 and Fig. 3C, D). Thus, both geochemical and petrographic dataindicate immature chemical weathering since Late Jurassic, when thesediments were derived from both upper and lower zones of a sourceweathering profile.
6.3. Provenance of the Mesozoic and Cenozoic sediments
6.3.1. PetrographyStable lithic fragments such as chert andmetaquartzite display high
abundances in the Mesozoic J1 and J2 sandstones (Fig. 3A–B), whichsuggests older sedimentary and metamorphic sources. Unstable lithic
Table 3Major, trace and rare earth elements of source end members, mixing source and average of mu
Element End members Alternative mixture Mixed source mode
Granite Quartzdiorite Eclogite 0.65G+ 0.35E 0.6G+ 0.35GD+ 0
Major oxide (wt.%)SiO2 69.56 53.87 46.85 61.61 62.93TiO2 0.45 0.96 2.40 1.13 0.72Al2O3 15.21 17.07 15.27 15.23 15.86Fe2O3 2.64 7.36 14.32 6.73 4.88MnO 0.04 0.13 0.21 0.10 0.08MgO 0.99 5.79 6.52 2.93 2.95CaO 2.65 7.95 10.06 5.24 4.87Na2O 3.88 3.48 2.62 3.44 3.68K2O 3.18 1.21 0.77 2.34 2.37P2O5 0.16 0.18 0.27 0.20 0.17LOI 1.92 3.64 0.70 1.49 2.46Total 100.68 101.62 99.99 100.44 100.97
Trace element (ppm)Y 18.87 28.80 26.50 21.54 22.72Rb 141.8 40.6 33.8 104.0 101.0Sr 507.8 336.0 319.3 441.8 438.3Ba 814.8 263.5 177.5 591.8 590.0Th 23.05 4.77 1.68 15.57 15.58U 1.82 0.74 0.90 1.50 1.40Zr 222.3 140.5 145.0 195.3 189.8Hf 5.68 3.55 3.54 4.93 4.83Nb 10.97 7.10 18.85 13.73 10.01Ta 0.76 0.45 1.27 0.94 0.68Sc 5.18 26.45 33.26 15.01 14.03Co 5.57 27.25 59.39 24.41 15.85
Rare earth element (ppm)La 54.13 21.55 15.53 40.62 40.80Ce 103.35 47.15 34.43 79.23 80.23Pr 10.93 5.61 4.62 8.72 8.75Nd 37.40 23.00 20.46 31.47 31.51Sm 6.37 5.08 5.01 5.89 5.85Eu 1.17 1.28 1.80 1.39 1.24Gd 4.82 5.10 5.43 5.03 4.95Tb 0.69 0.84 0.86 0.75 0.75Dy 3.56 5.10 5.36 4.19 4.19Ho 0.66 1.02 1.06 0.80 0.81Er 1.91 3.04 2.95 2.28 2.36Tm 0.27 0.43 0.40 0.31 0.33Yb 1.75 2.73 2.52 2.02 2.13Lu 0.26 0.41 0.37 0.30 0.32∑REE 227.3 122.3 100.8 183.0 184.2Th/Sc 4.45 0.18 0.05 1.04 1.11La/Th 2.35 4.52 9.22 2.61 2.62Co/Th 0.24 5.71 35.26 1.57 1.02Eu/Eu* 0.65 0.77 1.05 0.78 0.70LaN/YbN 22.21 5.66 4.43 14.44 13.74GdN/YbN 2.28 1.54 1.79 2.06 1.92
G: granite, QD: quartzdiorite, E: eclogite, s.d.: standard deviation. The data of granite, quartzd(2010b), respectively. The proportions of each source end member of the mixed source mode(Fig. 12A–B). A total of 66 mudstones were analyzed.
fragments such as schist and phyllite are enriched in the Cenozoicsandstones (Fig. 3C–D), implying that the dominant sources aremetasedimentary. In addition, heavyminerals such as zircon, tourmaline,garnet and epidote in these sandstones (Jian, 2013; Jian et al., 2013) alsoindicate dominant acidic-to-intermediate plutonic and metamorphicsources.
6.3.2. Trace- and rare elementsSome HFSEs (e.g. Th), TTEs (e.g. Co and Sc) and the REEs, have been
proven to be useful tools for reconstructing the source composition ofsediments (Taylor and McLennan, 1985; McLennan and Taylor, 1991).In the La/Th ratio vs. Hf diagram (Floyd and Leveridge, 1987), theuniformly low La/Th values (varying from 1.58 to 4.62, averaging2.83, with an exception of 9.67) for all analyzed samples indicate apredominant derivation from a felsic source (Fig. 9). In La–Th–Scternary diagram (Fig. 10), all samples plot close to La apex and far
dstones.
l 1 Mixed source model 2 Mudstone samples
.05E 0.55G + 0.4GD+ 0.05E Avg. mudstone(Mz)
s.d. Avg. mudstone(C)
s.d.
62.15 53.08 8.70 51.99 8.670.75 0.84 0.18 0.65 0.13
15.96 19.59 4.17 13.97 3.195.11 6.62 5.98 6.02 1.970.09 0.14 0.20 0.10 0.053.19 1.78 1.01 3.24 1.145.14 1.54 2.11 8.44 7.083.66 0.74 0.54 1.39 0.412.27 2.58 0.77 2.90 0.830.17 0.17 0.13 0.14 0.022.55 12.77 8.19 11.00 5.20
101.02 99.84 0.12 99.85 0.07
23.22 35.99 8.49 24.90 4.5795.9 138.6 36.2 126.0 36.6
429.7 137.9 84.4 249.2 171.7562.4 535.9 190.8 457.0 94.814.67 19.86 5.21 12.44 2.761.34 4.94 1.73 3.02 0.94
185.7 235.6 71.5 150.3 38.24.72 6.25 1.86 4.20 1.109.81 17.73 4.68 12.21 2.300.66 1.46 0.43 0.86 0.18
15.09 18.52 4.48 13.38 3.7716.93 18.23 10.35 18.96 5.29
39.17 53.97 12.65 35.79 6.6877.42 99.58 20.25 71.38 13.478.48 11.98 2.75 7.87 1.46
30.79 44.30 10.18 30.71 5.655.78 8.47 1.76 5.89 1.081.24 1.72 0.34 1.33 0.244.96 7.21 1.63 5.96 1.130.76 1.25 0.29 0.85 0.154.26 6.85 1.58 4.78 0.840.82 1.32 0.32 0.94 0.172.42 3.93 0.93 2.75 0.480.34 0.61 0.16 0.40 0.072.18 3.78 0.83 2.63 0.460.32 0.57 0.13 0.39 0.07
179.0 245.5 52.0 171.7 31.60.97 1.11 0.38 0.96 0.142.67 2.82 0.63 2.92 0.351.15 0.96 0.48 1.54 0.330.71 0.68 0.07 0.69 0.03
12.89 10.37 1.75 9.77 0.621.88 1.59 0.22 1.88 0.10
iorite and eclogite are from Meng and Zhang (2008), Wu et al. (2009) and Song S. et al.l were mainly determined by integration of Th/Sc vs. Eu/Eu* (Fig. 11B) and REE patterns

Fig. 11. (A) Chondrite-normalized REE patterns of potential parent-rock end members forthe sediments. Three parent-rock end members are recommended. Therein, the data ofgranite end member are the average of six granite samples from Luliangshan with thezircon SHRIMP U–Pb age of ~430Ma (Meng and Zhang, 2008); the data of quartzdioriteend member are the average of two quartzdiorite samples from Lulehe with the zirconSHRIMP U–Pb age of ~271 Ma (Wu et al., 2009); the data of mafic end member are theaverage of eighteen eclogites from Yuka (Song S. et al., 2010b) with the metamorphicage of ~433Ma. The protolith of these eclogites were regarded as basalts with magmaticcrystallization age of ~850Ma (Song S. et al., 2010b). These end members were mixed inorder to reproduce an average source area composition. (B) Plot of Th/Sc vs. Eu/Eu* formudstones. Mixing curves are divided into 10% increments. A mixture of 60% granite, 35%quartzdiorite and 5% mafic rocks, which balances Th/Sc and Eu/Eu* values of the averageof the Mesozoic mudstones, is proposed as the potential mixed source composition.Likewise, a mixture of 55% granite, 40% quartzdiorite and 5% mafic rocks is proposed asthe potential mixed source composition for the Cenozoic mudstones.
84 X. Jian et al. / Chemical Geology 360–361 (2013) 74–88
away from Sc apex which also implies a predominant felsic sourcecomposition, since Sc is rich in mafic igneous rocks (Taylor andMcLennan, 1985; McLennan et al., 1993). Most of them fall into thearea between granite (Meng and Zhang, 2008) and quartzdiorite(Wu et al., 2009), indicating the potential mixture of these rocks inthe source area. Furthermore, the strong contributions of felsic sourcerocks are supported by the REE patterns of analyzed samples, whichshow the characteristics of PAAS-like sediments (LaN/YbN = 7–15,GdN/YbN=1.0–2.0 and Eu/Eu*b0.85 (Figs. 6 and A4)).
6.3.3. Detrital zircon ages and detrital garnet chemical compositionsDetrital zircon U–Pb age spectra of sandstones in the northern
Qaidam basin are discussed elsewhere (Jian, 2013). The results showthat these detrital zircons are composed mainly of Early Paleozoic(clustered at ~400–480 Ma) and Late Paleozoic–Early Mesozoic(clustered at ~230–290 Ma) grains with subordinate Neoproterozoic(clustered at ~800–1000 Ma) and Palaeoproterozoic (clustered at~1700–2000 Ma and ~2300–2500 Ma) contributions. Previouspaleocurrent measurements indicated general southwest and westdirections prevailed in the northern Qaidam basin during the Mesozoicand Cenozoic (Ritts and Biffi, 2001; Zhuang et al., 2011b). And theintegrated provenance studies indicated that the source of thesesediments could be constrained to be within Qilian Mountains (Rittsand Biffi, 2001; Zhuang et al., 2011b; Jian et al., 2013).
Furthermore, the detrital garnets of sandstones in the northernQaidam basin are dominated by high Fe+Mn garnets and subordinatehigh Ca + Mg garnets, indicating that these detrital garnets werepredominantly derived from metasedimentary rocks and acidic-to-intermediate igneous rocks but the contribution of mafic rocks cannotbe ignored (Jian et al., 2013). However, according to the geochemicaldiscrimination diagrams (e.g. Fig. 9), evidence for a mafic source isalmost lost in the whole-rock chemical data of sediments. Thus amafic end member is also considered in the mixing model discussedbelow.
6.3.4. Mixed source composition modelPrevious studies (Cullers, 1994a, 1994b, 1995) have shown that fine-
grained sediments such as shales and siltstones are more likely to havemineralogy and chemical composition similar to their source thancoarse-grained sediments and thus they may be better indicators ofprovenance. Compared to sandstones,mudstones arewell homogenizedand display fairly uniform elemental ratios (Figs. 5, 9), implying anefficient mixing of source rocks during the sedimentary processes.Hence, in this study, the average composition of mudstones is used tomodel the mixed source composition.
Major, trace and rare element data of a variety of potential sourceswere compiled (Table 3) and used to model the relative proportions ofend members that contributed sediment to the Mesozoic and Cenozoicstrata in the northern Qaidam basin. End members used in the mixingcalculation were selected from the representative igneous rocks(or their metamorphic equivalents) in North Qiadam and South Qilianterranes which have published ages close to the detrital zircon agepeaks of the sandstones (Jian, 2013). The first end member is a~430 Ma granite exposed in the Luliangshan area (Meng and Zhang,2008), the second end member is a ~271Ma quartzdiorite exposed inthe Lulehe area (Wu et al., 2009), and the third end member is aneclogite (basalt as protolith, magmatic age of ~850 Ma) with themetamorphic age of ~433Ma (Song S. et al., 2010b) in the Yuka area.These three end members have distinct trace and rare elementcharacteristics (Table 3, Fig. 11) and thus can provide a wide range ofcompositions for identifying possible source end member proportions.
Using above-mentioned rock types as the potential sourcecontributors, it is possible to quantitatively model their proportions.The aim of the modeling is to achieve mass balance amongst the REEs,and Th/Sc ratio, both of which are sensitive to bulk source composition(Taylor and McLennan, 1985; McLennan and Taylor, 1991; Fedo et al.,
1997; Schoenborn and Fedo, 2011). Previous Cenozoic sandstoneprovenance analysis indicated that the source composition for thesediments of the northern Qaidam basin only has slight variation overtime (Jian et al., 2013). Furthermore, the analyzed samples have fairlyuniform REE patterns and trace element ratios (Figs. 6, 9). Therefore,in this study, considering the limited number of samples availablefrom each stratigraphic unit, we divide the analyzedmudstone samplesinto two groups (Fig. 11B), i.e. the Mesozoic mudstones (27 samples)and the Cenozoic mudstones (39 samples), and calculate the averagecompositions of each mudstone group (Table 3).
Amixture of 60% granite+35% quartzdiorite+5%mafic rocks (here,the mafic rock end member is represented by eclogite) is proposed asthe ideal modeled source composition for the Mesozoic sediments,because it has a similar chondrite-normalized REE pattern and Th/Scratio (and other trace element ratios) to those of the average of theMesozoic analyzed mudstones (Table 3, Fig. 12A, C). Although thecalculatedmixed source composition displays slightly lower abundancesof REEs than that of the average of mudstones (Fig. 12A, due toenrichment of clays in mudstones), it has a similar negative Eu anomalyand LaN/YbN and GdN/YbN values (Table 3, Fig. 12C). Likewise, a mixtureof 55% granite + 40% quartzdiorite + 5% mafic rocks is proposed asthe ideal composition of the source for the Cenozoic sediments(Table 3, Fig. 12B, D). Furthermore, the major element compositions of

Fig. 12. Comparison between the modeled mixed source and the average mudstone composition. Chondrite-normalized REE patterns (A, B) and trace elemental ratios (C, D) for theMesozoic (Mz) and Cenozoic (C) sediments. Note that the modeled sources display similar REE patterns and trace element ratios with the average mudstones. High abundances ofREEs in mudstones are due to enrichment of clays.
85X. Jian et al. / Chemical Geology 360–361 (2013) 74–88
themodeledmixed source (Table 3) demonstrate that themixture has aplagioclase-K-feldspar ratio of approximately 6:1, very close to thatderived from major element data of mudstones in the A–CN–K ternarydiagram (Fig. 7). This result reinforces our provenance interpretations.
Although a two-component mixture of 65% granite and 35% maficrocks (Table 3) also can generate a similar Th/Sc ratio (Th/Sc= 1.03),it has higher LaN/YbN (14.4), GdN/YbN (2.06) and Eu/Eu* (0.78) values,and hence distinctly differs from the averages of the Mesozoic andCenozoic mudstones. Furthermore, the mafic proportion (35%) of thealternative mixture does not coincide with the low content (maximumapproximately 10%) of mafic detrital components (Jian, 2013; Jian et al.,2013). Therefore, the mixture of 60% granite+35% quartzdiorite+5%mafic rocks and the mixture of 55% granite + 40% quartzdiorite + 5%mafic rocks provide more appropriate source compositions for theMesozoic and Cenozoic sediments, respectively.
6.4. Implications for paleoclimatic and tectonic evolution
Here, we reconstruct the Mesozoic and Cenozoic climatic evolutionsin the northernQaidambasin combining chemicalweathering intensity,sediment assemblage and depositional environment data, as well aspalynological data from the literature. The K-corrected CIA and PIAvalues of mudstones provide qualitative information about chemicalweathering variations over timeby plotting as a function of stratigraphicunit (Fig. 8). The details of sediment assemblage and depositionalenvironment for each stratigraphic unit are summarized in Fig. 2.
6.4.1. Early-Middle JurassicOverall, the J1 and J2 strata were deposited under warm and humid
climatic conditions. The first evidence for warmer and wetter Early-Middle Jurassic climate is provided by coal-bearing sediments (Fig. 2)with abundant higher plant fossils, suggesting open lacustrine andmeandering fluvial depositional systems (Ritts and Biffi, 2001).Secondly, this is supported by the evidence for intense chemicalweathering (Fig. 8). The labile phases would be easily eliminated(including conversion of feldspars to clay minerals) and the stablephases (e.g. quartz and chert, Fig. 3A–B) would be preserved under
these climatic conditions, which result in high CIA and PIA values formudstones (Fig. 8). These results are consistent with the dominatinghygrophyte and hygro-mesophyte in the palynological assemblagesof J1 and J2 strata (Wang et al., 2005). These authors concluded thata general warm temperate-subtropical humid climate prevailed inthe Qaidam basin in the early to middle Jurassic (Wang et al., 2005).Furthermore, J1 mudstones have slightly higher CIA and PIA valuesthan J2 mudstone (Fig. 8), which indicates that the Early Jurassic wasmore humid than the Middle Jurassic, coinciding with the results oftrace element geochemical study by Cao et al. (2012).
It is inferred that the humid climatic conditions were likely linkedwith a strong Early-Middle Jurassic monsoonal circulation, in whichTethyan-derived moisture was transported into the Qaidam basin(Robinson, 1973; Parrish et al., 1982; Hallam, 1984, 1985, 1991). Thewarm climate could be associated with an enhanced greenhouse effectand a global warming phenomenon due to an increased atmosphericCO2 content at that time (Hallam, 1985; Chandler et al., 1992; McElwainet al., 1999).
6.4.2. Late Jurassic to CenozoicIn comparison with the J1–J2 sediments, the J3–N23 strata were
deposited under relatively cool and semiarid to arid climatic conditions.The cooler and drier climate since the Late Jurassic is indicated byabundant red beds (Fig. 2), evaporate and calcic paleosol interlayers,dominant fluvial and overbank depositional systems, and the lack oforganic-rich rocks, higher plant fossils, and open lacustrine depositionalsystems (Ritts and Biffi, 2001; Zhuang et al., 2011b). Secondly, asemiarid to arid climate is suggested by the CIA and PIA indices, whichare indicative of mild to moderate chemical weathering conditions(Fig. 8). Under these climatic conditions, physical weathering processessuch as disaggregation and comminution are likely to predominate overchemical weathering to generate detrituswith amineralogy resemblingthat of the parent-rocks (e.g. metamorphic lithic fragments, Fig. 3C, D),thus resulting in comparatively low CIA and PIA values for mudstones(Fig. 8). Furthermore, the chemical weathering intensity of the LateJurassic to Cenozoic displays a decreasing trend over time (Fig. 8),implying the increase of aridification and cooling of the climate during

86 X. Jian et al. / Chemical Geology 360–361 (2013) 74–88
this stage. The drier climate during the Late Cenozoic is consistent withthe palynological data, which illustrated that the Late Cenozoicsediments (mainly from the Middle Miocene to the Quaternary) havehigher contents of xerophytic sporo-pollen (Wang et al., 1999; Sunand Wang, 2005; Miao et al., 2011).
We infer that the climatic transition starting in the Late Jurassic(from the Early-Middle Jurassic wet and warm climate to the LateJurassic–Cenozoic arid and cool climate) probably resulted from thebreakdown in the monsoonal circulation and the reorganization ofglobal atmospheric circulation patterns in response to the breakupof Pangea (Hallam, 1985; Parrish, 1985, 1992). Locally, we supportthe viewpoint of Ritts and Biffi (2001), who argued for the orogenicrejuvenation of the Qilian Mountains, thus producing a rain shadowthat led to arid conditions. The uplift of the Qilian Mountains is alsosupported by sedimentary evolution and provenance analysis results(Jian, 2013). Furthermore, the Cenozoic arid climatic conditions of theQaidam basin were likely controlled by the Paleogene dominantplanetary wind system and the Neogene and Quaternary monsoon-dominant system (Wang et al., 1999; Sun and Wang, 2005; Zhanget al., 2007a, 2007b). It has been proven that the East Asian monsoonwas markedly intensified and played a leading role in the Asian climatesince Late Cenozoic (Shi et al., 1999a, 1999b). The increase ofaridification in Central Asia controlled by the Late Cenozoic monsoon-dominant system has been regarded as an integrated result of the upliftof the Tibetan Plateau (e.g. Kutzbach et al., 1993;Molnar et al., 1993; Anet al., 2001; Kent-Corson et al., 2009), the retreat of the Paratethys andassociated variation of land–sea distribution (Ramstein et al., 1997;Fluteau et al., 1999; Zhang et al., 2007b) and the global cooling(Dupont-Nivet et al., 2007; Katz et al., 2008; Miao et al., 2012). Theseevents and the correspondingpaleoclimatic change resulted in relativelymild chemical weathering in the Qaidambasin during the Late Cenozoicand thus lower CIA and PIA values of the mudstones (Fig. 8).
7. Conclusions
This study combines sandstone petrography and major, trace-, andrare earth element geochemistry of the Mesozoic and Cenozoicsediments in the northern Qaidam basin, and yields the followingconclusions concerning the source area composition, the chemicalweathering conditions, and the paleoclimatic evolution:
1) The geochemical differences between sandstones and mudstonescan be due to the effects of sedimentary sorting rather than differentsource rock compositions. According to the fairly uniform chondrite-normalized REE patterns and trace element ratios, these sedimentsdisplay the characteristics of PAAS-like sediments, and they are likelyderived from a source area with dominant felsic bulk compositions.
2) The REE pattern and Th/Sc ratio of the Mesozoic and Cenozoicaverage mudstones are closely reproduced by mixing source rocksexposed in the Qilian Mountains in the following proportions: 60%granite+35% quartzdiorite+5%mafic rocks, and 55% granite+40%quartzdiorite + 5% mafic rocks, respectively, which indicates thatacidic-intermediate rocks were the major source contributors forthe sediments in the northern Qaidam basin. In addition, thismixture is also compatible with the major element compositionsplotted in the A–CN–K diagram.
3) The Mesozoic J1 and J2 mudstones have high K-corrected CIA andPIA values and hence experienced relatively intense chemicalweathering,which indicates awarmand humid climate. This climateof the Qaidam basin resulted in mature chemical weathering,coinciding with the high contents of stable detritus in the J1 andJ2 sandstones. The comparatively low-medium CIA and PIA valuesof J3–N23 mudstones demonstrate mild to moderate chemicalweathering conditions and thus cool and semiarid to arid climate.Additionally, the chemical weathering intensity decreased over
time, suggesting the increase of aridification and cooling of theclimate in the northern Qaidam basin.
4) The warm and humid Early-Middle Jurassic climate might berelated to a strong monsoonal circulation and a global warmingphenomenon due to an increased atmospheric CO2 content. Incontrast, the climatic transition since the Late Jurassic may beconsidered to have resulted from the restructuring of globalatmospheric circulation patterns in response to the breakup ofPangea and the orogenic rejuvenation of the Qilian Mountains.Furthermore, the arid and cool Cenozoic climate was probablycontrolled by the Paleogene planetary wind system pattern andthe Neogene and Quaternarymonsoon-dominant system. The latterresulted in the increase of aridification and thus relatively mildchemical weathering in the Qaidam basin.
Acknowledgments
This work is supported by the (973) National Basic ResearchProgram of China (Grant No. 2012CB214801), the Major National S&TProgram of China (Grant No. 2011ZX05009-002-403, 2011ZX05004-004-005) and the grants from the PetroChinaQinghai Oilfield Company.We thank Ruijuan Liu and Huan Cui for their assistance in sampling.We appreciate Libing Gu, Bin Yang, Fang Ma and Shibiao Deng fortheir help in laboratory analysis. The Editor Dr. Laurie Reisberg, thereviewer Dr. Maarten Lupker and an anonymous reviewer providedconstructive, thoughtful reviews that improved this manuscript. Weare grateful to Katie Whitcombe for her significant efforts in improvingthe English grammar of the manuscript.
Appendix A. Supplementary data
Supplementary data to this article can be found online at http://dx.doi.org/10.1016/j.chemgeo.2013.10.011.
References
An, Z., Kutzbach, J.E., Prell, W.L., Porter, S.C., 2001. Evolution of Asian monsoons andphased uplift of the Himalaya Tibetan plateau since late Miocene times. Nature 411,62–66.
Bhatia, M.R., 1983. Plate tectonics and geochemical composition of sandstones. J. Geol. 91,611–627.
Bhatia, M.R., Crook, K.A.W., 1986. Trace element characteristics of graywackes andtectonic setting discrimination of sedimentary basins. Contrib. Mineral. Petrol. 92,181–193.
Bock, B., McLennan, S.M., Hanson, G.N., 1998. Geochemistry and provenance of theMiddleOrdovician Austin GlenMember (Normanskill Formation) and the Taconian Orogenyin New England. Sedimentology 45, 635–655.
Bouchez, J., Gaillardet, J., France-Lanord, C., Maurice, L., Dutra-Maia, P., 2011. Grain sizecontrol of river suspended sediment geochemistry: clues from Amazon River depthprofiles. Geochem. Geophys. Geosyst. 12, Q03008.
Braun, J.-J., Viers, J., Dupre, B., Polve, M., Ndam, J., Muller, J.-P., 1997. Solid/liquid REEfractionation in the lateritic system of Goyoum, East Cameroon: the implicationfor the present dynamics of the soil covers of the humid tropical regions. Geochim.Cosmochim. Acta 62, 273–299.
Cao, J., Hu, K., Wang, K., Bian, L.Z., Liu, Y.T., Yang, S.Y., Wang, L.Q., Chen, Y., 2008. Possibleorigin of 25-norhopanes in Jurassic organic-poor mudstones from the northernQaidam Basin (NW China). Org. Geochem. 39, 1058–1065.
Cao, J., Wu, M., Chen, Y., Hu, K., Bian, L., Wang, L., Zhang, Y., 2012. Trace and rare earthelement geochemistry of Jurassic mudstones in the northern Qaidam Basin,northwest China. Chem. Erde Geochem. 72, 245–252.
Chandler, M.A., Rind, D., Ruedy, R., 1992. Pangaean climate during the Early Jurassic: GCMsimulations and the sedimentary record of palaeoclimate. Geol. Soc. Am. Bull. 194,543–559.
Clark, M.K., 2011. Early Tibetan Plateau uplift history eludes. Geology 39, 991–992.Cullers, R.L., 1994a. The chemical signature of source rocks in size fractions of Holocene
stream sediment derived from metamorphic rocks in the Wet Mountains region,USA. Chem. Geol. 113, 327–343.
Cullers, R.L., 1994b. The controls on the major and trace element variation of shales,siltstones, and sandstones of Pennsylvanian–Permian age from uplifted continentalblocks in Colorado to platform sediment in Kansas, USA. Geochim. Cosmochim.Acta 58, 4955–4972.
Cullers, R.L., 1995. The controls on the major- and trace-element evolution of shales,siltstones and sandstones of Ordovician to Tertiary age in the Wet Mountains region,Colorado, U.S.A. Chem. Geol. 123, 107–131.

87X. Jian et al. / Chemical Geology 360–361 (2013) 74–88
Dickinson,W.R., 1985. Interpretingprovenance relations fromdetritalmodes of sandstones.In: Zuffa, G.G. (Ed.), Provenance of Arenites. Reidel, Dordrecht, pp. 333–336.
Duddy, I.R., 1980. Redistribution and fractionation of rare-earth and other elements in aweathering profile. Chem. Geol. 30, 363–381.
Dupont-Nivet, G., Krijgsman, W., Langereis, C.G., Abels, H.A., Dai, S., Fang, X., 2007. Tibetanplateau aridification linked to global cooling at the Eocene–Oligocene transition.Nature 445, 635–638.
Fang, X., Zhang,W.,Meng, Q., Gao, J., Wang, X., King, J., Song, C., Dai, S., Miao, Y., 2007. High-resolution magnetostratigraphy of the Neogene Huaitoutala section in the easternQaidam Basin on the NE Tibetan Plateau, Qinghai Province, China and its implicationon tectonic uplift of the NE Tibetan Plateau. Earth Planet. Sci. Lett. 258, 293–306.
Fedo, C.M., Nesbitt, H.W., Young, G.M., 1995. Unraveling the effects of potassiummetasomatism in sedimentary rocks and paleosols, with implications forpaleoweathering conditions and provenance. Geology 23, 921–924.
Fedo, C.M., Eriksson, K.A., Krogstad, E.J., 1996. Geochemistry of shales from the Archean(3.0 Ga) Buhwa Greenstone Belt, Zimbabwe: implications for provenance andsource-area weathering. Geochim. Cosmochim. Acta 60, 1751–1763.
Fedo, C.M., Young, G.M., Nesbitt, H.W., 1997. Paleoclimatic control on the composition ofthe Paleoproterozoic Serpent Formation, Huronian Supergroup, Canada: a greenhouseto icehouse transition. Precambrian Res. 86, 201–223.
Feng, J., Cao, J., Hu, K., Peng, X., Chen, Y., Wang, Y., Wang, M., 2013. Dissolution and itsimpacts on reservoir formation in moderately to deeply buried strata of mixedsiliciclastic–carbonate sediments, northwestern Qaidam Basin, northwest China.Mar. Pet. Geol. 39, 124–137.
Floyd, P., Leveridge, B., 1987. Tectonic environment of the Devonian Gramscatho basin,south Cornwall: framework mode and geochemical evidence from turbiditicsandstones. J. Geol. Soc. 144, 531–540.
Fluteau, F., Ramstein, G., Besse, J., 1999. Simulating the evolution of the Asian and Africanmonsoons during the past 30 Myr using an atmospheric general circulation model.J. Geophys. Res. 104, 11995–12018.
Garzanti, E., Ando, S., France-Lanord, C., Vezzoli, G., Censi, P., Galy, V., Najman, Y., 2010.Mineralogical and chemical variability of fluvial sediments: 1. Bedload sand(Ganga–Brahmaputra, Bangladesh). Earth Planet. Sci. Lett. 299, 368–381.
Garzanti, E., Ando, S., France-Lanord, C., Censi, P., Vignola, P., Galy, V., Lupker, M., 2011.Mineralogical and chemical variability of fluvial sediments 2. Suspended-load silt(Ganga–Brahmaputra, Bangladesh). Earth Planet. Sci. Lett. 302, 107–120.
Gehrels, G., Kapp, P., DeCelles, P., Pullen, A., Blakey, R., Weislogel, A., Ding, L., Guynn, J.,Martin, A., McQuarrie, N., Yin, A., 2011. Detrital zircon geochronology of pre-Tertiarystrata in the Tibetan–Himalayan orogen. Tectonics 30, TC5016.
Grant, W.H., 1963. Weathering of stone mountain granite. In: Ingersoll, E.C. (Ed.), Claysand Clay Minerals, 11, pp. 65–73.
Hallam, A., 1984. Continental humid and arid zones during the Jurassic and Cretaceous.Palaeogeogr. Palaeoclimatol. Palaeoecol. 47, 195–223.
Hallam, A., 1985. A review of Mesozoic climates. J. Geol. Soc. Lond. 142, 433–445.Hallam, A., 1991. Jurassic climates as inferred from the sedimentary and fossil record.
Philos. Trans. R. Soc. Lond. B 341, 287–296.Hanson, A.D., Ritts, B.D., Zinniker, D., Moldowan, J.M., Biffi, U., 2001. Upper Oligocene
lacustrine source rocks and petroleum systems of the northern Qaidam basin,northwest China. AAPG Bull. 85, 601–619.
Harnois, L., 1988. The CIW index: a new chemical index of weathering. Sediment. Geol.55, 319–322.
Harrison, T.M., Copeland, P., Kidd, W.S.F., Yin, A., 1992. Raising Tibet. Science 255,1663–1670.
Herron, M.M., 1988. Geochemical classification of terrigenous sands and shales from coreor log data. J. Sediment. Petrol. 58, 820–829.
Jian, X., 2013. Controls on Mesozoic and Cenozoic sedimentary evolution of the northernQaidam basin: tectonic and climatic implications. Unpub. Ph.D. Dissertation, PekingUniversity. (In Chinese with English abstract)
Jian, X., Guan, P., Zhang, D.-W., Zhang,W., Feng, F., Liu, R.-J., Lin, S.-D., 2013. Provenance ofTertiary sandstone in the northern Qaidam basin, northeastern Tibetan Plateau:integration of framework petrography, heavymineral analysis andmineral chemistry.Sediment. Geol. 290, 109–125.
Johnsson, M.J., 1993. The system controlling the composition of clastic sediments.In: Johnsson, M.J., Basu, A. (Eds.), Processes controlling the composition of clasticsediments. Geological Society of America Special Paper, 284, pp. 1–19.
Kapp, P., DeCelles, P.G., Gehrels, G.E., Heizler, M., Ding, L., 2007. Geological records ofthe Lhasa–Qiangtang and Indo-Asian collisions in the Nima area of central Tibet.Geol. Soc. Am. Bull. 119, 917–932.
Katz, M.E., Miller, K.G., Wright, J.D., Wade, B.S., Browning, J.V., Cramer, B.S., Rosenthal, Y.,2008. Stepwise transition from the Eocene greenhouse to the Oligocene icehouse.Nat. Geosci. 1, 329–334.
Kent-Corson, M.L., Ritts, B.D., Zhuang, G., Bovet, P.M., Graham, S.A., Chamberlain, C.P.,2009. Stable isotopic constraints on the tectonic, topographic, and climatic evolutionof the northern margin of the Tibetan Plateau. Earth Planet. Sci. Lett. 282, 158–166.
Kravchinsky, V.A., Cogne, J.-P., Harbert, W.P., Kuzmin,M.I., 2002. Evolution of theMongol–Okhotsk Ocean as constrained by new palaeomagnetic data from the Mongol–Okhotsk suture zone, Siberia. Geophys. J. Int. 148, 34–57.
Kutzbach, J.E., Prell, W.L., Ruddiman, Wm.F., 1993. Sensitivity of Eurasian climate tosurface uplift of the Tibetan Plateau. J. Geol. 101, 177–190.
Liu, S., Zhang, J., Li, Q., Zhang, L., Wang, W., Yang, P., 2012. Geochemistry and U–Pb zirconages of metamorphic volcanic rocks of the Paleoproterozoic Lüliang Complex andconstraints on the evolution of the Trans-North China Orogen, North China Craton.Precambrian Res. 222–223, 173–190.
Lu, H., Xiong, S., 2009. Magnetostratigraphy of the Dahonggou section, northern QaidamBasin and its bearing on Cenozoic tectonic evolution of the Qilian Shan and AltynTagh Fault. Earth Planet. Sci. Lett. 288, 539–550.
Lupker, M., France-Lanord, C., Lave', J., Bouchez, J., Galy, V., Me'tivier, F., Gaillardet, J.,Lartiges, B., Mugnier, J.-L., 2011. A Rouse-based method to integrate the chemicalcomposition of river sediments: application to the Ganga basin. J. Geophys. Res. 116,F04012.
Lupker, M., France-Lanord, C., Galy, V., Lave', J., Gaillardet, J., Gajurel, A.P., Guilmette, C.,Rahman, M., Singh, S.K., Sinha, R., 2012. Predominant floodplain over mountainweathering of Himalayan sediments (Gangabasin). Geochim. Cosmochim. Acta 84,410–432.
Lupker, M., France-Lanord, C., Galy, V., Lavé, J., Kudrass, H., 2013. Increasing chemicalweathering in the Himalayan system since the Last Glacial Maximum. Earth Planet.Sci. Lett. 365, 243–252.
Mattinson, C.G.,Wooden, J.L., Zhang, J.X., Bird, D.K., 2009. Paragneiss zircon geochronologyand trace element geochemistry, North Qaidam HP/UHP terrane, western China.J. Asian Earth Sci. 35, 298–309.
McDonough,W.F., Sun, S.S., 1995. The composition of the earth. Chem. Geol. 120, 223–253.McElwain, J.C., Beerling, J., Woodward, F.I., 1999. Fossil plants and global warming at the
Triassic–Jurassic boundary. Science 285, 1386–1390.McLennan, S.M., 1989. Rare earth elements in sedimentary rocks: influence of provenance
and sedimentary processes. Rev. Mineral. Geochem. 21, 169–200.McLennan, S.M., 1993. Weathering and global denudation. J. Geol. 101, 295–303.McLennan, S.M., Taylor, S.R., 1991. Sedimentary rocks and crustal evolution: tectonic
setting and secular trends. J. Geol. 99, 1–21.McLennan, S.M., Hemming, S.,McDaniel, D.K., Hanson,G.N., 1993. Geochemical approaches
to sedimentation, provenance and tectonics. Geol. Soc. Am. Spec. Pap. 284, 21–40.Meng, F.C., Zhang, J.X., 2008. Contemporaneous of Early Palaeozoic granite and high
temperature metamorphism, North Qaidam Mountains, western China. Acta Petrol.Sin. 24, 1585–1594 (in Chinese with English abstract).
Menold, C.A., Manning, C.E., Yin, A., Tropper, P., Chen, X.H.,Wang, X.F., 2009.Metamorphicevolution, mineral chemistry and thermobarometry of orthogneiss hosting ultrahigh-pressure eclogites in the North Qaidam metamorphic belt, Western China. J. AsianEarth Sci. 35, 273–284.
Miao, Y., Fang, X., Herrmann, M., Wu, F., Zhang, Y., Liu, D., 2011. Miocene pollen record ofKC-1 core in the Qaidam Basin, NE Tibetan Plateau and implications for evolution ofthe East Asian monsoon. Palaeogeogr. Palaeoclimatol. Palaeoecol. 299, 30–38.
Miao, Y., Herrmann, M., Wu, F., Yan, X., Yang, S., 2012. What controlled Mid–LateMiocenelong-term aridification in Central Asia? — global cooling or Tibetan Plateau uplift:a review. Earth Sci. Rev. 112, 155–172.
Molnar, P., England, P., Joseph, M., 1993. Mantle dynamics, uplift of the Tibetan plateauand the Indian monsoon. Rev. Geophys. 31, 357–396.
Morton, A.C., Hallsworth, C.R., Chalton, B., 2004. Garnet compositions in Scottish andNorwegian basement terrains: a framework for interpretation of North Sea sandstoneprovenance. Mar. Pet. Geol. 21, 393–410.
Morton, A., Hallsworth, C., Strogen, D., Whitham, A., Fanning, M., 2009. Evolution ofprovenance in the NE Atlantic rift: the Early–Middle Jurassic succession in theHeidrun Field, Halten Terrace, offshore Mid-Norway. Mar. Pet. Geol. 26, 1100–1117.
Nesbitt, H.W., 1979. Mobility and fractionation of rare earth elements during weatheringof a granodiorite. Nature 279, 206–210.
Nesbitt, H.W., Young, G.M., 1982. Early Proterozoic climates and plate motions inferredfrom major element chemistry of lutites. Nature 299, 715–717.
Nesbitt, H.W., Young, G.M., 1984. Prediction of some weathering trends of plutonic andvolcanic rocks based on thermodynamic and kinetic considerations. J. Geol. 48,1523–1534.
Nesbitt, H.W., Young, G.M., 1989. Formation and diagenesis of weathering profiles. J. Geol.97, 129–147.
Nesbitt, H.W.,Markovics, G., Price, R.C., 1980. Chemical processes affecting alkalis and alkalineearths during continental weathering. Geochim. Cosmochim. Acta 44, 1659–1666.
Nesbitt, H.W., Young, G.M., McLennan, S.M., Keays, R.R., 1996. Effects of chemicalweathering and sorting on the petrogenesis of siliciclastic sediment, with implicationsfor provenance studies. J. Geol. 104, 525–542.
Nesbitt, H.W., Fedo, C.M., Young, G.M., 1997. Quartz and feldspar stability, steady andnon-steady-state weathering, and petrogenesis of siliciclastic sands and muds.J. Geol. 105, 173–191.
Parrish, J.T., 1985. Global paleogeography, atmospheric circulation, and rainfall in theBarremian Age (late Early Cretaceous). U.S. Geological Survey Open-File Report,85-728, p. 13.
Parrish, J.T., 1992. Jurassic climate and oceanography of the circum-Pacific region. In:Westermann, G.E.G. (Ed.), The Jurassic of the Circum-Pacific. IGCP Project 171. OxfordUniversity Press, pp. 365–379.
Parrish, J.T., Ziegler, A.M., Scotese, C.R., 1982. Rainfall patterns and the distribution of coalsand evaporites in the Mesozoic and Cenozoic. Palaeogeogr. Palaeoclimatol.Palaeoecol. 40, 67–101.
Ramstein, G., Fluteau, F., Besse, J., Joussaume, S., 1997. Effect on orogeny, plate motion andland–sea distribution on Eurasian climate change over the past 30 million years.Nature 386, 788–795.
Rieser, A.B., Neubauer, F., Liu, Y., Ge, X., 2005. Sandstone provenance of north-westernsectors of the intracontinental Cenozoic Qaidam basin, western China: tectonic vs.climatic control. Sediment. Geol. 177, 1–18.
Rieser, A.B., Liu, Y., Genser, J., Neubauer, F., Handler, R., Friedl, G., Ge, X.-H., 2006a.40Ar/39Ar ages of detrital white mica constrain the Cenozoic development of theintracontinental Qaidam Basin, China. Geol. Soc. Am. Bull. 118, 1522–1534.
Rieser, A.B., Liu, Y., Genser, J., Neubauer, F., Handler, R., Ge, X.-H., 2006b. Uniform Permian40Ar/39Ar detrital mica ages in the eastern Qaidam Basin (NW China): where is thesource? Terra Nova 18, 79–87.
Rieser, A.B., Bojar, A., Neubauer, F., Genser, J., Liu, Y., Ge, X.-H., Friedl, G., 2009. MonitoringCenozoic climate evolution of northeastern Tibet: stable isotope constraints from thewestern Qaidam Basin, China. Int. J. Earth Sci. 98, 1063–1075.

88 X. Jian et al. / Chemical Geology 360–361 (2013) 74–88
Ritts, B.D., Biffi, U., 2001. Mesozoic northeast Qaidam basin: response to contractionalreactivation of the Qilian Shan, and implications for the extent of Mesozoicintracontinental deformation in central Asia. Mem. Geol. Soc. Am. 194, 293–316.
Robinson, P.L., 1973. Palaeoclimatology and continental drift. In: Tarling, D.H., Runcorn,S.K. (Eds.), Implications of Continental Drift to the Earth Sciences, vol. 1. AcademicPress, London, pp. 449–476.
Roddaz, M., Viers, J., Brusset, S., Baby, P., Boucayrand, C., Herail, G., 2006. Controls onweathering and provenance in the Amazonian foreland basin: insights from major andtrace element geochemistry of Neogene Amazonian sediments. Chem. Geol. 226, 31–65.
Roser, B.P., Korsch, R.J., 1986. Determination of tectonic setting of sandstone–mudstonesuites using SiO2 content and K2O/Na2O ratio. J. Geol. 94, 635–650.
Roser, B.P., Korsch, R.J., 1988. Provenance signatures of sandstone–mudstone suitesdetermined using discriminant function analysis of major-element data. Chem. Geol.67, 119–139.
Royden, L.H., Burchfiel, B.C., van der Hilst, R.D., 2008. The geological evolution of theTibetan plateau. Science 321, 1054–1058.
Schnetzler, C.C., Philpotts, J.A., 1970. Partition coefficients of rare-earth elements betweenigneous matrix material and rock-forming mineral phenocrysts—II. Geochim.Cosmochim. Acta 34, 331–340.
Schoenborn, W.A., Fedo, C.M., 2011. Provenance and paleoweathering reconstruction ofthe Neoproterozoic Johnnie Formation, southeastern California. Chem. Geol. 285,231–255.
Shi, Y., Tang, M., Ma, Y., 1999a. Linkage between the second uplifting of the Qinghai-Xizang (Tibetan) Plateau and the initiation of the Asian monsoon system. Sci.China. Ser. D 42, 303–312.
Shi, Y., Li, J., Li, B., Yao, T.,Wang, S., Li, S., Cui, Z., Wang, F., Pan, B., Fang, X., Zhang, Q., 1999b.Uplift of the Tibetan Plateau and East Asia environmental change during LateCenozoic. Acta Geograph. Sin. 54, 10–20 (in Chinese with English abstract).
Singh, P., Rajamani, V., 2001. Geochemistry of the floodplain sediment of the Kaveri River,southern India. J. Sediment. Res. 71, 50–60.
Song, S.G., Zhang, L.F., Niu, Y.L., Su, L., Jian, P., Liu, D.Y., 2005. Geochronology of diamond-bearing zircons from garnet peridotite in the North Qaidam UHPM belt, NorthernTibetan Plateau: a record of complex histories from oceanic lithosphere subductionto continental collision. Earth Planet. Sci. Lett. 234, 99–118.
Song, S., Su, L., Niu, Y., Zhang, G., Zhang, L., 2009. Two types of peridotite in North QaidamUHPM belt and their tectonic implications for oceanic and continental subduction:a review. J. Asian Earth Sci. 35, 285–297.
Song, B., Zhang, K., Ji, J., Zhang, J., Chen, R., Ye, H., Wang, C., 2010a. Palaeogenesedimentary evolution in the Xitieshan–Changshanliang region, northern Qaidambasin. Sediment. Geol. Tethyan Geol. 30, 1–10 (in Chinese with English abstract).
Song, S., Su, L., Li, X., Zhang, G., Niu, Y., Zhang, L., 2010b. Tracing the 850-Ma continentalflood basalts from a piece of subducted continental crust in the North QaidamUHPM belt, NW China. Precambrian Res. 183, 805–816.
Sun, X., Wang, P., 2005. How old is the Asian monsoon system?—palaeobotanical recordsfrom China. Palaeogeogr. Palaeoclimatol. Palaeoecol. 222, 181–222.
Sun, Z., Yang, Z., Pei, J., Ge, X., Wang, X., Yang, T., Li, W., Yuan, S., 2005.Magnetostratigraphy of Paleogene sediments from northern Qaidam Basin, China:implications for tectonic uplift and block rotation in northern Tibetan plateau. EarthPlanet. Sci. Lett. 237, 635–646.
Sun, J., Ye, J., Wu, W., Ni, X., Bi, S., Zhang, Z., Liu, W., Meng, J., 2010. Late Oligocene-Miocenemid-latitude aridification andwindpatterns in theAsian interior. Geology 38, 515–518.
Tapponnier, P., Xu, Z., Roger, F., Meyer, B., Arnaud, N.,Wittlinger, G., Yang, J., 2001. Obliquestepwise rise and growth of the Tibet Plateau. Science 294, 1671–1677.
Taylor, S.R., McLennan, S.M., 1985. The Continental Crust: Its Composition and EvolutionGeoscience Texts. Blackwell Scientific Publications 312.
Wang, J., Wang, Y.J., Liu, Z.C., Li, J.Q., Xi, P., 1999. Cenozoic environmental evolution of theQaidam Basin and its implications for the uplift of the Tibetan Plateau and the dryingof central Asia. Palaeogeogr. Palaeoclimatol. Palaeoecol. 152, 37–47.
Wang, Y., Mosbrugger, V., Zhang, H., 2005. Early toMiddle Jurassic vegetation and climaticevents in theQaidamBasin, Northwest China. Palaeogeogr. Palaeoclimatol. Palaeoecol.224, 200–216.
Wang, X., Qiu, Z., Li, Q.,Wang, B., Qiu, Z., Downs,W.R., Xie, G., Xie, J., Deng, T., Takeuchi, G.T.,Tseng, Z.J., Chang, M., Liu, J., Wang, Y., Biasatti, D., Sun, Z., Fang, X., Meng, Q., 2007.Vertebrate paleontology, biostratigraphy, geochronology, and paleoenvironment ofQaidam Basin in northern Tibetan Plateau. Palaeogeogr. Palaeoclimatol. Palaeoecol.254, 363–385.
Wang, C., Zhao, X., Liu, Z., Lippert, P.C., Graham, S.A., Coe, R.S., Yi, H., Zhu, L., Liu, S., Li, Ya,2008. Constraints on the early uplift history of the Tibetan Plateau. Proc. Natl. Acad.Sci. 105, 4987–4992.
Wu, C., Wooden, J.L., Robinson, P.T., Gao, Y., Wu, S., Chen, Q., Mazdab, F.K., Mattinson, C.,2009. Geochemistry and zircon SHRIMP U–Pb dating of granitoids from the westsegment of the North Qaidam. Sci. China Ser. D Earth Sci. 52, 1771–1790.
Xia, W., Zhang, N., Yuan, X., Fan, L., Zhang, B., 2001. Cenozoic Qaidam basin, China:a stronger tectonic inversed, extensional rifted basin. AAPG Bull. 85, 715–736.
Yan, Z., Wang, Z., Yan, Q., Wang, T., Guo, X., 2012. Geochemical constraints on theprovenance and depositional setting of the Devonian Liuling Group, East QinlingMountains, Central China: implications for the tectonic evolution of the QinlingOrogenic Belt. J. Sediment. Res. 82, 9–24.
Yang, Y., Zhang, K., Xu, Y., Song, B., Zhang, J., Luo, M., Ji, J., Chen, F., Chen, R., 2013. Responseof the Neogene sedimentary paleocurrent and provenance distribution to uplift of thenortheastern Qinghai–Tibetan Plateau. Acta Geol. Sin. 87, 797–813 (in Chinese withEnglish abstract).
Ye, D., Zhong, X., Yao, Y., Yang, F., Zhang, S., Jiang, Z., Wang, Y., 1993. Tertiary Strata inChinese Petroliferous Provinces (volume I) — the General. Petroleum IndustryPress, Beijing, China (156-159 pp. (in Chinese)).
Yin, A., Harrison, T.M., 2000. Geologic evolution of the Himalayan–Tibetan orogen. Annu.Rev. Earth Planet. Sci. 28, 211–280.
Yin, A., Rumelhart, P.E., Butler, R.E., Cowgill, E., Harrison, T.M., Foster, D.A., Ingersoll, R.V.,Zhang, Q., Zhou, X.-Q., Wang, X.-F., Hanson, A., Raza, A., 2002. Tectonic history of theAltyn Tagh fault system in northern Tibet inferred from Cenozoic sedimentation.Geol. Soc. Am. Bull. 114, 1257–1295.
Yin, A., Dang, Y., Wang, L., Jiang, W., Zhou, S., Chen, X., Gehrels, G.E., McRivette, M.W.,2008. Cenozoic tectonic evolution of Qaidam basin and its surrounding regions(Part 1): the southern Qilian Shan-Nan Shan thrust belt and northern Qaidambasin. Geol. Soc. Am. Bull. 120, 813–846.
Young, G.M., 1999. Some aspects of the geochemistry, provenance and palaeoclimatologyof the Torridonian of NW Scotland. J. Geol. Soc. Lond. 156, 1097–1111.
Yue, Y., Liou, J.G., 1999. Two-stage evolution model for the Altyn Tagh fault, China.Geology 27, 227–230.
Yue, Y., Ritts, B.D., Graham, S.A., Wooden, J.L., Gehrels, G.E., Zhang, Z., 2003. Slowingextrusion tectonics: lowered estimate of post-Early Miocene slip rate for the AltynTagh fault. Earth Planet. Sci. Lett. 217, 111–122.
Zhang, Z., Wang, H., Guo, Z., Jiang, D., 2007a. Impacts of tectonic changes on thereorganization of the Cenozoic paleoclimatic patterns in China. Earth Planet. Sci. Lett.257, 622–634.
Zhang, Z., Wang, H., Guo, Z., Jiang, D., 2007b. What triggers the transition ofpalaeoenvironmental patterns in China, the Tibetan Plateau uplift or the ParatethysSea retreat? Palaeogeogr. Palaeoclimatol. Palaeoecol. 245, 317–331.
Zhang, G., Song, S., Zhang, L., Niu, Y., 2008. The subducted oceanic crust withincontinental-type UHP metamorphic belt in the North Qaidam, NW China: evidencefrom petrology, geochemistry and geochronology. Lithos 104, 99–118.
Zhang, J.-X., Mattinson, C.G., Meng, F.-C., Yang, H.-J.,Wan, Y.-S., 2009. U–Pb geochronologyof paragneisses and metabasite in the Xitieshan area, north Qaidam Mountains,western China: constraints on the exhumation of HP/UHP metamorphic rocks.J. Asian Earth Sci. 35, 245–258.
Zhuang, G., Hourigan, J.K., Koch, P.L., Ritts, B.D., Kent-Corson, M.L., 2011a. Isotopicconstraints on intensified aridity in Central Asia around 12 Ma. Earth Planet. Sci. Lett.312, 152–163.
Zhuang, G., Hourigan, J.K., Ritts, B.D., Kent-Corson, M.L., 2011b. Cenozoic multiple-phasetectonic evolution of the northern Tibetan Plateau: constraints from sedimentaryrecords from Qaidam basin, Hexi Corridor, and Subei basin, northwest China. Am.J. Sci. 311, 116–152.


![Heterogeneous ice nucleation on particles composed of ...mel.xmu.edu.cn/upload_paper/2016428104154-hhj3B4.pdf · et al., 2010]. This ice nucleation apparatus allows the exposure of](https://img.pdfslide.us/doc/110x75/5b430b277f8b9ad23b8bac77/heterogeneous-ice-nucleation-on-particles-composed-of-melxmueducnuploadpaper2016428104154-.jpg)