Embed Size (px)
Citation preview
Spreading process of the northern Mariana Trough:Rifting-spreading transition at 22�N
Toshitsugu YamazakiInstitute for Marine Resources and Environment, Geological Survey of Japan, AIST, Higashi, Tsukuba 305-8567,Japan ([email protected])
Nobukazu SeamaResearch Center for Inland Seas, Kobe University, 1-1 Rokkodai, Nada, Kobe 657-8501, Japan
Kyoko OkinoOcean Research Institute, University of Tokyo, Minamidai, Nakano, Tokyo 164-8639, Japan
Kazuya KitadaGraduate School of Science and Technology, Kobe University, Nada, Kobe 657-8501, Japan
Masato Joshima and Hirokuni OdaInstitute for Marine Resources and Environment, Geological Survey of Japan, AIST, Higashi, Tsukuba 305-8567,Japan
Jiro NakaIFREE, Japan Marine Science and Technology Center, 2-15 Natsushima, Yokosuka 237-0061, Japan
[1] We have conducted a geophysical survey of the northern Mariana Trough from 19�N to 24�N. Thetrough evolves southward from incipient rifting to seafloor spreading within this region. This study aims to
clarify the location and time of the rifting-to-spreading transition, which was controversial previously, and
processes of seafloor spreading after the transition. The new data set includes swath bathymetry with side-
scan images and magnetic vector anomaly. The mantle Bouguer gravity anomaly (MBA) was calculated
using the free-air gravity anomaly from satellite altimetry. The rifting-to-spreading transition occurs at
about 22�N, which is proved by seafloor-spreading fabric in the bathymetry, clear magnetic lineations, and
the bull’s-eye pattern in MBA. Four ridge segments separated by three nontransform discontinuities are
recognized between 19�N and 22�N. The northernmost segment has relatively abundant magma supply
compared with the other segments, which is estimated from a larger segment length, shallower axial depths
with no rift valley, and lower MBA. The next segment to the south is, on the other hand, a magma-starved
segment with a prominent rift valley. Two anomalously deep grabens (called the Central Grabens) formed
by amagmatic extension occur near the segment ends. The succession of magma-rich, magma-starved, and
normal segments with increasing distance from the volcanic arc is the same as the observation in the Lau
Basin reported by Martinez and Taylor [2002]. The magnetic anomaly revealed the detailed history of the
spreading. The seafloor spreading between 19�N and 20�N began prior to 5 Ma, and that between 20�Nand 21�300N began at about 4 Ma. Spreading half-rates in the western side of the spreading center were 2
to 3 cm/year before 2.58 Ma south of 21�300N and during the Matuyama Chron north of 21�300N, but anaverage during the Brunhes Chron is 1 cm/year or less. Orientations of the ridge axes, which range from
�20� to 0� at present, have rotated about 20� clockwise since the start of the spreading. These changes inrate and direction might be associated with changes in the motion of the Philippine Sea plate. Spreading
has been asymmetric in the northern Mariana Trough. The spreading rates of the western side of the
G3G3GeochemistryGeophysics
Geosystems
Published by AGU and the Geochemical Society
AN ELECTRONIC JOURNAL OF THE EARTH SCIENCES
GeochemistryGeophysics
Geosystems
Article
Volume 4, Number 9
12 September 2003
1075, doi:10.1029/2002GC000492
ISSN: 1525-2027
Copyright 2003 by the American Geophysical Union 1 of 18
spreading center have been significantly larger than the eastern counterpart in general. The asymmetry may
have been caused by an interaction of mantle upwelling systems under the volcanic front and the backarc
spreading center and would be a characteristic of backarc spreading.
Components: 8375 words, 10 figures, 1 table.
Keywords: Mariana Trough; spreading; rifting; magnetic anomaly; backarc basin; tectonics.
Index Terms: 3035 Marine Geology and Geophysics: Midocean ridge processes; 3005 Marine Geology and Geophysics:
Geomagnetism (1550); 3045 Marine Geology and Geophysics: Seafloor morphology and bottom photography.
Received 10 December 2002; Revised 18 June 2003; Accepted 28 July 2003; Published 12 September 2003.
Yamazaki, T., N. Seama, K. Okino, K. Kitada, M. Joshima, H. Oda, and J. Naka, Spreading process of the northern Mariana
Trough: Rifting-spreading transition at 22�N, Geochem. Geophys. Geosyst., 4(9), 1075, doi:10.1029/2002GC000492, 2003.
1. Introduction
[2] The Mariana Trough (Figure 1) is typical of
active backarc basins in the world. It is crescent-
shaped with a maximum width of about 250 km
near 18�N, located between the Mariana Ridge
(active arc) and the West Marina Ridge (remnant
arc). The Mariana trench-arc-backarc system along
the eastern margin of the Philippine Sea plate has
recently attracted a special interest as a target for
studying the operation of the Subduction Factory,
partly because the system is relatively simple; it has
grown on an oceanic crust, and sediments covering
the subducting Pacific plate are lithologically uni-
form and subducts completely. Please refer to Fryer
[1995, 1996] and Stern et al. [2003] for thorough
reviews of the Mariana trench-arc-backarc system.
[3] The northern Mariana Trough evolves south-
ward from an incipient rifting stage to a mature
backarc-spreading stage. Thus the northern Mariana
Trough provides us a rare opportunity to study
evolution processes of backarc basins. The trough
between 22�N and 24�N is in a rifting stage, and
structurally and thermally asymmetric [Yamazaki
and Murakami, 1998]. The location of the rifting-
to-spreading transition was controversial. Yamazaki
et al. [1993] inferred from magnetic total-force
anomalies and seismic profiles that seafloor spread-
ing occurs to the south of 22�N. Conversely,
Martinez et al. [1995] and Baker et al. [1996]
proposed that the Mariana Trough north of 20�Nis composed of arc lithosphere intruded by arc and
backarc-basin magmas, and defined the volcano-
tectonic zone (VTZ) where rifting and volcanism
concentrates. A series of deep half-grabens, about
5700 m at maximum in water depth, is located near
the center of the trough between 20�N and 21�N.They were considered to have been formed by
amagmatic extension during rifting, and called the
Central Grabens [Martinez et al., 1995; Stern et al.,
1996]. Martinez et al. [1995] concluded that initi-
ation of seafloor spreading occurs to the south of
the Central Grabens at 20�N. Thus prior work on
the rifting-to-spreading transition in the northern
Mariana Trough has led to different interpretations
as to its position: either 20�N or 22�N. The main
purpose of this study, then, is to clarify the position
of this transition, its relationship to the volcanic arc,
and the evolution of the back-arc region over the
past few million years using new data.
[4] Magnetic anomalies are a basic tool for study-
ing seafloor spreading. In the Mariana Trough,
however, conventional magnetic total-force anoma-
lies are not very useful because of small anomaly
amplitudes, and detailed history of the spreading
was not clarified previously. The small amplitudes
are due to the geometrical problem of the spreading
system in theMariana Trough: approximately north-
south orientation of the spreading axis in low
magnetic latitudes. Magnetic vector measurements
can overcome this problem, and high-amplitude
signals can be obtained regardless of ridge and
geomagnetic field geometries [Isezaki, 1986]. Mag-
netic vector anomalies are hence expected to be
quite useful in the Mariana Trough. In the central
Mariana Trough, Bibee et al. [1980] succeeded to
GeochemistryGeophysicsGeosystems G3G3
yamazaki et al.: mariana trough spreading 10.1029/2002GC000492
2 of 18
correlate only a few magnetic total-force anomaly
profiles between 17�300N to 18�N, and estimated a
spreading half-rate of approximately 1.5 cm/year
within 50 km (3 Ma) of the spreading axis. Recent
magnetic vector anomaly measurements around
18�N have confirmed that seafloor spreading
started at about 6 Ma [Yamazaki and Stern,
1997; Seama and Yamazaki, 1998; Iwamoto et
al., 2002]. This is consistent with the results of
the Deep Sea Drilling Project (DSDP) Leg 60: it
was estimated that the rifting began in the latest
Miocene, ca. 6 Ma, with a spreading half-rate of
2.15 cm/year [Hussong and Uyeda, 1982].
[5] In this paper, we present swath bathymetry,
magnetic vector anomalies, and gravity anomalies
in the northern Mariana Trough from 19�N to
24�N. Previously only limited areas of the Mariana
Trough, mainly along the spreading center, were
covered with swath bathymetry. It is desirable to
survey the entire trough to clarify detailed history
of evolution because spreading in small backarc
basins is usually unstable and spreading rates and
directions frequently vary with time. We have
mapped most of the trough north of 19�N. On
the basis of the new data set, we show that the
transition from rifting to seafloor spreading occurs
near 22�N, and discuss temporal and spatial
changes of spreading in ridge segments between
19�N and 22�N.
2. Data Collection and AnalysisMethods
[6] Bathymetric and magnetic data were collected
during the KR97-11, KR98-12, KR00-03, and
KR02-01 cruises of R/V Kairei, and the Y96-13
cruise of R/V Yokosuka of the Japan Marine
Figure 1. Shaded-relief topographic map of the Mariana trench-arc-backarc system and adjacent regions. A digitalgrid of global predicted seafloor topography [Smith and Sandwell, 1997] was used. Illumination from the west.
GeochemistryGeophysicsGeosystems G3G3
yamazaki et al.: mariana trough spreading 10.1029/2002GC000492yamazaki et al.: mariana trough spreading 10.1029/2002GC000492
3 of 18
Science and Technology Center. Swath bathymetry
data of the R/V Kairei cruises were collected using
a SeaBeam 2112 multinarrow-beam echo sounder,
and those of the R/V Yokosuka cruise were by a
Furuno HS-10 system. A shaded-relief topographic
map of the northern Mariana Trough between
18�300N and 24�N is displayed in Figure 2. Side-
scan images (Figure 3) were also obtained using
the SeaBeam 2112 system. Post processing of the
side-scan data, which includes grazing angle cor-
rection, low-pass filtering for destripe, on-track
pixels cut, and inverse filtering for smoothing,
was carried out using the MB-system software
[Caress and Chayes, 1995].
[7] A shipboard three-component magnetometer
system aboard each vessel was used for magnetic
vector anomaly measurements, and a proton
precession magnetometer was simultaneously
towed for magnetic total-force measurements.
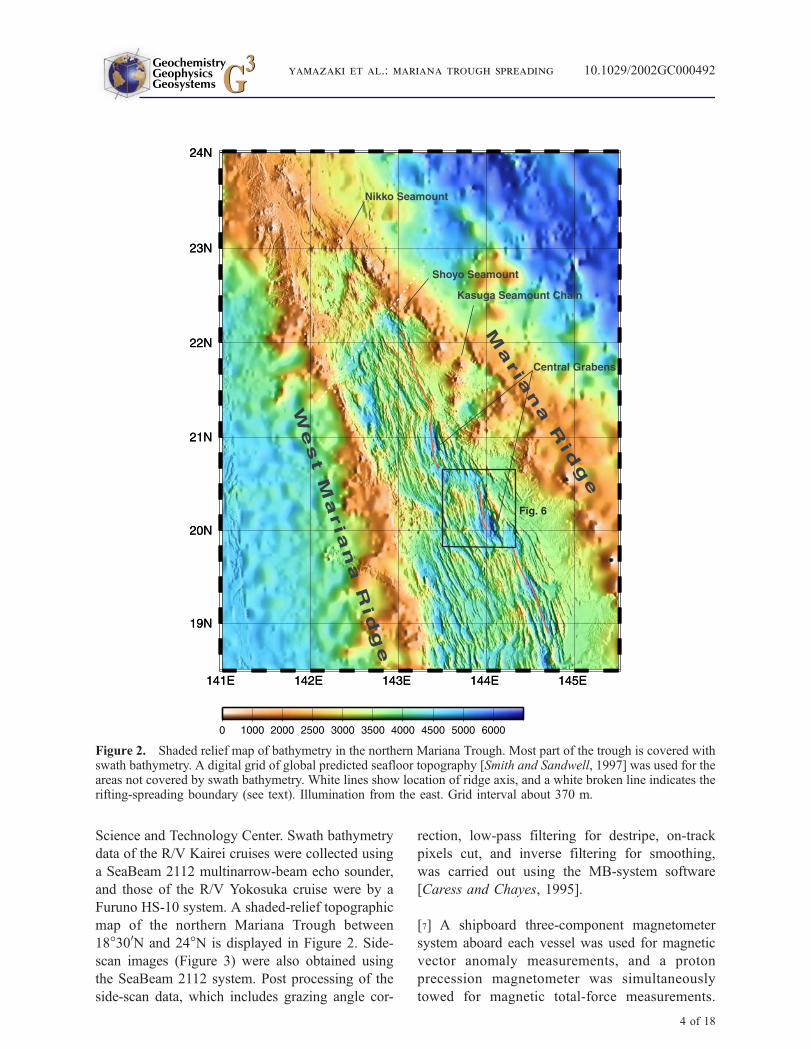
Figure 2. Shaded relief map of bathymetry in the northern Mariana Trough. Most part of the trough is covered withswath bathymetry. A digital grid of global predicted seafloor topography [Smith and Sandwell, 1997] was used for theareas not covered by swath bathymetry. White lines show location of ridge axis, and a white broken line indicates therifting-spreading boundary (see text). Illumination from the east. Grid interval about 370 m.
GeochemistryGeophysicsGeosystems G3G3
yamazaki et al.: mariana trough spreading 10.1029/2002GC000492
4 of 18
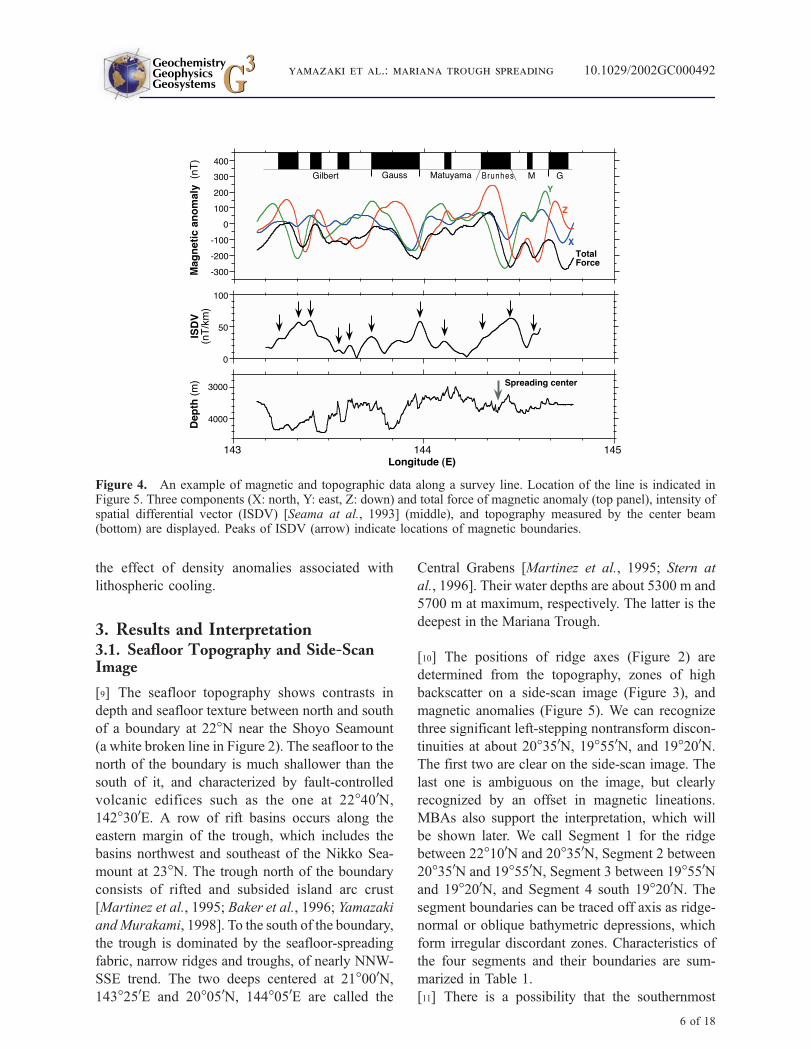
Please refer to Isezaki [1986] for the theory of
the onboard magnetic vector measurement and
Yamazaki and Stern [1997] and Yamazaki et al.
[1999] for the instruments and measurement
procedures on R/Vs Yokosuka and Kairei and
initial data processing. Magnetic vector anomalies
enabled us to identify magnetic lineations more
objectively than total-force anomalies; the mag-
netic polarities and locations of polarity bound-
aries were determined for each survey line from
variation patterns of both vertical and horizontal
components and the intensity of spatial differen-
tial vectors (ISDV) of Seama et al. [1993]. The
ISDV exhibits a peak at a magnetic boundary as
an example shown in Figure 4. The amplitudes of
the vertical and horizontal components are signif-
icantly larger than those of total-force anomalies
as expected.
[8] The mantle Bouguer gravity anomaly (MBA),
which is assumed to reflect variations in crustal
thickness and the temperature and density structure
of the mantle, was calculated using the free-air
gravity anomaly from satellite altimetry [Sandwell
and Smith, 1997] and the multinarrow-beam ba-
thymetry. Following the procedures of Parker
[1972] and Kuo and Forsyth [1988], we subtracted
attractions of seafloor topography and relief on the
crust-mantle interface. We assumed that the crust
has constant thickness of 6 km and that densities of
the seawater, crust, and mantle are 1030, 2700, and
3300 kg/m3, respectively. We did not correct for
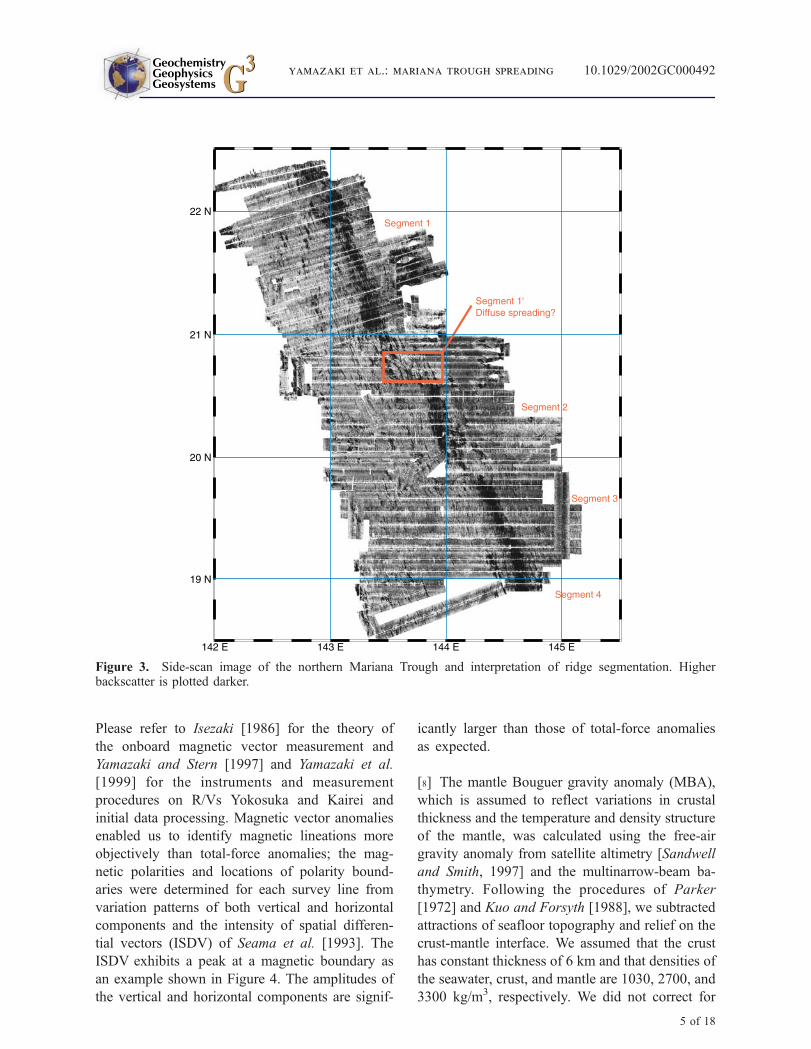
Figure 3. Side-scan image of the northern Mariana Trough and interpretation of ridge segmentation. Higherbackscatter is plotted darker.
GeochemistryGeophysicsGeosystems G3G3
yamazaki et al.: mariana trough spreading 10.1029/2002GC000492
5 of 18
the effect of density anomalies associated with
lithospheric cooling.
3. Results and Interpretation3.1. Seafloor Topography and Side-ScanImage
[9] The seafloor topography shows contrasts in
depth and seafloor texture between north and south
of a boundary at 22�N near the Shoyo Seamount
(a white broken line in Figure 2). The seafloor to the
north of the boundary is much shallower than the
south of it, and characterized by fault-controlled
volcanic edifices such as the one at 22�400N,142�300E. A row of rift basins occurs along the
eastern margin of the trough, which includes the
basins northwest and southeast of the Nikko Sea-
mount at 23�N. The trough north of the boundary
consists of rifted and subsided island arc crust
[Martinez et al., 1995; Baker et al., 1996; Yamazaki
and Murakami, 1998]. To the south of the boundary,
the trough is dominated by the seafloor-spreading
fabric, narrow ridges and troughs, of nearly NNW-
SSE trend. The two deeps centered at 21�000N,143�250E and 20�050N, 144�050E are called the
Central Grabens [Martinez et al., 1995; Stern at
al., 1996]. Their water depths are about 5300 m and
5700 m at maximum, respectively. The latter is the
deepest in the Mariana Trough.
[10] The positions of ridge axes (Figure 2) are
determined from the topography, zones of high
backscatter on a side-scan image (Figure 3), and
magnetic anomalies (Figure 5). We can recognize
three significant left-stepping nontransform discon-
tinuities at about 20�350N, 19�550N, and 19�200N.The first two are clear on the side-scan image. The
last one is ambiguous on the image, but clearly
recognized by an offset in magnetic lineations.
MBAs also support the interpretation, which will
be shown later. We call Segment 1 for the ridge
between 22�100N and 20�350N, Segment 2 between
20�350N and 19�550N, Segment 3 between 19�550Nand 19�200N, and Segment 4 south 19�200N. Thesegment boundaries can be traced off axis as ridge-
normal or oblique bathymetric depressions, which
form irregular discordant zones. Characteristics of
the four segments and their boundaries are sum-
marized in Table 1.
[11] There is a possibility that the southernmost
Figure 4. An example of magnetic and topographic data along a survey line. Location of the line is indicated inFigure 5. Three components (X: north, Y: east, Z: down) and total force of magnetic anomaly (top panel), intensity ofspatial differential vector (ISDV) [Seama at al., 1993] (middle), and topography measured by the center beam(bottom) are displayed. Peaks of ISDV (arrow) indicate locations of magnetic boundaries.
GeochemistryGeophysicsGeosystems G3G3
yamazaki et al.: mariana trough spreading 10.1029/2002GC000492
6 of 18
30 km of the Segment 1, south of 20�500N, belongsto a separate segment. A zone of high backscatter
corresponding to the ridge axis does not appear on
the side-scan image between 20�500N and 20�350N;instead a series of narrow NNW-trending streak of
high backscatter occurs in a broad area between
143�250E and 143�550E (Figure 3). This suggests
that spreading may have taken place in a diffuse
manner; it may not be focused at the axis along
143�250E but occur widely in the area east of it.
This might be an undergoing eastward ridge jump.
This disorganized spreading, if it occurs, has began
recently because the topographic fabric to the west
of the axis exhibits organized spreading, and there
is no off-axis trail extending from the possible
segment boundary at 20�500N. No offset was ob-
served in the magnetic lineations either (Figure 5).
We hence consider that the discontinuity at
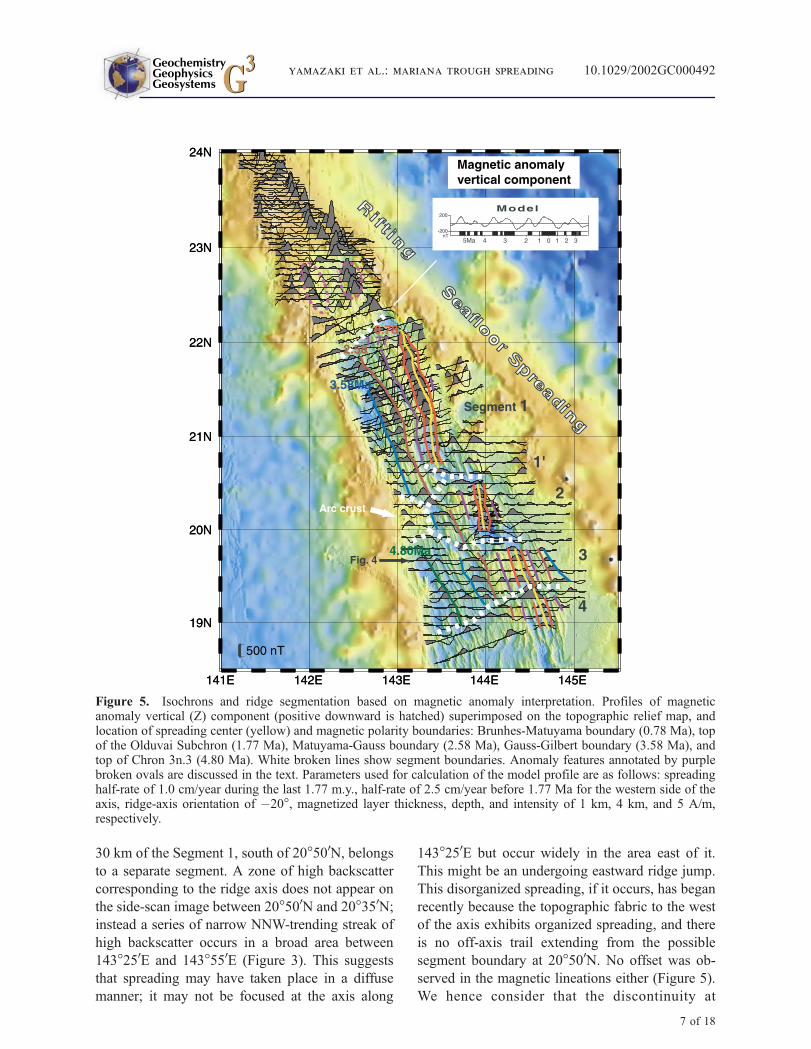
Figure 5. Isochrons and ridge segmentation based on magnetic anomaly interpretation. Profiles of magneticanomaly vertical (Z) component (positive downward is hatched) superimposed on the topographic relief map, andlocation of spreading center (yellow) and magnetic polarity boundaries: Brunhes-Matuyama boundary (0.78 Ma), topof the Olduvai Subchron (1.77 Ma), Matuyama-Gauss boundary (2.58 Ma), Gauss-Gilbert boundary (3.58 Ma), andtop of Chron 3n.3 (4.80 Ma). White broken lines show segment boundaries. Anomaly features annotated by purplebroken ovals are discussed in the text. Parameters used for calculation of the model profile are as follows: spreadinghalf-rate of 1.0 cm/year during the last 1.77 m.y., half-rate of 2.5 cm/year before 1.77 Ma for the western side of theaxis, ridge-axis orientation of �20�, magnetized layer thickness, depth, and intensity of 1 km, 4 km, and 5 A/m,respectively.
GeochemistryGeophysicsGeosystems G3G3
yamazaki et al.: mariana trough spreading 10.1029/2002GC000492
7 of 18
20�500N is less significant than the three major
discontinuities mentioned above, and call this por-
tion Subsegment 10.
[12] Segments 2, 3, and 4 show a typical morphol-
ogy of slow-spreading ridges like the Mid-Atlantic
Ridge [Ramberg et al., 1977; Severinghaus and
Macdonald, 1988; Sempere et al., 1990; Tucholke
and Lin, 1994, Gente et al., 1995]. The lengths of
the segments are from 60 to 75 km (Table 1). These
segments have well-developed rift valleys, and
neo-volcanic zones within the valleys are partly
observed, particularly in Segment 2 (Figure 6). The
floor of the valley is shallowest near the center of
each segment, and becomes deeper toward nodal
basins at the segment ends with increasing relief of
the rift valley. The rift valleys have asymmetric
structure: inside corners are higher elevation than
˚
˚
˚ ˚
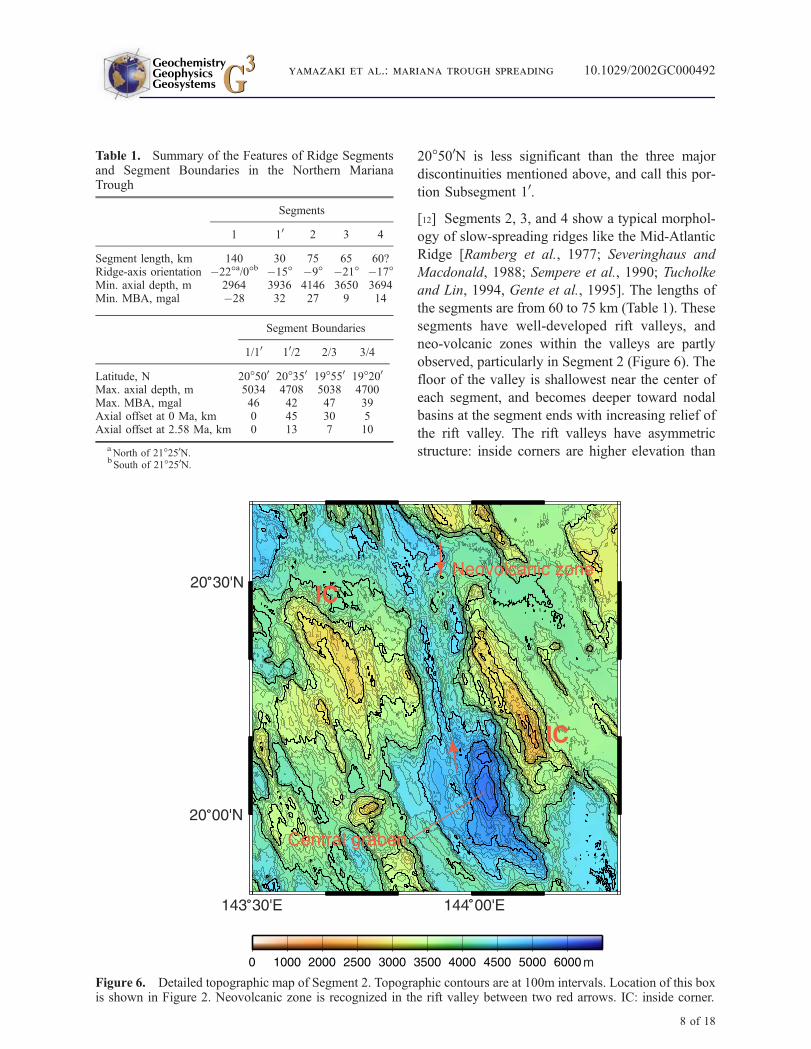
Figure 6. Detailed topographic map of Segment 2. Topographic contours are at 100m intervals. Location of this boxis shown in Figure 2. Neovolcanic zone is recognized in the rift valley between two red arrows. IC: inside corner.
Table 1. Summary of the Features of Ridge Segmentsand Segment Boundaries in the Northern MarianaTrough
Segments
1 10 2 3 4
Segment length, km 140 30 75 65 60?Ridge-axis orientation �22�a/0�b �15� �9� �21� �17�Min. axial depth, m 2964 3936 4146 3650 3694Min. MBA, mgal �28 32 27 9 14
Segment Boundaries
1/10 10/2 2/3 3/4
Latitude, N 20�500 20�350 19�550 19�200
Max. axial depth, m 5034 4708 5038 4700Max. MBA, mgal 46 42 47 39Axial offset at 0 Ma, km 0 45 30 5Axial offset at 2.58 Ma, km 0 13 7 10
aNorth of 21�250N.
bSouth of 21�250N.
GeochemistryGeophysicsGeosystems G3G3
yamazaki et al.: mariana trough spreading 10.1029/2002GC000492
8 of 18
outside corners. For example, the western flank of
the ridge Segment 2 is shallowest near the northern
segment boundary, whereas the eastern flank is
shallowest near the southern segment boundary
(Figure 6). Water depths of the rift valley of
Segment 2, about 4100 m near the segment center,
are deeper than those of Segment 3, about 3700 m
near the center. The rift valley at the southern end
of Segment 2 (the southern Central Grabens) has
particularly large relief which exceeds 3000 m: the
water depth of the valley reaches to 5700 m,
whereas the top of the inside corner is about
2500 m (Figure 6).
[13] Segment 1, on the other hand, has no clear rift
valley except for the segment ends, which morpho-
logically resembles ridges with intermediate
spreading rates [Macdonald, 1982]. Its large seg-
ment length, about 140 km excluding Subsegment
10, is also characteristic of intermediate to fast
spreading ridges [Macdonald et al., 1991]. Water
depths of the ridge axis of this segment, about
3000 m near the segment center, are shallower than
other segments. This segment may be divided into
two by a minor discontinuity at 21�250N, which is
suggested by a change of the ridge orientation,
slightly deeper ridge axis, and an off-axis trace of
the depressions from the point. The southern part of
Segment 1 near the boundary between the Subseg-
ment 10 has a prominent rift valley (the northern
Central Graben) with a shallow inside corner, which
resembles the southern end of Segment 2.
3.2. Magnetic Vector Anomaly
[14] Interpretation of magnetic polarity boundaries
is based on all three components and the ISDV,
although only vertical component anomalies are
shown in Figure 5. The anomalies are somewhat
skewed, and thus positive vertical-component
anomaly does not exactly correspond to normal-
polarity magnetization, as shown by a forward
model in Figure 5. This is because azimuths of
the ridge axis more or less deflect westward from
the north. The magnetic anomaly patterns can be
correlated to the polarity reversal sequence from
the Brunhes Chron (the last 0.78 m.y., hereafter
based on the timescale of Cande and Kent [1995])
to the Gilbert Chron (3.58 to 5.89 Ma). Even
shorter polarity subchrons in the timescale fit the
anomaly patterns well, although only isochrons
that correspond to the major polarity boundaries
are displayed in Figure 5. For example, the positive
anomalies in the vertical component between the
isochrons of 2.58 and 3.58 Ma (the end and
beginning of the Gauss Chron) consist of two
peaks (Figure 5), which reflect the presence of
short reversed subchrons (C2An.1r and C2An.2r)
in the middle of the Gauss Chron. Further, the two
minor peaks between the isochrons of 3.58 Ma
(Gauss/Gilbert boundary) and 4.80 Ma (top of
C3n.3n) in Segment 3 would correspond to the
two normal subchrons (C3n.1n and C3n.2n) in the
Gilbert Chron. The variation patterns are identical
to those near 18�N [Yamazaki and Stern, 1997;
Iwamoto et al., 2002], where organized seafloor
spreading is believed to take place.
[15] Locations of ridge-axis discontinuities at pres-
ent and their changes in the past can be known from
offsets of the magnetic anomaly isochrons, and such
information was used for identifying the ridge seg-
ments mentioned in the previous section. No dis-
placement inmagnetic lineations is recognized at the
boundary between Segment 1 and Subsegment 10.
In the zone to the east of the ridge axis of the
Subsegment 10, magnetic lineations older than the
Brunhes Chron are obscure. This is consistent with
the idea of diffuse spreading there. The length of
Segment 3 has decreased with time; it was 110 km at
4.8 Ma but now 65 km. Magnetic lineations are
disrupted at a block in the western margin of the
trough between 19�500N and 20�200N. The block
has small volcanoes and no spreading fabric. We
estimate that it consists of rifted arc crust.
[16] The identification of magnetic lineations
revealed spatial and temporal variations of spread-
ing rates, directions, and initiation of seafloor
spreading. Seafloor spreading of Segment 3, be-
tween 19�N and 20�N, started a little prior to 5 Ma,
which was extrapolated from the oldest magnetic
isochron identified (4.8 Ma) and its distance from
the West Mariana Ridge. Segments 1 and 2 began
spreading at about 4 Ma, more than 1 m.y. after the
initiation of Segment 3. It is estimated that the two
segments between 20�00N and 21�250N started
spreading simultaneously without northward prop-
GeochemistryGeophysicsGeosystems G3G3
yamazaki et al.: mariana trough spreading 10.1029/2002GC000492
9 of 18
agation of the spreading, because the 3.58 Ma
isochron is almost parallel to the West Mariana
Ridge. In the northern part of Segment 1, north of
21�250N, the spreading started during the Gauss
Chron. The age is younger than the southern part of
this segment, and hence northward propagation is
suggested here. Recent magnetic vector measure-
ments have confirmed that the central Mariana
Trough around 18�N began seafloor spreading at
about 6 Ma [Seama and Yamazaki, 1998; Iwamoto
et al., 2002]. These observations indicate that the
start of the seafloor spreading becomes later
according as the trough narrows northward. The
northward propagation of the spreading was step-
wise, but not continuous in general.
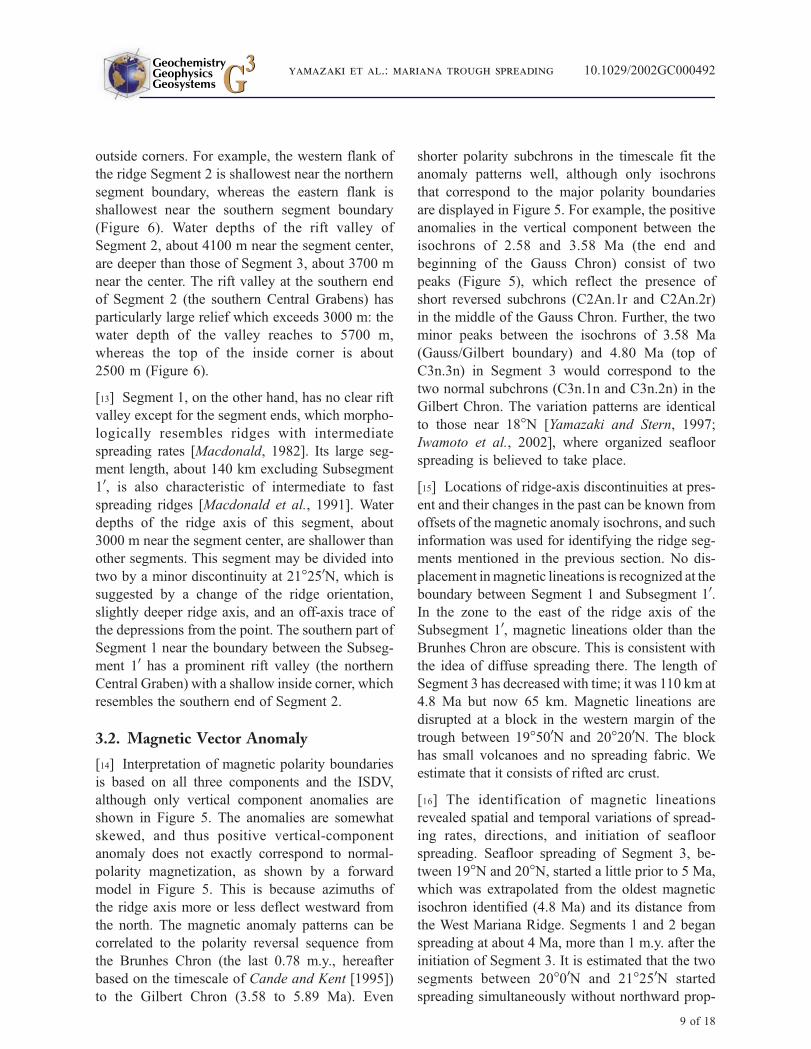
[17] The magnetic lineations show that the spread-
ing has been asymmetric in the northern Mariana
Trough. Spreading rates of the western side of the
spreading center are much larger than the eastern
counterpart in general (Figure 7), although mag-
netic lineations of the eastern side are not as clear
as the western side partly because of volcanic
overprints such as the Kasuga Seamount Chain
(Figure 2). An exception is the spreading during
the Brunhes Chron in Segment 2, where the eastern
side is faster. The asymmetry of the spreading in
the Mariana Trough is also derived from the fact
that the location of the spreading center is not at the
center of the trough but biased toward the volcanic
arc. The asymmetry is observed also in the central
and southern part of the Mariana Trough [Iwamoto
et al., 2002; Seama et al., 2002].
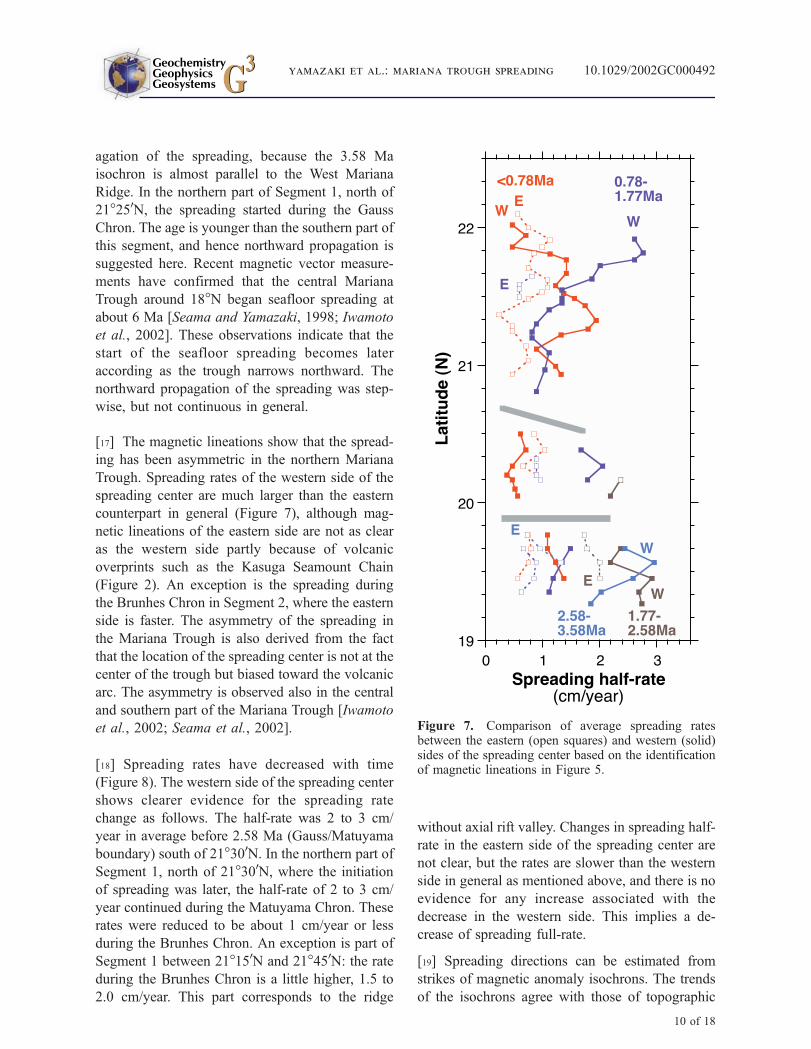
[18] Spreading rates have decreased with time
(Figure 8). The western side of the spreading center
shows clearer evidence for the spreading rate
change as follows. The half-rate was 2 to 3 cm/
year in average before 2.58 Ma (Gauss/Matuyama
boundary) south of 21�300N. In the northern part of
Segment 1, north of 21�300N, where the initiation
of spreading was later, the half-rate of 2 to 3 cm/
year continued during the Matuyama Chron. These
rates were reduced to be about 1 cm/year or less
during the Brunhes Chron. An exception is part of
Segment 1 between 21�150N and 21�450N: the rateduring the Brunhes Chron is a little higher, 1.5 to
2.0 cm/year. This part corresponds to the ridge
without axial rift valley. Changes in spreading half-
rate in the eastern side of the spreading center are
not clear, but the rates are slower than the western
side in general as mentioned above, and there is no
evidence for any increase associated with the
decrease in the western side. This implies a de-
crease of spreading full-rate.
[19] Spreading directions can be estimated from
strikes of magnetic anomaly isochrons. The trends
of the isochrons agree with those of topographic
Figure 7. Comparison of average spreading ratesbetween the eastern (open squares) and western (solid)sides of the spreading center based on the identificationof magnetic lineations in Figure 5.
GeochemistryGeophysicsGeosystems G3G3
yamazaki et al.: mariana trough spreading 10.1029/2002GC000492
10 of 18
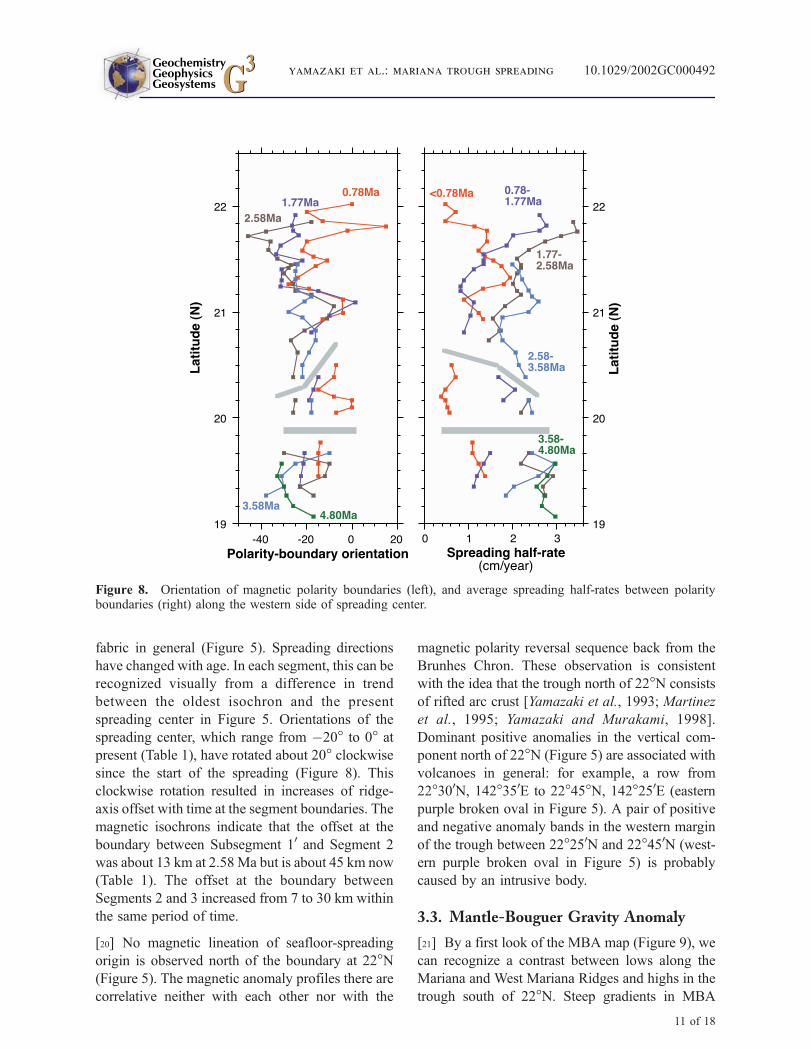
fabric in general (Figure 5). Spreading directions
have changed with age. In each segment, this can be
recognized visually from a difference in trend
between the oldest isochron and the present
spreading center in Figure 5. Orientations of the
spreading center, which range from �20� to 0� atpresent (Table 1), have rotated about 20� clockwisesince the start of the spreading (Figure 8). This
clockwise rotation resulted in increases of ridge-
axis offset with time at the segment boundaries. The
magnetic isochrons indicate that the offset at the
boundary between Subsegment 10 and Segment 2
was about 13 km at 2.58 Ma but is about 45 km now
(Table 1). The offset at the boundary between
Segments 2 and 3 increased from 7 to 30 km within
the same period of time.
[20] No magnetic lineation of seafloor-spreading
origin is observed north of the boundary at 22�N(Figure 5). The magnetic anomaly profiles there are
correlative neither with each other nor with the
magnetic polarity reversal sequence back from the
Brunhes Chron. These observation is consistent
with the idea that the trough north of 22�N consists
of rifted arc crust [Yamazaki et al., 1993; Martinez
et al., 1995; Yamazaki and Murakami, 1998].
Dominant positive anomalies in the vertical com-
ponent north of 22�N (Figure 5) are associated with
volcanoes in general: for example, a row from
22�300N, 142�350E to 22�45�N, 142�250E (eastern
purple broken oval in Figure 5). A pair of positive
and negative anomaly bands in the western margin
of the trough between 22�250N and 22�450N (west-
ern purple broken oval in Figure 5) is probably
caused by an intrusive body.
3.3. Mantle-Bouguer Gravity Anomaly
[21] By a first look of the MBA map (Figure 9), we
can recognize a contrast between lows along the
Mariana and West Mariana Ridges and highs in the
trough south of 22�N. Steep gradients in MBA
Figure 8. Orientation of magnetic polarity boundaries (left), and average spreading half-rates between polarityboundaries (right) along the western side of spreading center.
GeochemistryGeophysicsGeosystems G3G3
yamazaki et al.: mariana trough spreading 10.1029/2002GC000492
11 of 18
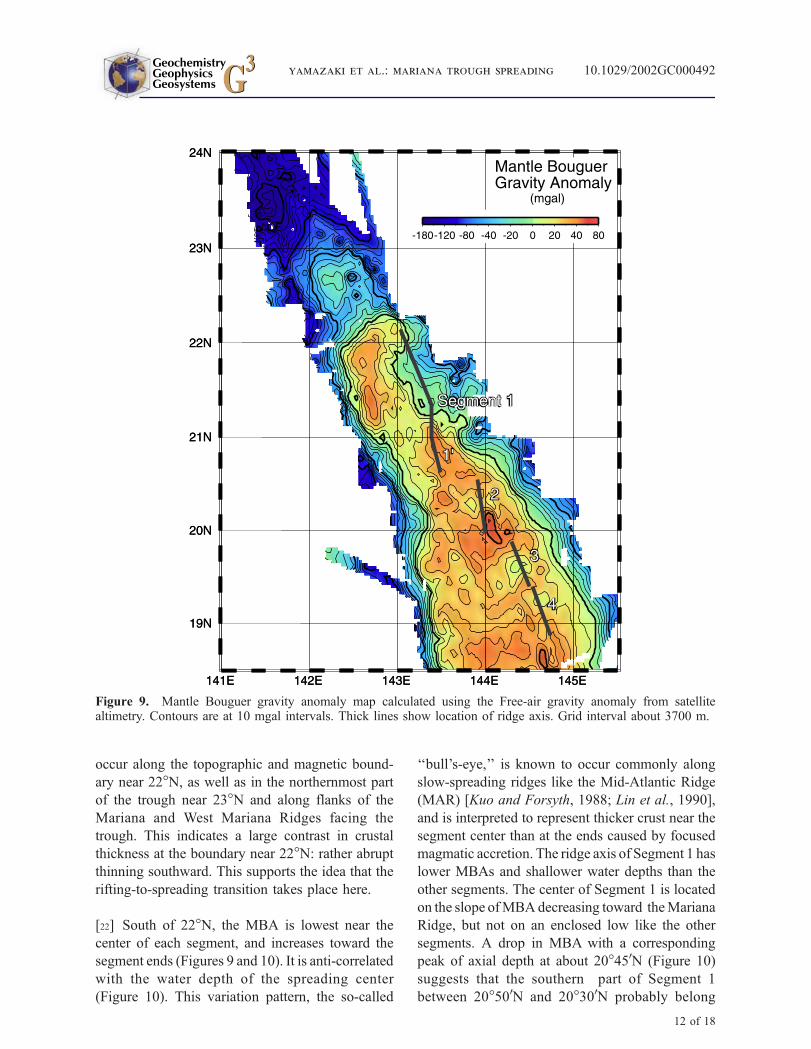
occur along the topographic and magnetic bound-
ary near 22�N, as well as in the northernmost part
of the trough near 23�N and along flanks of the
Mariana and West Mariana Ridges facing the
trough. This indicates a large contrast in crustal
thickness at the boundary near 22�N: rather abruptthinning southward. This supports the idea that the
rifting-to-spreading transition takes place here.
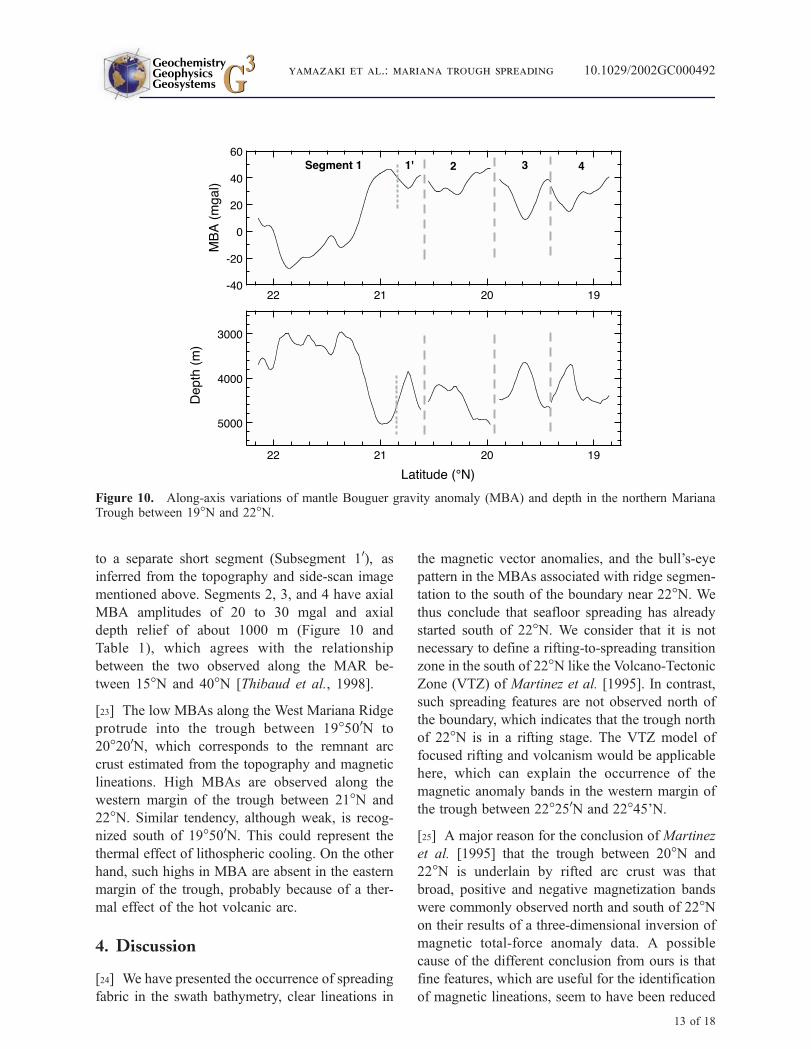
[22] South of 22�N, the MBA is lowest near the
center of each segment, and increases toward the
segment ends (Figures 9 and 10). It is anti-correlated
with the water depth of the spreading center
(Figure 10). This variation pattern, the so-called
‘‘bull’s-eye,’’ is known to occur commonly along
slow-spreading ridges like the Mid-Atlantic Ridge
(MAR) [Kuo and Forsyth, 1988; Lin et al., 1990],
and is interpreted to represent thicker crust near the
segment center than at the ends caused by focused
magmatic accretion. The ridge axis of Segment 1 has
lower MBAs and shallower water depths than the
other segments. The center of Segment 1 is located
on the slope ofMBAdecreasing toward theMariana
Ridge, but not on an enclosed low like the other
segments. A drop in MBA with a corresponding
peak of axial depth at about 20�450N (Figure 10)
suggests that the southern part of Segment 1
between 20�500N and 20�300N probably belong
Figure 9. Mantle Bouguer gravity anomaly map calculated using the Free-air gravity anomaly from satellitealtimetry. Contours are at 10 mgal intervals. Thick lines show location of ridge axis. Grid interval about 3700 m.
GeochemistryGeophysicsGeosystems G3G3
yamazaki et al.: mariana trough spreading 10.1029/2002GC000492
12 of 18
to a separate short segment (Subsegment 10), as
inferred from the topography and side-scan image
mentioned above. Segments 2, 3, and 4 have axial
MBA amplitudes of 20 to 30 mgal and axial
depth relief of about 1000 m (Figure 10 and
Table 1), which agrees with the relationship
between the two observed along the MAR be-
tween 15�N and 40�N [Thibaud et al., 1998].
[23] The low MBAs along the West Mariana Ridge
protrude into the trough between 19�500N to
20�200N, which corresponds to the remnant arc
crust estimated from the topography and magnetic
lineations. High MBAs are observed along the
western margin of the trough between 21�N and
22�N. Similar tendency, although weak, is recog-
nized south of 19�500N. This could represent the
thermal effect of lithospheric cooling. On the other
hand, such highs in MBA are absent in the eastern
margin of the trough, probably because of a ther-
mal effect of the hot volcanic arc.
4. Discussion
[24] We have presented the occurrence of spreading
fabric in the swath bathymetry, clear lineations in
the magnetic vector anomalies, and the bull’s-eye
pattern in the MBAs associated with ridge segmen-
tation to the south of the boundary near 22�N. We
thus conclude that seafloor spreading has already
started south of 22�N. We consider that it is not
necessary to define a rifting-to-spreading transition
zone in the south of 22�N like the Volcano-Tectonic
Zone (VTZ) of Martinez et al. [1995]. In contrast,
such spreading features are not observed north of
the boundary, which indicates that the trough north
of 22�N is in a rifting stage. The VTZ model of
focused rifting and volcanism would be applicable
here, which can explain the occurrence of the
magnetic anomaly bands in the western margin of
the trough between 22�250N and 22�45’N.
[25] A major reason for the conclusion of Martinez
et al. [1995] that the trough between 20�N and
22�N is underlain by rifted arc crust was that
broad, positive and negative magnetization bands
were commonly observed north and south of 22�Non their results of a three-dimensional inversion of
magnetic total-force anomaly data. A possible
cause of the different conclusion from ours is that
fine features, which are useful for the identification
of magnetic lineations, seem to have been reduced
Figure 10. Along-axis variations of mantle Bouguer gravity anomaly (MBA) and depth in the northern MarianaTrough between 19�N and 22�N.
GeochemistryGeophysicsGeosystems G3G3
yamazaki et al.: mariana trough spreading 10.1029/2002GC000492
13 of 18
in their inversion solution, because they applied a
band-pass filter which suppresses wavelengths less
than 12 km. Short-wavelength signals that corre-
spond to the Olduvai Subchron and two subchrons
within the Gauss Chron may have been affected by
the filtering. It can also be pointed out that our
results from the magnetic vector anomalies would
have higher resolution than theirs on the basis of
the total-force anomalies. The latter has inevitably
small anomaly amplitudes in the Mariana Trough
as mentioned before. Moreover, their inversion
assumption may not be valid in some points.
They assumed the source layer thickness of 1 km
for their inversion. This assumption is commonly
used for magnetic anomaly inversions of seafloor-
spreading origin [e.g., Macdonald et al., 1980;
Grindlay et al., 1992; Pariso et al., 1996], but
may not be applicable for arc crust north of 22�N.The upper part of arc crust would consist of thick
volcaniclastics, which contributes little to the
magnetic anomalies. Instead, middle and lower
crusts may have strong magnetization associated
with intrusion and underplating of magmas. Their
inversion includes the Mariana and West Mariana
Ridges, where deep-seated plutonic bodies may
contribute significantly to the magnetic anomalies.
The importance of such anomaly sources beneath
oceanic island arcs is suggested by the occurrence
of long-wavelength magnetic anomalies over the
Izu-Ogasawara (Bonin) Arc and the Kyushu-Palau
Ridge [Yamazaki and Yuasa, 1998]. Thus the
inversion which included altogether the Mariana
and West Mariana Ridges and the trough from
20�N to 24�N but assumed the constant 1 km
source-layer may not be valid; they have different
crustal structures and hence should have different
source-layer depths and thicknesses. Furthermore,
the assumption is not consistent with their model.
If the trough south of 22�N is underlain by rifted
arc crust with volcanic intrusions as they postu-
lated, the sources of the anomalies could be
deeper and thicker than surface 1 km, in particular
in the western part of the trough where the crust
should be cooler and have experienced relatively
small extension.
[26] The gravity data are not consistent with the
continuation of rifting southward beyond the
boundary near 22�N. A large change in MBA
occurs only between 22�N and 22�200N, and no
tendency indicating progressive crustal thinning is
observed south of it (Figure 9). A model calcula-
tion by Ishihara and Yamazaki [1991] using ship-
board free-air gravity data suggested that the
crustal thickness decreases from about 15 km near
24�N to about 6 km south of 22�N where water
depth is 4500 m. The thickness of the latter is
typical of oceanic crust. If the trough south of 22�Nconsists of rifted arc crust and the thinning is
localized along the VTZ with focused extension
[Martinez et al., 1995], the crust should be thinnest
along the VTZ and become thicker toward the
margins of the trough. A low in MBA is hence
expected for the western margin of the trough from
this model, but this is contrary to the observation.
[27] The two deeps near the center of the trough
between 20�N and 21�N, the Central Grabens,
have been formed by amagmatic extension at the
segment ends. The southern one near 20�N occurs
at the southern end of Segment 2, and the northern
one near 21�N is located at the southern end of
Segment 1 if we introduce Subsegment 10. They
were previously thought to have been formed by
concentration of rifting [Martinez et al., 1995] or
be enigmatic [Stern et al., 1996], but can well be
explained in the context of seafloor spreading. The
topographic asymmetry of the deeps, the prominent
eastern scarps vs. the gentle western slopes, can be
explained by tectonic thinning of the inside corners
by low-angle detachment faults [Tucholke and Lin,
1994; Tucholke et al., 1998]. Gabbros and ultra-
mafic rocks were recovered from the deep at 20�N[Stern et al., 1996, 1998; Ohara et al., 2002].
Exposure of lower crust and upper mantle at inside
corners is common in the MAR [Tucholke and Lin,
1994; Cannat et al., 1995; Gracia et al., 1997].
The great depths of the Central Grabens were
emphasized previously and thought to be anoma-
lous compared with the MAR, where maximum
depths of some second-order segment boundaries
are close to 5000 m. But the maximum depth of
5700 m of the Central Grabens are not quite
anomalous, considering that depths of backarc
basins in the Philippine Sea plate including the
Mariana Trough is about 700 m deeper in average
GeochemistryGeophysicsGeosystems G3G3
yamazaki et al.: mariana trough spreading 10.1029/2002GC000492
14 of 18
than expected from the age-depth curve of major
oceans [Park et al., 1990].
[28] Segment 1 shows the characteristics of the
ridges with intermediate spreading rates, those are
the larger segment length and the shallower depths
of the ridge axis without rift valley, even though
the spreading rate during the Brunhes Chron is
only slightly larger than the southern segments.
Furthermore, this segment has much lower MBAs
than the other segments in the bull’s-eye pattern,
suggesting thicker crust and/or hotter mantle. Since
this segment is closest to the volcanic arc and the
MBA low of the segment center continues to the
Mariana Ridge, these observations lead us an
interpretation that this segment receives extra
magma delivery from the volcanic front. Similar
changes of topography and gravity are observed in
segments of the MAR approaching to the Azores
hot spot [Detrick et al., 1995; Thibaud et al., 1998]
and the Iceland hot spot [Bell and Buck, 1992;
Searle et al., 1998]. On the basis of chemical
compositions of basalts obtained from the northern
part of the trough between 21�N and 22�N, Stern etal. [1990] estimated a mixing of 50–90% Mariana
arc component with a mid-ocean ridge basalt
(MORB) component. Subsegment 10 and Segment 2
are, on the contrary, cold, magma-starved seg-
ments. The centers of the segments are deeper than
Segment 3 as well as Segment 1, and they accom-
pany the deep grabens near the segment ends.
Segments 3 and 4 show normal morphological
features for slow-spreading ridges. The succession
of magma-rich, magma-starved, and normal seg-
ments with increasing distances from the volcanic
arc is the same as the observation in the Lau Basin,
from the Valu Fa Ridge to the Central Lau spread-
ing center, as proposed by Martinez and Taylor
[2002]. Presence of the volcanic arc would be a
fundamental difference of backarc spreading from
mid-ocean ridges. The asymmetry in spreading
rates also suggests that an interaction between
mantle upwellings under the backarc spreading
center and the volcanic front may control the
distance between the two.
[29] Seafloor spreading in small backarc basins is
considered to be unstable in general compared
with mid-oceanic ridges in major oceans because
the former may be affected by kinematics of
surrounding plates more easily, and changes in
spreading direction and rate may be frequent.
Recent GPS measurements revealed that both
the Philippine Sea plate and the Mariana Ridge
are moving westward relative to the Eurasia
[Kato et al., 1998; Sella et al., 2002], and the
opening of the Mariana Trough occurs because
the movement of the former is faster than the
latter. This observation is not consistent with
the opening model assuming a trench rollback
[Martinez and Fryer, 2000]. Spreading of
the Mariana Trough predicted from the GPS
measurements is almost east-west with a full-rate
of about 4.7 cm/year, which was measured in its
southern part (Guam). It is not inconsistent with
those in the northern Mariana Trough estimated
from the magnetic anomalies of Brunhes age,
considering that the rates would decrease north-
ward with decreasing width of the trough. The
reducing spreading rate and the clockwise rota-
tion of ridge-axis strike observed in the northern
Mariana Trough during the last ca. 1 to 2 m.y.
should reflect a change in the motion of the
Philippine Sea plate. Some evidences suggest
that the convergence along the Nankai and
Sagami Trough subduction zones in the northern
margin of the Philippine Sea plate changed from
the north to northwest at ca. 1 Ma [Nakamura et
al., 1984; Yamazaki and Okamura, 1989]. It is,
however, difficult to construct a plausible model
of the past Philippine Sea plate motion only from
these constraints, and further accumulation of
data concerning a detailed spreading history in
the central and southern part of the Mariana
Trough, internal deformation of the Mariana
arc, and convergence along margins of the Phil-
ippine Sea plate are required.
5. Conclusions
[30] This study revealed following characteristics
of the spreading in the northern Mariana Trough
between 19�N and 24�N.
[31] (1) Transition from rifting to seafloor spread-
ing occurs near 22�N. Four ridge segments sepa-
GeochemistryGeophysicsGeosystems G3G3
yamazaki et al.: mariana trough spreading 10.1029/2002GC000492
15 of 18
rated by three nontransform discontinuities are
identified between 19�N and 22�N. Seafloor
spreading between 19�N and 20�N began prior
to 5 Ma, and that between 20�N and 21�300Nbegan at about 4 Ma. The northward propagation
of the spreading was stepwise, but not continuous.
The bull’s-eye pattern of MBA, which is a char-
acteristic of slow-spreading ridges, occurs along
the ridge.
[32] (2) The northernmost segment is morpholog-
ically similar to ridges with intermediate spreading
rates: a large segment length and shallow water
depths without rift valley. The MBAs near the
segment center are lower than the other segments.
This suggests an abundant magma supply to this
segment. The next segment is, on the contrary, a
magma-starved segment with a prominent rift val-
ley. Two anomalously deep grabens (the Central
Grabens) occur near the segment ends between
20�N and 21�N, and were formed by amagmatic
extension. The succession of magma-rich, magma-
starved, and normal segments with increasing dis-
tances from the volcanic arc is the same as the
observation in the Lau Basin reported by Martinez
and Taylor [2002].
[33] (3) Spreading rate has decreased with time.
The spreading half-rates in the western side of
the spreading center were 2 to 3 cm/year before
2.58Ma south of 21�300N and during theMatuyama
Chron north of 21�300N, but an average during the
Brunhes Chron is 1 cm/year or less. Direction of
spreading has also changed with time. Orientations
of spreading ridges, which range from�20� to 0� atpresent, have rotated about 20� clockwise since
the start of the spreading. These changes might
be associated with changes in the motion of the
Philippine Sea plate.
[34] (4) The seafloor spreading has been asymmet-
ric. The spreading rates of the western side of the
spreading center have been significantly larger than
the eastern counterpart in general. We estimate that
diffuse spreading occurs in the eastern side of the
axis between 20�350N and 20�500N, which may be
an undergoing eastward ridge jump. The asymme-
try may have been caused by an interaction of
upwelling systems under the volcanic front and the
backarc spreading center, and would be a charac-
teristic of backarc spreading.
Acknowledgments
[35] We thank Naoki Wakabayashi, Yuichi Hasegawa, and
Hisanori Iwamoto for their help of the measurements and data
processing, and Robert J. Stern, Makoto Arima, Makoto
Yuasa, and Takemi Ishihara for discussion. We also thank all
onboard scientists, officers and crew of the cruises of R/V
Kairei and R/V Yokosuka for cooperation, and Hajimu
Kinoshita, Kiyoshi Suyehiro, and other JAMSTEC personnel
related to the cruises for their support. The manuscript was
greatly improved by comments from two anonymous
reviewers and an associate editor, Bruce Anderson. The
GMT software [Wessel and Smith, 1995] was used for pro-
ducing the figures. This study was partly supported by the
Grant-in-Aid for Scientific Research ((B)(2) No. 12440116) of
the Japan Society for the Promotion of Science.
References
Baker, N., P. Fryer, F. Martinez, and T. Yamazaki, Rifting
history of the northern Mariana Trough: SeaMARC II and
seismic reflection surveys, J. Geophys. Res., 101, 11,427–
11,455, 1996.
Bell, R. E., and W. R. Buck, Crustal control of ridge segmen-
tation inferred from observations of the Reykjanes Ridge,
Nature, 357, 583–586, 1992.
Bibee, L. D., G. G. Shor Jr., and R. S. Lu, Intra-arc spreading
in the Mariana Trough, Mar. Geol., 35, 183–197, 1980.
Cande, S. C., and D. V. Kent, Revised calibration of the geo-
magnetic polarity timescale for the Late Cretaceous and Cen-
ozoic, J. Geophys. Res., 100, 6093–6095, 1995.
Cannat, M., et al., Thin crust, ultramafic exposures, and rugged
faulting patterns at the Mid-Atlantic Ridge (22�–24�N),Geology, 23, 49–52, 1995.
Caress, D. W., and D. N. Chayes, New software for processing
sidescan data from sidescan-capable multibeam sonars, paper
presented at IEEE Oceans 95 Conference, Inst. of Electr. and
Electron. Eng., San Diego, Calif., 1995.
Detrick, R. S., H. D. Needham, and V. Renard, Gravity anoma-
lies and crustal thickness variations along the Mid-Atlantic
Ridge between 33�N and 40�N, J. Geophys. Res., 100,
3767–3787, 1995.
Fryer, P., Geology of the Mariana Trough, in Backarc Basins:
Tectonics and Magmatism, edited by B. Taylor, pp. 237–
279, Plenum, New York, 1995.
Fryer, P., Evolution of the Mariana convergent plate margin
system, Rev. Geophys., 34, 89–125, 1996.
Gente, P., R. A. Pockalny, C. Durand, C. Deplus, M. Maia,
G. Ceuleneer, C. Mevel, M. Cannat, and C. Laverne,
Characteristics and evolution of the segmentation of the
Mid-Atlantic Ridge between 20�N and 24�N during the last
10 million years, Earth Planet. Sci. Lett., 129, 55–71, 1995.
GeochemistryGeophysicsGeosystems G3G3
yamazaki et al.: mariana trough spreading 10.1029/2002GC000492
16 of 18
Gracia, E., D. Bideau, R. Hekinian, Y. Lagabrielle, and L. M.
Parson, Along-axis magmatic oscillations and exposure of
ultramafic rocks in a second-order segment of the Mid-
Atlantic Ridge (33�430N to 34�070N), Geology, 25, 1059–1062, 1997.
Grindlay, N. R., P. J. Fox, and P. R. Vogt, Morphology and
tectonics of the Mid-Atlantic Ridge (25�–27�300S) from Sea
Beam and magnetic data, J. Geophys. Res., 97, 6983–7010,
1992.
Hussong, D. M., and S. Uyeda, Tectonic processes and the
history of the Mariana Arc: A synthesis of the results of
deep-sea drilling project Leg 60, Initial Rep. Deep Sea Drill.
Proj., 60, 909–929, 1982.
Isezaki, N., A new shipboard three-component magnetometer,
Geophysics, 51, 1992–1998, 1986.
Ishihara, T., and T. Yamazaki, Gravity anomalies over the Izu-
Ogasawara (Bonin) and northern Mariana Arcs, Bull. Geol.
Surv. Jpn., 42, 687–701, 1991.
Iwamoto, H., M. Yamamoto, N. Seama, K. Kitada, T. Matsuno,
Y. Nogi, T. Goto, T. Fujiwara, K. Suyehiro, and T. Yamazaki,
Tectonic evolution of the central Mariana Trough, Eos
Trans. AGU, 83(47), Fall Meet. Suppl., abstract T72A-1235,
2002.
Kato, T., et al., Initial results from WING, the continuous GPS
network in the western Pacific area, Geophys. Res. Lett., 25,
369–372, 1998.
Kuo, B.-Y., and D. W. Forsyth, Gravity anomalies of the ridge-
transform system in the South Atlantic between 31� and 34.
5�S: Upwelling centers and variations in crustal thickness,
Mar. Geophys. Res., 10, 205–232, 1988.
Lin, J., G. M. Purdy, H. Schouten, J.-C. Sempere, and
C. Zervas, Evidence from gravity data for focused magmatic
accretion along the Mid-Atlantic Ridge, Nature, 344, 627–
632, 1990.
Macdonald, K. C., Mid-ocean ridges: Fine scale tectonic, vol-
canic and hydrothermal processes within the plate boundary
zone, Annu. Rev. Earth Planet. Sci., 10, 155–190, 1982.
Macdonald, K. C., S. P. Miller, S. P. Huestis, and F. N. Spiess,
Three-dimensional modeling of a magnetic reversal bound-
ary from inversion of deep-tow measurements, J. Geophys.
Res., 85, 3670–3680, 1980.
Macdonald, K. C., D. S. Scheirer, and S. M. Carbotte, Mid-
ocean ridges: Discontinuities, segments and giant cracks,
Science, 253, 986–994, 1991.
Martinez, F., and P. Fryer, Geophysical characteristics of the
Mariana Trough, 11�500N–13�400N, J. Geophys. Res., 105,16,591–16,607, 2000.
Martinez, F., and B. Taylor, Mantle wedge control on back-arc
crust accretion, Nature, 416, 417–420, 2002.
Martinez, F., P. Fryer, N. A. Baker, and T. Yamazaki, Evolution
of backarc rifting: Mariana Trough, 20�–24�N, J. Geophys.Res., 100, 3807–3827, 1995.
Nakamura, K., K. Shimazaki, and N. Yonekura, Subduction,
bending and eduction: Present and Quaternary tectonics of
the northern border of the Philippine Sea plate, Bull. Soc.
Geol. France, 26, 221–243, 1984.
Ohara, Y., R. J. Stern, T. Ishii, H. Yurimoto, and T. Yamazaki,
Peridotites from the Mariana Trough: First look at the mantle
beneath an active back-arc basin, Contrib. Mineral. Petrol.,
143, 1–18, 2002.
Pariso, J. E., C. Rommevaux, and J.-C. Sempere, Three-di-
mensional inversion of marine magnetic anomalies: Implica-
tions for crustal accretion along the Mid-Atlantic Ridge
(28�–31�300N), Mar. Geophys. Res., 18, 85–101, 1996.
Park, C.-H., K. Tamaki, and K. Kobayashi, Age-depth correla-
tion of the Philippine Sea back-arc basins and other marginal
basins in the world, Tectonophysics, 181, 351–371, 1990.
Parker, R. L., The rapid calculation of potential anomalies,
Geophys. J. Astron. Soc., 31, 447–455, 1972.
Ramberg, I. B., D. E. Gray, and R. G. H. Raynolds, Tectonic
evolution of the FAMOUS area of the Mid-Atlantic Ridge,
lat 35�500 to 37�200N, Geol. Soc. Am. Bull., 88, 609–620,1977.
Sandwell, D. T., and W. H. F. Smith, Marine gravity anomaly
from Geosat and ERS 1 satellite altimetry, J. Geophys. Res.,
102, 10,039–10,054, 1997.
Seama, N., and T. Yamazaki, Asymmetric sea-floor spreading
in the central Mariana Trough, Eos Trans. AGU, 79(45), Fall
Meet. Suppl., F908, 1998.
Seama, N., Y. Nogi, and N. Isezaki, A new method for precise
determination of the position and strike of magnetic bound-
aries using vector data of the geomagnetic anomaly field,
Geophys. J. Int., 113, 155–164, 1993.
Seama, N., T. Yamazaki, H. Iwamoto, K. Kitada, M. Yamamoto,
T. Fujiwara, Y. Nogi, K. Okino, and K. Suyehiro, Tectonic
features of the Mariana Trough, Eos Trans. AGU, 83(47), Fall
Meet. Suppl., abstract T71F-08, 2002.
Searle, R. C., J. A. Keeton, R. B. Owens, R. S. White,
R. Mecklenburgh, B. Parsons, and S. M. Lee, The Reykjanes
Ridge: Structure and tectonics of a hot-spot-influenced,
slow-spreading ridge, from multibeam bathymetry, gravity
and magnetic inversions, Earth Planet. Sci. Lett., 160,
463–478, 1998.
Sella, G. F., T. H. Dixon, and A. Mao, REVEL: A model for
recent plate velocities from space geodesy, J. Geophys. Res.,
107(B4), 2081, doi:10.1029/2000JB000033, 2002.
Sempere, J.-C., G. M. Purdy, and H. Schouten, Segmentation
of the Mid-Atlantic Ridge between 24�N and 30�400N,Nature, 344, 427–431, 1990.
Severinghaus, J. P., and K. C. Macdonald, High inside corners
at ridge-transform intersections,Mar. Geophys. Res., 9, 353–
367, 1988.
Smith, W. H. F., and D. T. Sandwell, Global sea floor topo-
graphy from satellite altimetry and ship depth soundings,
Science, 277, 1956–1962, 1997.
Stern, R. J., P.-N. Lin, J. D. Morris, M. C. Jackson, P. Fryer,
S. Bloomer, and E. Ito, Enriched back-arc basin basalts from
the northern Mariana Trough: Implications for the magmatic
evolution of back-arc basins, Earth Planet. Sci. Lett., 100,
210–225, 1990.
Stern, R. J., S. H. Bloomer, F. Martinez, T. Yamazaki, and
T. M. Harrison, The composition of back-arc basin lower
crust and upper mantle in the Mariana Trough: A first report,
Island Arc, 5, 354–372, 1996.
Stern, R. J., T. Yamazaki, S. Danishwar, and C.-H. Sun, Back-
arc basin lower crust and upper mantle in the northern
GeochemistryGeophysicsGeosystems G3G3
yamazaki et al.: mariana trough spreading 10.1029/2002GC000492
17 of 18
Mariana Trough studied with ‘‘Shinkai 6500,’’ JAMSTEC
J. Deep Sea Res., 13, 47–61, 1998.
Stern, R. J., M. J. Fouch, and S. L. Klemperer, An overview
of the Izu-Bonin-Mariana Subduction Factory, in Inside
the Subduction Factory, Geophys. Monogr. Ser., edited by
J. Eiler, in press, AGU, Washington, D. C., 2003.
Thibaud, R., P. Gente, and M. Maia, A systematic analysis of
the Mid-Atlantic Ridge morphology and gravity between
15�N and 40�N: Constraints of thermal structure, J. Geo-
phys. Res., 103, 24,223–24,243, 1998.
Tucholke, B. E., and J. Lin, A geological model for the struc-
ture of ridge segments in slow spreading ocean crust,
J. Geophys. Res., 99, 11,937–11,958, 1994.
Tucholke, B. E., J. Lin, and M. C. Kleinrock, Megamullions
and mullion structure defining oceanic metamorphic core
complexes on the Mid-Atlantic Ridge, J. Geophys. Res.,
103, 9857–9866, 1998.
Wessel, P., and W. H. F. Smith, New version of the generic
mapping tools released, Eos Trans. AGU, 76(33), 329, 1995.
Yamazaki, T., and F. Murakami, Asymmetric rifting of the
northern Mariana Trough, Island Arc, 7, 460–470, 1998.
Yamazaki, T., and Y. Okamura, Subducting seamounts and
deformation of overriding forearc wedges around Japan, Tec-
tonophysics, 160, 207–229, 1989.
Yamazaki, T., and R. J. Stern, Topography and magnetic vector
anomalies in the Mariana Trough, JAMSTEC J. Deep Sea
Res., 13, 31–45, 1997.
Yamazaki, T., and M. Yuasa, Possible Miocene rifting of the
Izu-Ogasawara (Bonin) arc deduced from magnetic anoma-
lies, Island Arc, 7, 374–382, 1998.
Yamazaki, T., F. Murakami, and E. Saito, Mode of seafloor
spreading in the northern Mariana Trough, Tectonophysics,
221, 207–222, 1993.
Yamazaki, T., K. Okino, Y. Hasegawa, H. Saitake, and
M. Ito, Geophysical mapping of Mariana Trough and West
Philippine Basin: A preliminary report of Kairei KR9812
cruise, JAMSTEC J. Deep Sea Res., Part II, 15, 63–72,
1999.
GeochemistryGeophysicsGeosystems G3G3
yamazaki et al.: mariana trough spreading 10.1029/2002GC000492
18 of 18