Embed Size (px)
Citation preview

For contact information, please visit our website: www.weatherfordlabs.com
C a n a d aU n i t e d S t a t e s
N o r w a yU n i t e d K i n g d o mK a z a k h s t a n
B r a z i lM e x i c oT r i n i d a dV e n e z u e l aA r g e n t i n a
K u w a i tL i b y aO m a nS a u d i A r a b i aU n i t e d A r a b E m i r a t e sI r a q
A u s t r a l i aI n d i aM a l a y s i aT h a i l a n dN e w Z e a l a n dI n d o n e s i a
Geochemical Methods and Assessment of Oil Shales
Tim Ruble
Senior Geochemist

Presentation Outline
• Source Rock Analyzer (SRA)• Fischer Assay (FA)• Hydrous Pyrolysis (HP)• In Situ Simulator (ISS)• Chemical Considerations• Geologic Considerations• Analytical Program Recommendations
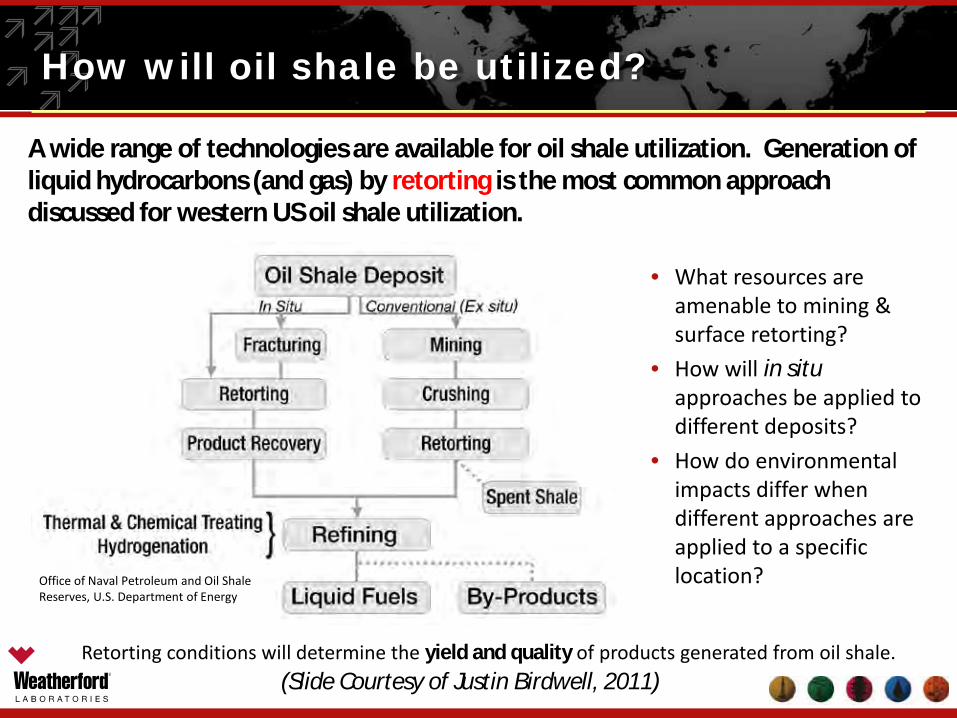
A wide range of technologies are available for oil shale utilization. Generation of liquid hydrocarbons (and gas) by retorting is the most common approach discussed for western US oil shale utilization.
How will oil shale be utilized?
• What resources are amenable to mining & surface retorting?
• How will in situapproaches be applied to different deposits?
• How do environmental impacts differ when different approaches are applied to a specific location?Office of Naval Petroleum and Oil Shale
Reserves, U.S. Department of Energy
Retorting conditions will determine the yield and quality of products generated from oil shale.(Slide Courtesy of Justin Birdwell, 2011)

Technically recoverable resources
Define resources:Retort-generated hydrocarbon liquids and gas
Methods for estimating Recovery Factors are needed for oil and gas products, with compositional estimates based on laboratory and pilot scale tests.
This is needed for representative technologies that are expected to be implemented.
(Slide Courtesy of Justin Birdwell, 2011)

Source Rock Analyzer

Pyrolysis Methods – Source Rock Analyzer
• Pyrolysis is the heating of organic matter in the absence of oxygen to yield organic compounds (Peters, 1986).
• Programmed Pyrolysis:– Pulverized samples are
gradually heated under an inert atmosphere
– Heating distills the free organic compounds (bitumen), then cracks pyrolytic products from the insoluble organic matter (kerogen)
Pyrolysis

Pyrolysis Methods – Source Rock Analyzer
Pyrolysis instrument that uses an FID detector and IR cells to measure:
vHydrocarbon Content – S1
vRemaining Hydrocarbon Generation Potential – S2
vOrganic richness – TOC
vThermal Maturity – Tmax
Rapid screening method

Source Rock Analyzer (SRA)
Pros:• Rapid (~40 min)• Small Sample Size (~100 mg)• Commercially Available• Cost Effective (~$90/per sample)• Can be used for bulk Kinetics**
Cons:• No Hydrocarbon Compositions**• Generation and Mass Transport
Mechanisms Differ from Oil Shale Processes

Fisher Assay

Retort
Condenser
Vent to hood/scrubber
Cooling bath
Oven or heating mantle
Cooling water inlet Oil and vapor
ASTM standard method for determining oil yield potential of oil shale
Collected oil
Collected water
100 g of shale is heated to 500°C at 12°C/min (20 min heat-up) and held for 40 min at atmospheric pressure
Oil, water and residual oil shale are collected
No gases are recovered (gas yield estimated)
Oil product yield and composition is comparable to surface retorting methods
Condensed Oil
Cooling water outlet
Mimics surface oil shale retorting
Pyrolysis Methods – Fischer Assay
(Slide Courtesy of Justin Birdwell, 2011)

SRA vs. Fisher Assay
y = 15.536x - 33.756R2 = 0.9462
0
50
100
150
200
250
0 2 4 6 8 10 12 14 16
Fischer Assay Yields (wt.% oil)
SR A
naly
zer
Pyro
lysi
s (S
2) Y
ield
s (m
g H
C/g
R)

Pyrolysis Methods – Fischer Assay
Pros:• Fairly Rapid (~2 hr)• Moderate Sample Size (~100 g)• Commercially Available• Cost Effective (~$125/per sample)• Products for Compositional Analysis• Mimics Surface Oil Shale Retort
Cons:• No Kinetics**• Generation and Mass Transport
Mechanisms Differ from In Situ Oil Shale Processes

Hydrous Pyrolysis

20°C360°C
20°C
Generated Gases
Expelled OilSource
Rock200 g
Water400 g
He(25 psia)
Spent Rock
72 h
Mimics petroleum generation in nature
PreparationPyrolysis
Cool-down &Collection
Heat-up
Pyrolysis Methods – Hydrous Pyrolysis
(Slide Courtesy of Justin Birdwell, 2011)

Pyrolysis Methods – Hydrous Pyrolysis
Rock
Water
Expelled Oilphysically, chemically, and isotopically similar to natural crude oils
Quartz Reactor
Line
before after 330 C/72 h
Rock
Water
Lewan et al., 1979(Slide Courtesy of Michael Lewan, 2011)

Pyrolysis Methods – Hydrous Pyrolysis
(Lewan, 1985)
Pros:• Products for Compositional Analysis• Mimics Natural Oil Generation• Bulk and Compositional Kinetics
Cons:• Time Consuming (days-weeks)• Large Sample Size (~200-500 g)• Limited Commercial Availability• Generation and Mass Transport
Mechanisms Differ from Oil Shale Processes**

In Situ Simulator
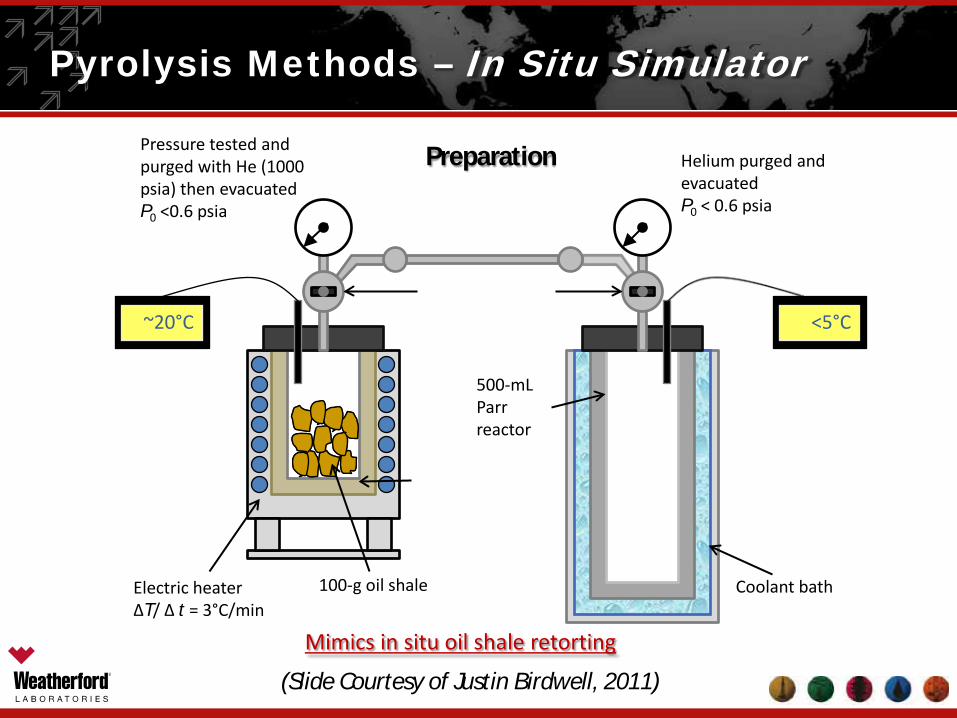
500-mL Parr reactor
250-mL Parr reactor
Helium purged and evacuatedP0 < 0.6 psia
Preparation
~20°C <5°CValves closed
Electric heaterΔT/ Δ t = 3°C/min
Coolant bath
Pressure tested and purged with He (1000 psia) then evacuatedP0 <0.6 psia
100-g oil shale
Mimics in situ oil shale retorting
Pyrolysis Methods – In Situ Simulator
(Slide Courtesy of Justin Birdwell, 2011)

Pyrolysis
Sample is heated to the desired temperature and held for between 6 and 288 hours
500 < P0 < 800 psiaP0 < 0.6 psia
0
200
400
600
800
1000
0 100 200 300
Reac
tor p
ress
ure
(psi
g)
Pyrolysis time (hrs)
360°C <5°CValves closed
Oil vapor and Gas
Pyrolysis Methods – In Situ Simulator
(Slide Courtesy of Justin Birdwell, 2011)

Collection
After the desired pyrolysis time has passed, the reactor is vented to the collector (complete in <1 min).
P < 200 psig P < 200 psig
~15°C360°CValves open
Oil vapor and Gas
Pyrolysis Methods – In Situ Simulator
(Slide Courtesy of Justin Birdwell, 2011)

Cool-down
Both the reactor and collector are brought to room temperature (~24 hours) prior to recovery of spent shale and products.
6 < P < 17 psia 45 < P < 85 psia
~20°CValves closed
~20°C
Gas
Condensed Oil
Spent shale
Pyrolysis Methods – In Situ Simulator
(Slide Courtesy of Justin Birdwell, 2011)

Gas
Condensed Oil
Pyrolysis Methods – In Situ Simulator
Pros:• Moderate Sample Size (~100 g)• Products for Compositional Analysis• Mimics In Situ Oil Shale Retorting• Bulk and Compositional Kinetics**
Cons:• Time Consuming (days-weeks)• Limited Commercial Availability• Generation and Mass Transport
Mechanisms may Differ from some Oil Shale Processes**
(Justin Birdwell, 2011)

Chemical Considerations

KerogenInsoluble organic solid
BitumenSoluble organic tar
Crude OilHydrocarbon-rich
liquid
Natural GasHydrocarbon-rich gas
Char/PyrobitumenInsoluble organic solid
ImmatureMature
Over mature
Hydrocarbon Generation
Hydrogen SulfideNon-hydrocarbon-rich gas
1
2
3
4
5
6
7
8
9
Reactions & Processes
(Lewan, 2011)(Slide Courtesy of Michael Lewan, 2011)

Bitumen* Expelled Oil*0 6 12 0 2 4 0 1 2 3
Unheated
300oC/72h
Kerogen*
320oC/72h
330oC/72h
340oC/72h
345oC/72h
350oC/72h
355oC/72h
360oC/72h
365oC/808h
Kerogen
Oil
Bitumen
*wt% of Rock (Lewan, 1985)
Fundamentals of Oil Formation
(Slide Courtesy of Michael Lewan, 2011)

HP-Expelled Oil
HP-Bitumen
Rock-Eval S2 at 475 to 600ºC
Pyrolysis Product Compositions
Behar et al.(1997)
AA
RE
Dry Squeezing(Lafargue et al., 1989)
(Lewan, 2011)
(Slide Courtesy of Michael Lewan, 2011)
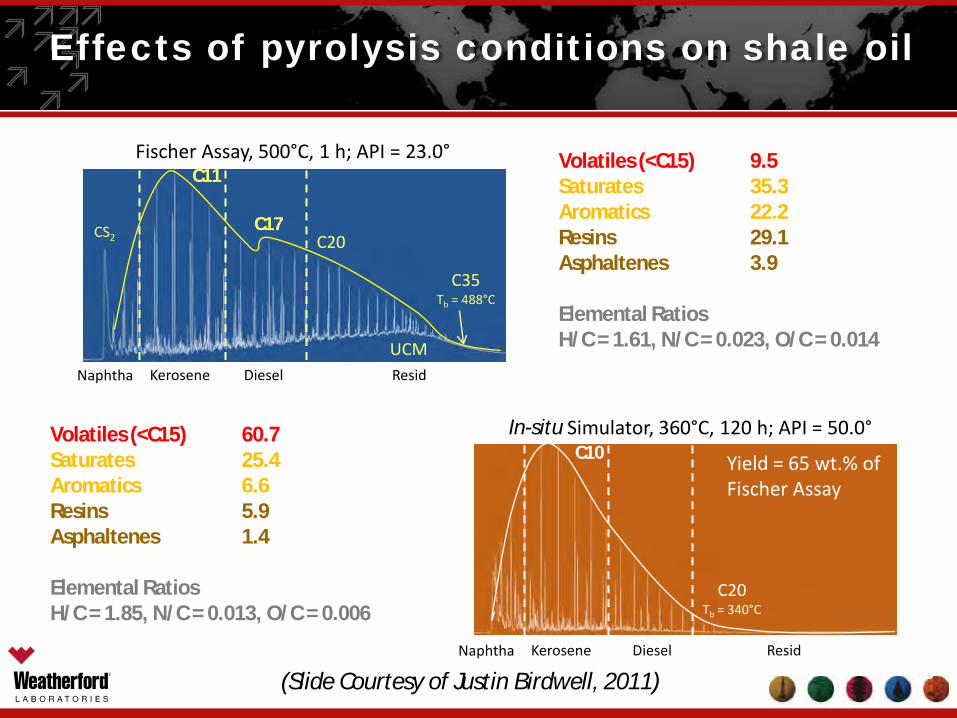
Fischer Assay, 500°C, 1 h; API = 23.0°
In-situ Simulator, 360°C, 120 h; API = 50.0°
FID
Resp
onse
C35Tb = 488°C
C20
C11
CS2C17
C10
Naphtha
UCM
C20Tb = 340°C
Kerosene Diesel Resid
Naphtha Kerosene Diesel Resid
Volatiles (<C15) 60.7Saturates 25.4Aromatics 6.6Resins 5.9Asphaltenes 1.4
Elemental RatiosH/C = 1.85, N/C = 0.013, O/C = 0.006
FID
Resp
onse
Volatiles (<C15) 9.5Saturates 35.3Aromatics 22.2Resins 29.1Asphaltenes 3.9
Elemental RatiosH/C = 1.61, N/C = 0.023, O/C = 0.014
Yield = 65 wt.% of Fischer Assay
18
Effects of pyrolysis conditions on shale oil
(Slide Courtesy of Justin Birdwell, 2011)

Results – Oil yields & specific gravities
Fischer Assay has the highest oil yield. Hydrous Pyrolysis and ISSyields were ~70% and ~30% of Fischer Assay, respectively.
In Situ Simulator generated the lightest oil, and Fischer Assay produced the heaviest. Differences between shales were minimal.
TOC = 19.3 wt%
10.0 wt% 29.7 wt%
0
200
400
600
800
1000
1200
Piceance Mahogany
Garden Gulch Member
Uinta Mahogany
Oil
yiel
d (m
g-oi
l/g-
TOC)
Fischer Assay Hydrous Pyrolysis In Situ Simulator
0.65
0.7
0.75
0.8
0.85
0.9
0.95
Piceance Mahogany
Garden Gulch Member
Uinta Mahogany
Oil
spec
ific
grav
ity
Fischer Assay Hydrous Pyrolysis In Situ Simulator
(Slide Courtesy of Justin Birdwell, 2011)

Results – Whole oil GC-FID
Piceance Mahogany Garden GulchUinta Mahogany
Hydrous Pyrolysis
In Situ Simulator
Fischer Assay
Naphtha<C9 Kerosene
C9 – C14
DieselC15 – C20
Resid>C20
C35Tb = 488°C
C20Tb = 340°C
(Slide Courtesy of Justin Birdwell, 2011)

Geologic Considerations

Lake Uinta Source-Rock Lithofacies
Birgenheier & Vanden Berg (2011)

Saline Facies
Birgenheier & Vanden Berg (2011)

Offshore Open Lacustrine Facies
Birgenheier & Vanden Berg (2011)

Nearshore Open Lacustrine Facies
Birgenheier & Vanden Berg (2011)

Why Recognizing Oil Shale Facies is Important
Saline Lacustrine Oil ShaleSaline Lacustrine Oil Shale
Offshore Open Lacustrine Oil ShaleOffshore Open Lacustrine Oil Shale
NearshoreNearshore Open Lacustrine Oil ShaleOpen Lacustrine Oil Shale
PaludalPaludal CoalCoal
Immiscible Oil Rock Extract
Sat. TIC
1520
25
30
Ph 22
26SatAro
P SatAroP
A
g-cerane
Immiscible Oil Rock Extract
Sat. TIC
1520
25
30
Ph 22
26SatAro
P SatAroP Sat
AroPA Sat
AroPA
g-ceraneg-cerane
Immiscible Oil Rock Extract
Sat. TIC
Pr
20
25
30
Ph
PrC30 H
15 SatAroP Sat
AroPA
g-cerane
Immiscible Oil Rock Extract
Sat. TIC
Pr
20
25
30
Ph
PrC30 H
15 SatAroP
SatAroP Sat
AroPA Sat
AroPA
g-ceraneg-cerane
Immiscible Oil Rock Extract
Sat. TIC
1520 25
30
15 2025
30SatAro
P SatAroP
A
Immiscible Oil Rock Extract
Sat. TIC
1520 25
30
15 2025
30SatAro
P SatAroP
A
Sat. TIC
1520 25
30
15 2025
30SatAro
PSatAro
P SatAroP
A SatAroP
A
Immiscible Oil Rock Extract
Sat. TIC
15 20
25
30
Pr
2025 30
SatAroP Sat
AroP
A
Immiscible Oil Rock Extract
Sat. TIC
15 20
25
30
Pr
2025 30
SatAroP SatAroP Sat
AroP
A SatAro
PA
3.2% TOC792 HI
515 bbl/a-ft*
Oil generated is moderately waxy and often has a high sulfur content.
5.9% TOC734 HI11.6 gal/ton371 bbl/a-ft*
Oil generated is a highly colored solid wax at room temperatures.
67.7% TOC586 HI
1129 bbl/a-ft*
Oil generated has a high wax content, but also contains a high proportion of aromatics.
15.2% TOC962 HI28.3 gal/ton889 bbl/a-ft*
Oil generated is free -with relatively low wax content.
*Immiscible oils generated during hydrous pyrolysis at 345oC/72h or at a transformation ratio of ~75%.
Immiscible Oil Rock Extract
Sat. TIC
1520
25
30
Ph 22
26SatAro
P SatAroP
A
g-cerane
Immiscible Oil Rock Extract
Sat. TIC
1520
25
30
Ph 22
26SatAro
P SatAroP Sat
AroPA Sat
AroPA
g-ceraneg-cerane
Immiscible Oil Rock Extract
Sat. TIC
Pr
20
25
30
Ph
PrC30 H
15 SatAroP Sat
AroPA
g-cerane
Immiscible Oil Rock Extract
Sat. TIC
Pr
20
25
30
Ph
PrC30 H
15 SatAroP
SatAroP Sat
AroPA Sat
AroPA
g-ceraneg-cerane
Immiscible Oil Rock Extract
Sat. TIC
1520 25
30
15 2025
30SatAro
P SatAroP
A
Immiscible Oil Rock Extract
Sat. TIC
1520 25
30
15 2025
30SatAro
P SatAroP
A
Sat. TIC
1520 25
30
15 2025
30SatAro
PSatAro
P SatAroP
A SatAroP
A
Immiscible Oil Rock Extract
Sat. TIC
15 20
25
30
Pr
2025 30
SatAroP Sat
AroP
A
Immiscible Oil Rock Extract
Sat. TIC
15 20
25
30
Pr
2025 30
SatAroP SatAroP Sat
AroP
A SatAro
PA
3.2% TOC792 HI
515 bbl/a-ft*
Oil generated is moderately waxy and often has a high sulfur content.
5.9% TOC734 HI11.6 gal/ton371 bbl/a-ft*
Oil generated is a highly paraffinic redish colored solid wax at room temperatures.
67.7% TOC586 HI
1129 bbl/a-ft*
Oil generated has a high wax content, but also contains a high proportion of aromatics.
15.2% TOC962 HI28.3 gal/ton889 bbl/a-ft*
Oil generated is free-flowing, black liquidwith relatively low wax content.
*Immiscible oils generated during hydrous pyrolysis at 345oC/72h or at a transformation ratio of ~75%.

C 10-40 ALKANE YIELDSHydrous Pyrolysis
0
50
100
150
200
250
300
0 20 40 60 80 100
Transformation Ratio %
bbl/a
-ft
HYDROCARBON YIELDSRock-Eval Pyrolysis
0
500
1000
1500
2000
2500
0 20 40 60 80 100
Transformation Ratio %
bbl/a
-ft
HYDROCARBON YIELDSHydrous Pyrolysis
0
500
1000
1500
2000
2500
0 20 40 60 80 100
Transformation Ratio %
bbl/a
-ft
SATURATES YIELDSHydrous Pyrolysis
0
200
400
600
800
1000
1200
0 20 40 60 80 100
Transformation Ratio %
bbl/a
-ft
Offshore 2.5× Nearshore
Offshore 2× Nearshore
Offshore = Nearshore
Importance of Organic Facies
Conventional method to grade oil shale is the modified Fischer Assay.
►Although this method is useful for measuring bulk oil yields duringlaboratory and/or surface retort, it operates within a much higher thermalregime, up to 500-600°C, compared to modern in-situ conversion methodsconducted at maximum temperatures of only ~370°C. As aresult, modified Fischer Assay yields and product composition are notequivalent.
►No standard grade is used to define oil shale resources. Someestimates use a minimum Fischer Assay yield of 15 gal/ton, while othersuse 10 gal/ton.
Hydrous Pyrolysis data show: Medium grade Offshore Facies ( 28 gal/ton Fischer assay)Low grade Nearshore Facies ( 12 gal/ton Fischer assay)Can generate comparable paraffin yields!!

Analytical Program Recommendations
Screening:• Source Rock Analyzer• Rock-Eval
Evaluation:• Fischer Assay• In Situ Simulator• Hydrous Pyrolysis
• Others (eg. TGA/Py-GC)
Up Scale Evaluation:• Pilot Plant Scale Simulations

Oil Shale Evaluation Services
• Fischer Assay• Source Rock Analyzer• Wellsite Geosciences
—Geochemistry—Mineralogy—Elemental Composition
• Wellsite Handling / Preservation / Gamma• Shale Rock Properties (SRP)• Shale Fabric Analysis• CT Scanning of Whole Core

Acknowledgements
Michael D. Lewan – U.S. Geological Survey
Justin E. Birdwell – U.S. Geological Survey
R. Paul Philp – University of Oklahoma

Questions?


![Geochemical Study of Oil Shales Sargelo Formation in Kuh-e ... · Basin with special attention to geochemistry of source rock [21]. Ala et al. (1980) also studied organic geochemical](https://img.pdfslide.us/doc/110x75/5f19f9b4b70345531231d716/geochemical-study-of-oil-shales-sargelo-formation-in-kuh-e-basin-with-special.jpg)