Embed Size (px)
Citation preview
Author's personal copy
Geochemical, isotopic, and remote sensingconstraints on the origin and evolution of theRub Al Khali aquifer system, Arabian Peninsula
M. Sultan a,*, N. Sturchio b, S. Al Sefry c, A. Milewski a, R. Becker a,I. Nasr d, Z. Sagintayev a
a Department of Geosciences, Western Michigan University, Kalamazoo, MI, USAb Department of Earth and Environmental Sciences, University of Illinois, Chicago, IL, USAc Hydrology Division, Saudi Geological Survey, Jeddah, Saudi Arabiad Desert Research Institute, Cairo, Egypt
Received 27 November 2007; accepted 1 April 2008
KEYWORDSSaudi Arabia;Rub Al Khali;Red sea hills;Groundwater rechargeand discharge;Tropical rainfall mea-suring mission;Oxygen, hydrogen, andstrontium isotopes
Summary Chemical and stable isotopic compositions of groundwater samples from theRub Al Khali (RAK) in southern Saudi Arabia were analyzed. Samples were collected fromwells of variable depth (1.5–800 m) along the perimeter of the eastern half of the RAKincluding flowing artesian wells, pumped wells (formerly artesian), and shallow hand-dug wells encompassing those in sabkha areas. Data indicate that the water from the arte-sian and formerly artesian wells represents the contents of confined aquifers. Such water(Group 1) is isotopically depleted (d2H values ranging from �60& to �35&), and has totaldissolved solids (TDS) concentrations ranging from 1300 to 76,000 mg/L, indicating thatmuch of the salinity is acquired in the subsurface. Water from shallow hand-dug wellsincluding those in sabkha areas (Group 2) has experienced significant evaporation (d2H val-ues ranging from �34& to +19&) as well as salinization (TDS as high as 92,000 mg/L) bydissolution of sabkha salts including halite and gypsum. Stable isotope data for the Group2 water samples define an evaporation trend line originating from the Group 1 water sam-ples. This relationship indicates that the Group 2-type water evolved from Group 1-typewater by ascending through structural discontinuities, dissolving evaporative salts, andundergoing substantial near-surface evaporation in groundwater discharge zones (sab-khas) characterized by shallow groundwater levels (<2 m). This interpretation is supportedby the relatively unradiogenic Sr isotope ratios of groundwater samples (Sr87/Sr86 = 0.70771–0.70874) that are inconsistent with that of modern seawater(87Sr/86Sr = 0.70932). The RAK aquifer water represents either high-elevation recharge
0022-1694/$ - see front matter ª 2008 Elsevier B.V. All rights reserved.doi:10.1016/j.jhydrol.2008.04.001
* Corresponding author. Tel.: +1 269 387 5487.E-mail address: [email protected] (M. Sultan).
Journal of Hydrology (2008) 356, 70–83
ava i lab le at www.sc iencedi rec t . com
journal homepage: www.elsevier .com/ locate / jhydro l

Author's personal copy
from the Red Sea Hills, and/or recharge largely formed of paleo-water precipitated duringmoist climate intervals of the late Pleistocene recharging aquifers cropping out at thefoothills of the Red Sea mountains. This inference is supported by a progressive decreasein hydraulic head and increase in groundwater salinity from west to east, substantial pre-cipitation over the Red Sea Hills, and a major E–W trending channel network that chan-nels precipitation from the Red Sea Hills toward recharge areas. Analysis of 3-hourly TRMM(Tropical Rainfall Measuring Mission: 1998–2006) precipitation data and digital elevationdata shows that 27% of the average annual precipitation (150 · 109 m3) over the ArabianPeninsula is channeled toward the recharge zone of the RAK aquifer system, of whichan estimated 4 · 109 m3 a�1 to 10 · 109 m3 a�1 of this water is partitioned as rechargeto the RAK aquifer system. Additional integrated studies on recharge rates, sustainability,and water quality issues for the RAK aquifers could demonstrate that the RAK is one of themost promising sites for groundwater exploration in the Arabian Peninsula. Results high-light the importance of investigating the potential for sustainable exploitation of similarlarge aquifer systems that were largely recharged in previous wet climatic periods yet arestill receiving modest modern meteoric contributions.
ª 2008 Elsevier B.V. All rights reserved.
Introduction
The low rates of precipitation (<100 mm/yr) over many ofthe arid and hyper-arid parts of the world represent a seri-ous challenge to organized efforts to populate and developsuch areas. This problem is exemplified in the Saharan beltand in the Arabian Peninsula. At present, precipitation overthe Sahara and the Arabian Peninsula is largely localized inhigh-elevation areas (e.g., Red Sea Hills in Egypt, Sudan,and Arabia), whereas the majority of the remaining landsin this area receive very little, if any precipitation. The cur-rent conditions contrast with the wet climatic periods thatprevailed throughout the Late Pleistocene. In this manu-script, we show that large aquifers that were mainly re-charged during wet periods and are still receiving moderncontributions from localized precipitation can potentiallyprovide opportunities for sustainable development.
Underlying the vast deserts of the Rub Al Khali (RAK),meaning the ‘Empty Quarter’, is one of the largest aquifersystems of the arid world, the Rub Al Khali Aquifer System(RAKAS) of the Arabian Peninsula. This aquifer extends forsome 650,000 km2 in the southern third of the Arabian Pen-insula in southern Saudi Arabia, Oman, Yemen, and UnitedArab Emirates (Fig. 1). With the exception of a few settle-ments at the outskirts of the desert, the RAK remains largelyuninhabited and undeveloped because of its harsh climaticconditions (temperatures > 50 �C in summer) and largelyinaccessible terrain. The RAK encompasses the largest dunefields on Earth with some dunes reaching hundreds of me-ters high. These problems together with a lack of under-standing of the area’s groundwater potential havehindered plans for its development. In this manuscript, wepresent the results of a preliminary integrated investiga-tion, involving geochemical, isotopic, field, and remotesensing data that addresses the origin and evolution of thegroundwater of the RAKAS.
Understanding the origin, evolution, and magnitude ofthis major groundwater resource is crucial for optimalmanagement of the RAK. This paper summarizes geochem-ical and isotopic data for 24 groundwater samples obtainedduring a sampling expedition to the RAK in February/March
2006. Interpretation of geochemical and isotopic data wasconducted in the context of relevant geologic and hydrog-eologic data sets including: spatial variations in hydraulichead, distribution of recharge areas (extracted from geo-logic maps), distribution of watersheds and drainage net-works (extracted from digital elevation data), andtemporal precipitation over the watersheds. The latterwas extracted from 3-hourly TRMM (Tropical Rainfall Mea-suring Mission) precipitation data for a nine year time per-iod of 1998–2006. We also show that there are indicationsthat groundwater resources in the RAK are apparently sig-nificant compared to other areas in the Peninsula and offerdevelopment potential that merits further detailedinvestigations.
Geology, hydrogeology, landforms, and climateof the RAK
To date, only limited detailed studies have been conductedon the hydrogeology of the RAK in Saudi Arabia. These inad-equacies will be addressed in part by examining our datasets in the context of the more thoroughly studied portionsof the RAK in neighboring countries (United Arab Emiratesand Oman) and that of areas of similar hydrogeologic andclimatic settings in neighboring countries. Such an approachcould potentially provide insights into the origin and evolu-tion of groundwater in the study area.
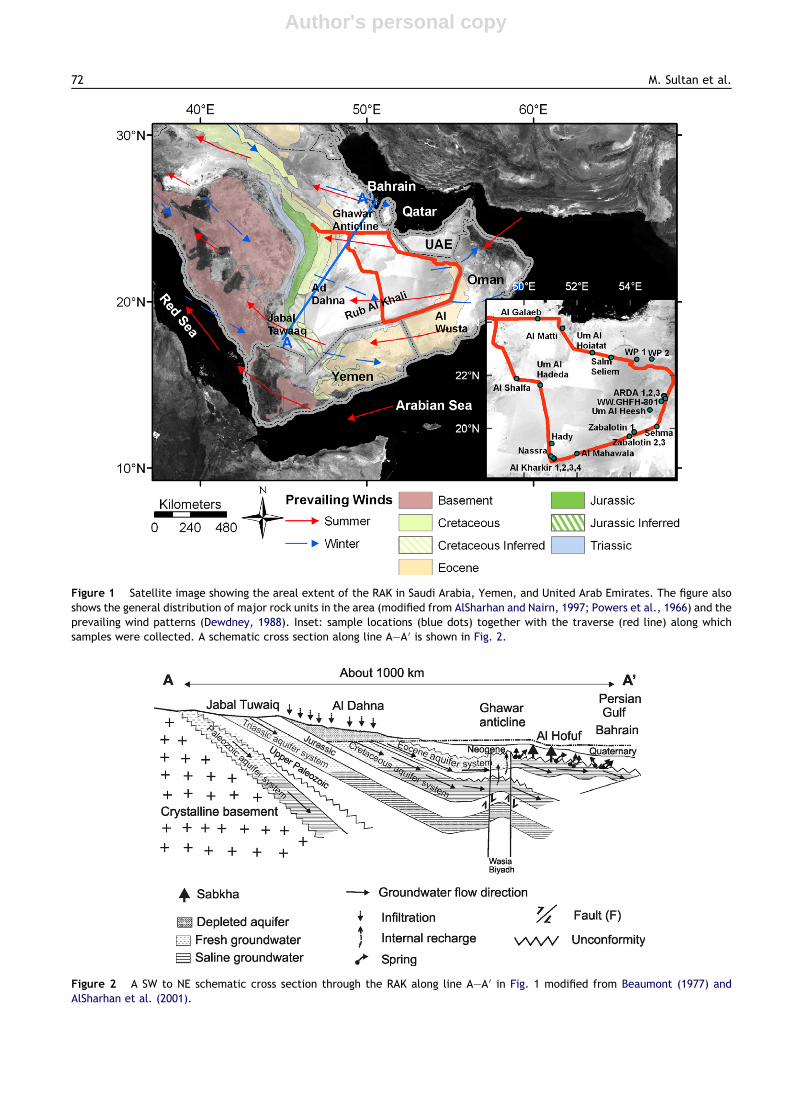
Precambrian crystalline basement of the Arabian Shieldcrops out along the eastern margins of the Red Sea coast-line forming the westernmost margin of the RAK terrain.The basement complex rocks are impermeable and ground-water in basement areas is found in fractures or in thealluvial aquifers within the wadi network dissecting thesedomains. Unconformably overlying the crystalline base-ment are thick sequences of sedimentary formations rang-ing in age from Cambrian to recent; they dip gently to theeast and thicken in the same direction reaching thickness-es of up to 5 km in the vicinity of the Persian Gulf. Thesestratigraphic relationships are demonstrated in Fig. 2, ageneralized schematic cross-section along a SW to NEtrending transect.
Geochemical, isotopic, and remote sensing constraints 71
Author's personal copy
Figure 1 Satellite image showing the areal extent of the RAK in Saudi Arabia, Yemen, and United Arab Emirates. The figure alsoshows the general distribution of major rock units in the area (modified from AlSharhan and Nairn, 1997; Powers et al., 1966) and theprevailing wind patterns (Dewdney, 1988). Inset: sample locations (blue dots) together with the traverse (red line) along whichsamples were collected. A schematic cross section along line A–A 0 is shown in Fig. 2.
Figure 2 A SW to NE schematic cross section through the RAK along line A–A 0 in Fig. 1 modified from Beaumont (1977) andAlSharhan et al. (2001).
72 M. Sultan et al.

Author's personal copy
Groundwater in the RAK is hosted primarily in sandstone,limestone, and dolomite formations separated by interleav-ing confining shale units. These aquifers are here groupedin: (1) Paleozoic sandstone aquifers (e.g., Wajid aquifer:200–900 m thick) and limestone and dolomite aquifers ofthe Kuff formation (250–600 m), (2) Mesozoic sandstoneaquifer (e.g., Minjur: 400 m thick; Biyadh-Wasia: 425 m),and (3) Cenozoic (Eocene and Neogene) limestone and dolo-mite (e.g., Umm er Radhuma: 250–700 m; Dammam:250 m) (Al Alawi and Abdulrazzak, 1994; AlSharhan et al.,2001; Ministry for Higher Education, 2000).
These sedimentary formations are exposed in the foot-hills of the Red Sea Hills providing ample opportunities forgroundwater recharge for all aquifers (Cambrian to Quater-nary) from rain precipitating over the Red Sea Hills and sur-roundings. Precipitation is concentrated over the mountainranges and/or highlands surrounding the area from the west(Red Sea Hills), east (Oman mountains), south (e.g., Hadr-amount and Dhofar mountains), and north (Yabrin moun-tains) and is channeled by an extensive E–W trendingwatershed intercepting the recharge areas. These relation-ships are demonstrated in Fig. 3a, which shows a mosaic ofLandsat Thematic Mapper scenes draped over digital eleva-tion data for the RAK and surrounding mountains and a sim-ilar drape for the major watersheds and drainage networksin the area (Fig. 3b). The precipitation over the southernand eastern highlands is less likely to recharge the aquifersequence in its entirety since only the more recent aquifers
(Cenozoic) crop out at the foothills of these mountainranges.
Radiocarbon dating of groundwater samples from a num-ber of these reservoirs (Saq: 22,000–28,000 ka; Biyadh-Wa-sia: 8000–16,000 ka; Umm er Radhuma: 10,000–28,000 ka)have lead to interpretations suggesting that these reservoirswere recharged during previous wet climatic periods in theQuaternary (AlSharhan, 2003; Beaumont, 1977; Otkun,1971). Although we believe that the aquifers are largelyformed of fossil water, we suggest that during the interven-ing dry periods, as is the case now, these aquifers must re-ceive additional recharge given the relatively highprecipitation over the Red Sea Hills and the presence of anetwork of ephemeral streams that can channel thesewaters to the recharge areas at the foothills of these moun-tains. This has been demonstrated to be the case in similarsettings in the Eastern Desert of Egypt and the Sinai Penin-sula (Sultan et al., 2007).
Sample locations and methodology
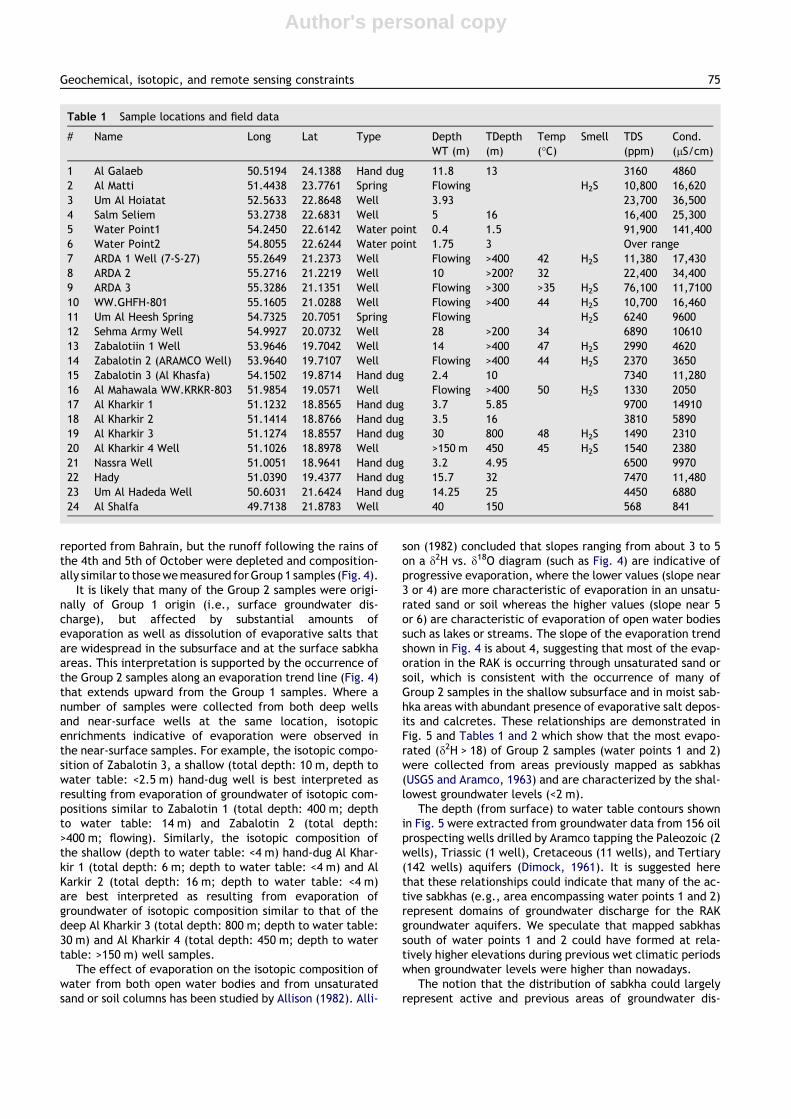
A set of water samples from 24 locations was collectedalong a traverse that covered the eastern half of the RAKfrom locations shown in the inset of Fig. 1. The sample loca-tions are between latitudes 19� and 24�N, and longitudes 50�and 56�E. Samples are grouped in two groups, Group 1 andGroup 2. Group 1 samples are from deep (>150 m deep)groundwater aquifers and were collected from flowing arte-sian (e.g., ARDA 1, ARDA 3, WW.GHFH-801, Zabalotin 2, AlMahawla, Al Kharkhir 4), pumped wells (e.g., ARDA 2, Seh-ma Army well, Zabalotin 1, Al Shalfa), and springs (e.g.,Um El Heesh, Al Matti). Many of these wells discharge hotwaters (temperatures of up to 50 �C) and display an H2Sodor. Group 2 samples are from shallow production wells(e.g., Um Al Hoitat, Salem Seleim), hand-dug wells (Al Ga-leab, Al Kharkhir1,2,3, Nassra, and Hady), and water points(WP 1 and 2).
Three samples were collected at each location: (1) a fil-tered, acidified 60-mL sample for cation analyses; (2) anunfiltered, unacidified 125-mL sample for anion and alkalin-ity analyses; and (3) an unfiltered, unacidified 30-mL samplefor stable isotope ratio analyses for hydrogen and oxygen.
Cations were analyzed by inductively coupled plasma-atomic emission spectrometry. Anions were analyzed byion chromatography. Alkalinity was determined by titration.Hydrogen and oxygen isotope ratios were determined by themethods of Coleman et al. (1982) and Socki et al. (1992),respectively. Hydrogen and oxygen isotope ratios are ex-pressed in the conventional d (delta) notation, where
d ¼ ½ðRsample=RsampleÞ � 1� � 1000 ð1Þ
and R represents the ratio of deuterium/hydrogen (D/H) or18O/16O, respectively, in the sample and the standard. Theresulting sample values of dD and d18O are reported in unitsof & (per mil), or parts per thousand deviation relative tothe corresponding ratios in Standard Mean Ocean Water(V-SMOW) (Coplen, 1996).
Strontium isotope ratios were measured by dynamic mul-ticollection on a VG Sector 54 thermal ionization mass spec-trometer. Strontium was concentrated from water samplesand purified using extraction chromatography, and then
Figure 3 3-D representations. (a) Landsat TM false colorimages draped over vertically exaggerated digital elevationdata (1 km SRTM). Also shown in Fig. 3a are our samplelocations (red dots) and field trip traverse (red line). (b)Watersheds (RAK watershed: yellow area) and drainage net-works extracted from SRTM data draped over 1 km SRTM data.
Geochemical, isotopic, and remote sensing constraints 73
Author's personal copy
loaded onto Re filaments with H3PO4 and TaCl5 activator.Procedural Sr blanks were <40 pg. The 87Sr/86Sr of NIST987 obtained during the period of these analyses is0.710246 ± 0.000011 (2r), with 88Sr current maintained at3 · 10�11 amps.
Stable and radiogenic isotope geochemistry inRAK groundwaters
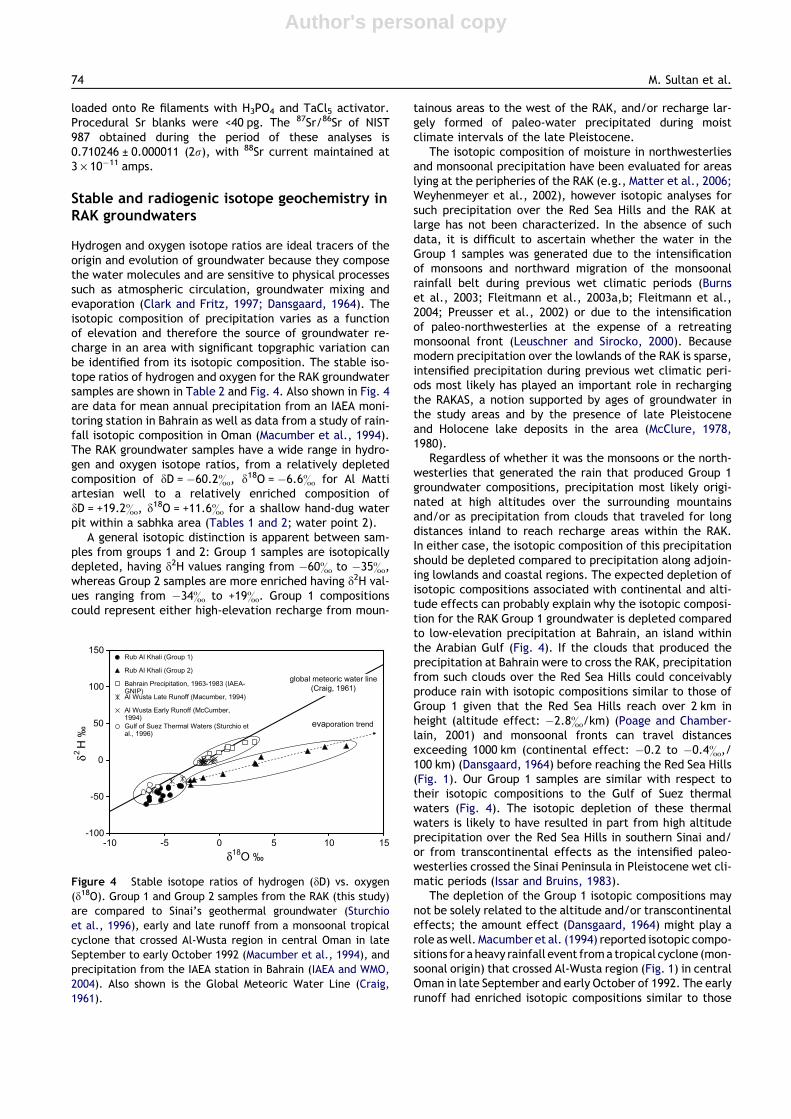
Hydrogen and oxygen isotope ratios are ideal tracers of theorigin and evolution of groundwater because they composethe water molecules and are sensitive to physical processessuch as atmospheric circulation, groundwater mixing andevaporation (Clark and Fritz, 1997; Dansgaard, 1964). Theisotopic composition of precipitation varies as a functionof elevation and therefore the source of groundwater re-charge in an area with significant topgraphic variation canbe identified from its isotopic composition. The stable iso-tope ratios of hydrogen and oxygen for the RAK groundwatersamples are shown in Table 2 and Fig. 4. Also shown in Fig. 4are data for mean annual precipitation from an IAEA moni-toring station in Bahrain as well as data from a study of rain-fall isotopic composition in Oman (Macumber et al., 1994).The RAK groundwater samples have a wide range in hydro-gen and oxygen isotope ratios, from a relatively depletedcomposition of dD = �60.2&, d18O = �6.6& for Al Mattiartesian well to a relatively enriched composition ofdD = +19.2&, d18O = +11.6& for a shallow hand-dug waterpit within a sabhka area (Tables 1 and 2; water point 2).
A general isotopic distinction is apparent between sam-ples from groups 1 and 2: Group 1 samples are isotopicallydepleted, having d2H values ranging from �60& to �35&,whereas Group 2 samples are more enriched having d2H val-ues ranging from �34& to +19&. Group 1 compositionscould represent either high-elevation recharge from moun-
tainous areas to the west of the RAK, and/or recharge lar-gely formed of paleo-water precipitated during moistclimate intervals of the late Pleistocene.
The isotopic composition of moisture in northwesterliesand monsoonal precipitation have been evaluated for areaslying at the peripheries of the RAK (e.g., Matter et al., 2006;Weyhenmeyer et al., 2002), however isotopic analyses forsuch precipitation over the Red Sea Hills and the RAK atlarge has not been characterized. In the absence of suchdata, it is difficult to ascertain whether the water in theGroup 1 samples was generated due to the intensificationof monsoons and northward migration of the monsoonalrainfall belt during previous wet climatic periods (Burnset al., 2003; Fleitmann et al., 2003a,b; Fleitmann et al.,2004; Preusser et al., 2002) or due to the intensificationof paleo-northwesterlies at the expense of a retreatingmonsoonal front (Leuschner and Sirocko, 2000). Becausemodern precipitation over the lowlands of the RAK is sparse,intensified precipitation during previous wet climatic peri-ods most likely has played an important role in rechargingthe RAKAS, a notion supported by ages of groundwater inthe study areas and by the presence of late Pleistoceneand Holocene lake deposits in the area (McClure, 1978,1980).
Regardless of whether it was the monsoons or the north-westerlies that generated the rain that produced Group 1groundwater compositions, precipitation most likely origi-nated at high altitudes over the surrounding mountainsand/or as precipitation from clouds that traveled for longdistances inland to reach recharge areas within the RAK.In either case, the isotopic composition of this precipitationshould be depleted compared to precipitation along adjoin-ing lowlands and coastal regions. The expected depletion ofisotopic compositions associated with continental and alti-tude effects can probably explain why the isotopic composi-tion for the RAK Group 1 groundwater is depleted comparedto low-elevation precipitation at Bahrain, an island withinthe Arabian Gulf (Fig. 4). If the clouds that produced theprecipitation at Bahrain were to cross the RAK, precipitationfrom such clouds over the Red Sea Hills could conceivablyproduce rain with isotopic compositions similar to those ofGroup 1 given that the Red Sea Hills reach over 2 km inheight (altitude effect: �2.8&/km) (Poage and Chamber-lain, 2001) and monsoonal fronts can travel distancesexceeding 1000 km (continental effect: �0.2 to �0.4&,/100 km) (Dansgaard, 1964) before reaching the Red Sea Hills(Fig. 1). Our Group 1 samples are similar with respect totheir isotopic compositions to the Gulf of Suez thermalwaters (Fig. 4). The isotopic depletion of these thermalwaters is likely to have resulted in part from high altitudeprecipitation over the Red Sea Hills in southern Sinai and/or from transcontinental effects as the intensified paleo-westerlies crossed the Sinai Peninsula in Pleistocene wet cli-matic periods (Issar and Bruins, 1983).
The depletion of the Group 1 isotopic compositions maynot be solely related to the altitude and/or transcontinentaleffects; the amount effect (Dansgaard, 1964) might play arole aswell. Macumber et al. (1994) reported isotopic compo-sitions for aheavy rainfall event froma tropical cyclone (mon-soonal origin) that crossed Al-Wusta region (Fig. 1) in centralOman in late September and early October of 1992. The earlyrunoff had enriched isotopic compositions similar to those
-100
-50
0
50
100
150
-10 -5 0 5 10 15
Rub Al Khali (Group 1)
Rub Al Khali (Group 2)
Bahrain Precipitation, 1963-1983 (IAEA-GNIP)Al Wusta Late Runoff (Macumber, 1994)
Al Wusta Early Runoff (McCumber,1994)Gulf of Suez Thermal Waters (Sturchio etal., 1996)
evaporation trend
δ18O ‰
δ2H
‰
global meteoric water line(Craig, 1961)
Figure 4 Stable isotope ratios of hydrogen (dD) vs. oxygen(d18O). Group 1 and Group 2 samples from the RAK (this study)are compared to Sinai’s geothermal groundwater (Sturchioet al., 1996), early and late runoff from a monsoonal tropicalcyclone that crossed Al-Wusta region in central Oman in lateSeptember to early October 1992 (Macumber et al., 1994), andprecipitation from the IAEA station in Bahrain (IAEA and WMO,2004). Also shown is the Global Meteoric Water Line (Craig,1961).
74 M. Sultan et al.
Author's personal copy
reported from Bahrain, but the runoff following the rains ofthe 4th and 5th of October were depleted and composition-ally similar to thosewemeasured forGroup 1 samples (Fig. 4).
It is likely that many of the Group 2 samples were origi-nally of Group 1 origin (i.e., surface groundwater dis-charge), but affected by substantial amounts ofevaporation as well as dissolution of evaporative salts thatare widespread in the subsurface and at the surface sabkhaareas. This interpretation is supported by the occurrence ofthe Group 2 samples along an evaporation trend line (Fig. 4)that extends upward from the Group 1 samples. Where anumber of samples were collected from both deep wellsand near-surface wells at the same location, isotopicenrichments indicative of evaporation were observed inthe near-surface samples. For example, the isotopic compo-sition of Zabalotin 3, a shallow (total depth: 10 m, depth towater table: <2.5 m) hand-dug well is best interpreted asresulting from evaporation of groundwater of isotopic com-positions similar to Zabalotin 1 (total depth: 400 m; depthto water table: 14 m) and Zabalotin 2 (total depth:>400 m; flowing). Similarly, the isotopic composition ofthe shallow (depth to water table: <4 m) hand-dug Al Khar-kir 1 (total depth: 6 m; depth to water table: <4 m) and AlKarkir 2 (total depth: 16 m; depth to water table: <4 m)are best interpreted as resulting from evaporation ofgroundwater of isotopic composition similar to that of thedeep Al Kharkir 3 (total depth: 800 m; depth to water table:30 m) and Al Kharkir 4 (total depth: 450 m; depth to watertable: >150 m) well samples.
The effect of evaporation on the isotopic composition ofwater from both open water bodies and from unsaturatedsand or soil columns has been studied by Allison (1982). Alli-
son (1982) concluded that slopes ranging from about 3 to 5on a d2H vs. d18O diagram (such as Fig. 4) are indicative ofprogressive evaporation, where the lower values (slope near3 or 4) are more characteristic of evaporation in an unsatu-rated sand or soil whereas the higher values (slope near 5or 6) are characteristic of evaporation of open water bodiessuch as lakes or streams. The slope of the evaporation trendshown in Fig. 4 is about 4, suggesting that most of the evap-oration in the RAK is occurring through unsaturated sand orsoil, which is consistent with the occurrence of many ofGroup 2 samples in the shallow subsurface and in moist sab-hka areas with abundant presence of evaporative salt depos-its and calcretes. These relationships are demonstrated inFig. 5 and Tables 1 and 2 which show that the most evapo-rated (d2H > 18) of Group 2 samples (water points 1 and 2)were collected from areas previously mapped as sabkhas(USGS and Aramco, 1963) and are characterized by the shal-lowest groundwater levels (<2 m).
The depth (from surface) to water table contours shownin Fig. 5 were extracted from groundwater data from 156 oilprospecting wells drilled by Aramco tapping the Paleozoic (2wells), Triassic (1 well), Cretaceous (11 wells), and Tertiary(142 wells) aquifers (Dimock, 1961). It is suggested herethat these relationships could indicate that many of the ac-tive sabkhas (e.g., area encompassing water points 1 and 2)represent domains of groundwater discharge for the RAKgroundwater aquifers. We speculate that mapped sabkhassouth of water points 1 and 2 could have formed at rela-tively higher elevations during previous wet climatic periodswhen groundwater levels were higher than nowadays.
The notion that the distribution of sabkha could largelyrepresent active and previous areas of groundwater dis-
Table 1 Sample locations and field data
# Name Long Lat Type DepthWT (m)
TDepth(m)
Temp(�C)
Smell TDS(ppm)
Cond.(lS/cm)
1 Al Galaeb 50.5194 24.1388 Hand dug 11.8 13 3160 48602 Al Matti 51.4438 23.7761 Spring Flowing H2S 10,800 16,6203 Um Al Hoiatat 52.5633 22.8648 Well 3.93 23,700 36,5004 Salm Seliem 53.2738 22.6831 Well 5 16 16,400 25,3005 Water Point1 54.2450 22.6142 Water point 0.4 1.5 91,900 141,4006 Water Point2 54.8055 22.6244 Water point 1.75 3 Over range7 ARDA 1 Well (7-S-27) 55.2649 21.2373 Well Flowing >400 42 H2S 11,380 17,4308 ARDA 2 55.2716 21.2219 Well 10 >200? 32 22,400 34,4009 ARDA 3 55.3286 21.1351 Well Flowing >300 >35 H2S 76,100 11,710010 WW.GHFH-801 55.1605 21.0288 Well Flowing >400 44 H2S 10,700 16,46011 Um Al Heesh Spring 54.7325 20.7051 Spring Flowing H2S 6240 960012 Sehma Army Well 54.9927 20.0732 Well 28 >200 34 6890 1061013 Zabalotiin 1 Well 53.9646 19.7042 Well 14 >400 47 H2S 2990 462014 Zabalotin 2 (ARAMCO Well) 53.9640 19.7107 Well Flowing >400 44 H2S 2370 365015 Zabalotin 3 (Al Khasfa) 54.1502 19.8714 Hand dug 2.4 10 7340 11,28016 Al Mahawala WW.KRKR-803 51.9854 19.0571 Well Flowing >400 50 H2S 1330 205017 Al Kharkir 1 51.1232 18.8565 Hand dug 3.7 5.85 9700 1491018 Al Kharkir 2 51.1414 18.8766 Hand dug 3.5 16 3810 589019 Al Kharkir 3 51.1274 18.8557 Hand dug 30 800 48 H2S 1490 231020 Al Kharkir 4 Well 51.1026 18.8978 Well >150 m 450 45 H2S 1540 238021 Nassra Well 51.0051 18.9641 Hand dug 3.2 4.95 6500 997022 Hady 51.0390 19.4377 Hand dug 15.7 32 7470 11,48023 Um Al Hadeda Well 50.6031 21.6424 Hand dug 14.25 25 4450 688024 Al Shalfa 49.7138 21.8783 Well 40 150 568 841
Geochemical, isotopic, and remote sensing constraints 75
Author's personal copy
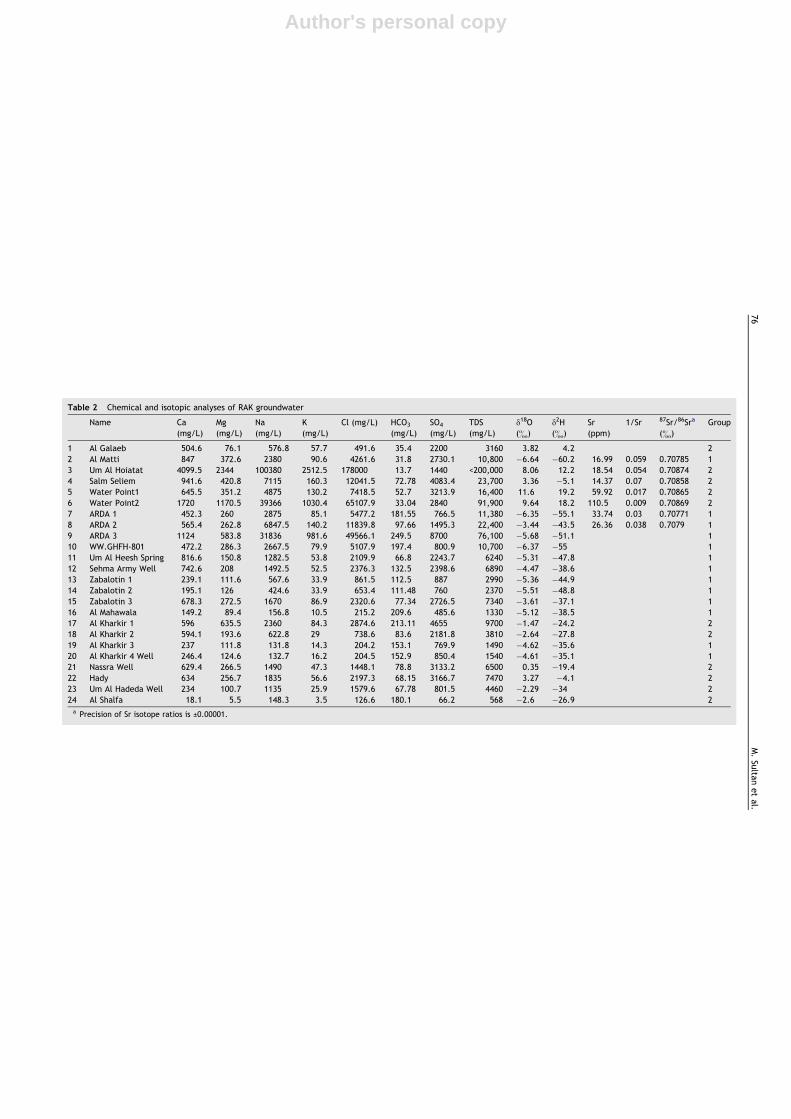
Table 2 Chemical and isotopic analyses of RAK groundwater
Name Ca(mg/L)
Mg(mg/L)
Na(mg/L)
K(mg/L)
Cl (mg/L) HCO3
(mg/L)SO4
(mg/L)TDS(mg/L)
d18O(&)
d2H(&)
Sr(ppm)
1/Sr 87Sr/86Sra
(&)Group
1 Al Galaeb 504.6 76.1 576.8 57.7 491.6 35.4 2200 3160 3.82 4.2 22 Al Matti 847 372.6 2380 90.6 4261.6 31.8 2730.1 10,800 �6.64 �60.2 16.99 0.059 0.70785 13 Um Al Hoiatat 4099.5 2344 100380 2512.5 178000 13.7 1440 <200,000 8.06 12.2 18.54 0.054 0.70874 24 Salm Seliem 941.6 420.8 7115 160.3 12041.5 72.78 4083.4 23,700 3.36 �5.1 14.37 0.07 0.70858 25 Water Point1 645.5 351.2 4875 130.2 7418.5 52.7 3213.9 16,400 11.6 19.2 59.92 0.017 0.70865 26 Water Point2 1720 1170.5 39366 1030.4 65107.9 33.04 2840 91,900 9.64 18.2 110.5 0.009 0.70869 27 ARDA 1 452.3 260 2875 85.1 5477.2 181.55 766.5 11,380 �6.35 �55.1 33.74 0.03 0.70771 18 ARDA 2 565.4 262.8 6847.5 140.2 11839.8 97.66 1495.3 22,400 –3.44 –43.5 26.36 0.038 0.7079 19 ARDA 3 1124 583.8 31836 981.6 49566.1 249.5 8700 76,100 �5.68 �51.1 110 WW.GHFH-801 472.2 286.3 2667.5 79.9 5107.9 197.4 800.9 10,700 �6.37 �55 111 Um Al Heesh Spring 816.6 150.8 1282.5 53.8 2109.9 66.8 2243.7 6240 �5.31 �47.8 112 Sehma Army Well 742.6 208 1492.5 52.5 2376.3 132.5 2398.6 6890 �4.47 �38.6 113 Zabalotin 1 239.1 111.6 567.6 33.9 861.5 112.5 887 2990 �5.36 �44.9 114 Zabalotin 2 195.1 126 424.6 33.9 653.4 111.48 760 2370 �5.51 �48.8 115 Zabalotin 3 678.3 272.5 1670 86.9 2320.6 77.34 2726.5 7340 �3.61 �37.1 116 Al Mahawala 149.2 89.4 156.8 10.5 215.2 209.6 485.6 1330 �5.12 �38.5 117 Al Kharkir 1 596 635.5 2360 84.3 2874.6 213.11 4655 9700 �1.47 �24.2 218 Al Kharkir 2 594.1 193.6 622.8 29 738.6 83.6 2181.8 3810 �2.64 �27.8 219 Al Kharkir 3 237 111.8 131.8 14.3 204.2 153.1 769.9 1490 �4.62 �35.6 120 Al Kharkir 4 Well 246.4 124.6 132.7 16.2 204.5 152.9 850.4 1540 �4.61 �35.1 121 Nassra Well 629.4 266.5 1490 47.3 1448.1 78.8 3133.2 6500 0.35 �19.4 222 Hady 634 256.7 1835 56.6 2197.3 68.15 3166.7 7470 3.27 �4.1 223 Um Al Hadeda Well 234 100.7 1135 25.9 1579.6 67.78 801.5 4460 �2.29 �34 224 Al Shalfa 18.1 5.5 148.3 3.5 126.6 180.1 66.2 568 �2.6 �26.9 2a Precision of Sr isotope ratios is ±0.00001.
76
M.Su
ltanetal.

Author's personal copy
Figure 5 Spatial variations in d18O values for our groundwater samples and depth to water table extracted from the Aramco welldata set. The depth (from surface) to water table contours were extracted from groundwater data from 156 oil prospecting wellsdrilled by Aramco tapping the Paleozoic (2 wells), Triassic (1 well), Cretaceous (11 wells), and Tertiary (142 wells) aquifers (Dimock,1961). Additional data (TDS and static head) from the same wells are given in Fig. 8. Also shown is the distribution of sabkhas (USGSand Aramco, 1963).
0.05 0.10 0.15
1/Sr (mg/L)-1
Group 1
seawater
0.7075
0.7080
0.7085
0.7090
0.7095
0 10 20 30 40
Age (Ma)
87S
r/86
Sr
Group 2
DePaolo & Finger, 1991
Hess, 1991
DePaolo & Ingram, 1985
Figure 6 87Sr/86Sr ratios versus 1/Sr concentrations (mg/L) for Group 1 and Group 2 groundwater samples that are proximal(<200 km) to the Gulf. Group 1 samples have Sr isotope ratios similar to Eocene seawater, and Group 2 samples have Sr isotope ratiossimilar to Neogene seawater, indicating significant water–rock interaction within Eocene and Neogene aquifers, respectively.Variations in Sr isotopic ratios through time for seawater were extracted from Depaolo and Finger (1991), Hess et al. (1991) andDepaolo and Ingram (1985).
Geochemical, isotopic, and remote sensing constraints 77
Author's personal copy
charge as opposed to representing coastal sabkha settingsaffected by mixing with seawater as previously suggested(Glennie, 1970) is further tested by examining the Sr isotopesystematics in a representative suite of our groundwatersamples. Seven groundwater samples classified as Group 1(Al Matti, ARDA 1, 2) and Group 2 samples (Um Al Hoitat,Salem Seliem, water points 1 and 2) that were collectedfrom locations proximal (<200 km) to the Gulf were ana-lyzed for their 87Sr/86Sr compositions and Sr concentrations(Table 2; Fig. 6). Sr87/Sr86 ratios are less radiogenic(0.70771 to 0.70874) and Sr concentrations are high (14.4to 59.9 ppm) compared to modern seawater compositions(Sr87/Sr86 = 0.70932 and Sr = 8 ppm) and no obvious mixingtrends with modern seawater composition are observed sug-gesting that these sabkhas are not marine in origin. Centralto understanding the hydrologic setting (recharge, trans-port, and discharge) of the RAK groundwater is the originand evolution of the solutes of these waters.
Chemical composition of groundwaters
Chemical data for the 24 water samples collected in thisstudy are listed in Table 2. The samples have a wide rangeconcentration of total dissolved solids (�600–92,000 mg/L) that is dominated by a Na–Ca–Cl–SO4 salt assemblage.
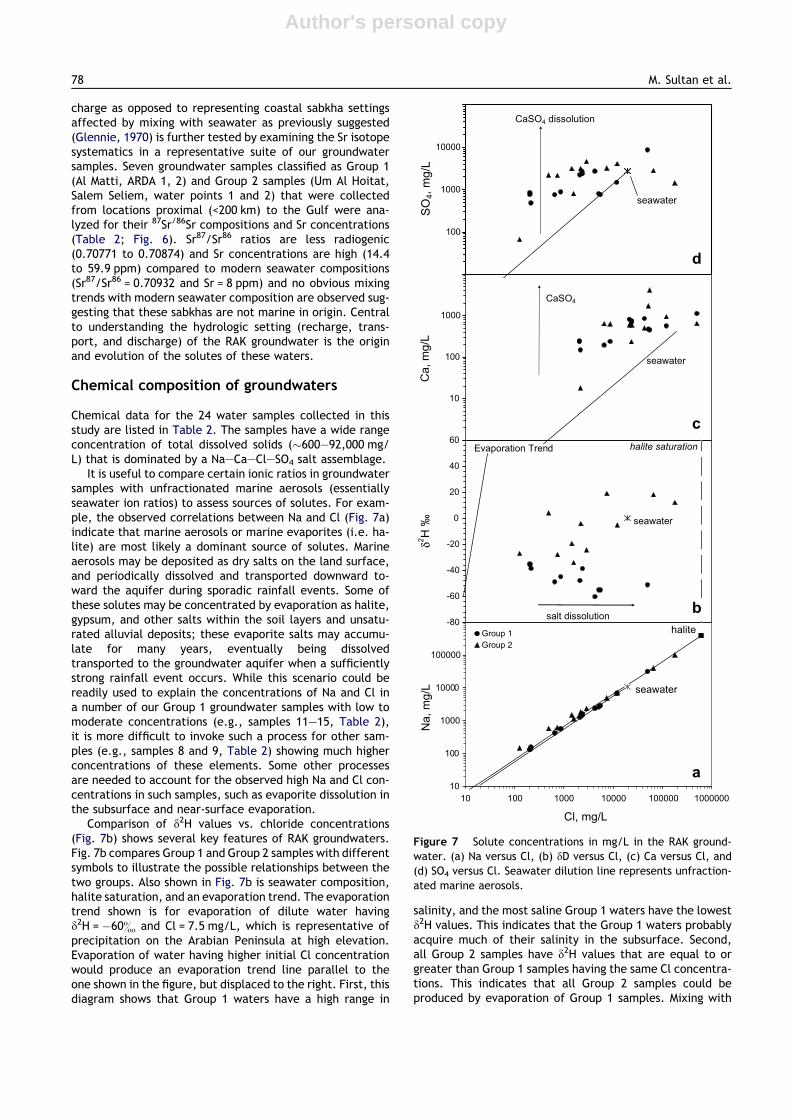
It is useful to compare certain ionic ratios in groundwatersamples with unfractionated marine aerosols (essentiallyseawater ion ratios) to assess sources of solutes. For exam-ple, the observed correlations between Na and Cl (Fig. 7a)indicate that marine aerosols or marine evaporites (i.e. ha-lite) are most likely a dominant source of solutes. Marineaerosols may be deposited as dry salts on the land surface,and periodically dissolved and transported downward to-ward the aquifer during sporadic rainfall events. Some ofthese solutes may be concentrated by evaporation as halite,gypsum, and other salts within the soil layers and unsatu-rated alluvial deposits; these evaporite salts may accumu-late for many years, eventually being dissolvedtransported to the groundwater aquifer when a sufficientlystrong rainfall event occurs. While this scenario could bereadily used to explain the concentrations of Na and Cl ina number of our Group 1 groundwater samples with low tomoderate concentrations (e.g., samples 11–15, Table 2),it is more difficult to invoke such a process for other sam-ples (e.g., samples 8 and 9, Table 2) showing much higherconcentrations of these elements. Some other processesare needed to account for the observed high Na and Cl con-centrations in such samples, such as evaporite dissolution inthe subsurface and near-surface evaporation.
Comparison of d2H values vs. chloride concentrations(Fig. 7b) shows several key features of RAK groundwaters.Fig. 7b compares Group 1 and Group 2 samples with differentsymbols to illustrate the possible relationships between thetwo groups. Also shown in Fig. 7b is seawater composition,halite saturation, and an evaporation trend. The evaporationtrend shown is for evaporation of dilute water havingd2H = �60& and Cl = 7.5 mg/L, which is representative ofprecipitation on the Arabian Peninsula at high elevation.Evaporation of water having higher initial Cl concentrationwould produce an evaporation trend line parallel to theone shown in the figure, but displaced to the right. First, thisdiagram shows that Group 1 waters have a high range in
salinity, and the most saline Group 1 waters have the lowestd2H values. This indicates that the Group 1 waters probablyacquire much of their salinity in the subsurface. Second,all Group 2 samples have d2H values that are equal to orgreater than Group 1 samples having the same Cl concentra-tions. This indicates that all Group 2 samples could beproduced by evaporation of Group 1 samples. Mixing with
100
1000
10000
SO4,
mg/
L
seawater
CaSO4 dissolution
10
100
1000
Ca,
mg/
L
seawater
CaSO4
10
100
1000
10000
100000
10 100 1000 10000 100000 1000000
Cl, mg/L
Na,
mg/
L
Group 1Group 2
seawater
halite-80
-60
-40
-20
0
20
40
60Evaporation Trend
seawater
halite saturation
salt dissolution
δ2 H ‰
Figure 7 Solute concentrations in mg/L in the RAK ground-water. (a) Na versus Cl, (b) dD versus Cl, (c) Ca versus Cl, and(d) SO4 versus Cl. Seawater dilution line represents unfraction-ated marine aerosols.
78 M. Sultan et al.
Author's personal copy
seawater is contradicted by the observed relationship be-tween d2H and salinity, especially for Group 1 waters, indi-cating that seawater intrusion does not play a major rolein salinization of groundwater at the sampled locations.
The sources of salinity in the RAK groundwaters can beconstrained further by considering the deviation of solutecompositions from those derived strictly from marine aero-sols. For example, Fig. 7d shows the relation between sul-fate and chloride concentrations, and there is a strongenrichment of sulfate relative to that which can be attrib-uted to marine aerosols. The most likely source for this sul-fate is from dissolution of anhydrite or gypsum in thesubsurface (for Group 1 samples) or in the shallow near-sur-face environment (Group 2 samples). Additional evidencesupporting Ca mineral dissolution as a major contributionto salinity is given by the relationship between Ca and Cl con-centrations as shown in Fig. 7c. Fig. 7c and d indicates thatthere are about the same Ca and SO4 concentrations in sam-ples having 1000 mg/L Cl as in samples having 10,000 mg/LCl, so the Ca and SO4 concentrations are likely being con-trolled by mineral dissolution instead of fluid mixing.
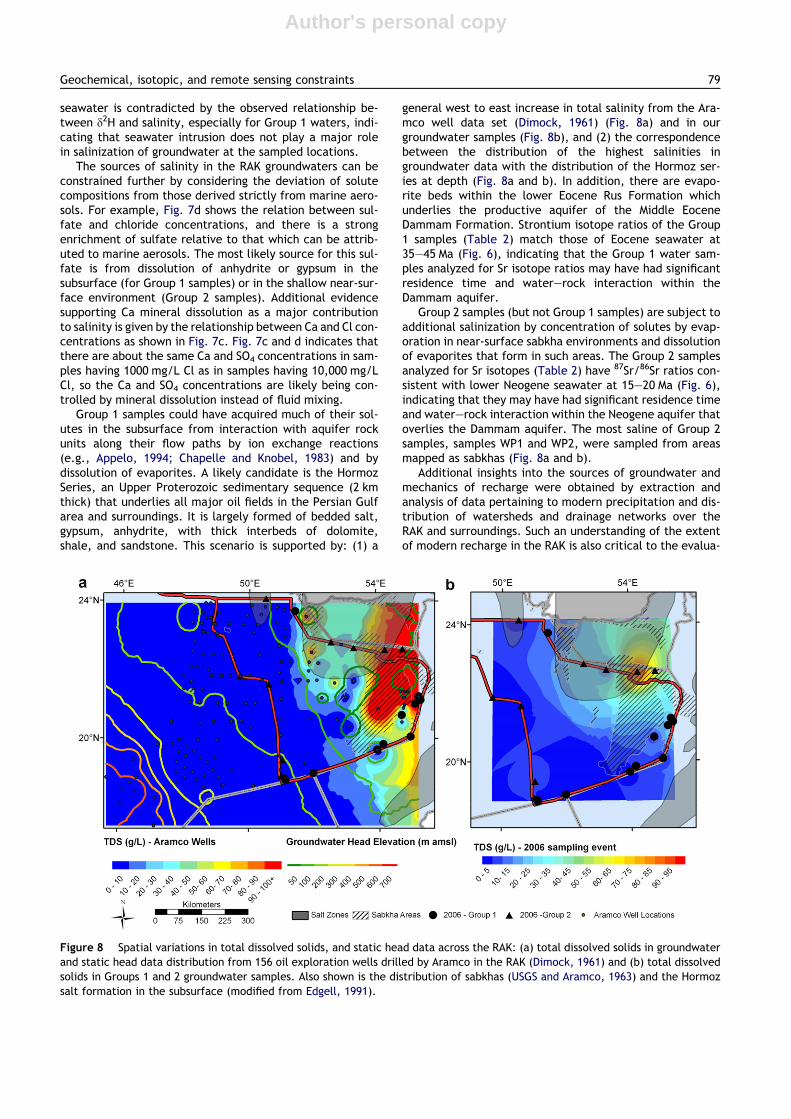
Group 1 samples could have acquired much of their sol-utes in the subsurface from interaction with aquifer rockunits along their flow paths by ion exchange reactions(e.g., Appelo, 1994; Chapelle and Knobel, 1983) and bydissolution of evaporites. A likely candidate is the HormozSeries, an Upper Proterozoic sedimentary sequence (2 kmthick) that underlies all major oil fields in the Persian Gulfarea and surroundings. It is largely formed of bedded salt,gypsum, anhydrite, with thick interbeds of dolomite,shale, and sandstone. This scenario is supported by: (1) a
general west to east increase in total salinity from the Ara-mco well data set (Dimock, 1961) (Fig. 8a) and in ourgroundwater samples (Fig. 8b), and (2) the correspondencebetween the distribution of the highest salinities ingroundwater data with the distribution of the Hormoz ser-ies at depth (Fig. 8a and b). In addition, there are evapo-rite beds within the lower Eocene Rus Formation whichunderlies the productive aquifer of the Middle EoceneDammam Formation. Strontium isotope ratios of the Group1 samples (Table 2) match those of Eocene seawater at35–45 Ma (Fig. 6), indicating that the Group 1 water sam-ples analyzed for Sr isotope ratios may have had significantresidence time and water–rock interaction within theDammam aquifer.
Group 2 samples (but not Group 1 samples) are subject toadditional salinization by concentration of solutes by evap-oration in near-surface sabkha environments and dissolutionof evaporites that form in such areas. The Group 2 samplesanalyzed for Sr isotopes (Table 2) have 87Sr/86Sr ratios con-sistent with lower Neogene seawater at 15–20 Ma (Fig. 6),indicating that they may have had significant residence timeand water–rock interaction within the Neogene aquifer thatoverlies the Dammam aquifer. The most saline of Group 2samples, samples WP1 and WP2, were sampled from areasmapped as sabkhas (Fig. 8a and b).
Additional insights into the sources of groundwater andmechanics of recharge were obtained by extraction andanalysis of data pertaining to modern precipitation and dis-tribution of watersheds and drainage networks over theRAK and surroundings. Such an understanding of the extentof modern recharge in the RAK is also critical to the evalua-
Figure 8 Spatial variations in total dissolved solids, and static head data across the RAK: (a) total dissolved solids in groundwaterand static head data distribution from 156 oil exploration wells drilled by Aramco in the RAK (Dimock, 1961) and (b) total dissolvedsolids in Groups 1 and 2 groundwater samples. Also shown is the distribution of sabkhas (USGS and Aramco, 1963) and the Hormozsalt formation in the subsurface (modified from Edgell, 1991).
Geochemical, isotopic, and remote sensing constraints 79

Author's personal copy
tion of the groundwater development potential for the RAKgroundwater.
Modern contributions to the RAKAS
Channel networks and watershed boundaries were extractedfor the RAK to examine runoff patterns and potential re-charge scenarios in light of the distribution of outcrops ofthe various aquifers of the RAKAS. The Topographic Param-eterization (TOPAZ) program of Garbrecht and Martz (1995)was used to extract the distribution of drainage networksand watersheds from Shuttle Radar Topography Mission
(SRTM) digital elevation data with 1 km spatial resolution(Fig. 3b). Elevation of each cell was compared to that ofthe neighboring cells, and the flow direction was assumedto be toward the cell with lowest elevation and all cellsdraining into one outlet were assumed to belong to the samewatershed. Elevation data were smoothed to avoid generat-ing false dams and pits by averaging elevations within indi-vidual cells. SRTM-derived streams and watersheds werecalibrated and validated by comparison to co-registeredLandsat and geologic maps. A major E–W trending wa-tershed and its drainage networks was delineated; this wa-tershed collects precipitation over the Red Sea Hills, and
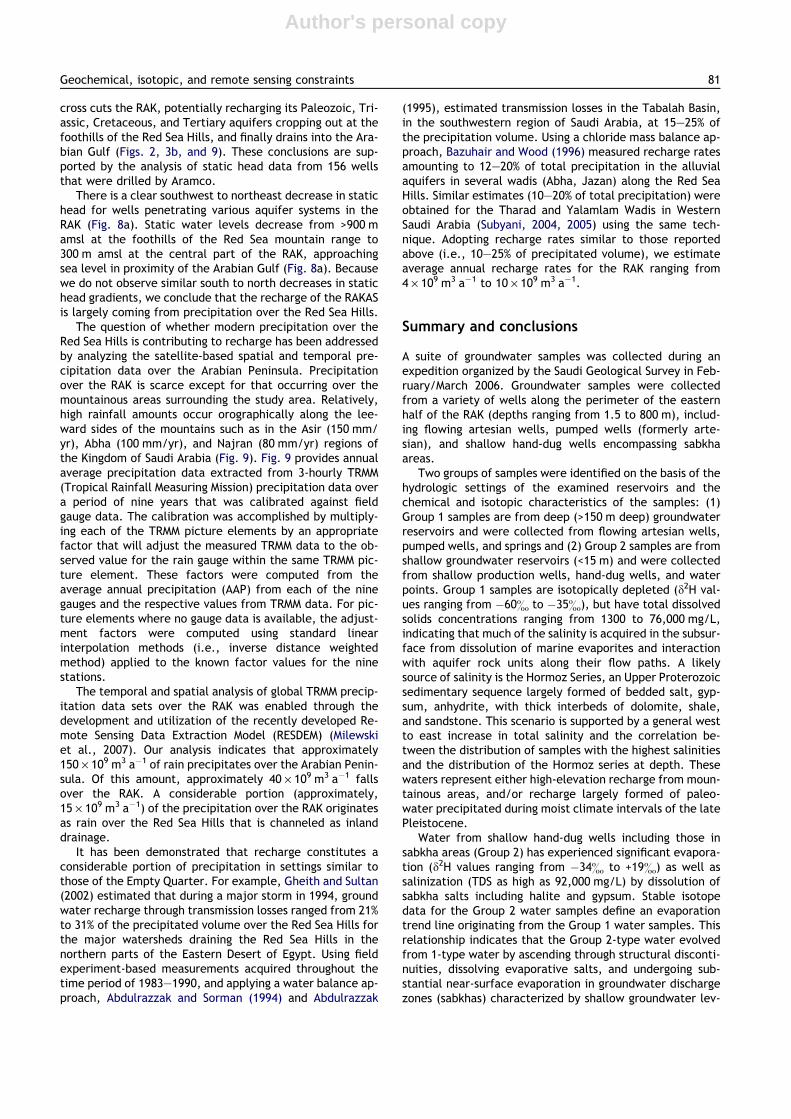
Figure 9 Average (1998–2006) annual precipitation over the Arabian Peninsula extracted from 3-hourly TRMM precipitation data.Yellow star symbols represent the locations for the nine rain gauges that were used for calibrating the TRMM precipitation data. Alsoshown are locations of two additional stations (Abha and Najran), outline of the RAK watershed, and outcrops of the RAK aquifersand their postulated extensions under the sand cover.
80 M. Sultan et al.
Author's personal copy
cross cuts the RAK, potentially recharging its Paleozoic, Tri-assic, Cretaceous, and Tertiary aquifers cropping out at thefoothills of the Red Sea Hills, and finally drains into the Ara-bian Gulf (Figs. 2, 3b, and 9). These conclusions are sup-ported by the analysis of static head data from 156 wellsthat were drilled by Aramco.
There is a clear southwest to northeast decrease in statichead for wells penetrating various aquifer systems in theRAK (Fig. 8a). Static water levels decrease from >900 mamsl at the foothills of the Red Sea mountain range to300 m amsl at the central part of the RAK, approachingsea level in proximity of the Arabian Gulf (Fig. 8a). Becausewe do not observe similar south to north decreases in statichead gradients, we conclude that the recharge of the RAKASis largely coming from precipitation over the Red Sea Hills.
The question of whether modern precipitation over theRed Sea Hills is contributing to recharge has been addressedby analyzing the satellite-based spatial and temporal pre-cipitation data over the Arabian Peninsula. Precipitationover the RAK is scarce except for that occurring over themountainous areas surrounding the study area. Relatively,high rainfall amounts occur orographically along the lee-ward sides of the mountains such as in the Asir (150 mm/yr), Abha (100 mm/yr), and Najran (80 mm/yr) regions ofthe Kingdom of Saudi Arabia (Fig. 9). Fig. 9 provides annualaverage precipitation data extracted from 3-hourly TRMM(Tropical Rainfall Measuring Mission) precipitation data overa period of nine years that was calibrated against fieldgauge data. The calibration was accomplished by multiply-ing each of the TRMM picture elements by an appropriatefactor that will adjust the measured TRMM data to the ob-served value for the rain gauge within the same TRMM pic-ture element. These factors were computed from theaverage annual precipitation (AAP) from each of the ninegauges and the respective values from TRMM data. For pic-ture elements where no gauge data is available, the adjust-ment factors were computed using standard linearinterpolation methods (i.e., inverse distance weightedmethod) applied to the known factor values for the ninestations.
The temporal and spatial analysis of global TRMM precip-itation data sets over the RAK was enabled through thedevelopment and utilization of the recently developed Re-mote Sensing Data Extraction Model (RESDEM) (Milewskiet al., 2007). Our analysis indicates that approximately150 · 109 m3 a�1 of rain precipitates over the Arabian Penin-sula. Of this amount, approximately 40 · 109 m3 a�1 fallsover the RAK. A considerable portion (approximately,15 · 109 m3 a�1) of the precipitation over the RAK originatesas rain over the Red Sea Hills that is channeled as inlanddrainage.
It has been demonstrated that recharge constitutes aconsiderable portion of precipitation in settings similar tothose of the Empty Quarter. For example, Gheith and Sultan(2002) estimated that during a major storm in 1994, groundwater recharge through transmission losses ranged from 21%to 31% of the precipitated volume over the Red Sea Hills forthe major watersheds draining the Red Sea Hills in thenorthern parts of the Eastern Desert of Egypt. Using fieldexperiment-based measurements acquired throughout thetime period of 1983–1990, and applying a water balance ap-proach, Abdulrazzak and Sorman (1994) and Abdulrazzak
(1995), estimated transmission losses in the Tabalah Basin,in the southwestern region of Saudi Arabia, at 15–25% ofthe precipitation volume. Using a chloride mass balance ap-proach, Bazuhair and Wood (1996) measured recharge ratesamounting to 12–20% of total precipitation in the alluvialaquifers in several wadis (Abha, Jazan) along the Red SeaHills. Similar estimates (10–20% of total precipitation) wereobtained for the Tharad and Yalamlam Wadis in WesternSaudi Arabia (Subyani, 2004, 2005) using the same tech-nique. Adopting recharge rates similar to those reportedabove (i.e., 10–25% of precipitated volume), we estimateaverage annual recharge rates for the RAK ranging from4 · 109 m3 a�1 to 10 · 109 m3 a�1.
Summary and conclusions
A suite of groundwater samples was collected during anexpedition organized by the Saudi Geological Survey in Feb-ruary/March 2006. Groundwater samples were collectedfrom a variety of wells along the perimeter of the easternhalf of the RAK (depths ranging from 1.5 to 800 m), includ-ing flowing artesian wells, pumped wells (formerly arte-sian), and shallow hand-dug wells encompassing sabkhaareas.
Two groups of samples were identified on the basis of thehydrologic settings of the examined reservoirs and thechemical and isotopic characteristics of the samples: (1)Group 1 samples are from deep (>150 m deep) groundwaterreservoirs and were collected from flowing artesian wells,pumped wells, and springs and (2) Group 2 samples are fromshallow groundwater reservoirs (<15 m) and were collectedfrom shallow production wells, hand-dug wells, and waterpoints. Group 1 samples are isotopically depleted (d2H val-ues ranging from �60& to �35&), but have total dissolvedsolids concentrations ranging from 1300 to 76,000 mg/L,indicating that much of the salinity is acquired in the subsur-face from dissolution of marine evaporites and interactionwith aquifer rock units along their flow paths. A likelysource of salinity is the Hormoz Series, an Upper Proterozoicsedimentary sequence largely formed of bedded salt, gyp-sum, anhydrite, with thick interbeds of dolomite, shale,and sandstone. This scenario is supported by a general westto east increase in total salinity and the correlation be-tween the distribution of samples with the highest salinitiesand the distribution of the Hormoz series at depth. Thesewaters represent either high-elevation recharge from moun-tainous areas, and/or recharge largely formed of paleo-water precipitated during moist climate intervals of the latePleistocene.
Water from shallow hand-dug wells including those insabkha areas (Group 2) has experienced significant evapora-tion (d2H values ranging from �34& to +19&) as well assalinization (TDS as high as 92,000 mg/L) by dissolution ofsabkha salts including halite and gypsum. Stable isotopedata for the Group 2 water samples define an evaporationtrend line originating from the Group 1 water samples. Thisrelationship indicates that the Group 2-type water evolvedfrom 1-type water by ascending through structural disconti-nuities, dissolving evaporative salts, and undergoing sub-stantial near-surface evaporation in groundwater dischargezones (sabkhas) characterized by shallow groundwater lev-
Geochemical, isotopic, and remote sensing constraints 81
Author's personal copy
els (<2 m). This interpretation is supported by the relativelyunradiogenic Sr isotope ratios of groundwater samples (Sr87/Sr86 = 0.70771–0.70874) that are consistent with Group 1samples having interacted with Eocene aquifer rocks andGroup 2 samples having interacted with overlying Neogeneaquifer rocks. The Sr isotope ratios are significantly differ-ent from that of modern seawater (87Sr/86Sr = 0.70932),indicating that seawater intrusion or inundation has notplayed a major role in sabkha formation.
Results point to a single recharge source for Group 1 and 2samples, most likely the precipitation falling over the RedSea Hills. This precipitation has significant potential forrecharging the Paleozoic, Triassic, Cretaceous, and Eoceneaquifers cropping out in the foothills of the Red Sea moun-tains to the east. This inference is supported by a progressivedecrease in static heads from SW to the NE, substantial pre-cipitation over the adjacent Red Sea Hills, and the presenceof a major E–W trending drainage network that channelsprecipitation towards recharge areas to the east.
Although we believe that the RAKAS is largely formed offossil water that was recharged during previous wet climaticperiods, we suggest that during the intervening dry periods,as is the case now, these aquifers must receive some addi-tional recharge. This has been demonstrated to be the casein similar settings in the Eastern Desert of Egypt and the Si-nai Peninsula (Sultan et al., 2007). To obtain first order esti-mates for modern contributions to the RAKAS, we used therecently developed Remote Sensing Data Extraction Modelto analyze global 3-hourly TRMM precipitation data sets ac-quired (1998–2006) over the Arabian Peninsula. Our analysisindicates that of the 150 · 109 m3 a�1 of precipitation thatconstitutes the average annual precipitation over the Ara-bian Peninsula, approximately 40 · 109 m3 a�1 are chan-neled towards the RAK. Adopting recharge rates (10–25%of precipitation volume) that were extracted for areas withsimilar climatic, hydrologic, geologic settings conditions inthe Red Sea Hills and surroundings in Egypt and Saudi Ara-bia, we estimate an average annual recharge rate of4 · 109 m3 a�1 to 10 · 109 m3 a�1 for the RAK.This compareswith a current total estimated water usage of about22 · 109 m3 a�1 in Saudi Arabia.
Results show that groundwater resources in the RAK areapparently significant compared to other areas in the Ara-bian Peninsula and offer development potential that meritsfurther detailed investigations. Development scenariosshould preferentially target aquifers that are proximal to re-charge areas to intercept groundwater before undergoingsubstantial dissolution of marine evaporites along their flowpaths and before being subjected to near-surface evapora-tion in discharge areas. Additional integrated studies(e.g., modeling, geochemistry, geophysics, GIS) on rechargerates, sustainability, and water quality issues for the RAKAScould potentially demonstrate that the RAK is one of themost promising sites for groundwater exploration in the Ara-bian Peninsula. Results also highlight the importance ofinvestigating the potential for sustainable exploitation ofsimilar large aquifer systems that were largely rechargedin previous wet climatic periods yet are still receiving mod-est modern meteoric contributions. Investigating and ulti-mately developing these aquifer systems could potentiallyprovide partial solutions to the mounting water shortagesin arid and hyper-arid regions.
Acknowledgments
We thank the administration of the Saudi Geological Sur-vey for arranging the field excursion to the RAK, all thegeologists of the Saudi Geological Survey who organizedand led this excursion, and the LBC for covering theexcursion.
References
Abdulrazzak, M., 1995, Water supplies versus demand in countriesof the Arabian Peninsula. Journal of Water Resources Planningand Management. v. May/June 1995.
Abdulrazzak, M.J., Sorman, A.U., 1994. Transmission losses fromephemeral stream in arid region. Journal of Irrigation andDrainage Engineering-Asce 120, 669–675.
Al Alawi, J., Abdulrazzak, M., 1994. Water in the Arabian Pennin-sula: problems and perspectives. In: Rogers, P., Lydon, P. (Eds.),Water in the Arab World; Perspectives and Prognoses. HarvardUniversity Press, pp. 171–202.
Allison, G.B., 1982. The relationship between oxygen-18 anddeuterium in water in sand columns undergoing evaporation.Journal of Hydrology 55, 163–169.
AlSharhan, A.S., 2003. Petroleum geology and potential hydrocar-bon plays in the Gulf of Suez rift basin, Egypt. AAPG Bulletin 87,143–180.
AlSharhan, A.S., Nairn, A.E.M., 1997. Sedimentary Basins andPetroleum Geology of the Middle East. Elsevier Science, 942 p.
AlSharhan, A.S., Rizk, Z.A., Nairn, A.E.M., Bakhit, D.W., AlHajari,S.A., 2001. Hydrogeology of an Arid Region. The Arabian Gulfand Adjoining Areas. Elsevier, Amsterdam.
Appelo, C.A.J., 1994. Some calculations on multicomponent trans-port with cation-exchange in aquifers. Ground Water 32, 968–975.
Bazuhair, A., Wood, W., 1996. Chloride mass-balance method forestimating ground water recharge in arid areas: examples fromWestern Saudi Arabia. Journal of Hydrology 186, 153–159.
Beaumont, P., 1977. Water development in Saudi Arabia. TheGeographical Journal 143, 42–60.
Burns, S.J., Fleitmann, D., Matter, A., Kramers, J., Al-Subbary,A.A., 2003. Indian Ocean climate and an absolute chronologyover Dansgaard/Oeschger events 9 to 13. Science 301, 1365–1367.
Chapelle, F.H., Knobel, L.L., 1983. Aqueous geochemistry and theexchangeable cation composition of glauconite in the AquiaAquifer, Maryland. Ground Water 21, 343–352.
Clark, I.D., Fritz, P., 1997. Environmental Isotopes in Hydrogeology.CRC Press/Lewis Publishers, Boca Raton, FL, 328 p.
Coleman, M.L., Shepherd, T.J., Durham, J.J., Rouse, J.E., Moore,G.R., 1982. Reduction of water with zinc for hydrogen isotopeanalysis 54, 993–995.
Coplen, T.B., 1996. New guidelines for the reporting of stablehydrogen, carbon, and oxygen isotope ratio data. Geochimica etCosmochimica Acta 60, 3369.
Craig, H., 1961. Isotopic variations in meteoric waters. Science 133,1702–1703.
Dansgaard, W., 1964. Stable isotopes in precipitation. Tellus 16,436–468.
Depaolo, D.J., Finger, K.L., 1991. High-resolution strontium-isotopestratigraphy and biostratigraphy of the miocene-monterey-for-mation, Central California. Geological Society of AmericaBulletin 103, 112–124.
Depaolo, D.J., Ingram, B.L., 1985. High-resolution stratigraphy withstrontium isotopes. Science 227, 938–941.
Dewdney, J., 1988. The Cambridge Atlas of the Middle East andNorth Africa. Cambridge University Press, UK, 74pp.
82 M. Sultan et al.

Author's personal copy
Dimock, W.C., 1961, A Study of the Water Resources of the Rub Al-Khali in Southern Saudi Arabia. Unpublished Groundwater Report22, ARAMCO, p. 183.
Edgell, H.S., 1991. Proterozoic salt basins of the Persian Gulf areaand their role in hydrocarbon generation. Precambrian Research54, 1–14.
Fleitmann, D., Burns, S.J., Mudelsee, M., Neff, U., Kramers, J.,Mangini, A., Matter, A., 2003a. Holocene forcing of the Indianmonsoon recorded in a stalagmite from Southern Oman. Science300, 1737–1739.
Fleitmann, D., Burns, S.J., Neff, U., Mangini, A., Matter, A., 2003b.Changing moisture sources over the last 330,000 years inNorthern Oman from fluid-inclusion evidence in speleothems.Quaternary Research 60, 223–232.
Fleitmann, D., Burns, S.J., Neff, U., Mudelsee, M., Mangini, A.,Matter, A., 2004. Palaeoclimatic interpretation of high-resolu-tion oxygen isotope profiles derived from annually laminatedseleothems from Southern Oman. Quaternary Science Reviews23, 935–945.
Garbrecht, J., Martz, L., 1995. TOPAZ: An Automated DigitalLandscape Analysis Tool for Topographic Evaluation, DrainageIdentification, Watershed Segmentation, and Sub-CatchmentParameterization: Overview: Agricultural Research Service v.NAWQL 95.
Gheith, H., Sultan, M., 2002. Construction of a hydrologic model forestimating wadi runoff and groundwater recharge in the easterndesert, Egypt. Journal of Hydrology 263, 36–55.
Glennie, K.W., 1970. Desert Sedementary Environments. Elsevier,Amsterdam, 222 p.
Hess, J., Bender, M., Schilling, J.G., 1991. Assessing seawaterbasalt exchange of strontium isotopes in hydrothermal processeson the flanks of Midocean ridges. Earth and Planetary ScienceLetters 103, 133–142.
IAEA, I.A.E.A., and WMO, W.M.O., 2004, Global Network forIsotopes in Precipitation, The GNIP database.
Issar, A.S., Bruins, H.J., 1983. Special climatological conditions inthe deserts of Sinai and the Negev during the latest pleistocene.Palaeogeography, Palaeoclimatology, Palaeoecology 43, 63–72.
Leuschner, D.C., Sirocko, F., 2000. The low-latitude monsoonclimate during Dansgaard–Oeschger cycles and Heinrich Events.Quaternary Science Reviews 19, 243–254.
Macumber, P.G., Al-Said, S.B.G., Kew, G.A., Tennakoon, T.B.,1994. Hydrogeologic implications of a cyclonic rainfall event incentral Oman. In: Nash, H., McCall, G.J.H. (Eds.), GroundwaterQuality. Chapman & Hall, pp. 87–97.
Matter, J.M., Waber, H.N., Loew, S., Matter, A., 2006. Rechargeareas and geochemical evolution of groundwater in an alluvialaquifer system in the Sultanate of Oman. Hydrogeology Journal14, 203–224.
McClure, H.A., 1978. Early paleozoic glaciation in Arabia. Palaeog-eography, Palaeoclimatology, Palaeoecology 25, 315–326.
McClure, H.A., 1980. Permian–carboniferous glaciation in theArabian Peninsula. Geological Society of America Bulletin 91,707–712.
Milewski, A., Sultan, M., Balekai, R., Markondiah Jayaprakash, S.,Becker, R., 2007. RESDEM, A vehicle for data mining andmodeling of temporal remote sensing data (TRMM, SSM/I,AVHRR, AMSR, MODIS, and QuikSCAT). In: Geological SocietyAmerica Annual Meeting Abstracts with Programs 39.
Ministry for Higher Education, S.A., 2000. Atlas of Saudi Arabia.Saudi Arabian Ministry for Higher Education.
Otkun, G., 1971, Paleozoic sandstone aquifers in Saudi Arabia. In:International Association of Hydrogeologists: Tokyo Congress.
Poage, M.A., Chamberlain, C.P., 2001. Empirical relationshipsbetween elevation and the stable isotope composition ofprecipitation and surface waters, Considerations for studies ofpaleoelevation change. American Journal of Science 301, 1–15.
Powers, R.W., Ramirez, L.F., Redmond, C.D., Elberg, E.L.J., 1966.Geology of the Arabian Penninsula. U.S. Geologic Survey,Professional Paper 560-D, p. 127.
Preusser, F., Radies, D., Matter, A., 2002. A 160,000-year record ofdune development and atmospheric circulation in southernArabia. Science 296, 2018–2020.
Socki, R.A., Karlsson, H.R., Gibson, E.K., 1992. Extraction tech-nique for the determination Of O-18 in water using preevacuatedglass vials. Analytical Chemistry 64, 829–831.
Sturchio, N.C., Arehart, G.B., Sultan, M., Sano, Y., AboKamar, Y.,Sayed, M., 1996. Composition and origin of thermal waters in theGulf of Suez area, Egypt. Applied Geochemistry 11, 471–479.
Subyani, A., 2004. Use of chloride mass-balance and environmentalisotopes for evaluation of groundwater recharge in the AlluvialAquifer, Wadi Tharad, Western Saudi Arabia. EnvironmentalGeology 46, 741–749.
Subyani, A., 2005. Hydrochemical identification and salinity prob-lem of ground-water in Wadi Yalamlam Basin, Western SaudiArabia. Journal of Arid Environments 60, 53–66.
Sultan, M., Yan, E., Sturchio, N., Wagdy, A., Gelil, K.A., Becker, R.,Manocha, N., Milewski, A., 2007. Natural discharge: a key tosustainable utilization of fossil groundwater. Journal of Hydrol-ogy 335, 25–36.
USGS, Aramco, 1963. Geological Map of the Arabian Penninsula,Miscelaneous Geologic Investigations Map I-270A. Ministry ofPetroleum and Mineral Resources.
Weyhenmeyer, C.E., Burns, S.J., Waber, H.N., Macumber, P.G.,2002. Isotope study of moisture sources, recharge areas, andgroundwater flow paths within the eastern Batinah coastal plain,Sultanate of Oman. Water Resources Research, 38.
Geochemical, isotopic, and remote sensing constraints 83