Embed Size (px)
DESCRIPTION
manifestasi
Citation preview
PROCEEDINGS, 4th ITB Geothermal Workshop 2015Institut Teknologi Bandung, Bandung, Indonesia, March 16-20, 2015
GEOCHEMICAL AND GEOTHERMOMETRY STUDIES ON GEOTHERMAL SYSTEMS IN MANIFESTATIONS SHOWERS SEVEN AND SHOWER THREE, BATURRADEN,
PURWOKERTO, CENTRAL JAVA
*Muhammad Abdurrozak Siamashari*Priyo Adi Nugroho
*Dhevi Andhini Antikasari*Irfania Fitria Arsah*As’ad Argiansyah
*)Universitas Jenderal SoedirmanH.R. Boenyamin, Purwokerto, Central Java
ABSTRACTGeothermal under the Act No. 21 tahun 2014 is a source of heat energy contained in the hot water, steam
and rock along with other associated minerals and gases that are genetically inseparable in a geothermal system. Most of geothermal production fields in Indonesia are situated in Java Island. Some of geothermal prospects are associated with a specific geological setting on Java. Those geological setting are on a subduction zone which is located on the South of Java Island. The subduction of oceanic crust (Indo-Australia) beneath continent crust (Eurasia) produces magma that ascends to the surface and forms a volcanic arc along Java Island. Volcanoes in Java are dominantly composed by andesitic rock that is related with a stratovolcano - high terrain geothermal system. One of geothermal systems associated with volcanic island of Java is the geothermal system in Baturraden located at the foot of Mount Slamet. Geothermal systems in Baturraden has the potential 175 MW with an area of 24 660 ha. In this geothermal systems, there are manifestations of geothermal energy in the form of hot springs and Shower Seven and Shower Three. Making this paper aims to compare both the hot springs are based on geochemical data and geotermometer fluid. Sampling for geochemical analysis is in the form of samples of water, soil, and rocks that surround the area manifestations. While collecting data for analysis geothermometry derived from water temperature and air temperature around the hot springs. We want to know hot fluid classification using Ternary diagram. Data from the diagram is used to determine the level of maturity of the geothermal system and to determine reservoir temperature and to recognize equilibrated waters suitable for geothermometry.
INTRODUCTIONIncrease in Fuel (BBM) recently give a
significant impact on price changes in Indonesian society living purposes. Based on this, renewable energy should be improved exploration and development. A fairly abundant renewable energy's existence in Indonesia is geothermal. The existence of geothermal manifestations in Indonesia covering 40% of the existence of geothermal energy in the world. But in reality in Indonesia geothermal energy utilization reached only 1.4% of all energy sources in Indonesia. Seeing this, the exploration activities of geothermal fields new ones need to be improved and the development of which concern in earth heat field that has been found. In the field of geothermal exploration activities there are several methods that can be used. One is the method of geochemical sampling with the object is water, gas, and soil or rock surrounding the geothermal manifestations.
According to other sources, Indonesia has a total potential of geothermal resources and reserves amounted to 27 189 MW (ie a potential of 14 244 MW, 9912 MW unexpected reserves, probably 728
MW and 2,305 MW proven) or approximately 40% of potential world (Wahyuningsih, 2005). However the new 807 MW of the total potential is utilized to meet the electricity needs of Indonesia. Central Java is an area that has lots of geothermal prospects indicated by the presence of geothermal manifestations on the surface, such as hot springs, fumaroles, solfatara, steaming ground, and mud pools. Geothermal potential of West Java and Banten comparatively high, namely 1626 MW. Although in Indonesia, only about 3% potential developed and produce electrical energy as the primary energy replacement of oil and gas. Geothermal field developed to date is the Geothermal Field: Dieng, Kamojang, Darajat, Wayang Windu and Awibengkok-Mount Salak. Another geothermal field that will be developed include Geothermal Field: Patuha, Karaha Bodas and Ungaran
One cause is not maximum utilization of geothermal energy in Central Java is due to ignorance about the geothermal system and pattern hidrogeokimia geothermal fluid beneath the surface.
PROCEEDINGS, 4th ITB Geothermal Workshop 2015Institut Teknologi Bandung, Bandung, Indonesia, March 16-20, 2015
Actually it can be learned by geothermal manifestations on the surface, which is characteristic of hot springs and hydrothermal alteration patterns in the surface (Hochstein and Browne, 2000)
The research area can be reached by road with two or four wheeled vehicle.The road to reach this place is good although some bad road condition in some location. The distance of study sites from Purwokerto is about 25 Kilometers and can be reached in about 1 and half hours. Survey research sites was visited on January 2nd 2015.
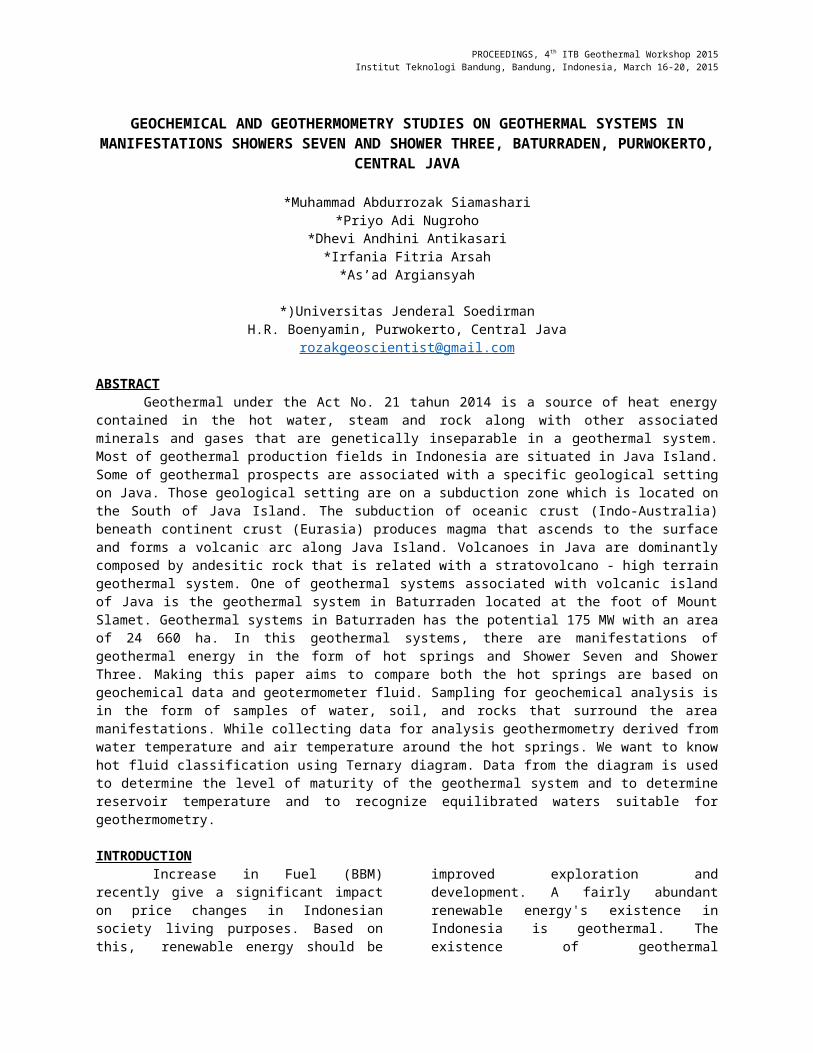
The research location is located in Pancuran 7 and pancuran 3 hot spring tourism site,Baturraden,Central Java. . By coordinates N 9191612 / S 303 291 and N 9191628 / S 304203. The distance between the Pancuran 7 and the Pancuran 3 approximately 300 m.
Figure 1. Research Location SRTM Map
This study is did to explain the occurance of geothermal manifestations such as hot springs as part of the geothermal system that developed in the study area. This study use the approach of geochemistry of the geothermal water on research areas. Geochemistry of geothermal water methods analyze the comparison of major elements that be in hot water to know the hot water type and, if possible, it can estimates the temperatures of geothermal reservoir with geotermometer method of elements that dissolved in the hot water. And then data
result from laboratory analysis can also be validated with ion balance method.
The analysis also did on the water surface,in the writer case, the water is occur on the pool which the water come from the hot water spring around that pool.. The study also looks at the geological conditions that exist in the study area to determine the dominant factors that influence the occurance of the hot springs manifestations.
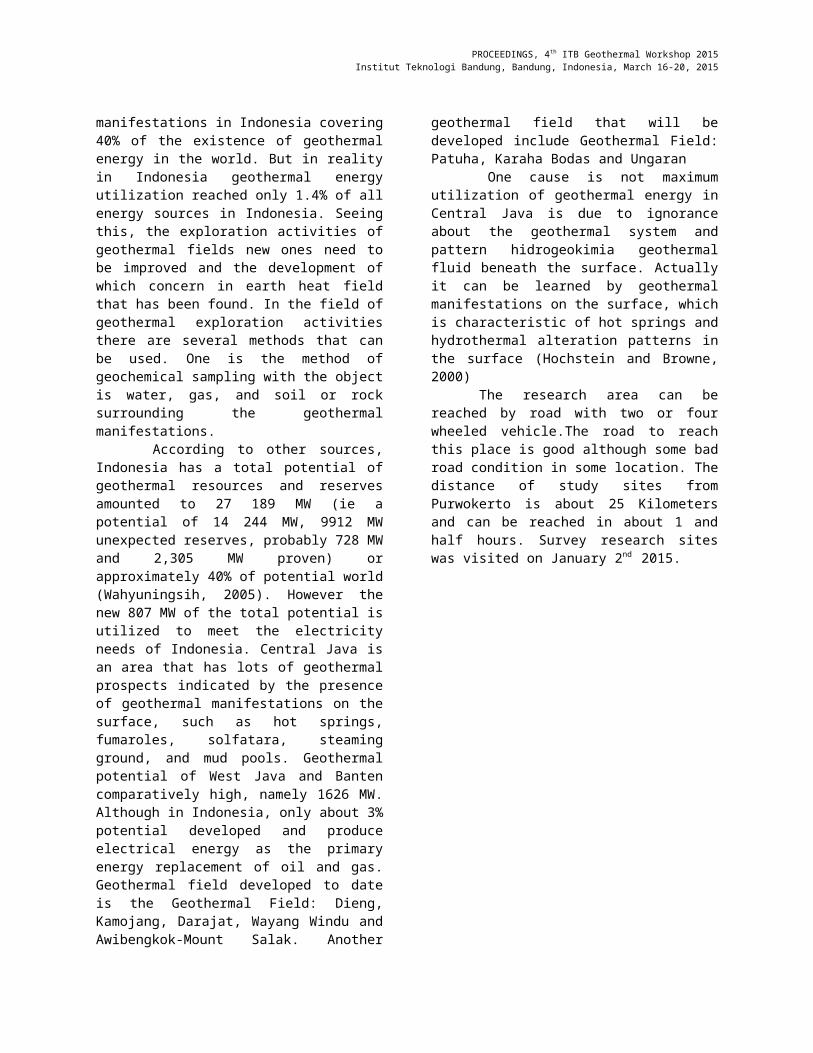
REGIONAL GEOLOGYBased on Geological Map Sheet Purwokerto and Tegal, and Sheet Majenang, Java, scale 1:100,000 (Djuri, dkk., 1996 dan Kastowo, 1975), geological map of the study area can be looked at the map below.Figure 2. Regional Geology Map of study area (summarized from Djuri, M, dkk., 1996).
Regional StratigraphyThis research location is consist of some rock formations from oldest to youngest respectively, and are summarized as follows:
Undifferentiated Volcanics Of Mt. Slamet (Qvs)
PROCEEDINGS, 4th ITB Geothermal Workshop 2015Institut Teknologi Bandung, Bandung, Indonesia, March 16-20, 2015
This rock formation composed by volcanic product of Slamet volcano such as volcanic breccia lava and tuff on the slope of Slamet volcano and it’s forming flat or hill areaLava Of Mt. Slamet (Qvls)This rock formation composed by volcanic product of Slamet volcano in the form of andesitic lava which has porous characteristics.
Regional StructureGeological structure at the site consisted of: strike slip fault, normal fault, thrust fault, and Syncline. Geological structures mentioned above are generally hit rock formations of Tertiary age, such as rambatan formation (Tmr), halang formation (Tmph and Tmh), and tapak formation (Tpt). Strike slip fault hit sedimentary rock units of laharic deposits and lava of Mount Slamet (Qva). Fracture was indicated by alignment patterns of the contours on the map. Fractures located on the oldest rock units, namely rambatan formation, until the youngest rock units, namely Laharic Deposits of Gunung Slamet (Qls).
METHODS
In this research about geothermal manifestasions we have a few methods. The method can be seen in the next explanation below.
Fault and Fracture Density (FFD) analysisTo know about pathways for geothermal fluids release in many manifestasions, we can analyze about fracture and fault from satellite data. Then we can make a classification and assumption.
Heat loss analysisTo calculate the heat loss of Hot Pool and Hot spring and classification each manifestasion.
Water type analysisFluid in the manifestasions in this case is water. Water analysis use major element consisted in the manifestasion. Data will
plotted in ternary diagram, like Na-Mg-K, Cl-Li-B, Cl-SO4-HCO3.
RESULTS AND DISSCUSSION
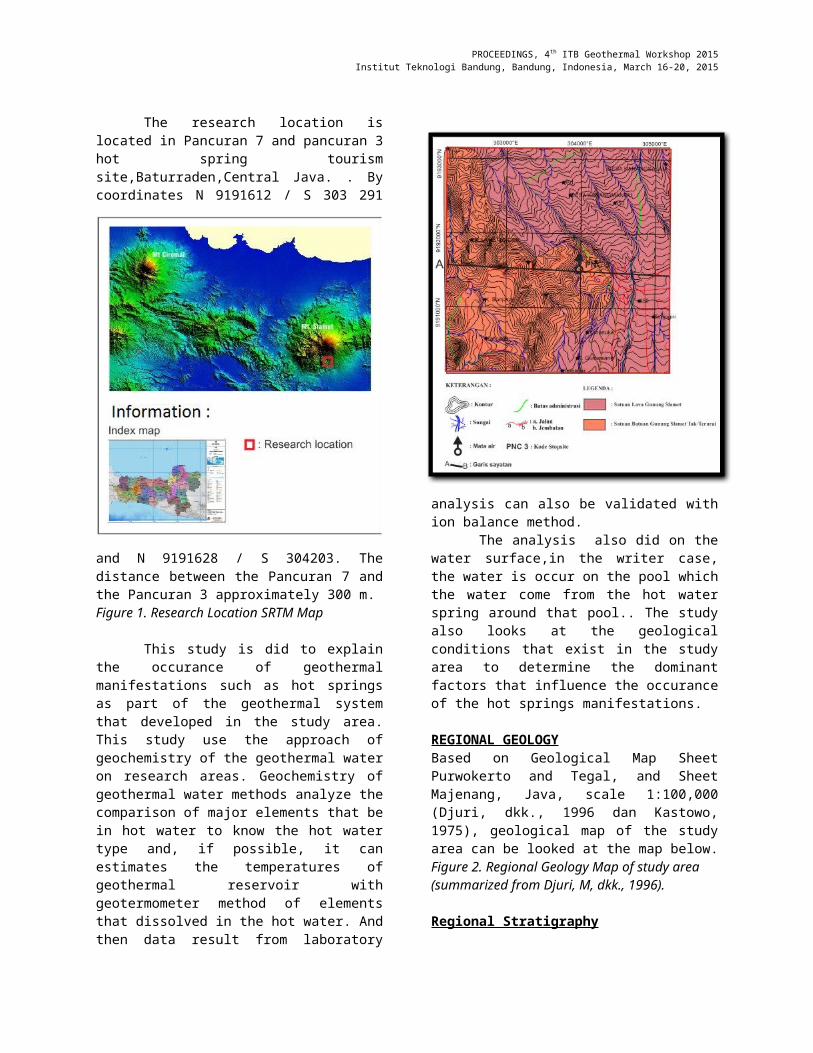
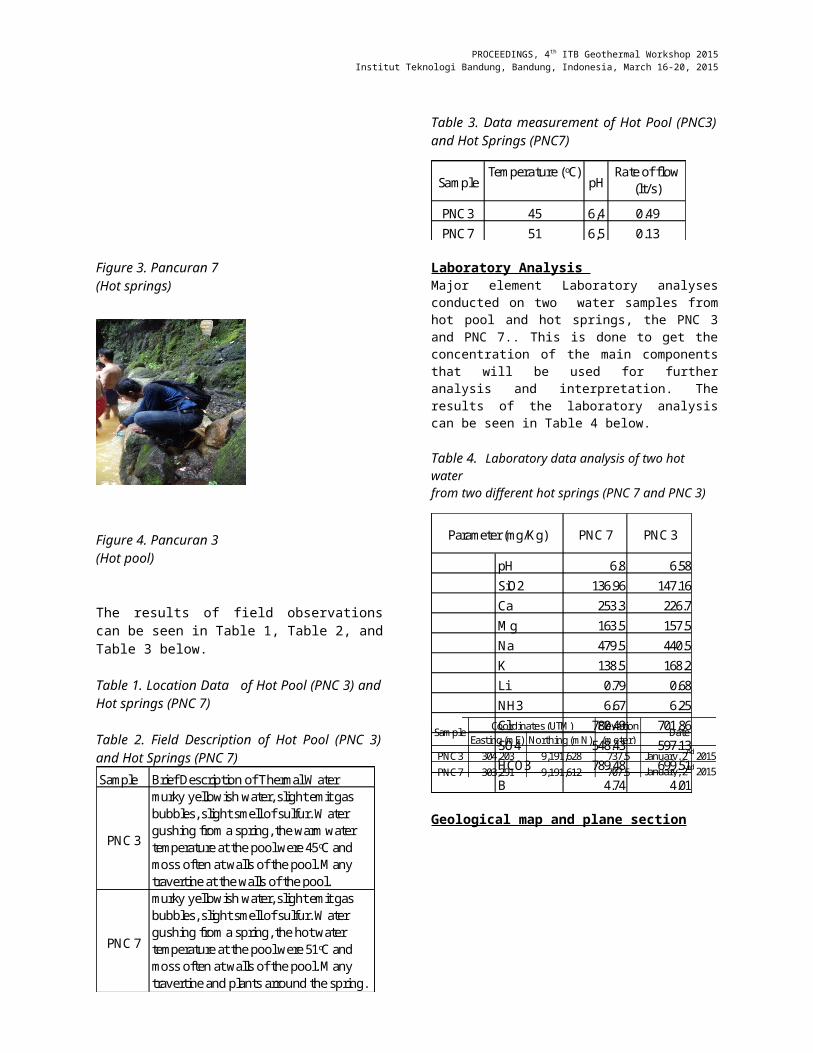
Field studyFrom the field observations, we obtained a two point location of hot springs and hot pool that are close together. Observations were also conducted on rocks that maybe uncovered and cold water surface nearby hot springs manifestations.
Figure 3. Pancuran 7(Hot springs)
Figure 4. Pancuran 3(Hot pool)
The results of field observations can be seen in Table 1, Table 2, and Table 3 below.
PROCEEDINGS, 4th ITB Geothermal Workshop 2015Institut Teknologi Bandung, Bandung, Indonesia, March 16-20, 2015
Table 1. Location Data of Hot Pool (PNC 3) and Hot springs (PNC 7)
Table 2. Field Description of Hot Pool (PNC 3) and Hot Springs (PNC 7)
Table 3. Data measurement of Hot Pool (PNC3) and Hot Springs (PNC7)
Laboratory Analysis Major element Laboratory analyses conducted on two water samples from hot pool and hot springs, the PNC 3 and PNC 7.. This is done to get the concentration of the main components that will be used for further analysis and interpretation. The results of the laboratory analysis can be seen in Table 4 below.
Table 4. Laboratory data analysis of two hot water
from two different hot springs (PNC 7 and PNC 3)
Geological map and plane section
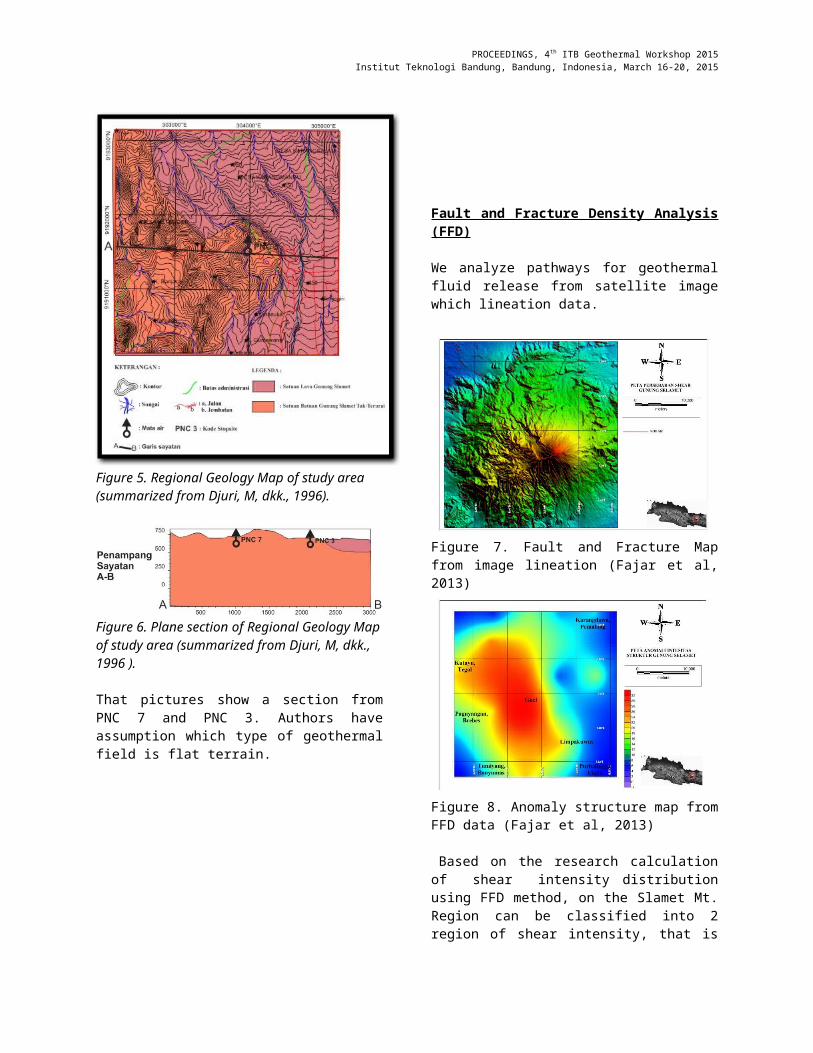
Figure 5. Regional Geology Map of study area (summarized from Djuri, M, dkk., 1996).
Figure 6. Plane section of Regional Geology Map of study area (summarized from Djuri, M, dkk., 1996 ).
That pictures show a section from PNC 7 and PNC 3. Authors have assumption which type of geothermal field is flat terrain.
Easting (mE) Northing (mN)
PNC 3 304,203 9,191,628 737.5 January, 2nd 2015
PNC 7 303,291 9,191,612 707.5 January, 2nd 2015
Coordinates (UTM) Elevation (meter)
DateSample
Sample Brief Description of Thermal Water
PNC 3
murky yellowish water, slight emit gas bubbles, slight smell of sulfur. Water gushing from a spring, the warm water temperature at the pool were 45ᵒC and moss often at walls of the pool. Many travertine at the walls of the pool.
PNC 7
murky yellowish water, slight emit gas bubbles, slight smell of sulfur. Water gushing from a spring, the hot water temperature at the pool were 51ᵒC and moss often at walls of the pool. Many travertine and plants arround the spring.
PNC 3 45 6,4 0.49
PNC 7 51 6,5 0.13
SampleTemperature (ᵒC)
pHRate of flow
(lt/s)
pH 6.8 6.58
SiO2 136.96 147.16
Ca 253.3 226.7
Mg 163.5 157.5
Na 479.5 440.5
K 138.5 168.2
Li 0.79 0.68
NH3 6.67 6.25
Cl 780.49 701.86
SO4 548.43 597.13
HCO3 789.48 699.51
B 4.74 4.01
Parameter (mg/Kg) PNC 7 PNC 3
PROCEEDINGS, 4th ITB Geothermal Workshop 2015Institut Teknologi Bandung, Bandung, Indonesia, March 16-20, 2015
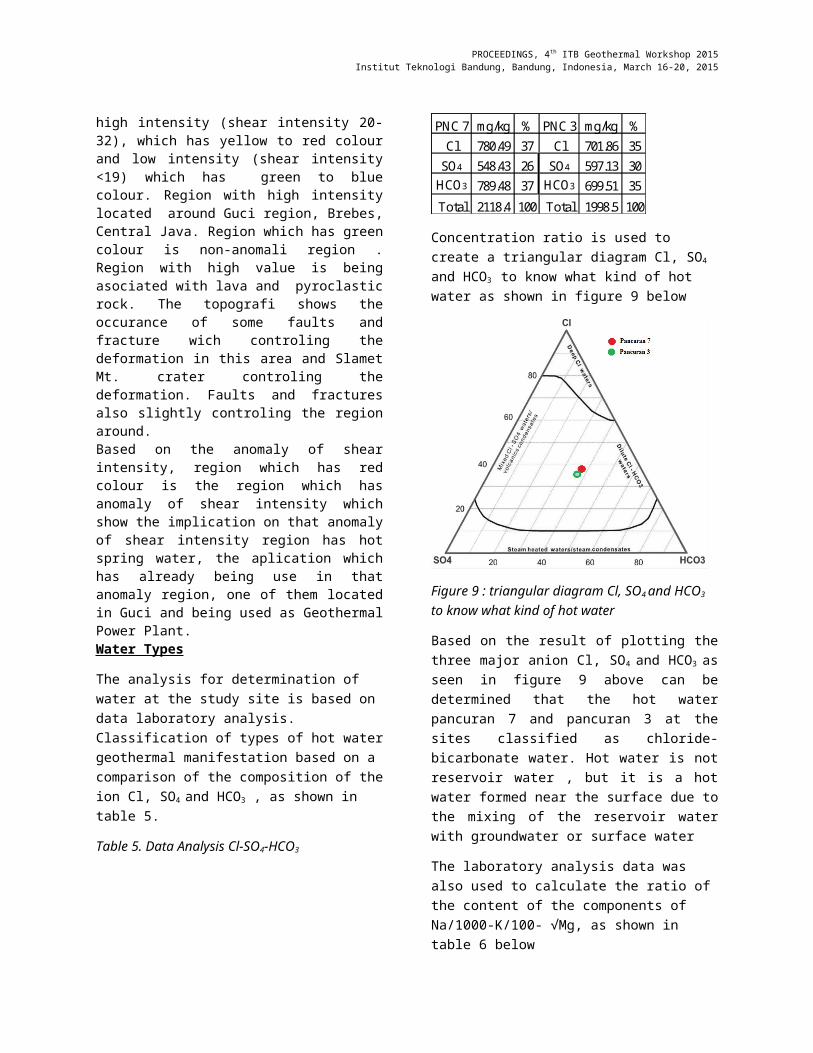
Fault and Fracture Density Analysis (FFD)
We analyze pathways for geothermal fluid release from satellite image which lineation data.
Figure 7. Fault and Fracture Map from image lineation (Fajar et al, 2013)
Figure 8. Anomaly structure map from FFD data (Fajar et al, 2013)
Based on the research calculation of shear intensity distribution using FFD method, on the Slamet Mt. Region can be classified into 2 region of shear intensity, that is high intensity (shear intensity 20-
32), which has yellow to red colour and low intensity (shear intensity <19) which has green to blue colour. Region with high intensity located around Guci region, Brebes, Central Java. Region which has green colour is non-anomali region . Region with high value is being asociated with lava and pyroclastic rock. The topografi shows the occurance of some faults and fracture wich controling the deformation in this area and Slamet Mt. crater controling the deformation. Faults and fractures also slightly controling the region around.Based on the anomaly of shear intensity, region which has red colour is the region which has anomaly of shear intensity which show the implication on that anomaly of shear intensity region has hot spring water, the aplication which has already being use in that anomaly region, one of them located in Guci and being used as Geothermal Power Plant.Water Types
The analysis for determination of water at the study site is based on data laboratory analysis. Classification of types of hot water geothermal manifestation based on a comparison of the composition of the ion Cl, SO4 and HCO3 , as shown in table 5.
Table 5. Data Analysis Cl-SO4-HCO3
PNC 7 mg/kg % PNC 3 mg/kg %
Cl 780.49 37 Cl 701.86 35
SO4 548.43 26 SO4 597.13 30
HCO3 789.48 37 HCO3 699.51 35
Total 2118.4 100 Total 1998.5 100
Concentration ratio is used to create a triangular diagram Cl, SO4 and HCO3 to know what kind of hot water as shown in figure 9 below
PROCEEDINGS, 4th ITB Geothermal Workshop 2015Institut Teknologi Bandung, Bandung, Indonesia, March 16-20, 2015
Figure 9 : triangular diagram Cl, SO4 and HCO3 to know what kind of hot water
Based on the result of plotting the three major anion Cl, SO4 and HCO3 as seen in figure 9 above can be determined that the hot water pancuran 7 and pancuran 3 at the sites classified as chloride-bicarbonate water. Hot water is not reservoir water , but it is a hot water formed near the surface due to the mixing of the reservoir water with groundwater or surface water
The laboratory analysis data was also used to calculate the ratio of the content of the components of Na/1000-K/100- √Mg, as shown in table 6 below
Table 6. Data Analysis Na-K-Mg
PNC 7 mg/kg % PNC 3 mg/kg %
Na/1000 0.4 2.8 Na/1000 0.4 2.7
K/100 1.4 9.7 K/100 1.7 11.7
√Mg 12.7 87.5 √Mg 12.5 85.6
Total 14.5 100 Total 14.6 100
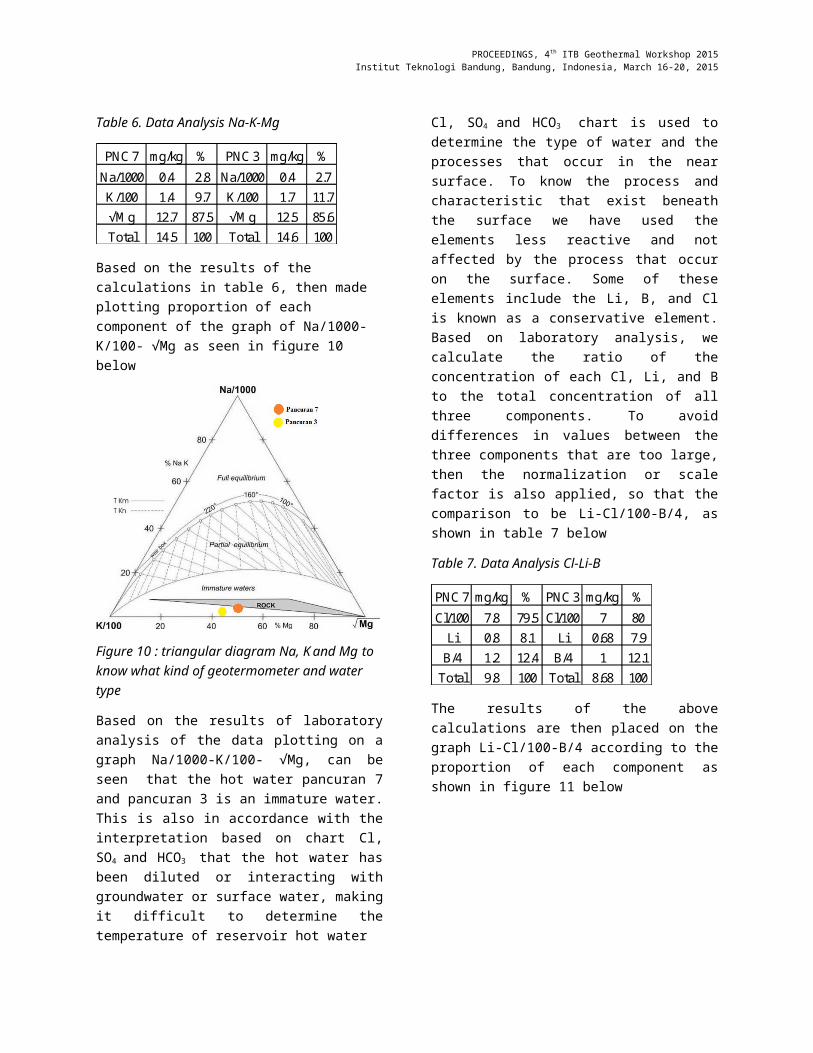
Based on the results of the calculations in table 6, then made plotting proportion of each component of the graph of Na/1000-K/100- √Mg as seen in figure 10 below
Figure 10 : triangular diagram Na, K and Mg to know what kind of geotermometer and water type
Based on the results of laboratory analysis of the data plotting on a graph Na/1000-K/100- √Mg, can be seen that the hot water pancuran 7 and pancuran 3 is an immature water. This is also in accordance with the interpretation based on chart Cl, SO4 and HCO3
that the hot water has been diluted or interacting with groundwater or surface water, making it difficult to determine the temperature of reservoir hot water
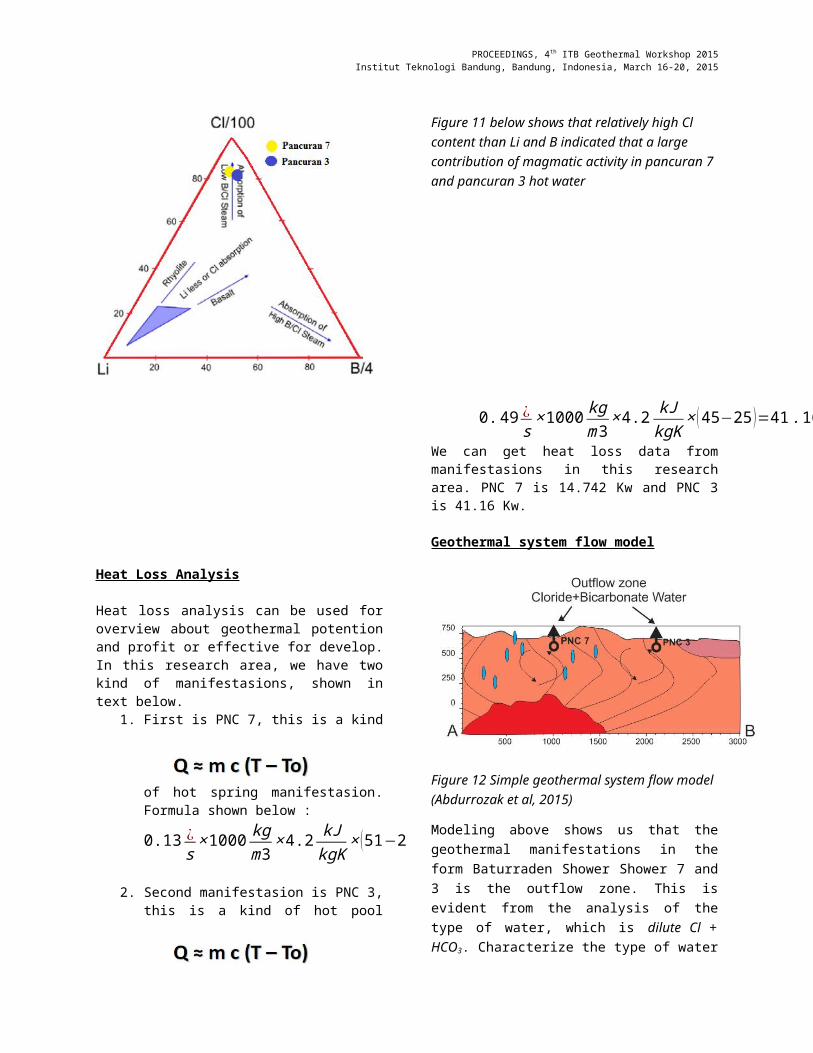
Cl, SO4 and HCO3 chart is used to determine the type of water and the processes that occur in the near surface. To know the process and characteristic that exist beneath the surface we have used the elements less reactive and not affected by the process that occur on the surface. Some of these elements include the Li, B, and Cl is known as a conservative element. Based on laboratory analysis, we calculate the ratio of the concentration of each Cl, Li, and B to the total concentration of all three components. To avoid differences in values between the three components that are too large, then the normalization or scale factor is also applied, so that the comparison to be Li-Cl/100-B/4, as shown in table 7 below
Table 7. Data Analysis Cl-Li-B
PNC 7 mg/kg % PNC 3 mg/kg %
Cl/100 7.8 79.5 Cl/100 7 80
Li 0.8 8.1 Li 0.68 7.9
B/4 1.2 12.4 B/4 1 12.1
Total 9.8 100 Total 8.68 100
PROCEEDINGS, 4th ITB Geothermal Workshop 2015Institut Teknologi Bandung, Bandung, Indonesia, March 16-20, 2015
The results of the above calculations are then placed on the graph Li-Cl/100-B/4 according to the proportion of each component as shown in figure 11 below
Figure 11 below shows that relatively high Cl content than Li and B indicated that a large contribution of magmatic activity in pancuran 7 and pancuran 3 hot water
Heat Loss Analysis
Heat loss analysis can be used for overview about geothermal potention and profit or effective for develop. In this research area, we have two kind of manifestasions, shown in text below.
1. First is PNC 7, this is a kind of hot spring manifestasion. Formula shown below :
0.13 ¿s
×1000kgm3
× 4.2kJ
kgK× (51−24 )=14.742 Kw
2. Second manifestasion is PNC 3, this is a kind of hot pool manifestasion. Formula shown below :
0.49 ¿s
× 1000kgm3
× 4.2kJ
kgK× ( 45−25 )=41 . 16 Kw
We can get heat loss data from manifestasions in this research area. PNC 7 is 14.742 Kw and PNC 3 is 41.16 Kw.
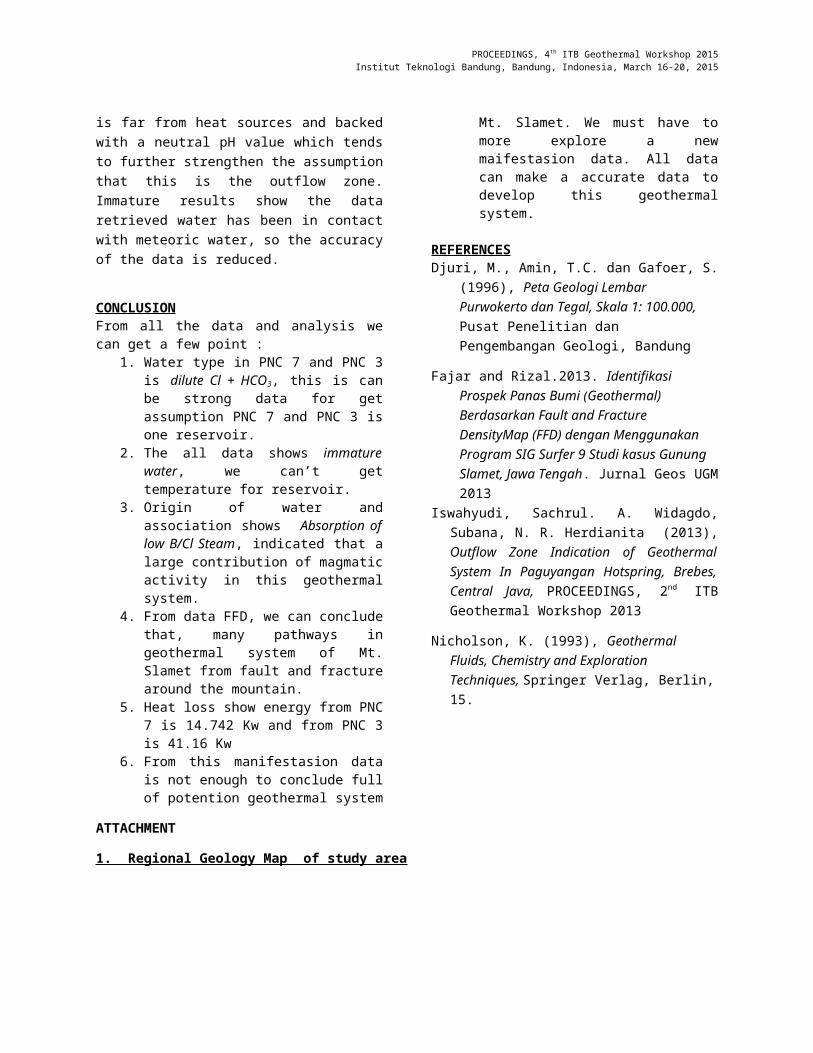
Geothermal system flow model
Figure 12 Simple geothermal system flow model (Abdurrozak et al, 2015)
Modeling above shows us that the geothermal manifestations in the form Baturraden Shower Shower 7 and 3 is the outflow zone. This is evident from the analysis of the type of water, which is dilute Cl + HCO3. Characterize the type of water is far from heat sources and backed with a neutral pH value which tends to further strengthen the assumption that
PROCEEDINGS, 4th ITB Geothermal Workshop 2015Institut Teknologi Bandung, Bandung, Indonesia, March 16-20, 2015
this is the outflow zone. Immature results show the data retrieved water has been in contact with meteoric water, so the accuracy of the data is reduced.
CONCLUSIONFrom all the data and analysis we can get a few point :
1. Water type in PNC 7 and PNC 3 is dilute Cl + HCO3, this is can be strong data for get assumption PNC 7 and PNC 3 is one reservoir.
2. The all data shows immature water, we can’t get temperature for reservoir.
3. Origin of water and association shows Absorption of low B/Cl Steam, indicated that a large contribution of magmatic activity in this geothermal system.
4. From data FFD, we can conclude that, many pathways in geothermal system of Mt. Slamet from fault and fracture around the mountain.
5. Heat loss show energy from PNC 7 is 14.742 Kw and from PNC 3 is 41.16 Kw
6. From this manifestasion data is not enough to conclude full of potention geothermal system Mt. Slamet. We must have to more explore a new maifestasion data. All data
can make a accurate data to develop this geothermal system.
REFERENCESDjuri, M., Amin, T.C. dan Gafoer, S. (1996), Peta
Geologi Lembar Purwokerto dan Tegal, Skala 1: 100.000, Pusat Penelitian dan Pengembangan Geologi, Bandung
Fajar and Rizal.2013. Identifikasi Prospek Panas Bumi (Geothermal) Berdasarkan Fault and Fracture DensityMap (FFD) dengan Menggunakan Program SIG Surfer 9 Studi kasus Gunung Slamet, Jawa Tengah. Jurnal Geos UGM 2013
Iswahyudi, Sachrul. A. Widagdo, Subana, N. R. Herdianita (2013), Outflow Zone Indication of Geothermal System In Paguyangan Hotspring, Brebes, Central Java, PROCEEDINGS, 2nd ITB Geothermal Workshop 2013
Nicholson, K. (1993), Geothermal Fluids, Chemistry and Exploration Techniques, Springer Verlag, Berlin, 15.
ATTACHMENT
1. Regional Geology Map of study area
PROCEEDINGS, 4th ITB Geothermal Workshop 2015Institut Teknologi Bandung, Bandung, Indonesia, March 16-20, 2015
2. Fracture Map of Mt. Slamet
PROCEEDINGS, 4th ITB Geothermal Workshop 2015Institut Teknologi Bandung, Bandung, Indonesia, March 16-20, 2015
3. Anomaly Structure Map of Mt.Slamet
3. Model of Geothermal System in study area