Embed Size (px)
Citation preview
Geochemical Analysis of Catawba Ceramics
Rosanna Crow
Honors Thesis Curriculum in Archaeology
University of North Carolina at Chapel Hill
April 2011
Approved:
_________________________________ Dr. Vin Steponaitis (advisor)
_________________________________ Dr. Steve Davis
_________________________________ Dr. Drew Coleman
i
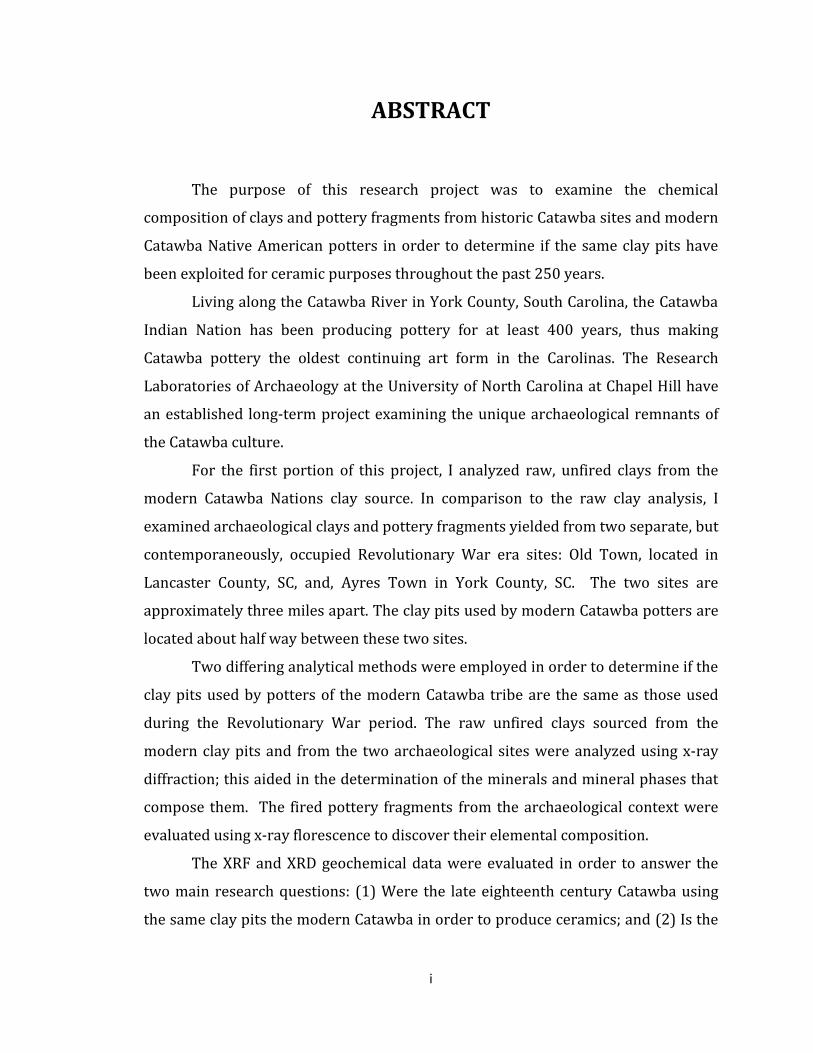
ABSTRACT
The purpose of this research project was to examine the chemical
composition of clays and pottery fragments from historic Catawba sites and modern
Catawba Native American potters in order to determine if the same clay pits have
been exploited for ceramic purposes throughout the past 250 years.
Living along the Catawba River in York County, South Carolina, the Catawba
Indian Nation has been producing pottery for at least 400 years, thus making
Catawba pottery the oldest continuing art form in the Carolinas. The Research
Laboratories of Archaeology at the University of North Carolina at Chapel Hill have
an established long-term project examining the unique archaeological remnants of
the Catawba culture.
For the first portion of this project, I analyzed raw, unfired clays from the
modern Catawba Nations clay source. In comparison to the raw clay analysis, I
examined archaeological clays and pottery fragments yielded from two separate, but
contemporaneously, occupied Revolutionary War era sites: Old Town, located in
Lancaster County, SC, and, Ayres Town in York County, SC. The two sites are
approximately three miles apart. The clay pits used by modern Catawba potters are
located about half way between these two sites.
Two differing analytical methods were employed in order to determine if the
clay pits used by potters of the modern Catawba tribe are the same as those used
during the Revolutionary War period. The raw unfired clays sourced from the
modern clay pits and from the two archaeological sites were analyzed using x-ray
diffraction; this aided in the determination of the minerals and mineral phases that
compose them. The fired pottery fragments from the archaeological context were
evaluated using x-ray florescence to discover their elemental composition.
The XRF and XRD geochemical data were evaluated in order to answer the
two main research questions: (1) Were the late eighteenth century Catawba using
the same clay pits the modern Catawba in order to produce ceramics; and (2) Is the

ii
raw clay found within the archaeological context the same clay used in the clay body
of the archaeological pottery (as is commonly thought)?
iii
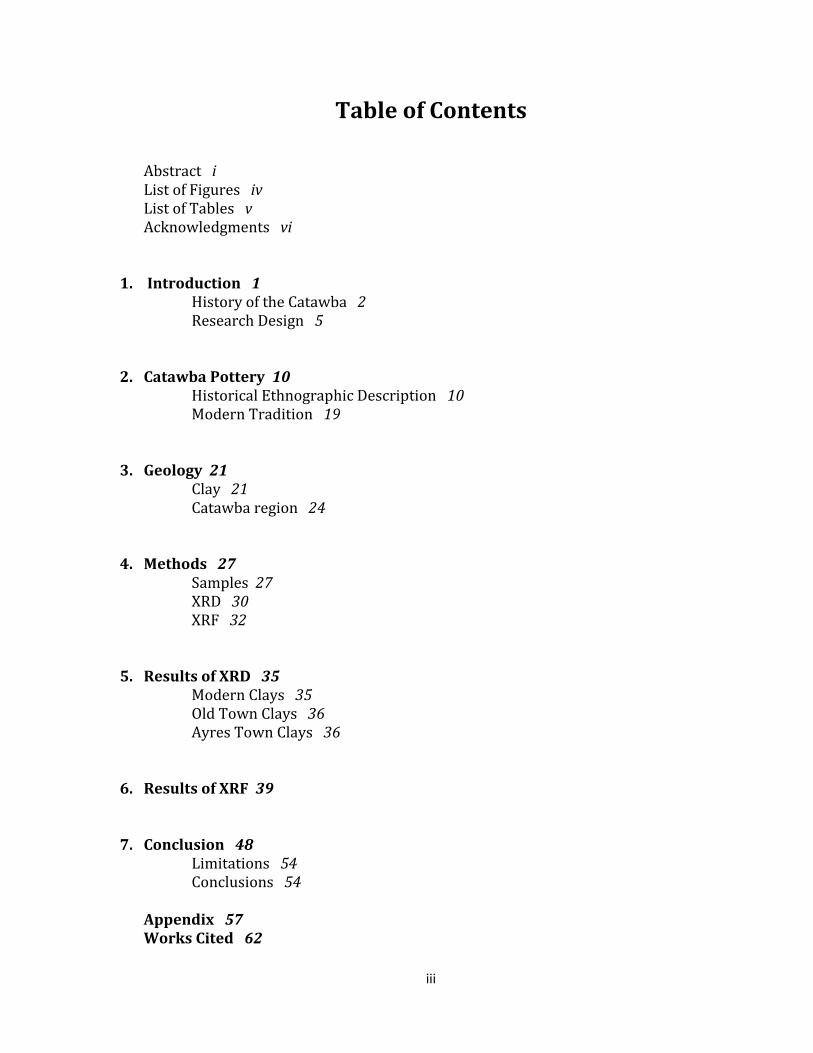
Table of Contents Abstract i List of Figures iv List of Tables v Acknowledgments vi
1. Introduction 1 History of the Catawba 2 Research Design 5
2. Catawba Pottery 10 Historical Ethnographic Description 10 Modern Tradition 19
3. Geology 21 Clay 21 Catawba region 24
4. Methods 27 Samples 27 XRD 30 XRF 32
5. Results of XRD 35 Modern Clays 35 Old Town Clays 36 Ayres Town Clays 36
6. Results of XRF 39
7. Conclusion 48 Limitations 54 Conclusions 54
Appendix 57 Works Cited 62
iv
List of Figures 1.1 Location of historical Catawba reservation 4 1.2 Historic pottery fragments 6 1.3 An 1808 map of the Catawba reservation 7 1.4 Potter at Nisbet Bottoms 8 2.1 A 1908 photograph of Catawba potters digging clay 13 2.2 Example of modern Catawba ceramic vessels 20 3.1 Major geologic regions of the Carolinas 23 3.2 Catawba-Wateree Drainage Basin 26 4.1 XRD graph of modern pan clay 30 4.2- Schematic arrangement of XRF 33 6.1 PCA graph of all samples 41 6.2 PCA clay groups 42 6.3 Normalized graph of oxides of Clay Group One 44 6.4 Normalized graph of Clay Group Two 44 6.5 Normalized graph of Clay Group Three 45 6.5 Normalized graph of Clay Group Four 45
7.1 PCA of the XRF data 49
v
List of Tables 4.1 Description of Archaeological and Modern Clays 28 5.1 XRD data of all samples tested 37 6.1 XRF data of all samples 39 6.2 Principal component analysis data 40 6.3- XRF data organized according to clay group 43
7.1 XRD Data 48 7.2 Mineral data of XRF samples 49
vi
Acknowledgments
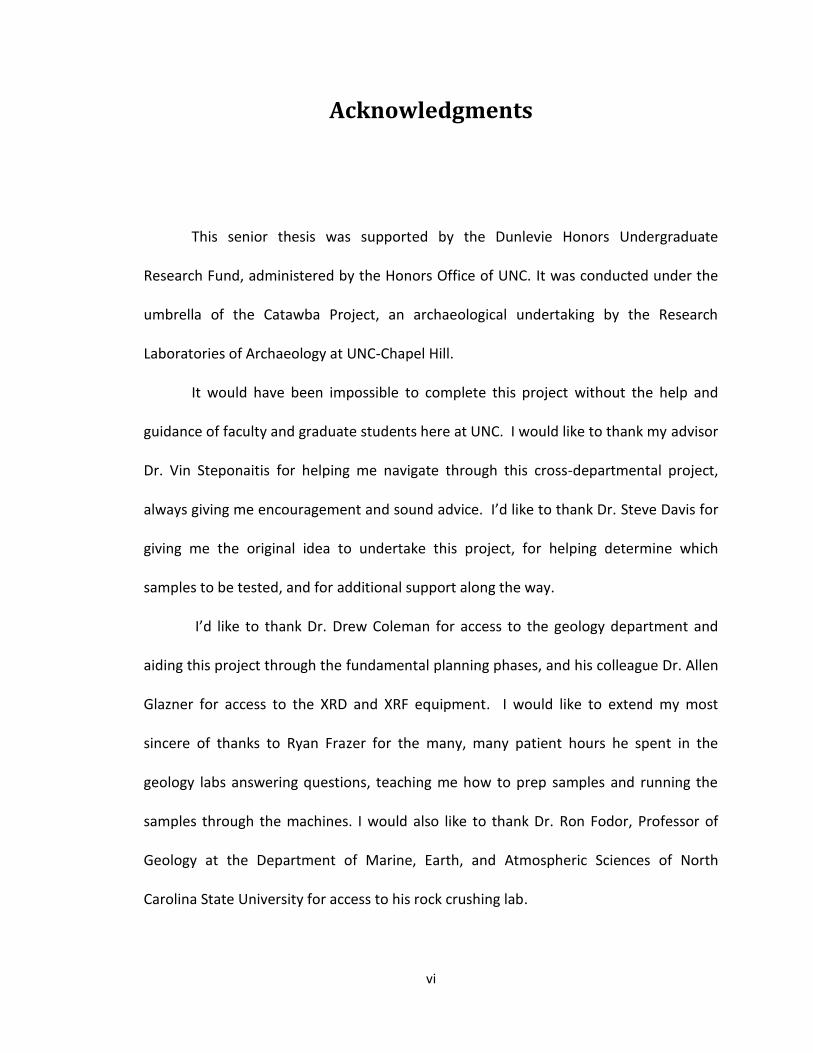
This senior thesis was supported by the Dunlevie Honors Undergraduate
Research Fund, administered by the Honors Office of UNC. It was conducted under the
umbrella of the Catawba Project, an archaeological undertaking by the Research
Laboratories of Archaeology at UNC-Chapel Hill.
It would have been impossible to complete this project without the help and
guidance of faculty and graduate students here at UNC. I would like to thank my advisor
Dr. Vin Steponaitis for helping me navigate through this cross-departmental project,
always giving me encouragement and sound advice. I’d like to thank Dr. Steve Davis for
giving me the original idea to undertake this project, for helping determine which
samples to be tested, and for additional support along the way.
I’d like to thank Dr. Drew Coleman for access to the geology department and
aiding this project through the fundamental planning phases, and his colleague Dr. Allen
Glazner for access to the XRD and XRF equipment. I would like to extend my most
sincere of thanks to Ryan Frazer for the many, many patient hours he spent in the
geology labs answering questions, teaching me how to prep samples and running the
samples through the machines. I would also like to thank Dr. Ron Fodor, Professor of
Geology at the Department of Marine, Earth, and Atmospheric Sciences of North
Carolina State University for access to his rock crushing lab.
vii
I would like to thank Beckee Garris from the Catawba Cultural Preservation
Project for all of her generous time answering questions as well as providing the modern
potting clays that were tested for this project. I would like to extend many thanks to
archaeology graduate students Anna Semon, Erin Stevens, and David Cranford for all of
their encouragement, support, motivation, advice and time spent listening and helping
me work through the set backs that are part of any research project. I would like to
thank Kristin Dellinger, for editing drafts and providing editorial advice. Lastly, I’d like to
thank Christian Alvan for helping me work through the this project by cooking late-night
dinners, walking the dogs, and generally being supportive and loving throughout my
college career.
1
Chapter 1
INTRODUCTION
The Catawba Indians, indigenous to the South Carolina piedmont, are one of the
only modern tribes to the east of the Mississippi River to have an unbroken pottery
tradition expanding back to the pre-contact era. Modern potters within the Catawba
tribe produce artful pottery that closely resembles that of their ancient ancestors.
Although the Catawba Indians produce a distinctive style of Carolina piedmont pottery,
little is known about the chemical composition of either the modern or historically
utilized clays. It is of anthropological interest to examine if there has been any change
in the chemical composition of the clay used to create Catawba pottery. Any similarities
or changes in composition of the pottery could provide valuable insight into changes in
Catawba cultural practices.
The Research Laboratories of Archaeology at UNC have used a combination of
colonial documents and survey methods to locate eighteenth and early nineteenth
century sites attributed to the Catawba nation. Multiple historic village sites have been
found along the Catawba River near Rock Hill, South Carolina. Of these, two
contemporaneously occupied Revolutionary War era sites Old Town and Ayres Town
yielded archaeological material for this study. The Catawba tribe still lives in this area
today, where local Catawba potters produce ceramics that bear a close resemblance to
2
the pottery of their ancestors. Modern Catawba tribal potters provided clay samples for
this project.
In order to determine the mineralogical and elemental compositions of modern
clays, historic clays, and historic ceramics used in this study, two different geochemical
methods are utilized: (1) X-ray diffraction, and (2) X-ray fluorescence. The modern clays
were raw and unfired, gathered by local Catawba potters from two central clay sources.
The data obtained from these samples were compared to information from a
geochemical analysis of archaeological clays and ceramic fragments.
The goals of this project were twofold. The first goal was to examine the
relationship between archaeological raw clay and the clay body of the archaeological
pottery. If the raw clays are the same as the clays being used to make the pottery, it
should be evident in mineral and elemental composition of the pottery. The second
goal of the project was to determine if the historic Catawba potters used the same clay
pits that the modern Catawba use today in ceramic production. The modern potters live
in an area that overlaps that of their ancestral potters, and the mineralogical and
elemental data should aid in determining if the same clay sources were being exploited.
History of the Catawba
Historically, the Catawba Indians inhabited the Catawba River Valley near the
modern North and South Carolina border. In the spring of 1540, De Soto led an army of
more than 600 troops through the area of the southern piedmont, becoming the first
European to have contact with the Catawba (Merrell 1989a: 9). Juan Pardo followed the
3
path of De Soto 26 years later, but his troops remained in the area longer, and they built
forts to inhabit. Pardo’s troops were driven out of the area in the early 1570s, and the
Spaniards never returned to the area in any substantial numbers (Merrell 1989b: 13).
The Catawba have faced many obstacles throughout their history, and have
survived as a tribal unit where other tribes could not. The tribe probably coalesced from
smaller, regional tribes in the wake of the diseases brought by the first European
explorers (Merrell 1989b: 18-27). In 1650, explorers living in the English settlement of
Jamestown, Virginia began exploring the area after 50 years of settlement to the north
(Merrell 1989a: 16). For many years after their arrival, the Catawba maintained
autonomy from the English colonialists, and therefore could benefit from European
trade goods instead of depending upon them. Due to this level of independence, the
Catawba maintained control over the trade-affairs of the time, and were able to ask for
higher prices for the goods they offered and deny sub-par European goods (Merrell
1989b: 32). Over time this independence was diminished and the Catawba became
increasingly dependent upon the goods brought in by traders while their indigenous
skills dwindled. As they became more reliant on European goods, such as muskets,
brass kettles and alcohol, English traders became more abusive and iniquitous during
trading (Merrell 1989a: 42-43).
Just prior to the American Revolution in 1776, the Catawba were living on a
reservation of 144,000 acres located in the western regions of South Carolina. Only a
small portion of this territory was inhabited due to a large smallpox epidemic, which in
1759 had drastically decimated the population reducing their numbers from 2,500 to
4
less than 1,000, from six villages to only one. (Merrell 1989a: 195). During the 1830s a
large-scale removal of Native Americans from the southeastern United States occurred.
The Catawba were one of the five tribes that were not forcibly relocated, though at the
same time they did not own federally recognized lands (Perdue and Green 2001: 125).
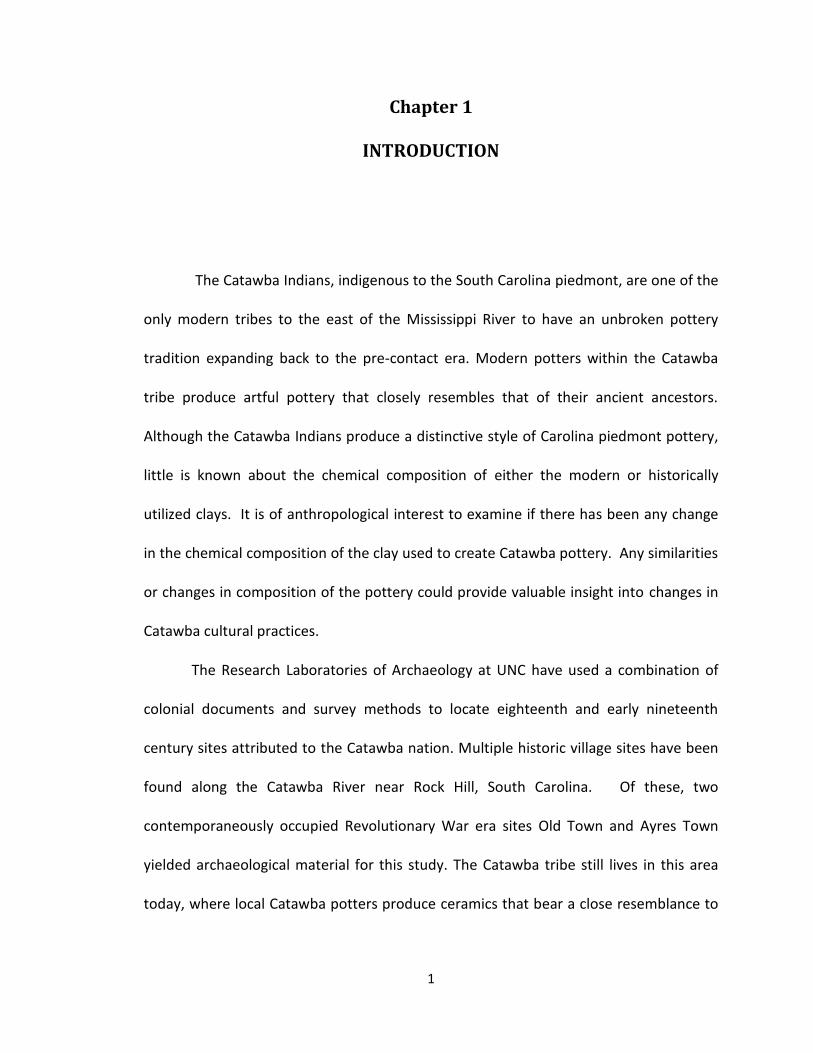
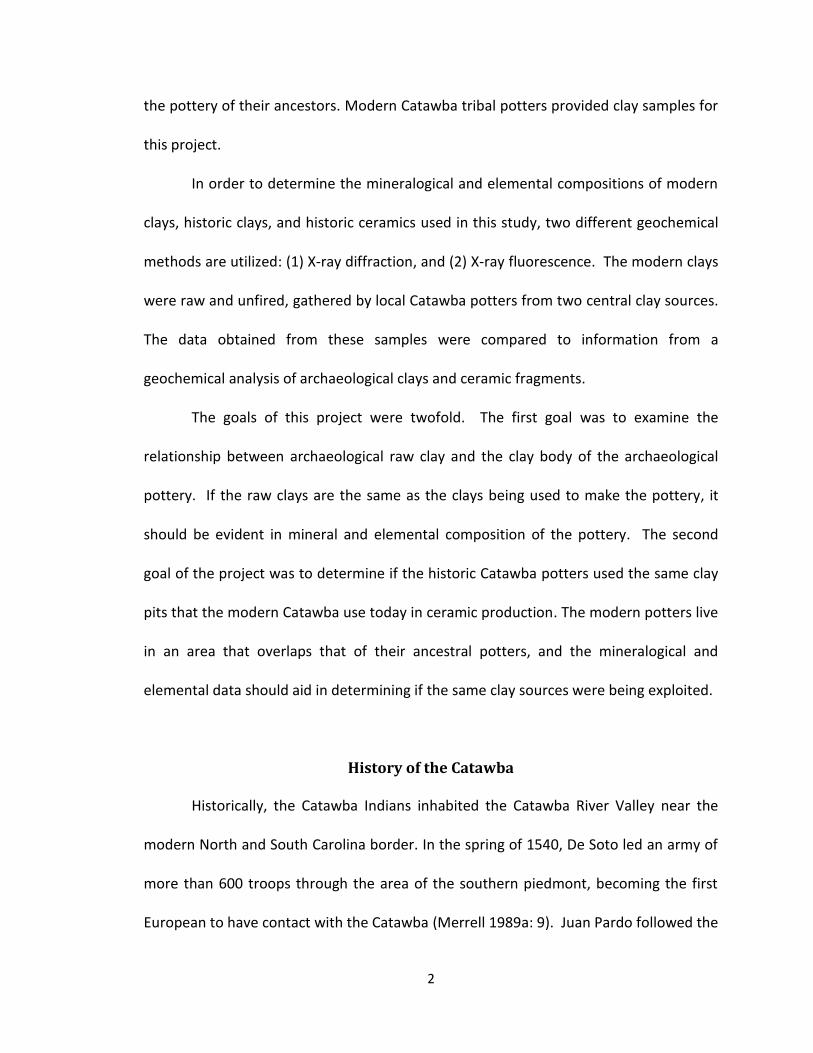
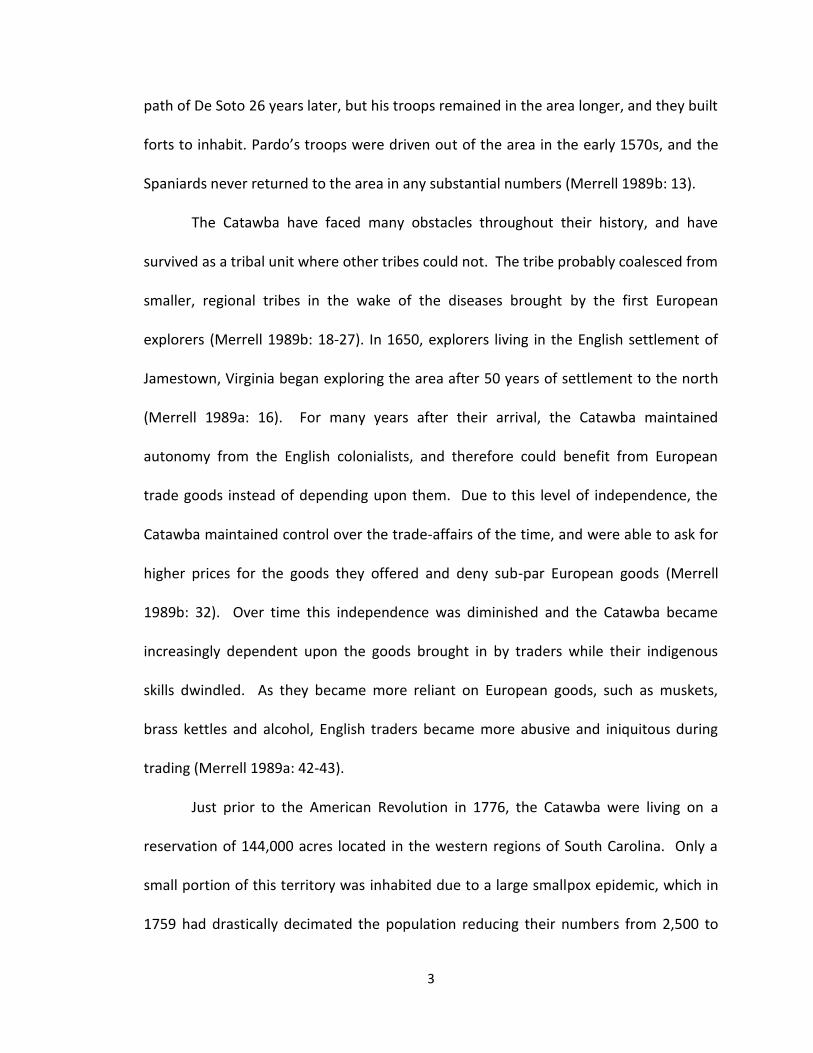
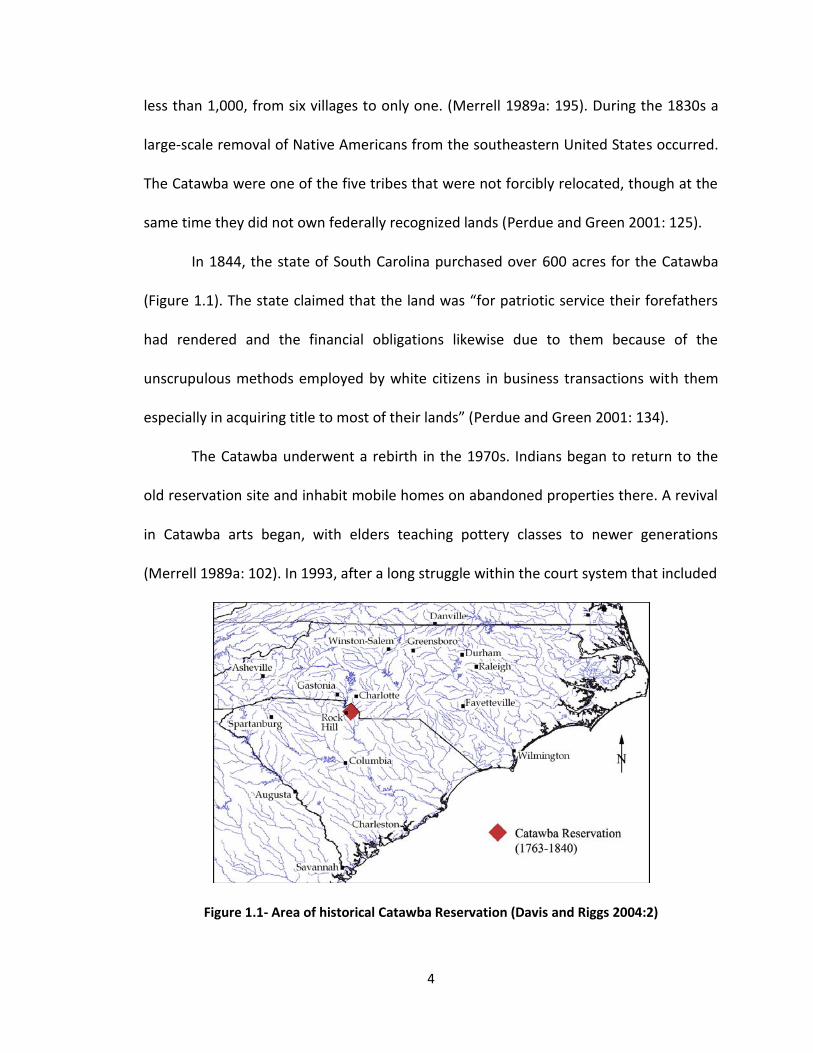
In 1844, the state of South Carolina purchased over 600 acres for the Catawba
(Figure 1.1). The state claimed that the land was “for patriotic service their forefathers
had rendered and the financial obligations likewise due to them because of the
unscrupulous methods employed by white citizens in business transactions with them
especially in acquiring title to most of their lands” (Perdue and Green 2001: 134).
The Catawba underwent a rebirth in the 1970s. Indians began to return to the
old reservation site and inhabit mobile homes on abandoned properties there. A revival
in Catawba arts began, with elders teaching pottery classes to newer generations
(Merrell 1989a: 102). In 1993, after a long struggle within the court system that included
Figure 1.1- Area of historical Catawba Reservation (Davis and Riggs 2004:2)
5
many appeals, the US government passed legislation that paid the Catawbas $50 million
and restored their previously terminated federal recognition (Perdue and Green 2001:
134).
The Catawba have a rich history, and one that shows how versatile and strong
their culture has been. The Catawba persevered through many different hardships,
more than once facing extinction, decimation, or collapse due to outside forces. They
have overcome many challenges, adapting while maintaining solidarity and a distinct
tribal culture. Their history shows what a strong and versatile people they are. Modern
archaeological research will only strengthen this, adding more history to an already rich
wealth of knowledge.
Research Design
In order to complete this project, raw clays and fired sherds from two sites were
analyzed using methods of X-ray diffraction (XRD) and X-ray fluorescence (XRF). The
results from these archaeological materials were compared to XRD and XRF tests run on
two different types of modern pottery clays that are used by potters today.
The first major question to be answered during this project was: Are the clay
samples being found in Catawba midden pits the same as the clay that is used to create
pottery vessels?
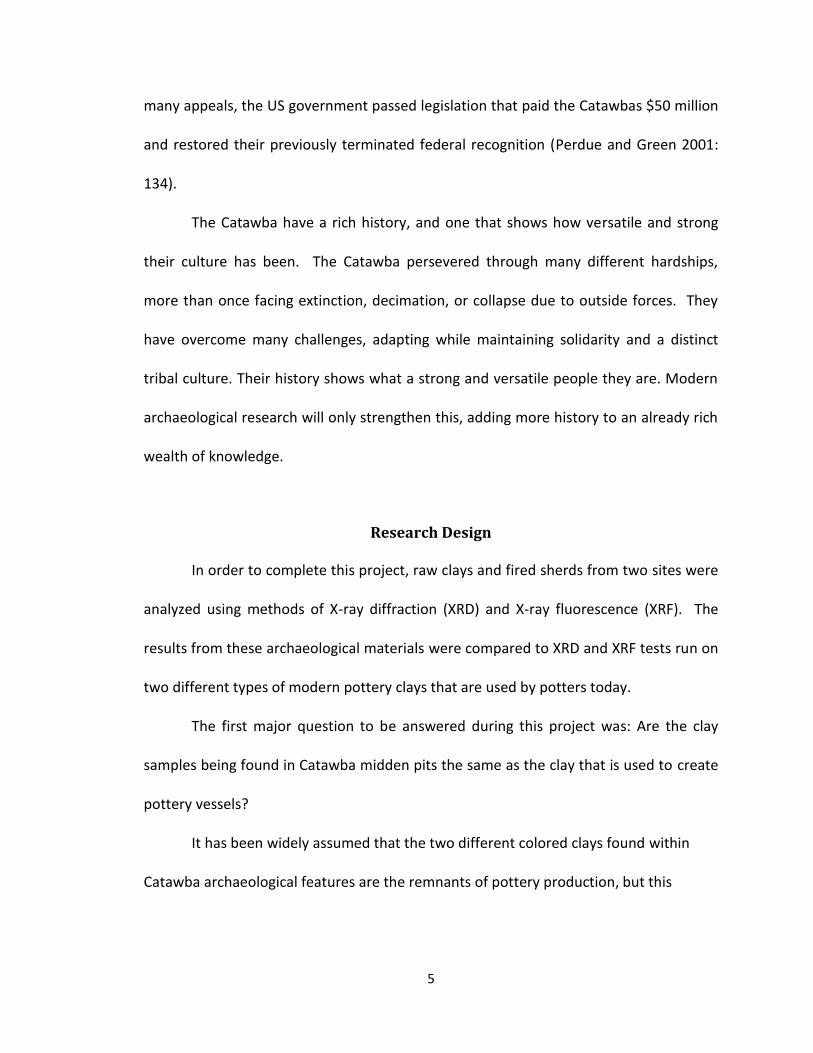
It has been widely assumed that the two different colored clays found within
Catawba archaeological features are the remnants of pottery production, but this
6
Figure 1.2- Example of sherds found at Old Town site (Riggs et al. 2006:82)
hypothesis has not previously been tested. The comparison between the archaeological
clays and pottery sherds is to be determined using XRD on the raw clays and both XRF
and XRD on the sherds.
The second major research question to be examined was: Are the current
Catawba potters using the same clay source today as they were in the late 1700s? Given
that the Catawba peoples have inhabited the same region for at least 250 years, it is
possible that the clay used by historic potters comes from the same source as the clay
used by modern Catawba potters today.
Archaeological Sites
The archaeological clays and pottery fragments were excavated from two differing but
contemporaneously occupied Revolutionary War era sites; Old Town, located in
Lancaster County, SC, and Ayres Town in York County, SC. These sites are
7
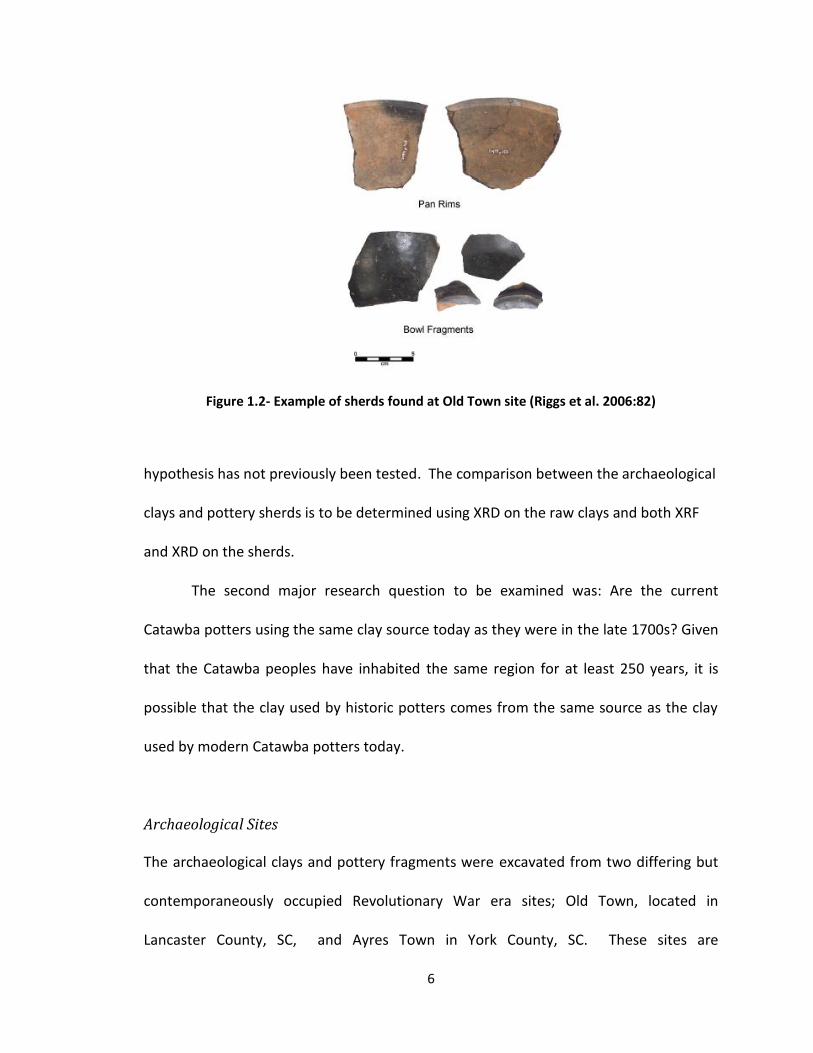
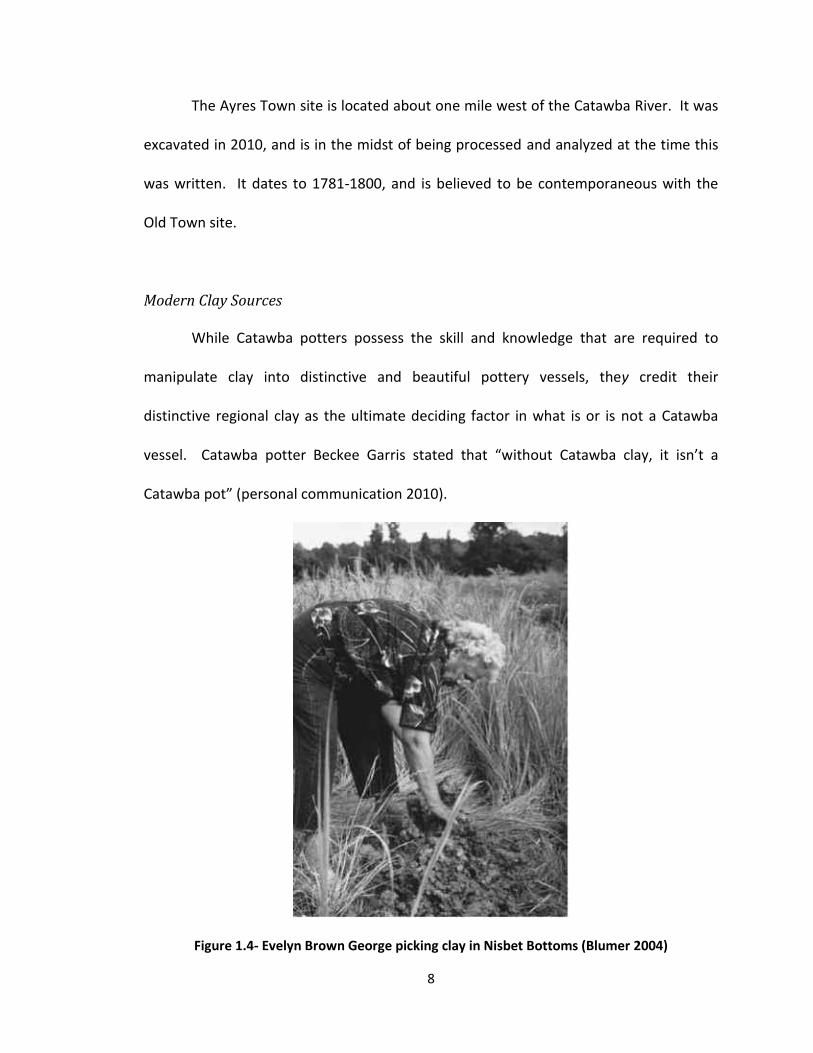
approximately 3 miles away from each other, and are located on opposite sides of the
Catawba River. Catawba Old Town (Figure 1.3) is located close to the banks of the
Catawba River and represents two sequential occupations that date to about 1761-
1780 and 1781- 1800. The site has five identified cabins and associated features. The
Native pottery vessels that have been found from this area were built as reproductions
of colonial wares, all highly burnished and most smudged. Also discovered at this site
were many other artifacts including nose bangles, English ceramics, glass beads,
gunflints, and a coin that dates to 1769 (Davis and Riggs 2004: 8-13).
Figure 1.3 An 1808 map section that documents the Catawba reservation and shows the
location of the Old Town site. Drawn by Jonathan Price and John Strothers; titled “The First Actual Survey of the State of North Carolina.” (Riggs and Davis 2006: 13).
8
The Ayres Town site is located about one mile west of the Catawba River. It was
excavated in 2010, and is in the midst of being processed and analyzed at the time this
was written. It dates to 1781-1800, and is believed to be contemporaneous with the
Old Town site.
Modern Clay Sources
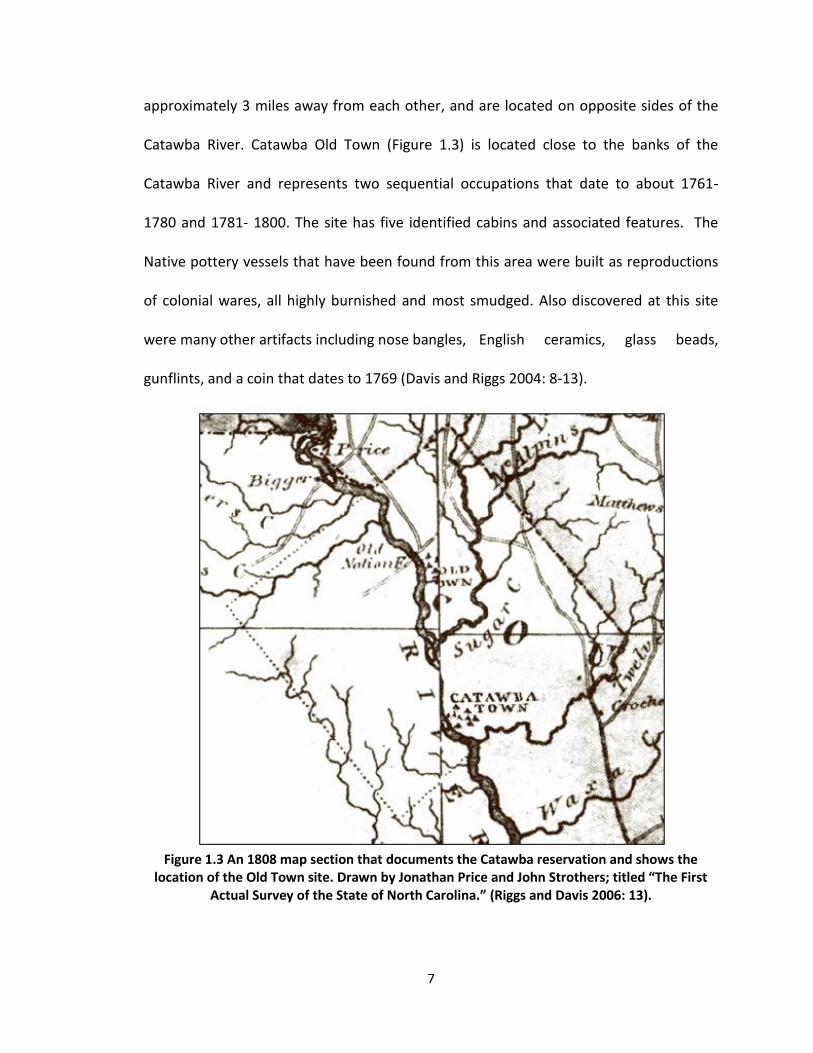
While Catawba potters possess the skill and knowledge that are required to
manipulate clay into distinctive and beautiful pottery vessels, they credit their
distinctive regional clay as the ultimate deciding factor in what is or is not a Catawba
vessel. Catawba potter Beckee Garris stated that “without Catawba clay, it isn’t a
Catawba pot” (personal communication 2010).
Figure 1.4- Evelyn Brown George picking clay in Nisbet Bottoms (Blumer 2004)
9
Throughout time, the Catawba potters have struggled to maintain exclusive control of
their pottery clay sources; and they are currently concerned that their pottery sources
may run out some time in the near future. Because of this, Catawba potters are
reluctant to share the location of their clay sources (Blumer 2004:93).
The Catawba use two types of clay to make pottery. The source of the first clay,
called pan clay, is an undisclosed location in the Nisbet Bottoms, a privately owned
property that is approximately half way between the Ayres Town and Old Town sites
(Beckee Garris, personal communication 2011). The source of the second clay, called
pipe clay, is located in Camden, which is approximately 55 miles from the Catawba
reservation. Mrs. Garris states that “the pipe clay comes from around the Camden area.
It is much coarser and darker in color with almost a blue look to it. It is not soaked as the
pan clay is but rather ground up like cement mix and gradually added to the pan clay
while stirring it” (Beckee Garris, personal communication 2010). Unfortunately, due to
the seasonal nature of the potter’s work, a sample of unadulterated pipe clay was not
available for testing.
Catawba potters believe that the Nisbet Bottoms has been a source of clay
throughout their history. In a paper written to defend the historical importance of this
place, Thomas Blumer states:
All of the potters interviewed during the course of the Memory Book Project spoke of the special nature of the clay found in Nisbet Bottoms. They knew the same clay was to be found in numerous other places but insisted this clay was their clay, the clay the old Indians dug. In their minds, though clay could be had in many places and they knew of several alternative sources, clay from the Nisbet Bottoms was preferred, not only for its quality but for its special nature [Blumer 2000: 6].
10
Chapter 2
CATAWBA POTTERY
The knowledge of pottery technology has been handed down from generation to
generation of Catawba potters, creating an unbroken pottery-making lineage that spans
over 250 years (Blumer 2004:2). Because of this, the pottery that is found in
archaeological situations bears resemblance to pottery produced and sold today. This
can be explained by an examination of Catawba methods of pottery production, with a
special emphasis on the acquisition of clays due to its importance to this project.
Historical Ethnographic Descriptions of Catawba Pottery
Discussed here is an analysis of two ethnographies that document the
production of Catawba pottery in 1908 and 1941. Two ethnographies were used for this
study, one published in 1908 by M.R. Harrington titled “Catawba Potters and Their
Work” and the second published posthumously in 1944 by Vladimir Fewkes, titled
“Catawba Pottery-Making, With Notes on Pamunkey Pottery-Making, Cherokee Pottery-
Making, and Coiling.”
Harrington’s study was undertaken and published in 1908. At the time of visit,
Harrington noted twelve houses upon the reservation, and described the practice of
ceramic manufacture as practically non-existent (Harrington 1908:401). Vladimir Fewkes
visited the Catawba reservation for the first time 21 years after Harrington, his research
11
spanning a period of 12 years. He interviewed and observed many different potters at
work, noting that at least 70 women on the reservation were knowledgeable in ceramic
production. In order to avoid repetition, the two ethnographic documents will be
reviewed here as one, with any discrepancies between the two authors noted.
To begin, Harrington noted two separate categories of vessels being made upon
the reservation: “old vessels that had seen service” (Harrington 1908:401) such as
cooking pots with and without legs, bowls, simple pipes and jars; and a category of
ceramics specifically made for trade, such as vases, pitchers, fancy pipes and flower
pots. Harrington noted that all of the vessels has been incised or modeled (Harrington
1908:401). In Fewkes’s later work he did not mention this distinction between vessels,
as he saw almost no pottery goods in domestic use on the reservation with the
exception of one household (Fewkes 1944:70). Both ethnographers noted a variety of
tools being used by the Catawba in order to produce vessels. Harrington placed them
into two categories: tools native in origin and tools modern in origin. The native tools
included wooden pestles up to 2½ ft long, mussel shells, wood and gourd modelers of
circular or oval form, cane for cutting and piercing, wooden tools for boring pipe stems,
smooth fine grained water worn pebbles for rubbing stones, and polished bone
implements resembling blunt awls. Objects of modern origin included a lap board used
for rolling and as bases for modeling (called a “manipulating board” by Fewkes), iron
knives, wire and coins for decoration, and agricultural hoes for digging clay (Harrington
1908:402). Fewkes noted that the potter also kept a supply of water in a tin can or wash
basin nearby at all times (Fewkes 1944: 73)
12
Raw Materials
Both ethnographers describe similar techniques for clay acquisition and
preparation, but Fewkes describes the process in much greater detail. Though Fewkes’s
summary is more thorough, he does note that “even in 1941 I was asked to remain in
the car while a sample of pan clay was being obtained” (Fewkes 1944:73). Fewkes
describes the landscape surrounding the Catawba as plentiful in clay beds, and records
that potential clay pits are often found in ravines, gullies, hillsides, and eroded surfaces.
Geographically, Fewkes notes that the Catawba find clay within the borders of their
reservation, but also on public and private properties within the local area (Fewkes
1944:73).
First, the clay is dug by men of the tribe from already established clay pits using
agricultural tools or bare hands. The clay pits can extend several feet under the ground,
and the use of agricultural tools may be implemented to reach the clay bed. The women
will pick over the clays for impurities as it is loaded into baskets or sacks for
transportation. After using a pit it would be covered or concealed, as clay pits were
highly prized and needed to be protected from rain or unfriendly exploitation. Although
protected, clay pits were not always exploited until depleted (Fewkes 1944:73).
Harrington states that “until it becomes troublesome to keep free of water” a clay pit
will be used, then the potter will “abandon it and begin a new one nearby” (Harrington
1908: 403).
Two kinds of clay are exploited for vessels production: pan clay or “blue clay,”
which is dry, compact, coarse textured, and usually contains sand and mica; and pipe
13
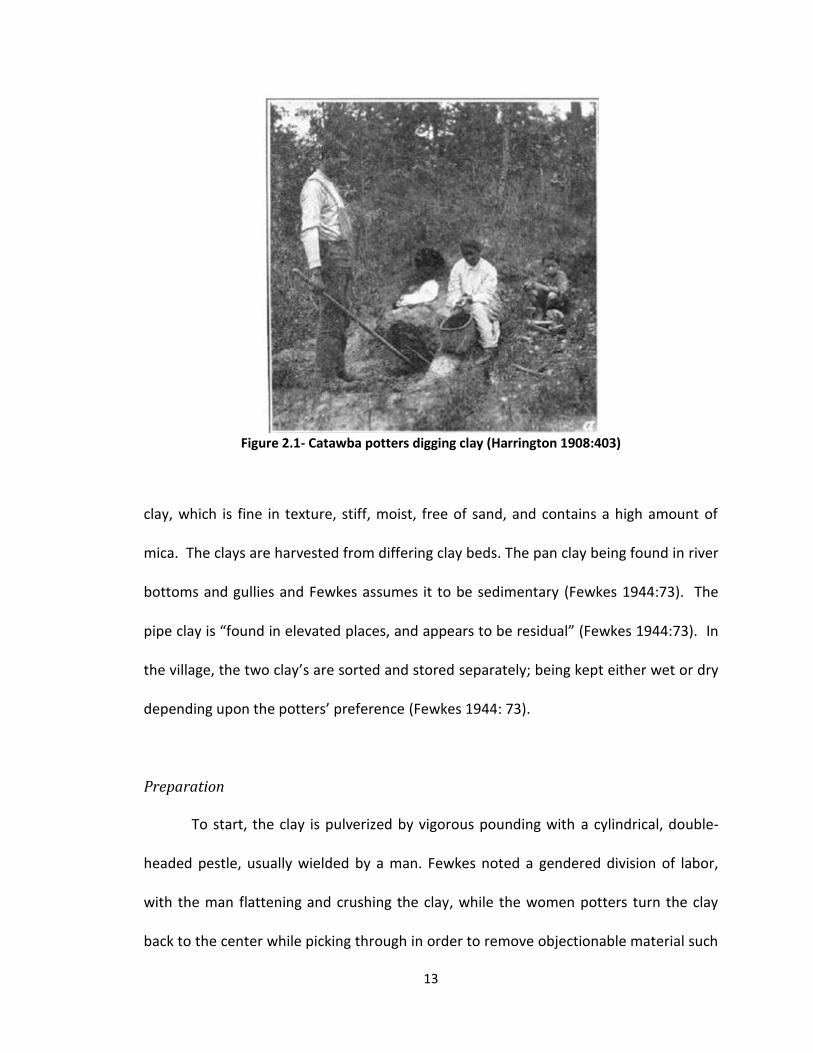
Figure 2.1- Catawba potters digging clay (Harrington 1908:403)
clay, which is fine in texture, stiff, moist, free of sand, and contains a high amount of
mica. The clays are harvested from differing clay beds. The pan clay being found in river
bottoms and gullies and Fewkes assumes it to be sedimentary (Fewkes 1944:73). The
pipe clay is “found in elevated places, and appears to be residual” (Fewkes 1944:73). In
the village, the two clay’s are sorted and stored separately; being kept either wet or dry
depending upon the potters’ preference (Fewkes 1944: 73).
Preparation
To start, the clay is pulverized by vigorous pounding with a cylindrical, double-
headed pestle, usually wielded by a man. Fewkes noted a gendered division of labor,
with the man flattening and crushing the clay, while the women potters turn the clay
back to the center while picking through in order to remove objectionable material such
14
as organic or rock debris. The raw material is crushed and pounded separately, then
sifted through a screen or sieve onto a board or textile in order to further remove
objectionable material. Once the clay is sufficiently pounded and picked over, the
different clays are mixed together by standards that suit the preference of the specific
potter, usually half pan and half pipe clay, or two-thirds pan to one-third pipe clay. Clay
that is going to be used only for the production of pipes is not blended, as the pipe clay
is used alone in pipe production. The mixed clays are then combined by heavy pounding
and mixing, with an addition of water followed by more mixing and hand kneading. It is
important to note that the Catawba do not add temper, and the process of preparation
removes any large inclusions present in the natural clay. Fewkes notes that occasionally
the blood of domestic animals is added to produce a lighter weight in the final product
(Fewkes 1944:71-73).
Construction
When documenting vessel formation, Fewkes notes a variety of different
methods of vessel formation, while Harrington only mentions one observed method.
The first method described by Fewkes is modeling, also mentioned by Harrington but
only as a method of fashioning the base of a coiled pot (Harrington 1908:403). In order
to model a vessel, Fewkes describes the potter as beginning with spherical lump of clay
and forming a depression with thumbs in the center. The potter then presses her fingers
into the lump’s depression while turning with other her hand; Fewkes notes that the
vessel is supported by the potter’s hand or fragment of vessel or gourd rind, but the
15
shape of the vessel is not achieved by the shape of supports. This method is usually
implemented to create pots small in size and simple in shape. The potter implements
minimum scraping and if desired polishes the vessel with a pebble or wet cloth (Fewkes
1944:78).
Fewkes notes two different methods used for coiling a vessel or “segmental
building,” describing them as the ring variant and the circuit variant. Both methods are
built upon bases built by hand modeling; coiling is only used for the erection of the wall.
With the ring variant, the potter superpositions individual rings of constant dimension
that have been separately fashioned and closed on the manipulating board. These rings
are overlaid upon a modeled disk- shaped bottom that was dropped onto the dry-paste
coated manipulating board with an impact that flattens its underside. The rings are
prepared by dividing cylindrical uniform fillets of paste and cutting ribbons of clay from
each fillet. These ribbons are rolled between the palms while hanging like a pendant;
these ribbons are formed into coils with diameters that are more or less equal, and then
closed into rings. The initial ring is placed on the flattened disk-base and pressed down,
with additional rings superimposed one by one, each pressed down vertically. The joints
of rings are aligned “in order to aid the shaping process,” and bonding is achieved by
pinching, pressing, and smoothing. The circuit variant is exactly the same as the ring
variant, with the coils being left open prior to superposition upon each other, with the
ends joined upon the vessel, and any additional is clay pinched off or added as needed
(Fewkes 1944:79). This is the only method of vessel manufacture observed and reported
by Harrington (Harrington 1908:403).
16
For both methods, the hands are frequently washed in order to keep them free
of paste and to facilitate bonding and removal of surplus material. The crude product
usually has a cylindrical form and requires shaping. In order to shape the vessel a spoon-
shaped gourd rind is used on the inside of the cylinder with the free hand supporting
the outside and the other hand moving in an upward scraping motion inside the vessel.
A cane knife is used to remove excess paste, and when finished the vessel will have a
smooth appearance inside and out, with much thinner walls than it started with.
Further scraping is done on the outer surface with a frequently wettened mussel shell;
the same mussel shell is also used to cut and polish the rim (Fewkes 1944:80).
The last method described by Fewkes is the process of molding within a double
form, used by the Catawba to make pipes. To start, a blank pipe form is made of paste
using equal parts of the two clays, this serves as an original model that is shaped by
hand and fired. The original fired blank pipe is then pressed into two lumps of clay on
either face, both of which are fired to become the two sides of a mold. Fewkes notes
that most pipes are molded excepting for pipes with the peace, spearhead, and plain
forms which are usually hand modeled. In order to mold a pipe, a rough shape of clay is
pressed into a mold, and the two sides of the mold are closed. The excess paste oozes
out and is scraped off. The paste blank is frequently removed and scraped, then inserted
again until assuming its final shape. A pipe with the desired shape is then dried and
given a surface treatment such as burnishing and incising before the stem is pierced and
the bowl carved out (Fewkes 1944:82).
17
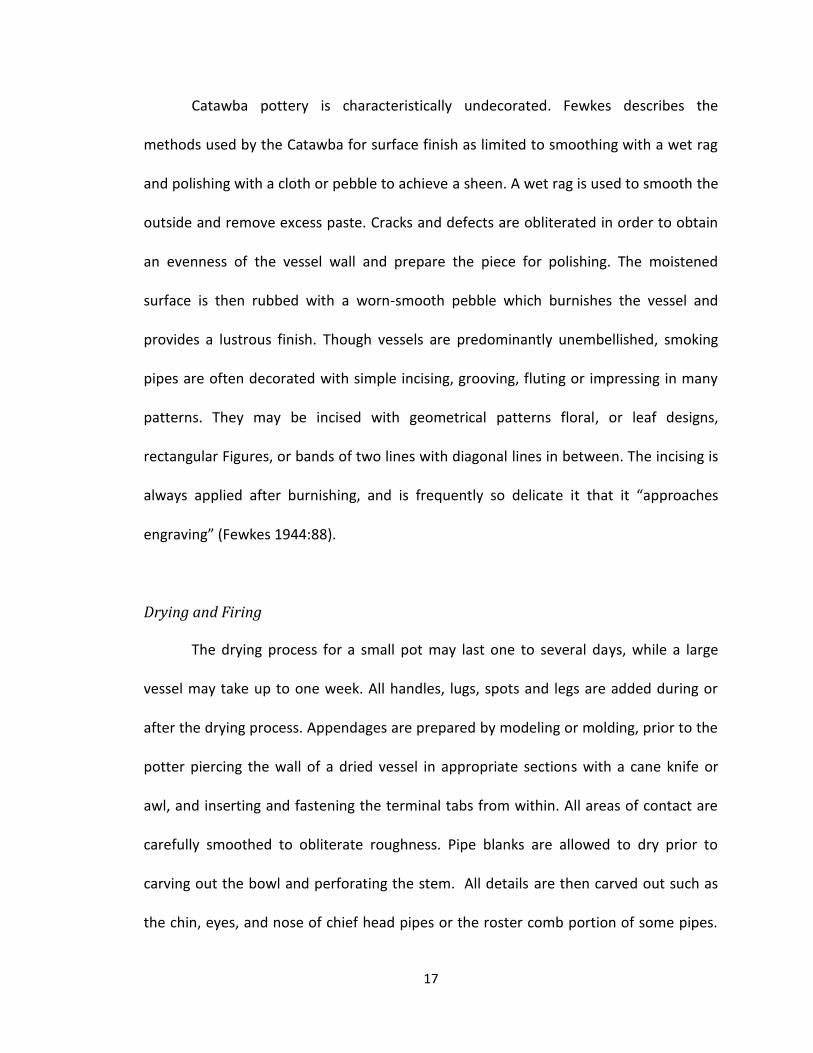
Catawba pottery is characteristically undecorated. Fewkes describes the
methods used by the Catawba for surface finish as limited to smoothing with a wet rag
and polishing with a cloth or pebble to achieve a sheen. A wet rag is used to smooth the
outside and remove excess paste. Cracks and defects are obliterated in order to obtain
an evenness of the vessel wall and prepare the piece for polishing. The moistened
surface is then rubbed with a worn-smooth pebble which burnishes the vessel and
provides a lustrous finish. Though vessels are predominantly unembellished, smoking
pipes are often decorated with simple incising, grooving, fluting or impressing in many
patterns. They may be incised with geometrical patterns floral, or leaf designs,
rectangular Figures, or bands of two lines with diagonal lines in between. The incising is
always applied after burnishing, and is frequently so delicate it that it “approaches
engraving” (Fewkes 1944:88).
Drying and Firing
The drying process for a small pot may last one to several days, while a large
vessel may take up to one week. All handles, lugs, spots and legs are added during or
after the drying process. Appendages are prepared by modeling or molding, prior to the
potter piercing the wall of a dried vessel in appropriate sections with a cane knife or
awl, and inserting and fastening the terminal tabs from within. All areas of contact are
carefully smoothed to obliterate roughness. Pipe blanks are allowed to dry prior to
carving out the bowl and perforating the stem. All details are then carved out such as
the chin, eyes, and nose of chief head pipes or the roster comb portion of some pipes.
18
The pipe is then burnished using a pebble or bone-awl around tighter areas (Fewkes
1944:88).
Once dried and decorated, the vessels are fired in the open while the pipes are
fired separately in a fuel-smothered receptacle. All pots are fired in a plain hearth,
outdoor pit, or indoor fireplace, with fuel of wood, tree bark, or corncobs. To begin the
process, the pots are placed around the fire for about a half hour in order to remove all
excess interstitial water, a process known as pot smoking. Over time, the vessels are
moved closer and closer with all directions frequently facing the fire as they are
periodically turned. Once warm, the vessels are moved closer to fire with the rim facing
inwards and more fuel added to fire. Next, they are moved practically next to the fire
and are turned repeatedly with a stick, as they are too hot to handle. Some potters may
smear the vessel with a grease-covered rag at this point in order to create a vessel they
believe is darker in color and of lighter weight. More fuel such as bark or woodchips is
added, in order to create a reducing atmosphere, and sometimes hot bark is placed
directly on vessel in order to encourage fire clouding, a desired effect. After pots are
fired, but while still hot, some potters may smear the pot with lard or bacon rind in
order to seal the vessel and create luster (Fewkes 1944:91). Fewkes noted that some
potters in the past would decorate the pot with red sealing wax at this stage; he saw
vessels that had been decorated in this manner but did not see modern potters using
this technique (Fewkes 1944:91).
19
Modern Catawba Tradition
The Catawba pottery tradition has survived the tests of time; the ceramics made
by potters today have a striking similarity to historic ceramics made as early as the
1760s (Blumer 2004:7). Passed along with the knowledge of how to work clay is an oral
tradition that ties Catawba clay and ancestral origins. Thomas Blumer recorded a tale
told to him by Susannah Harris Owl in 1977:
One day the Creator decided to make a man. He took some clay and molded one and put the Figure in the fire to burn. When the Creator thought the man was baked enough, he took him from the fire. He was hardly burned at all and was a pale color. Dissatisfied, God took the man and threw him across the sea. He became the white man. The Creator did not despair but decided to try again. So he took up his clay and molded another Figure and put it in the fire to burn. This time He let the fire burn longer. When the Creator thought the man was baked enough, he took the man from the fire. To His dismay, the man was burned black. Dissatisfied again, God took the man and threw him across the ocean. This man became the Negro. The Creator decided to try one more time. He took up his clay and molded another Figure and placed it in the fire. He watched the fire more carefully this time and took the man out at just the right moment. The man was burned nice and red. The Creator did not throw this man away but kept him. This perfect man was the first Catawba Indian [Blumer 2004:5]. This oral legend is telling of how the Catawba potters of today still feel about
their clay. In the process of this project, Beckee Garris, the potter who provided the
modern clay sample, warned that the clay had many cultural taboos. Prior to providing
the samples she had to ask permission from the Catawba Tribal Elders in order to insure
that this project would not violate these taboos (personal communication, 2010).
This cultural respect for the local Catawba clays is reflected in the high quality of
Catawba pottery, which can fetch a high price on the pottery market. The production of
ceramic vessels has become an economic boon for many Catawba potters, and this
reality helps insure that this cultural tradition will be passed on to future Catawba
20
generations (Blumer 2004:4). Currently, the number of Catawba potters that are
learning the craft and producing pottery is greater than at the end of the nineteenth
century (Blumer 2004:11).
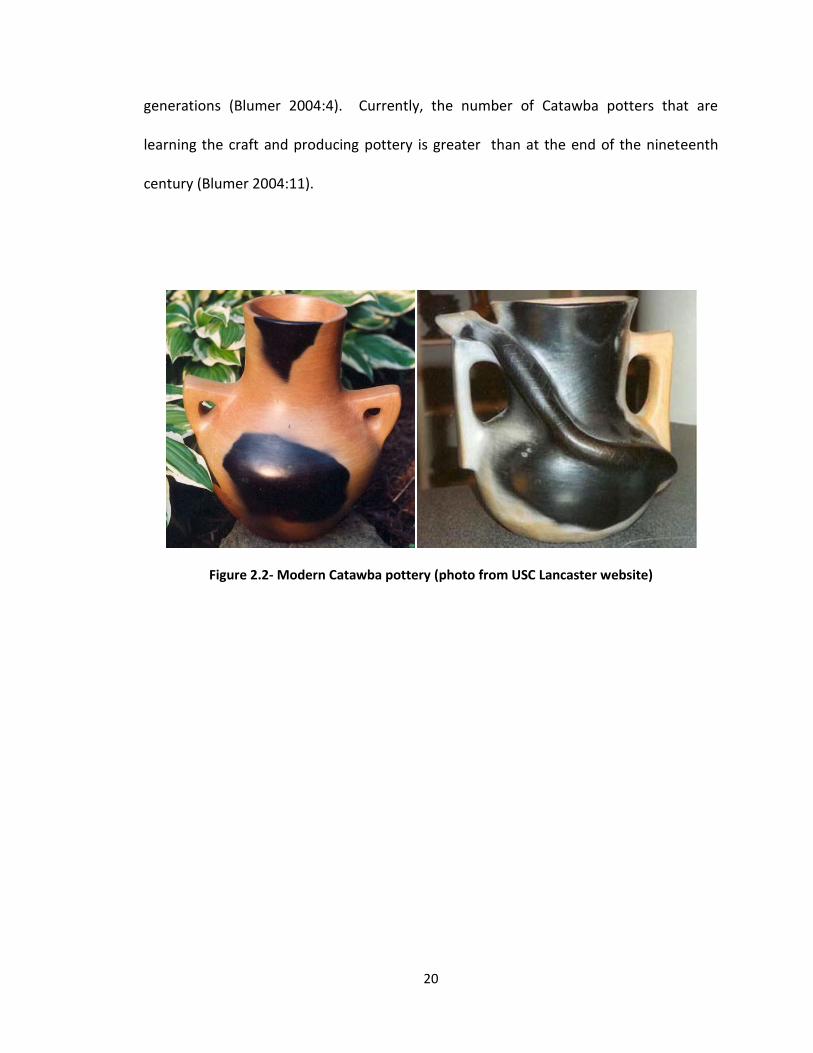
Figure 2.2- Modern Catawba pottery (photo from USC Lancaster website)
21
Chapter 3
GEOLOGY
An understanding of material properties of clay, as well as of the surrounding
geological landscape, is important for interpreting the mineralogical and elemental data.
Regional variation affects the composition of clays found within a region, as does the
method of clay deposition. Once this is explored and understood, trends based upon
geology may become obvious when interpreting the geochemical data.
Clay
The term clay has two working definitions; the word clay can be used to describe
a size grade or a specific mineral category. When the term clay is being used in
reference to mineral content, it is defined as a broad category of hydrous silicate
minerals in which the silica tetrahedrons are arranged into sheets. The three main types
of clay important to pottery production are the minerals illite, smectitie, and kaolinite.
The kaolin group of clay minerals includes kaolinite and halloysite, both of which are
hydrated aluminum silicates. Kaolinite has a simple layer structure; a kaolinite layer is
composed of one tetrahedral sheet combined with one octahedral sheet. Clays
predominantly composed of kaolinite are commercially known as “kaolin”. Kaolinite has
a chemical formula AlAlSiO5(OH)4. Kaolinite has multiple polymorphs, which are
minerals with identical chemical formulas but differing crystalline lattices. Polymorphs
22
of kaolinite that are relevant to this project include the minerals dickite and nacrite
(Nesse 2000:253).
A second group is illite, a phyllosilicate or layered alumino-silicate. Its structure is
constituted by the repetition of tetrahedron – octahedron – tetrahedron (TOT). The
interlayer space is mainly occupied by poorly hydrated potassium cations responsible
for the absence of swelling.
Smectite, the last of the clay mineral groups, has a variable chemical
composition, owed much to substitution in the crystal lattice and to the presence of
variable amounts of cations such as calcium and sodium between the Ayres (Nesse
2000:253).
The second definition of clay is based upon a size classification, where clay is a
clastic particle of any composition with a grain size less than 2 or 4 microns. This
definition of clay can be classified into two types, depending on formation processes;
clay can be either sedimentary or residual. Residual clays derive directly from the
weathering of a rock into very fine particles. The particles become mixed with water and
materials from the surrounding soil. Clay which is residual will probably have a fairly
unique chemical and mineral composition that reflects the rock from which it
weathered from.
Sedimentary clays are formed when particles of weathered rocks are carried by
water or some other locomotor from the place in which they were formed by
weathering, and are deposited in another place, which usually creates a layered effect.
23
Sedimentary clays that were deposited through alluvial movement will have a chemical
composition that reflects the geology through which the river flowed (Nesse 2000:255).
Geology of the Catawba Region
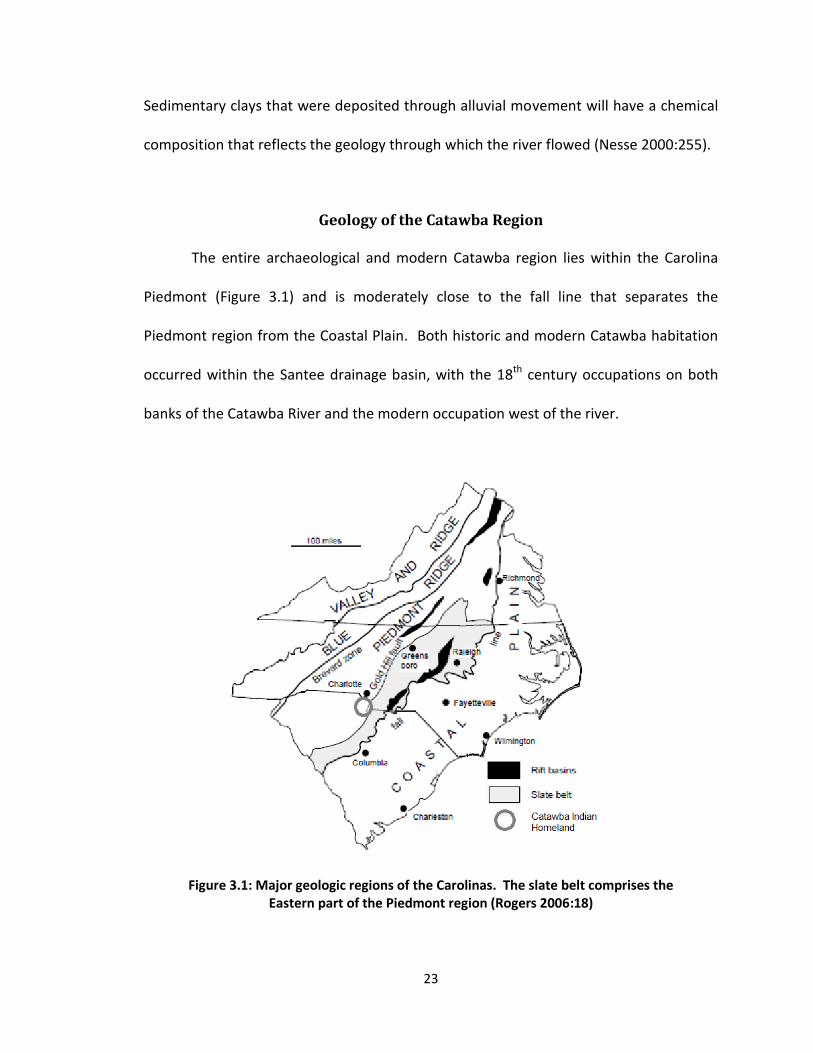
The entire archaeological and modern Catawba region lies within the Carolina
Piedmont (Figure 3.1) and is moderately close to the fall line that separates the
Piedmont region from the Coastal Plain. Both historic and modern Catawba habitation
occurred within the Santee drainage basin, with the 18th century occupations on both
banks of the Catawba River and the modern occupation west of the river.
Figure 3.1: Major geologic regions of the Carolinas. The slate belt comprises the Eastern part of the Piedmont region (Rogers 2006:18)
24
Geology of the Carolina Piedmont
The Carolina Piedmont is a plateau region that divides the Appalachian
Mountains from the Coastal Plain. It ranges between 200 feet to 1,000 feet in elevation,
and it is characterized by gentle, rolling hills. Multiple orogenic events led to the
creation of the piedmont, and include the Grenville and Appalachian orogonies. The
breakup of Pangaea formed the large Triassic-era basins that have since been partly
filled with surrounding weathered sediments (Rogers 2006: 18). The Piedmont can be
divided into two unequal halves: the western and eastern piedmont. These halves are
divided based upon elevation as well as rock type, with the higher western half
dominated by higher-grade gneisses, schists, and amphibolites. The lower, eastern half
is comprised of low-grade metavolcanic and metasedimentary rocks of the Carolina
Slate Belt. The piedmont is separated from the coastal plain by the fall line (Herbert and
McReynolds 2008: 9).
Catawba River
The Catawba River begins its decent towards the Atlantic Ocean near the base of
Mount Mitchell, flowing past the town of Old Fort near the Blue Ridge Mountains of
North Carolina (Figure 3.2). It then travels over 150 miles through the Piedmont region
of North Carolina. After crossing into the South Carolina piedmont, the Catawba River
crosses through multiple man-made dams and lakes until crossing the Fall Line and into
Lake Wateree. Below Lake Wateree the river changes names to the Wateree River and
25
finally joins the Congaree River, which eventually becomes the Santee River before
entering the Atlantic Ocean (NCSU 2006: 1).
The Catawba River has features common in the piedmont region, such as rocky
shoals with pool and riffle features that have been created by the flow of water. The
western piedmont, where the historic Catawba nation resided, has areas that are
composed of a rock type that is softer, and therefore easier for rivers to erode. In these
areas, the river is able to move laterally and form meanders and floodplains where the
flow of water is slowed and sediments are deposited. These sediments are a result of
the narrow valley and softer soils eroding clay minerals and silt-sized particles into the river
(Rogers 1999: 28). The alluvial clay deposits of the Catawba- Wateree River Basin were
created through this geologic process.
The fact that the Catawba River has headwaters and tributaries that begin in the
Appalachian Mountains may have an impact upon this study. The mountain region of
the Carolinas has a mineral and elemental composition that differs from that of the
Carolina piedmont, and this may be reflected in the alluvial clays deposited by the
Catawba River. Because the Catawba River passes through no significant change in
geology once it enters the piedmont, all of the sedimentary clays deposited by the
Catawba River should be homogeneous in the region surrounding the region being
studied here.
26
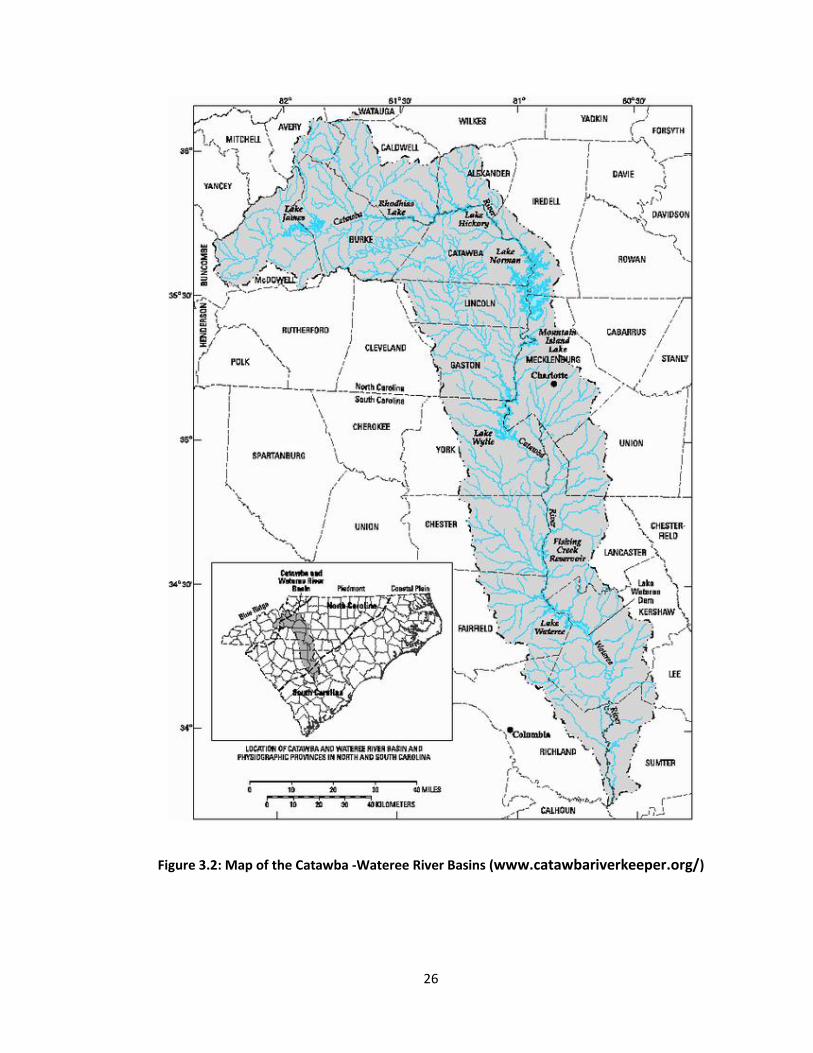
Figure 3.2: Map of the Catawba -Wateree River Basins (www.catawbariverkeeper.org/)
27
Chapter 4
METHODS
Overall, fourteen different archaeological clays, two different modern clays, and
four fired ceramic sherds comprise the research sample. All clays were tested for
mineralogical analysis, and a randomly chosen sample of seven clays and four sherds
were tested for elemental analysis.
Archaeological Clays
In accordance with both modern pottery tradition as well as ethnographic
research, two distinct clays have been found within domestic Catawba middens, one a
blue-gray and the other a tan or yellowish gray. In addition, a distinctive red clay was
found, which was also tested in order to determine if it was used for pottery production.
Overall, fourteen different clay samples were chosen from thirteen discrete features
(Table 4.1). Six of the samples were taken from the Old Town site. Upon visual
inspection, it seems as though there are two distinct types of clay— a darker, gray clay
and a light tan clay. The Ayres Town clays include eight different samples, representing
three dissimilar types of clay. Again, the gray clays and tan clays were present, as well as
a sample of orange-red clays that were not found in the Old Town assemblage.
28
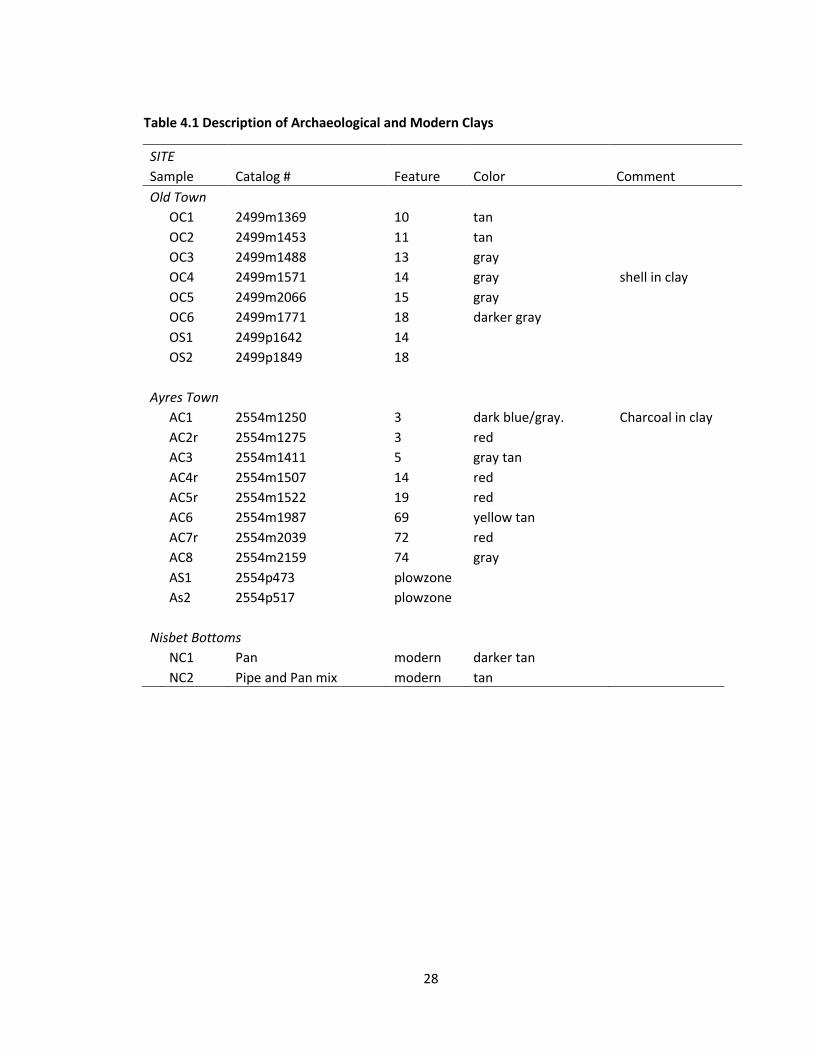
Table 4.1 Description of Archaeological and Modern Clays
SITE
Sample Catalog # Feature Color Comment
Old Town
OC1 2499m1369 10 tan
OC2 2499m1453 11 tan
OC3 2499m1488 13 gray
OC4 2499m1571 14 gray shell in clay
OC5 2499m2066 15 gray
OC6 2499m1771 18 darker gray
OS1 2499p1642 14
OS2 2499p1849 18
Ayres Town
AC1 2554m1250 3 dark blue/gray. Charcoal in clay
AC2r 2554m1275 3 red
AC3 2554m1411 5 gray tan
AC4r 2554m1507 14 red
AC5r 2554m1522 19 red
AC6 2554m1987 69 yellow tan
AC7r 2554m2039 72 red
AC8 2554m2159 74 gray
AS1 2554p473 plowzone
As2 2554p517 plowzone
Nisbet Bottoms
NC1 Pan modern darker tan
NC2 Pipe and Pan mix modern tan
29
In 1944 ethnographer Vladimir Fewkes ran chemical tests on the clays he obtained from
the Catawba in order to test them for their iron-oxide percentage. He found a relatively
high ferric content for both clays, which he states “help to explain the red-burning
tendency of the two clays” (Fewkes 1944:73).
Modern Clays
The modern clays were obtained from Catawba potters Caroleen Saunders and
Beckee Garris in the fall of 2010. They provided egg-sized lumps of clay that were
samples from larger clay bodies currently in use by the potters for constructing vessels.
One sample (NC-1) was 20 grams of pan clay, which had been prepared for use in the
vessel body in a traditional method. The pan clay is sourced from Nisbet Bottoms. The
second sample (NC-2) was approximately 20 grams of a pipe and pan clay mix. This mix
is what modern Catawba potters use in order to make vessels. The pipe clay is sourced
from an area near Camden, SC; the ratio of the mixture was not given (Beckee Garris,
personal communication 2010).
Ceramics
Four pottery fragments were used for this study. In order to provide a large
enough sample for XRF, each sherd had to weigh at least 8 grams. Two of the sherds
came from Old Town, where they were found in features 14 and 18 (samples OS1 and
OS2). Sample OS1 is a buff ware, a sherd that is lighter in color and more delicate.
Sample OS2 is a red ware, a ceramic that is darker and color and coarser. The two
30
sherds from Ayres Town came from the plow zone, as at the time of this study the
ceramic materials from features had not yet been analyzed. Both sherds were red
wares. Buff-ware sherds are more delicate, and so when they are found in the plow
zone they are much smaller and cannot provide a large enough sample for XRF.
X-Ray Diffraction
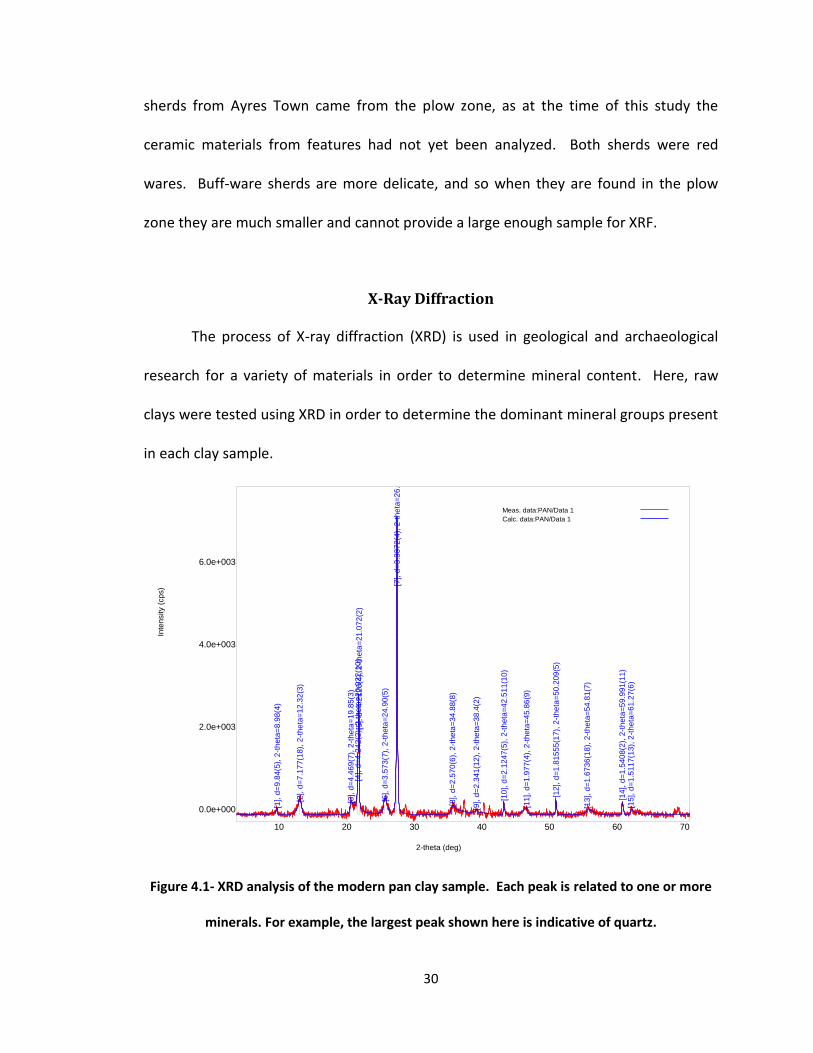
The process of X-ray diffraction (XRD) is used in geological and archaeological
research for a variety of materials in order to determine mineral content. Here, raw
clays were tested using XRD in order to determine the dominant mineral groups present
in each clay sample.
Figure 4.1- XRD analysis of the modern pan clay sample. Each peak is related to one or more
minerals. For example, the largest peak shown here is indicative of quartz.
10 20 30 40 50 60 70
0.0e+000
2.0e+003
4.0e+003
6.0e+003
[1], d
=9
.84(5
), 2
-th
eta
=8
.98(4
)
[2], d
=7
.177
(18),
2-t
heta
=1
2.3
2(3
)
[3], d
=4
.469
(7),
2-t
heta
=19
.85(3
)[4
], d
=4
.242
(2),
2-t
heta
=20
.922
(10)
[5], d
=4
.212
6(4
), 2
-th
eta
=2
1.0
72
(2)
[6], d
=3
.573
(7),
2-t
heta
=24
.90(5
)
[7], d
=3
.337
2(4
), 2
-th
eta
=2
6.6
90
(3)
[8], d
=2
.570
(6),
2-t
heta
=34
.88(8
)
[9], d
=2
.341
(12),
2-t
heta
=3
8.4
(2)
[10], d
=2
.124
7(5
), 2
-th
eta
=4
2.5
11(1
0)
[11], d
=1
.977
(4),
2-t
heta
=4
5.8
6(9
)
[12], d
=1
.815
55
(17),
2-t
heta
=5
0.2
09
(5)
[13], d
=1
.673
6(1
8),
2-t
heta
=5
4.8
1(7
)
[14], d
=1
.540
8(2
), 2
-th
eta
=5
9.9
91(1
1)
[15], d
=1
.511
7(1
3),
2-t
heta
=6
1.2
7(6
)
2-theta (deg)
Meas. data:PAN/Data 1
Calc. data:PAN/Data 1
Inte
nsity (
cp
s)
31
XRD is an analytical technique principally used for phase identification of a
crystalline material, in which the average bulk composition is determined. Fired pottery
sherds cannot produce results useful to this project using this method due to the
breakdown of the crystallographic lattice of clay minerals during the firing process.
The X-ray diffractometer machine consists of of three parts: an X-ray tube, a
sample holder, and an X-ray detector. X-rays are produced in the tube by heating a
filament which creates electrons that are accelerated by applying a voltage. The
electrons are directed at the slide and the sample acts as a diffraction grating. X-rays
will be enhanced as they pass through the grating if they leave the crystal in phase, or
will be cancelled out if the leave the crystal out phase. How the X-rays leave the crystal
is determined by Bragg’s law, which states nλ=2dsinθ where n is an integer, lambda (λ)
is the wavelength of the incident wave, d is the spacing between planes of atoms
characteristic of each crystals structure, and theta (θ) is the angle of incidence of the x-
ray. The diffractometer scans across 2 θ angles and determines d for which waves exit
the crystal in phase. The family of d-spacings is characteristic of the mineral phase being
analyzed.
This study also uses the reference-intensity-ratio (RIR) method. RIR is a method
used for quantitative analysis in powder diffraction XRF. The RIR method scales ratios to
a common reference; all factors except the mineral concentration in the sample are
ratioed and reduced to a constant. By using ratios and measuring peak areas, the RIR
method can be used to determine relative concentrations of minerals within the
32
sample. This concentration data is calculated into the percentage of each mineral in the
sample (Dutrow 2011:3).
Sample Preparation
Sample preparation for this project was a simple process. The air-dried clay was
ground into powder using a mortar and pestle, then sprinkled on a piece of double-
sided tape adhered to a standard petrographic glass slide. The excess powder was
shaken off and saved. During the process care was taken to not press the clay sample
onto the slide as clay minerals are plate-like and will align to one another, negatively
distorting the results. There are more complex methods of sample preparation that
include saturation and acid dissolution, but they were not required for this project.
XRD Configuration
The XRD spectra were recorded at room temperature with a Philips PW 1720
diffractometer using Cu Ka radiation with a graphite monochromator. The diffracted
patterns were recorded between two theta angles of 2.5 and 70 ° with a scanning step
of 0.02° 2 and a measuring time of two seconds per point.
X- Ray Fluorescence
X-ray fluorescence is a method of determining the elemental data of a sample
both qualitatively and quantitatively. An X-ray tube is used to emit high energy electron
energy in the form of x-rays, which are directed toward the sample. When the x-rays hit
the sample, secondary fluorescent x-rays are emitted due to elemental reshuffling of
33
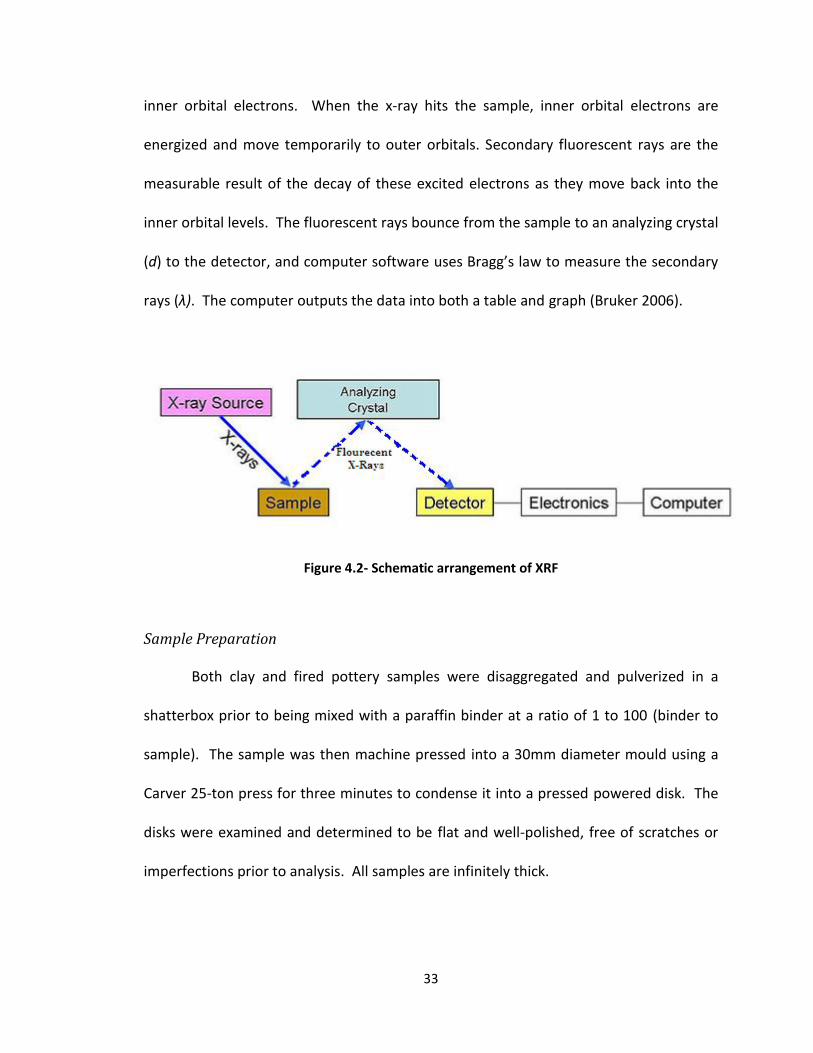
inner orbital electrons. When the x-ray hits the sample, inner orbital electrons are
energized and move temporarily to outer orbitals. Secondary fluorescent rays are the
measurable result of the decay of these excited electrons as they move back into the
inner orbital levels. The fluorescent rays bounce from the sample to an analyzing crystal
(d) to the detector, and computer software uses Bragg’s law to measure the secondary
rays (λ). The computer outputs the data into both a table and graph (Bruker 2006).
Figure 4.2- Schematic arrangement of XRF
Sample Preparation
Both clay and fired pottery samples were disaggregated and pulverized in a
shatterbox prior to being mixed with a paraffin binder at a ratio of 1 to 100 (binder to
sample). The sample was then machine pressed into a 30mm diameter mould using a
Carver 25-ton press for three minutes to condense it into a pressed powered disk. The
disks were examined and determined to be flat and well-polished, free of scratches or
imperfections prior to analysis. All samples are infinitely thick.

34
XRF Configuration
The data for this study were obtained by using a Rigaku Supermini wavelength-
dispersive XRF spectrometer. Each sample was analyzed twice.
35
Chapter 5
RESULTS OF XRD
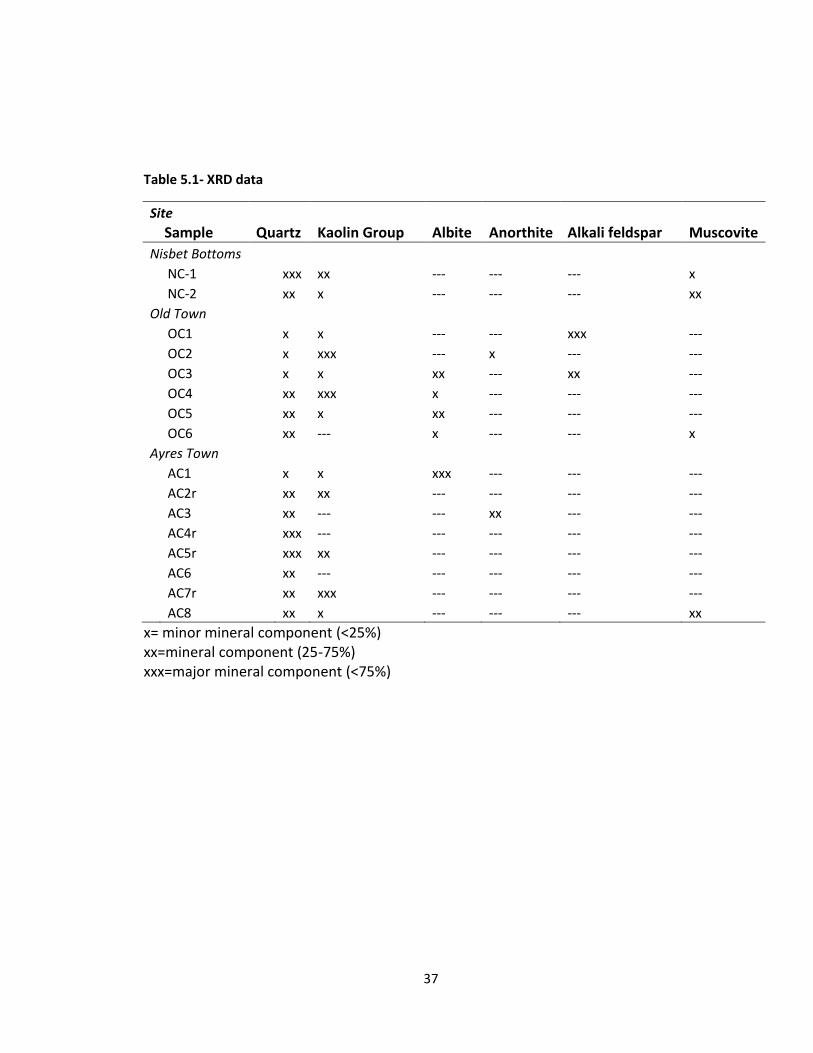
Sixteen samples were analyzed using XRD analysis, which determined that the
clays were composed of nine minerals. The results of all the samples are shown grouped
together by both the mineral group in Table 5.1, as well as by polymorph in Table A in
the appendix. All clays, both modern and archaeological, contain alpha-low quartz
(SiO2). All but four of the samples are composed of a form of a clay mineral; it was
determined that these clay minerals are kaolinite, dickite, and nacrite, all of which share
the chemical formula AlAlSiO5(OH)4 (referred to as the kaolin group from here on).
Eight of the samples contained a feldspar mineral component. Seven of these
were plagioclase feldspar, five contained albite (NaAlSi3O8), and two contained anorthite
(CaAlSi2O8). Two samples contained alkali feldspar (KAlSi3O8), one containing microcline
and the other orthoclase. Only four of the samples contained a mica mineral, with both
of the modern samples and two of the archaeological samples containing muscovite
(KAl2(AlSi3O10)(OH)2). These mineralogical divisions can be seen in Table 5.1.
Modern Clays
Both modern clays from Nisbet Bottoms were determined to be composed of
alpha-low quartz, kaolinite, and muscovite. The proportions of minerals within these
36
two clays differ (Table 5.2); the pipe and pan mix has a larger proportion of muscovite
and less quartz or kaolinite than the pan clay alone.
Old Town Clays
All of the clay from Old Town contained alpha-low quartz, and all but one,
sample OC6, contained a kaolin group clay mineral. All samples contained a feldspar-
group mineral, with half of the samples containing the feldspar mineral albite. Two of
the three samples that did not contain albite (OC1 and OC2) did test positive for a
different type of feldspar. Sample OC6 contained only muscovite and quartz, and is the
only sample tested from the Old Town site that contained a mica mineral.
Ayres Town Clays
The samples from Ayres Town can be divided into two mineralogical trends that
are reflected in their color: red clays and blue clays. The data from the XRF seem to
suggest that these two clay categories are unrelated mineralogically.
Red Clays
The red clays, seen in Table 5.4, were found in Feature 3, 14, 19, and 72. These
samples only contained quartz and a kaolin-group clay mineral. There was no consistent
pattern when the kaolin group minerals were examined against each other, as one had
kaolinite and the other dickite. Samples AC4r and AC5r contained no detectable clay
minerals, only quartz. The other features contained only kaolinite or dickite, with no
37
Table 5.1- XRD data
Site
Sample Quartz Kaolin Group Albite Anorthite Alkali feldspar Muscovite
Nisbet Bottoms
NC-1 xxx xx --- --- --- x
NC-2 xx x --- --- --- xx
Old Town
OC1 x x --- --- xxx ---
OC2 x xxx --- x --- ---
OC3 x x xx --- xx ---
OC4 xx xxx x --- --- ---
OC5 xx x xx --- --- ---
OC6 xx --- x --- --- x
Ayres Town
AC1 x x xxx --- --- ---
AC2r xx xx --- --- --- ---
AC3 xx --- --- xx --- ---
AC4r xxx --- --- --- --- ---
AC5r xxx xx --- --- --- ---
AC6 xx --- --- --- --- ---
AC7r xx xxx --- --- --- ---
AC8 xx x --- --- --- xx
x= minor mineral component (<25%) xx=mineral component (25-75%) xxx=major mineral component (<75%)
38
overlap. These clays contained none of the mica or feldspar minerals that were present
in some form or arrangement in almost all of the other clay samples.
Blue Clays
The four blue clays from Ayres Town do not show any easily discernable trends.
All contained quartz; sample AC6 contained only quartz and tested positive for no other
minerals. Two of the samples contained kaolinite; dickite and nacrite were not present
in the Ayres Town sample sub-set. Sample AC8, from Feature 74, contained muscovite.
The clay sample AC8 was the only sample of all of the archaeological samples tested
that had a mineralogical match to the modern samples, though a match does not
immediately denote a similar source. Sample AC3 contained no kaolin group clay
minerals, only quartz and the feldspar anorthite. Sample AC1 contained quartz,
kaolinite and the feldspar albite. Due to the mineralogical differences between the
samples, it is unlikely that any of these clays were obtained from the same depositional
source.
39
Chapter 6
RESULTS OF XRF
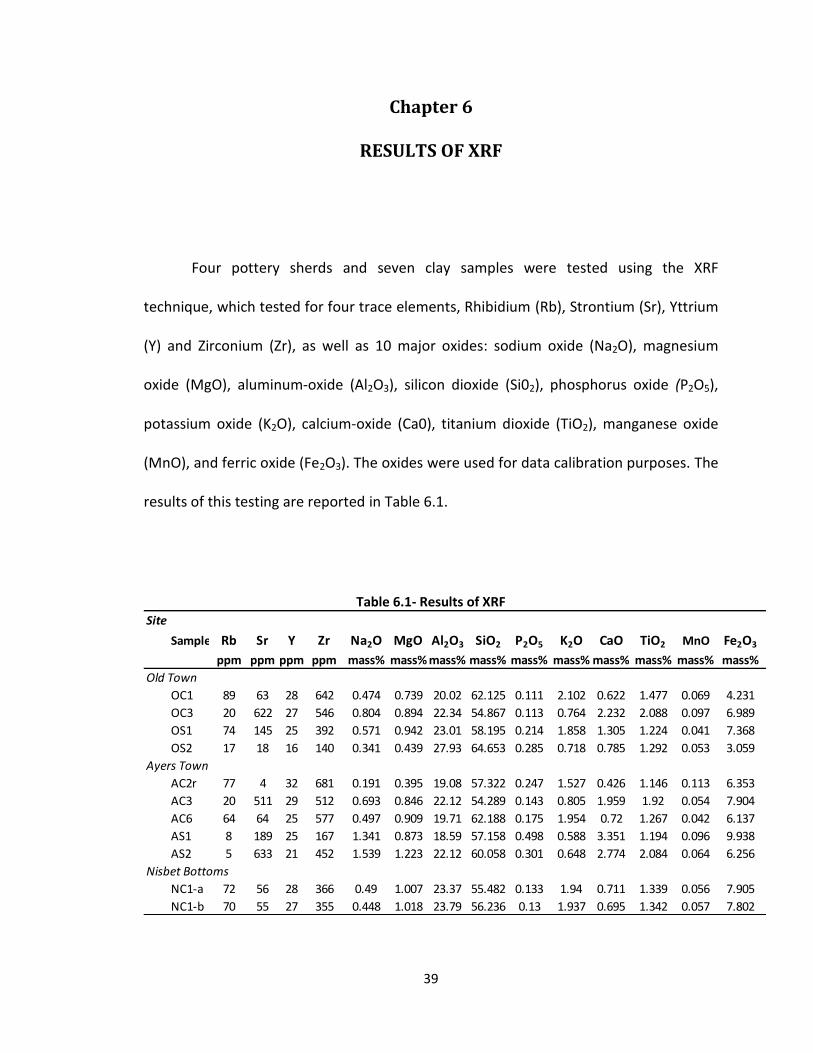
Four pottery sherds and seven clay samples were tested using the XRF
technique, which tested for four trace elements, Rhibidium (Rb), Strontium (Sr), Yttrium
(Y) and Zirconium (Zr), as well as 10 major oxides: sodium oxide (Na2O), magnesium
oxide (MgO), aluminum-oxide (Al2O3), silicon dioxide (Si02), phosphorus oxide (P2O5),
potassium oxide (K2O), calcium-oxide (Ca0), titanium dioxide (TiO2), manganese oxide
(MnO), and ferric oxide (Fe2O3). The oxides were used for data calibration purposes. The
results of this testing are reported in Table 6.1.
Table 6.1- Results of XRF
Site
Sample Rb Sr Y Zr Na2O MgO Al2O3 SiO2 P2O5 K2O CaO TiO2 MnO Fe2O3
ppm ppm ppm ppm mass% mass% mass% mass% mass% mass% mass% mass% mass% mass%
Old Town
OC1 89 63 28 642 0.474 0.739 20.02 62.125 0.111 2.102 0.622 1.477 0.069 4.231
OC3 20 622 27 546 0.804 0.894 22.34 54.867 0.113 0.764 2.232 2.088 0.097 6.989
OS1 74 145 25 392 0.571 0.942 23.01 58.195 0.214 1.858 1.305 1.224 0.041 7.368
OS2 17 18 16 140 0.341 0.439 27.93 64.653 0.285 0.718 0.785 1.292 0.053 3.059
Ayers Town
AC2r 77 4 32 681 0.191 0.395 19.08 57.322 0.247 1.527 0.426 1.146 0.113 6.353
AC3 20 511 29 512 0.693 0.846 22.12 54.289 0.143 0.805 1.959 1.92 0.054 7.904
AC6 64 64 25 577 0.497 0.909 19.71 62.188 0.175 1.954 0.72 1.267 0.042 6.137
AS1 8 189 25 167 1.341 0.873 18.59 57.158 0.498 0.588 3.351 1.194 0.096 9.938
AS2 5 633 21 452 1.539 1.223 22.12 60.058 0.301 0.648 2.774 2.084 0.064 6.256
Nisbet Bottoms
NC1-a 72 56 28 366 0.49 1.007 23.37 55.482 0.133 1.94 0.711 1.339 0.056 7.905
NC1-b 70 55 27 355 0.448 1.018 23.79 56.236 0.13 1.937 0.695 1.342 0.057 7.802
40
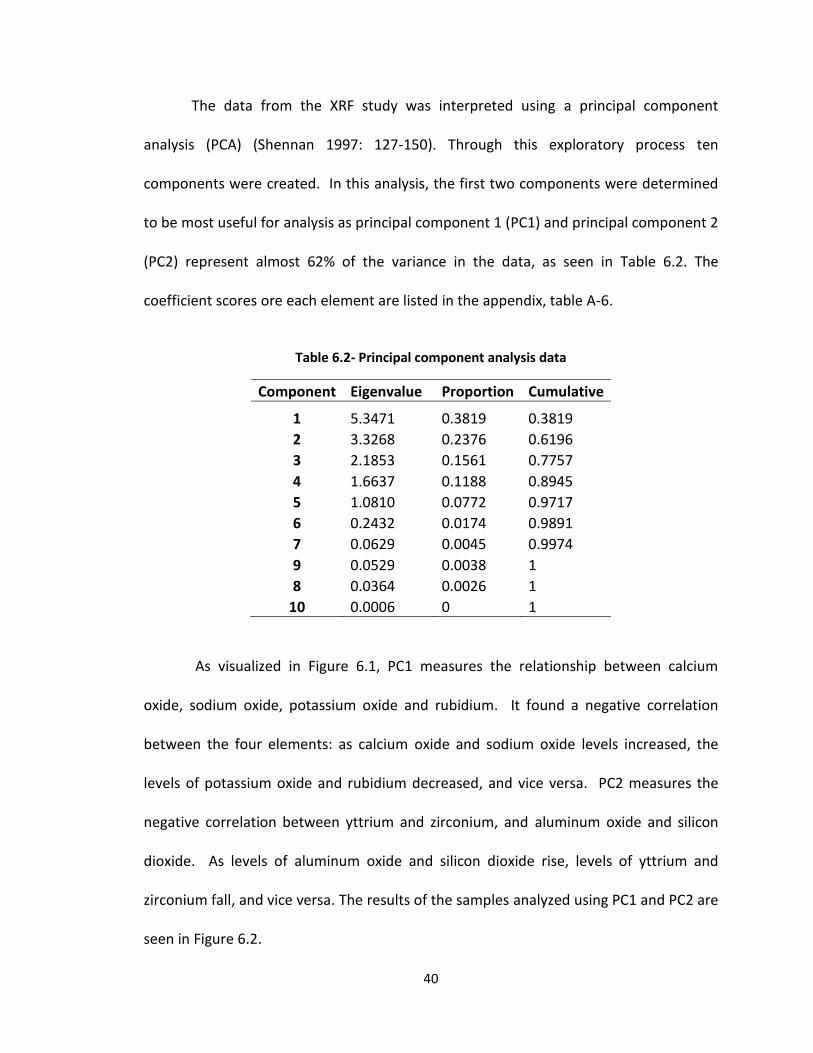
The data from the XRF study was interpreted using a principal component
analysis (PCA) (Shennan 1997: 127-150). Through this exploratory process ten
components were created. In this analysis, the first two components were determined
to be most useful for analysis as principal component 1 (PC1) and principal component 2
(PC2) represent almost 62% of the variance in the data, as seen in Table 6.2. The
coefficient scores ore each element are listed in the appendix, table A-6.
Table 6.2- Principal component analysis data
Component Eigenvalue Proportion Cumulative
1 5.3471 0.3819 0.3819
2 3.3268 0.2376 0.6196
3 2.1853 0.1561 0.7757
4 1.6637 0.1188 0.8945
5 1.0810 0.0772 0.9717
6 0.2432 0.0174 0.9891
7 0.0629 0.0045 0.9974
9 0.0529 0.0038 1
8 0.0364 0.0026 1
10 0.0006 0 1
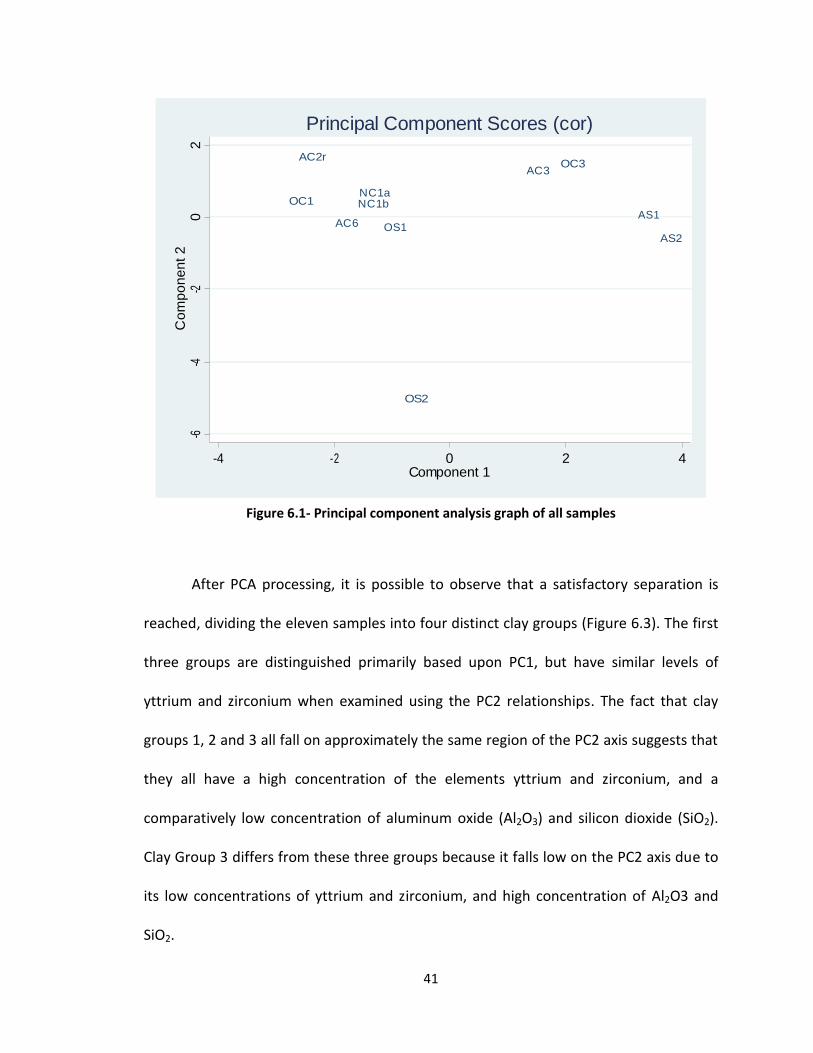
As visualized in Figure 6.1, PC1 measures the relationship between calcium
oxide, sodium oxide, potassium oxide and rubidium. It found a negative correlation
between the four elements: as calcium oxide and sodium oxide levels increased, the
levels of potassium oxide and rubidium decreased, and vice versa. PC2 measures the
negative correlation between yttrium and zirconium, and aluminum oxide and silicon
dioxide. As levels of aluminum oxide and silicon dioxide rise, levels of yttrium and
zirconium fall, and vice versa. The results of the samples analyzed using PC1 and PC2 are
seen in Figure 6.2.
41
Figure 6.1- Principal component analysis graph of all samples
After PCA processing, it is possible to observe that a satisfactory separation is
reached, dividing the eleven samples into four distinct clay groups (Figure 6.3). The first
three groups are distinguished primarily based upon PC1, but have similar levels of
yttrium and zirconium when examined using the PC2 relationships. The fact that clay
groups 1, 2 and 3 all fall on approximately the same region of the PC2 axis suggests that
they all have a high concentration of the elements yttrium and zirconium, and a
comparatively low concentration of aluminum oxide (Al2O3) and silicon dioxide (SiO2).
Clay Group 3 differs from these three groups because it falls low on the PC2 axis due to
its low concentrations of yttrium and zirconium, and high concentration of Al2O3 and
SiO2.
OC1
OC3
OS1
OS2
AC2r
AC3
AC6AS1
AS2
NC1aNC1b
-6-4
-20
2C
om
po
ne
nt
2
-4 -2 0 2 4Component 1
Principal Component Scores (cor)
42
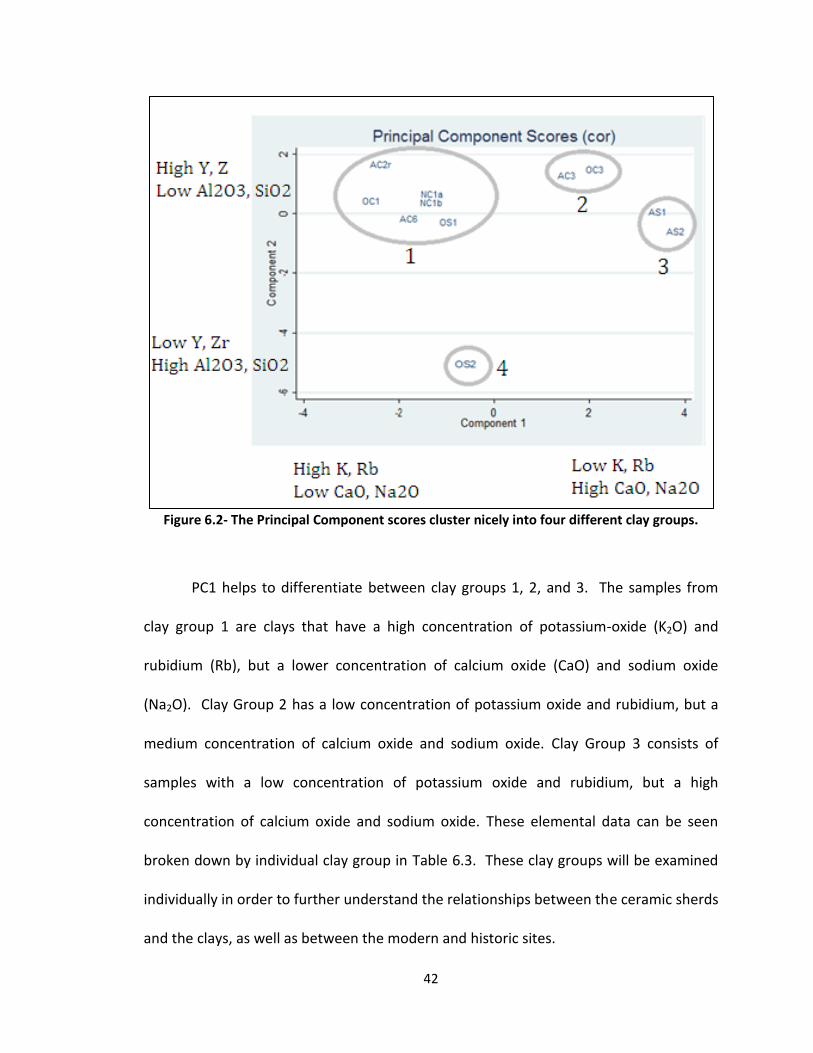
Figure 6.2- The Principal Component scores cluster nicely into four different clay groups.
PC1 helps to differentiate between clay groups 1, 2, and 3. The samples from
clay group 1 are clays that have a high concentration of potassium-oxide (K2O) and
rubidium (Rb), but a lower concentration of calcium oxide (CaO) and sodium oxide
(Na2O). Clay Group 2 has a low concentration of potassium oxide and rubidium, but a
medium concentration of calcium oxide and sodium oxide. Clay Group 3 consists of
samples with a low concentration of potassium oxide and rubidium, but a high
concentration of calcium oxide and sodium oxide. These elemental data can be seen
broken down by individual clay group in Table 6.3. These clay groups will be examined
individually in order to further understand the relationships between the ceramic sherds
and the clays, as well as between the modern and historic sites.
43
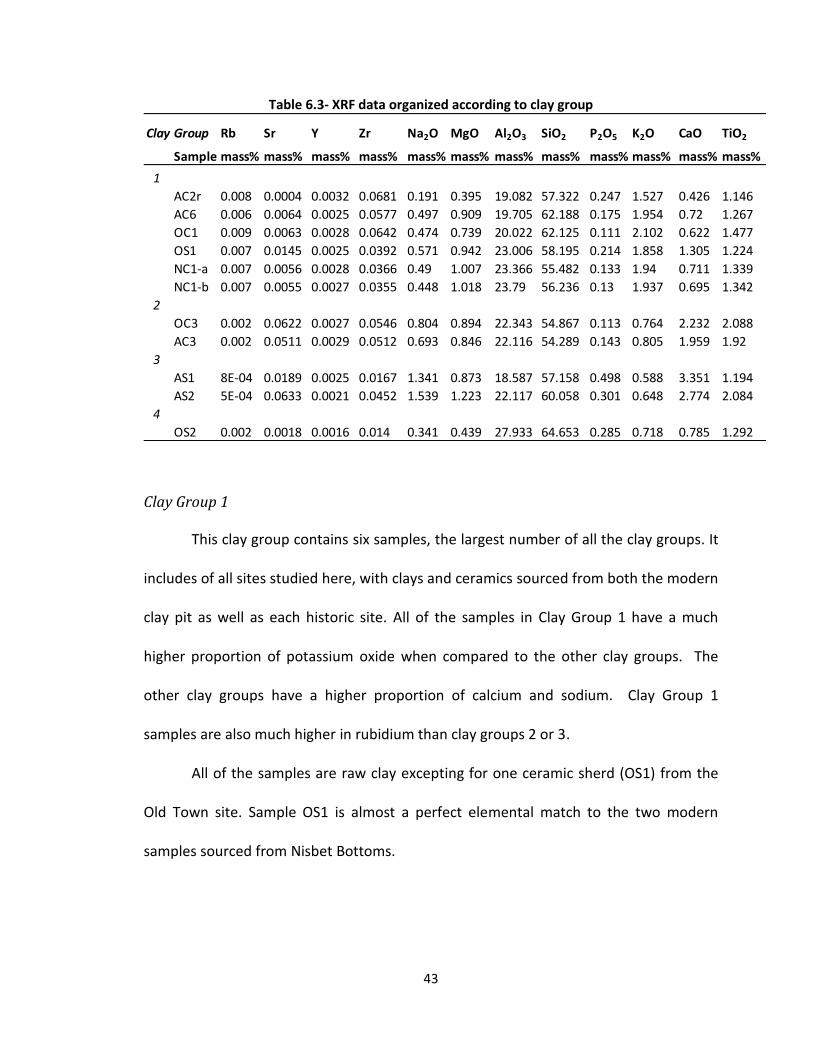
Table 6.3- XRF data organized according to clay group
Clay Group 1
This clay group contains six samples, the largest number of all the clay groups. It
includes of all sites studied here, with clays and ceramics sourced from both the modern
clay pit as well as each historic site. All of the samples in Clay Group 1 have a much
higher proportion of potassium oxide when compared to the other clay groups. The
other clay groups have a higher proportion of calcium and sodium. Clay Group 1
samples are also much higher in rubidium than clay groups 2 or 3.
All of the samples are raw clay excepting for one ceramic sherd (OS1) from the
Old Town site. Sample OS1 is almost a perfect elemental match to the two modern
samples sourced from Nisbet Bottoms.
Clay Group Rb Sr Y Zr Na2O MgO Al2O3 SiO2 P2O5 K2O CaO TiO2
Sample mass% mass% mass% mass% mass% mass% mass% mass% mass% mass% mass% mass%
1
AC2r 0.008 0.0004 0.0032 0.0681 0.191 0.395 19.082 57.322 0.247 1.527 0.426 1.146
AC6 0.006 0.0064 0.0025 0.0577 0.497 0.909 19.705 62.188 0.175 1.954 0.72 1.267
OC1 0.009 0.0063 0.0028 0.0642 0.474 0.739 20.022 62.125 0.111 2.102 0.622 1.477
OS1 0.007 0.0145 0.0025 0.0392 0.571 0.942 23.006 58.195 0.214 1.858 1.305 1.224
NC1-a 0.007 0.0056 0.0028 0.0366 0.49 1.007 23.366 55.482 0.133 1.94 0.711 1.339
NC1-b 0.007 0.0055 0.0027 0.0355 0.448 1.018 23.79 56.236 0.13 1.937 0.695 1.342
2
OC3 0.002 0.0622 0.0027 0.0546 0.804 0.894 22.343 54.867 0.113 0.764 2.232 2.088
AC3 0.002 0.0511 0.0029 0.0512 0.693 0.846 22.116 54.289 0.143 0.805 1.959 1.92
3
AS1 8E-04 0.0189 0.0025 0.0167 1.341 0.873 18.587 57.158 0.498 0.588 3.351 1.194
AS2 5E-04 0.0633 0.0021 0.0452 1.539 1.223 22.117 60.058 0.301 0.648 2.774 2.084
4
OS2 0.002 0.0018 0.0016 0.014 0.341 0.439 27.933 64.653 0.285 0.718 0.785 1.292
44
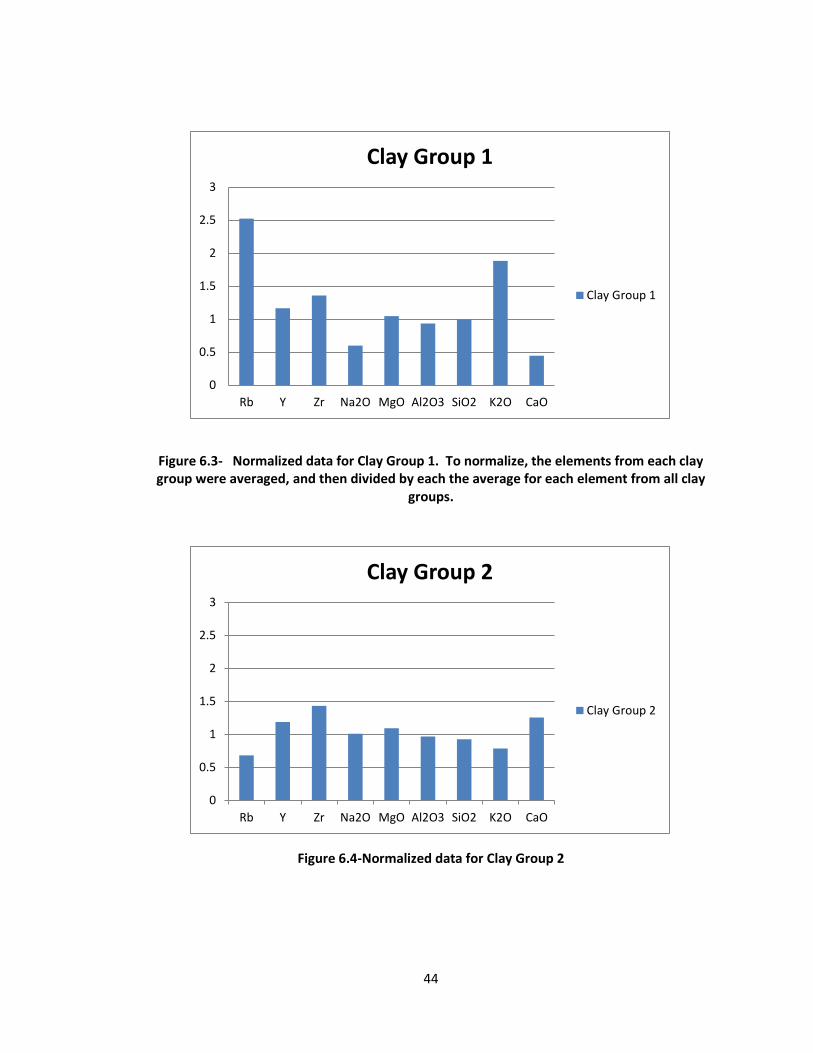
Figure 6.3- Normalized data for Clay Group 1. To normalize, the elements from each clay group were averaged, and then divided by each the average for each element from all clay
groups.
Figure 6.4-Normalized data for Clay Group 2
0
0.5
1
1.5
2
2.5
3
Rb Y Zr Na2O MgO Al2O3 SiO2 K2O CaO
Clay Group 1
Clay Group 1
0
0.5
1
1.5
2
2.5
3
Rb Y Zr Na2O MgO Al2O3 SiO2 K2O CaO
Clay Group 2
Clay Group 2
45
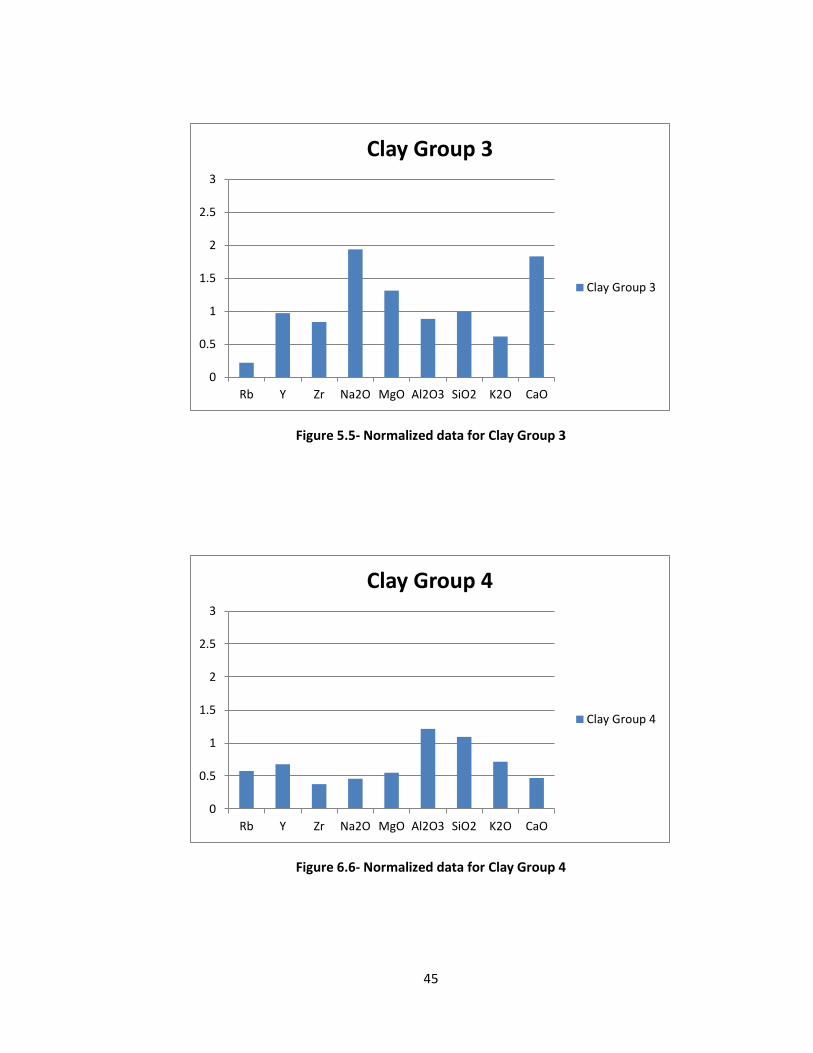
Figure 5.5- Normalized data for Clay Group 3
Figure 6.6- Normalized data for Clay Group 4
0
0.5
1
1.5
2
2.5
3
Rb Y Zr Na2O MgO Al2O3 SiO2 K2O CaO
Clay Group 3
Clay Group 3
0
0.5
1
1.5
2
2.5
3
Rb Y Zr Na2O MgO Al2O3 SiO2 K2O CaO
Clay Group 4
Clay Group 4
46
When considering the three archaeological clay samples, the greatest
discrepancy from the modern clay is seen in the amount of zirconium present. As well as
one sherd from Old Town, one sample of clay, sample OC1, lies within Clay Group 1.
Also present is a blue/gray clay sample from Ayres Town. The one sample of red clay
from the Ayres Town site (AC2r) that was tested using XRF is part of this sample subset.
The raw modern clay is also found within this clay group. Two samples from the
modern pan clay were tested, and were found to have extremely similar, though not
perfectly identical, elemental compositions to each other. These samples have an
elemental composition that is extremely similar to the elemental composition of Old
Town ceramic sample OS1.
Clay Group 2
This subset of samples consists of one clay sample from Old Town and one clay
sample from Ayres Town. Elementally they are almost identical, with the only noticeable
discrepancy between the two samples being a small amount of zirconium. The similarity
in elemental composition indicates that the clay used to produce these two samples is
from a shared depositional source, which is interesting because they are from two
different historic sites.
47
Clay Group 3
This group is made up of both of the ceramic sherds that were tested from the
Ayres Town site. Interestingly, no clay from the Ayres Town site that was tested for this
study had a similar composition, although this may be because of the small sample size,
or because no buff ware pottery sherds were tested. The elemental composition of
these sherds is not as identical as the other clay groups, due to a noticeable difference
in zirconium content. Because all other elemental and oxide percentages are
overlapping, especially in comparison to the other samples, it is likely that these
samples were sourced from a shared depositional source.
Clay Group 4
This group contains only one sample, a pottery sherd from Old Town (OS2). It is
elementally different from the other groups because it has a low yttrium and zirconium
content, and a high aluminum oxide and silicon dioxide content when compared to the
other samples. It does fall along the same axis as Clay Group 1 when examined only
using PC1; the high content of potassium oxide and rubidium and lack of calcium- or
sodium-oxide is very similar to the samples found in this group.
From this study it is unclear why this sherd is so different from the other ten
samples. Though no temper was observed, the addition of sand to the pottery clay may
have caused this discrepancy. This clay group also could be the result of clay composed
from a geologically different area than the other samples. Unfortunately, without
testing more Old Town samples, this clay group cannot be further explored.
48
Chapter 7
CONCLUSIONS
While a larger sample size might have shown more distinctive trends, the
mineral and elemental data from the 14 samples suggests that all the clays and ceramic
samples were probably not obtained from one shared communal source. The XRF and
XRD results can be seen side by side in Figures 7.1 and 7.2 on page 48. Although there is
bound to be a lack of homogeneity in any sized clay pit, I suspect that data would have
shown a more uniform trend if all samples came from one unique shared depositional
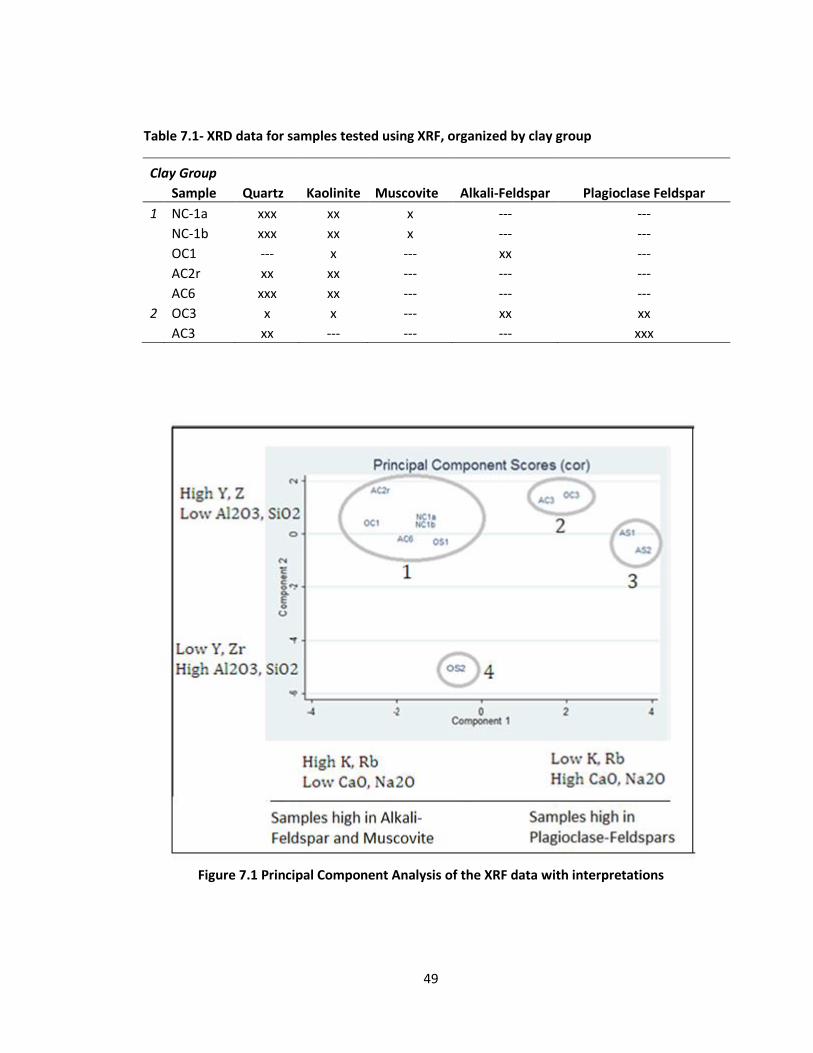
source. The principal component analysis identified four distinct clay types, these types
probably represent four distinct clay deposition sources, but it does not imply that each
clay group was sourced from the exact same locale.
The XRF data clarifies that it is possible that the potters in Ayres Town utilized
the same kinds of pottery clays, possibly from the same localities, as the Old Town
potters. This is unclear when analyzing the XRD data because the clays from each area
contain the same overall minerals, as is to be expected considered the geological
consistency of the region. The idea that the potters from both sites may have used clays
from the same deposition source is clarified by looking at the principal component
analysis of the elemental data. Of the four distinct clay groups distinguished using XRF
data, two clay groups (1 and 2), are composed of samples from both sites.
49
Table 7.1- XRD data for samples tested using XRF, organized by clay group
Clay Group
Sample Quartz Kaolinite Muscovite Alkali-Feldspar Plagioclase Feldspar
1 NC-1a xxx xx x --- ---
NC-1b xxx xx x --- ---
OC1 --- x --- xx ---
AC2r xx xx --- --- ---
AC6 xxx xx --- --- ---
2 OC3 x x --- xx xx
AC3 xx --- --- --- xxx
Figure 7.1 Principal Component Analysis of the XRF data with interpretations
50
In light of the XRF data, samples studied using only XRD methods can be
tentatively placed into the clay groups discovered using PCA. Group two is composed of
sample AC3 which contains the mineral anorthite, and sample OC3, which contains
albite. Due to the large component of albite in some of the Old Town clays, as well as
the high levels of sodium that distinguishes the Clay Group 2 samples, I believe that the
samples OC4, OC5, and OC6 could have been from a shared depositional source. In
addition to these examples, sample AC1 may also be from the same locality because of
its high albite component and because of the fact that Clay Group 2 has a high level of
calcium oxide that distinguishes it from the other groups.
Albite and anorthite are feldspar minerals that are part of a larger group of
minerals, called plagioclase feldspars; these are distinguished from the other feldspars
because they contain the elements sodium or calcium. Another group of feldspars are
the alkali feldspars, which contain potassium. Muscovite is also potassium rich. Using
the knowledge that Clay Group 2 is distinguished by its high sodium oxide and calcium
oxide content, and that Clay Group 1 is distinguished by its high potassium oxide
content, it is probable that the clay groups discovered using PC1 of the XRF data are
orienting themselves along the lines of feldspar composition and the presence of mica.
This idea can be reinforced by examining the XRD data. The mineralogical data of only
the samples tested using XRF is shown in Table 7.2.
PC1 found a negative correlation between potassium/rubidium and
calcium/sodium oxide. This division is represented by the mineralogical data: some
samples from Clay Group 1 contain alkali-feldspar or muscovite (which are both
51
potassium-rich minerals), whereas the clays from group two contain albite or anorthite,
minerals rich in either calcium or sodium. This mineralogical trend reaffirms both the
statistical analysis, as well as the suspicion that the albite-rich clays from Old Town that
were not tested using XRF probably originate from the source of Clay Group 2.
Clay Group 1 contains the one sample of red clay, sample AC2r. It also contains
sample AC6, which was found to contain only quartz. Why these samples are in this
group is a mystery. According to the mineralogical data, these clay samples have only
quartz and kaolinite, and do not contain a potassium-rich mineral that is distinctive of
this group, probably due to XRD detection limits.
When used in relation to the mineralogical data, the gray and tan colors of the
clays do not fall into any easy discernable patterns. When the color of the clays is
examined using the clay groups established from the XRF data, an obvious trend
appears. All of the samples in Clay Group 1 are tan, with the exception of one red clay
sample. Both of the clays in Clay Group 2 are gray. Assuming that samples OC4, OC5,
and OC6 also belong in Clay Group 2 due to their mineral composition, this trend is
continued, as all of these clays are gray as well. Therefore, using this data, one can
assume that the tanner clays are more potassium rich and possibly from the same
source as Clay Group 1, and the grayer clays are more calcium or sodium rich, and
probably are from Clay Group 2.
Although trends in the data can be established, there are also differences in the
mineralogical and elemental data between some of the samples of the two historic
sites. This is apparent in the elemental evidence that shows that both of the sherds from
52
Ayres Town have a different composition than either of the Old Town sherds. It is also
apparent in the fact that clay groups one and two contain samples from both Old Town
and Ayres Town. I suspect this is evidence of clay acquisition procedures alluded to in
the ethnography. The method described by Fewkes is the practice of each potter
obtaining their clay from a pit that may run out or become filled with water. Because of
this, the locations of these pits are concealed and highly guarded. Therefore, the
mineral and elemental differences seen in the samples of each site indicate that the
potters were using clays from different depositional sources. The fact that the XFD and
XRF data suggest that all of these clays were sourced locally implies that the dissimilarity
in mineral and elemental composition is probably representative of variation in the
methods of deposition and the materials from which each differing clay-pit weathered.
This project was carried out with two main questions to be answered. The first
issue questioned the relationship between the raw clays and fired ceramics found in the
archaeological record. Unfortunately, this query cannot be answered definitively using
the data gathered for this study, but it can be explored in part by investigating the data
provided by the XRF. Of the four fired ceramic samples tested, only one, sample OS1,
fell into a clay group that contained other clays. This group contained the modern clays,
as well as two clay samples from Old Town and one from Ayres Town. This correlation
implies that this ceramic sample was indeed made from the clays found
archaeologically.
The other three ceramic samples examined do not correspond with any of the
clay samples tested using XRF. The Ayres Town ceramic samples compose a group of
53
their own, as does the Old Town sherd that constitutes Clay Group 4. Possibly with
further testing this issue may come to rest, but as of now it can be said that at least
some of the clays found in the archaeological record were being used to make the
ceramics that they are found with. Due to the similarity in color and the frequency with
which this clay is found, it can be assumed that the blue gray clay found in Catawba
archaeological sites was probably being utilized to make pottery, but this cannot be
confirmed using the data from this project alone.
The other major goal of this study was to examine the lifespan of the current
clay pits at Nisbet Bottoms being exploited by modern Catawba potters. The modern
clay sources are in the same territory inhabited by the historical Catawba, and it is
possible that the same clay sources could have been used throughout time. The XRF
results from this study show that it is possible that the historic Catawba were using the
same clay pit that the modern Catawba use today. This is seen by examining Clay Group
1, which contains both the modern clay samples as well as samples from both historic
sites. Due to the close correlation of both the modern and historic clays in Clay Group 1;
it is reasonable to assume that they are all coming from one shared depositional source.
It is known that the clays at Nisbet Bottom are Catawba River alluvial deposits,
and therefore it can be inferred that the other samples in Clay Group 1 are also clays
deposited by the Catawba River. What cannot be confidently determined is that the
other Clay Group 1 samples were sourced specifically from the Nisbet Bottoms property.
It can be determined that Clay Group 1 samples are from alluvial deposits of the
54
Catawba River, and the likelihood that they are from the Nisbet Bottoms cannot be
ruled out.
Limitations
Due to the time constraints of an extended analysis of multiple samples, the
sample size for this project was much smaller than is to be desired for any statistical
study. In order for a representative study to be conducted a sample size at least three
times larger than was used here would be satisfactory. I hope that in the future this
study can be repeated using an adequate sample size. This may help to confirm or deny
outliers such as Clay Group 3, or I suspect could possibly create a link between clay
groups two and three.
Catawba potters today, and in ethnographic description, use two different types
of clay, a pipe clay and a pan clay, when constructing vessels. An unadulterated sample
of pipe clay could not be obtained for this study due to the winter-season timing of this
project. Modern Catawba potters dig for the clay they use to build vessels during the
warmer months; therefore, a sample of pipe clay was not available for testing.
Summary
It has been determined from the information provided by a principal component
analysis of the XRF data that there were at least three different clay depositional
sources are represented in this study that were utilized by the Catawba for the
acquisition of clay. These clays from different sources differed in both elemental and
55
mineralogical composition. The most obvious difference was a separation of clay groups
based on feldspar minerals and muscovite. Group one was composed of alkali-feldspars
and muscovite and therefore has a high potassium oxide content; clay groups two and
three were composed of plagioclase feldspars and contain calcium oxide or sodium
oxide elements. It may be possible to distinguish clays from each source by eye, clays
that are from Clay Group 1 are generally a more tan color, whereas clays from Clay
Group 2 tend to be darker gray or bluish in color.
The elemental comparison of both sherds and clays could not establish a
definitive relationship between the two materials. The data from this project hints that
the clays found in archaeological deposits are the clays that were used to make pottery,
but it cannot confirm without question that each clay sample was used in a vessel body.
The data can link at least one ceramic sherd to a clay source from which we also have
archaeological and modern clay samples.
Using the established clay groups, it can be determined that potters at Old Town
and potters at Ayres Town were using at least one overlapping clay source. This is seen
in Clay Group 1, which has two clay samples from Ayres town and one clay and one
ceramic sample from Old Town. The fact that there was a shared clay source may be
useful for those looking at the relationship between the two populations.
Lastly, from this project it can be determined that the Catawba potters of today
are using a depositional clay source that was utilized by their Revolutionary War period
ancestors to make ceramic vessels. This determination is verified through the elemental
similarity of the samples in clay group 1, especially the fact that both historical clays and

56
ceramic samples are found within this clay group. This finding strengthens the Catawba
Nation’s claim to the clays that lie under the soil of Nisbet Bottom, SC.
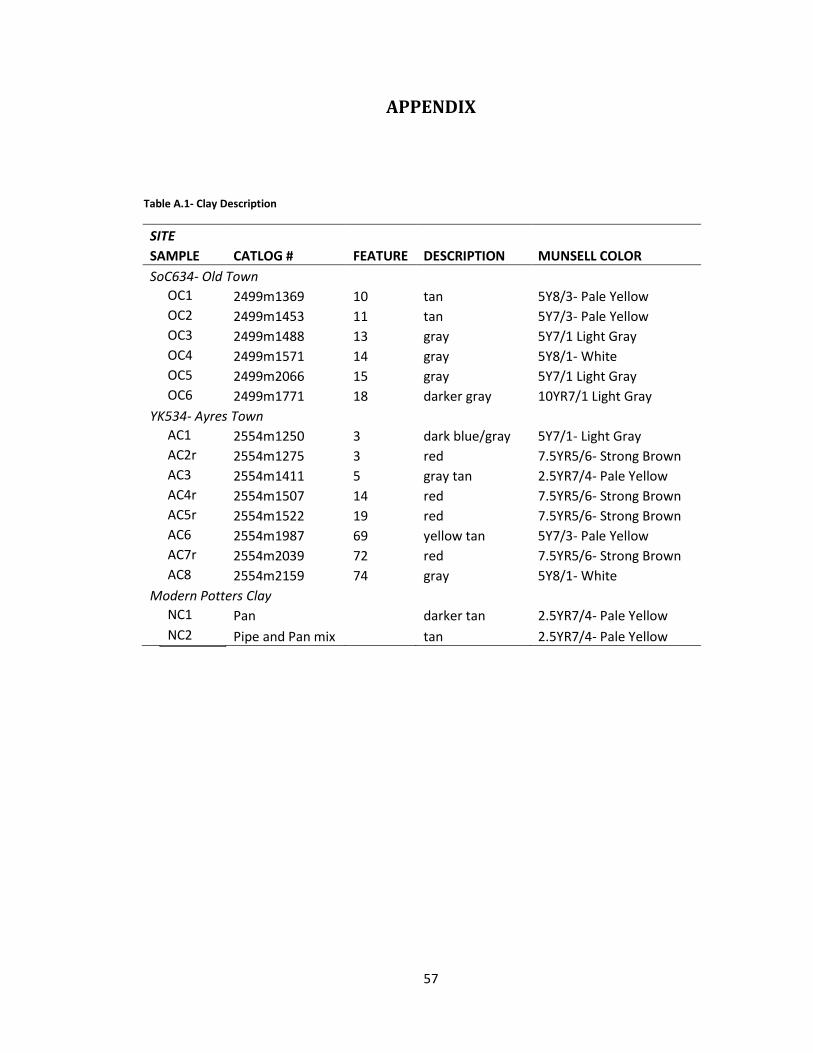
57
APPENDIX
Table A.1- Clay Description
SITE
SAMPLE CATLOG # FEATURE DESCRIPTION MUNSELL COLOR
SoC634- Old Town
OC1 2499m1369 10 tan 5Y8/3- Pale Yellow
OC2 2499m1453 11 tan 5Y7/3- Pale Yellow
OC3 2499m1488 13 gray 5Y7/1 Light Gray
OC4 2499m1571 14 gray 5Y8/1- White
OC5 2499m2066 15 gray 5Y7/1 Light Gray
OC6 2499m1771 18 darker gray 10YR7/1 Light Gray
YK534- Ayres Town
AC1 2554m1250 3 dark blue/gray 5Y7/1- Light Gray
AC2r 2554m1275 3 red 7.5YR5/6- Strong Brown
AC3 2554m1411 5 gray tan 2.5YR7/4- Pale Yellow
AC4r 2554m1507 14 red 7.5YR5/6- Strong Brown
AC5r 2554m1522 19 red 7.5YR5/6- Strong Brown
AC6 2554m1987 69 yellow tan 5Y7/3- Pale Yellow
AC7r 2554m2039 72 red 7.5YR5/6- Strong Brown
AC8 2554m2159 74 gray 5Y8/1- White
Modern Potters Clay
NC1 Pan
darker tan 2.5YR7/4- Pale Yellow
NC2 Pipe and Pan mix tan 2.5YR7/4- Pale Yellow
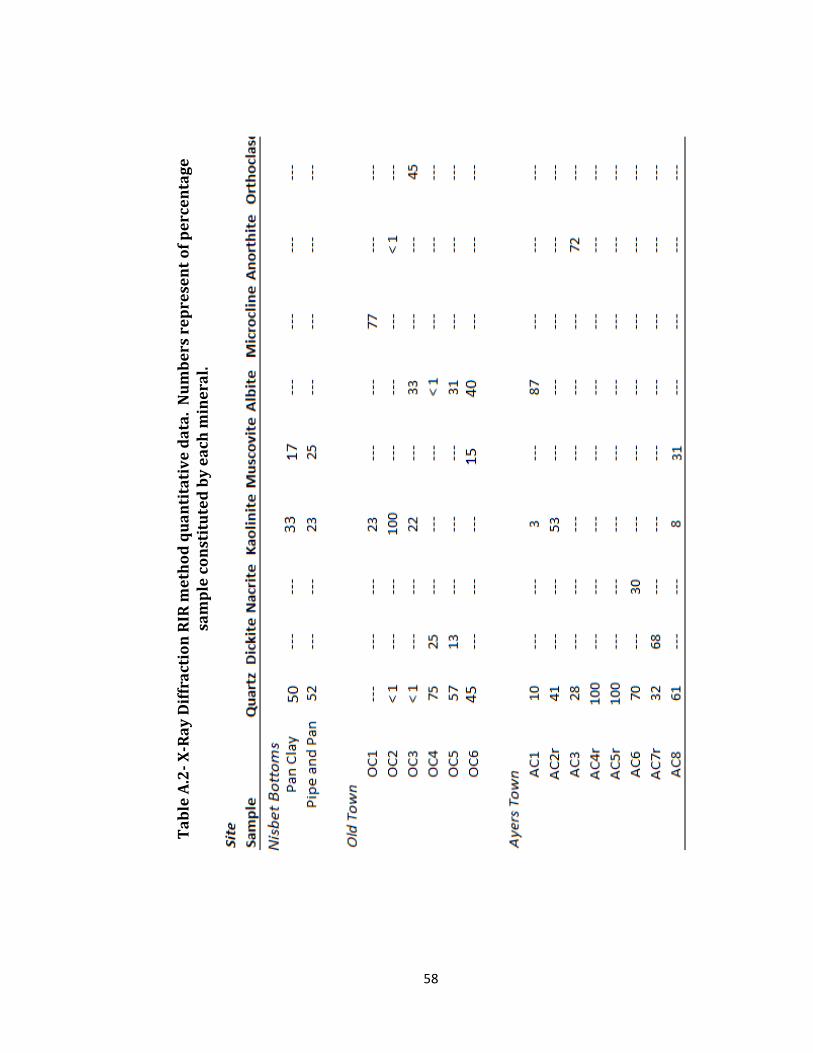
58
Ta
ble
A.2
- X
-Ra
y D
iffr
act
ion
RIR
me
tho
d q
ua
nti
tati
ve
da
ta.
Nu
mb
ers
re
pre
sen
t o
f p
erc
en
tag
e
sam
ple
co
nst
itu
ted
by
ea
ch m
ine
ral.
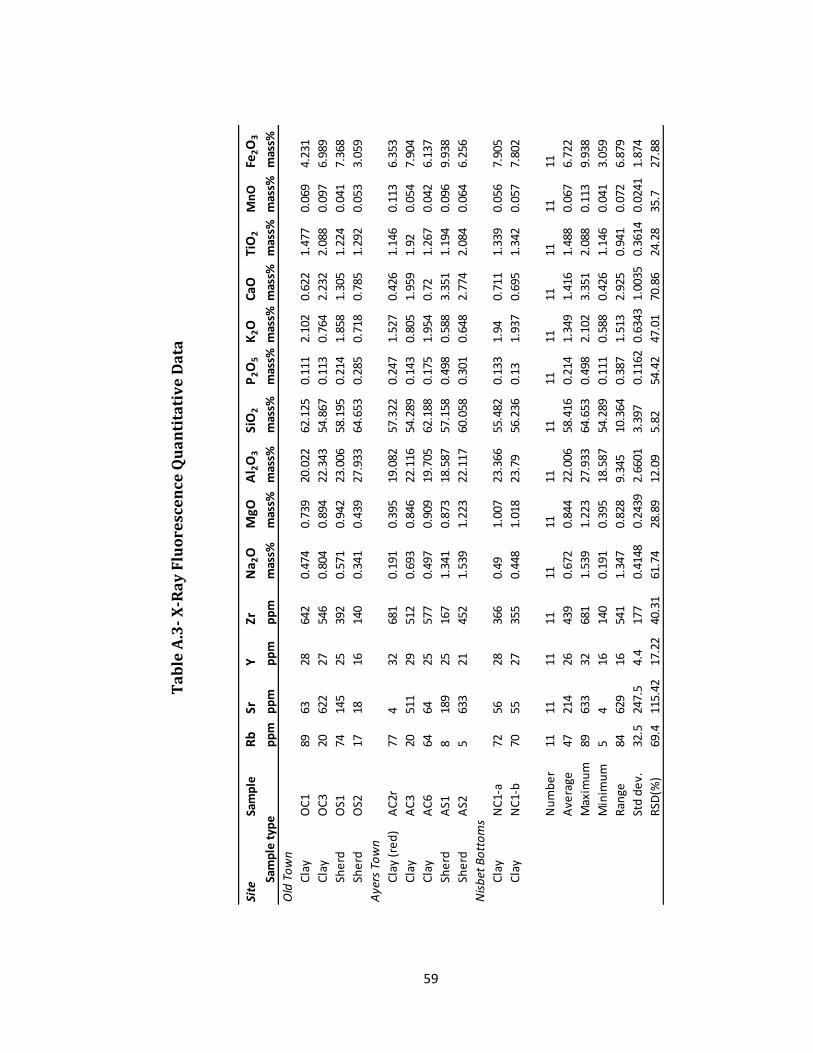
59
Site
Sam
ple
Rb
SrY
ZrN
a 2O
MgO
Al 2
O3
SiO
2P
2O
5K
2O
CaO
TiO
2M
nO
Fe2O
3
Sam
ple
typ
ep
pm
pp
mp
pm
pp
mm
ass%
mas
s%m
ass%
mas
s%m
ass%
mas
s%m
ass%
mas
s%m
ass%
mas
s%
Old
To
wn
Cla
yO
C1
8963
2864
20.
474
0.73
920
.022
62.1
250.
111
2.10
20.
622
1.47
70.
069
4.23
1
Cla
yO
C3
2062
227
546
0.80
40.
894
22.3
4354
.867
0.11
30.
764
2.23
22.
088
0.09
76.
989
She
rdO
S174
145
2539
20.
571
0.94
223
.006
58.1
950.
214
1.85
81.
305
1.22
40.
041
7.36
8
She
rdO
S217
1816
140
0.34
10.
439
27.9
3364
.653
0.28
50.
718
0.78
51.
292
0.05
33.
059
Aye
rs T
ow
n
Cla
y (r
ed
)A
C2r
774
3268
10.
191
0.39
519
.082
57.3
220.
247
1.52
70.
426
1.14
60.
113
6.35
3
Cla
yA
C3
2051
129
512
0.69
30.
846
22.1
1654
.289
0.14
30.
805
1.95
91.
920.
054
7.90
4
Cla
yA
C6
6464
2557
70.
497
0.90
919
.705
62.1
880.
175
1.95
40.
721.
267
0.04
26.
137
She
rdA
S18
189
2516
71.
341
0.87
318
.587
57.1
580.
498
0.58
83.
351
1.19
40.
096
9.93
8
She
rdA
S25
633
2145
21.
539
1.22
322
.117
60.0
580.
301
0.64
82.
774
2.08
40.
064
6.25
6
Nis
bet
Bo
tto
ms
Cla
yN
C1-
a72
5628
366
0.49
1.00
723
.366
55.4
820.
133
1.94
0.71
11.
339
0.05
67.
905
Cla
yN
C1-
b70
5527
355
0.44
81.
018
23.7
956
.236
0.13
1.93
70.
695
1.34
20.
057
7.80
2
Nu
mb
er
1111
1111
1111
1111
1111
1111
1111
Ave
rage
4721
426
439
0.67
20.
844
22.0
0658
.416
0.21
41.
349
1.41
61.
488
0.06
76.
722
Max
imu
m89
633
3268
11.
539
1.22
327
.933
64.6
530.
498
2.10
23.
351
2.08
80.
113
9.93
8
Min
imu
m5
416
140
0.19
10.
395
18.5
8754
.289
0.11
10.
588
0.42
61.
146
0.04
13.
059
Ran
ge84
629
1654
11.
347
0.82
89.
345
10.3
640.
387
1.51
32.
925
0.94
10.
072
6.87
9
Std
de
v.32
.524
7.5
4.4
177
0.41
480.
2439
2.66
013.
397
0.11
620.
6343
1.00
350.
3614
0.02
411.
874
RSD
(%)
69.4
115.
4217
.22
40.3
161
.74
28.8
912
.09
5.82
54.4
247
.01
70.8
624
.28
35.7
27.8
8
Ta
ble
A.3
- X
-Ra
y F
luo
resc
en
ce Q
ua
nti
tati
ve
Da
ta
T
ab
le A
.4-
X R
ay
Flu
ore
sce
nce
in
ten
sity
da
ta
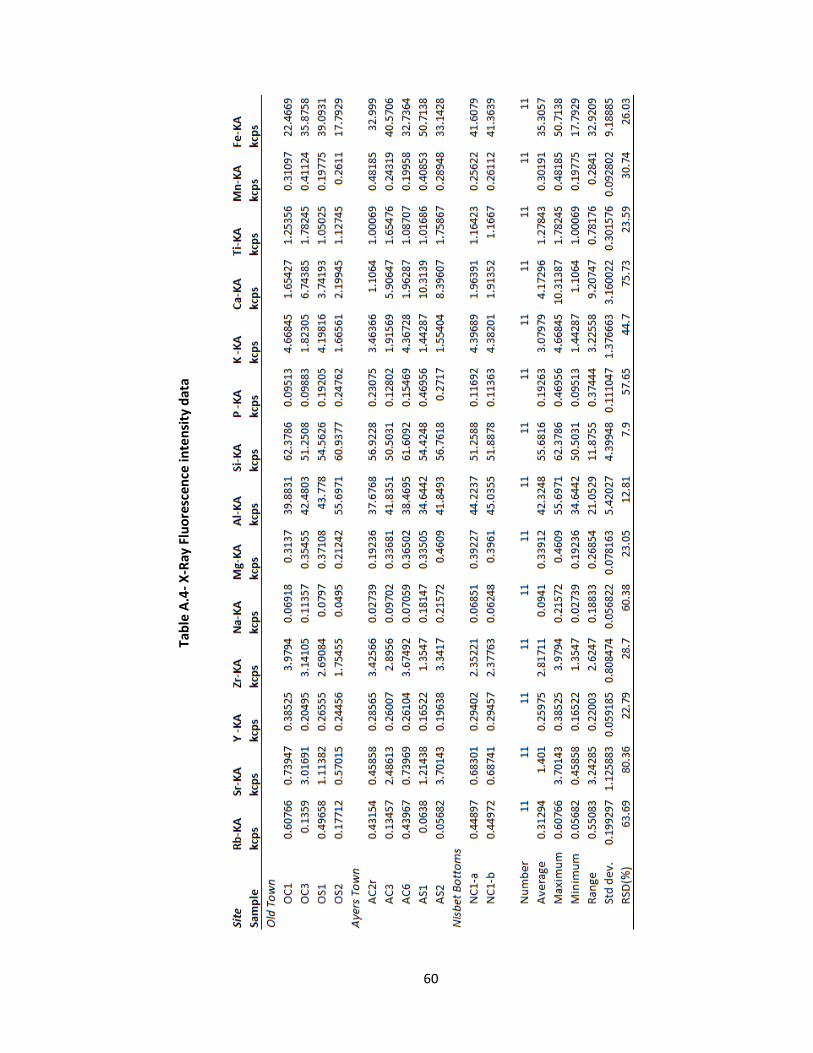
60
Tab
le A
.4-
X-R
ay F
luo
resc
ence
inte
nsi
ty d
ata
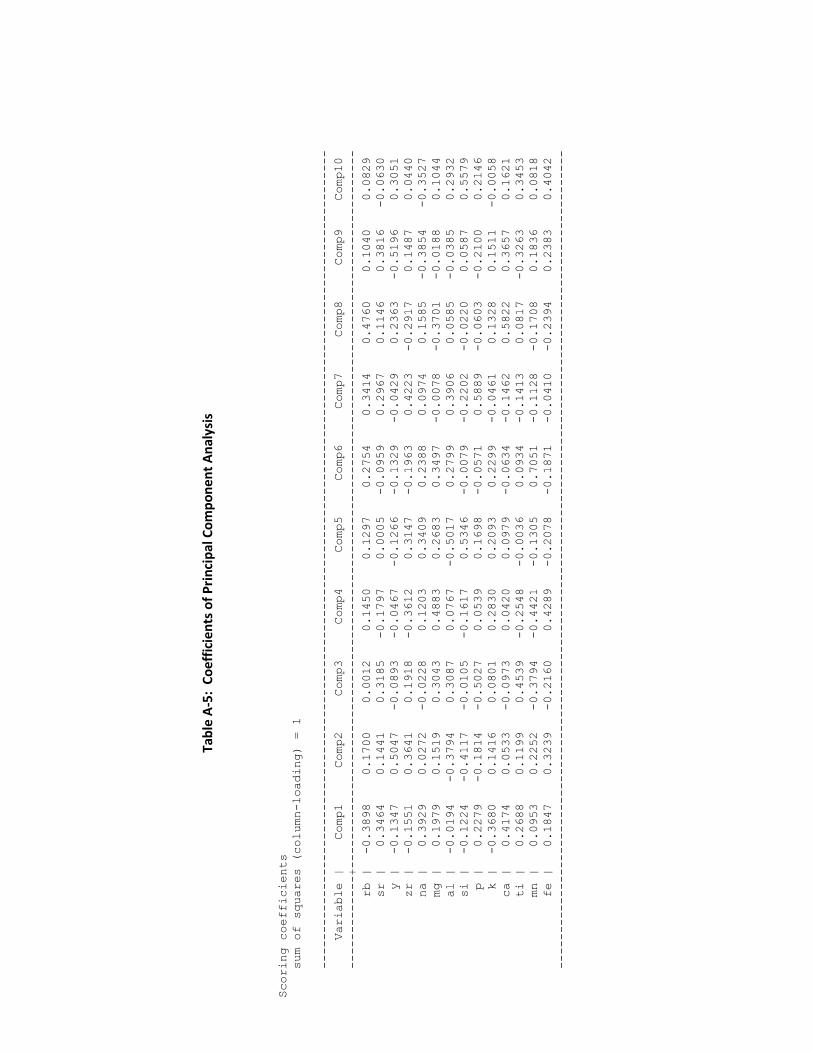
61
Scoring coefficients
sum of squares (column-loading) = 1
------------------------------------------------------------------------------------------------------------------
Variable | Comp1 Comp2 Comp3 Comp4 Comp5 Comp6 Comp7 Comp8 Comp9 Comp10
-------------+----------------------------------------------------------------------------------------------------
rb | -0.3898 0.1700 0.0012 0.1450 0.1297 0.2754 0.3414 0.4760 0.1040 0.0829
sr | 0.3464 0.1441 0.3185 -0.1797 0.0005 -0.0959 0.2967 0.1146 0.3816 -0.0630
y | -0.1347 0.5047 -0.0893 -0.0467 -0.1266 -0.1329 -0.0429 0.2363 -0.5196 0.3051
zr | -0.1551 0.3641 0.1918 -0.3612 0.3147 -0.1963 0.4223 -0.2917 0.1487 0.0440
na | 0.3929 0.0272 -0.0228 0.1203 0.3409 0.2388 0.0974 0.1585 -0.3854 -0.3527
mg | 0.1979 0.1519 0.3043 0.4883 0.2683 0.3497 -0.0078 -0.3701 -0.0188 0.1044
al | -0.0194 -0.3794 0.3087 0.0767 -0.5017 0.2799 0.3906 0.0585 -0.0385 0.2932
si | -0.1224 -0.4117 -0.0105 -0.1617 0.5346 -0.0079 -0.2202 -0.0220 0.0587 0.5579
p | 0.2279 -0.1814 -0.5027 0.0539 0.1698 -0.0571 0.5889 -0.0603 -0.2100 0.2146
k | -0.3680 0.1416 0.0801 0.2830 0.2093 0.2299 -0.0461 0.1328 0.1511 -0.0058
ca | 0.4174 0.0533 -0.0973 0.0420 0.0979 -0.0634 -0.1462 0.5822 0.3657 0.1621
ti | 0.2688 0.1199 0.4539 -0.2548 -0.0036 0.0934 -0.1413 0.0817 -0.3263 0.3453
mn | 0.0953 0.2252 -0.3794 -0.4421 -0.1305 0.7051 -0.1128 -0.1708 0.1836 0.0818
fe | 0.1847 0.3239 -0.2160 0.4289 -0.2078 -0.1871 -0.0410 -0.2394 0.2383 0.4042
------------------------------------------------------------------------------------------------------------------
Tab
le A
-5:
Co
eff
icie
nts
of
Pri
nci
pal
Co
mp
on
en
t A
nal
ysis
62
WORKS CITED
Brown, Douglas S.
1966 The Catawba Indians: The People of the River. Columbia, SC: The
University of South Carolina.
Blumer, Thomas J.
2000 Nisbet Bottoms: A Catawba Indian Treasure Trove. http://www.catawba-
people.com/nisbet_bottoms.pdf (accessed March 30, 2011).
Blumer, Thomas John.
2004. Catawba Indian Pottery. Tuscaloosa: The University of Alabama Press.
Bruker AXS, Inc.
2006 Introduction to X-Ray Florescence (XRF).
http://www.brukeraxs.de/fileadmin/user_upload/xrfintro/index.html
(accessed February 26, 2011).
Catawba-Wateree Basin Map from USGS.
Catawba Riverkeeper. http://www.catawbariverkeeper.org/about-the-
catawba/CatawbaWatereemapNCandSCfromUSGS.gif/view (accessed April 27,
2011).
Davis, Stephen, and Brett H. Riggs
2004 "An Introduction to the Catawba Project." North Carolina Archaeology 53.
63
Dutrow, Barbra L., and Christine M. Clark.
2011 X-ray Powder Diffraction (XRD). Science Education and Resource Center at
Carleton College. http://serc.carleton.edu/18400 (accessed February 27, 2011).
Fewkes, Vladimir J.
1944 Catawba Pottery-Making, With Notes on Pamunkey Pottery-Making,
Cherokee Pottery-Making, and Coiling. Proceedings of the American
Philosophical Society.
Harrington, M. R.
1908 Catawba Potters and Their Work. American Anthropologist N.S. 10(3):399-
407.
Herbert, Joseph M., Theresa E. McReynolds
2008 Woodland Pottery Sourcing in the Carolina Sandhills. Research Report No.
29, Research Laboratories of Archaeology, University of North Carolina, Chapel
Hill.
Langston, Hightower.
2003 The Native American World. Hoboken, NJ: John Wiley & Sons.
Merrell, James H.
1989a The Catawbas. United States of America: Chelsea House Publishers.
Merrell, James H.
1989b The Indians’ New World. Chapel Hill, NC: University of North Carolina
Press.
64
Nesse, William D.
2000 Introduction to Mineralogy. New York: Oxford University Press.
North Carolina State University.
2006 Catawba River Basin. http://www.water.ncsu.edu/catawba.html (accessed
April 17, 2011).
Page, Jake.
2003 In the Hands of the Great Spirit: The 20,000 Year History of American
Indians. New York, NY: Free Press.
Perdue, Theda, and Michael D. Green.
2001 The Columbia Guide to American Indians of the Southeast. New York:
Columbia University Pres.
Riggs, Brett H., R.P. Steven Davis, Jr., and Mark R. Plane.
2006 Catawba Pottery in the Post-Revolutionary Era: A View from the Source.
North Carolina Archaeology 55: 60-88.
Rogers, J. J. W.
1999 History and Environment of North Carolina’s Piedmont: Evolution of a
Value-Added Society. Electronic Document,
http://rocks.geosci.unc.edu/files/faculty/emeritus%20faculty/rogers/piedmont_
hist_env.pdf (accessed March 17, 2011).
Shennan, Stephen.
1997 Quantifying Archaeology. Iowa City, University of Iowa Press.

65
University of South Carolina Lancaster.
Tradition and the Individual Talent: Georgia Harris and Catawba Indian Pottery.
http://usclancaster.sc.edu/nas/GeorgiaHarrisExhibit/index.htm (accessed
February 26, 2011).