Embed Size (px)
Citation preview
REVISED DRAFT: 19 May 2013
1
Geoarchaeological and bioarchaeological studies at Mira,
an early Upper Paleolithic site in the Lower Dnepr Valley, Ukraine
John F. Hoffeckera*
, Vance T. Hollidayb, Vadim N. Stepanchuk
c, Alexis Brugère
d, Steven L.
Formane, Paul Goldberg
f, Oleg Tubolzev
g, and Igor Pisarev
h
aInstitute of Arctic and Alpine Research, University of Colorado at Boulder, 1560 30
th Street,
Boulder, Colorado 80309-0450 USA bDepartments of Anthropology and Geosciences, University of Arizona, PO Box 210030,
Tucson, Arizona 85721-0030 USA cStone Age Department, Institute of Archaeology, Ukrainian Academy of Sciences, Heroes of
Stalingrad Avenue 12, Kiev 04210, Ukraine dMaison de l’Archéologie et de l’Ethnologie, CNRS UMR 7041 “Archéologies environmentales”
21 allée de l’Université. 92023 Nanterre Cedex - France eLuminescence Dating Research Laboratory, Department of Earth and Environmental Sciences,
University of Illinois, Chicago, Illinois 80607-7059 USA fDepartment of Archaeology, Boston University, Boston, Massachusetts 02215 USA
gNovaya Arkheologicheskaya Shkola, Pr. Metallurov 22/2, Zaporozhye 69006 Ukraine
h38, 2a Gagarin Street, Zaporozhye 69057 Ukraine
Abstract
New geoarchaeological and bioarcheological research was undertaken at the open-air site of
Mira, which is buried in deposits of the Second Terrace (~30 meters) of the Dnepr River, roughly
15 km downstream from the city of Zaporozhiye in Ukraine. Previous excavation of the site
revealed two occupation layers dating to ~32,000 cal BP. The lower layer (II/2) yielded
bladelets similar to those of the early Gravettian, while the upper layer (I) contained traces of a
small artificial shelter and hundreds of bones and teeth of horse (Equus latipes). Mira represents
the only firmly dated early Upper Paleolithic (EUP) site in the Dnepr Basin, and occupies a
unique topographic setting for the EUP near the center of the broad floodplain of the Dnepr
River. The site was visited during a period of floodplain stability, characterized by overbank
deposition and weak soil formation under cool climate conditions. Mira was used as a long-term
camp, but also was the locus of large-mammal carcass-processing associated with a nearby kill
of a group of horses (Layer I).
*Corresponding author: Institute of Arctic and Alpine Research, University of Colorado at
Boulder, 1560 30th Street, Boulder, Colorado 80309-0450 USA. Tel.: 303-735-780; Fax: 303-
492-6388.
E-mail: [email protected]

REVISED DRAFT: 19 May 2013
2
1. Introduction
Modern humans moved into Europe before 40,000 years ago and possibly as early as 50,000
years ago (Richter et al., 2008; Higham et al., 2011). The archaeological remains that they
deposited between the time of their arrival and roughly 30,000 cal BP may be classified as “early
Upper Paleolithic” (or EUP), including a set of assemblages that are sometimes labeled “Initial
Upper Paleolithic” (Cohen and Stepanchuk, 1999; Kozlowski, 2007; Hoffecker, 2009, 2011).
Both the genetics of living humans and the EUP archaeological record indicate that modern
humans may have entered Europe in the form of two or more population movements or
migrations that originated in Western Asia. At least one of these migrations was directly from
the latter into Eastern Europe via the Caucasus Mountains before 40,000 cal BP (Ahmarian), and
represents a plausible source for the “early Gravettian” industry that is represented at several
sites on the East European Plain that antedate 30,000 cal BP (Prat et al., 2011; Hoffecker, 2012).
The dispersal and settlement of modern humans in Europe must be understood within the
context of their archaeological record, and it is essential to recognize that the EUP archaeological
record of the East European Plain differs from that of Western Europe, especially the Franco-
Cantabrian region. On the central plain of Eastern Europe, natural shelters are almost entirely
absent. As a consequence, Paleolithic sites are more difficult to find, because their location is
less likely to coincide with an identifiable feature of the modern landscape. The overall sample
of sites on the central East European Plain is small in comparison to Franco-Cantabria
(especially in relation to total area). The sample of EUP sites is particularly small (compared
with later Upper Paleolithic sites) and appears to reflect a common pattern of deep burial. Most
EUP occupation levels on the central plain are buried at least several meters below the ground
surface. The richness of the sites, which yield elaborate burials and evidence of large-mammal
mass kills, suggest that low archaeological visibility, not low human population density,
accounts for the small sample.
The lack of natural shelters on the central plain (and their comparatively limited use in
the southwest plain) also influences the archaeological record with respect to site function or
type. For the most part, the natural shelters of the Franco-Cantabrian region yield habitation
sites, and their function is reflected in their contents (e.g., artifacts associated with variety of
activities, ornamentation and visual art, diverse and heavily processed faunal remains). The
central plain of Eastern Europe does not exhibit this bias towards habitation sites for the EUP
and—paradoxically, given the comparatively small sample—offers a wider spectrum of site
types and functions. The sites include examples of kill-butchery events (in the form of large-
mammal bone beds), carcass-processing areas, and other traces of short-term occupation. In
many respects, the EUP record on the central plain resembles the archaeological record of the
North American Plains, where such sites are common (for some periods, in fact, kill sites and
short-term camps dominate the record [e.g., Holliday and Mandel, 2006]).
The discovery and investigation of the Mira site in the Lower Dnepr Valley of south-
central Ukraine added a new dimension to the EUP of Eastern Europe. Mira remains the only
firmly dated EUP site (i.e., Upper Paleolithic site older than 30,000 cal BP) in the Dnepr Basin,
and it fills a major void with respect to EUP geographic distribution (Stepanchuk et al., 2009).
Much of the raw material used for artifacts was imported hundreds of kilometers from the
eastern slope of the Carpathian Mountains, suggesting a link with the southwest plain
(Stepanchuk, 2005, p. 28). Its geomorphic context—buried 10 meters below the surface of the
Second Terrace under a mass of fluvial and eolian deposits—probably indicates why EUP sites
are so scarce in the region. Mira was situated near the center of the wide Dnepr River floodplain,
REVISED DRAFT: 19 May 2013
3
which is a unique topographic setting for the EUP. Nevertheless, the site reveals a familiar
pattern of artifacts and faunal remains for EUP sites on the central plain, including evidence for
the butchering of a large group of horses associated with a long-term encampment in Layer I
(and rare evidence for an artificial shelter in the EUP). It also documents the presence of the
early Gravettian (in Layer II/2), which now appears to be an East European counter-part to the
classic Aurignacian of Western Europe.
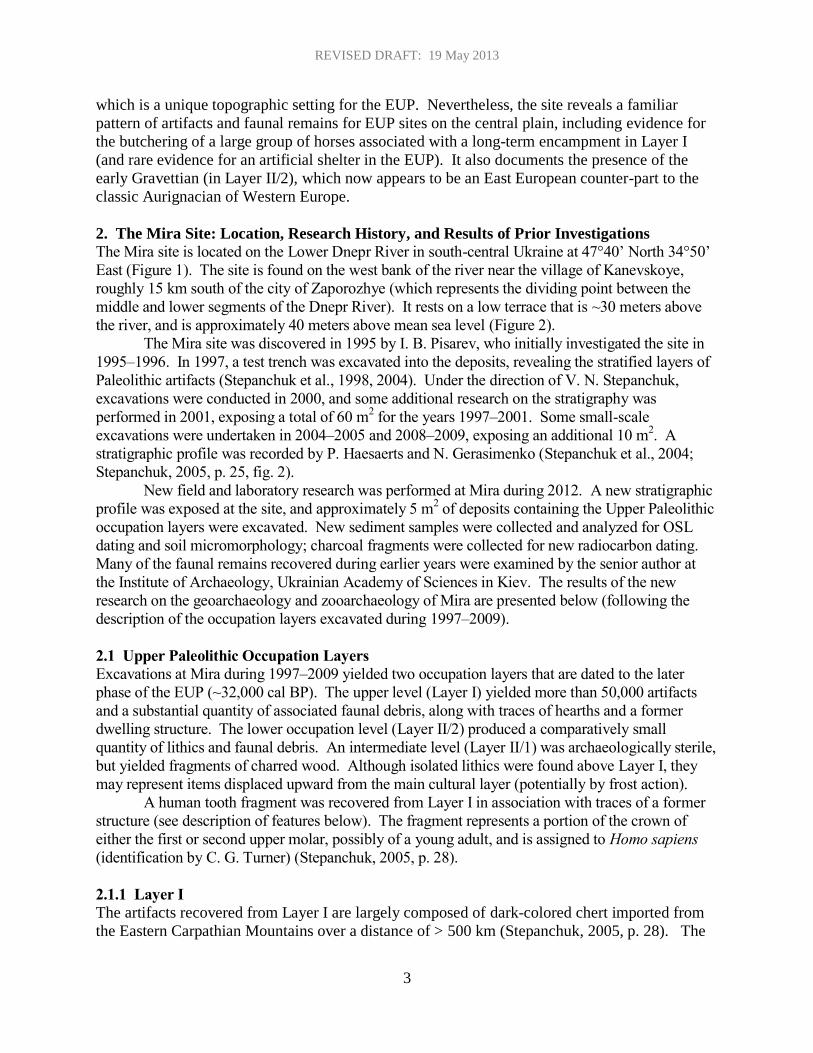
2. The Mira Site: Location, Research History, and Results of Prior Investigations
The Mira site is located on the Lower Dnepr River in south-central Ukraine at 47°40’ North 34°50’
East (Figure 1). The site is found on the west bank of the river near the village of Kanevskoye,
roughly 15 km south of the city of Zaporozhye (which represents the dividing point between the
middle and lower segments of the Dnepr River). It rests on a low terrace that is ~30 meters above
the river, and is approximately 40 meters above mean sea level (Figure 2).
The Mira site was discovered in 1995 by I. B. Pisarev, who initially investigated the site in
1995–1996. In 1997, a test trench was excavated into the deposits, revealing the stratified layers of
Paleolithic artifacts (Stepanchuk et al., 1998, 2004). Under the direction of V. N. Stepanchuk,
excavations were conducted in 2000, and some additional research on the stratigraphy was
performed in 2001, exposing a total of 60 m2 for the years 1997–2001. Some small-scale
excavations were undertaken in 2004–2005 and 2008–2009, exposing an additional 10 m2. A
stratigraphic profile was recorded by P. Haesaerts and N. Gerasimenko (Stepanchuk et al., 2004;
Stepanchuk, 2005, p. 25, fig. 2).
New field and laboratory research was performed at Mira during 2012. A new stratigraphic
profile was exposed at the site, and approximately 5 m2 of deposits containing the Upper Paleolithic
occupation layers were excavated. New sediment samples were collected and analyzed for OSL
dating and soil micromorphology; charcoal fragments were collected for new radiocarbon dating.
Many of the faunal remains recovered during earlier years were examined by the senior author at
the Institute of Archaeology, Ukrainian Academy of Sciences in Kiev. The results of the new
research on the geoarchaeology and zooarchaeology of Mira are presented below (following the
description of the occupation layers excavated during 1997–2009).
2.1 Upper Paleolithic Occupation Layers
Excavations at Mira during 1997–2009 yielded two occupation layers that are dated to the later
phase of the EUP (~32,000 cal BP). The upper level (Layer I) yielded more than 50,000 artifacts
and a substantial quantity of associated faunal debris, along with traces of hearths and a former
dwelling structure. The lower occupation level (Layer II/2) produced a comparatively small
quantity of lithics and faunal debris. An intermediate level (Layer II/1) was archaeologically sterile,
but yielded fragments of charred wood. Although isolated lithics were found above Layer I, they
may represent items displaced upward from the main cultural layer (potentially by frost action).
A human tooth fragment was recovered from Layer I in association with traces of a former
structure (see description of features below). The fragment represents a portion of the crown of
either the first or second upper molar, possibly of a young adult, and is assigned to Homo sapiens
(identification by C. G. Turner) (Stepanchuk, 2005, p. 28).
2.1.1 Layer I
The artifacts recovered from Layer I are largely composed of dark-colored chert imported from
the Eastern Carpathian Mountains over a distance of > 500 km (Stepanchuk, 2005, p. 28). The
REVISED DRAFT: 19 May 2013
4
lithic assemblage comprises almost 53,000 items (mostly small flakes or “chips”). Only 2 cores
(and 5 chert fragments) are reported; 94% of the unretouched blanks are flakes (n = 579), but
some blades and bladelets also are present (Stepanchuk, 2005, pp. 29–30).
The most common retouched tools (1.4%) include non-geometric microliths (n = 138),
end-scrapers (n = 36), scaled pieces (n = 20), points (n = 18), side-scrapers (n = 17), points (n =
18), Dufour bladelets (n = 15), combination tools (n = 15), and Mousterian points (n = 13). The
side-scrapers include simple, double, canted, convergent, and double convergent forms. The
Dufour bladelets are characterized as “atypical” (Stepanchuk, 2005, p. 34). Also common are
retouched flakes (n = 81), retouched bladelets (n = 50), and retouched blades (n = 45). There are
>400 “atypical bladelets,” which include twisted and curved forms. Less common items include
borers (n = 8), micro-points (n = 7), and burins (n = 5). Among bifacial implements are bifaces
(complete = 4), leaf-shaped points (including tip fragments), and others (Stepanchuk, 2005, 30–
36). The combined presence of Middle and Upper Paleolithic technology and tool types is not
uncommon in the later EUP of the East European Plain, especially among assemblages assigned
to the Gorodtsovan Culture (e.g., Rogachev and Anikovich, 1984, pp. 183–186).
Among the non-stone artifacts are two small point tips (awls?), one of which is of antler
(?), a possible mid-section fragment of a needle (bone), roughly 40 retouchers (bone), 10
perforated carnivore teeth or ornaments, several fragments of amber, and several other items
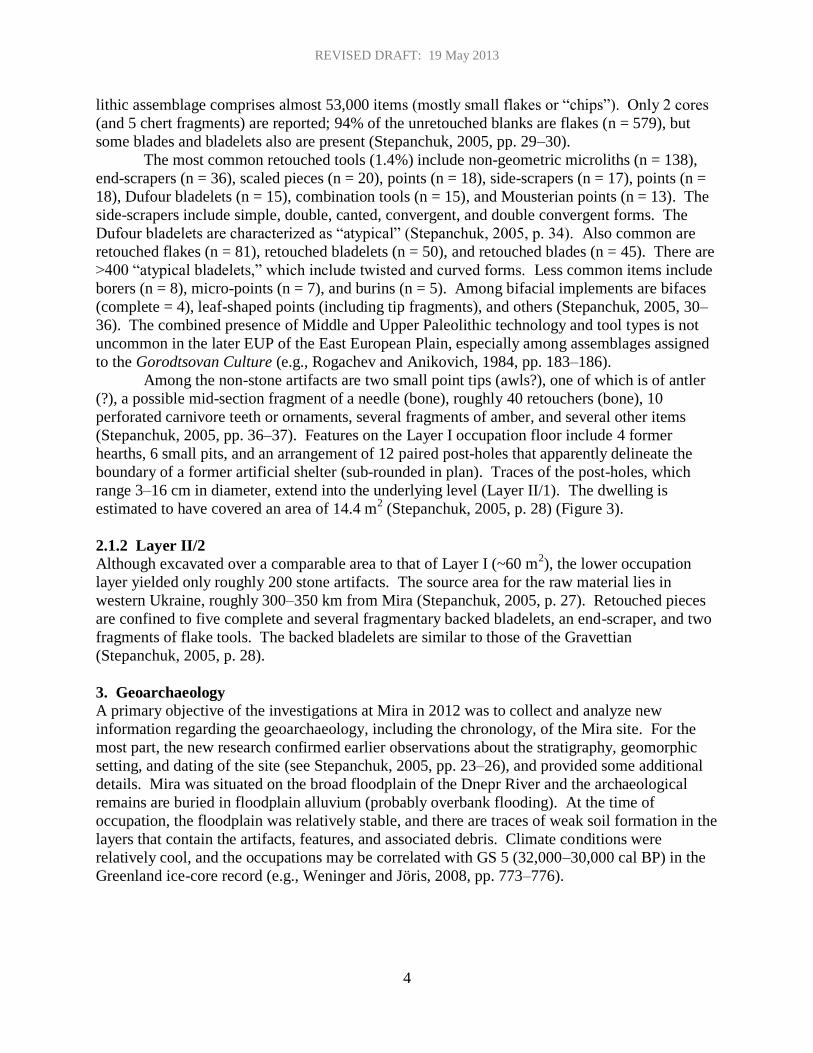
(Stepanchuk, 2005, pp. 36–37). Features on the Layer I occupation floor include 4 former
hearths, 6 small pits, and an arrangement of 12 paired post-holes that apparently delineate the
boundary of a former artificial shelter (sub-rounded in plan). Traces of the post-holes, which
range 3–16 cm in diameter, extend into the underlying level (Layer II/1). The dwelling is
estimated to have covered an area of 14.4 m2 (Stepanchuk, 2005, p. 28) (Figure 3).
2.1.2 Layer II/2
Although excavated over a comparable area to that of Layer I (~60 m2), the lower occupation
layer yielded only roughly 200 stone artifacts. The source area for the raw material lies in
western Ukraine, roughly 300–350 km from Mira (Stepanchuk, 2005, p. 27). Retouched pieces
are confined to five complete and several fragmentary backed bladelets, an end-scraper, and two
fragments of flake tools. The backed bladelets are similar to those of the Gravettian
(Stepanchuk, 2005, p. 28).
3. Geoarchaeology
A primary objective of the investigations at Mira in 2012 was to collect and analyze new
information regarding the geoarchaeology, including the chronology, of the Mira site. For the
most part, the new research confirmed earlier observations about the stratigraphy, geomorphic
setting, and dating of the site (see Stepanchuk, 2005, pp. 23–26), and provided some additional
details. Mira was situated on the broad floodplain of the Dnepr River and the archaeological
remains are buried in floodplain alluvium (probably overbank flooding). At the time of
occupation, the floodplain was relatively stable, and there are traces of weak soil formation in the
layers that contain the artifacts, features, and associated debris. Climate conditions were
relatively cool, and the occupations may be correlated with GS 5 (32,000–30,000 cal BP) in the
Greenland ice-core record (e.g., Weninger and Jöris, 2008, pp. 773–776).
REVISED DRAFT: 19 May 2013
5
3.1 Stratigraphy
The Mira site is buried in alluvium of the Second Terrace of the Dnepr River along the
uppermost segment of the Lower Dnepr Valley. At the location of the site (~15 km downstream
from Zaporozhye), the Second Terrace is ~30 meters above the river level, which is elevated by
~1 meter as a result of a downstream dam and reservoir. Although the Second Terrace was
assigned to the Middle Pleistocene by Goretskii (1970) and others, it is clear that the alluvial
facies accumulated during the Late Pleistocene (Matoshko et al. 2002, pp. 345–349). The
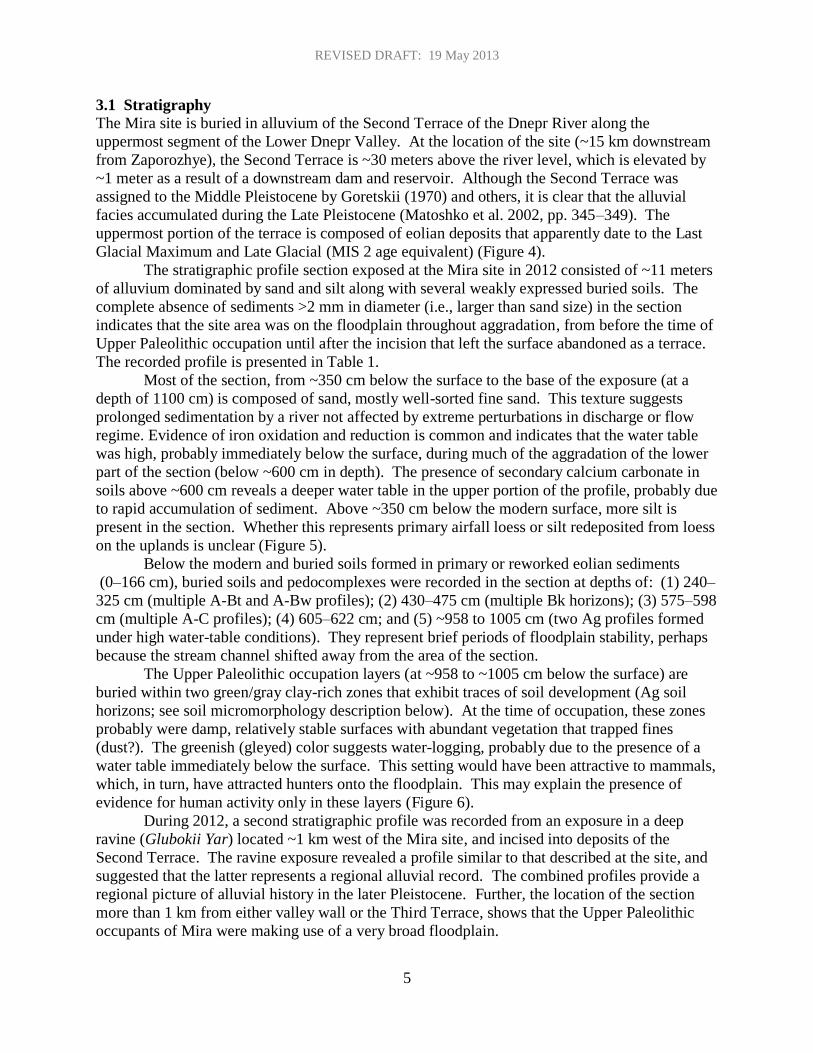
uppermost portion of the terrace is composed of eolian deposits that apparently date to the Last
Glacial Maximum and Late Glacial (MIS 2 age equivalent) (Figure 4).
The stratigraphic profile section exposed at the Mira site in 2012 consisted of ~11 meters
of alluvium dominated by sand and silt along with several weakly expressed buried soils. The
complete absence of sediments >2 mm in diameter (i.e., larger than sand size) in the section
indicates that the site area was on the floodplain throughout aggradation, from before the time of
Upper Paleolithic occupation until after the incision that left the surface abandoned as a terrace.
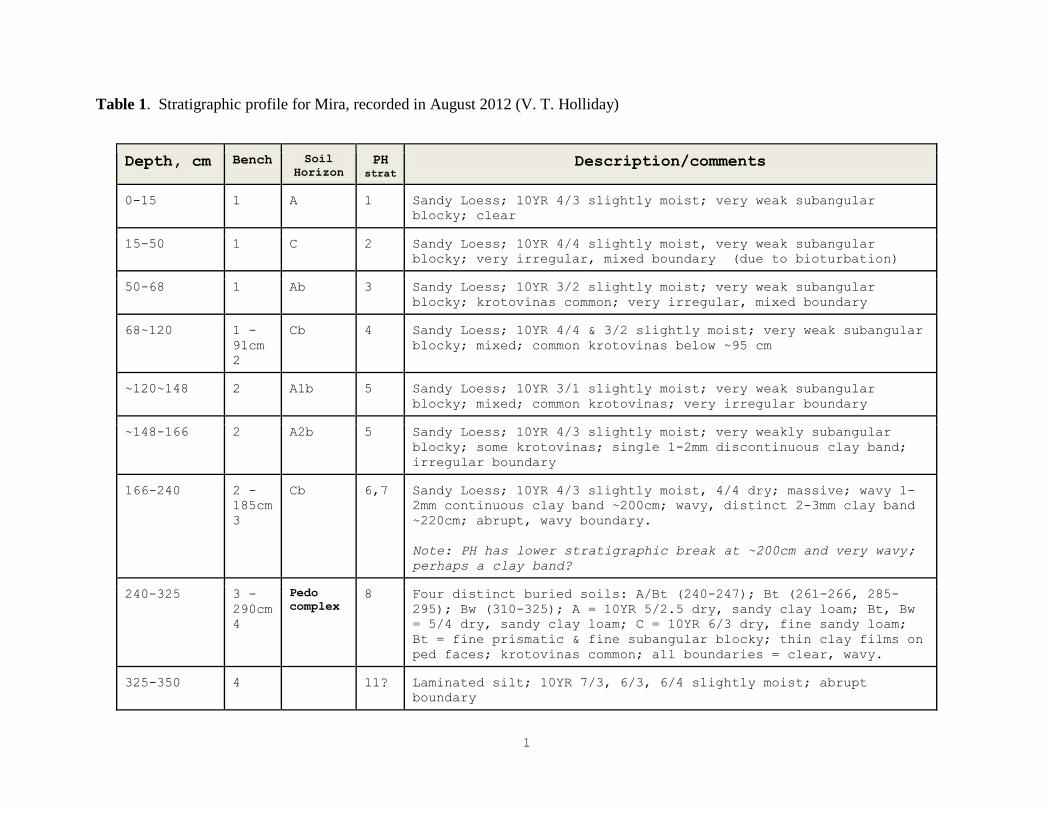
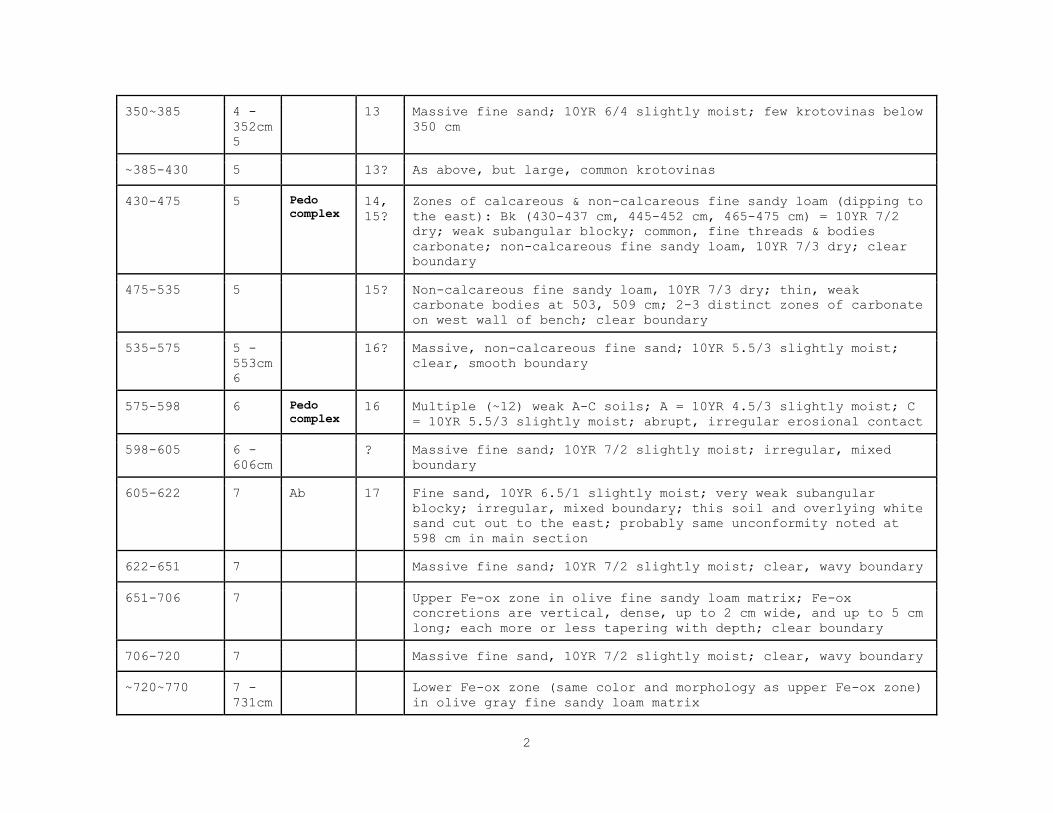
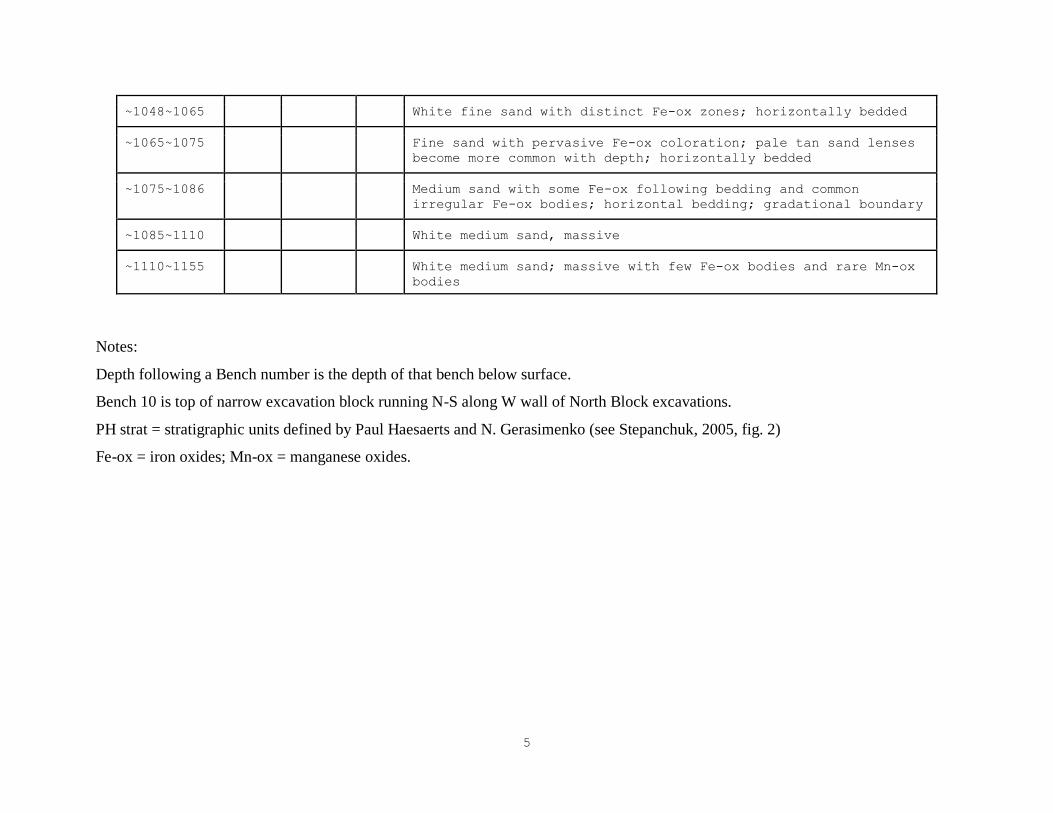
The recorded profile is presented in Table 1.
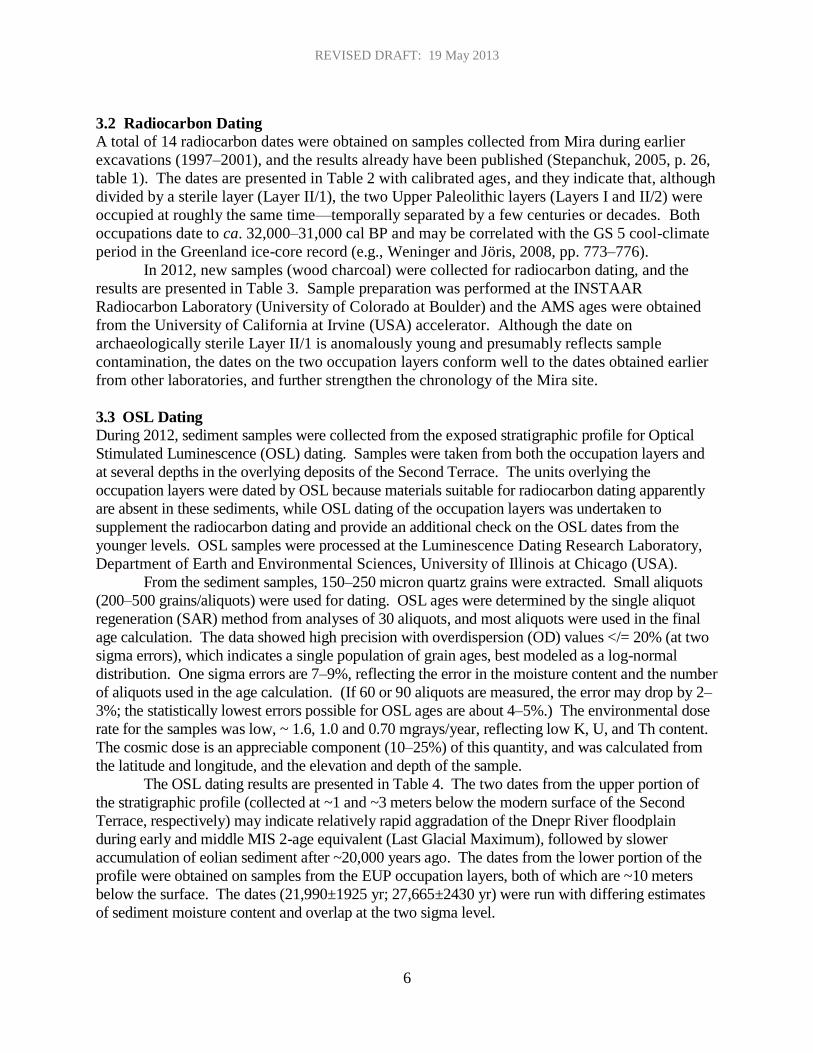
Most of the section, from ~350 cm below the surface to the base of the exposure (at a
depth of 1100 cm) is composed of sand, mostly well-sorted fine sand. This texture suggests
prolonged sedimentation by a river not affected by extreme perturbations in discharge or flow
regime. Evidence of iron oxidation and reduction is common and indicates that the water table
was high, probably immediately below the surface, during much of the aggradation of the lower
part of the section (below ~600 cm in depth). The presence of secondary calcium carbonate in
soils above ~600 cm reveals a deeper water table in the upper portion of the profile, probably due
to rapid accumulation of sediment. Above ~350 cm below the modern surface, more silt is
present in the section. Whether this represents primary airfall loess or silt redeposited from loess
on the uplands is unclear (Figure 5).
Below the modern and buried soils formed in primary or reworked eolian sediments
(0–166 cm), buried soils and pedocomplexes were recorded in the section at depths of: (1) 240–
325 cm (multiple A-Bt and A-Bw profiles); (2) 430–475 cm (multiple Bk horizons); (3) 575–598
cm (multiple A-C profiles); (4) 605–622 cm; and (5) ~958 to 1005 cm (two Ag profiles formed
under high water-table conditions). They represent brief periods of floodplain stability, perhaps
because the stream channel shifted away from the area of the section.
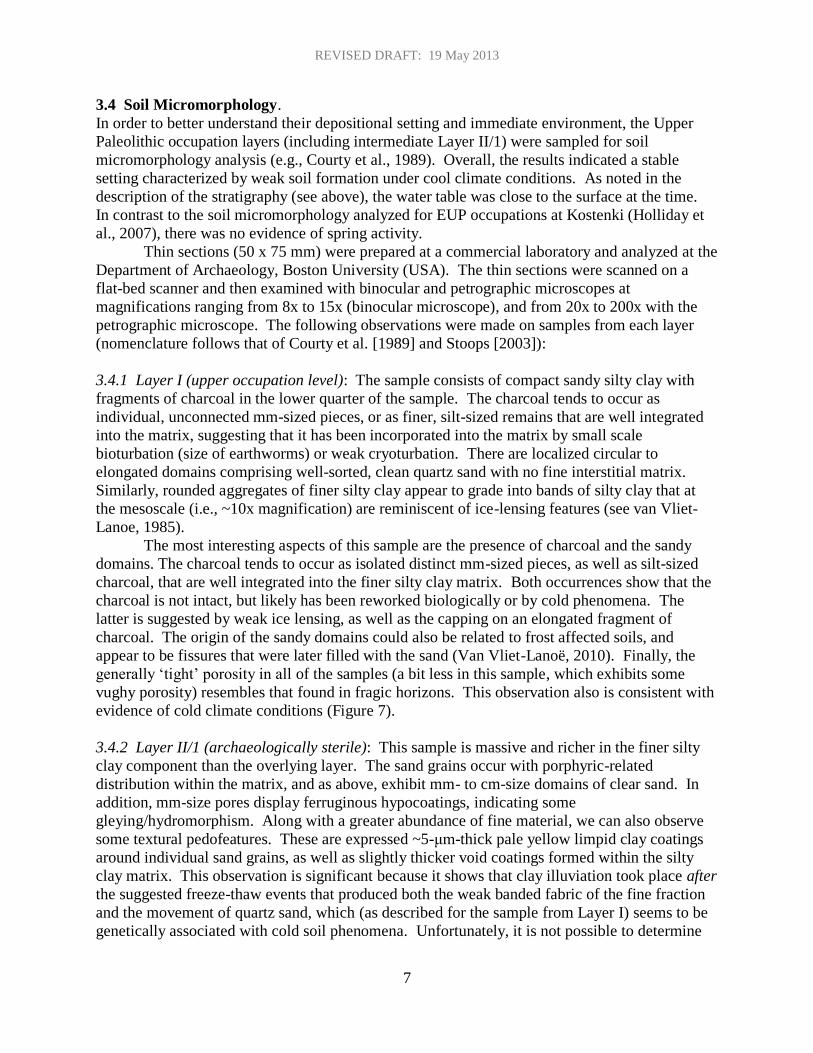
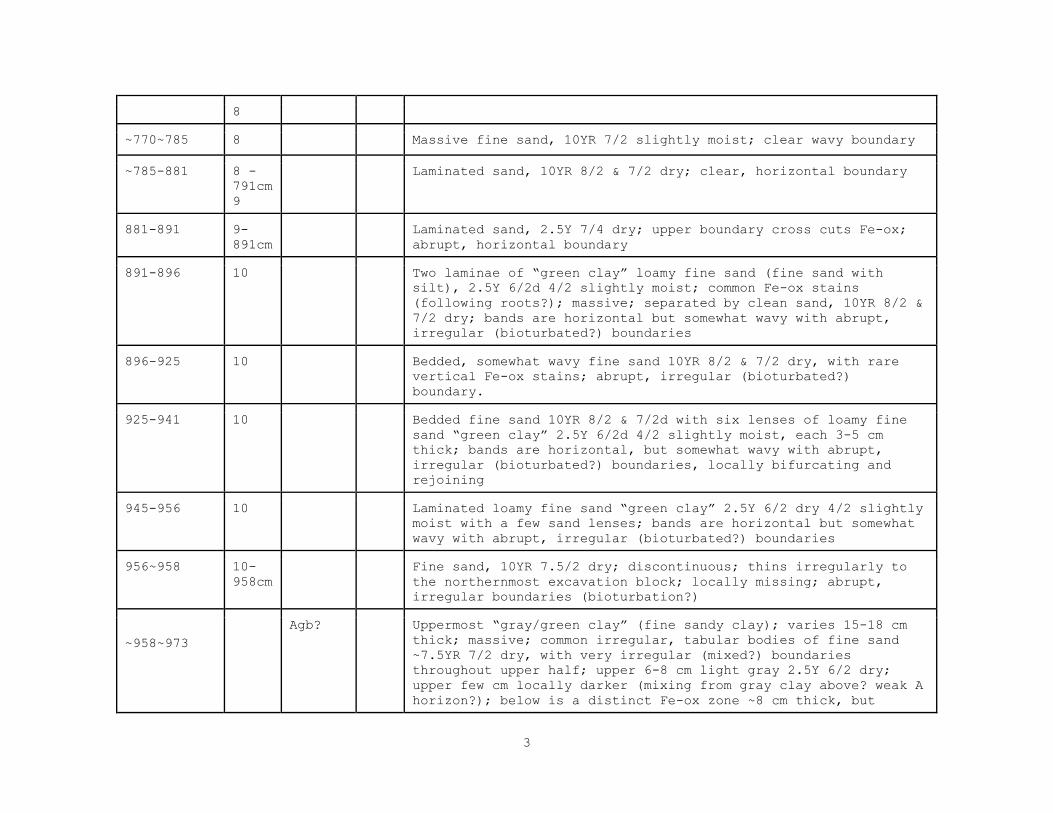
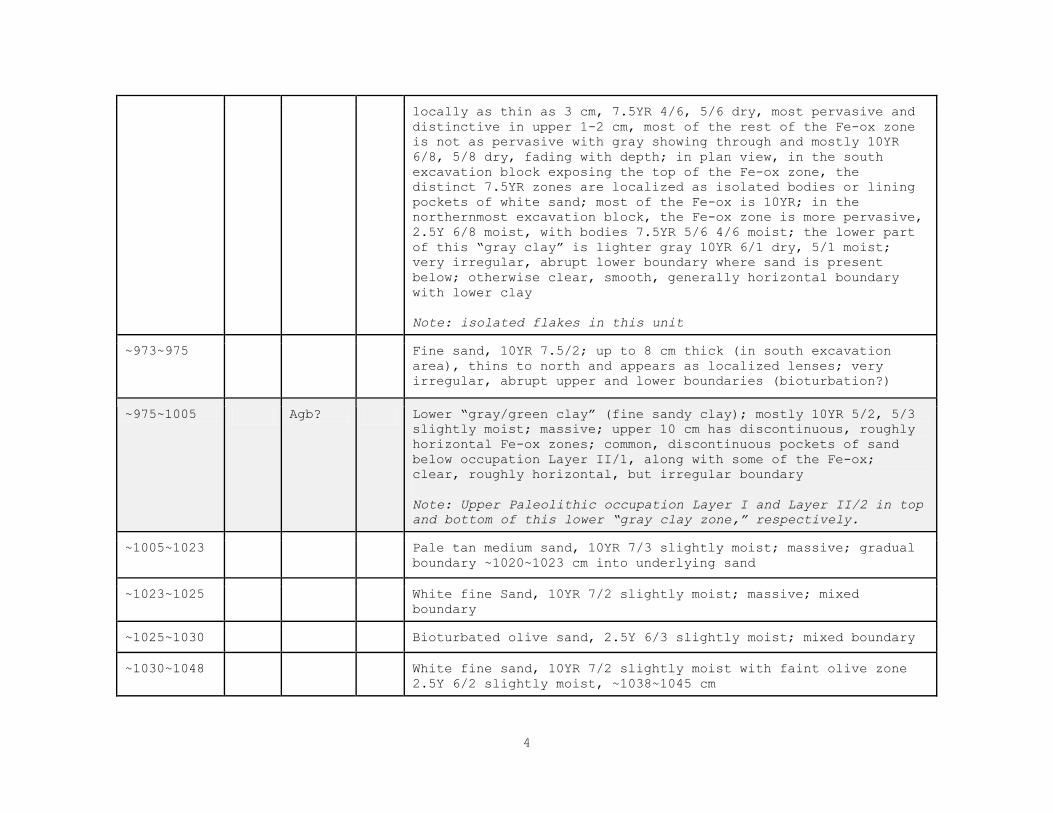
The Upper Paleolithic occupation layers (at ~958 to ~1005 cm below the surface) are
buried within two green/gray clay-rich zones that exhibit traces of soil development (Ag soil
horizons; see soil micromorphology description below). At the time of occupation, these zones
probably were damp, relatively stable surfaces with abundant vegetation that trapped fines
(dust?). The greenish (gleyed) color suggests water-logging, probably due to the presence of a
water table immediately below the surface. This setting would have been attractive to mammals,
which, in turn, have attracted hunters onto the floodplain. This may explain the presence of
evidence for human activity only in these layers (Figure 6).
During 2012, a second stratigraphic profile was recorded from an exposure in a deep
ravine (Glubokii Yar) located ~1 km west of the Mira site, and incised into deposits of the
Second Terrace. The ravine exposure revealed a profile similar to that described at the site, and
suggested that the latter represents a regional alluvial record. The combined profiles provide a
regional picture of alluvial history in the later Pleistocene. Further, the location of the section
more than 1 km from either valley wall or the Third Terrace, shows that the Upper Paleolithic
occupants of Mira were making use of a very broad floodplain.
REVISED DRAFT: 19 May 2013
6
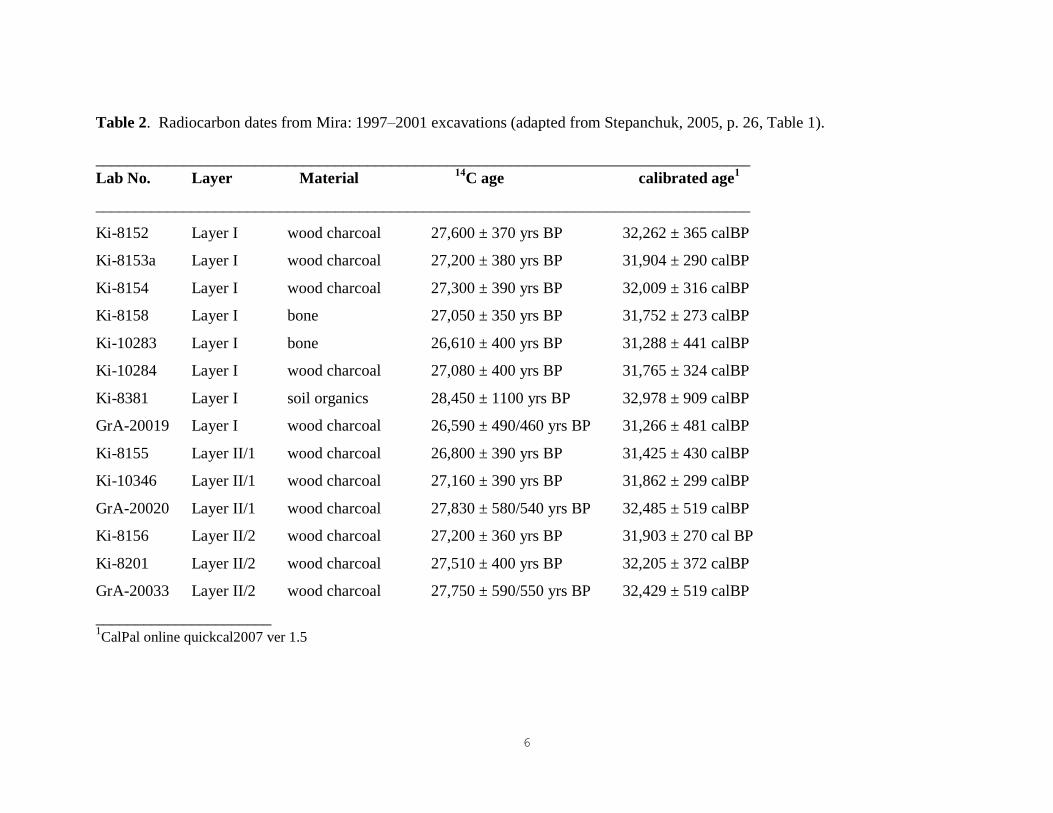
3.2 Radiocarbon Dating A total of 14 radiocarbon dates were obtained on samples collected from Mira during earlier
excavations (1997–2001), and the results already have been published (Stepanchuk, 2005, p. 26,
table 1). The dates are presented in Table 2 with calibrated ages, and they indicate that, although
divided by a sterile layer (Layer II/1), the two Upper Paleolithic layers (Layers I and II/2) were
occupied at roughly the same time—temporally separated by a few centuries or decades. Both
occupations date to ca. 32,000–31,000 cal BP and may be correlated with the GS 5 cool-climate
period in the Greenland ice-core record (e.g., Weninger and Jöris, 2008, pp. 773–776).
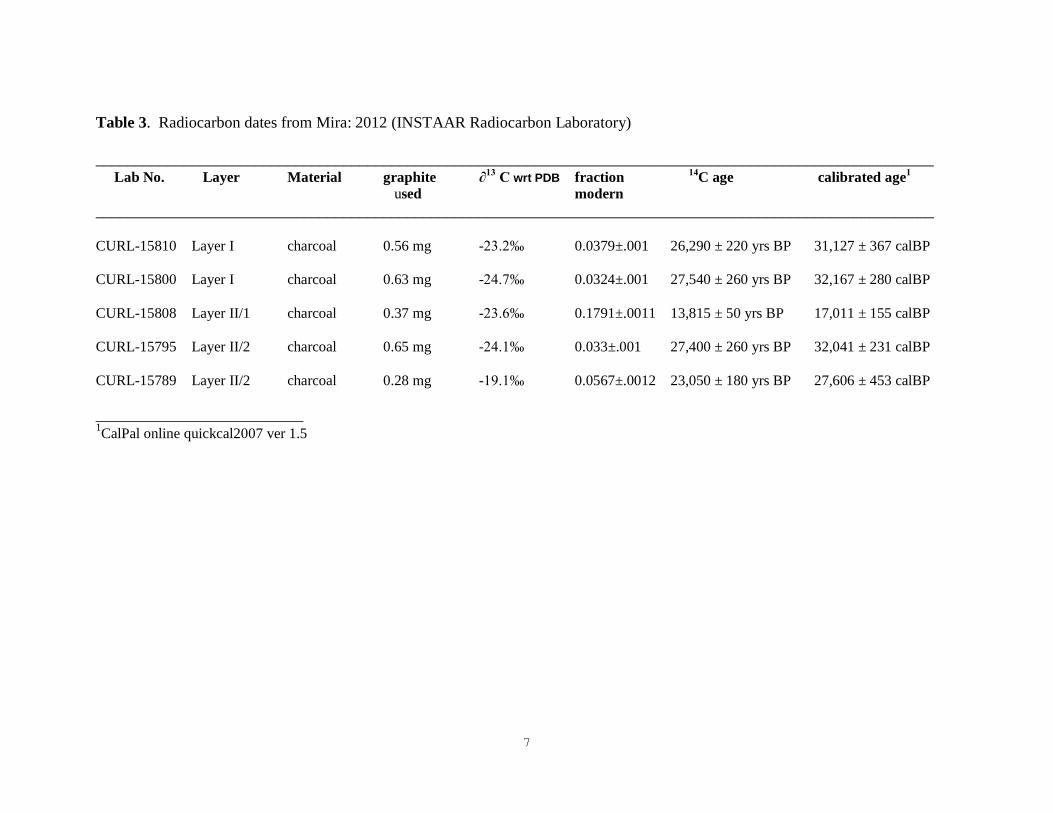
In 2012, new samples (wood charcoal) were collected for radiocarbon dating, and the
results are presented in Table 3. Sample preparation was performed at the INSTAAR
Radiocarbon Laboratory (University of Colorado at Boulder) and the AMS ages were obtained
from the University of California at Irvine (USA) accelerator. Although the date on
archaeologically sterile Layer II/1 is anomalously young and presumably reflects sample
contamination, the dates on the two occupation layers conform well to the dates obtained earlier
from other laboratories, and further strengthen the chronology of the Mira site.
3.3 OSL Dating
During 2012, sediment samples were collected from the exposed stratigraphic profile for Optical
Stimulated Luminescence (OSL) dating. Samples were taken from both the occupation layers and
at several depths in the overlying deposits of the Second Terrace. The units overlying the
occupation layers were dated by OSL because materials suitable for radiocarbon dating apparently
are absent in these sediments, while OSL dating of the occupation layers was undertaken to
supplement the radiocarbon dating and provide an additional check on the OSL dates from the
younger levels. OSL samples were processed at the Luminescence Dating Research Laboratory,
Department of Earth and Environmental Sciences, University of Illinois at Chicago (USA).
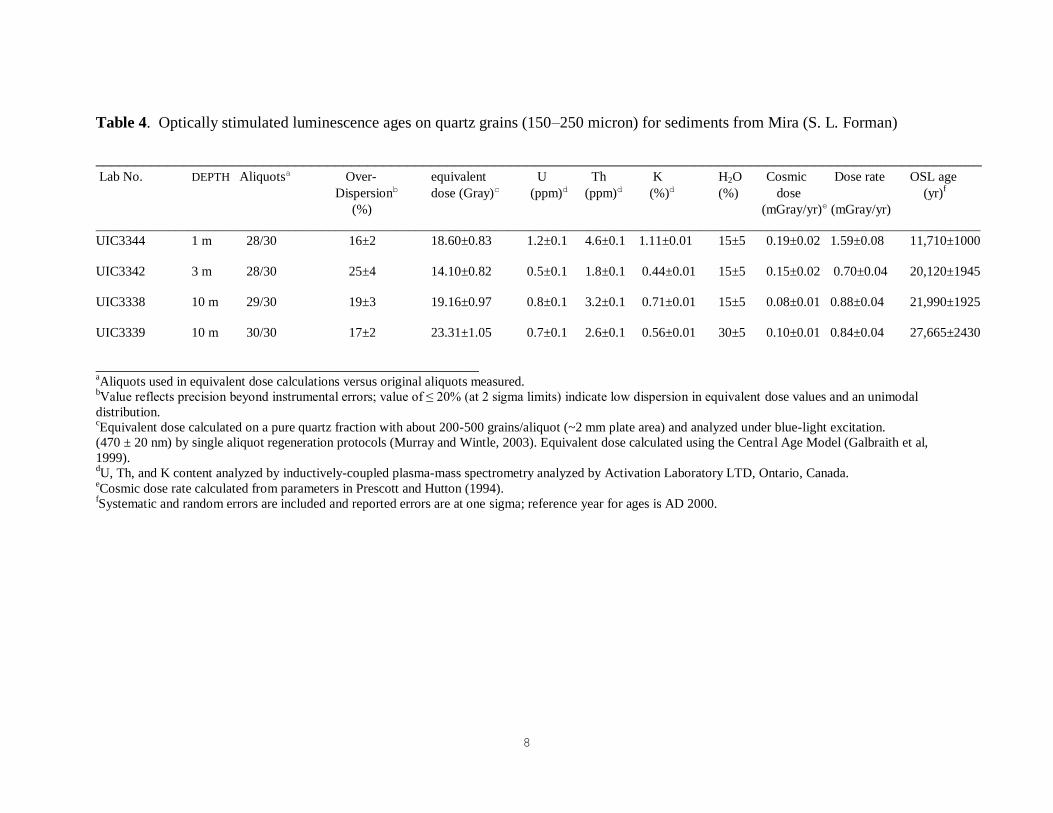
From the sediment samples, 150–250 micron quartz grains were extracted. Small aliquots
(200–500 grains/aliquots) were used for dating. OSL ages were determined by the single aliquot
regeneration (SAR) method from analyses of 30 aliquots, and most aliquots were used in the final
age calculation. The data showed high precision with overdispersion (OD) values </= 20% (at two
sigma errors), which indicates a single population of grain ages, best modeled as a log-normal
distribution. One sigma errors are 7–9%, reflecting the error in the moisture content and the number
of aliquots used in the age calculation. (If 60 or 90 aliquots are measured, the error may drop by 2–
3%; the statistically lowest errors possible for OSL ages are about 4–5%.) The environmental dose
rate for the samples was low, ~ 1.6, 1.0 and 0.70 mgrays/year, reflecting low K, U, and Th content.
The cosmic dose is an appreciable component (10–25%) of this quantity, and was calculated from
the latitude and longitude, and the elevation and depth of the sample.
The OSL dating results are presented in Table 4. The two dates from the upper portion of
the stratigraphic profile (collected at ~1 and ~3 meters below the modern surface of the Second
Terrace, respectively) may indicate relatively rapid aggradation of the Dnepr River floodplain
during early and middle MIS 2-age equivalent (Last Glacial Maximum), followed by slower
accumulation of eolian sediment after ~20,000 years ago. The dates from the lower portion of the
profile were obtained on samples from the EUP occupation layers, both of which are ~10 meters
below the surface. The dates (21,990±1925 yr; 27,665±2430 yr) were run with differing estimates
of sediment moisture content and overlap at the two sigma level.
REVISED DRAFT: 19 May 2013
7
3.4 Soil Micromorphology.
In order to better understand their depositional setting and immediate environment, the Upper
Paleolithic occupation layers (including intermediate Layer II/1) were sampled for soil
micromorphology analysis (e.g., Courty et al., 1989). Overall, the results indicated a stable
setting characterized by weak soil formation under cool climate conditions. As noted in the
description of the stratigraphy (see above), the water table was close to the surface at the time.
In contrast to the soil micromorphology analyzed for EUP occupations at Kostenki (Holliday et
al., 2007), there was no evidence of spring activity.
Thin sections (50 x 75 mm) were prepared at a commercial laboratory and analyzed at the
Department of Archaeology, Boston University (USA). The thin sections were scanned on a
flat-bed scanner and then examined with binocular and petrographic microscopes at
magnifications ranging from 8x to 15x (binocular microscope), and from 20x to 200x with the
petrographic microscope. The following observations were made on samples from each layer
(nomenclature follows that of Courty et al. [1989] and Stoops [2003]):
3.4.1 Layer I (upper occupation level): The sample consists of compact sandy silty clay with
fragments of charcoal in the lower quarter of the sample. The charcoal tends to occur as
individual, unconnected mm-sized pieces, or as finer, silt-sized remains that are well integrated
into the matrix, suggesting that it has been incorporated into the matrix by small scale
bioturbation (size of earthworms) or weak cryoturbation. There are localized circular to
elongated domains comprising well-sorted, clean quartz sand with no fine interstitial matrix.
Similarly, rounded aggregates of finer silty clay appear to grade into bands of silty clay that at
the mesoscale (i.e., ~10x magnification) are reminiscent of ice-lensing features (see van Vliet-
Lanoe, 1985).
The most interesting aspects of this sample are the presence of charcoal and the sandy
domains. The charcoal tends to occur as isolated distinct mm-sized pieces, as well as silt-sized
charcoal, that are well integrated into the finer silty clay matrix. Both occurrences show that the
charcoal is not intact, but likely has been reworked biologically or by cold phenomena. The
latter is suggested by weak ice lensing, as well as the capping on an elongated fragment of
charcoal. The origin of the sandy domains could also be related to frost affected soils, and
appear to be fissures that were later filled with the sand (Van Vliet-Lanoë, 2010). Finally, the
generally ‘tight’ porosity in all of the samples (a bit less in this sample, which exhibits some
vughy porosity) resembles that found in fragic horizons. This observation also is consistent with
evidence of cold climate conditions (Figure 7).
3.4.2 Layer II/1 (archaeologically sterile): This sample is massive and richer in the finer silty
clay component than the overlying layer. The sand grains occur with porphyric-related
distribution within the matrix, and as above, exhibit mm- to cm-size domains of clear sand. In
addition, mm-size pores display ferruginous hypocoatings, indicating some
gleying/hydromorphism. Along with a greater abundance of fine material, we can also observe
some textural pedofeatures. These are expressed ~5-μm-thick pale yellow limpid clay coatings
around individual sand grains, as well as slightly thicker void coatings formed within the silty
clay matrix. This observation is significant because it shows that clay illuviation took place after
the suggested freeze-thaw events that produced both the weak banded fabric of the fine fraction
and the movement of quartz sand, which (as described for the sample from Layer I) seems to be
genetically associated with cold soil phenomena. Unfortunately, it is not possible to determine
REVISED DRAFT: 19 May 2013
8
the horizon from which these clay coatings are derived, only that this horizon overlies that of this
sample; it is interesting to note that the overlying sample did not contain any translocation
features, or any effects of gleying. The fact that the gleying is found also in the underlying
sample (Layer II/2), points to subsurface, groundwater, gleying.
3.4.3 Layer II/2 (lower occupation level): The proportion of quartz sand to the finer silty clay
matrix is similar to that in the above sample. On the other hand, the segregation of the quartz
fraction from the silty clay matrix is striking in this sample, and is exhibited by a near vertical,
roughly cm-wide tongue of clean quartz sand in the center of the thin section. In addition,
secondary iron staining is somewhat less abundant than in the above sample, although it is not
present as hypocoatings around pores, but as impregnations associated with the remains of
charcoal or organic matter. Moreover, translocated clay is more abundant in this sample than
above, and it is somewhat limited to the finer fraction and less so as coatings around coarser
quartz grains. This increased degree of translocation suggests that this sample is more within
what was a weak Bt soil horizon. The clearly defined textural tongue containing clean quartz
sand reflects the position of this sample possibly close to a former surface and is part of a
number of ‘bleached’ areas observed in the field at this position. In any case, it is reasonable to
infer that the formation of the tongues is related to frost-affected soils, whereas the translocation
of the limpid clay—as coatings around quartz grains and void coatings within the matrix—is tied
to more temperate conditions. The presence of ferruginous impregnations is indicative of
groundwater effects that might precede the formation of the tongues, as there is no secondary
iron staining in the tongues.
4. Bioarchaeology Both plant and animal remains were recovered from the Upper Paleolithic occupation layers at
Mira, and their analysis contributes significantly to interpretation of the site. Although sediment
samples collected during the earlier excavations yielded small numbers of pollen grains and
spores, several layers contain plant macro-fossils, including relatively large fragments of burned
wood, which is unusual for Paleolithic sites. The occupation layers, especially Layer I, produced
a large quantity of well-preserved mammalian remains, including a sample of several hundred
bones and teeth of horse. The horse remains from Layer I were another focus of the 2012
research, and their analysis is described below.
4.1 Plant Macro-Fossils
During the earlier excavations (1997–2001), charcoal fragments (identified as Pinus sp. by F.
Damblon) were recovered from Layer II/1 without evidence of human occupation. The macro-
fossils in this level evidently reflect the effects of a wildfire.
Burned wood fragments also were collected from Upper Paleolithic occupation Layer I,
concentrated in two locations of the 5-m2 area excavated during 2012. The fragments included 5
large pieces, the largest of which is approximately 30 cm in diameter, and more than 15 smaller
pieces (each roughly 1–2 cm in diameter and several mm in thickness). The macro-fossils have
not been identified. The two concentrations of wood fragments were found several cm below the
level of bone fragments mapped in these units, and may or may not be associated with human
occupation (Figure 8).
REVISED DRAFT: 19 May 2013
9
4.2 Mammal Remains
Several thousand bones and teeth of mammals were recovered from the occupation layers at
Mira, and a list (presence/absence) of species is presented in Table 5. Most remains were found
in Layer I, while less than 40 fragmented bones were found in Layer II/2. The bones and teeth
were identified by O. P. Zhuravlev, P. V. Puchkov, and L. I. Rekovets.
Among medium and large mammals, horse (Equus latipes) predominates, representing
72% of NISP (number of identified specimens) in Layer I, and at least some of the bone
fragments in Layer II/2. Most of the remaining bones and teeth (NISP = 22%) in Layer I are
assigned to arctic fox (Alopex lagopus). Less common taxa include hare (Lepus europaeus),
steppe marmot (Marmota bobac), mammoth (Mammuthus primigenius), red deer (Cervus
elaphus), reindeer (Rangifer tarandus), giant deer (Megaloceros giganteus), and steppe bison
(Bison priscus). In addition to horse, some of the bone fragments in Layer II/2 were identified as
bison.
4.3 Analysis of Horse Remains from Layer I
Among large mammals, only the horse remains from Layer I constitute a sufficiently large
sample for analysis of skeletal-part representation and mortality profile. An analysis of the
taphonomy of the horse remains from Layer I was undertaken by one of us (A. Brugère) as part
of a separate study, and some of the results, supplemented by observations of the senior author,
are presented below.
4.3.1 Weathering, Breakage, and Surficial Damage. The bones are moderately weathered. In
terms of color, a random sample (n = 48) was primarily “brownish yellow (10YR6/6), “very pale
brown” (10YR7/4), and “light yellowish brown” (10YR6/4). A combined sample of femur and
humerus shaft bones (n = 55) were classified according to weathering stages defined by
Behrensmeyer (1978) and Johnson (1985): Stage 1 (0%), Stage 1/2 (49%), Stage 2 (31%), Stage
2/3 (15%), and Stage 3 (5%).
There is evidence of substantial breakage of bones in a fresh or green condition. A
combined sample of femur and humerus fragments (epiphyses and shafts) (n = 81) contained
examples of green (52%), dry (25%), and undetermined (35%) fractures (some bones exhibited
more than one type of break). Green breakage types observed include sawtooth, spiral, V-
shaped, cone fracture, and others (See Figure 9a).
The bones exhibited little evidence of root etching or carnivore gnawing—only isolated
examples of each were observed. Probable tool cut-marks and percussion marks were noted on a
number of bones (n = 16), including fragments of the ribs, humerus, radius, pelvis, femur, tibia,
and metapodials (see Figure 9b).
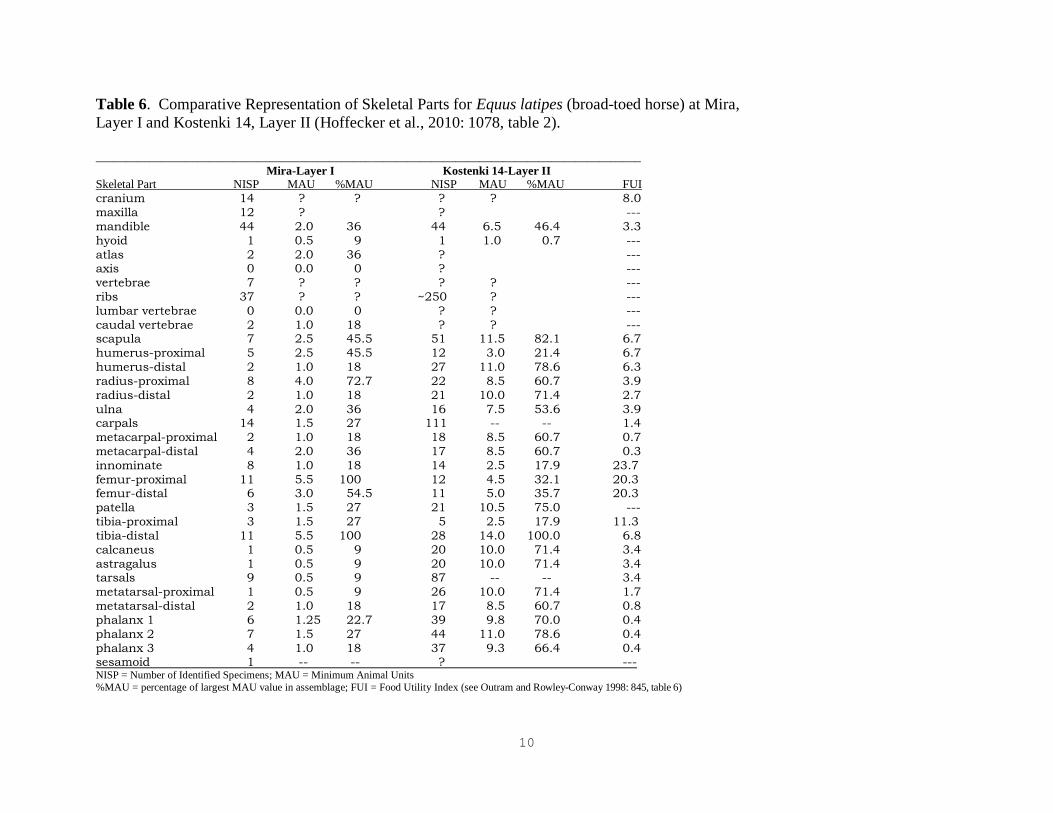
4.3.2 Skeletal-Part Representation. Most skeletal parts are represented, including a large
quantity of isolated teeth. The distribution of parts (excluding teeth) is shown in Table 6, in
which raw counts of identified bone fragments (NISP) have been converted to minimum number
of animal units (MAU), and the latter have been normalized (by dividing each MAU value by the
greatest MAU value in the assemblage) (e.g., Lyman, 1994, pp. 104–110). Total NISP counts
for some parts were higher than those presented in Table 6, because some fragments (e.g., radius
shaft) could not be assigned to a specific part in the table. The best represented parts of the
skeleton are the proximal femur and distal tibia, while the least well represented parts are some
of the lower limb elements such as the astragalus and metatarsal.
REVISED DRAFT: 19 May 2013
10
For comparative purposes, the skeletal-part distribution for the same taxon in the broadly
contemporaneous occupation at Kostenki 14, Layer II (Hoffecker et al., 2010, p. 1078, table 2)
also is shown in Table 6. Most of the same parts found at Mira are present at Kostenki 14, but
there are significant differences in the proportional representation of specific elements.
Statistical comparison of the two distributions (appendicular parts only) yields a Kolmogorov-
Smirnov value of 1.73, which is significant at the 0.01 level (e.g., Klein and Cruz-Uribe, 1984,
pp. 73–74). Mira yielded relatively few bones of the lower extremities, and the contrast with
Kostenki 14 is especially pronounced for the metapodials, larger tarsals, and phalanges. Because
these elements are dense (see Lam et al., 1999, pp. 348–353) and easy to identify (even when
broken), degree of weathering or fragmentation is unlikely to account for the difference. As a
food utility index (FUI) for horse (Outram and Rowley-Conwy, 1998, p. 845, table 6) indicates,
however, they possess low food value in comparison to other elements. The poor representation
of these parts at Mira probably reflects selective retrieval of “meaty” portions of the carcass by
the occupants of the site (Stepanchuk, 2005, p. 26).
4.3.3 Demographic Data. Variations in the presence/absence and eruption and wear of teeth
provide information of the age and sex of the horses represented in Layer I. These data indicate
that both adults and juveniles were present and that females probably were predominant among
the adults. This age/sex distribution is consistent with that of a mare-band among living horses
(e.g., Berger, 1986; Niven, 2007, p. 373).
In a separate study, one of us (A. Brugère) grouped the isolated cheek-teeth into age sets.
Although results varied by tooth, they all indicated a group composed of several adults and
young individuals. For example, the left mandibular teeth yielded the following age distribution:
0–1 years (n = 4), 1–3 years (n = 3), 3–5 years (n = 4), 5–10 years (n = 3), >10 years (n = 2).
Based on data from Zhuravlev and Puchkov, Stepanchuk (2005, p. 28) reported only two canines
among the horse teeth, suggesting most of the adult horses were females (e.g., Turner, 2002, p.
204).
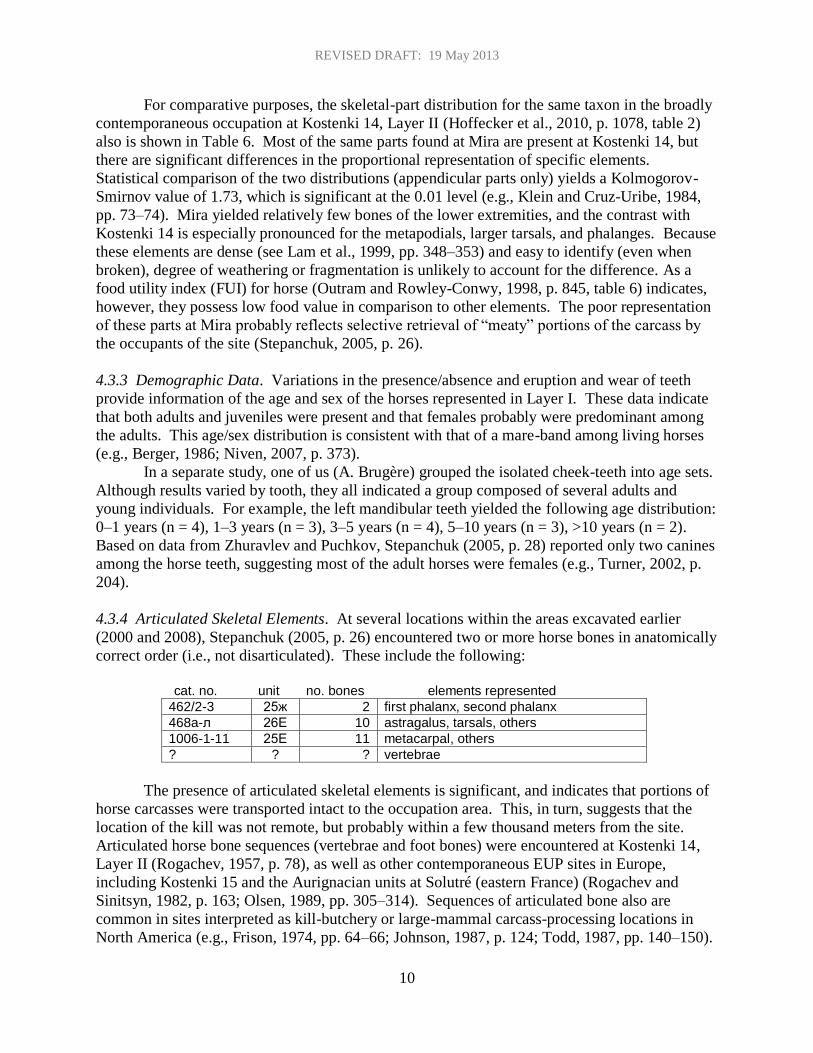
4.3.4 Articulated Skeletal Elements. At several locations within the areas excavated earlier
(2000 and 2008), Stepanchuk (2005, p. 26) encountered two or more horse bones in anatomically
correct order (i.e., not disarticulated). These include the following:
cat. no. unit no. bones elements represented
462/2-3 25ж 2 first phalanx, second phalanx
468a-л 26Е 10 astragalus, tarsals, others
1006-1-11 25Е 11 metacarpal, others
? ? ? vertebrae
The presence of articulated skeletal elements is significant, and indicates that portions of
horse carcasses were transported intact to the occupation area. This, in turn, suggests that the
location of the kill was not remote, but probably within a few thousand meters from the site.
Articulated horse bone sequences (vertebrae and foot bones) were encountered at Kostenki 14,
Layer II (Rogachev, 1957, p. 78), as well as other contemporaneous EUP sites in Europe,
including Kostenki 15 and the Aurignacian units at Solutré (eastern France) (Rogachev and
Sinitsyn, 1982, p. 163; Olsen, 1989, pp. 305–314). Sequences of articulated bone also are
common in sites interpreted as kill-butchery or large-mammal carcass-processing locations in
North America (e.g., Frison, 1974, pp. 64–66; Johnson, 1987, p. 124; Todd, 1987, pp. 140–150).
REVISED DRAFT: 19 May 2013
11
3.4.5 Conclusions. The taphonomic characteristics of the horse remains in Layer I probably
indicate the butchering of a group of horses near the site (Stepanchuk, 2005). This conclusion is
based on the following observations: a) large concentration of bones and teeth representing more
than a dozen individual horses of varying age and sex; (b) virtually all skeletal parts represented
and multiple groups of articulated bones, including vertebrae and lower limb elements; (c) traces
of carnivore damage almost entirely absent; and (d) high proportion of bones fractured when
fresh and some percussion and cut marks (cut marks sometimes observed in anatomically
significant locations), apparently reflecting multiple phases of a butchering process. The
demographic profile of the horses probably reflects a mare-band comprising an adult male,
several adult females, and multiple juveniles (Berger, 1986; Olsen, 1995). The pattern is similar
to that observed at two other late EUP sites on the East European Plain: Kostenki 14, Layer II
and Kostenki 15 (Hoffecker et al., 2010, pp. 1078–1081).
Although there is no direct evidence of hunting (e.g., point embedded in horse bone) as
opposed to scavenging carcasses from a natural catastrophe, the former seems most likely, given
the almost complete absence of carnivore damage to the bones, as well as the lack of features in
the area that are associated with catastrophic death (e.g., box canyon subject to flash floods). In
fact, the topographic setting of the site (i.e., center of wide floodplain) raises questions about
how its occupants were able to trap and kill a large group of horses without some form of barrier
or enclosure.
5. Mira and the EUP of Eastern Europe Mira remains the only dated EUP site in the immense Dnepr Basin, and fills a major void in the
EUP record of the East European Plain. The geomorphic context of the site suggests that the
scarcity of EUP sites in this region—and more generally on the East European Plain—is due not
to sparse settlement, but to deep burial in sediments that are largely inaccessible and rarely
subject to accidental exposure and discovery. There probably are many more sites similar to
Mira buried in the alluvium of the Second Terrace.
The site dates to a late phase of the EUP (35,000–30,000 cal BP) and is broadly
contemporaneous with several other major EUP sites/layers on the East European Plain,
including Molodova V, Layer 10; Kostenki 14, Layer II; Kostenki 15; and Sungir’ (Sinitsyn and
Hoffecker, 2006; Haesaerts et al., 2003, pp. 166–167; Hoffecker et al., 2010, p. 1078; Marom et
al., 2012). Radiocarbon dates on the two occupation layers at Mira cluster tightly around
~32,000 cal BP and correlate with a cold oscillation in the Greenland ice-core record (Greenland
Stadial 5 [GS 5]). The sediments containing the occupation debris exhibit some evidence of cold
climate, and mammal remains associated with the upper layer include arctic fox.
Mira is found in a paleo-topographic setting unique to the EUP of Eastern Europe. The
position of the site in relation to the Third Terrace indicates that it was located near the center of
the broad Dnepr River floodplain—not on a low terrace above the floodplain or along a side-
valley ravine (see Figure 10). The site was occupied during an interval when the floodplain was
relatively stable—subject to periodic overbank deposition—and weak soil formation was
occurring on the surface. No evidence of spring activity was detected in the analysis of the soil
micromorphology (although a modern spring outlet is found ~1 km west of the site in a Holocene
ravine) and it remains unclear what attracted people to this specific area of the floodplain on at
least two occasions.
REVISED DRAFT: 19 May 2013
12
During the second occupation (which took place at least a few decades or possibly
centuries after the first occupation), a group of horses—probably a mare-band—was killed near
the site by its inhabitants. Close proximity to the kill location is suggested by the relatively
complete representation of skeletal elements, and the presence of several articulated bone
sequences. The hunting of mare-bands seems to have been widespread during the later EUP, not
only on the East European Plain (i.e., at Kostenki), but also in Western Europe (at Solutré in
eastern France) (Olsen, 1989; Hoffecker et al., 2010). In contrast to the horse bone assemblage
at Kostenki 14, Layer II, Mira contains few lower limb elements. These bones are comparatively
low in food value, and apparently were abandoned at the kill location—probably indicating that
the later was not as close to the site as at Kostenki 14. Also in contrast to other EUP sites that
yield evidence for the hunting of mare-bands, there was no natural trap or cul-de-sac in the
vicinity of Mira, which lends support to the suggestion (raised at other sites [e.g., Olsen, 1995:
73]), that some form of artificial barrier or enclosure was constructed to trap the horses. The
large wood fragments recovered from Layer I and II/1 indicate that materials were available to
construct a fence or barrier.
Although technically a stratified site, the cultural levels at Mira were occupied in
relatively rapid succession (within a few centuries or less), but the relationship between the two
artifact assemblages remains unclear. Bladelets recovered from the lower occupation level
(Layer II/2) are diagnostic of the early Gravettian (Stepanchuk, 2005, pp. 27–28), which also is
represented at the roughly contemporaneous occupation at Kostenki 8, Layer II (Anikovich et al.,
2007, p. 233–236). New radiocarbon dates from Buran-Kaya III in Crimea suggest that the
Gravettian in Eastern Europe may be almost as early as 40,000 cal BP (Prat et al., 2011). This,
in turn, suggests that it is historically connected to the Ahmarian bladelet industry, now
documented in the northern and southern Caucasus (Adler et al., 2006; Golovanova et al., 2010),
and apparently a proxy for modern human movement directly from the Levant to Eastern Europe
via the Caucasus (Hoffecker, 2012).
The spatial and temporal range of the sites suggests that the early Gravettian industry
occupies a major place in the EUP of Eastern Europe. Its visibility probably is reduced,
however, by two factors that reflect the character of the archaeological record of the East
European Plain (i.e., scarcity of natural shelters): (a) comparatively few known sites due to low
archaeological visibility; and (b) predominance of artifacts (e.g., flake scrapers) related to large-
mammal butchery and carcass-processing that are not diagnostic of specific cultural entities. In
other words, the people who produced the bladelets in Layer II/2 at Mira may have been part of a
widespread cultural phenomenon in Eastern Europe 40,000–30,000 cal BP, but without leaving
an archaeological record comparable to the contemporaneous Aurignacian of Western Europe.
The upper layer at Mira (Layer I) also contains numerous bladelets, but they are not
particularly diagnostic of a specific EUP industry (see Stepanchuk, 2005, 34–34); they might be
connected to several contemporaneous sites/layers in Eastern Europe that contain elements of the
Aurignacian technocomplex (e.g., Kostenki 1, Layer III). The assemblage from Layer I has been
widely assigned to a local East European industry (Gorodtsovan) that exhibits a combination of
typical Middle and Upper Paleolithic technology and tool forms (e.g., Cohen and Stepanchuk,
1999, pp. 298–301; Anikovich et al., 2007, p. 262). An alternative explanation is that the
“Middle Paleolithic” forms, which include side-scrapers and bifaces, represent expedient tools
related to the processing of large-mammal carcasses, and it should be noted that other
“Gorodtsovan” sites (e.g., Kostenki 14, Layer II; Kostenki 15) also yield evidence of horse
carcass-processing (Hoffecker, 2011).

REVISED DRAFT: 19 May 2013
13
Acknowledgments The 2012 Mira project was supported by a general grant from the L.S.B. Leakey Foundation.
The grant was administered by the Illinois State Museum.
References
Adler, D.S., Belfer-Cohen, A., Bar-Yosef, O., 2006. Between a rock and a hard place:
Neandertal-modern human interactions in the southern Caucasus. In: Conard, N.J. (Ed.)
Neandertals and Modern Humans Meet. Krems-Verlag, Tübingen, pp. 165–187.
Anikovich, M.V., Anisyutkin, N.K., Vishnyatsky, L.B., 2007. Uzlovye Problemy Perekhoda k
Verkhnemu Paleolitu v Evrazii. Nestor-Istoriya, Saint Petersburg.
Behrensmeyer, A.K., 1978. Taphonomic and ecologic information from bone weathering.
Paleobiology 4, 150–162.
Berger, J., 1986. Wild Horses of the Great Basin. University of Chicago Press, Chicago.
Cohen, V.Yu., Stepanchuk, V.N., 1999. Late Middle and early Upper Paleolithic evidence from
the East European Plain and Caucasus: a new look at variability, interactions, and
transitions. Journal of World Prehistory 13(3), 265–319.
Courty, M.- A., Goldberg, P. & Macphail, R. I., 1989. Soils and Micromorphology in
Archaeology. Cambridge University Press, New York.
Frison, G.C., 1974. The Casper Site: A Hell Gap Bison Kill on the High Plains. Academic Press,
New York.
Galbraith, R.F., Roberts, R.G., Laslett, G.M., Yoshida, H., and Olley, J.M., 1999. Optical dating
of single and multiple grains of quartz from Jinmium rock shelter, northern Australia,
part 1, Experimental design and statistical models. Archaeometry 41, 339–364.
Goldberg, P., Macphail, R.I., 2006. Practical and Theoretical Geoarchaeology. Blackwell,
Boston.
Golovanova, L.V., Doronichev, V.B., Cleghorn, N.E., Kulkova, M.A., Sapelko, T.V. &
Shackley, M.S. 2010. Significance of ecological factors in the Middle to Upper
Paleolithic transition. Current Anthropology 51, 655–691.
Goretskii, G.I., 1970. Allyuvialnaya Letopis’ Velikogo Pra-Dnepra. Nauka, Moscow, 412 pp.
Haesaerts, P., Borziak, I., Chirica, V., Damblon, F., Koulakovska, L., van der Plicht, J., 2003.
The east Carpathian loess record: a reference for the middle and late Pleniglacial
stratigraphy in central Europe. Quaternaire 14,163–188.
Higham, T., Compton, T., Stringer, C., Jacobi, R., Shapiro, B., Trinkaus, E., Chandler, B.,
Gröning, F., Collins, C., Hillson, S., O’Higgins, P., FitzGerald, C., Fagan, M., 2011. The
earliest evidence for anatomically modern humans in northwestern Europe. Nature 479,
521–524.
Hoffecker, J. F., 2009. The spread of modern humans in Europe. Proceedings of the National
Academy of Sciences 106(38), 16040–16045.
Hoffecker, J. F., 2011. The early Upper Paleolithic of eastern Europe reconsidered. Evolutionary
Anthropology 20(1), 24–39.
Hoffecker, J. F., 2012. A new framework for the Upper Paleolithic of Eastern Europe.
Proceedings of the European Society for the Study of Human Evolution 1, 101.
Hoffecker, J.F., Holliday, V.T., Anikovich, M.V., Sinitsyn, A.A., Popov, V.V., Levkovskaya,
G.M., Pospelova, G.A., Forman, S.L., Lisitsyn, S.N., Giaccio, B., 2008. From the Bay of
REVISED DRAFT: 19 May 2013
14
Naples to the River Don: the Campanian Ignimbrite eruption and the Middle to Upper
Paleolithic transition in Eastern Europe. Journal of Human Evolution 55, 858–870.
Hoffecker, J.F., Kuz’mina, I.E., Syromyatnikova, E.V., Anikovich, M.V., Sinitsyn, A.A., Popov,
V.V., Holliday, V.T., 2010. Evidence for kill-butchery events of early Upper Paleolithic
age at Kostenki, Russia. Journal of Archaeological Science 37, 1073–1089.
Holliday, V.T., 2004. Soils in Archaeological Research. Oxford University Press, New York.
Holliday, V.T., Hoffecker, J.F., Goldberg, P., Macphail, R.I., Forman, S.L., Anikovich, M.,
Sinitsyn, A. 2007. Geoarchaeology of the Kostenki-Borshchevo sites, Don River, Russia.
Geoarchaeology: An International Journal 22(2), 183–230.
Holliday, V.T., Mandel, R.E., 2006. Geoarcheology of the Plains, Southwest, and Great Lakes.
In: Ubelaker, D. H. (Ed.), Handbook of North American Indians: Environment, Origins,
Population, vol. 3. Smithsonian Institution Press, Washington, pp. 23–46.
Johnson, E., 1985. Current developments in bone technology. In: Schiffer, M.B. (Ed.), Advances
in Archaeological Method and Theory, vol. 8. Academic Press, New York, pp. 157-235.
Johnson, E., 1987. Cultural activities and interactions. In: Johnson, E. (Ed.), Lubbock Lake: Late
Quaternary Studies on the Southern High Plains. Texas A&M University Press, College
Station, TX, pp. 120–158.
Klein, R.G., Cruz-Uribe, K., 1984. The Analysis of Animal Bones from Archeological Sites.
University of Chicago Press, Chicago.
Kozlowski, J.K., 2007. The significance of blade technologies in the period 50-35 kya BP for the
Middle-Upper Palaeolithic transition in central and Eastern Europe. In: Mellars, P.,
Boyle, K., Bar-Yosef, O., Stringer, C., (Eds.) Rethinking the human revolution: new
behavioural and biological perspectives on the origin and dispersal of modern humans.
McDonald Institute Monographs, Cambridge, pp. 317–328.
Lam, Y.M., Chen, X., Pearson, O.M., 1999. Intertaxonomic variability in patterns of bone
density and the differential representation of bovid, cervid, and equid elements in the
archaeological record. American Antiquity 64, 343–362.
Lyman, R.L., 1994. Vertebrate Taphonomy. Cambridge University Press, Cambridge.
Marom, A., McCullagh, Higham, T.F.G., Sinitsyn, A.A., Hedges, R.E.M., 2012. Single amino
acid radiocarbon dating of Upper Paleolithic modern humans. Proceedings of the
National Academy of Sciences doi/10.1037/pnas.1116328109
Matoshko, A.V., Gozhik, P.F., Ivchenko, A.S., 2002. The fluvial archive of the Middle and
Lower Dnieper (a review). Netherlands Journal of Geosciences 81, 339–355.
Montet-White, A., 2002. Les outillages des chasseurs de Solutré. In: Combier, J., Montet-White,
A. (Eds.) Solutré 1968-1998, Société Préhistorique Française Mémoire 30, 225–241.
Murray, A. S., Wintle, A. G., 2003. The single aliquot regenerative dose protocol: potential for
improvements in reliability. Radiation Measurements 37, 377–381.
Niven, L., 2007. From carcass to cave: Large mammal exploitation during the Aurignacian at
Vogelherd, Germany. Journal of Human Evolution 53, 362–382.
Olsen, S.L., 1989. Solutré: a theoretical approach to the reconstruction of Upper Palaeolithic
hunting strategies. Journal of Human Evolution 18, 295–327.
Olsen, S.L., 1995. Pleistocene horse-hunting at Solutré: why bison jump analogies fail. In:
Johnson, E. (Ed.) Ancient Peoples and Landscapes. Museum of Texas Tech University,
Lubbock, pp. 65–75.
Outram, A.K., Rowley-Conwy, P., 1998. Meat and marrow utility indices for horse (Equus).
Journal of Archaeological Science 25, 839–849.
REVISED DRAFT: 19 May 2013
15
Prat, S., Péan, S.C., Crépin, L., Drucker, D.G., Puaud, S.J., Valladas, H., Lázničková-
Galetová, M., van der Plicht, J., Yanevich, A., 2011. The oldest anatomically modern
humans from far southeast Europe: direct dating, culture, and behavior. PLoS ONE 6:
e20834.
Prescott, J.R., Hutton, J.T., 1994. Cosmic ray contributions to dose rates for luminescence and
ESR dating: large depths and long-term time variations. Radiation Measurements 23,
497–500.
Richter, D., Tostevin, G., Škrdla, P., 2008. Bohunician technology and thermoluminescence
dating of the type locality of Brno-Bohunice (Czech Republic). Journal of Human
Evolution 55, 871–885.
Rogachev, A.N., 1957. Mnogosloinye stoyanki Kostenkovsko-Borshevskogo raiona na Donu i
problema razvitiya kul’tury v epokhu verkhnego paleolita na Russkoi Ravnine. Materialy
i issledovaniya po arkheologii SSSR 59, 9–134.
Rogachev, A.N., Anikovich, M.V., 1984. Pozdnii paleolit Russkoi Ravniny i Krima. In:
Boriskovskii, P.I. (Ed.) Paleolit SSSR. Nauka, Moscow, pp. 162–271.
Rogachev, A.N., Sinitsyn, A.A., 1982. Kostenki 15 (Gorodtsovskaya stoyanka). In: Praslov ND,
Rogachev AN, (Eds.) Paleolit Kostenkovsko-Borshchevskogo raiona na Donu 1879–
1979. Nauka, Leningrad, pp. 162–171.
Sinitsyn, A.A., Hoffecker, J.F., 2006. Radiocarbon dating and chronology of the early Upper
Paleolithic at Kostenki (Russia). Quaternary International 152-153, pp. 175–185.
Stepanchuk, V.N., 2005. The archaic to true Upper Paleolithic interface: the case of Mira in the
Middle Dnieper area. Eurasian Prehistory 3(1), 23–41.
Stepanchuk, V.N., Cohen, V. Yu., Pisaryev, I. B., 1998. Mira, a new Late Pleistocene site in the
Middle Dnieper, Ukraine (preliminary report). Pyrenae 29, 195–204.
Stepanchuk, V.N., Cohen, V.Yu., Gerasimenko, N.P., Damblon, F., Haesaerts, P., Zhuravlev,
O.P., Kovalyukh, N.N., Petrougne, V.F., van der Plicht, J., Putshkov, P.V., Rekovets,
L.I., Turner, C.G., 2004. Bogatosharova stoyanka Mira na Sredn’omu Dnipri: osnoni
rezul’tati razkopok 2000 roku. Kam’yana doba Ukraini, Kiev, pp. 62–98.
Stepanchuk, V.N., Sapozhnikov, I.V., Gladkikh, M.I., Ryzhov, S.N., 2009. Ukrainian Upper
Paleolithic between 40/10.000 BP: Current insights into environmental-climatic change
and cultural development. In: F. Djindjian, J. Kozlowski, N. Bicho (Eds.) Le Concept de
Territories dans le Paléolithique Supérieur Européen, pp. 63–74. BAR International
Series 1938.
Stoops, G., 2003. Guidelines for Analysis and Description of Soil and Regolith Thin Sections.
Soil Science Society of America, Madison, WI, 184p.
Todd, L.C., 1987. Taphonomy of the Horner II bone bed. In: Frison, G.C., Todd, L.C. (Eds.) The
Horner Site: The Type Site of the Cody Cultural Complex. Academic Press, Orlando, FL,
pp. 107–198.
Turner, E., 2002. Analyse archéozoologique des restes de faune magdaléniens de Solutré
(Secteurs I11 et P16). In: J. Combier, A. Montet-White (Eds.), Solutré 1968-1998,
Société Préhistorique Française Mémoire 30, pp. 197–217.
van Vliet-Lanoë, B., 1985. Frost effects in soils. In: J. Boardman (Ed.) Soils and Quaternary
Landscape Evolution. John Wiley & Sons, Chichester, pp. 117–158.
van Vliet-Lanoë, B., 2010. Frost Action. In: G. Stoops, V. Marcelino and F. Mees (Eds.)
Interpretation of Micromorphological Features of Soils and Regoliths. Elsevier,
Amsterdam, pp. 81–108.
REVISED DRAFT: 19 May 2013
16
Weninger, B., Jöris, O. 2008. A 14
C calibration curve for the last 60 ka: the Greenland-Hulu
U/Th timescale and its impact on understanding the Middle to Upper Paleolithic
transition in western Eurasia. Journal of Human Evolution 55, 772–781.
Figure Captions
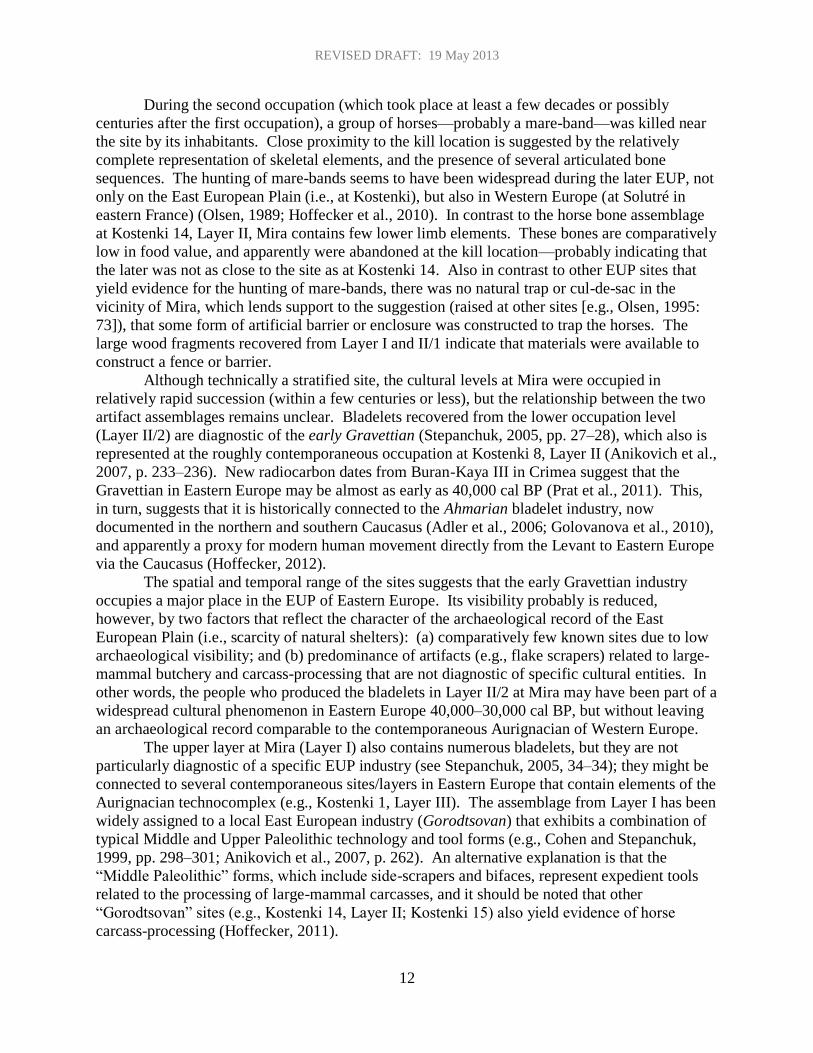
Figure 1. Map of Eastern Europe, showing the location of Mira and other major EUP sites in the
region.
Figure 2. Satellite image of the Mira site and immediate setting (source: Google Maps).
Figure 3. Occupation floor of EUP Layer I. Key: 1 - 1995–1996 excavations; 2 - features (pits,
postholes, hearths); 3 - charcoal and ash concentration; 4 - bones; 5 - lithics; 6 - wood charcoal
(from V.N. Stepanchuk).
Figure 4. The Second Terrace of the Dnepr River at the location of the Mira site. Numbers refer
to portions of the stratigraphic sequence depicted in specific figures (5a = see Figure 5a; 5b = see
Figure 5b; 6 = see Figure 6) (photograph by JFH, August 2012).
Figure 5. Stratigraphic profile at the Mira site: (a) upper portion of sequence to a depth of 650
cm below modern surface; (b) lower portion of sequence between 650 and 950 cm below modern
surface. Numbers refer to depth in centimeters. Letters refer to soil horizons (e.g., Ab) and
Pedocomplex (PK). OSL ages are given for the upper portion of the sequence on the right of 5a
(photographs by JFH, August 2012).
Figure 6. The Upper Paleolithic occupation layers at Mira. Layer numbers refer to
archaeological, not lithological, units (photograph by VNS, August 2012).
Figure 7. Soil micromorphology of the sediments containing Upper Paleolithic occupation Layer
I at Mira: (a) banded fabric with partially rounded aggregates produced by ice (PPL); (b) band of
charcoal with silty clay capping, also an ice-related feature (PPL) (photographs by PG,
December 2012).
Figure 8. Wood fragments recovered from Layer I (photograph by VNS, August 2012).
Figure 9. Horse remains from Layer I: (a) small bone fragment illustrating ventral surface of
cone fracture; (b) probable stone tool cut marks on a tibia shaft fragment (photographs by JFH,
November 2012).
Figure 10. The Third Terrace of the Dnepr River (west bank), photographed at a location
approximately 5 km southwest of the Mira site on the modern surface of the Second Terrace, to
illustrate the width of the floodplain at the time of occupation (~32,000 cal BP) (photograph by
JFH, August 2012).
1
Table 1. Stratigraphic profile for Mira, recorded in August 2012 (V. T. Holliday)
Depth, cm Bench Soil
Horizon PH
strat Description/comments
0-15 1 A 1 Sandy Loess; 10YR 4/3 slightly moist; very weak subangular
blocky; clear
15-50 1 C 2 Sandy Loess; 10YR 4/4 slightly moist, very weak subangular
blocky; very irregular, mixed boundary (due to bioturbation)
50-68 1 Ab 3 Sandy Loess; 10YR 3/2 slightly moist; very weak subangular
blocky; krotovinas common; very irregular, mixed boundary
68~120 1 -
91cm 2
Cb 4 Sandy Loess; 10YR 4/4 & 3/2 slightly moist; very weak subangular
blocky; mixed; common krotovinas below ~95 cm
~120~148 2 A1b 5 Sandy Loess; 10YR 3/1 slightly moist; very weak subangular
blocky; mixed; common krotovinas; very irregular boundary
~148-166 2 A2b 5 Sandy Loess; 10YR 4/3 slightly moist; very weakly subangular
blocky; some krotovinas; single 1-2mm discontinuous clay band;
irregular boundary
166-240 2 -
185cm 3
Cb 6,7 Sandy Loess; 10YR 4/3 slightly moist, 4/4 dry; massive; wavy 1-
2mm continuous clay band ~200cm; wavy, distinct 2-3mm clay band
~220cm; abrupt, wavy boundary.
Note: PH has lower stratigraphic break at ~200cm and very wavy;
perhaps a clay band?
240-325 3 -
290cm 4
Pedo
complex 8 Four distinct buried soils: A/Bt (240-247); Bt (261-266, 285-
295); Bw (310-325); A = 10YR 5/2.5 dry, sandy clay loam; Bt, Bw
= 5/4 dry, sandy clay loam; C = 10YR 6/3 dry, fine sandy loam;
Bt = fine prismatic & fine subangular blocky; thin clay films on
ped faces; krotovinas common; all boundaries = clear, wavy.
325-350 4 11? Laminated silt; 10YR 7/3, 6/3, 6/4 slightly moist; abrupt
boundary
2
350~385 4 -
352cm 5
13 Massive fine sand; 10YR 6/4 slightly moist; few krotovinas below
350 cm
~385-430 5 13? As above, but large, common krotovinas
430-475 5 Pedo
complex 14,
15? Zones of calcareous & non-calcareous fine sandy loam (dipping to
the east): Bk (430-437 cm, 445-452 cm, 465-475 cm) = 10YR 7/2
dry; weak subangular blocky; common, fine threads & bodies
carbonate; non-calcareous fine sandy loam, 10YR 7/3 dry; clear
boundary
475-535 5 15? Non-calcareous fine sandy loam, 10YR 7/3 dry; thin, weak
carbonate bodies at 503, 509 cm; 2-3 distinct zones of carbonate
on west wall of bench; clear boundary
535-575 5 -
553cm 6
16? Massive, non-calcareous fine sand; 10YR 5.5/3 slightly moist;
clear, smooth boundary
575-598 6 Pedo
complex 16 Multiple (~12) weak A-C soils; A = 10YR 4.5/3 slightly moist; C
= 10YR 5.5/3 slightly moist; abrupt, irregular erosional contact
598-605 6 -
606cm ? Massive fine sand; 10YR 7/2 slightly moist; irregular, mixed
boundary
605-622 7 Ab 17 Fine sand, 10YR 6.5/1 slightly moist; very weak subangular
blocky; irregular, mixed boundary; this soil and overlying white
sand cut out to the east; probably same unconformity noted at
598 cm in main section
622-651 7 Massive fine sand; 10YR 7/2 slightly moist; clear, wavy boundary
651-706 7 Upper Fe-ox zone in olive fine sandy loam matrix; Fe-ox
concretions are vertical, dense, up to 2 cm wide, and up to 5 cm
long; each more or less tapering with depth; clear boundary
706-720 7 Massive fine sand, 10YR 7/2 slightly moist; clear, wavy boundary
~720~770 7 -
731cm Lower Fe-ox zone (same color and morphology as upper Fe-ox zone)
in olive gray fine sandy loam matrix
3
8
~770~785 8 Massive fine sand, 10YR 7/2 slightly moist; clear wavy boundary
~785-881 8 -
791cm 9
Laminated sand, 10YR 8/2 & 7/2 dry; clear, horizontal boundary
881-891 9-
891cm Laminated sand, 2.5Y 7/4 dry; upper boundary cross cuts Fe-ox;
abrupt, horizontal boundary
891-896 10 Two laminae of “green clay” loamy fine sand (fine sand with
silt), 2.5Y 6/2d 4/2 slightly moist; common Fe-ox stains
(following roots?); massive; separated by clean sand, 10YR 8/2 &
7/2 dry; bands are horizontal but somewhat wavy with abrupt,
irregular (bioturbated?) boundaries
896-925 10 Bedded, somewhat wavy fine sand 10YR 8/2 & 7/2 dry, with rare
vertical Fe-ox stains; abrupt, irregular (bioturbated?)
boundary.
925-941 10 Bedded fine sand 10YR 8/2 & 7/2d with six lenses of loamy fine
sand “green clay” 2.5Y 6/2d 4/2 slightly moist, each 3-5 cm
thick; bands are horizontal, but somewhat wavy with abrupt,
irregular (bioturbated?) boundaries, locally bifurcating and
rejoining
945-956 10 Laminated loamy fine sand “green clay” 2.5Y 6/2 dry 4/2 slightly
moist with a few sand lenses; bands are horizontal but somewhat
wavy with abrupt, irregular (bioturbated?) boundaries
956~958 10-
958cm Fine sand, 10YR 7.5/2 dry; discontinuous; thins irregularly to
the northernmost excavation block; locally missing; abrupt,
irregular boundaries (bioturbation?)
~958~973
Agb? Uppermost “gray/green clay” (fine sandy clay); varies 15-18 cm
thick; massive; common irregular, tabular bodies of fine sand
~7.5YR 7/2 dry, with very irregular (mixed?) boundaries
throughout upper half; upper 6-8 cm light gray 2.5Y 6/2 dry;
upper few cm locally darker (mixing from gray clay above? weak A
horizon?); below is a distinct Fe-ox zone ~8 cm thick, but
4
locally as thin as 3 cm, 7.5YR 4/6, 5/6 dry, most pervasive and
distinctive in upper 1-2 cm, most of the rest of the Fe-ox zone
is not as pervasive with gray showing through and mostly 10YR
6/8, 5/8 dry, fading with depth; in plan view, in the south
excavation block exposing the top of the Fe-ox zone, the
distinct 7.5YR zones are localized as isolated bodies or lining
pockets of white sand; most of the Fe-ox is 10YR; in the
northernmost excavation block, the Fe-ox zone is more pervasive,
2.5Y 6/8 moist, with bodies 7.5YR 5/6 4/6 moist; the lower part
of this “gray clay” is lighter gray 10YR 6/1 dry, 5/1 moist;
very irregular, abrupt lower boundary where sand is present
below; otherwise clear, smooth, generally horizontal boundary
with lower clay
Note: isolated flakes in this unit
~973~975 Fine sand, 10YR 7.5/2; up to 8 cm thick (in south excavation
area), thins to north and appears as localized lenses; very
irregular, abrupt upper and lower boundaries (bioturbation?)
~975~1005 Agb? Lower “gray/green clay” (fine sandy clay); mostly 10YR 5/2, 5/3
slightly moist; massive; upper 10 cm has discontinuous, roughly
horizontal Fe-ox zones; common, discontinuous pockets of sand
below occupation Layer II/1, along with some of the Fe-ox;
clear, roughly horizontal, but irregular boundary
Note: Upper Paleolithic occupation Layer I and Layer II/2 in top
and bottom of this lower “gray clay zone,” respectively.
~1005~1023 Pale tan medium sand, 10YR 7/3 slightly moist; massive; gradual
boundary ~1020~1023 cm into underlying sand
~1023~1025 White fine Sand, 10YR 7/2 slightly moist; massive; mixed
boundary
~1025~1030 Bioturbated olive sand, 2.5Y 6/3 slightly moist; mixed boundary
~1030~1048 White fine sand, 10YR 7/2 slightly moist with faint olive zone
2.5Y 6/2 slightly moist, ~1038~1045 cm
5
~1048~1065 White fine sand with distinct Fe-ox zones; horizontally bedded
~1065~1075 Fine sand with pervasive Fe-ox coloration; pale tan sand lenses
become more common with depth; horizontally bedded
~1075~1086 Medium sand with some Fe-ox following bedding and common
irregular Fe-ox bodies; horizontal bedding; gradational boundary
~1085~1110 White medium sand, massive
~1110~1155 White medium sand; massive with few Fe-ox bodies and rare Mn-ox
bodies
Notes:
Depth following a Bench number is the depth of that bench below surface.
Bench 10 is top of narrow excavation block running N-S along W wall of North Block excavations.
PH strat = stratigraphic units defined by Paul Haesaerts and N. Gerasimenko (see Stepanchuk, 2005, fig. 2)
Fe-ox = iron oxides; Mn-ox = manganese oxides.
6
Table 2. Radiocarbon dates from Mira: 1997–2001 excavations (adapted from Stepanchuk, 2005, p. 26, Table 1).
__________________________________________________________________________________
Lab No. Layer Material 14
C age calibrated age1
__________________________________________________________________________________
Ki-8152 Layer I wood charcoal 27,600 ± 370 yrs BP 32,262 ± 365 calBP
Ki-8153a Layer I wood charcoal 27,200 ± 380 yrs BP 31,904 ± 290 calBP
Ki-8154 Layer I wood charcoal 27,300 ± 390 yrs BP 32,009 ± 316 calBP
Ki-8158 Layer I bone 27,050 ± 350 yrs BP 31,752 ± 273 calBP
Ki-10283 Layer I bone 26,610 ± 400 yrs BP 31,288 ± 441 calBP
Ki-10284 Layer I wood charcoal 27,080 ± 400 yrs BP 31,765 ± 324 calBP
Ki-8381 Layer I soil organics 28,450 ± 1100 yrs BP 32,978 ± 909 calBP
GrA-20019 Layer I wood charcoal 26,590 ± 490/460 yrs BP 31,266 ± 481 calBP
Ki-8155 Layer II/1 wood charcoal 26,800 ± 390 yrs BP 31,425 ± 430 calBP
Ki-10346 Layer II/1 wood charcoal 27,160 ± 390 yrs BP 31,862 ± 299 calBP
GrA-20020 Layer II/1 wood charcoal 27,830 ± 580/540 yrs BP 32,485 ± 519 calBP
Ki-8156 Layer II/2 wood charcoal 27,200 ± 360 yrs BP 31,903 ± 270 cal BP
Ki-8201 Layer II/2 wood charcoal 27,510 ± 400 yrs BP 32,205 ± 372 calBP
GrA-20033 Layer II/2 wood charcoal 27,750 ± 590/550 yrs BP 32,429 ± 519 calBP
______________________ 1CalPal online quickcal2007 ver 1.5
7
Table 3. Radiocarbon dates from Mira: 2012 (INSTAAR Radiocarbon Laboratory)
_________________________________________________________________________________________________________ Lab No. Layer Material graphite ∂
13 C wrt PDB fraction
14C age calibrated age
1
used modern
_________________________________________________________________________________________________________
CURL-15810 Layer I charcoal 0.56 mg -23.2‰ 0.0379±.001 26,290 ± 220 yrs BP 31,127 ± 367 calBP
CURL-15800 Layer I charcoal 0.63 mg -24.7‰ 0.0324±.001 27,540 ± 260 yrs BP 32,167 ± 280 calBP
CURL-15808 Layer II/1 charcoal 0.37 mg -23.6‰ 0.1791±.0011 13,815 ± 50 yrs BP 17,011 ± 155 calBP
CURL-15795 Layer II/2 charcoal 0.65 mg -24.1‰ 0.033±.001 27,400 ± 260 yrs BP 32,041 ± 231 calBP
CURL-15789 Layer II/2 charcoal 0.28 mg -19.1‰ 0.0567±.0012 23,050 ± 180 yrs BP 27,606 ± 453 calBP
__________________________ 1CalPal online quickcal2007 ver 1.5
8
Table 4. Optically stimulated luminescence ages on quartz grains (150–250 micron) for sediments from Mira (S. L. Forman)
_______________________________________________________________________________________________________________ Lab No. DEPTH Aliquotsa Over- equivalent U Th K H2O Cosmic Dose rate OSL age
Dispersionb dose (Gray)c (ppm)d (ppm)d (%)d (%) dose (yr)f
(%) (mGray/yr)e (mGray/yr)
_____________________________________________________________________________________________________________________________________
UIC3344 1 m 28/30 16±2 18.60±0.83 1.2±0.1 4.6±0.1 1.11±0.01 15±5 0.19±0.02 1.59±0.08 11,710±1000
UIC3342 3 m 28/30 25±4 14.10±0.82 0.5±0.1 1.8±0.1 0.44±0.01 15±5 0.15±0.02 0.70±0.04 20,120±1945
UIC3338 10 m 29/30 19±3 19.16±0.97 0.8±0.1 3.2±0.1 0.71±0.01 15±5 0.08±0.01 0.88±0.04 21,990±1925
UIC3339 10 m 30/30 17±2 23.31±1.05 0.7±0.1 2.6±0.1 0.56±0.01 30±5 0.10±0.01 0.84±0.04 27,665±2430
________________________________________________ aAliquots used in equivalent dose calculations versus original aliquots measured.
bValue reflects precision beyond instrumental errors; value of ≤ 20% (at 2 sigma limits) indicate low dispersion in equivalent dose values and an unimodal
distribution. cEquivalent dose calculated on a pure quartz fraction with about 200-500 grains/aliquot (~2 mm plate area) and analyzed under blue-light excitation.
(470 ± 20 nm) by single aliquot regeneration protocols (Murray and Wintle, 2003). Equivalent dose calculated using the Central Age Model (Galbraith et al,
1999). dU, Th, and K content analyzed by inductively-coupled plasma-mass spectrometry analyzed by Activation Laboratory LTD, Ontario, Canada.
eCosmic dose rate calculated from parameters in Prescott and Hutton (1994).
fSystematic and random errors are included and reported errors are at one sigma; reference year for ages is AD 2000.

9
Table 5. Vertebrate Remains from Mira (O. P. Zhuravlev, P. V. Puchkov, and L. I. Rekovets)
_________________________________________________________________________
Species Layer I Layer II/2 Layer II/2
_________________________________________________________________________
Lepus cf. europaeus (hare) + - -
Ochotona cf. pusilla (pika) + - -
Marmota bobac (marmot) + - -
Myospalax sp. + - -
Lagurus lagurus + - -
Eolagurus luteus + - -
Clethrionomys sp. + - -
Microtus gregalis - - +
Microtus cf. socialis + - -
Microtus oeconomus + - -
Microtus arvalis-socialis + - -
Alopex lagopus + - -
Vulpes vulpes + - -
Vulpes corsac + - -
Meles meles + - -
Mammuthus primigenius (woolly mammoth) + - -
Equus latipes (broad-toed horse) + ? +
Cervus elaphus (red deer) + - -
Megaloceros giganteus (giant Irish elk) + - -
Rangifer tarandus (reindeer) + - -
Bison priscus (steppe bison) + - +
10
Table 6. Comparative Representation of Skeletal Parts for Equus latipes (broad-toed horse) at Mira,
Layer I and Kostenki 14, Layer II (Hoffecker et al., 2010: 1078, table 2).
___________________________________________________________________________________________
Mira-Layer I Kostenki 14-Layer II Skeletal Part NISP MAU %MAU NISP MAU %MAU FUI
cranium 14 ? ? ? ? 8.0
maxilla 12 ? ? ---
mandible 44 2.0 36 44 6.5 46.4 3.3
hyoid 1 0.5 9 1 1.0 0.7 ---
atlas 2 2.0 36 ? --- axis 0 0.0 0 ? ---
vertebrae 7 ? ? ? ? ---
ribs 37 ? ? ~250 ? ---
lumbar vertebrae 0 0.0 0 ? ? ---
caudal vertebrae 2 1.0 18 ? ? --- scapula 7 2.5 45.5 51 11.5 82.1 6.7
humerus-proximal 5 2.5 45.5 12 3.0 21.4 6.7
humerus-distal 2 1.0 18 27 11.0 78.6 6.3
radius-proximal 8 4.0 72.7 22 8.5 60.7 3.9
radius-distal 2 1.0 18 21 10.0 71.4 2.7
ulna 4 2.0 36 16 7.5 53.6 3.9 carpals 14 1.5 27 111 -- -- 1.4
metacarpal-proximal 2 1.0 18 18 8.5 60.7 0.7
metacarpal-distal 4 2.0 36 17 8.5 60.7 0.3
innominate 8 1.0 18 14 2.5 17.9 23.7
femur-proximal 11 5.5 100 12 4.5 32.1 20.3 femur-distal 6 3.0 54.5 11 5.0 35.7 20.3
patella 3 1.5 27 21 10.5 75.0 ---
tibia-proximal 3 1.5 27 5 2.5 17.9 11.3
tibia-distal 11 5.5 100 28 14.0 100.0 6.8
calcaneus 1 0.5 9 20 10.0 71.4 3.4
astragalus 1 0.5 9 20 10.0 71.4 3.4 tarsals 9 0.5 9 87 -- -- 3.4
metatarsal-proximal 1 0.5 9 26 10.0 71.4 1.7
metatarsal-distal 2 1.0 18 17 8.5 60.7 0.8
phalanx 1 6 1.25 22.7 39 9.8 70.0 0.4
phalanx 2 7 1.5 27 44 11.0 78.6 0.4
phalanx 3 4 1.0 18 37 9.3 66.4 0.4 sesamoid 1 -- -- ? --- NISP = Number of Identified Specimens; MAU = Minimum Animal Units
%MAU = percentage of largest MAU value in assemblage; FUI = Food Utility Index (see Outram and Rowley-Conway 1998: 845, table 6)

Mira
Kostenki
Sungir’
Molodova
Buran-Kaya III
Mezmaiskaya
Cave
Biryuch’ya
balka
Caucasus Mtns
BLACK SEA
EAST EUROPEAN PLAIN
Figure 1

SITE
Second Terrace First Terrace
Glubokii Yar
DNEPR RIVER
Figure 2
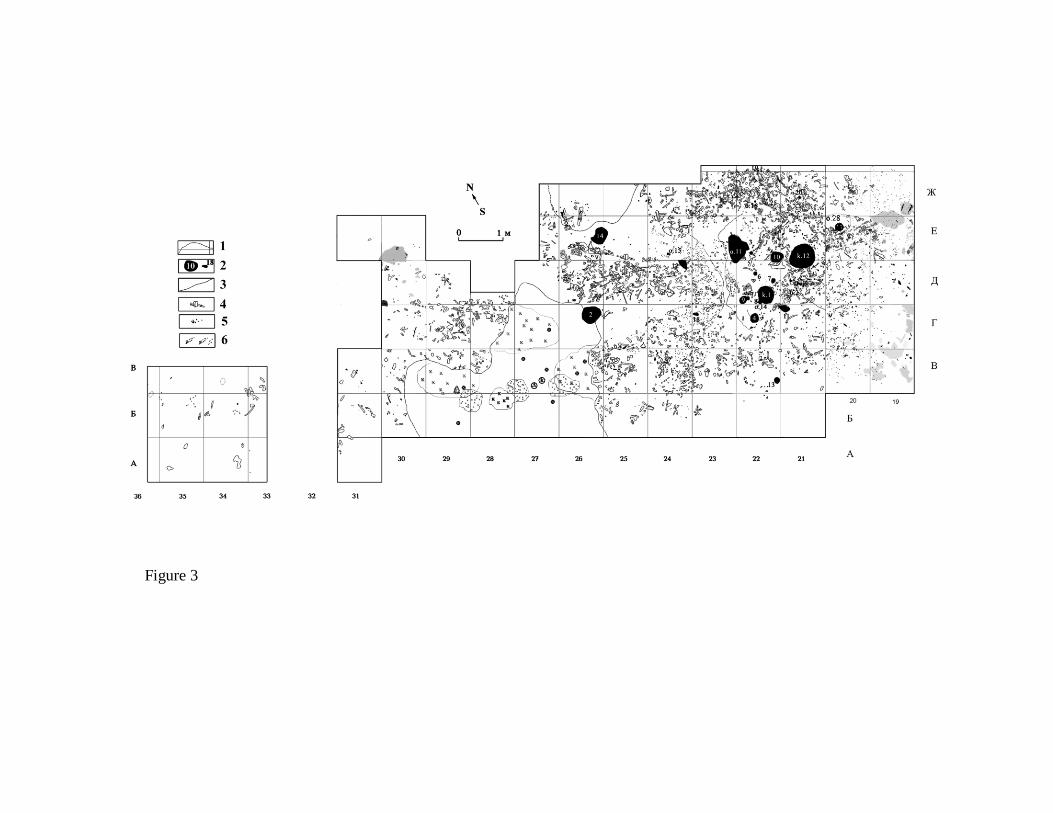
Figure 3

Figure 4

Figure 5a Figure 5b
11,710 ± 1000 yr
OSL age
20,120 ± 1945 yr
STRATIGRAPHY STRATIGRAPHY
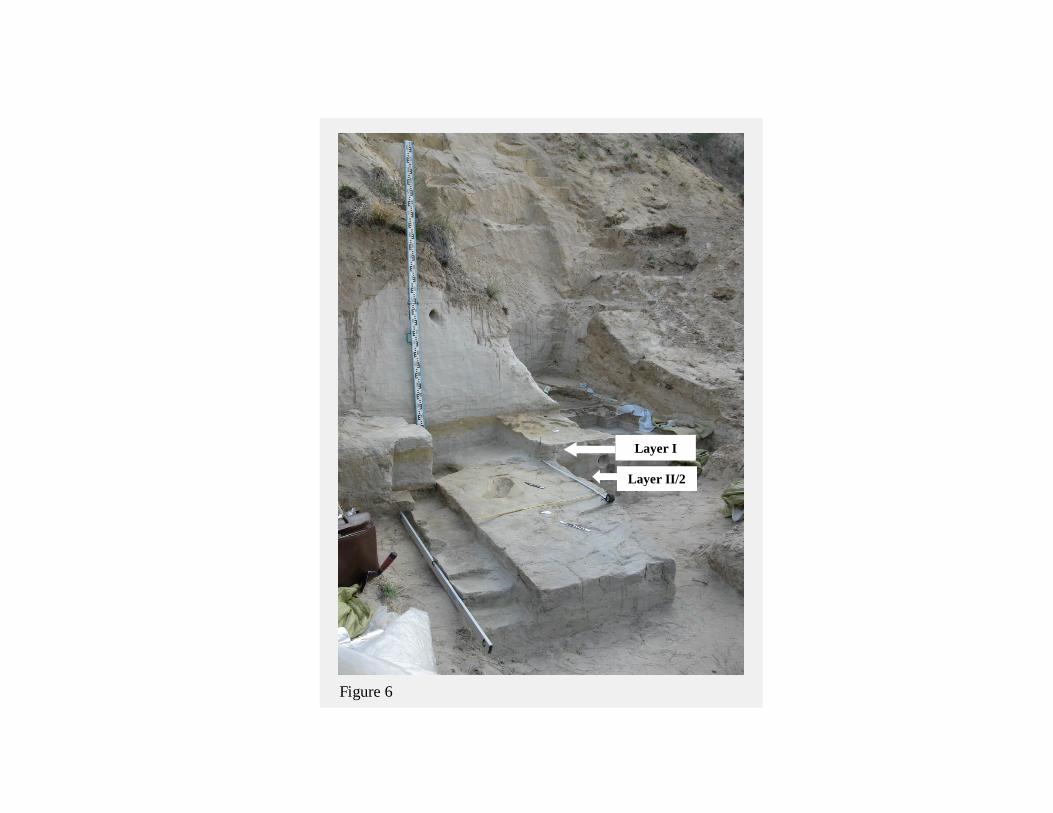
Figure 6
Layer I
Layer II/2
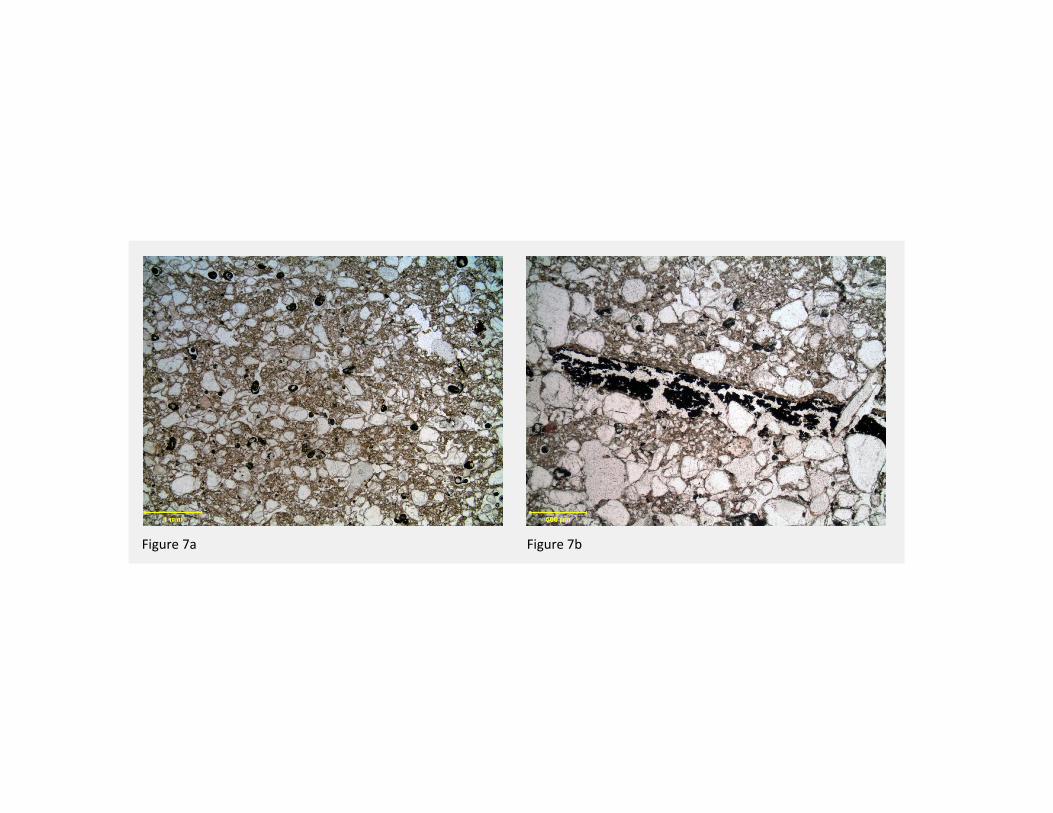
Figure 7a Figure 7b
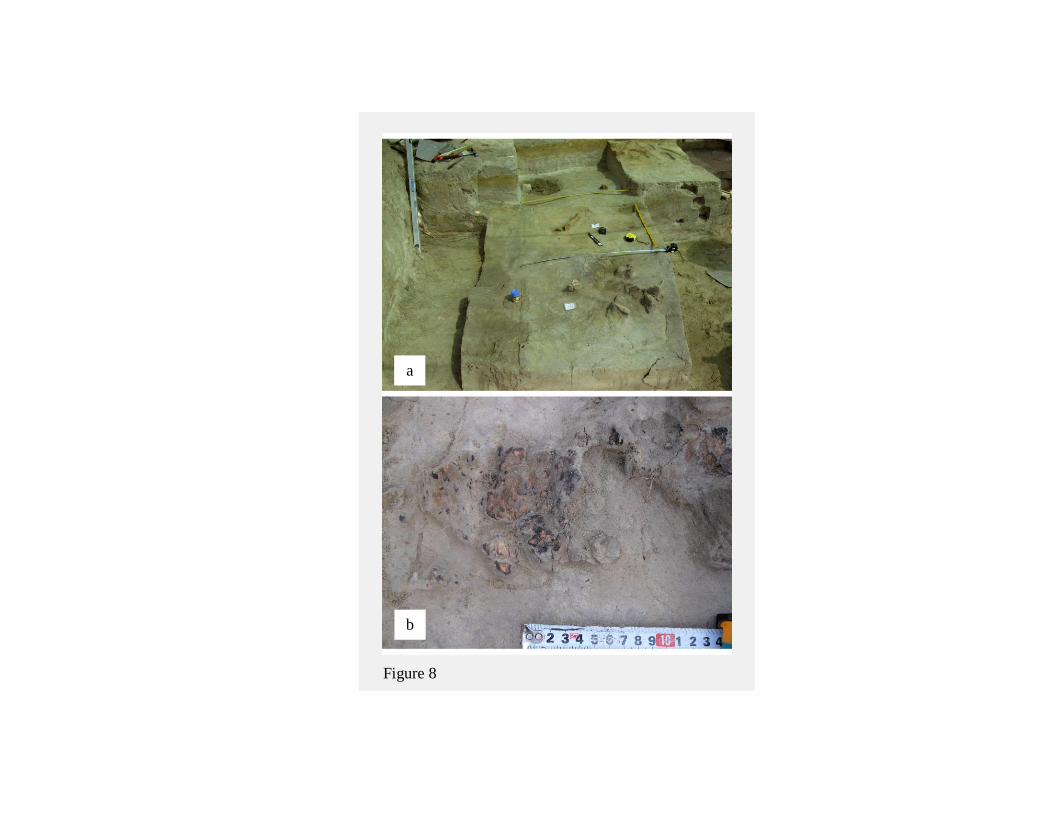
Figure 8
a
b
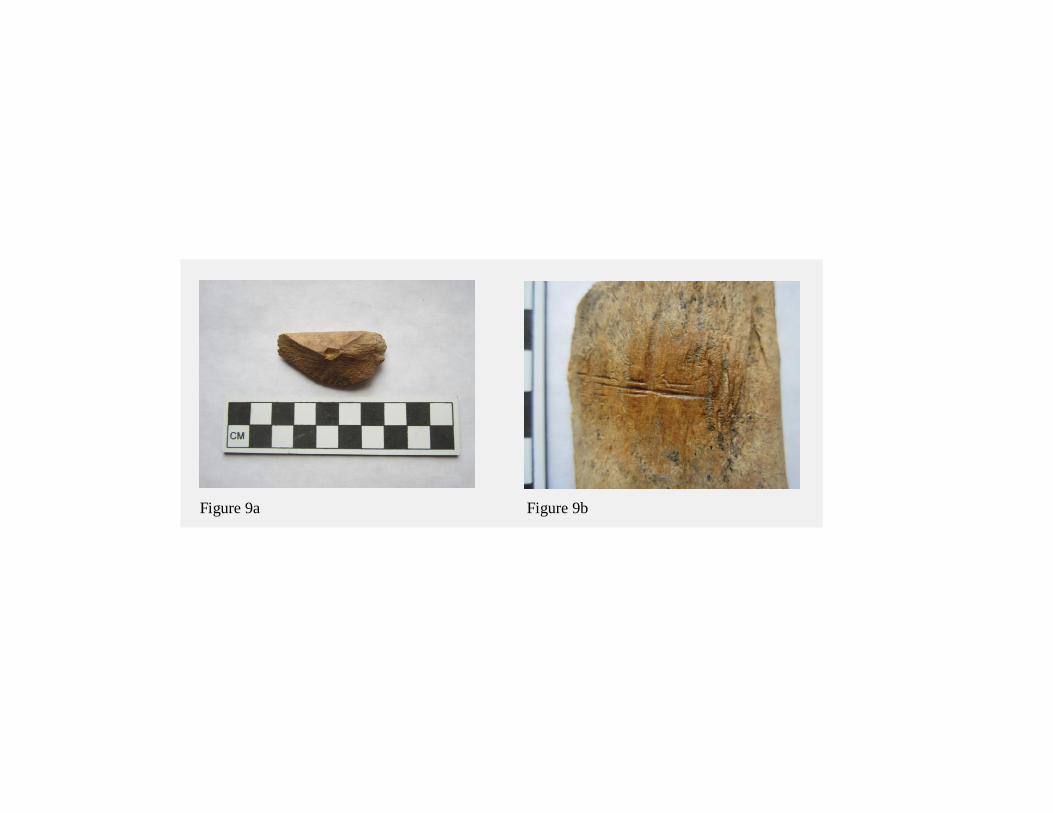
Figure 9a Figure 9b
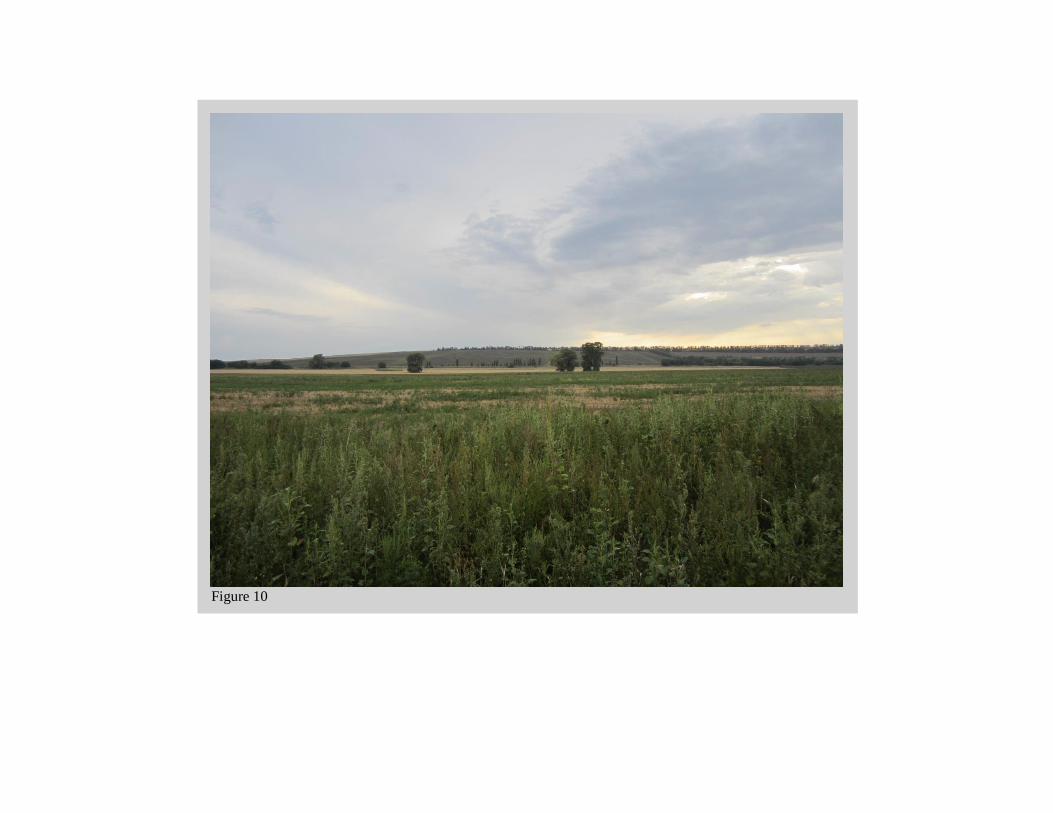
Figure 10