Embed Size (px)
Citation preview

Geo-Spatial Investigation of California Coastal Commission Permit
Decisions: LA County from 1996-2014
Summer Research Project Coordinated by The Bill Lane Center for the American West
Prepared by: Aaron Peterson (Earth Systems Co-term) Brittany Rymer (Earth Systems Co-term) Marveliz Santos (CEE Undergraduate)
1
Acknowledgements: This research was made possible through the help and support of: Bruce Cain and Iris Hui whose expert guidance throughout the course of the summer research made this report possible. Chau Ho, whose administrative assistance proved invaluable over the course of the project. The Stanford Geospatial Center, whose technical assistance and GIS facilities were invaluable! Without the Center’s physical resources and extensive guidance on our many technical GIS questions, this project would not have been possible. Meg Caldwell, Executive Director of the Center for Oceans Solutions and former Commissioner; Joan Lane and the Bill Lane family; Joe Bodovitz, former Executive Director of the CCC; and Clem Shute, former attorney for the CCC who provided the context and insight needed to embark on this 10-week journey.
I. Introduction II. Origin and Function of the CCC
i. Establishment of the CCC ii. Area of Jurisdiction iii. Board Composition and Meetings iv. Administrative Capacities
III. Project Methodology i. Selection of LA County ii. Obtaining and Cleaning Permit Data iii. Obtaining Additional Data Sources iv. Analysis in ArcMap v. Analysis in ArcScene
IV. Results and Limitations i. Early Development in LA County ii. Permit Acceptance Rates from 1996-2014 iii. Geographic Variation of Permit Acceptance Rates iv. Geographic Variation of Permit Types v. Permit Acceptance Rates and Median Income vi. Permit Acceptance Rates and Sea Level Rise vii. Project Limitations
V. Discussion and Policy Recommendations i. Geographic Distribution ii. Income and Distribution
2

iii. Climate Change
I. Introduction The California Coastal Commission (CCC) monitors and regulates land use
within California’s coastal zone. Since its formation in 1972, the CCC has processed thousands of development applications across the state. Consequently, the CCC has played an influential role in shaping the present form and function of California’s coastline.
While the CCC’s guiding principles in directing coastal development have remained consistent, its focus and real-world impact have changed significantly over time. The CCC’s geographic impact on coastal development is also non-uniform. This variability might reflect the CCC’s process of continual adaptation to a regulatory ecosystem confronted by unique challenges beyond those initially envisioned during its creation, such as climate change, new patterns of development, new legal frameworks regulating land use, and new methods of energy extraction like fracking. Variability might also reflect conscious or unconscious preferencing of certain types of development or development in certain economically privileged or underprivileged areas.
Since the CCC occupies such a potentially influential role, spatial and temporal trends in the approval and denial of development applications might have a substantial and diverse impact on Californians’ relationship with the coast. A small number of studies have looked at the effect of the CCC on housing prices and gentrification;1
however, few have explored the CCC’s impact on the built environment, and none have looked specifically at variability in approval rate as evidence that the CCC might have a disparate impact on coastal landowners and users based on geography, wealth, or type of development being sought.
This paper seeks to explore temporal and geographic impacts of the CCC. The CCC’s development permit decisions for Los Angeles (LA) county from 1996-2014 were batch-processed and analysed in ArcGIS. By spatially positioning all of the CCC’s recent development decisions for LA county, we identified trends in approval distribution as well as changes in approval tendencies over time. Additionally, we explored the relationship between the CCC’s permit approvals and projected sea level rise within LA county.
Batch-processing and geographically analysing CCC permit decisions have great potential to create a more holistic understanding of the CCC’s impact on the California coast. While this paper looks specifically at recent development in LA county, the same
1 The Housing Market Effects of Discrete Land Use Regulations: Evidence from the California Coastal Boundary Zone. (2010, August). Retrieved August 12, 2014 from http://164.67.163.139/Documents/areas/ctr/ziman/2010-08.pdf
3

methodology could be applied to other geographic areas of the coastline and/or other temporal selections.
II. Origin and Function of the CCC
i. Establishment of the CCC The California Coastal Commission was established in 1972 by Proposition 20, a California voter initiative. The CCC was made permanent in 1976 by the adaptation of the California Coastal Act of 1976 . The Coastal Act establishes that the mission of the 2
CCC is to: “Protect, conserve, restore, and enhance environmental and human-based resources of the California coast and ocean for environmentally sustainable and prudent use by current and future generations.” 3
ii. Area of Jurisdiction In order to promote this mission, the CCC plans and regulates land use within the coastal zone. The CA coastal zone varies in width throughout the state. In most urban areas, the coastal zone is only a few hundred feet. In some rural areas, the coastal zone extends up to five miles inland. Across CA, the coastal zone also includes a three-mile wide band of ocean . The CA Coastal Zone extends across California’s entire coastline, 4
with the exception of the San Francisco Bay, where the Bay Conservation and Development commission monitors development . A map of the CA coastal zone is 5
displayed below.
2 California Coastal Commission Program Overview. (2012, January 1). Retrieved August 15, 2014, from http://www.coastal.ca.gov/whoweare.html. 3 Ibid. 4 Ibid. 5 Ibid.
4

Figure 1.
From a quick, statewide view, the CCC’s area of jurisdiction, seems like a uniform strip bordering the California coastline. Yet the CCC’s area of jurisdiction varies according to the population densities along the coast, with greater jurisdiction in areas of least density and vice versa. Given the dramatic changes in density within particular regions of the coastline, the width of the area of jurisdiction is much more varied once one zooms in.
5

figure 2.
6
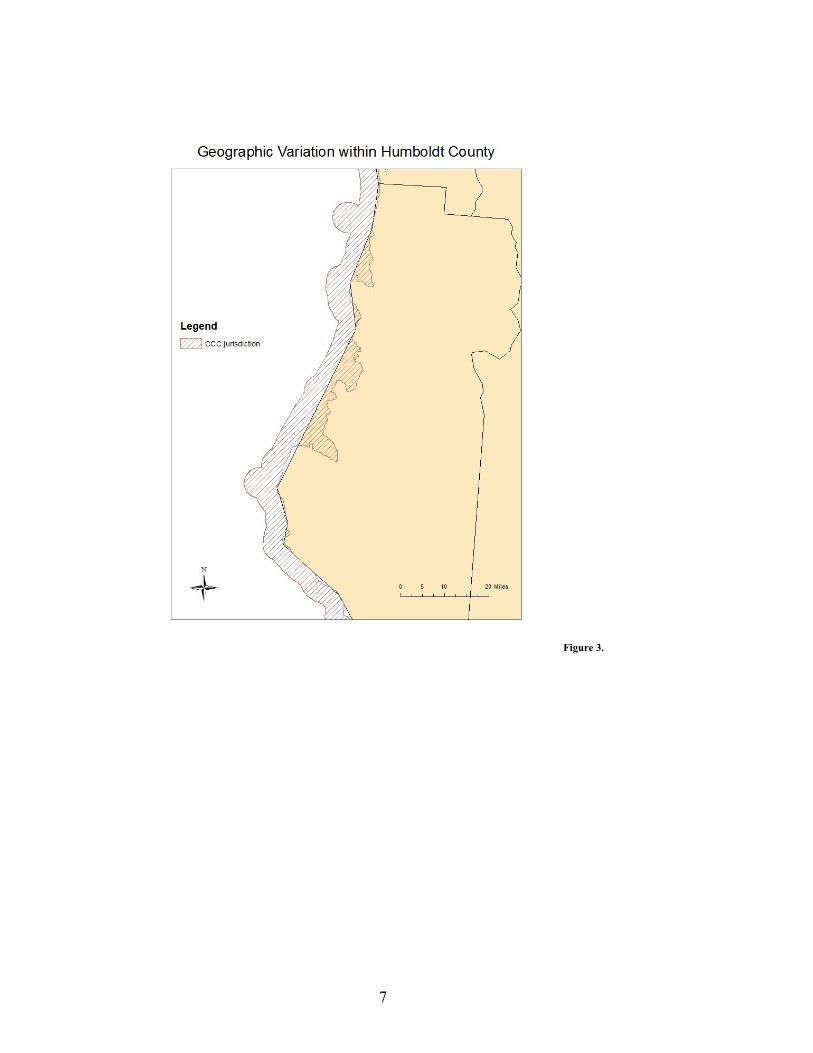
Figure 3.
7

Figure 4.
iii. Board Composition and Meetings Twelve voting members comprise the CCC board. These members are appointed by the Governor, Senate Rules Committee, and Speaker of the Assembly. Six members must be locally elected officials and six are appointed from the public at large. 6
Additionally, there are three non-voting members of the CCC who represent the Resources Agency, California State Transportation Agency, and the State Lands Commission. None of the members receive any form of payment or paid salary for their work. 7
The CCC aims to be as transparent as possible without endangering the goals of its mission. It seeks to have a friendly and cooperative relationship with California residents and the developers involved. In order to facilitate community involvement, the CCC holds public meetings every month in different locations throughout its jurisdiction. The general public is welcome to attend and speak adhering to a time limit set by the speaker. Meetings are streamed live on the internet and stored in a publically accessible online video archive. Documents, exhibits, attachments, and reports that are not available
6 Ibid. 7 Ibid.
8

online are available for inspection at the offices of the Commission during normal business hours. Electronic notification of the publication of the monthly meeting agenda is also available via email.
iv. Administrative Capacities In terms of specific legislative capacities, the Coastal Act requires that all 15
counties and 61 cities located wholly or partially within the coastal zone create a Local Coastal Program (LCP) . LCP’s include land use plans and zoning specifications for the coastal zone. The CCC must approve all LCP’s, LCP amendments, and review LCPs at least every five years. To ensure local compliance with LCPs, the CCC must grant a 8
coastal development permit for all development within the coastal zone. This includes 9
both private development (i.e. home construction, home remodels, hotel construction) and government projects (national park projects, highway improvements, military projects in coastal locations).
III. Project Methodology
i. Selection of LA County While the CCC has played a major role in directing development along the
California coast, it is difficult to measure the CCC’s quantitative impact or document its holistic impacts. Acting through thousands of cases throughout the entire coastal zone for over four decades, the CCC’s impact is both geographically and temporally dispersed.
In order understand the localized impact of the CCC, we decided to limit our analysis to LA county. The parcel and footprint data required for this analysis is held and maintained by individual California counties, and the quality and completeness of that data varies accordingly. For years this type of analysis would have been prohibitively expensive, as counties would charge potential customers hundreds of thousands of dollars to access the data. While Sierra Club v. Orange County affirmed in 2013 that publicly held GIS databases constitute public records and thus “must be produced upon request at the actual cost of duplication,” many countries either do not have a GIS database with 10
parcel and footprint data or keep a database which lacks key category fields, like year built or zoning information. Los Angeles County and San Francisco County were the only two counties for which all desired information could be found; Los Angeles was chosen because its larger size and greater variation in housing density and income level allows for an exploration of CCC impacts across a diverse subgroup of Californians.
8 Ibid. 9 Ibid. 10 Sierra Club v. City of Orange , 163 Cal. App. 4th 523 (Ct. App. 2008).
9

Furthermore, we limited our area of focus to permits processed from January 1996 to June 2014 as this is is the time frame of permits available on the CCC’s website. As a result, our analysis looks at the past 18 years of permit decisions.
ii. Obtaining and Cleaning Permit Data To compile and process the CCC’s influence on the LA county coastal zone, our
team developed a script that retrieves key permit application data from the CCC’s online meeting minutes archive. Information retrieved by this script includes: application ruling (i.e. approved, postponed, or denied), application task, date, applicant name, and location. All applications on file contained either postal addresses or approximate coordinates, allowing us to geocode these files for longitude and latitude coordinates using Google maps. 11
After obtaining geocoded permit information for all of LA county from 1996 to 2014, we cleaned the data. The meeting archives included many cases once denied and later approved, resulting in a number of duplicate addresses with conflicting permit decisions; in these cases the final decision was recorded. Each entry was also given a task type (i.e. new home, home remodel, municipal project, etc.). The data processed by the CCC are not assigned any categorization based on type of development: this classification system was invented for the purposes of this project. Data cleaning also involved deleting repeated entries and manually geocoding any addresses that were not processable through our GoogleMaps approach. After cleaning, we had 3,096 permits for separate development projects processed by the CCC for LA Country from January 1996 - June 2014.
iii. Obtaining Additional Data Sources Our analysis was made possible by the use of four key datasets: building footprint
data for LA county, median income data from the 2010 Census, shapefile map of the CCC boundary, and Sea Level Rise Data along the California Coast.
Building footprint data for LA county was obtained from the LA County GIS Data Portal and merged with parcel data including year of construction, building height, 12
and zoning information. It should also be noted that the Los Angeles County footprint 13
data only covers buildings which were standing as of 2008. Therefore, the figures showing buildings constructed by year in LA County do not include buildings which were subsequently demolished. The cycle of development in LA usually means that demolitions are followed shortly by new construction at the same site, but not always.
11 This data acquisition and organization process was primarily developed by Iris Hui. 12 “Countywide Building Footprints.” (2006-2008). LA County GIS Data Portal. Retrieved June 22, 2014 from http://egis3.lacounty.gov/dataportal/2011/04/28/countywide-building-outlines/ 13 “Los Angeles County Parcel Shapefile” and “Los Angeles County Local Roll.” Mapshare: UCLA’s Spatial Data Repository. Retrieved July 1, 2014. http://gis.ats.ucla.edu/Mapshare/
10

Our group also obtained median income data from the 2010 Census . Per Capita 14
Income data is taken during the US Census every decade. Since the available permit records span 1996-2014, both 2000 and 2010 censuses fall within this time range. However, since census tract boundaries change between censuses, averaging the two values is not possible, so the 2010 census was used. Future research directions might include charting the temporal variations in income level experienced within the coastal zone since the implementation of the CCC. Additionally, census median per capita income data in 2010 was not included for the following census tracts: 980028, 980030, 980033, and 980007.
Additionally, we gathered a shapefile map of the CCC boundary, and Sea Level 15
Rise Data Pacific Institute’s 2009 report on The Impacts of Sea-Level Rise on the California Coast. 16
iv. Analysis in ENVI ArcMap With longitude and latitude information acquired for all cases, we were able to
import an Excel file of all geocoded permit decisions into ArcGIS. Having such data in ArcGIS allowed us to visually review the temporal and geographic distribution of permit decisions. This created a point shapefile with the geographic location of all processed permits in our data set.
14 Household Income for States: 2010 and 2011. (2012, September). Retrieved August 2, 2014, from http://www.census.gov/prod/2012pubs/acsbr11-02.pdf 15Marine Cadastre. Retrieved 3/1/2014. marinecadastre.gov/data/. 16 Pacific Institute: Sea Level Rise Data. (2009, January 1). Retrieved August 15, 2014, from http://www2.pacinst.org/reports/sea_level_rise/data/index.htm
11

Figure 5.
By using Raster Calculator to make selections in the attribute table of this shapefile, we were able to visualize specific subsets of the data (e.g. displaying only residential permits within the permit type field or displaying only denied permits). Having this graphic display allowed us to note likely spatial distribution trends in the data.
12

Figure 6.
Using the clip feature in ArcMap, we cut down our additional data sources (building footprints, median income, and sea level rise projections) to cover only our area of interest. We then used the intersect tool to identify which building footprints align with permit acceptance and denials. For analyzing median income, we used a spatial join to obtain the number of accepted and denied permits within each census tract. Finally, we used the intersect tool once more to identify which buildings would be affected by the Pacific Institute’s sea level rise estimates.
v. Analysis in ArcScene In an effort to better display our data, our team used ArcScene for 3D modeling.
We obtained an elevation layer from the USGS National Elevation Dataset (NED). The 17
NED at large provides basic elevation for mapping application in all of the United States.
17
13

Having the applicable portion of the elevation dataset, we draped the previously acquired LA footprint over the NED dataset.
Figure 7.
Next, we extruded the building footprint layer according to its <<HEIGHT>>
field. This gave us a basic 3D representation of the geography and the overlaying buildings within LA county.
14

Figure 8.
Due to limited time and processing capacity, we selected three geographically
dispersed regions to model in detail. These were the areas surrounding Point Dume, Hermosa Beach, and Marina del Rey. We then added relevant layers to these model including highways, trails, bodies of water, streets, and projected sea level rise.
Finally, we created counterfactual models for these areas of what each area would have looked like if the CCC had not denied any permits. To do this, we used permit specifications in denied application to create a layer of building footprints for denied applications only. Next, we extruded this layer based on height, which was also typically included in the permit application.
IV. Results and Limitations
i. Early Development in LA County Using the Year Build field in our LA County Buildings Footprints layer, we were
able to determine the number of buildings built within LA since 1900. Sorting the data by decade generated the following bar graph.
Figure 9
As can be quickly noted, construction levels were highest from 1940-1959. By the
time the CCC was established in 1974, much of LA had already been densely developed. However, despite this decrease in development level, construction within the CCC’s area
15

of jurisdiction did not stop. Instead, it has remained relatively constant over the past 20 years.
This trend of decreased, but not disappearing, construction levels are mimicked in the 2-mile buffer area extending from the CCC boundary. A graph of this trend is displayed below.
Figure 10.
Development trends within the CCC’s jurisdiction match trends in the immediate vicinity almost identically. These results suggest that the CCC may have less of a dampening effect on development than critics have sometimes argued.
ii. Permit Acceptance Rates from 1996-2014 From 1996-2014, the CCC processed 3096 applications for permits within LA
county. Of these 3096 applications, 2594 were approved and 502 were denied. Consequently, the CCC approved 84% of permit applications for LA county from
16
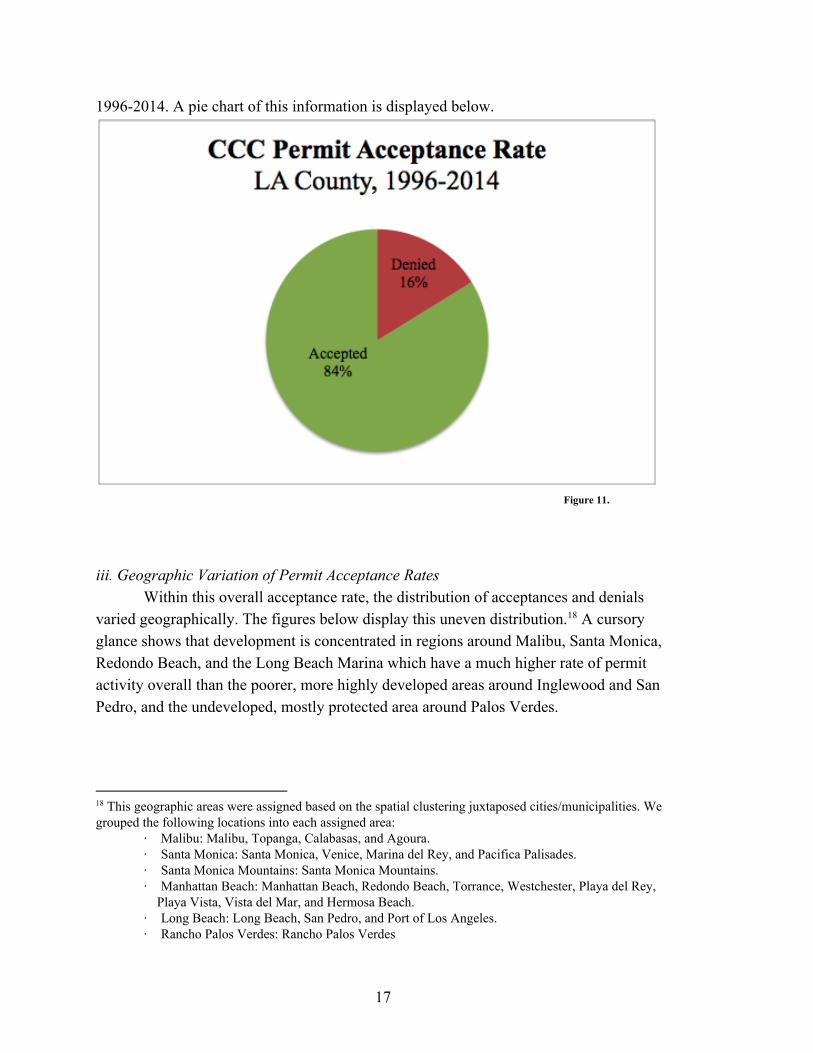
1996-2014. A pie chart of this information is displayed below.
Figure 11.
iii. Geographic Variation of Permit Acceptance Rates Within this overall acceptance rate, the distribution of acceptances and denials
varied geographically. The figures below display this uneven distribution. A cursory 18
glance shows that development is concentrated in regions around Malibu, Santa Monica, Redondo Beach, and the Long Beach Marina which have a much higher rate of permit activity overall than the poorer, more highly developed areas around Inglewood and San Pedro, and the undeveloped, mostly protected area around Palos Verdes.
18 This geographic areas were assigned based on the spatial clustering juxtaposed cities/municipalities. We grouped the following locations into each assigned area:
· Malibu: Malibu, Topanga, Calabasas, and Agoura. · Santa Monica: Santa Monica, Venice, Marina del Rey, and Pacifica Palisades. · Santa Monica Mountains: Santa Monica Mountains. · Manhattan Beach: Manhattan Beach, Redondo Beach, Torrance, Westchester, Playa del Rey, Playa Vista, Vista del Mar, and Hermosa Beach. · Long Beach: Long Beach, San Pedro, and Port of Los Angeles. · Rancho Palos Verdes: Rancho Palos Verdes
17

Figure 12.
18

Figure 13.
The pie charts below display this geographic variation numerically. Manhattan Beach, Long Beach, and many smaller jurisdictions (marked as other) see a proportionately greater share of their permit applications accepted. Malibu, the Santa Monica Mountains, and Santa Monica (and to a less dramatic extent Rancho Palos Verdes) occupy a significantly greater percentage of permit rejections than their share of total permit applications.
19

Figure 14. Figure 15.
iv. Variation by Permit Types Acceptance and denial rates also vary by permit type. Using the task field in the
attribute table of our processed CCC file, we were able to calculate the geographic distribution of different permit types processed by the CCC. These permit types included residential (e.g. new home construction or home renovations), land maintenance (e.g. planting native vegetation or stone wall repair), government (e.g. highway maintenance or streetlight installation), industry (power plant upgrade or mall construction), hotel/hospitality (e.g. new hotel construction), and marina (e.g. installation of new mornings).
As can be seen in the pie graphs below, hotel/hospitality, residential, and land maintenance all occupy a higher percentage of rejected permits than accepted permits; the inverse is true for government projects and marinas. Industry remains constant while government permits are considerably more represented in acceptances than denials.
Figure 16. Figure 17.
As can be seen in the proceeding pie charts, residential permits make up over 50% of both accepted and denied permits. A map showing only accepted residential permits is displayed below.
20

Figure 18
In order to better represent the impact of these acceptances, our group produced
3D visualizations for two of the areas with a high intensity of accepted residential permits. The first area lies along Hermosa Beach. In this area, all permit applications for new development or renovations to residential houses between 1996 and 2014 were approved by the CCC. This counters the prevailing view that the CCC is inherently opposed to coastal development. Of course, these new buildings constitute part of an existing urban infrastructure rather than breaking new previously undeveloped ground.
21

Figure 19.
v. Permit Acceptance Rates and Median Income Looking beyond permit type, our group analyzed the variation of permit
acceptance rates based on median per capita income using 2010 Census data. Maps displaying median income distribution overlaid with permit acceptance and denial rates are displayed below.
22
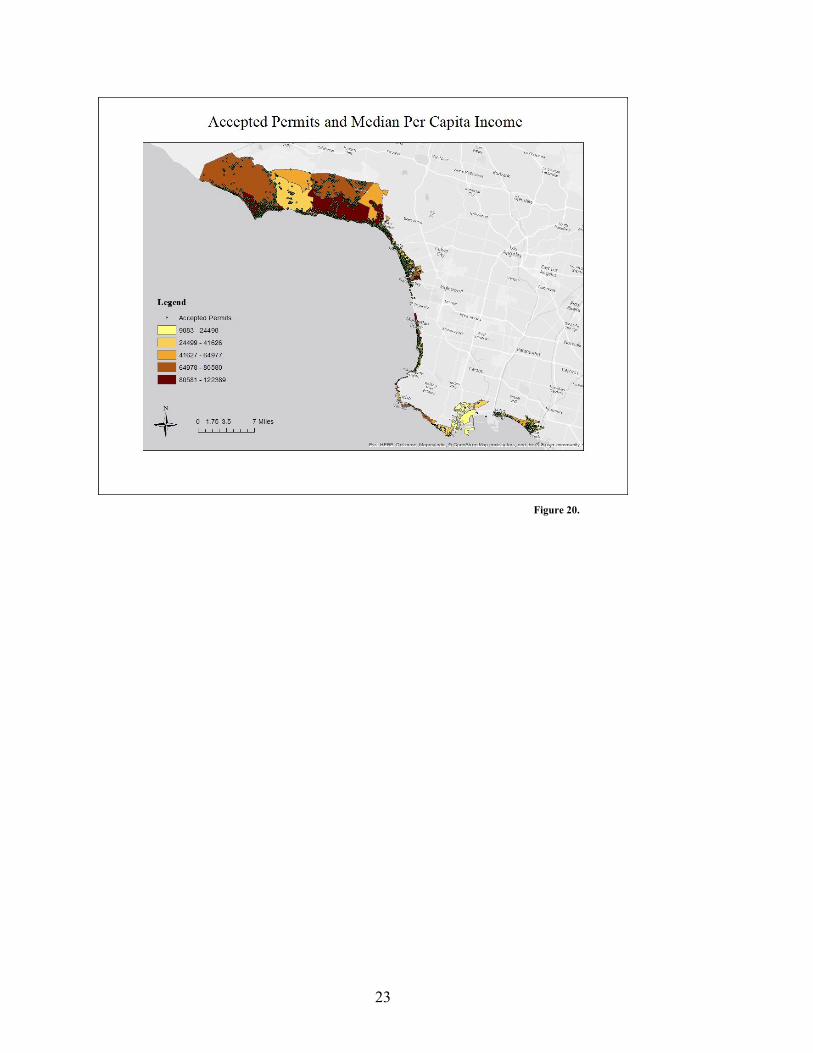
Figure 20.
23

Figure 21.
With this data, we tested for a correlation between the percentage of accepted permits within each Census tract and media per capita income. A graph displaying the results of this test for correlation are displayed below.
24

Figure 22.
As our low R2 value of .00047 indicates, very little of the variation in permit acceptance rates amount Census tracts can be explained by a variation in median per capita income.
vi. Permit Acceptance Rates and Sea Level Rise Finally, our group accessed the distribution of permit acceptance rates in relation
to predicted sea level rise. This analysis was made using the Pacific Institute’s 2009 report on The Impacts of Sea-Level Rise on the California Coast. In this report the 19
Pacific Institute estimates that 480,000 people, a wide range of critical infrastructure, vast areas of wetlands and other natural ecosystems, and nearly $100 billion in property along the California coast are, in their current state, at increased risk from flooding from a 1.4-meter sea-level rise . Estimated sea level rises are generally between .5 and 1.4 20
meters. This is therefore the most extreme of cases. We used the sea level rise map that accompanied this report and overlayed it to our footprints and maps of accepted and denied cases to compare these to the effects of sea-level rise.
The pie charts below displays the percentage of permits processed by the CCC. As can be easily noted, a really small percentage of permits are expected to be impacted by sea level rise.
19 Pacific Institute: Sea Level Rise Data. (2009, January 1). Retrieved August 15, 2014, from http://www2.pacinst.org/reports/sea_level_rise/data/index.htm 20 Ibid.
25
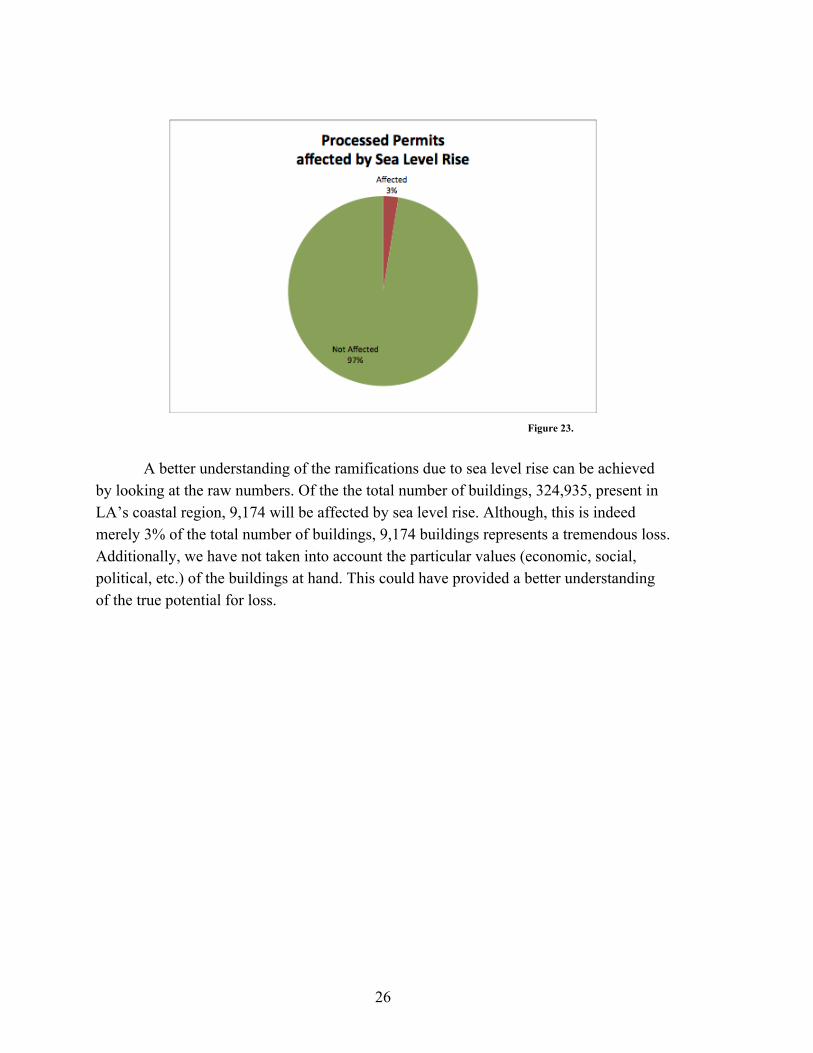
Figure 23.
A better understanding of the ramifications due to sea level rise can be achieved
by looking at the raw numbers. Of the the total number of buildings, 324,935, present in LA’s coastal region, 9,174 will be affected by sea level rise. Although, this is indeed merely 3% of the total number of buildings, 9,174 buildings represents a tremendous loss. Additionally, we have not taken into account the particular values (economic, social, political, etc.) of the buildings at hand. This could have provided a better understanding of the true potential for loss.
26
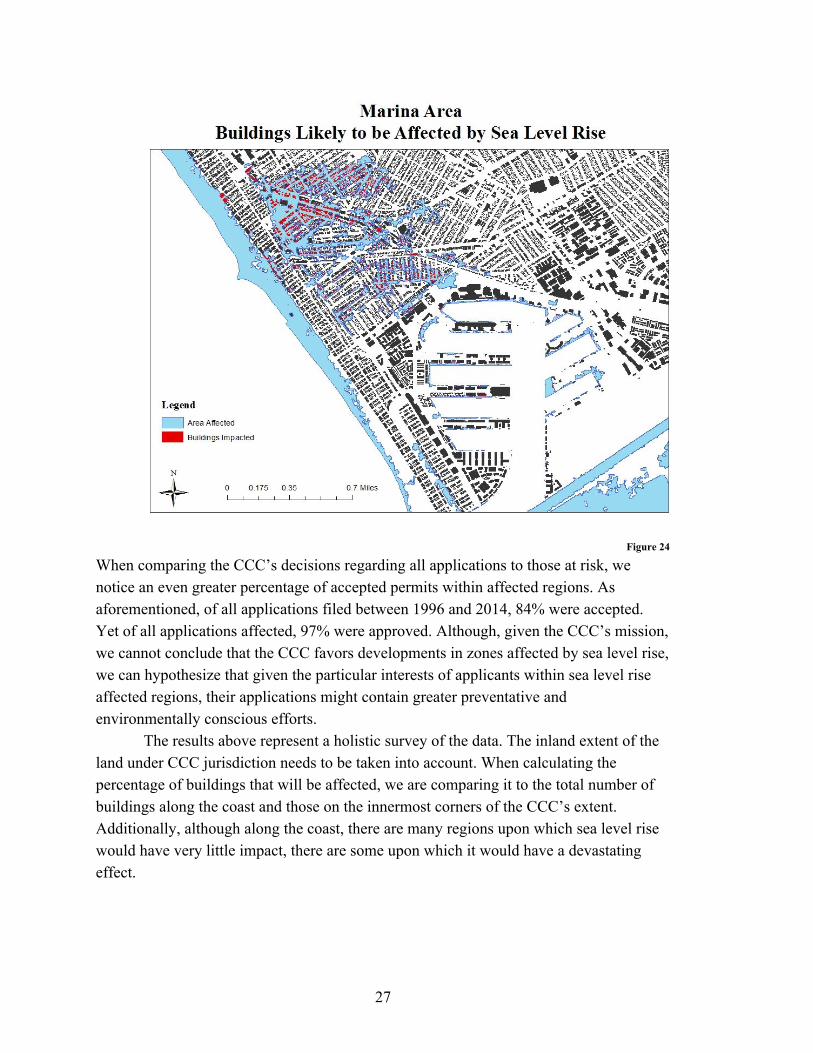
Figure 24
When comparing the CCC’s decisions regarding all applications to those at risk, we notice an even greater percentage of accepted permits within affected regions. As aforementioned, of all applications filed between 1996 and 2014, 84% were accepted. Yet of all applications affected, 97% were approved. Although, given the CCC’s mission, we cannot conclude that the CCC favors developments in zones affected by sea level rise, we can hypothesize that given the particular interests of applicants within sea level rise affected regions, their applications might contain greater preventative and environmentally conscious efforts.
The results above represent a holistic survey of the data. The inland extent of the land under CCC jurisdiction needs to be taken into account. When calculating the percentage of buildings that will be affected, we are comparing it to the total number of buildings along the coast and those on the innermost corners of the CCC’s extent. Additionally, although along the coast, there are many regions upon which sea level rise would have very little impact, there are some upon which it would have a devastating effect.
27
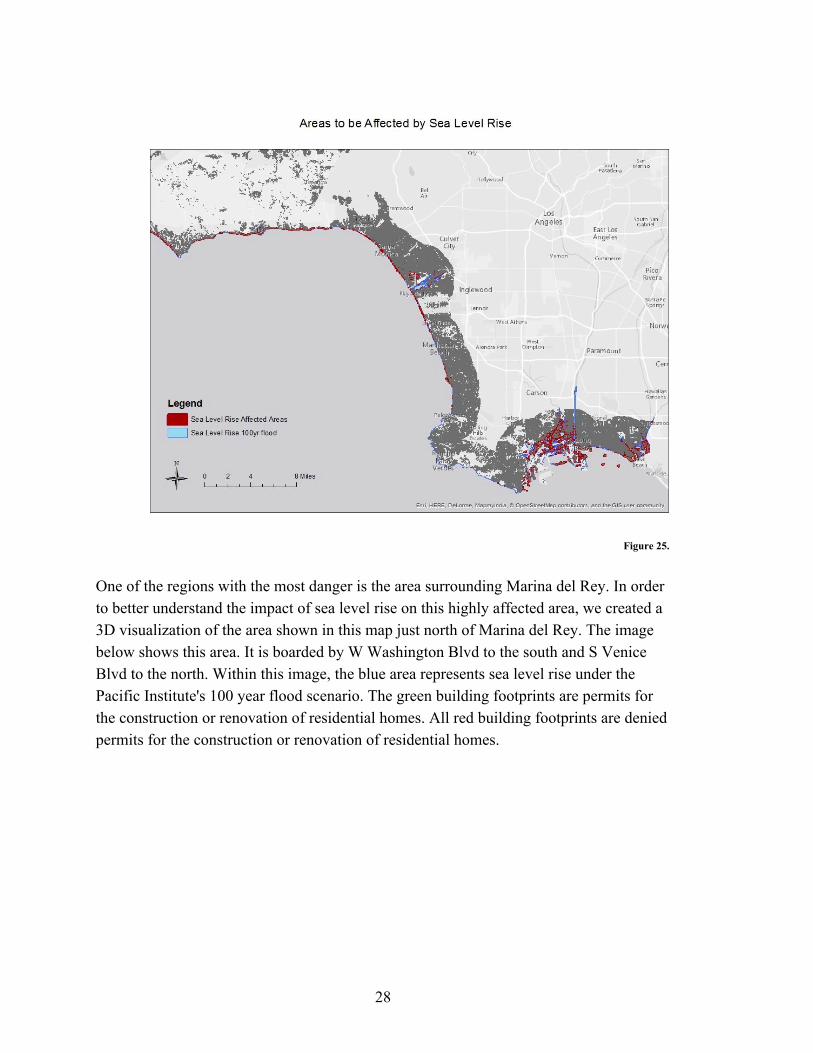
Figure 25.
One of the regions with the most danger is the area surrounding Marina del Rey. In order to better understand the impact of sea level rise on this highly affected area, we created a 3D visualization of the area shown in this map just north of Marina del Rey. The image below shows this area. It is boarded by W Washington Blvd to the south and S Venice Blvd to the north. Within this image, the blue area represents sea level rise under the Pacific Institute's 100 year flood scenario. The green building footprints are permits for the construction or renovation of residential homes. All red building footprints are denied permits for the construction or renovation of residential homes.
28

Figure 26.
The image below shows a zoomed in view for the center of this region.
29

Figure 27.
As can be quickly noted, a large number of approved residential permits are affected under the projected sea level rise conditions. While this impact is more severe in the Marina del Rey area than in most other parts of Los Angeles county, the concentrated effect of sea level rise in some areas is important to note.
V. Discussion and Policy Recommendations
i. Permits by Type, Income, and Geographic Distribution Residential development and remodeling, hotel development and remodeling, and
landscaping exhibit the highest rates of permit application denial, which could stem from several sources. Firstly, government and marina projects - among the most likely to be approved - are also likely to discuss projects with regulatory agencies like the coastal commission before the development process arrives at the permit stage. Government projects that are less likely to be approved are more likely to be dropped earlier so public funds can be saved and energy directed elsewhere, whereas private landowners may have more incentive to advocate for a potentially rejectable project, since they own fewer
30

properties in the first place. For these same reasons, residential projects may be more likely to be out of the scope of LCP or zoning restrictions.
Equally, geographic variations in permit acceptance rate does not signify any inherent bias on the part of the CCC in favor of a particular location. For one, different regions have different types of development, and as demonstrated by Part IV of the results section, some permit types are more commonly rejected than others. The majority of permits in the Long Beach area are for marina and port projects, which have a higher approval rate.
Additionally, Local Coastal Programs regulate the routine granting of permits, and LCPs themselves exhibit a range of guidelines depending on the type of existing development and planned use within the jurisdiction governed. For instance, an area with more open space like Rancho Palos Verdes will have different provisions for undeveloped land than a more developed area like Manhattan Beach. Variation in LCP guidelines may result in certain areas appealing a greater percentage of local permit decisions to the CCC Board, or a greater percentage of applications of lesser quality, which results in more rejections from that region. This said, it may be beneficial for greater research to be conducted on the reasons behind these geographic variations so no charges of bias can be levied against the CCC.
Permit acceptance rate displayed no correlation with per capita income per census district. This result varies slightly from initial expectations; higher income areas were predicted to have a higher rate of rejections since more large private development - characteristic of sprawl - happens in places with wealthier landowners. Given that this is not the case, it might be prudent to examine what type of development is getting approved and rejected within these income districts. However, overall there is no evidence that the Coastal Commission judges permit application appeals in anything other than a just manner.
ii. Climate Change Climate change is an increasingly alarming factor affecting development along
the California coast. According to a survey performed by Stanford’s Center for Ocean Solutions, “an overwhelming majority of Americans want to prepare for global warming-induced sea-level rise and storms” . On the other hand, the CCC is mandated 21
by the Coastal Act to “protect, conserve, restore, and enhance” the state’s coastal resources . Given that the imminent effect of sea level rise is a worry for both parties, 22
CCC and California residents along the coast, we see an opportunity for collaboration in the effort to mitigate the losses due to sea level rise.
21 2013 Stanford Poll on Climate Adaptation. 22 California Coastal Commission Program Overview.
31

The impacts of sea level rise are already altering landscape through coastal erosion, coastal inundation, the intrusion of saltwater into freshwater, and storms and waves. The CCC has, therefore, already made efforts in addressing climate change. In their evaluation of permits, the commission takes into account the possibility of reducing emissions and preparing for potential impacts. A special task force within the Commission staff meets regularly to discuss the climate change issues and planning related topics including green building, smart growth, and adaptation to climate change impacts.
32