Embed Size (px)
Citation preview
1 Introduction
The amount of geographic information available as Linked Open Data (LOD) is rapidly increasing and becoming an invaluable source for application development. The term Linked Data refers to a set of best practices to publish machine-readable and semantically annotated data online [1]. The approach builds on established Web standards for identifying and accessing data sources (URLs), lightweight semantics (RDF) for data description, and a standardized query language for data access (SPARQL). These principles facilitate a distributed and interlinked collection of datasets known as the Linked Data Cloud [3]. Geographic information sources such as GeoNames1 play a central role in this cloud, which is also documented by new datasets from cultural heritage [5], environmental monitoring [6], and emergency response [7], as well as the OGC GeoSPARQL query language [8].
At the same time, software development has transformed towards cloud environments and multi-platform development, especially including mobile devices. New software development platforms and libraries have eased the development of interactive web pages and mobile apps. Examples are web frameworks such as Django,2 online content management systems such as Drupal3 and mobile app platforms such as PhoneGap4 and App Inventor5 [10].
1 http://geonames.org 2 https://www.djangoproject.com 3 http://drupal.org 4 http://phonegap.com 5 http://appinventor.mit.edu
The goal of this paper is to review the process to get from LOD to a working application and put it in the context of the required skillset. We sketch the steps in developing web-based visualizations of humanitarian data (see Figures 1 and 2) and draw conclusions concerning the practical and conceptual skills that need to be covered in a GIScience curriculum for students to be able to complete such a development task.
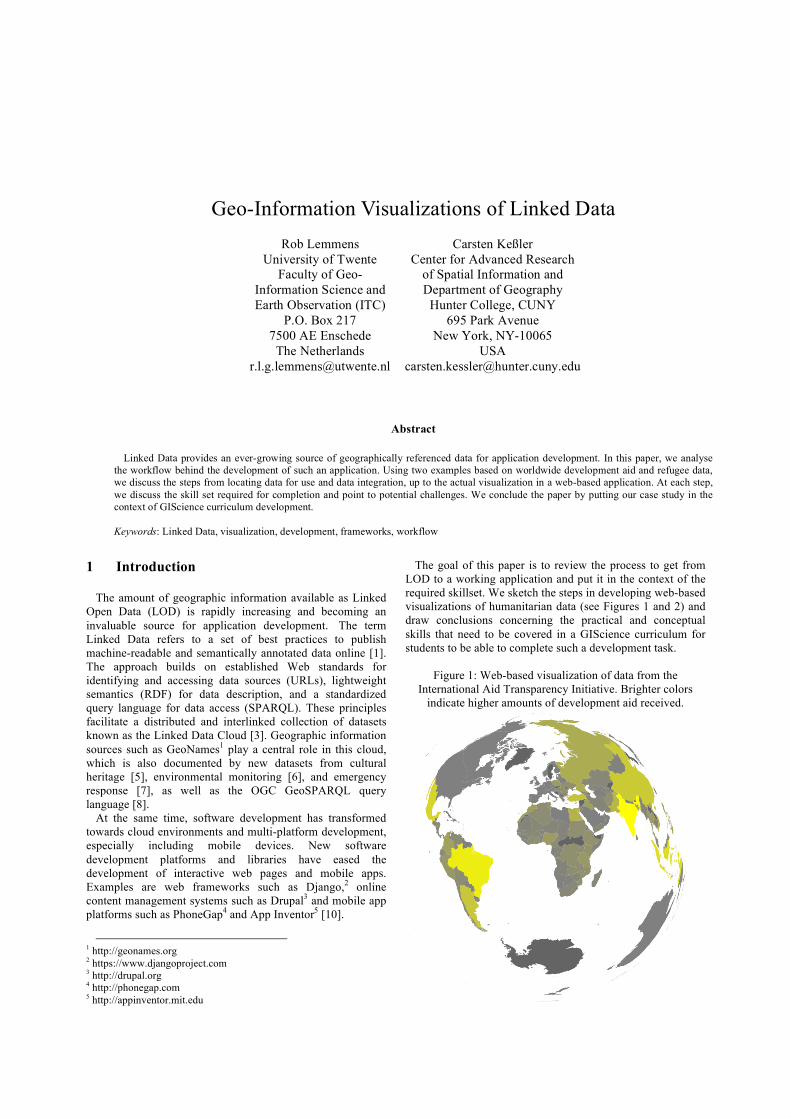
Figure 1: Web-based visualization of data from the International Aid Transparency Initiative. Brighter colors
indicate higher amounts of development aid received.
Geo-Information Visualizations of Linked Data
Rob Lemmens University of Twente
Faculty of Geo-Information Science and Earth Observation (ITC)
P.O. Box 217 7500 AE Enschede
The Netherlands [email protected]
Carsten Keßler Center for Advanced Research
of Spatial Information and Department of Geography
Hunter College, CUNY 695 Park Avenue
New York, NY-10065 USA
Abstract
Linked Data provides an ever-growing source of geographically referenced data for application development. In this paper, we analyse the workflow behind the development of such an application. Using two examples based on worldwide development aid and refugee data, we discuss the steps from locating data for use and data integration, up to the actual visualization in a web-based application. At each step, we discuss the skill set required for completion and point to potential challenges. We conclude the paper by putting our case study in the context of GIScience curriculum development.
Keywords: Linked Data, visualization, development, frameworks, workflow
AGILE 2014 – Castellón, June 3-6, 2014
2 Development workflow
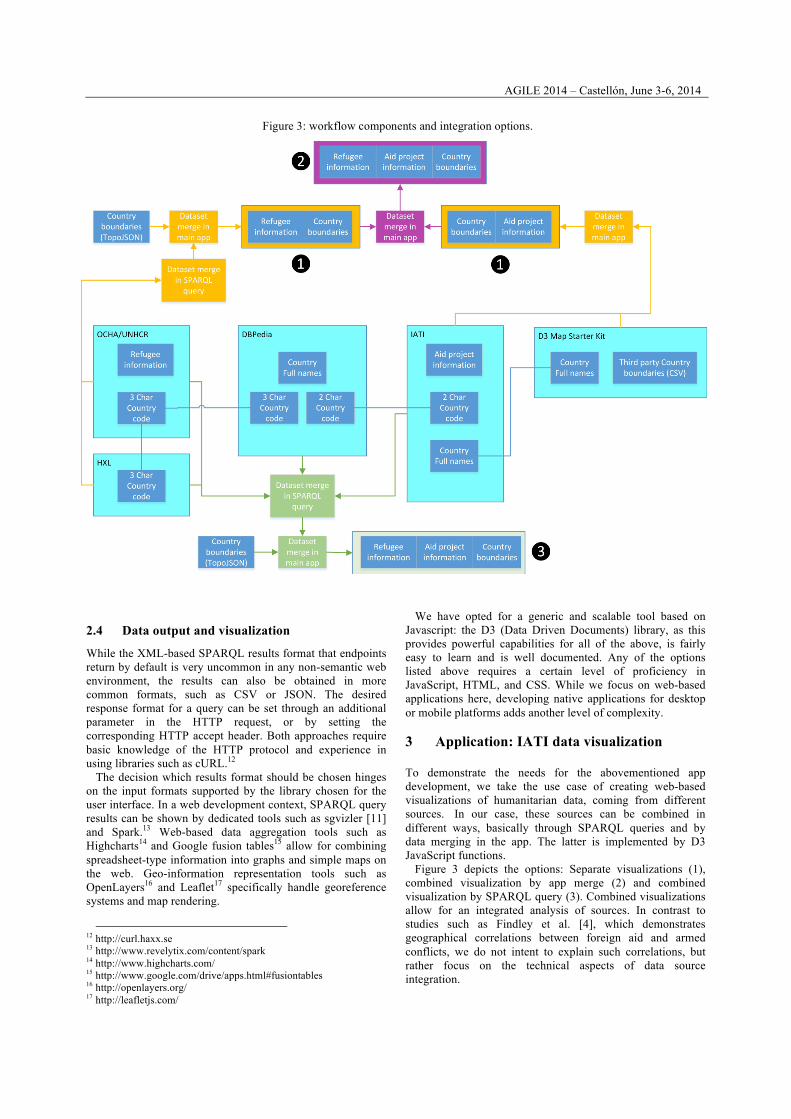
This section describes the different steps that were required to build the two sample web applications and discusses the different skills required to complete them. Figure 3 gives an overview of the different components and their interplay.
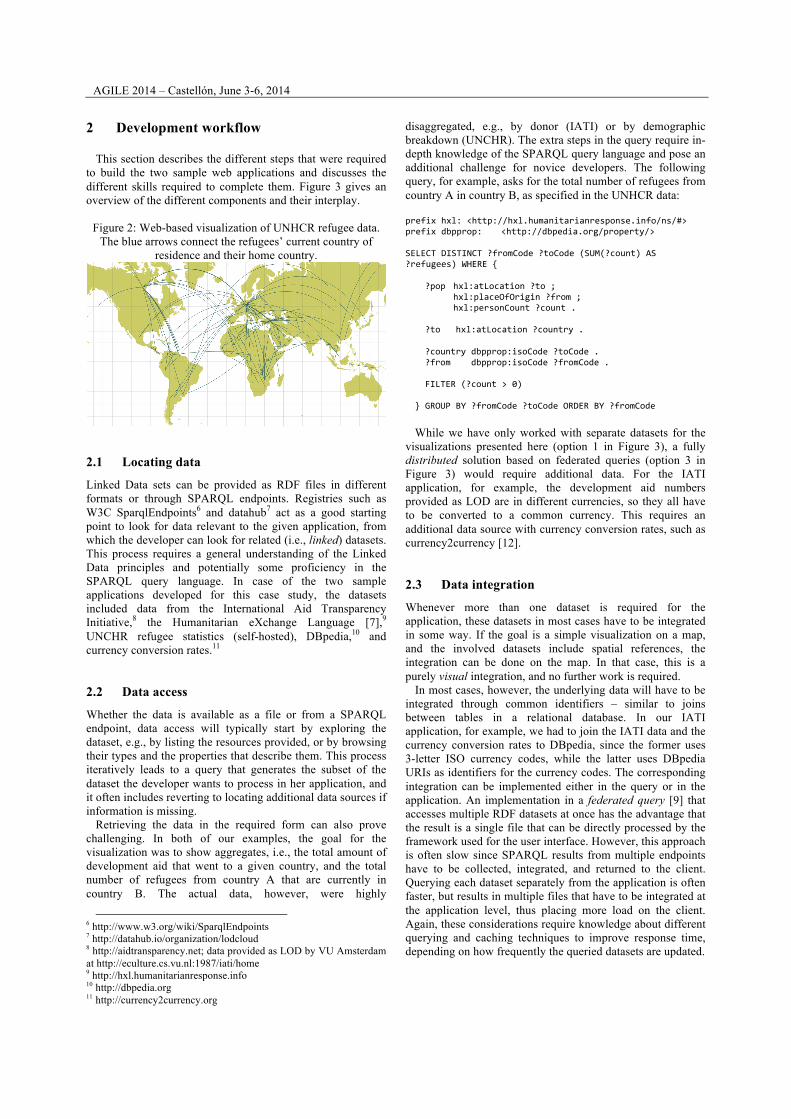
Figure 2: Web-based visualization of UNHCR refugee data.
The blue arrows connect the refugees’ current country of residence and their home country.
2.1 Locating data
Linked Data sets can be provided as RDF files in different formats or through SPARQL endpoints. Registries such as W3C SparqlEndpoints6 and datahub7 act as a good starting point to look for data relevant to the given application, from which the developer can look for related (i.e., linked) datasets. This process requires a general understanding of the Linked Data principles and potentially some proficiency in the SPARQL query language. In case of the two sample applications developed for this case study, the datasets included data from the International Aid Transparency Initiative,8 the Humanitarian eXchange Language [7],9 UNCHR refugee statistics (self-hosted), DBpedia,10 and currency conversion rates.11
2.2 Data access
Whether the data is available as a file or from a SPARQL endpoint, data access will typically start by exploring the dataset, e.g., by listing the resources provided, or by browsing their types and the properties that describe them. This process iteratively leads to a query that generates the subset of the dataset the developer wants to process in her application, and it often includes reverting to locating additional data sources if information is missing.
Retrieving the data in the required form can also prove challenging. In both of our examples, the goal for the visualization was to show aggregates, i.e., the total amount of development aid that went to a given country, and the total number of refugees from country A that are currently in country B. The actual data, however, were highly
6 http://www.w3.org/wiki/SparqlEndpoints 7 http://datahub.io/organization/lodcloud 8 http://aidtransparency.net; data provided as LOD by VU Amsterdam at http://eculture.cs.vu.nl:1987/iati/home 9 http://hxl.humanitarianresponse.info 10 http://dbpedia.org 11 http://currency2currency.org
disaggregated, e.g., by donor (IATI) or by demographic breakdown (UNCHR). The extra steps in the query require in-depth knowledge of the SPARQL query language and pose an additional challenge for novice developers. The following query, for example, asks for the total number of refugees from country A in country B, as specified in the UNHCR data:
prefix hxl: <http://hxl.humanitarianresponse.info/ns/#> prefix dbpprop: <http://dbpedia.org/property/>
SELECT DISTINCT ?fromCode ?toCode (SUM(?count) AS ?refugees) WHERE { ?pop hxl:atLocation ?to ; hxl:placeOfOrigin ?from ; hxl:personCount ?count . ?to hxl:atLocation ?country . ?country dbpprop:isoCode ?toCode . ?from dbpprop:isoCode ?fromCode . FILTER (?count > 0) } GROUP BY ?fromCode ?toCode ORDER BY ?fromCode While we have only worked with separate datasets for the
visualizations presented here (option 1 in Figure 3), a fully distributed solution based on federated queries (option 3 in Figure 3) would require additional data. For the IATI application, for example, the development aid numbers provided as LOD are in different currencies, so they all have to be converted to a common currency. This requires an additional data source with currency conversion rates, such as currency2currency [12].
2.3 Data integration
Whenever more than one dataset is required for the application, these datasets in most cases have to be integrated in some way. If the goal is a simple visualization on a map, and the involved datasets include spatial references, the integration can be done on the map. In that case, this is a purely visual integration, and no further work is required.
In most cases, however, the underlying data will have to be integrated through common identifiers – similar to joins between tables in a relational database. In our IATI application, for example, we had to join the IATI data and the currency conversion rates to DBpedia, since the former uses 3-letter ISO currency codes, while the latter uses DBpedia URIs as identifiers for the currency codes. The corresponding integration can be implemented either in the query or in the application. An implementation in a federated query [9] that accesses multiple RDF datasets at once has the advantage that the result is a single file that can be directly processed by the framework used for the user interface. However, this approach is often slow since SPARQL results from multiple endpoints have to be collected, integrated, and returned to the client. Querying each dataset separately from the application is often faster, but results in multiple files that have to be integrated at the application level, thus placing more load on the client. Again, these considerations require knowledge about different querying and caching techniques to improve response time, depending on how frequently the queried datasets are updated.
AGILE 2014 – Castellón, June 3-6, 2014
2.4 Data output and visualization
While the XML-based SPARQL results format that endpoints return by default is very uncommon in any non-semantic web environment, the results can also be obtained in more common formats, such as CSV or JSON. The desired response format for a query can be set through an additional parameter in the HTTP request, or by setting the corresponding HTTP accept header. Both approaches require basic knowledge of the HTTP protocol and experience in using libraries such as cURL.12
The decision which results format should be chosen hinges on the input formats supported by the library chosen for the user interface. In a web development context, SPARQL query results can be shown by dedicated tools such as sgvizler [11] and Spark.13 Web-based data aggregation tools such as Highcharts14 and Google fusion tables15 allow for combining spreadsheet-type information into graphs and simple maps on the web. Geo-information representation tools such as OpenLayers16 and Leaflet17 specifically handle georeference systems and map rendering.
12 http://curl.haxx.se 13 http://www.revelytix.com/content/spark 14 http://www.highcharts.com/ 15 http://www.google.com/drive/apps.html#fusiontables 16 http://openlayers.org/ 17 http://leafletjs.com/
We have opted for a generic and scalable tool based on Javascript: the D3 (Data Driven Documents) library, as this provides powerful capabilities for all of the above, is fairly easy to learn and is well documented. Any of the options listed above requires a certain level of proficiency in JavaScript, HTML, and CSS. While we focus on web-based applications here, developing native applications for desktop or mobile platforms adds another level of complexity.
3 Application: IATI data visualization
To demonstrate the needs for the abovementioned app development, we take the use case of creating web-based visualizations of humanitarian data, coming from different sources. In our case, these sources can be combined in different ways, basically through SPARQL queries and by data merging in the app. The latter is implemented by D3 JavaScript functions.
Figure 3 depicts the options: Separate visualizations (1), combined visualization by app merge (2) and combined visualization by SPARQL query (3). Combined visualizations allow for an integrated analysis of sources. In contrast to studies such as Findley et al. [4], which demonstrates geographical correlations between foreign aid and armed conflicts, we do not intent to explain such correlations, but rather focus on the technical aspects of data source integration.
Figure 3: workflow components and integration options.
AGILE 2014 – Castellón, June 3-6, 2014
The International Aid Transparency Initiative (IATI) fosters the exchange of information on international aid projects. IATI does this by setting standards for information exchange and providing a hub for registering data sets. IATI does not provide the data itself, this is done by the donor organizations themselves. IATI does provide information about how to create and consume IATI-standardized information and about available tools by third parties. IATI information has been deployed in a triple store [2] and is available as a SPARQL endpoint.
Since a federated query approach proved too slow during the data integration step, subsets of the used datasets were exported using SPARQL construct queries and loaded into a local triple store. This allowed for faster iterations during the development of the integration query, which was then ultimately used to produce a CSV file fed into D3. In a production environment, this file could be produced directly from the original endpoint via federated query and cached, with updates e.g. on a daily basis, depending on the data update frequency. 4 Conclusions
The amount of Linked Open Data containing geographic information is growing and becomes an attractive data source for application development. Based on the premise of truly linked data, it should be straightforward to use data from different sources together in applications. In reality, the integration of data from such sources to be able to use them together is still challenging, leading to situations where it is easier and more straightforward to download subsets of the data and integrate them locally. While this is a practice-oriented approach, it is clearly not in the spirit of Linked Open Data. Once the data for an application has been assembled, the developer is confronted with the choice from a wide variety of frameworks for implementation. While many frameworks such as D3 have sophisticated functionalities for the visualization of and interaction with geoinformation, putting them to use still confronts novice developers with a steep learning curve. In order to implement the (relatively simple) visualizations shown in this paper, profound knowledge of RDF, SPARQL, HTTP requests, HTML, and JavaScript is required. Adding interaction and developing for touch screen devices, for example, adds another layer of complexity. While adding all of these technologies to the already demanding GIScience curricula is hardly possible, we believe that the study programs can enable their students to learn these (and other) new technologies faster. Proficiency in different geo-information standards is already part of the curriculum in many programs and can easily be extended to a broader range of web standards. Existing research methods courses can be extended with sections on research for software development to familiarize students with resources such as StackOverflow18 as well as tools such as GitHub19 and bl.ocks.org.20 Finally, hands-on lab exercises that ask for the development of creative solutions, rather than following “click-through” instructions, get the students used to independent problem solving.
18 http://stackoverflow.com 19 https://github.com 20 http://bl.ocks.org
References
[1] Berners-Lee, T.: Linked Data – Design Issues (2009) Online: http://www.w3.org/DesignIssues/LinkedData.html
[2] Brandt, K. (2013), Linked Data for IATI, MSc Thesis,Vrije Universiteit Amsterdam.
[3] Cyganiak, R., Jentzsch, A. (2011) Linking Open Data
cloud diagram. Online: http://lod-cloud.net [4] Findley, M. G., J. Powell, D. Strandow, and J. Tanner
(2011), The Localized Geography of Foreign Aid: A New Dataset and Application to Violent Armed Conflict, World Development, 39(11), 1995–2009, doi:10.1016/j.worlddev.2011.07.022.
[5] Haslhofer, B., & Isaac, A. (2011). data.europeana.eu: The Europeana Linked Open Data Pilot. In International Conference on Dublin Core and Metadata Applications (pp. 94-104).
[6] Kauppinen, T., de Espindola, G. M., Jones, J., Sánchez,
A., Gräler, B., & Bartoschek, T. (2013). Linked brazilian amazon rainforest data. Semantic Web.
[7] Keßler, C. and Hendrix, C. (forthcoming) The
Humanitarian eXchange Language: Coordinating Disaster Response with Semantic Web Technologies. Semantic Web Journal, accepted.
[8] OGC (2012) GeoSPARQL – A Geographic Query
Language for RDF data. [9] Prud'hommeaux, E.,Buil-Aranda, C. (2013) SPARQL 1.1
Federated Query. W3C Recommendation: http://www.w3.org/TR/sparql11-federated-query/
[10] Shih, F., O. Seneviratne, D. Miao, I. Liccardi, L. Kagal,
E. Patton, C. Castillo, and P. Meier (2013), Democratizing Mobile App Development for Disaster Management, in AIIP ’13 Joint Proceedings of the Workshop on AI Problems and Approaches for Intelligent Environments and Workshop on Semantic Cities, pp. 39–42, ACM.
[11] Skjaeveland, M. (2012), Sgvizler: A javascript wrapper
for easy visualization of SPARQL result sets, in Extended Semantic Web Conference.
[12] Stolz, A. and Hepp, M.(2013) Currency Conversion the
Linked Data Way, in: Proceedings of the Workshop on Services and Applications over Linked APIs and Data (SALAD2013), in conjunction with the 10th Extended Semantic Web Conference (ESWC 2013), May 26-30, Montpellier, France.