Embed Size (px)
Citation preview

Eratosthenes Research Centre Limassol, Cyprus
GEO-CRADLE Project Meeting 2
16th November, 2016
Task 4.2
The GEO-CRADLE project has received funding from the European Union’s Horizon 2020 research and innovation program under grant agreement No 690133.
SOIL SPECTRAL INFORMATION IN THE ERA OF COMMERCIAL
HYPERSPECTRAL SENSOR IN ORBIT: PRISMA PROJECT
S. Pignatti, F. Longo
1
Limassol Project Meeting, 17/11/2016, Eratosthenes Research Centre
outlines
The next spaceborne mission; PRISMA
The impact of HYS missions for soil sciences
Texture (% of clay, silt and sand)
% of Soil organic carbon - SOC
Soil moisture
Soil contamination (?)
Soil vigour
Related agronomical proxi variables related to food security issues
2

Limassol Project Meeting, 17/11/2016, Eratosthenes Research Centre
Future IS spaceborne missions
http://www.enmap.org/sites/default/files/pdf/Hyperspectral_EO_Missions_2015_06_22_FINAL.pdf
3

Limassol Project Meeting, 17/11/2016, Eratosthenes Research Centre
Future IS spaceborne missions
http://www.enmap.org/sites/default/files/pdf/Hyperspectral_EO_Missions_2015_06_22_FINAL.pdf
4

Limassol Project Meeting, 17/11/2016, Eratosthenes Research Centre
PRISMA Payload
The hyperspectral sensor utilizes prisms to obtain the dispersion of incoming radiation
on a 2-D matrix detectors so to acquire spectral bands of the same strip on ground.
The PRISMA Payload operates with a Pushbroom scanning concept that records reflected radiation from the
Earth surface in the PAN range, in the visible/near infrared (VNIR) range and in the short wave infrared (SWIR)
range with a band width of 10 nm.
The PAN sensor is characterized by a ground sampling distance of 5 m (nadir at sea level); the VNIR/ SWIR
GSD is 30 m.
Heat pipes
Cold radiator
Swath / FOV 30 km / 2.77°
Ground Sampling Distance
(GSD) Hyperspectral: 30 m / PAN: 5 m
Spectral Range
VNIR: 400 – 1010 nm
SWIR: 920 – 2505 nm
PAN : 400 – 700 nm
Spectral Width (FWHM) ≤ 12 nm
Radiometric Quantization 12 bit
VNIR SNR > 200:1
SWIR SNR > 100:1
PAN SNR > 240:1
MTF@ Nyquist freq.
VNIR/SWIR along track > 0.18
VNIR/SWIR across track > 0.34
PAN along track > 0.10 across track >0.20
Spectral Bands 66 VNIR / 173 SWIR
Data processing Lossless compression with compression factor 1.6
Near lossless compression
Thermal Control System Double stage passive radiator
(1 for each HYP channel) + stabilization heater
Mass
(including 5% margin)
Optical Head: 175kg
Thermal Shield: 25kg
Main Electronics: 12kg
Power Consumption
(including 10%margin)
Earth Observation /calibration: <105W
Idle: <90W
5
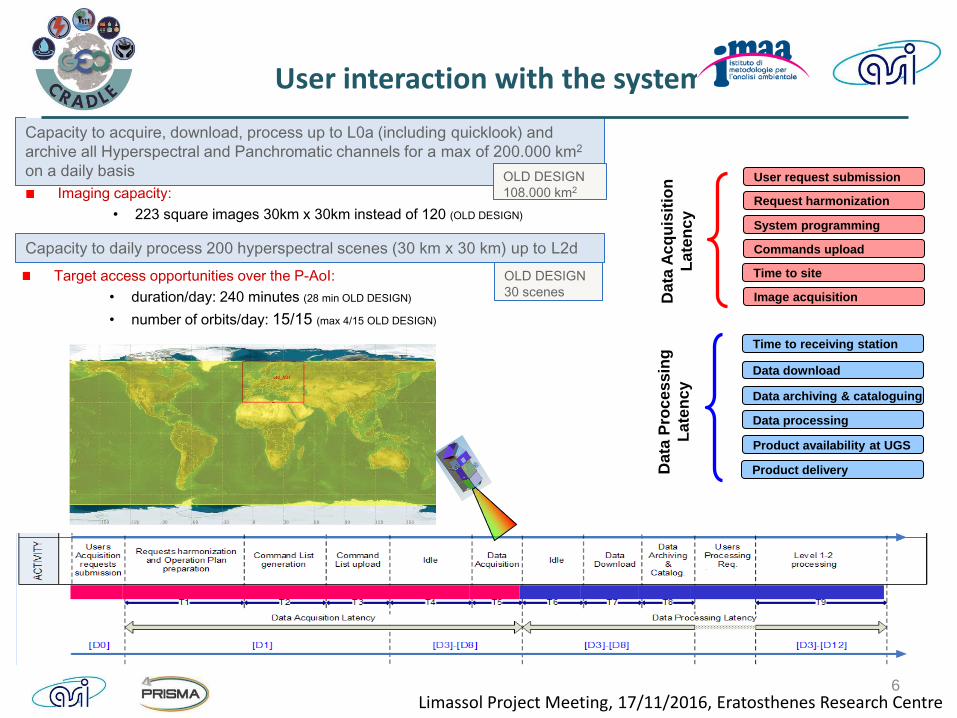
Capacity to acquire, download, process up to L0a (including quicklook) and
archive all Hyperspectral and Panchromatic channels for a max of 200.000 km2
on a daily basis
Limassol Project Meeting, 17/11/2016, Eratosthenes Research Centre
User interaction with the system
Request harmonization
Data archiving & cataloguing
Product availability at UGS
Image acquisition
Time to site
Data download
Product delivery
Commands upload
User request submission
Data
Ac
qu
isit
ion
Late
ncy
Data
Pro
ce
ssin
g
Late
ncy
Time to receiving station
System programming
Data processing
OLD DESIGN
108.000 km2 Imaging capacity:
• 223 square images 30km x 30km instead of 120 (OLD DESIGN)
Capacity to daily process 200 hyperspectral scenes (30 km x 30 km) up to L2d
Target access opportunities over the P-AoI:
• duration/day: 240 minutes (28 min OLD DESIGN)
• number of orbits/day: 15/15 (max 4/15 OLD DESIGN)
OLD DESIGN
30 scenes
6

Limassol Project Meeting, 17/11/2016, Eratosthenes Research Centre
PRISMA processing chain
Level 0:
Instrument data decoding and decompression
PAN, HYP layers and ancillary data rearrangement
Cloud cover percentage calculation (for image cataloguing)
Image preview (for image cataloguing)
Level 0 data archiving
Level 1 (upon user request)
Image rediometric, spectral and geometric calibration
Additional: user surface cover map
Level 2 (upon user request)
Atmospheric corrections
Atmospheric load estimation (columnar water vapour and aerosol load, thin clouds
optical thickness)
Image geo-referencing/geocoding
7

IS versus soil properties and crop parameters retrieval
Limassol Project Meeting, 17/11/2016, Eratosthenes Research Centre
EO Products Description UnitEO product
maturity level Notes
CLAY Percentage of clay in the first 30 cm of soil % medium
SILT Percentage of silt in the first 30 cm of soil % medium
SAND Percentage of sand in the first 30 cm of soil % medium
SOC Percentage of organic carbon in the first 30 cm of soil % low
limited to mechanically
prepared bare ground
Vegetation components
Soil components
Agricultural components
EO
ProductsDescription Unit
EO product
maturity level Notes
YLD Crop production t ha-1 low
QN Content of nitrogen in the aboveground biomass % low
GN Nitrogen content in grain % low
Nresnitrate nitrogen (NO3-N-) in the soil at the end
of crop cyclekg ha
-1 low
limited to a cereal
crop to be defined
EO
ProductsDescription Unit
EO product
maturity level Notes
LAI Leaf Area Index - high
CabChlorophyll a and b Content of in leaves per unit
of areamg cm
-2 high
FPARFraction of photosynthetically
active radiation absorbed by vegetation cover- high
limited to herbaceous
crops
8

F. Castaldi, R. Casa, A. Castrignanò, S.Pascucci, A. Palombo and S. Pignatti «Estimation of soil properties at the field scale from satellite data: a comparison between spatial and non-spatial
techniques» ESJ, Volume 65, Issue 6, pages 842–851, November 2014
9
Soil component - texture
Hyperion 7 November 2012
n° Min % Max % Mean % sd skewness
clay 72 18.37 49.61 37.91 6.78 -0.37
sand 72 23.10 60.43 36.55 7.48 0.95
SOM 72 1.07 2.67 1.69 0.44 0.64

SM
IR B
TDR Nov. 8, 12
Hyperion, Nov. 7, 12 SMIR - B
Pearson’s correlation coefficient (r) between Soil Moisture
content and reflectance values of MAC and SOLREFLIU
spectral datasets as a function of l
10
Rmse 10%
Soil component – soil moisture
Soil Moisture
Index Formula R a b c
RMSE
(%) RPIQ
SMIR_A (R1770 − R2100)/
(R1770 + R2100) 0.89 0.03 1.63 −1.89 0.05 4.25
SMIR_B R1506/R1770 −0.88 0.48 0.24 −0.75 0.05 4.25
NSMI Normalized Soil Moisture Index
(R1800 − R2119)/
(R1800 + R2119) 0.88 0.50 −1.67 1.46 0.05 4.25
Cross-validation results Pearson’s
correlation coefficient (r), the coefficients of
the quadratic regressions
SM=a+b*index+c*index2
the root mean square error (RMSE) and
the Ratio of the Performance to the
Interquartile Range (RPIQ) are reported in
the above tab
Spectral dataset
SOLREFLIU MAC
N° samples 89 72
Type Topsoil Topsoil
Sampling Area France & China Italy
Spectral Meas. Directional Directional
Spectral range 350-2500 350-2500
Spectral Res. 1 nm 1 nm

Pearson’s correlation coefficient (r) between clay content and Band
Depth spectral values for the four soil moisture classes of the MAC
spectral library (VW: very wet; W: wet; LW: low wet; D: dry)
11
Soil component – soil moisture / clay
SM class Clay index r
VW (BD2230 − BD1680)/(BD2230 + BD1680) 0.70
W (BD1340 − BD2360)/(BD1340 + BD2360) −0.73
LW BD530/BD2225 0.65
D (BD2170 − BD2270)/(BD2170 + BD2270) 0.75
CLAY ESTIMATION METHOD
Spectral indices PLSR
Summer Autumn Winter Summer Autumn Winter
SM class RMSE (%) RPIQ RMSE (%) RPIQ RMSE (%) RPIQ RMSE (%) RPIQ RMSE (%) RPIQ RMSE (%) RPIQ
Different
spectral
indices
according
to SM
level
VW 6.6 2.6 6.3 2.7 6.3 2.7 7.1 2.4 6.7 2.5 7.4 2.3
W 8.2 2.1 8.5 2 10.6 1.6 6.3 2.7 6.8 2.5 9.2 1.8
LW 8.5 2 8.2 2.1 7.8 2.2 9.5 1.8 9.1 1.9 9.5 1.8
D 5.9 2.9 6 2.8 5.9 2.9 4.7 3.6 5.8 2.9 7.3 2.3
Mean 7.3 2.3 7.3 2.3 7.7 2.2 6.9 2.6 7.1 2.4 8.4 2.3
D to all 13.2 1.3 13.3 1.3 11.9 1.4 15.8 1.1 15.6 1.1 10.4 1.6
Castaldi, F.; Palombo, A.; Pascucci, S.; Pignatti, S.; Santini, F.; Casa, R. Reducing the Influence of Soil Moisture on the Estimation of Clay from Hyperspectral Data: A Case Study Using Simulated
PRISMA Data. Remote Sens. 2015, 7, 15561-15582.
12
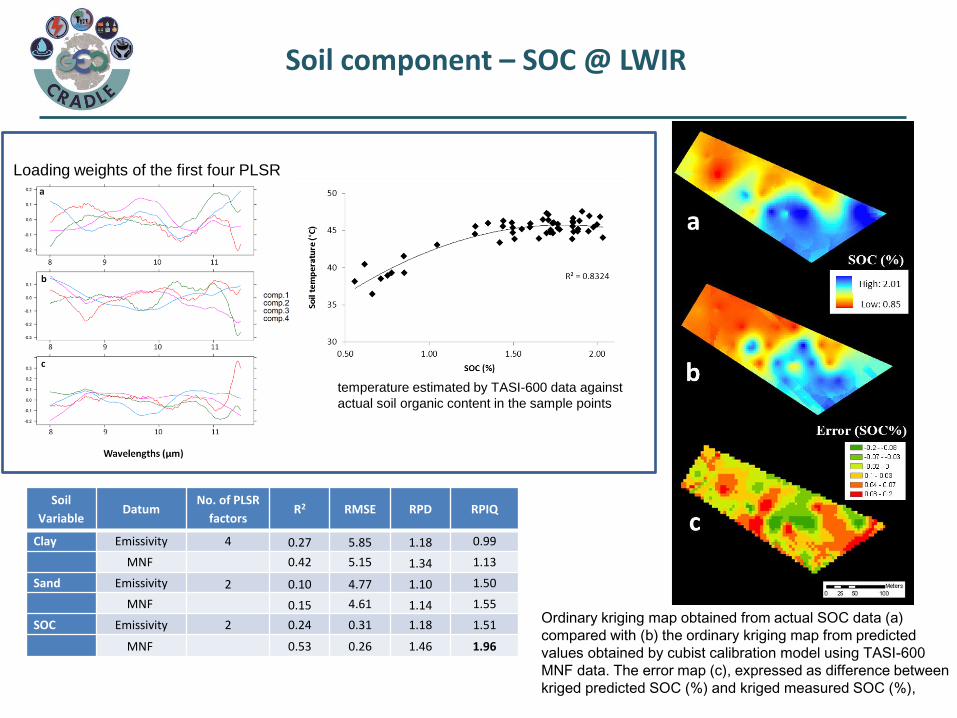
Soil component – SOC @ LWIR
Soil
Variable Datum
No. of PLSR
factors R2 RMSE RPD RPIQ
Clay Emissivity 4 0.27 5.85 1.18 0.99
MNF 0.42 5.15 1.34 1.13
Sand Emissivity 2 0.10 4.77 1.10 1.50
MNF 0.15 4.61 1.14 1.55
SOC Emissivity 2 0.24 0.31 1.18 1.51
MNF 0.53 0.26 1.46 1.96
Ordinary kriging map obtained from actual SOC data (a)
compared with (b) the ordinary kriging map from predicted
values obtained by cubist calibration model using TASI-600
MNF data. The error map (c), expressed as difference between
kriged predicted SOC (%) and kriged measured SOC (%),
temperature estimated by TASI-600 data against
actual soil organic content in the sample points
Loading weights of the first four PLSR

Limassol Project Meeting, 17/11/2016, Eratosthenes Research Centre
Soil contamination – heavy metal Spectral Library 110 samples
laboratory concentration (ppm) & ASD spectral measurements
Airborne VSWIR-TIR hyperspectral data
13

• Aimed at defining the local scale elementary units for crop growing models simulations either at the
parcel or the within-parcel scale (static over the years)
• Foreseen the availability of the new spaceborne HIS data, multispectral (SPOT & Landsat) inter-
annual time series of images (i.e. winter images for bare soil and summer images for biomass)
have been used
Italy time-series: (2013-2014)
- 27 SPOT images / 385 fields
- 26 Landsat 7 ETM+ / 394 fields
Spain time-series: (2009-2014)
- 22 Landsat 5 and LC8-OLI
- 101 fields
Greece time-series: (2003-2015)
- 40 Landsat 5 and LC8-OLI
- 6934 fields
Soil and Biomass constant pattern maps
http://www.ermes-fp7space.eu/
Soil component – spatial variability (vigour)
14

Greek time-series (2003-2015): 40 Landsat images (GSD 30 m) - 6934 parcels
2015 rice season,
monitored parcels
A downstream service to support agro-production, planning and policy ‘Soil and Biomass constant pattern maps’
Thessaloniki
15

A,B,C
Cosmo-Skymed
(Radar X band)
2016 time variability
maps (3m/pixel)
D
Soil/Biomass
constant pattern
map obtained using
SPOT 2002-2014
time series
(5-10m/pixel)
ERMES: Rice Farm in the Lomellina rice agricultural district (IT) Optical (SPOT 5m) and Radar (COSMO-SkyMed 3m) time series
16

LAI
Biomass & Yield
Example of LAI, Biomass and Yield simulation with EnKF assimilation for SAFY (7 Oct 2008, Xiaotangshan field experiments)
Satellite images LAI maps
Yangling, Shaanxi
2013
2014
SAFY
Assimilation of remote sensing variables into crop models
Wheat yield estimation
17
Conclusion I
Limassol Project Meeting, 17/11/2016, Eratosthenes Research Centre
From 2018 PRISMA & ENMAP hyperspectral 30m/pixel images will be
available to the community (free data policy?);
The advent of HYS will allow the mapping of the physical and chemical
characteristics of agricultural soils (in the first 30 cm of soil) like:
Texture (% of clay, silt and sand)
% of soil organic carbon - SOC
Soil moisture
Soil contamination (?)
The availability of new HYS imagery will impact on the retrieval accuracy
of:
parameters pertaining to the agronomical management ;
agronomical proxi variables (e.g. yield, nitrogen content in grain,
nitrate nitrogen in the soil at the end of crop cycle etc.) related to food
security issues
18
Conclusion II
Limassol Project Meeting, 17/11/2016, Eratosthenes Research Centre
The future HYS missions should assure an higher spatial resolution, and a
wider swath to fulfill the tight requirements of the precision agriculture
applications;
HyspIRI and SHALOM will start to fill these gaps providing high spatial
resolution and a full spectral coverage covering from the VSWIR to the
LWIR
Synergy with the Sentinels (wide swath and temporal frequency) is still an
important issue
19

20

21