Embed Size (px)
Citation preview

GEO 309Dr. Garver

Study of the relationship between size and shape
First outlined by Otto Snell in 1892 and Julian Huxley in
1932
Practical applications;
◦ differential growth rates of the parts of a living
organism
◦ Insects
◦ Children
◦ Plants
Allometry


Can we prove a relationship between tree
height and trunk diameter?
Collect data using clinometers and meter
tapes.
Start by standardizing our measurement
techniques (First week of allometry
exercise).

an optical device for measuring elevation angles above horizontal

◦ Week 1 of exercise – Print out a copy of clinometer_training.xls
Form small groups
Go to the 5 stations listed on worksheet, each group member
will;
take a clinometer reading at each station.
calculate their height at eye level.
Each group member completes their own copy of
clinometer_training.xls

Allometry exercise – Week 1 of exercise
◦ Each group will then create a new spreadsheet that
combines the collected data and calculates the average
heights for each of the 5 stations, and the average errors.
◦ When all groups are done we will then compare the results
to the actual measured heights of the 5 stations.
◦ Each group needs to hand in their
clinometer_groupweek1.xls with each member’s individual
clinometer_training.xls sheet in order to get credit for
today’s exercise.

= 575 m
a = ?
= 29°

Based on the mathematics of right triangles.
Pace off a good distance from the object you want to
measure.
Record that measurement
◦ This is the baseline of the right triangle
Second measurement is the angle between your line
of sight and the ground (use a clinometer to make this
measurement)
◦ Greek letter θ (pronounced thay'-ta).

The tangent (tan) function. For a given angle, the ratio of the length of those two
sides is always the same. a/b is equal to the tangent of the angle θ. In equation
form, it looks like this:a/b = tan θ
Another way to write this same equation is:
a = b * tan θ
So, the height we want to measure (a) is equal to the baseline of the right triangle (b) times the tangent of the sight angle (θ).
575 * tan(29) = 575 * 0.5543 = 319 m

= 575 m
a = 319 m
= 29°
575 * tan(29) = 575 * 0.5543 = 319 m

Graph of tangent function from 0 to 89°
Values change slowly from 0° to 60° or 70°
Then values start to change more rapidly.
Want to make sure that you are far enough
away from the object so that your sight
angle is in the range where the tangent
function is not changing rapidly.


distance around a circle – circumference
The distance across a circle through the center - diameter.
Pi is the ratio of the circumference of a circle to the
diameter.
divide the circumference by the diameter, you get a value close to Pi.

Get in groups and standardize measurement
techniques for improved data collection.
Next 2 weeks – we will collect and analyze
campus tree data.
Dr. G..
= 5.15 mKyle

5 locations outside – Bridge, Flagged railing,
Balcony1, Balcony2, Balcony3
5.15 m
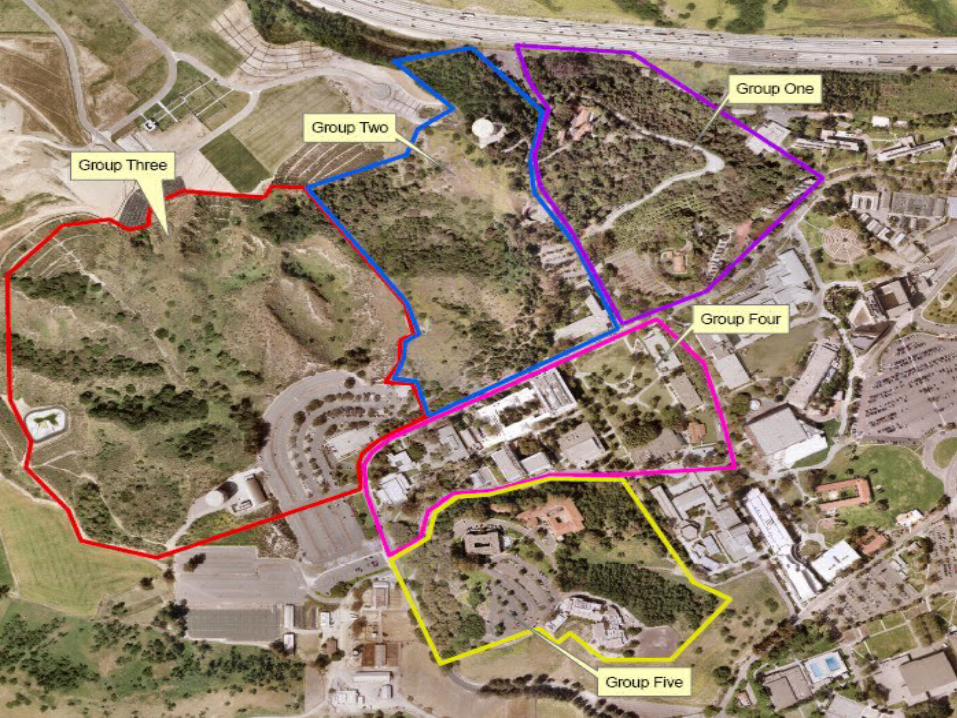
Bridge Location
Kyle clinometer reading = 18.5°
Dr. G. clinometer reading = 20°
Kyle eye hgt. = 1.73 m
G. eye hgt. = 1.65 m
Locationclinometer
(deg)horizontal dist. (m) height (m)
your eye hgt. (m)
Final Object Hgt. (m)
actual heght error
bridge - Garver 20 10.00 3.64 1.65 5.29 5.15 -0.14
bridge - Myrick 18.5 10.00 3.35 1.73 5.08 5.15 0.07


Tree Diameter vs. Height
0
5
10
15
20
25
30
35
40
0.00 10.00 20.00 30.00 40.00 50.00 60.00 70.00
Diamter (cm)
Hei
gh
t (m
)
Series1
Linear (Series1)
Full dataset n = 88 RSQ R
25% 50%
Example of a Plot A

Tree Diameter vs. Height
0.00
2.00
4.00
6.00
8.00
10.00
12.00
14.00
16.00
0.00 10.00 20.00 30.00 40.00 50.00 60.00 70.00
diameter (cm)
hei
gh
t (m
)
Series1
Linear (Series1)
RSQ R47% 69%
Example of a Plot B