Embed Size (px)
Citation preview
GENT FAIRHEAD & CO FICHTNER
S1552-0700-0010RSF Rivenhall - Human Health Risk Assessment Page i
GENT FAIRHEAD & CO
RIVENHALL
HUMAN HEALTH RISK ASSESSMENT
GENT FAIRHEAD & CO FICHTNER
S1552-0700-0010RSF Rivenhall - Human Health Risk Assessment Page ii
GENT FAIRHEAD & CO
RIVENHALL
HUMAN HEALTH RISK ASSESSMENT
Document Production & Approval Record
ISSUE NO. 6 NAME SIGNATURE POSITION DATE
Prepared by: Rosalind Flavell
Associate Senior
Consultant
24/02/17
Checked by: Stephen Othen
Technical
Director
24/02/17
Document Revision Record
ISSUE
NO.
DATE DETAILS OF REVISIONS PREPARED
BY
CHECKED
BY
1 28/07/15 First draft for client review RSF SMO
2 30/07/15 Draft for client review RSF SMO
3 31/07/15 Final draft RSF SMO
4 31/07/15 Final RSF SMO
5 22/02/17 Updated RSF SMO
6 24/02/17 Final following client comments RSF SMO
© 2017 Fichtner Consulting Engineers. All rights reserved.
This report and its accompanying documents contain information which is confidential and is
intended only for the use of Gent Fairhead & Co. If you are not one of the intended recipients any
disclosure, copying, distribution or action taken in reliance on the contents of the information is
strictly prohibited.
GENT FAIRHEAD & CO FICHTNER
S1552-0700-0010RSF Rivenhall - Human Health Risk Assessment Page iii
Unless expressly agreed, any reproduction of material from this report must be requested and
authorised in writing from Fichtner Consulting Engineers. Authorised reproduction of material must
include all copyright and proprietary notices in the same form and manner as the original, and must
not be modified in any way. Acknowledgement of the source of the material must also be included
in all references.
GENT FAIRHEAD & CO FICHTNER
S1552-0700-0010RSF Rivenhall - Human Health Risk Assessment Page iv
TABLE OF CONTENTS
TABLE OF CONTENTS ........................................................................................................... IV
1 Introduction .............................................................................................................. 1
2 Issue Identification .................................................................................................... 2
2.1 Issue ............................................................................................................... 2
2.2 Chemicals of Potential Concern (COPC) ................................................................ 2
3 Assessment Criteria ................................................................................................... 4
4 Conceptual Site Model ................................................................................................ 7
4.1 Conceptual site model ........................................................................................ 7
4.2 Pathways excluded from assessment ................................................................... 9
4.2.1 Dermal absorption ............................................................................................... 9
4.2.2 Groundwater ....................................................................................................... 9
4.2.3 Surface water ...................................................................................................... 9
4.2.4 Fish consumption ................................................................................................. 9
5 Sensitive Receptors .................................................................................................. 11
6 IRAP Model Assumptions and Inputs ........................................................................... 14
6.1 Concentration in soil ......................................................................................... 14
6.2 Concentration in plants ..................................................................................... 14
6.3 Concentration in animals ................................................................................... 14
6.4 Concentration in humans ................................................................................... 14
6.4.1 Intake via inhalation ............................................................................................ 14
6.4.2 Intake via soil ingestion ....................................................................................... 15
6.4.3 Ingestion of food ................................................................................................. 15
6.4.4 Breast milk ingestion ........................................................................................... 15
6.5 Estimation of COPC concentration in media .......................................................... 15
6.6 Modelled emissions ........................................................................................... 16
7 Results .................................................................................................................... 21
7.1 At point of maximum impact .............................................................................. 21
7.2 Maximum impact at a receptor ........................................................................... 23
7.3 Uncertainty and sensitivity analysis .................................................................... 24
7.4 Upset process conditions ................................................................................... 25
8 Conclusions .............................................................................................................. 26
APPENDIX A - DETAILED RESULTS TABLES .................................................................. 28
GENT FAIRHEAD & CO FICHTNER
S1552-0700-0010RSF Rivenhall - Human Health Risk Assessment Page 1
1 INTRODUCTION
Fichtner Consulting Engineers Ltd (“Fichtner”) has been engaged to undertake a Human
Health Risk Assessment (HHRA) to support the planning and Environmental Permit application
for the proposed Rivenhall Integrated Waste Management Facility (IWMF). The Facility will
include a Combined Heat and Power (CHP) plant consisting of 2 streams to process up to
595,000 tonnes per annum of non-hazardous Solid Recovered Fuel (SRF) and Refuse Derived
Fuel (RDF). Due to the recycled nature of some of the fuel, the limits on emissions to air will
be based on those outlined in Chapter IV and Annex VI of the Industrial Emissions Directive
(IED) (2010/75/EU) for waste incineration and co-incineration plants. This will include limits
on emissions of heavy metals and dioxins and furans.
The advice from health specialists such as the Health Protection Agency that the damage to
health from emissions from incineration and co-incineration plants is likely to be very small,
and probably not detectable. Nevertheless, the specific effects on human health of the
proposed plant have been considered, and are presented in this report.
For most substances released from the Facility, the most significant effects on human health
will arise by inhalation. The Air Quality Assessment Levels (AQALs) outlined within the
Dispersion Modelling Assessment have been set by the various authorities at a level which is
considered to present minimum or zero risk to human health. It is widely accepted that, if the
concentrations in the atmosphere are less than the AQOs, then the pollutant is unlikely to
have an adverse effect on human health.
For some pollutants which accumulate in the environment, inhalation is only one of the
potential exposure routes. Therefore, other exposure routes are considered in this
assessment.
The Facility is located in a sparsely populated area, and areas in the direction of the maximum
impact have either been subject to quarrying (the former Coggeshall Pit) or will be subject to
quarrying operations (by Blackwater Aggregates’ adjacent to the Facility); and future
residential development and/or habitation is therefore unlikely.
A number of agricultural and residential receptors have been identified and the impact of the
Facility on those receptors considered. The point of maximum impact is located in an
uninhabited site in the adjacent quarry.
GENT FAIRHEAD & CO FICHTNER
S1552-0700-0010RSF Rivenhall - Human Health Risk Assessment Page 2
2 ISSUE IDENTIFICATION
2.1 Issue
The key issue is the release of substances from the proposed CHP to atmosphere which
have the potential to harm human health. No other sources will include emissions of either
metals or dioxins. The Facility is to be located to the south-east of the disused airfield
known as Rivenhall airfield, in rural Essex approximately 3.4km south east of Kelvedon.
The closest residential properties are Allshots Farmhouse and The Lodge approximately
450m to the north east of the Facility.
The Facility will be designed to meet the emission limits outlined in the IED (2010/75/EU).
Limits have been set for pollutants known to be produced during the combustion of waste
which have the potential to impact upon the local environment either on human health or
ecological receptors. These pollutants include:
nitrogen dioxide, sulphur dioxide, particulate matter, carbon monoxide, ammonia;
acid gases - hydrogen chloride, and hydrogen fluoride;
total organic carbon;
metals - mercury, cadmium, thallium, antimony, arsenic, lead, cobalt, copper,
manganese, nickel and vanadium;
dioxin and furans;
dioxin like PCBs; and
polycyclic aromatic hydrocarbons (PAHs).
For most substances released from the Facility, the most significant effects on human
health will arise by inhalation. An Air Quality Assessment has been undertaken to
determine the impact of atmospheric concentrations of the pollutants listed above based
on the levels transposed under UK Law in the UK Air Quality Strategy and those set by the
Environment Agency. These levels have been set at a level which is considered to present
minimum or zero risk to human health.
Some pollutants, including dioxins, furans, dioxin-like polychlorinated biphenyls (PCBs)
and heavy metals, accumulate in the environment, which means that inhalation is only
one of the potential exposure routes. Therefore, impacts cannot be evaluated in terms of
their effects on human health by simply reference to ambient air quality standards. An
assessment needs to be made of the overall human exposure to the substances by the
local population and the risk that this exposure causes.
2.2 Chemicals of Potential Concern (COPC)
The substances which have been considered within this assessment are those which are
authorised (as listed above). Although Emission Limit Values (ELVs) for PAHs are not
currently set from installations, monitoring is required by legislation in the UK. Therefore,
benzo(a)pyrene has been included in the assessment to represent PAH emissions. The
following have been considered COPCs for the purpose of this assessment:
PCDD/Fs (individual congeners) and dioxin like PCBs;
Hydrogen chloride
Benzene
Benzo(a)pyrene
Mercury (Hg)
Mercuric chloride
Cadmium (Cd)
Thallium (Tl)
Antimony (Sb)
GENT FAIRHEAD & CO FICHTNER
S1552-0700-0010RSF Rivenhall - Human Health Risk Assessment Page 3
Arsenic (As)
Chromium (Cr), trivalent and hexavalent
Lead (Pb); and
Nickel (Ni).
This risk assessment investigates the potential for long term health effect of these COPCs
through other routes than just inhalation.
GENT FAIRHEAD & CO FICHTNER
S1552-0700-0010RSF Rivenhall - Human Health Risk Assessment Page 4
3 ASSESSMENT CRITERIA
IRAP calculates the total exposure through each of the different pathways so that a dose from
inhalation and ingestion can be calculated for each receptor. By default, these doses are then
used to calculate a cancer risk, using the USEPA’s approach. However, the Environment
Agency recommend that the results be assessed using the UK’s approach, which is explained
in the Environment Agency’s document “Human Health Toxicological Assessment of
Contaminants in Soil”, ref SC050021. This approach involves two types of assessment:
For those substances with a threshold level for toxicity, a Tolerable Daily Intake (TDI)
is defined. This is “an estimate of the amount of a contaminant, expressed on a
bodyweight basis, which can be ingested daily over a lifetime without appreciable health
risk.” A Mean Daily Intake (MDI) is also defined, which is the typical intake from
background sources (including dietary intake) across the UK. In order to assess the
impact of the Facility, the predicted intake of a substance due to emissions from the
Facility is added to the MDI and compared with the TDI.
For substances without a threshold level for toxicity, an Index Dose (ID) is defined. This
is a level of exposure which is associated with a negligible risk to human health. The
predicted intake of a substance due to emissions from the Facility is compared directly
with the ID without taking account of background levels.
Substances can reach the body either through inhalation or through ingestion (oral exposure)
and the body handles chemicals differently depending on the route of exposure. For this
reason, different TDI and IDs are defined for inhalation and oral exposure.
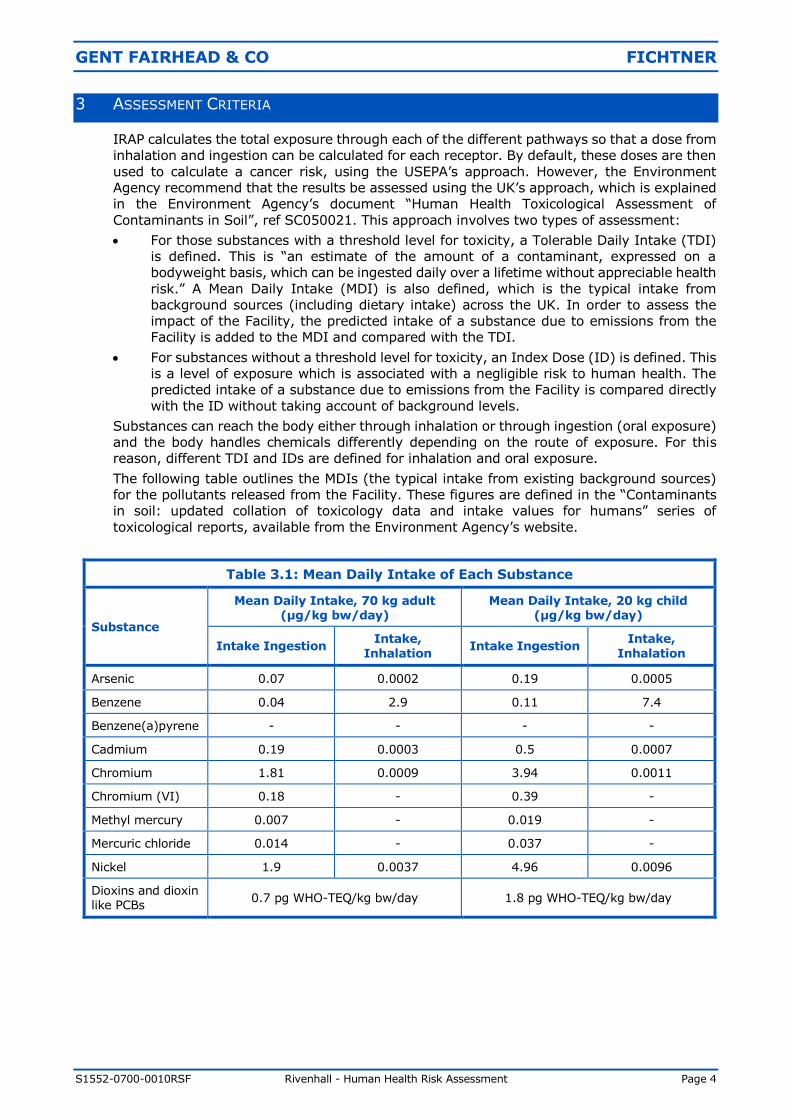
The following table outlines the MDIs (the typical intake from existing background sources)
for the pollutants released from the Facility. These figures are defined in the “Contaminants
in soil: updated collation of toxicology data and intake values for humans” series of
toxicological reports, available from the Environment Agency’s website.
Table 3.1: Mean Daily Intake of Each Substance
Substance
Mean Daily Intake, 70 kg adult (µg/kg bw/day)
Mean Daily Intake, 20 kg child (µg/kg bw/day)
Intake Ingestion Intake,
Inhalation Intake Ingestion
Intake,
Inhalation
Arsenic 0.07 0.0002 0.19 0.0005
Benzene 0.04 2.9 0.11 7.4
Benzene(a)pyrene - - - -
Cadmium 0.19 0.0003 0.5 0.0007
Chromium 1.81 0.0009 3.94 0.0011
Chromium (VI) 0.18 - 0.39 -
Methyl mercury 0.007 - 0.019 -
Mercuric chloride 0.014 - 0.037 -
Nickel 1.9 0.0037 4.96 0.0096
Dioxins and dioxin like PCBs
0.7 pg WHO-TEQ/kg bw/day 1.8 pg WHO-TEQ/kg bw/day
GENT FAIRHEAD & CO FICHTNER
S1552-0700-0010RSF Rivenhall - Human Health Risk Assessment Page 5
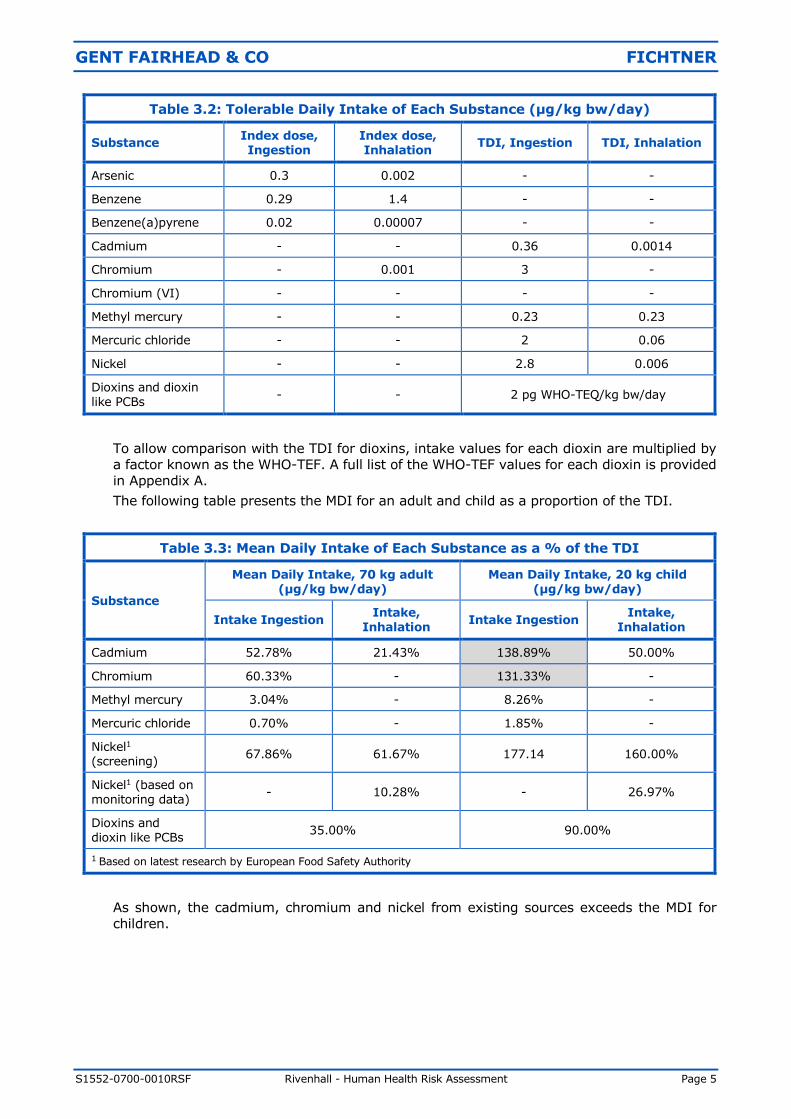
Table 3.2: Tolerable Daily Intake of Each Substance (µg/kg bw/day)
Substance Index dose, Ingestion
Index dose, Inhalation
TDI, Ingestion TDI, Inhalation
Arsenic 0.3 0.002 - -
Benzene 0.29 1.4 - -
Benzene(a)pyrene 0.02 0.00007 - -
Cadmium - - 0.36 0.0014
Chromium - 0.001 3 -
Chromium (VI) - - - -
Methyl mercury - - 0.23 0.23
Mercuric chloride - - 2 0.06
Nickel - - 2.8 0.006
Dioxins and dioxin like PCBs
- - 2 pg WHO-TEQ/kg bw/day
To allow comparison with the TDI for dioxins, intake values for each dioxin are multiplied by
a factor known as the WHO-TEF. A full list of the WHO-TEF values for each dioxin is provided
in Appendix A.
The following table presents the MDI for an adult and child as a proportion of the TDI.
Table 3.3: Mean Daily Intake of Each Substance as a % of the TDI
Substance
Mean Daily Intake, 70 kg adult
(µg/kg bw/day)
Mean Daily Intake, 20 kg child
(µg/kg bw/day)
Intake Ingestion Intake,
Inhalation Intake Ingestion
Intake, Inhalation
Cadmium 52.78% 21.43% 138.89% 50.00%
Chromium 60.33% - 131.33% -
Methyl mercury 3.04% - 8.26% -
Mercuric chloride 0.70% - 1.85% -
Nickel1 (screening)
67.86% 61.67% 177.14 160.00%
Nickel1 (based on monitoring data)
- 10.28% - 26.97%
Dioxins and dioxin like PCBs
35.00% 90.00%
1 Based on latest research by European Food Safety Authority
As shown, the cadmium, chromium and nickel from existing sources exceeds the MDI for
children.
GENT FAIRHEAD & CO FICHTNER
S1552-0700-0010RSF Rivenhall - Human Health Risk Assessment Page 6
The MDI for chromium is set for chromium III and taken from the DEFRA report
“Contaminants in Soil: Collation of Toxicological Data and Intake Values for Humans.
Chromium”. This states that there are no published reports on the adverse effects in humans
resulting from ingested chromium III. Almost all toxicological opinion, is that chromium III
compounds are of low oral toxicity, and indeed the UK Committee on Medial Aspects of Food
Policy recommends chromium III in the diet. The World Health Organisation (WHO) have
reviewed the daily intake of chromium from foods and found that existing levels do not
represent a toxicity problem. The WHO conclude that “in the form of trivalent compounds,
chromium is an essential nutrient and is relatively non-toxic for man and other mammalian
species”.
The DEFRA report explains that the TDI has been derived from the USEPA’s Reference Dose
of 3 µg/kg bw/day for chromium VI. This is the only explicitly derived safety limit for oral
exposures of chromium. DEFRA recommends that the USEPA Reference Dose is applied to all
the chromium content as a starting point. Therefore the TDI presented in Table 3.2 is actually
the TDI for chromium VI not chromium. Assessing the total dietary intake of chromium
against this TDI is highly conservative.
The key determinant of cadmium’s toxicity potential is its chronic accumulation in the kidney.
The Environment Agency in their toxicology report “SC050021/TOx 3) explain that chronic
exposure to levels in excess of the TDI might be associated with an increase in kidney disease
in a proportion of those exposed, but (small) exceedances lasting for shorter periods are of
less consequence. Therefore, assessing a lifetime exposure is appropriate. If we assess the
exposure of a receptor over a lifetime (i.e. a period as a child and adult) the lifetime MDI is
below the TDI.
The MDI and TDI (oral) for nickel has been revised following the publication by the European
Food Safety Authority of new expert opinion relating to the reproductive and developmental
effects in experimental animals. The MDI exceeds the TDI for children for both inhalation and
ingestion. The MDI for inhalation is 0.26 µg/day for an adult which, assuming an inhalation
rate of 20m3/day, equates to an atmospheric concentration of 13.0 ng/m3. A review of the
monitoring data of nickel across the UK between 2011 and 2015 has shown that
concentrations at rural background locations are 0.83 ng/m3 on average, with a maximum of
2.05 ng/m3. Therefore, the recommended MDI for inhalation is conservative for rural
locations, and so the MDI for inhalation is not expected to exceed the TDI in the area around
the facility. Applying this maximum background concentration, the MDI would be 0.04 µg/day
or 10.3% of the inhalation TDI for an adult and 26.6% of the TDI for a child. This has been
used as the value of the MDI for the remainder of this analysis.
GENT FAIRHEAD & CO FICHTNER
S1552-0700-0010RSF Rivenhall - Human Health Risk Assessment Page 7
4 CONCEPTUAL SITE MODEL
4.1 Conceptual site model
A detailed Human Health Risk Assessment has been carried out using the Industrial Risk
Assessment Program-Human Health (IRAP-h View – Version 4.0). The programme, created
by Lakes Environmental, is based on the United States Environment Protection Agency
(USEPA) Human Health Risk Assessment Protocol for Hazardous Waste Combustion
Facilities1. This Protocol is a development of the approach defined by Her Majesty’s
Inspectorate on Pollution (HMIP) in the UK in 19962, taking account of further research
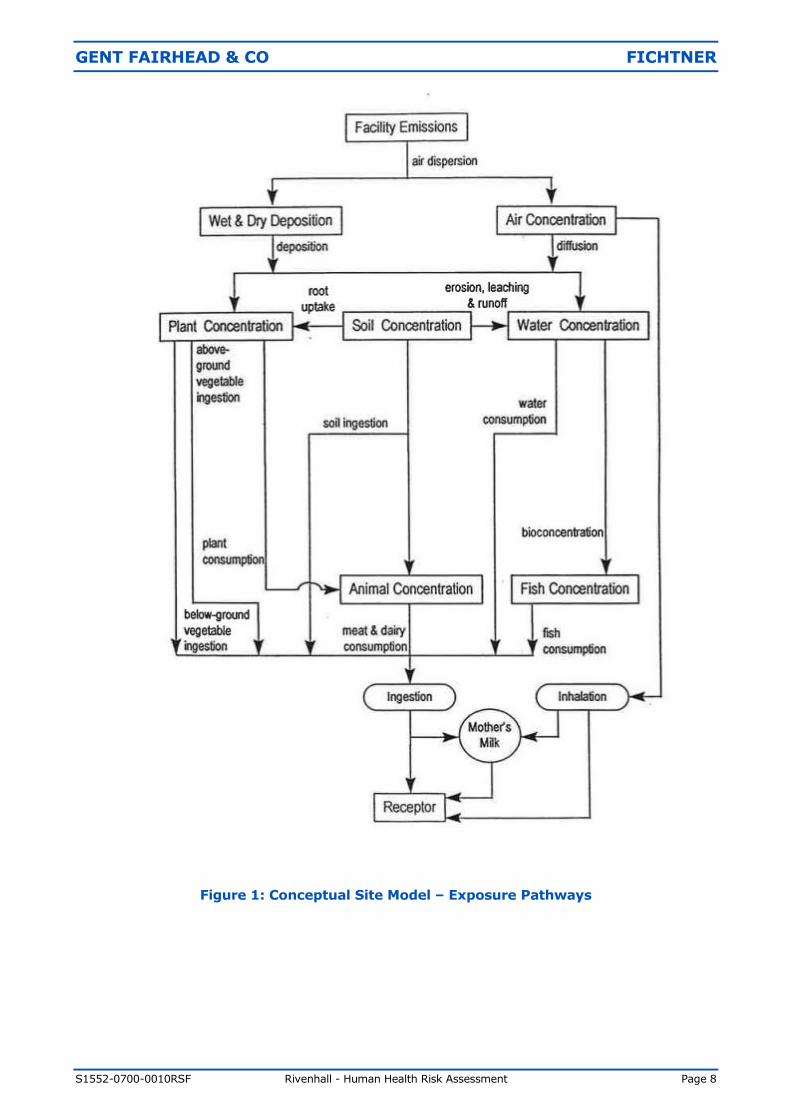
since that date. The exposure pathways included in the IRAP model are shown in Figure 1.
Exposure to gaseous contaminants has the potential to occur by direct inhalation or vapour
phase transfer to plants. In addition, exposure to particulate phase contaminants may
occur via indirect pathways following the deposition of particles to soil. These pathways
include:
Ingestion of soil and dust;
Uptake of contaminants from soil into the food-chain (through home-grown produce
and crops); and
Direct deposition of particles onto above ground crops.
The pathways through which inhalation and ingestion occur and the receptors that have
been considered to be impacted via each pathway are:
Direct inhalation All receptors
Ingestion of soil All receptors
Ingestion of home-grown produce All receptors
Ingestion of drinking water All receptors
Ingestion of eggs from home-grown chickens Agricultural receptors
Ingestion of home-grown chickens Agricultural receptors
Ingestion of home-grown beef Agricultural receptors
Ingestion of home-grown pork Agricultural receptors
Ingestion of home-grown milk Agricultural receptors
Ingestion of breast milk Infants only
It is noted that some households may keep chickens and consume eggs and potentially
the birds. The impact on these households is considered to be between the impact at an
agricultural receptor and a standard resident receptor. The approach used considers an
agricultural receptor at the point of maximum impact as a complete worst case.
As shown in Figure 1, the pathway from the ingestion of mother’s milk in infants is
considered within the assessment. This considers all dioxins and dioxin-like PCBs. The IRAP
model calculates the amount of these COPCs entering the mother’s milk and being passed
on to the infants. The impacts are then compared against the TDI.
1 USEPA (2005) Human Health Risk Assessment Protocol for Hazardous Waste Combustion Facilities. 2 HMIP (1996) Risk Assessment of Dioxin Releases from Municipal Waste Incineration Processes.
GENT FAIRHEAD & CO FICHTNER
S1552-0700-0010RSF Rivenhall - Human Health Risk Assessment Page 8
Figure 1: Conceptual Site Model – Exposure Pathways
GENT FAIRHEAD & CO FICHTNER
S1552-0700-0010RSF Rivenhall - Human Health Risk Assessment Page 9
4.2 Pathways excluded from assessment
The intake of dioxins via dermal absorption, groundwater and surface water exposure
pathways is very limited and as such these pathways are excluded from the HHRA. The
justification for excluding these pathways is highlighted in the following sections.
4.2.1 Dermal absorption
Both the HMIP and the USEPA note that the contribution from dermal exposure to soils
impacted from waste combustion facilities is typically a very minor pathway and is
typically very small relative to contributions resulting from exposures via the food chain.
The USEPA3 provide an example from the risk assessment conducted for the Waste
Technologies, Inc. hazardous waste incinerator in East Liverpool, Ohio. This indicated
that for an adult subsidence farmer in a subarea with high exposures, the risk resulting
from soil ingestion and dermal contact was 50-fold less than the risk from any other
pathway and 300-fold less than the total estimated risk.
The HMIP document4 provides a screening calculation using conservative assumptions,
which states for a 1 pg I-TEQ/m3 the intake via dermal absorption is 30 times lower
than the intake via inhalation, which is itself a minor contributor to the total risk.
As such the pathway from dermal absorption is deemed to be an insignificant risk and
has been excluded from this assessment.
4.2.2 Groundwater
Exposure via groundwater can only occur if the groundwater is contaminated and
consumed untreated by an individual.
The USEPA5 have concluded that the build up of dioxins in the aquifer over realistic
travel times relevant to human exposure was predicted to be so small as to be
essentially zero.
As such the pathway from groundwater is deemed to be an insignificant risk and has
been excluded from this assessment.
4.2.3 Surface water
It is noted that a possible pathway is via deposition of emissions directly onto surface
water, i.e local drinking water supplies or rainwater storage tanks.
Surface water generally goes through several treatment steps and as such any
contaminants would be removed from the water before consumption. It is noted that
run off to rainwater tanks may not go through the same treatment. However, rain water
tanks have a very small surface area and as such the potential for deposition and build
up of COPCs is limited. As such the pathway from contaminated surface water is deemed
to be an insignificant risk and has been excluded from this assessment.
4.2.4 Fish consumption
The consumption of locally caught fish has been excluded from the assessment. Whilst
it is noted that fish makes up a proportion of the UK diet, it is not likely that this would
be sourced wide-scale from close proximity to the Facility as the majority of UK dietary
fish comes from marine habitats, not inland waterways.
3 USEPA (2005) Human Health Risk Assessment Protocol for Hazardous Waste Combustion Facilities.
4 HMIP (1996) Risk Assessment of Dioxin Releases from Municipal Waste Incineration Processes. 5 USEPA (2005) Human Health Risk Assessment Protocol for Hazardous Waste Combustion Facilities.
GENT FAIRHEAD & CO FICHTNER
S1552-0700-0010RSF Rivenhall - Human Health Risk Assessment Page 10
A review of the local waterbodies has been undertaken to see if there are any game
fishing lakes in the local area (http://www.fisharound.net/where-to-fish/locations-
map). This has shown that the local waterbodies are all coarse fishing lakes which are
not routinely used for human consumption. The closest lake which both game and
course fishing takes place is Chigboro Fisheries which is approximately 9km to the south
east of the Facility. Whilst fish caught in this lake may be used for human consumption,
due to the distance from the facility this source has been excluded from the analysis.
No other game fishing lakes have been identified within 10km of the Facility.
It is noted that the Bradwell Trout Farm is located approximately 1.5km to the north of
the Facility. The Bradwell Trout Farm website explains that they produce rainbow trout
exclusively for the restaurant and catering trade and that the supply is limited. It is
highly unlikely that any fish caught would make up a significant proportion of the local
community’s diet. Therefore, this pathway has been excluded from this assessment,
based on professional judgement.
GENT FAIRHEAD & CO FICHTNER
S1552-0700-0010RSF Rivenhall - Human Health Risk Assessment Page 11
5 SENSITIVE RECEPTORS
This assessment considers the possible effects on human health at key receptors, where
humans are likely to be exposed to the greatest impact from the Facility, and at the point of
maximum impact of annual mean emissions.
For the purposes of this assessment, ‘Residential’ and ‘Agricultural’ receptors have been
identified and can be defined as follows:
Residential: A known place of residence that is occupied within the study area;
Agricultural: A farm holding or area land of horticultural interest.
The emissions from the Facility are expected to be significant only in the locality of the plant.
The specific receptors identified in the Air Quality Assessment have been considered in this
Assessment. In addition, a ‘Point of maximum impact’ receptor has been selected at the point
of maximum impact within fields close to the Facility (and within the adjacent quarry) from
annual mean process emissions, although it should be noted that this point is actually
uninhabited.
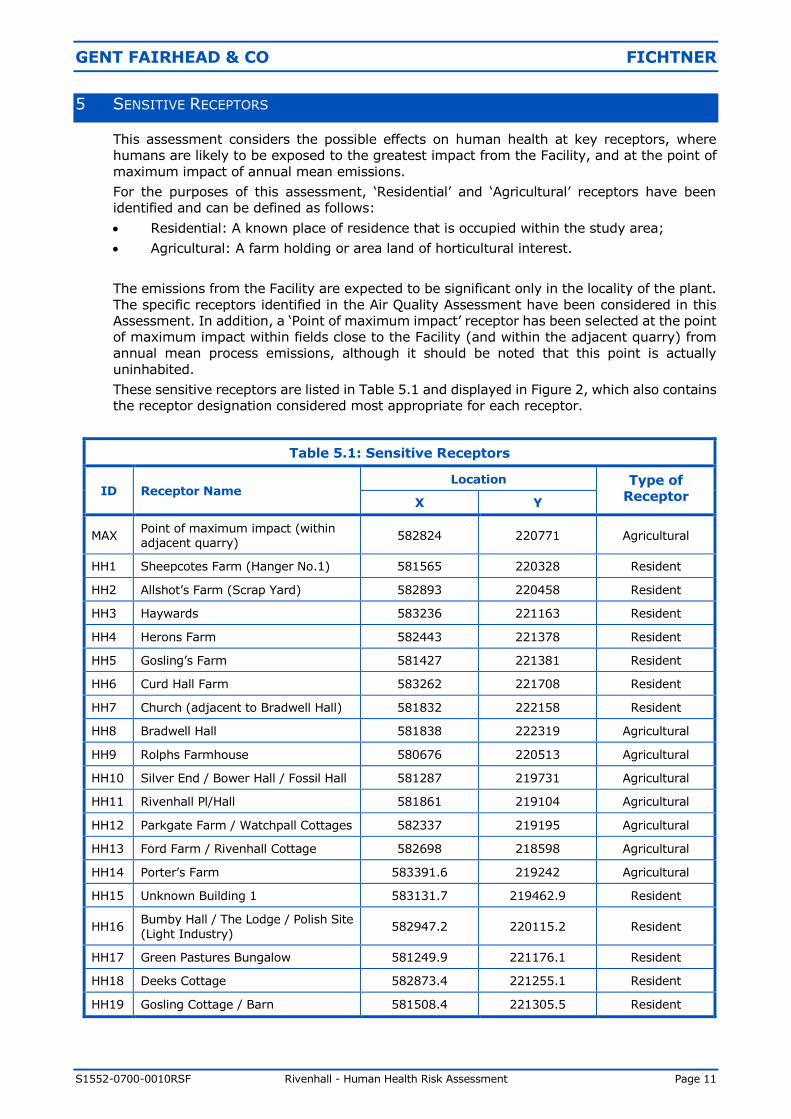
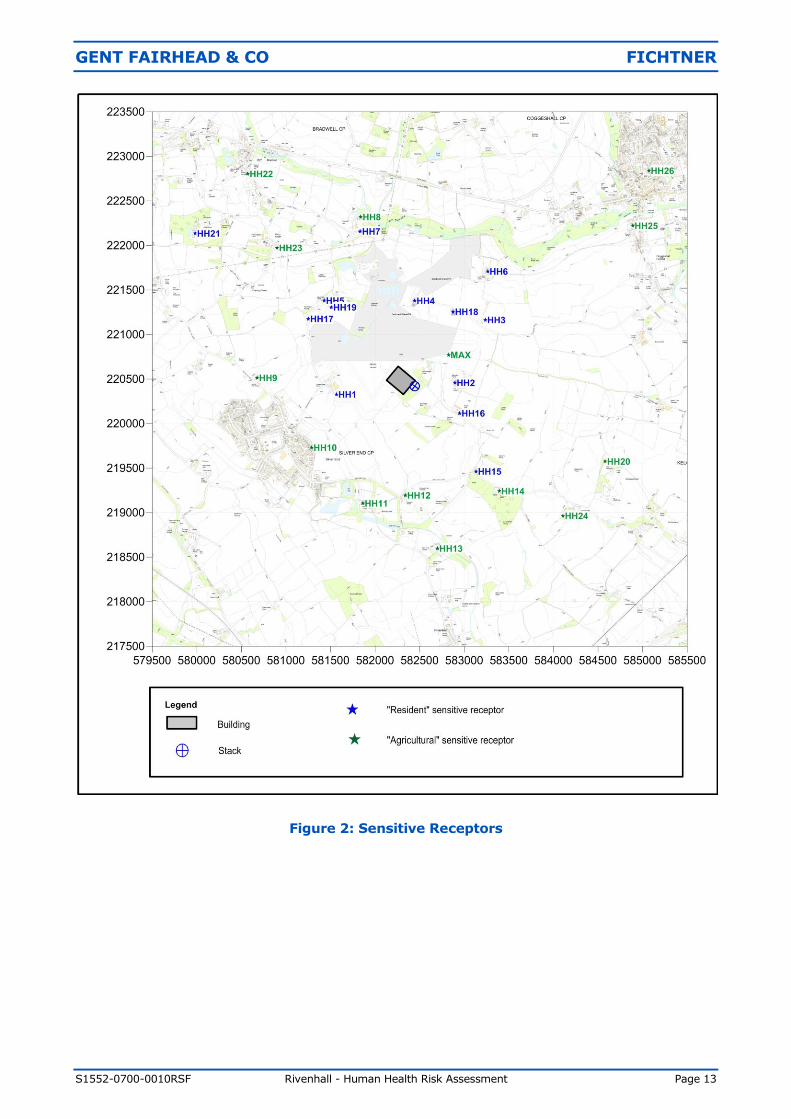
These sensitive receptors are listed in Table 5.1 and displayed in Figure 2, which also contains
the receptor designation considered most appropriate for each receptor.
Table 5.1: Sensitive Receptors
ID Receptor Name Location Type of
Receptor X Y
MAX Point of maximum impact (within adjacent quarry)
582824 220771 Agricultural
HH1 Sheepcotes Farm (Hanger No.1) 581565 220328 Resident
HH2 Allshot’s Farm (Scrap Yard) 582893 220458 Resident
HH3 Haywards 583236 221163 Resident
HH4 Herons Farm 582443 221378 Resident
HH5 Gosling’s Farm 581427 221381 Resident
HH6 Curd Hall Farm 583262 221708 Resident
HH7 Church (adjacent to Bradwell Hall) 581832 222158 Resident
HH8 Bradwell Hall 581838 222319 Agricultural
HH9 Rolphs Farmhouse 580676 220513 Agricultural
HH10 Silver End / Bower Hall / Fossil Hall 581287 219731 Agricultural
HH11 Rivenhall Pl/Hall 581861 219104 Agricultural
HH12 Parkgate Farm / Watchpall Cottages 582337 219195 Agricultural
HH13 Ford Farm / Rivenhall Cottage 582698 218598 Agricultural
HH14 Porter’s Farm 583391.6 219242 Agricultural
HH15 Unknown Building 1 583131.7 219462.9 Resident
HH16 Bumby Hall / The Lodge / Polish Site
(Light Industry) 582947.2 220115.2 Resident
HH17 Green Pastures Bungalow 581249.9 221176.1 Resident
HH18 Deeks Cottage 582873.4 221255.1 Resident
HH19 Gosling Cottage / Barn 581508.4 221305.5 Resident
GENT FAIRHEAD & CO FICHTNER
S1552-0700-0010RSF Rivenhall - Human Health Risk Assessment Page 12
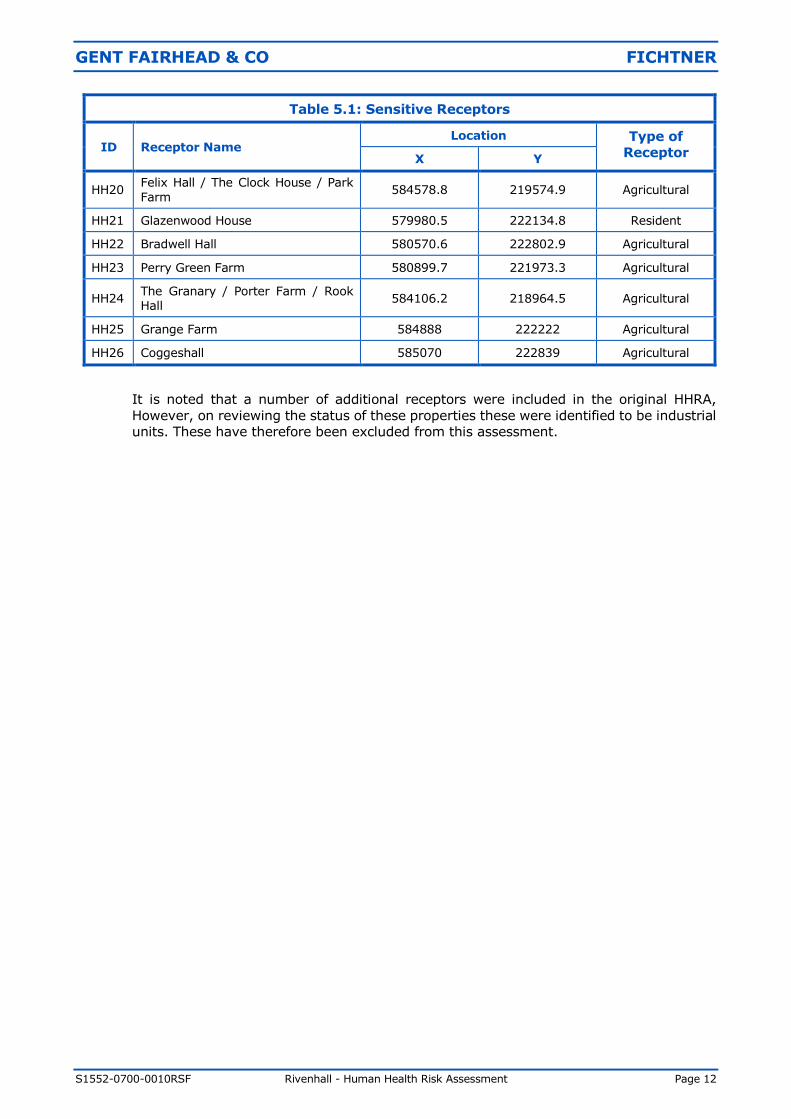
Table 5.1: Sensitive Receptors
ID Receptor Name Location Type of
Receptor X Y
HH20 Felix Hall / The Clock House / Park
Farm 584578.8 219574.9 Agricultural
HH21 Glazenwood House 579980.5 222134.8 Resident
HH22 Bradwell Hall 580570.6 222802.9 Agricultural
HH23 Perry Green Farm 580899.7 221973.3 Agricultural
HH24 The Granary / Porter Farm / Rook Hall
584106.2 218964.5 Agricultural
HH25 Grange Farm 584888 222222 Agricultural
HH26 Coggeshall 585070 222839 Agricultural
It is noted that a number of additional receptors were included in the original HHRA,
However, on reviewing the status of these properties these were identified to be industrial
units. These have therefore been excluded from this assessment.
GENT FAIRHEAD & CO FICHTNER
S1552-0700-0010RSF Rivenhall - Human Health Risk Assessment Page 13
Figure 2: Sensitive Receptors
GENT FAIRHEAD & CO FICHTNER
S1552-0700-0010RSF Rivenhall - Human Health Risk Assessment Page 14
6 IRAP MODEL ASSUMPTIONS AND INPUTS
The following section details the user defined assumptions used within the IRAP model and
provides justifications where appropriate.
6.1 Concentration in soil
The concentration of each chemical in the soil is calculated from the deposition results of
the air quality modelling for vapour phase and particle phase deposition. The critical
variables in calculating the accumulation of pollutants in the soil are as follows:
The lifetime of the Facility is taken as 30 years.
The soil mixing depth is taken as 2 cm in general and 15 cm for produce.
The split between the solid and vapour phase for the substance considered depends on the
specific physical properties of each chemical.
To assess the amount of substance which is lost from the soil each year through
volatilisation, leaching and surface run-off, a soil loss constant is calculated. The rates for
leaching and surface runoff are taken as constant, while the rate for volatilisation is
calculated from the physical properties of each substance.
6.2 Concentration in plants
The concentrations in plants are determined by considering direct deposition and air-to-
plant transfer for above ground produce, and root uptake for above ground and below
ground produce. The calculation takes account of the different types of plant; for example,
uptake of substances through the roots will differ for below ground and above ground
vegetables, and deposition onto plants will be more significant for above ground
vegetables.
6.3 Concentration in animals
The concentrations in animals, based on consumption of plants, are calculated from the
concentrations in plants, assumed consumption rates and bio-concentration factors. These
vary for different animals and different substances, since the transfer of chemicals between
the plants consumed and animal tissue varies.
It is also assumed that 100% of the plant materials eaten by animals is grown on soil
contaminated by emission sources. This is likely to be a highly pessimistic assumption for
UK farming practice.
6.4 Concentration in humans
6.4.1 Intake via inhalation
This is calculated from inhalation rates of typical adults and children and atmospheric
concentrations. The inhalation rates used for adults and children are:
Adults - 20 m3/day; and
Children – 7.2 m3/day.
These are as specified within the Environment Agency series of reports: “Contaminants
in soil: updated collation of toxicology data and intake values for humans”. The
calculation also takes account of time spent outside, since most people spend most of
their time indoors.
GENT FAIRHEAD & CO FICHTNER
S1552-0700-0010RSF Rivenhall - Human Health Risk Assessment Page 15
6.4.2 Intake via soil ingestion
This calculation allows for the ingestion of soil and takes account of different exposure
frequencies. It allows for ingestion of soil attached to unwashed vegetables, unintended
ingestion when farming or gardening and, for children, ingestion of soil when playing.
6.4.3 Ingestion of food
The calculation of exposure due to ingestion of food draws on the calculations of
concentrations in animals and plants and takes account of different ingestion rates for
the various food groups by different age groups.
For most people, locally-produced food is only a fraction of their diet and so exposure
factors are applied to allow for this.
6.4.4 Breast milk ingestion
For infants, the primary route of exposure is through breast milk. The calculation draws
on the exposure calculation for adults and then allows for the transfer of chemicals in
breast milk to an infant who is exclusively breast-fed.
The only pathway considered for dioxins for a breast fed infant is through breast milk.
The modelled scenario consists of the accumulation of pollutants in the food chain up to
an adult receptor, the accumulation of pollutants in breast milk and finally the
consumption of breast milk by an infant.
The assumptions used were:
Exposure duration of infant to breast milk 1 year
Proportion of ingested dioxin that is stored in fat 0.9%
Proportion of mothers weight that is stored in fat 0.3%
Fraction of fat in breast milk 0.04%
Fraction of ingested contaminant that is absorbed 0.9%
Half life of dioxins in adults 2,555 days
Ingestion rate of breast milk 0.688 kg/day
6.5 Estimation of COPC concentration in media
The IRAP-h model uses a database of physical and chemical parameters to calculate the
COPC concentrations through each of the different pathways identified. The base physical
and chemical parameters have been used in this assessment.
In order to calculate the COPC concentrations, a number of site specific pieces of
information are required.
Weather data was obtained for the period 2009-20136 from the Stansted weather
station, as used within the air quality dispersion modelling. This provides the annual
average precipitation which can be used to calculate the general IRAP-h input
parameters. Unfortunately, the dataset does not include data on precipitation rates.
Therefore, the annual average precipitation from Andrewsfield climatic monitoring
station between the years 1981-2010 has been used. Andrewsfield monitoring
station is located in Stebbing approximately 13km to the west of the Facility:
6 The periods 2009 to 2013 was chosen as this was the full set of data available at the time of starting air
quality modelling.
GENT FAIRHEAD & CO FICHTNER
S1552-0700-0010RSF Rivenhall - Human Health Risk Assessment Page 16
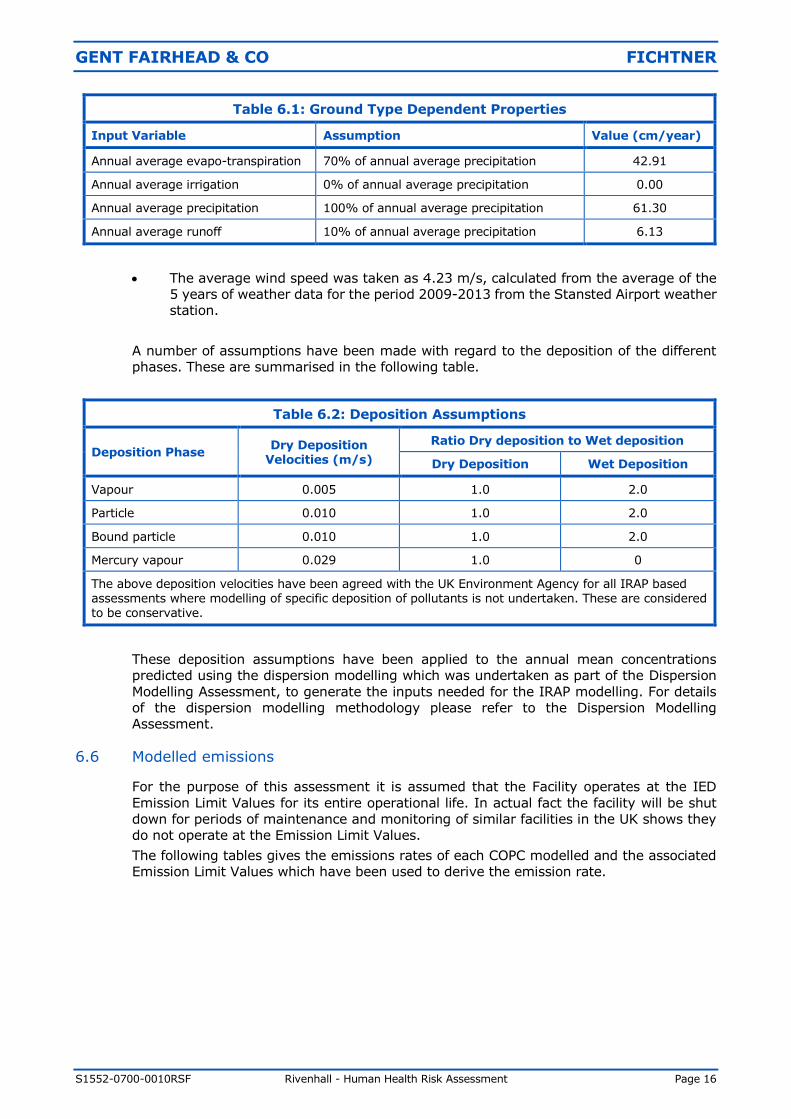
Table 6.1: Ground Type Dependent Properties
Input Variable Assumption Value (cm/year)
Annual average evapo-transpiration 70% of annual average precipitation 42.91
Annual average irrigation 0% of annual average precipitation 0.00
Annual average precipitation 100% of annual average precipitation 61.30
Annual average runoff 10% of annual average precipitation 6.13
The average wind speed was taken as 4.23 m/s, calculated from the average of the
5 years of weather data for the period 2009-2013 from the Stansted Airport weather
station.
A number of assumptions have been made with regard to the deposition of the different
phases. These are summarised in the following table.
Table 6.2: Deposition Assumptions
Deposition Phase Dry Deposition
Velocities (m/s)
Ratio Dry deposition to Wet deposition
Dry Deposition Wet Deposition
Vapour 0.005 1.0 2.0
Particle 0.010 1.0 2.0
Bound particle 0.010 1.0 2.0
Mercury vapour 0.029 1.0 0
The above deposition velocities have been agreed with the UK Environment Agency for all IRAP based assessments where modelling of specific deposition of pollutants is not undertaken. These are considered to be conservative.
These deposition assumptions have been applied to the annual mean concentrations
predicted using the dispersion modelling which was undertaken as part of the Dispersion
Modelling Assessment, to generate the inputs needed for the IRAP modelling. For details
of the dispersion modelling methodology please refer to the Dispersion Modelling
Assessment.
6.6 Modelled emissions
For the purpose of this assessment it is assumed that the Facility operates at the IED
Emission Limit Values for its entire operational life. In actual fact the facility will be shut
down for periods of maintenance and monitoring of similar facilities in the UK shows they
do not operate at the Emission Limit Values.
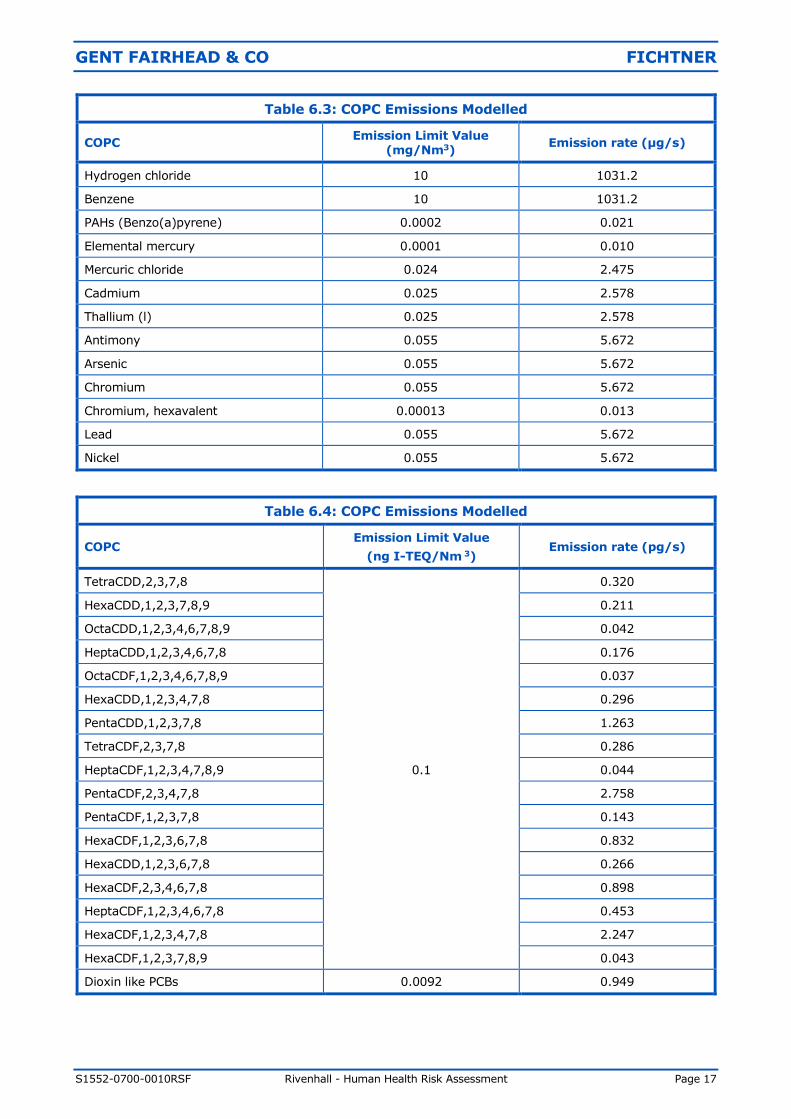
The following tables gives the emissions rates of each COPC modelled and the associated
Emission Limit Values which have been used to derive the emission rate.
GENT FAIRHEAD & CO FICHTNER
S1552-0700-0010RSF Rivenhall - Human Health Risk Assessment Page 17
Table 6.3: COPC Emissions Modelled
COPC Emission Limit Value
(mg/Nm3) Emission rate (µg/s)
Hydrogen chloride 10 1031.2
Benzene 10 1031.2
PAHs (Benzo(a)pyrene) 0.0002 0.021
Elemental mercury 0.0001 0.010
Mercuric chloride 0.024 2.475
Cadmium 0.025 2.578
Thallium (l) 0.025 2.578
Antimony 0.055 5.672
Arsenic 0.055 5.672
Chromium 0.055 5.672
Chromium, hexavalent 0.00013 0.013
Lead 0.055 5.672
Nickel 0.055 5.672
Table 6.4: COPC Emissions Modelled
COPC Emission Limit Value
(ng I-TEQ/Nm 3) Emission rate (pg/s)
TetraCDD,2,3,7,8
0.1
0.320
HexaCDD,1,2,3,7,8,9 0.211
OctaCDD,1,2,3,4,6,7,8,9 0.042
HeptaCDD,1,2,3,4,6,7,8 0.176
OctaCDF,1,2,3,4,6,7,8,9 0.037
HexaCDD,1,2,3,4,7,8 0.296
PentaCDD,1,2,3,7,8 1.263
TetraCDF,2,3,7,8 0.286
HeptaCDF,1,2,3,4,7,8,9 0.044
PentaCDF,2,3,4,7,8 2.758
PentaCDF,1,2,3,7,8 0.143
HexaCDF,1,2,3,6,7,8 0.832
HexaCDD,1,2,3,6,7,8 0.266
HexaCDF,2,3,4,6,7,8 0.898
HeptaCDF,1,2,3,4,6,7,8 0.453
HexaCDF,1,2,3,4,7,8 2.247
HexaCDF,1,2,3,7,8,9 0.043
Dioxin like PCBs 0.0092 0.949
GENT FAIRHEAD & CO FICHTNER
S1552-0700-0010RSF Rivenhall - Human Health Risk Assessment Page 18
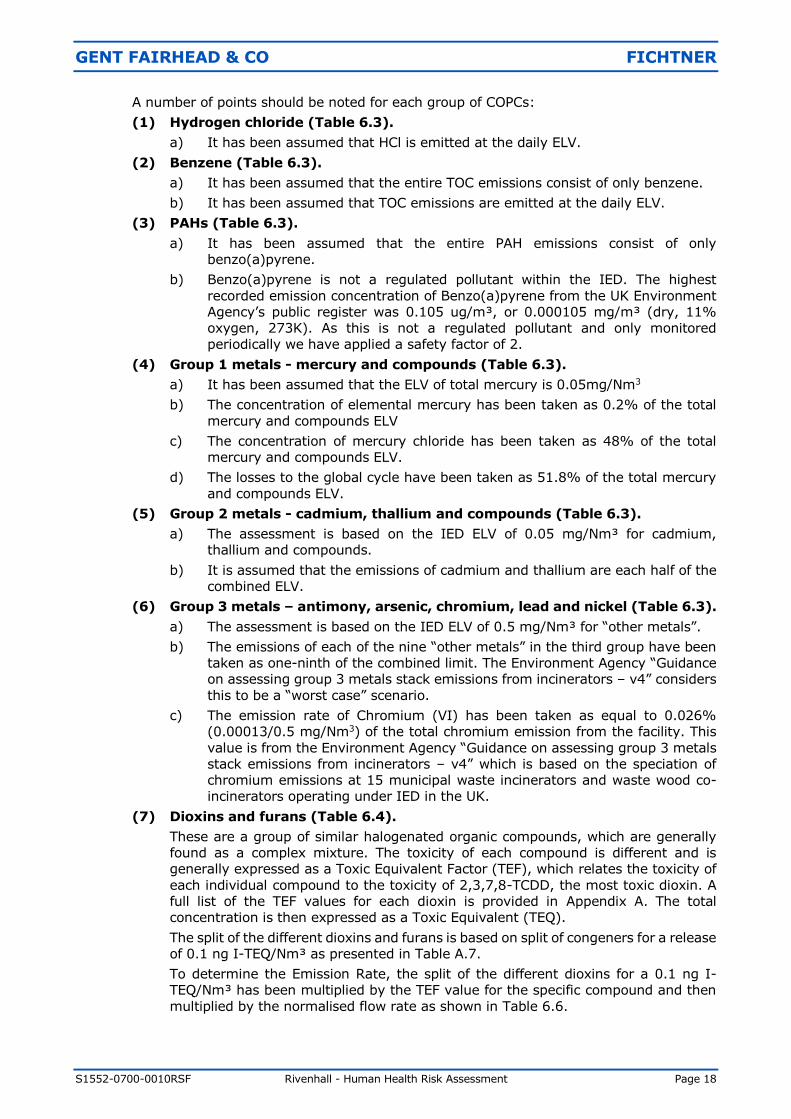
A number of points should be noted for each group of COPCs:
(1) Hydrogen chloride (Table 6.3).
a) It has been assumed that HCl is emitted at the daily ELV.
(2) Benzene (Table 6.3).
a) It has been assumed that the entire TOC emissions consist of only benzene.
b) It has been assumed that TOC emissions are emitted at the daily ELV.
(3) PAHs (Table 6.3).
a) It has been assumed that the entire PAH emissions consist of only
benzo(a)pyrene.
b) Benzo(a)pyrene is not a regulated pollutant within the IED. The highest
recorded emission concentration of Benzo(a)pyrene from the UK Environment
Agency’s public register was 0.105 ug/m³, or 0.000105 mg/m³ (dry, 11%
oxygen, 273K). As this is not a regulated pollutant and only monitored
periodically we have applied a safety factor of 2.
(4) Group 1 metals - mercury and compounds (Table 6.3).
a) It has been assumed that the ELV of total mercury is 0.05mg/Nm3
b) The concentration of elemental mercury has been taken as 0.2% of the total
mercury and compounds ELV
c) The concentration of mercury chloride has been taken as 48% of the total
mercury and compounds ELV.
d) The losses to the global cycle have been taken as 51.8% of the total mercury
and compounds ELV.
(5) Group 2 metals - cadmium, thallium and compounds (Table 6.3).
a) The assessment is based on the IED ELV of 0.05 mg/Nm³ for cadmium,
thallium and compounds.
b) It is assumed that the emissions of cadmium and thallium are each half of the
combined ELV.
(6) Group 3 metals – antimony, arsenic, chromium, lead and nickel (Table 6.3).
a) The assessment is based on the IED ELV of 0.5 mg/Nm³ for “other metals”.
b) The emissions of each of the nine “other metals” in the third group have been
taken as one-ninth of the combined limit. The Environment Agency “Guidance
on assessing group 3 metals stack emissions from incinerators – v4” considers
this to be a “worst case” scenario.
c) The emission rate of Chromium (VI) has been taken as equal to 0.026%
(0.00013/0.5 mg/Nm3) of the total chromium emission from the facility. This
value is from the Environment Agency “Guidance on assessing group 3 metals
stack emissions from incinerators – v4” which is based on the speciation of
chromium emissions at 15 municipal waste incinerators and waste wood co-
incinerators operating under IED in the UK.
(7) Dioxins and furans (Table 6.4).
These are a group of similar halogenated organic compounds, which are generally
found as a complex mixture. The toxicity of each compound is different and is
generally expressed as a Toxic Equivalent Factor (TEF), which relates the toxicity of
each individual compound to the toxicity of 2,3,7,8-TCDD, the most toxic dioxin. A
full list of the TEF values for each dioxin is provided in Appendix A. The total
concentration is then expressed as a Toxic Equivalent (TEQ).
The split of the different dioxins and furans is based on split of congeners for a release
of 0.1 ng I-TEQ/Nm³ as presented in Table A.7.
To determine the Emission Rate, the split of the different dioxins for a 0.1 ng I-
TEQ/Nm³ has been multiplied by the TEF value for the specific compound and then
multiplied by the normalised flow rate as shown in Table 6.6.
GENT FAIRHEAD & CO FICHTNER
S1552-0700-0010RSF Rivenhall - Human Health Risk Assessment Page 19
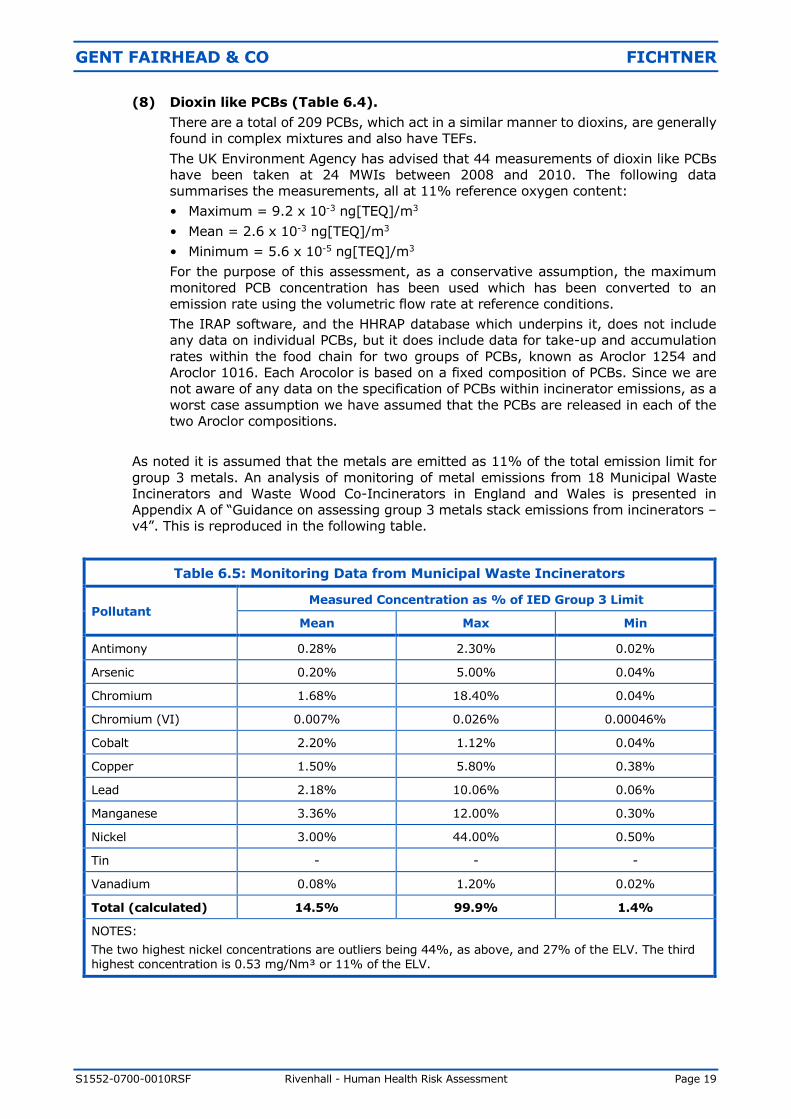
(8) Dioxin like PCBs (Table 6.4).
There are a total of 209 PCBs, which act in a similar manner to dioxins, are generally
found in complex mixtures and also have TEFs.
The UK Environment Agency has advised that 44 measurements of dioxin like PCBs
have been taken at 24 MWIs between 2008 and 2010. The following data
summarises the measurements, all at 11% reference oxygen content:
• Maximum = 9.2 x 10⁻³ ng[TEQ]/m3
• Mean = 2.6 x 10⁻³ ng[TEQ]/m3
• Minimum = 5.6 x 10⁻⁵ ng[TEQ]/m3
For the purpose of this assessment, as a conservative assumption, the maximum
monitored PCB concentration has been used which has been converted to an
emission rate using the volumetric flow rate at reference conditions.
The IRAP software, and the HHRAP database which underpins it, does not include
any data on individual PCBs, but it does include data for take-up and accumulation
rates within the food chain for two groups of PCBs, known as Aroclor 1254 and
Aroclor 1016. Each Arocolor is based on a fixed composition of PCBs. Since we are
not aware of any data on the specification of PCBs within incinerator emissions, as a
worst case assumption we have assumed that the PCBs are released in each of the
two Aroclor compositions.
As noted it is assumed that the metals are emitted as 11% of the total emission limit for
group 3 metals. An analysis of monitoring of metal emissions from 18 Municipal Waste
Incinerators and Waste Wood Co-Incinerators in England and Wales is presented in
Appendix A of “Guidance on assessing group 3 metals stack emissions from incinerators –
v4”. This is reproduced in the following table.
Table 6.5: Monitoring Data from Municipal Waste Incinerators
Pollutant Measured Concentration as % of IED Group 3 Limit
Mean Max Min
Antimony 0.28% 2.30% 0.02%
Arsenic 0.20% 5.00% 0.04%
Chromium 1.68% 18.40% 0.04%
Chromium (VI) 0.007% 0.026% 0.00046%
Cobalt 2.20% 1.12% 0.04%
Copper 1.50% 5.80% 0.38%
Lead 2.18% 10.06% 0.06%
Manganese 3.36% 12.00% 0.30%
Nickel 3.00% 44.00% 0.50%
Tin - - -
Vanadium 0.08% 1.20% 0.02%
Total (calculated) 14.5% 99.9% 1.4%
NOTES:
The two highest nickel concentrations are outliers being 44%, as above, and 27% of the ELV. The third highest concentration is 0.53 mg/Nm³ or 11% of the ELV.
GENT FAIRHEAD & CO FICHTNER
S1552-0700-0010RSF Rivenhall - Human Health Risk Assessment Page 20
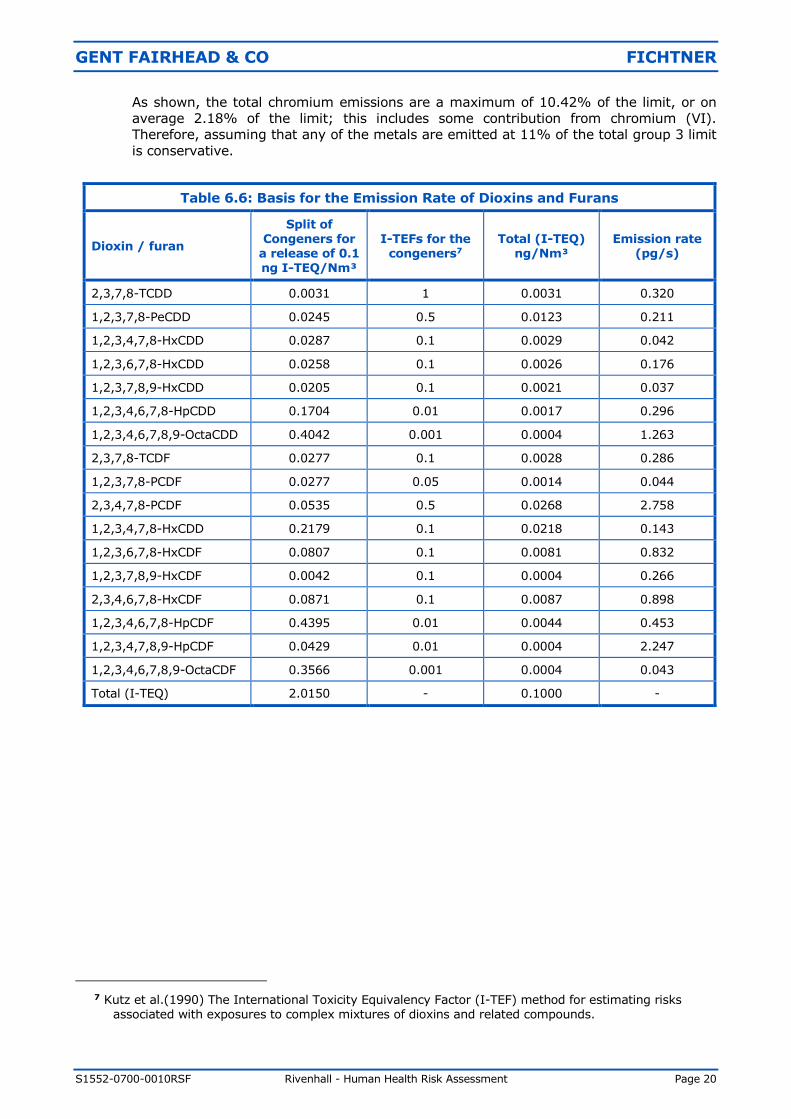
As shown, the total chromium emissions are a maximum of 10.42% of the limit, or on
average 2.18% of the limit; this includes some contribution from chromium (VI).
Therefore, assuming that any of the metals are emitted at 11% of the total group 3 limit
is conservative.
Table 6.6: Basis for the Emission Rate of Dioxins and Furans
Dioxin / furan
Split of Congeners for
a release of 0.1 ng I-TEQ/Nm³
I-TEFs for the congeners7
Total (I-TEQ) ng/Nm³
Emission rate (pg/s)
2,3,7,8-TCDD 0.0031 1 0.0031 0.320
1,2,3,7,8-PeCDD 0.0245 0.5 0.0123 0.211
1,2,3,4,7,8-HxCDD 0.0287 0.1 0.0029 0.042
1,2,3,6,7,8-HxCDD 0.0258 0.1 0.0026 0.176
1,2,3,7,8,9-HxCDD 0.0205 0.1 0.0021 0.037
1,2,3,4,6,7,8-HpCDD 0.1704 0.01 0.0017 0.296
1,2,3,4,6,7,8,9-OctaCDD 0.4042 0.001 0.0004 1.263
2,3,7,8-TCDF 0.0277 0.1 0.0028 0.286
1,2,3,7,8-PCDF 0.0277 0.05 0.0014 0.044
2,3,4,7,8-PCDF 0.0535 0.5 0.0268 2.758
1,2,3,4,7,8-HxCDD 0.2179 0.1 0.0218 0.143
1,2,3,6,7,8-HxCDF 0.0807 0.1 0.0081 0.832
1,2,3,7,8,9-HxCDF 0.0042 0.1 0.0004 0.266
2,3,4,6,7,8-HxCDF 0.0871 0.1 0.0087 0.898
1,2,3,4,6,7,8-HpCDF 0.4395 0.01 0.0044 0.453
1,2,3,4,7,8,9-HpCDF 0.0429 0.01 0.0004 2.247
1,2,3,4,6,7,8,9-OctaCDF 0.3566 0.001 0.0004 0.043
Total (I-TEQ) 2.0150 - 0.1000 -
7 Kutz et al.(1990) The International Toxicity Equivalency Factor (I-TEF) method for estimating risks
associated with exposures to complex mixtures of dioxins and related compounds.
GENT FAIRHEAD & CO FICHTNER
S1552-0700-0010RSF Rivenhall - Human Health Risk Assessment Page 21
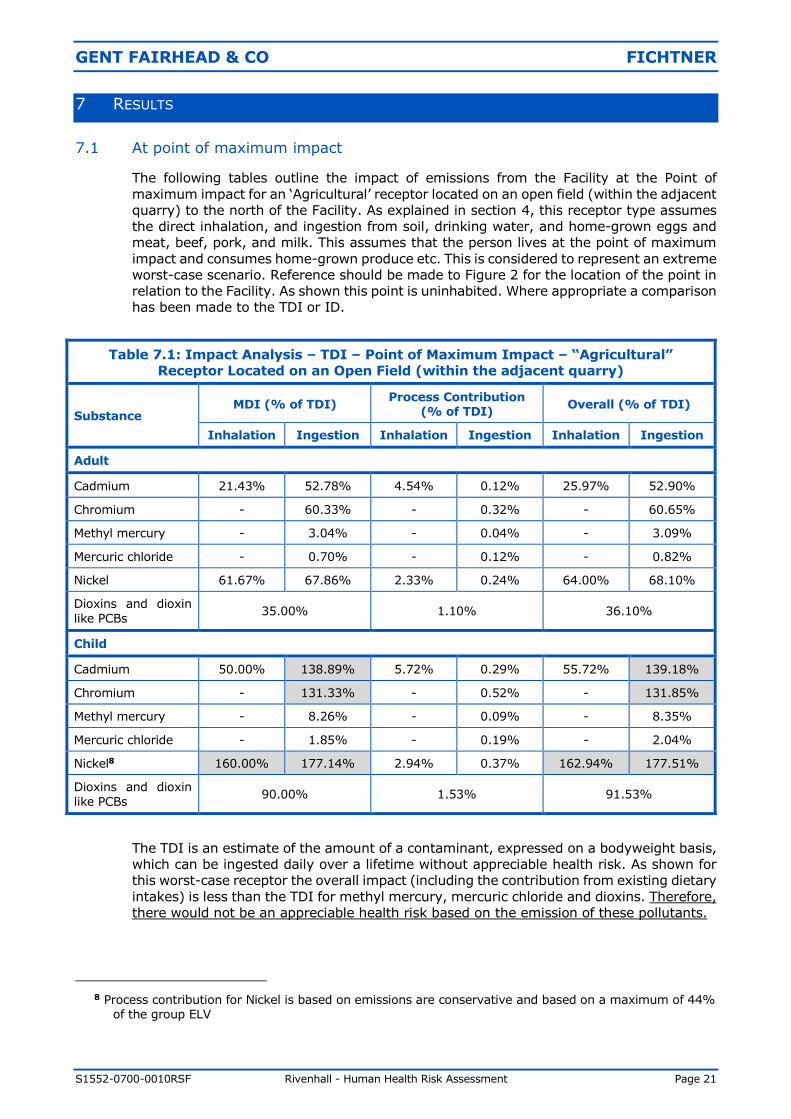
7 RESULTS
7.1 At point of maximum impact
The following tables outline the impact of emissions from the Facility at the Point of
maximum impact for an ‘Agricultural’ receptor located on an open field (within the adjacent
quarry) to the north of the Facility. As explained in section 4, this receptor type assumes
the direct inhalation, and ingestion from soil, drinking water, and home-grown eggs and
meat, beef, pork, and milk. This assumes that the person lives at the point of maximum
impact and consumes home-grown produce etc. This is considered to represent an extreme
worst-case scenario. Reference should be made to Figure 2 for the location of the point in
relation to the Facility. As shown this point is uninhabited. Where appropriate a comparison
has been made to the TDI or ID.
Table 7.1: Impact Analysis – TDI – Point of Maximum Impact – “Agricultural”
Receptor Located on an Open Field (within the adjacent quarry)
Substance MDI (% of TDI)
Process Contribution (% of TDI)
Overall (% of TDI)
Inhalation Ingestion Inhalation Ingestion Inhalation Ingestion
Adult
Cadmium 21.43% 52.78% 4.54% 0.12% 25.97% 52.90%
Chromium - 60.33% - 0.32% - 60.65%
Methyl mercury - 3.04% - 0.04% - 3.09%
Mercuric chloride - 0.70% - 0.12% - 0.82%
Nickel 61.67% 67.86% 2.33% 0.24% 64.00% 68.10%
Dioxins and dioxin
like PCBs 35.00% 1.10% 36.10%
Child
Cadmium 50.00% 138.89% 5.72% 0.29% 55.72% 139.18%
Chromium - 131.33% - 0.52% - 131.85%
Methyl mercury - 8.26% - 0.09% - 8.35%
Mercuric chloride - 1.85% - 0.19% - 2.04%
Nickel8 160.00% 177.14% 2.94% 0.37% 162.94% 177.51%
Dioxins and dioxin
like PCBs 90.00% 1.53% 91.53%
The TDI is an estimate of the amount of a contaminant, expressed on a bodyweight basis,
which can be ingested daily over a lifetime without appreciable health risk. As shown for
this worst-case receptor the overall impact (including the contribution from existing dietary
intakes) is less than the TDI for methyl mercury, mercuric chloride and dioxins. Therefore,
there would not be an appreciable health risk based on the emission of these pollutants.
8 Process contribution for Nickel is based on emissions are conservative and based on a maximum of 44%
of the group ELV
GENT FAIRHEAD & CO FICHTNER
S1552-0700-0010RSF Rivenhall - Human Health Risk Assessment Page 22
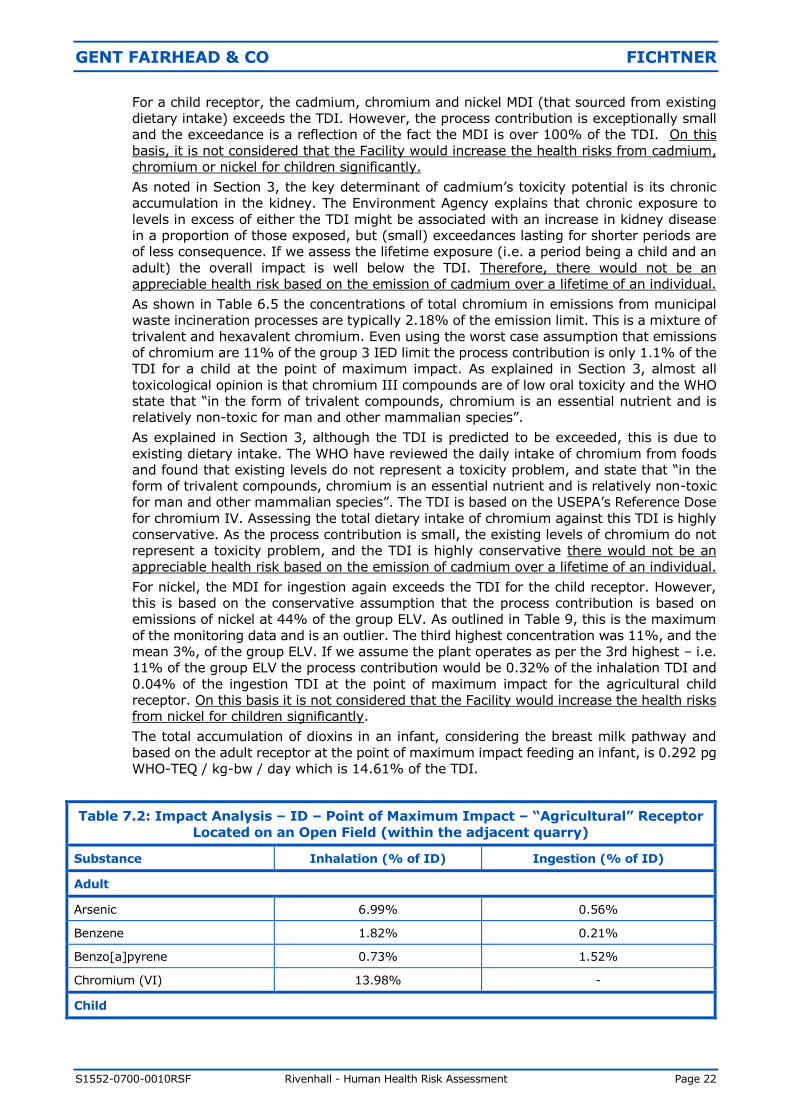
For a child receptor, the cadmium, chromium and nickel MDI (that sourced from existing
dietary intake) exceeds the TDI. However, the process contribution is exceptionally small
and the exceedance is a reflection of the fact the MDI is over 100% of the TDI. On this
basis, it is not considered that the Facility would increase the health risks from cadmium,
chromium or nickel for children significantly.
As noted in Section 3, the key determinant of cadmium’s toxicity potential is its chronic
accumulation in the kidney. The Environment Agency explains that chronic exposure to
levels in excess of either the TDI might be associated with an increase in kidney disease
in a proportion of those exposed, but (small) exceedances lasting for shorter periods are
of less consequence. If we assess the lifetime exposure (i.e. a period being a child and an
adult) the overall impact is well below the TDI. Therefore, there would not be an
appreciable health risk based on the emission of cadmium over a lifetime of an individual.
As shown in Table 6.5 the concentrations of total chromium in emissions from municipal
waste incineration processes are typically 2.18% of the emission limit. This is a mixture of
trivalent and hexavalent chromium. Even using the worst case assumption that emissions
of chromium are 11% of the group 3 IED limit the process contribution is only 1.1% of the
TDI for a child at the point of maximum impact. As explained in Section 3, almost all
toxicological opinion is that chromium III compounds are of low oral toxicity and the WHO
state that “in the form of trivalent compounds, chromium is an essential nutrient and is
relatively non-toxic for man and other mammalian species”.
As explained in Section 3, although the TDI is predicted to be exceeded, this is due to
existing dietary intake. The WHO have reviewed the daily intake of chromium from foods
and found that existing levels do not represent a toxicity problem, and state that “in the
form of trivalent compounds, chromium is an essential nutrient and is relatively non-toxic
for man and other mammalian species”. The TDI is based on the USEPA’s Reference Dose
for chromium IV. Assessing the total dietary intake of chromium against this TDI is highly
conservative. As the process contribution is small, the existing levels of chromium do not
represent a toxicity problem, and the TDI is highly conservative there would not be an
appreciable health risk based on the emission of cadmium over a lifetime of an individual.
For nickel, the MDI for ingestion again exceeds the TDI for the child receptor. However,
this is based on the conservative assumption that the process contribution is based on
emissions of nickel at 44% of the group ELV. As outlined in Table 9, this is the maximum
of the monitoring data and is an outlier. The third highest concentration was 11%, and the
mean 3%, of the group ELV. If we assume the plant operates as per the 3rd highest – i.e.
11% of the group ELV the process contribution would be 0.32% of the inhalation TDI and
0.04% of the ingestion TDI at the point of maximum impact for the agricultural child
receptor. On this basis it is not considered that the Facility would increase the health risks
from nickel for children significantly.
The total accumulation of dioxins in an infant, considering the breast milk pathway and
based on the adult receptor at the point of maximum impact feeding an infant, is 0.292 pg
WHO-TEQ / kg-bw / day which is 14.61% of the TDI.
Table 7.2: Impact Analysis – ID – Point of Maximum Impact – “Agricultural” Receptor
Located on an Open Field (within the adjacent quarry)
Substance Inhalation (% of ID) Ingestion (% of ID)
Adult
Arsenic 6.99% 0.56%
Benzene 1.82% 0.21%
Benzo[a]pyrene 0.73% 1.52%
Chromium (VI) 13.98% -
Child
GENT FAIRHEAD & CO FICHTNER
S1552-0700-0010RSF Rivenhall - Human Health Risk Assessment Page 23
Table 7.2: Impact Analysis – ID – Point of Maximum Impact – “Agricultural” Receptor
Located on an Open Field (within the adjacent quarry)
Substance Inhalation (% of ID) Ingestion (% of ID)
Arsenic 8.81% 0.99%
Benzene 2.29% 0.50%
Benzo[a]pyrene 0.92% 2.20%
Chromium (VI) 17.61% -
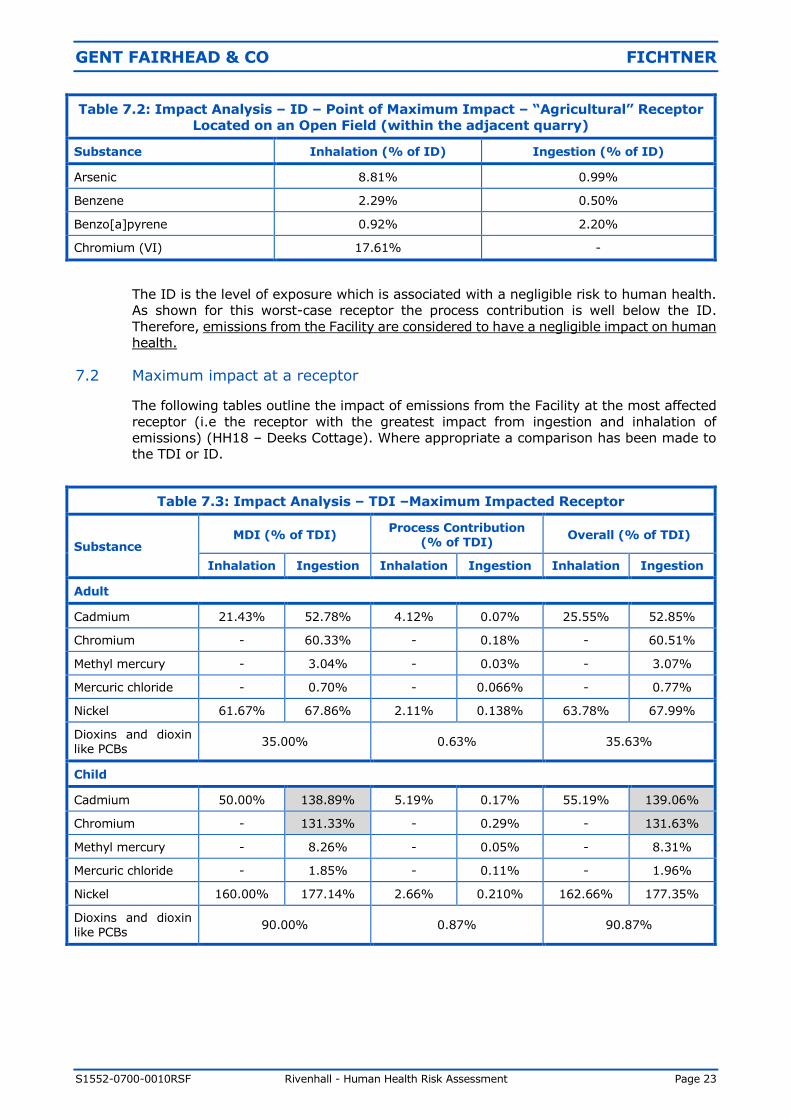
The ID is the level of exposure which is associated with a negligible risk to human health.
As shown for this worst-case receptor the process contribution is well below the ID.
Therefore, emissions from the Facility are considered to have a negligible impact on human
health.
7.2 Maximum impact at a receptor
The following tables outline the impact of emissions from the Facility at the most affected
receptor (i.e the receptor with the greatest impact from ingestion and inhalation of
emissions) (HH18 – Deeks Cottage). Where appropriate a comparison has been made to
the TDI or ID.
Table 7.3: Impact Analysis – TDI –Maximum Impacted Receptor
Substance MDI (% of TDI)
Process Contribution (% of TDI)
Overall (% of TDI)
Inhalation Ingestion Inhalation Ingestion Inhalation Ingestion
Adult
Cadmium 21.43% 52.78% 4.12% 0.07% 25.55% 52.85%
Chromium - 60.33% - 0.18% - 60.51%
Methyl mercury - 3.04% - 0.03% - 3.07%
Mercuric chloride - 0.70% - 0.066% - 0.77%
Nickel 61.67% 67.86% 2.11% 0.138% 63.78% 67.99%
Dioxins and dioxin like PCBs
35.00% 0.63% 35.63%
Child
Cadmium 50.00% 138.89% 5.19% 0.17% 55.19% 139.06%
Chromium - 131.33% - 0.29% - 131.63%
Methyl mercury - 8.26% - 0.05% - 8.31%
Mercuric chloride - 1.85% - 0.11% - 1.96%
Nickel 160.00% 177.14% 2.66% 0.210% 162.66% 177.35%
Dioxins and dioxin like PCBs
90.00% 0.87% 90.87%
GENT FAIRHEAD & CO FICHTNER
S1552-0700-0010RSF Rivenhall - Human Health Risk Assessment Page 24
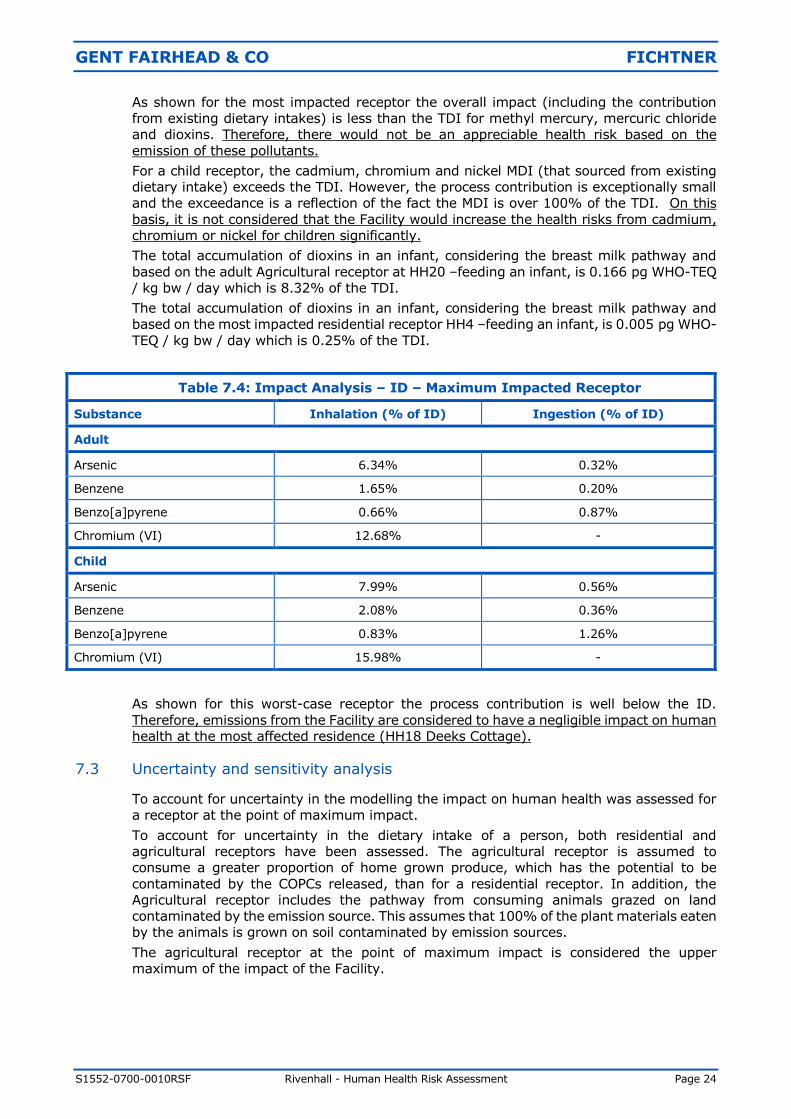
As shown for the most impacted receptor the overall impact (including the contribution
from existing dietary intakes) is less than the TDI for methyl mercury, mercuric chloride
and dioxins. Therefore, there would not be an appreciable health risk based on the
emission of these pollutants.
For a child receptor, the cadmium, chromium and nickel MDI (that sourced from existing
dietary intake) exceeds the TDI. However, the process contribution is exceptionally small
and the exceedance is a reflection of the fact the MDI is over 100% of the TDI. On this
basis, it is not considered that the Facility would increase the health risks from cadmium,
chromium or nickel for children significantly.
The total accumulation of dioxins in an infant, considering the breast milk pathway and
based on the adult Agricultural receptor at HH20 –feeding an infant, is 0.166 pg WHO-TEQ
/ kg bw / day which is 8.32% of the TDI.
The total accumulation of dioxins in an infant, considering the breast milk pathway and
based on the most impacted residential receptor HH4 –feeding an infant, is 0.005 pg WHO-
TEQ / kg bw / day which is 0.25% of the TDI.
Table 7.4: Impact Analysis – ID – Maximum Impacted Receptor
Substance Inhalation (% of ID) Ingestion (% of ID)
Adult
Arsenic 6.34% 0.32%
Benzene 1.65% 0.20%
Benzo[a]pyrene 0.66% 0.87%
Chromium (VI) 12.68% -
Child
Arsenic 7.99% 0.56%
Benzene 2.08% 0.36%
Benzo[a]pyrene 0.83% 1.26%
Chromium (VI) 15.98% -
As shown for this worst-case receptor the process contribution is well below the ID.
Therefore, emissions from the Facility are considered to have a negligible impact on human
health at the most affected residence (HH18 Deeks Cottage).
7.3 Uncertainty and sensitivity analysis
To account for uncertainty in the modelling the impact on human health was assessed for
a receptor at the point of maximum impact.
To account for uncertainty in the dietary intake of a person, both residential and
agricultural receptors have been assessed. The agricultural receptor is assumed to
consume a greater proportion of home grown produce, which has the potential to be
contaminated by the COPCs released, than for a residential receptor. In addition, the
Agricultural receptor includes the pathway from consuming animals grazed on land
contaminated by the emission source. This assumes that 100% of the plant materials eaten
by the animals is grown on soil contaminated by emission sources.
The agricultural receptor at the point of maximum impact is considered the upper
maximum of the impact of the Facility.
GENT FAIRHEAD & CO FICHTNER
S1552-0700-0010RSF Rivenhall - Human Health Risk Assessment Page 25
7.4 Upset process conditions
Article 46(6) of the IED (Directive 2010/75/EU) states that:
“… the waste incineration plant … shall under no circumstances continue to
incinerate waste for a period of more than 4 hours uninterrupted where emission
limit values are exceeded.
The cumulative duration or operation in such conditions over 1 year shall not exceed
60 hours.”
Article 47 continues with:
“In the case of a breakdown, the operator shall reduce or close down operations as
soon as practicable until normal operations can be restored.”
In addition Annex VI, Part 3, 2 of the IED states the emission limit values applicable in the
circumstances described in Article 46(6) and Article 47:
“The total dust concentration in the emissions into the air of a waste incineration
plant shall under no circumstances exceed 150 mg/Nm3 expressed as a half-hourly
average. The air emission limit values for TOC and CO set out in points 1.2 and
1.5(b) shall not be exceeded.”
The conditions detailed in Article 46(6) are considered to be “Upset Operating Conditions”.
As identified these periods are short term events which can only occur for a maximum of
60 hours per year.
Start-up of the Facility from cold will be conducted with clean support fuel (low sulphur
light fuel oil). During start-up waste will not be introduced onto the grate unless the
temperature within the oxidation zone is above the 850ºC as required by Article 50,
paragraph 4(a) of the IED. During start-up, the flue gas treatment plant will be operational
as will be the combustion control systems and emissions monitoring equipment.
The same is true during plant shutdown where waste will cease to be introduced to the
grate. The waste remaining on the grate will be combusted, the temperature not being
permitted to drop below 850ºC through the combustion of clean support auxiliary fuel.
During this period the flue gas treatment equipment is fully operational, as will be the
control systems and monitoring equipment. After complete combustion of the waste, the
auxiliary burners will be turned off and the plant will be allowed to cool.
Start-up and shutdown are infrequent events. The facility is designed to operate
continuously, and ideally only shutdown for its annual maintenance programme.
In relation to the magnitude of dioxin emissions during plant start-up and shutdown,
research has been undertaken by AEA Technology on behalf of the Environment Agency9.
Whilst elevated emissions of dioxins (within one order of magnitude) were found during
shutdown and start-up phases where the waste was not fully established in the combustion
chamber, the report concluded that:
“The mass of dioxin emitted during start-up and shutdown for a 4-5 day planned
outage was similar to the emission which would have occurred during normal
operation in the same period. The emission during the shutdown and restart is
equivalent to less than 1 % of the estimated annual emission (if operating normally
all year).”
There is therefore no reason why such start-up and shutdown operations or upset
operating conditions will affect the long term impact of the facility.
9 AEA Technology (2012) Review of research into health effects of Energy from Waste facilities.
GENT FAIRHEAD & CO FICHTNER
S1552-0700-0010RSF Rivenhall - Human Health Risk Assessment Page 26
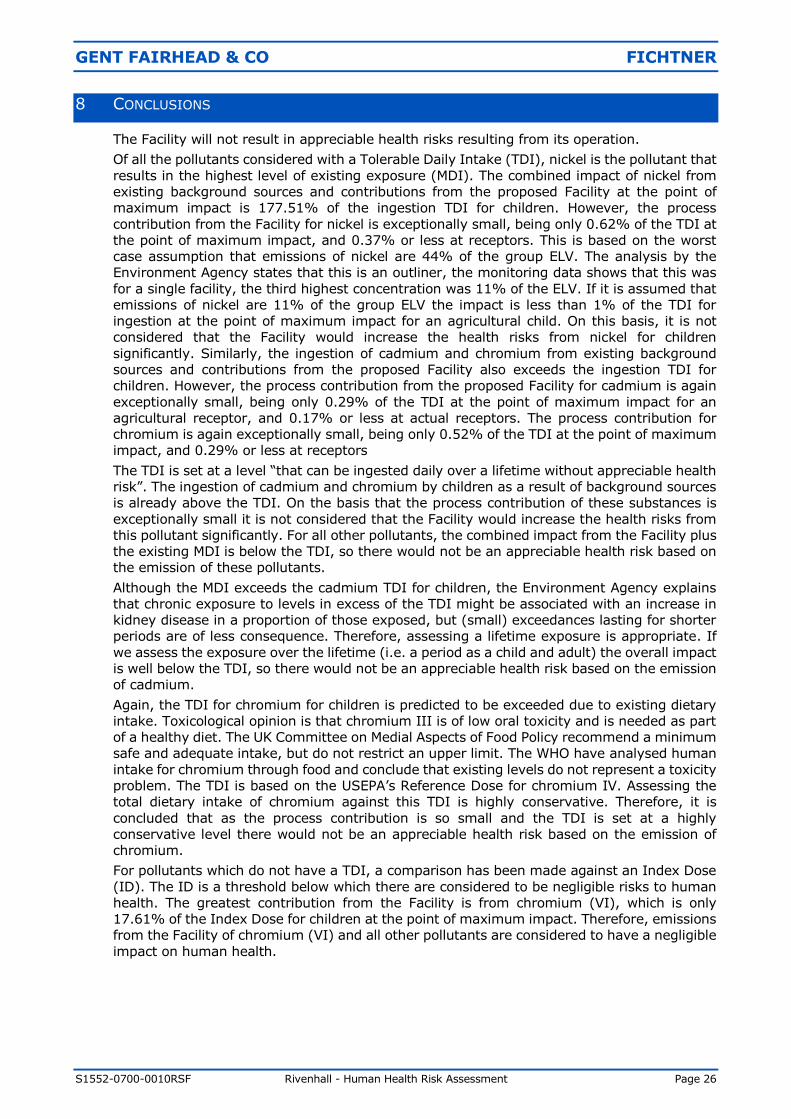
8 CONCLUSIONS
The Facility will not result in appreciable health risks resulting from its operation.
Of all the pollutants considered with a Tolerable Daily Intake (TDI), nickel is the pollutant that
results in the highest level of existing exposure (MDI). The combined impact of nickel from
existing background sources and contributions from the proposed Facility at the point of
maximum impact is 177.51% of the ingestion TDI for children. However, the process
contribution from the Facility for nickel is exceptionally small, being only 0.62% of the TDI at
the point of maximum impact, and 0.37% or less at receptors. This is based on the worst
case assumption that emissions of nickel are 44% of the group ELV. The analysis by the
Environment Agency states that this is an outliner, the monitoring data shows that this was
for a single facility, the third highest concentration was 11% of the ELV. If it is assumed that
emissions of nickel are 11% of the group ELV the impact is less than 1% of the TDI for
ingestion at the point of maximum impact for an agricultural child. On this basis, it is not
considered that the Facility would increase the health risks from nickel for children
significantly. Similarly, the ingestion of cadmium and chromium from existing background
sources and contributions from the proposed Facility also exceeds the ingestion TDI for
children. However, the process contribution from the proposed Facility for cadmium is again
exceptionally small, being only 0.29% of the TDI at the point of maximum impact for an
agricultural receptor, and 0.17% or less at actual receptors. The process contribution for
chromium is again exceptionally small, being only 0.52% of the TDI at the point of maximum
impact, and 0.29% or less at receptors
The TDI is set at a level “that can be ingested daily over a lifetime without appreciable health
risk”. The ingestion of cadmium and chromium by children as a result of background sources
is already above the TDI. On the basis that the process contribution of these substances is
exceptionally small it is not considered that the Facility would increase the health risks from
this pollutant significantly. For all other pollutants, the combined impact from the Facility plus
the existing MDI is below the TDI, so there would not be an appreciable health risk based on
the emission of these pollutants.
Although the MDI exceeds the cadmium TDI for children, the Environment Agency explains
that chronic exposure to levels in excess of the TDI might be associated with an increase in
kidney disease in a proportion of those exposed, but (small) exceedances lasting for shorter
periods are of less consequence. Therefore, assessing a lifetime exposure is appropriate. If
we assess the exposure over the lifetime (i.e. a period as a child and adult) the overall impact
is well below the TDI, so there would not be an appreciable health risk based on the emission
of cadmium.
Again, the TDI for chromium for children is predicted to be exceeded due to existing dietary
intake. Toxicological opinion is that chromium III is of low oral toxicity and is needed as part
of a healthy diet. The UK Committee on Medial Aspects of Food Policy recommend a minimum
safe and adequate intake, but do not restrict an upper limit. The WHO have analysed human
intake for chromium through food and conclude that existing levels do not represent a toxicity
problem. The TDI is based on the USEPA’s Reference Dose for chromium IV. Assessing the
total dietary intake of chromium against this TDI is highly conservative. Therefore, it is
concluded that as the process contribution is so small and the TDI is set at a highly
conservative level there would not be an appreciable health risk based on the emission of
chromium.
For pollutants which do not have a TDI, a comparison has been made against an Index Dose
(ID). The ID is a threshold below which there are considered to be negligible risks to human
health. The greatest contribution from the Facility is from chromium (VI), which is only
17.61% of the Index Dose for children at the point of maximum impact. Therefore, emissions
from the Facility of chromium (VI) and all other pollutants are considered to have a negligible
impact on human health.
GENT FAIRHEAD & CO FICHTNER
S1552-0700-0010RSF Rivenhall - Human Health Risk Assessment Page 27
In conclusion, the Facility will not result in appreciable health risks resulting from its operation.
This is the same conclusion reached in the original human health risk assessment(s)
completed by Golder Associates (UK) Ltd. This confirms that the design modifications that
have been made to the Facility since then have not changed the overall health risks resulting
from its operation.

GENT FAIRHEAD & CO FICHTNER
S1552-0700-0010RSF Rivenhall - Human Health Risk Assessment Page 28
Appendix A - Detailed Results Tables
GENT FAIRHEAD & CO FICHTNER
S1552-0700-0010RSF Rivenhall - Human Health Risk Assessment Page 29
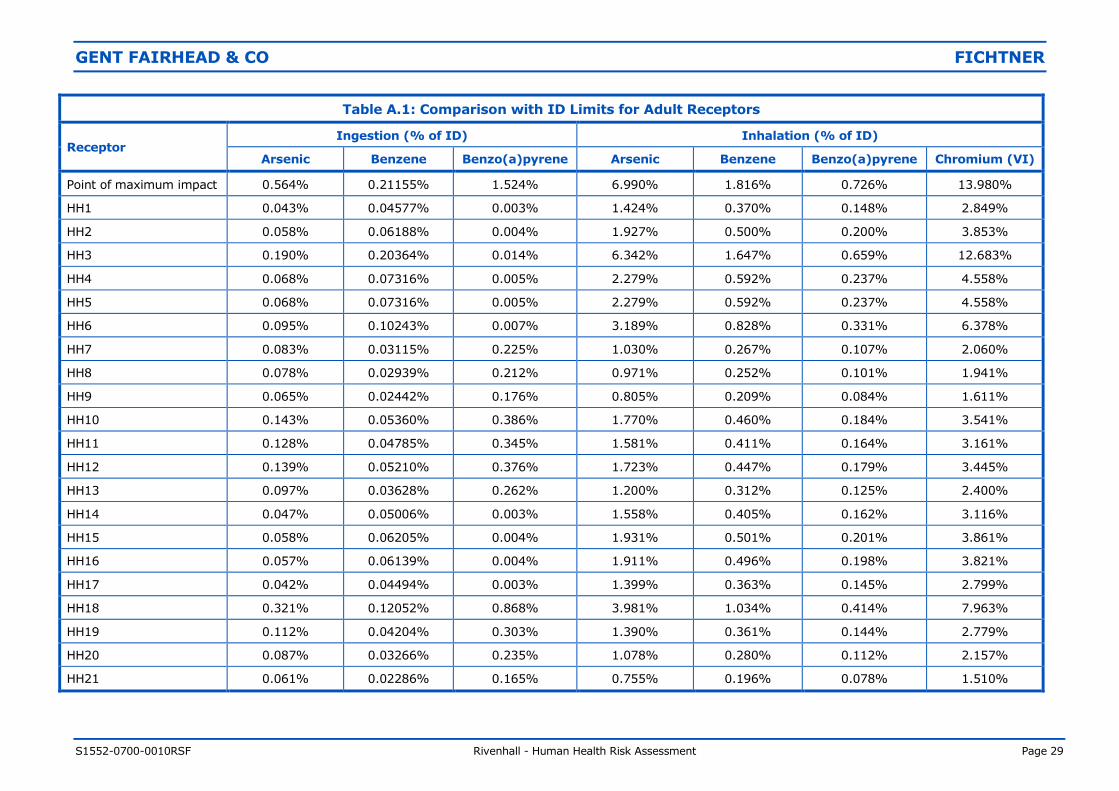
Table A.1: Comparison with ID Limits for Adult Receptors
Receptor Ingestion (% of ID) Inhalation (% of ID)
Arsenic Benzene Benzo(a)pyrene Arsenic Benzene Benzo(a)pyrene Chromium (VI)
Point of maximum impact 0.564% 0.21155% 1.524% 6.990% 1.816% 0.726% 13.980%
HH1 0.043% 0.04577% 0.003% 1.424% 0.370% 0.148% 2.849%
HH2 0.058% 0.06188% 0.004% 1.927% 0.500% 0.200% 3.853%
HH3 0.190% 0.20364% 0.014% 6.342% 1.647% 0.659% 12.683%
HH4 0.068% 0.07316% 0.005% 2.279% 0.592% 0.237% 4.558%
HH5 0.068% 0.07316% 0.005% 2.279% 0.592% 0.237% 4.558%
HH6 0.095% 0.10243% 0.007% 3.189% 0.828% 0.331% 6.378%
HH7 0.083% 0.03115% 0.225% 1.030% 0.267% 0.107% 2.060%
HH8 0.078% 0.02939% 0.212% 0.971% 0.252% 0.101% 1.941%
HH9 0.065% 0.02442% 0.176% 0.805% 0.209% 0.084% 1.611%
HH10 0.143% 0.05360% 0.386% 1.770% 0.460% 0.184% 3.541%
HH11 0.128% 0.04785% 0.345% 1.581% 0.411% 0.164% 3.161%
HH12 0.139% 0.05210% 0.376% 1.723% 0.447% 0.179% 3.445%
HH13 0.097% 0.03628% 0.262% 1.200% 0.312% 0.125% 2.400%
HH14 0.047% 0.05006% 0.003% 1.558% 0.405% 0.162% 3.116%
HH15 0.058% 0.06205% 0.004% 1.931% 0.501% 0.201% 3.861%
HH16 0.057% 0.06139% 0.004% 1.911% 0.496% 0.198% 3.821%
HH17 0.042% 0.04494% 0.003% 1.399% 0.363% 0.145% 2.799%
HH18 0.321% 0.12052% 0.868% 3.981% 1.034% 0.414% 7.963%
HH19 0.112% 0.04204% 0.303% 1.390% 0.361% 0.144% 2.779%
HH20 0.087% 0.03266% 0.235% 1.078% 0.280% 0.112% 2.157%
HH21 0.061% 0.02286% 0.165% 0.755% 0.196% 0.078% 1.510%
GENT FAIRHEAD & CO FICHTNER
S1552-0700-0010RSF Rivenhall - Human Health Risk Assessment Page 30
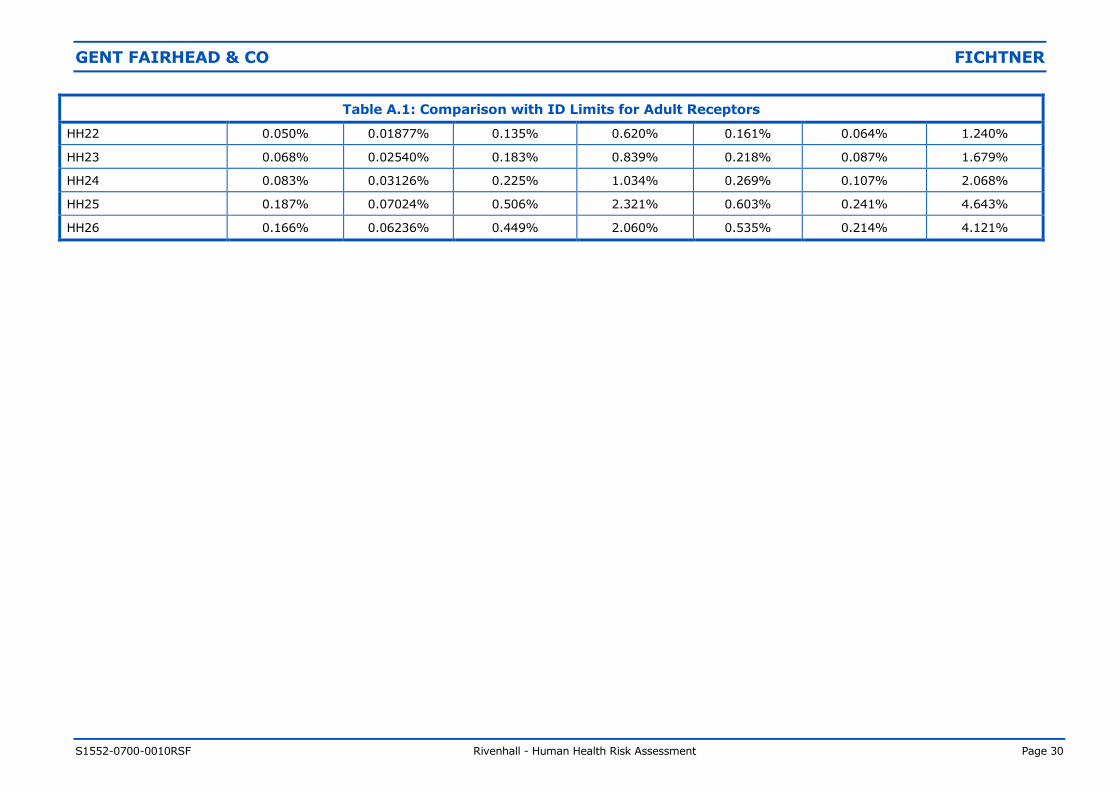
Table A.1: Comparison with ID Limits for Adult Receptors
HH22 0.050% 0.01877% 0.135% 0.620% 0.161% 0.064% 1.240%
HH23 0.068% 0.02540% 0.183% 0.839% 0.218% 0.087% 1.679%
HH24 0.083% 0.03126% 0.225% 1.034% 0.269% 0.107% 2.068%
HH25 0.187% 0.07024% 0.506% 2.321% 0.603% 0.241% 4.643%
HH26 0.166% 0.06236% 0.449% 2.060% 0.535% 0.214% 4.121%

GENT FAIRHEAD & CO FICHTNER
S1552-0700-0010RSF Rivenhall - Human Health Risk Assessment Page 31
Table A.2: Comparison with ID Limits for Child Receptors
Receptor Ingestion (% of ID) Inhalation (% of ID)
Arsenic Benzene Benzo(a)pyrene Arsenic Benzene Benzo(a)pyrene Chromium (VI)
Point of maximum impact 0.987% 0.496887% 2.204% 8.807% 2.288% 0.915% 17.614%
HH1 0.103% 0.081192% 0.008% 1.795% 0.466% 0.186% 3.589%
HH2 0.139% 0.109788% 0.011% 2.428% 0.631% 0.252% 4.855%
HH3 0.456% 0.361268% 0.037% 7.991% 2.075% 0.830% 15.981%
HH4 0.164% 0.129792% 0.013% 2.872% 0.746% 0.298% 5.743%
HH5 0.164% 0.129792% 0.013% 2.872% 0.746% 0.298% 5.743%
HH6 0.230% 0.181710% 0.019% 4.018% 1.044% 0.417% 8.036%
HH7 0.145% 0.073174% 0.325% 1.298% 0.337% 0.135% 2.595%
HH8 0.137% 0.069032% 0.306% 1.223% 0.318% 0.127% 2.446%
HH9 0.114% 0.057344% 0.254% 1.015% 0.264% 0.105% 2.030%
HH10 0.250% 0.125893% 0.558% 2.231% 0.579% 0.232% 4.461%
HH11 0.223% 0.112376% 0.498% 1.992% 0.517% 0.207% 3.983%
HH12 0.243% 0.122362% 0.543% 2.170% 0.564% 0.225% 4.341%
HH13 0.169% 0.085228% 0.378% 1.512% 0.393% 0.157% 3.024%
HH14 0.112% 0.088807% 0.009% 1.963% 0.510% 0.204% 3.926%
HH15 0.139% 0.110081% 0.011% 2.433% 0.632% 0.253% 4.865%
HH16 0.138% 0.108908% 0.011% 2.407% 0.625% 0.250% 4.815%
HH17 0.101% 0.079730% 0.008% 1.763% 0.458% 0.183% 3.526%
HH18 0.562% 0.283073% 1.255% 5.017% 1.303% 0.521% 10.033%
HH19 0.196% 0.098741% 0.438% 1.751% 0.455% 0.182% 3.502%
HH20 0.152% 0.076705% 0.340% 1.359% 0.353% 0.141% 2.718%
HH21 0.107% 0.053692% 0.238% 0.951% 0.247% 0.099% 1.903%
GENT FAIRHEAD & CO FICHTNER
S1552-0700-0010RSF Rivenhall - Human Health Risk Assessment Page 32
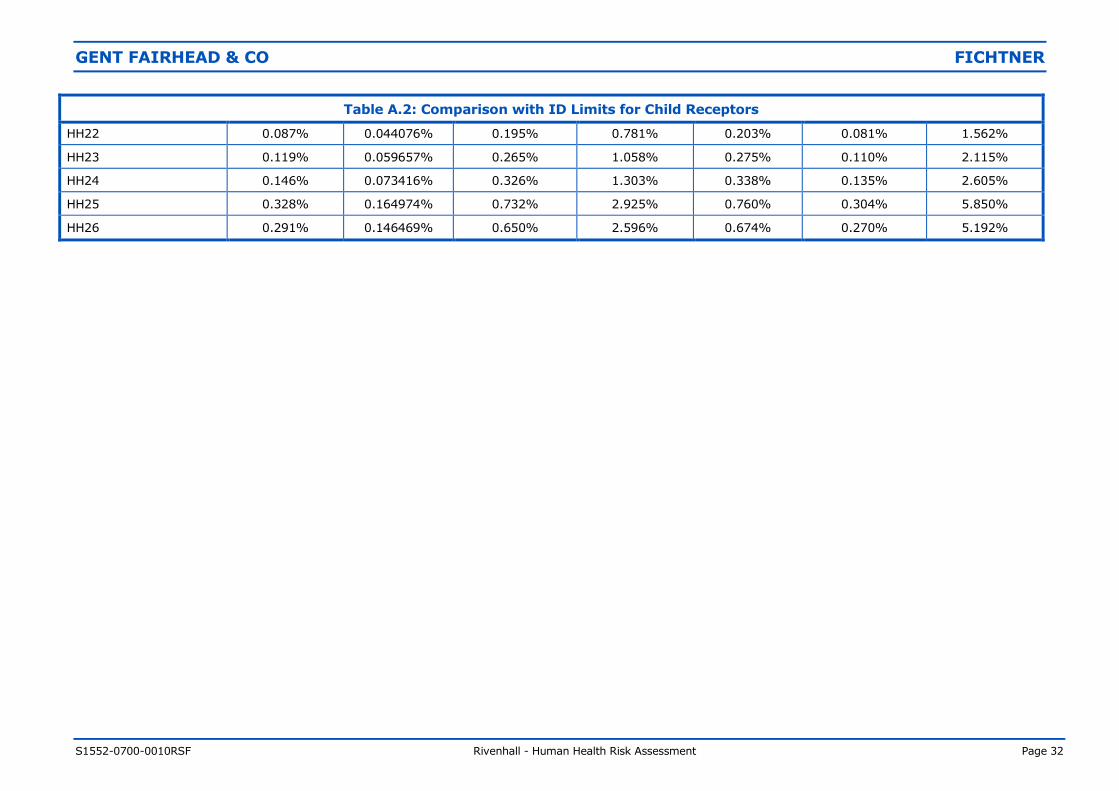
Table A.2: Comparison with ID Limits for Child Receptors
HH22 0.087% 0.044076% 0.195% 0.781% 0.203% 0.081% 1.562%
HH23 0.119% 0.059657% 0.265% 1.058% 0.275% 0.110% 2.115%
HH24 0.146% 0.073416% 0.326% 1.303% 0.338% 0.135% 2.605%
HH25 0.328% 0.164974% 0.732% 2.925% 0.760% 0.304% 5.850%
HH26 0.291% 0.146469% 0.650% 2.596% 0.674% 0.270% 5.192%
GENT FAIRHEAD & CO FICHTNER
S1552-0700-0010RSF Rivenhall - Human Health Risk Assessment Page 33
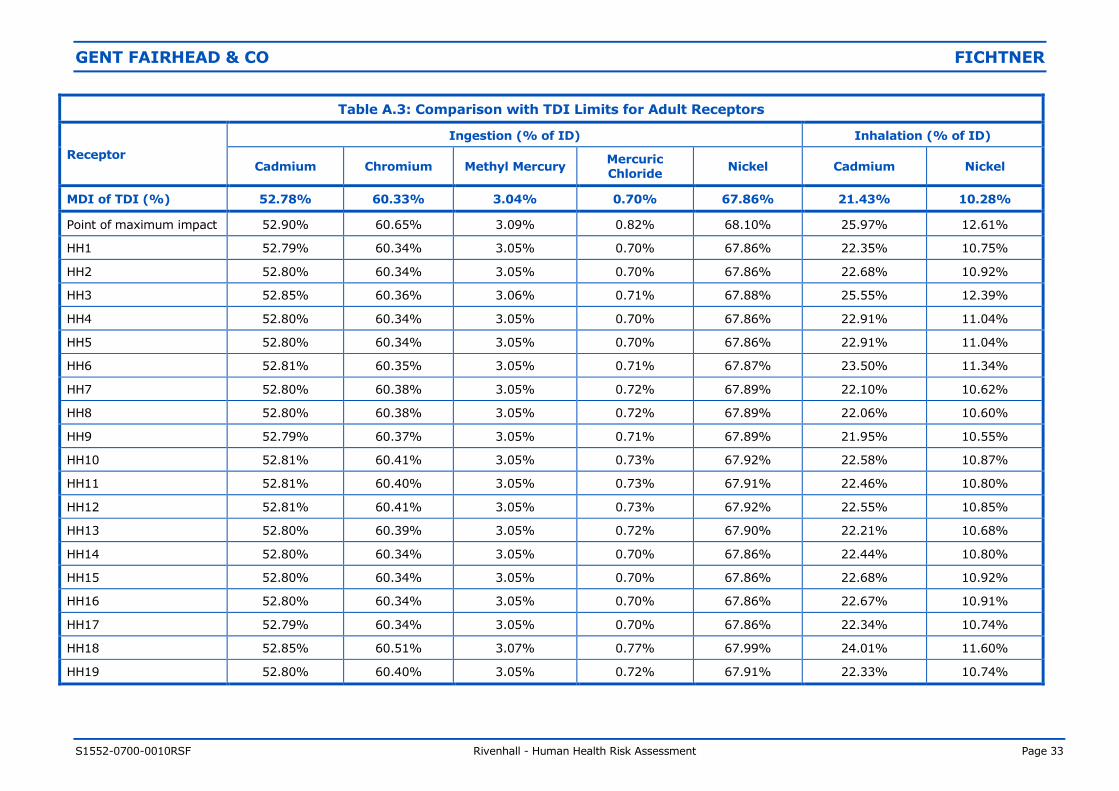
Table A.3: Comparison with TDI Limits for Adult Receptors
Receptor
Ingestion (% of ID) Inhalation (% of ID)
Cadmium Chromium Methyl Mercury Mercuric Chloride
Nickel Cadmium Nickel
MDI of TDI (%) 52.78% 60.33% 3.04% 0.70% 67.86% 21.43% 10.28%
Point of maximum impact 52.90% 60.65% 3.09% 0.82% 68.10% 25.97% 12.61%
HH1 52.79% 60.34% 3.05% 0.70% 67.86% 22.35% 10.75%
HH2 52.80% 60.34% 3.05% 0.70% 67.86% 22.68% 10.92%
HH3 52.85% 60.36% 3.06% 0.71% 67.88% 25.55% 12.39%
HH4 52.80% 60.34% 3.05% 0.70% 67.86% 22.91% 11.04%
HH5 52.80% 60.34% 3.05% 0.70% 67.86% 22.91% 11.04%
HH6 52.81% 60.35% 3.05% 0.71% 67.87% 23.50% 11.34%
HH7 52.80% 60.38% 3.05% 0.72% 67.89% 22.10% 10.62%
HH8 52.80% 60.38% 3.05% 0.72% 67.89% 22.06% 10.60%
HH9 52.79% 60.37% 3.05% 0.71% 67.89% 21.95% 10.55%
HH10 52.81% 60.41% 3.05% 0.73% 67.92% 22.58% 10.87%
HH11 52.81% 60.40% 3.05% 0.73% 67.91% 22.46% 10.80%
HH12 52.81% 60.41% 3.05% 0.73% 67.92% 22.55% 10.85%
HH13 52.80% 60.39% 3.05% 0.72% 67.90% 22.21% 10.68%
HH14 52.80% 60.34% 3.05% 0.70% 67.86% 22.44% 10.80%
HH15 52.80% 60.34% 3.05% 0.70% 67.86% 22.68% 10.92%
HH16 52.80% 60.34% 3.05% 0.70% 67.86% 22.67% 10.91%
HH17 52.79% 60.34% 3.05% 0.70% 67.86% 22.34% 10.74%
HH18 52.85% 60.51% 3.07% 0.77% 67.99% 24.01% 11.60%
HH19 52.80% 60.40% 3.05% 0.72% 67.91% 22.33% 10.74%
GENT FAIRHEAD & CO FICHTNER
S1552-0700-0010RSF Rivenhall - Human Health Risk Assessment Page 34
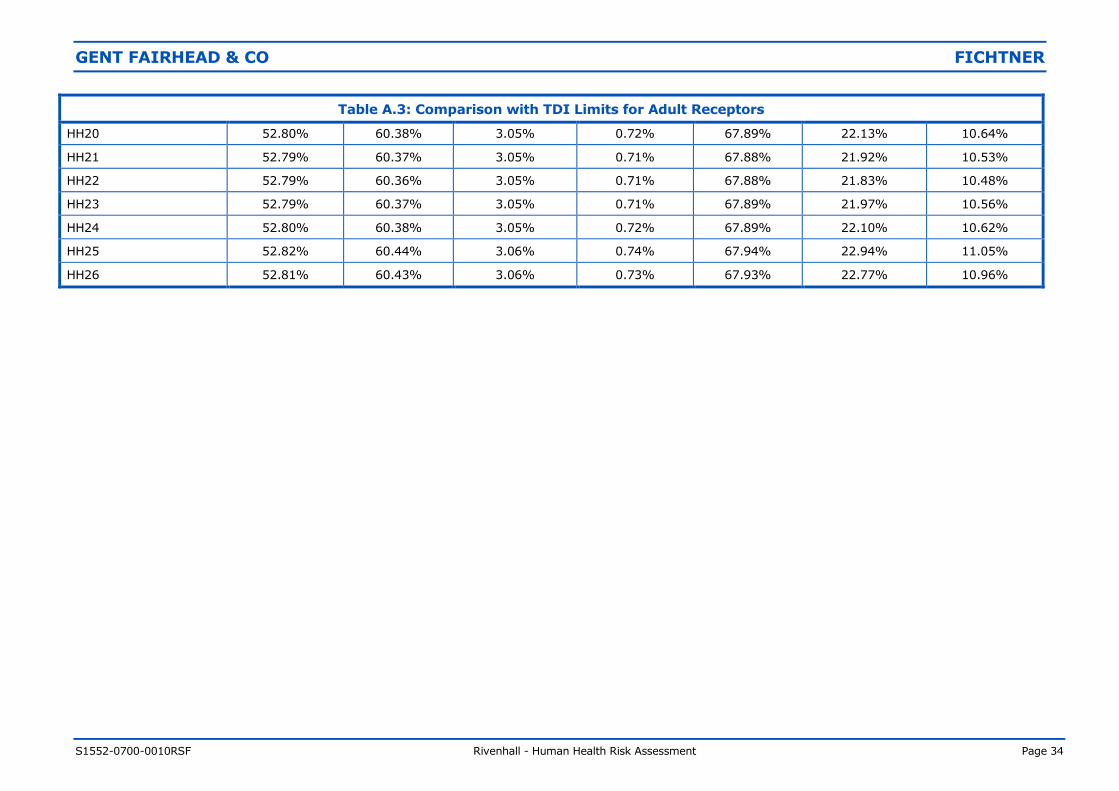
Table A.3: Comparison with TDI Limits for Adult Receptors
HH20 52.80% 60.38% 3.05% 0.72% 67.89% 22.13% 10.64%
HH21 52.79% 60.37% 3.05% 0.71% 67.88% 21.92% 10.53%
HH22 52.79% 60.36% 3.05% 0.71% 67.88% 21.83% 10.48%
HH23 52.79% 60.37% 3.05% 0.71% 67.89% 21.97% 10.56%
HH24 52.80% 60.38% 3.05% 0.72% 67.89% 22.10% 10.62%
HH25 52.82% 60.44% 3.06% 0.74% 67.94% 22.94% 11.05%
HH26 52.81% 60.43% 3.06% 0.73% 67.93% 22.77% 10.96%
GENT FAIRHEAD & CO FICHTNER
S1552-0700-0010RSF Rivenhall - Human Health Risk Assessment Page 35
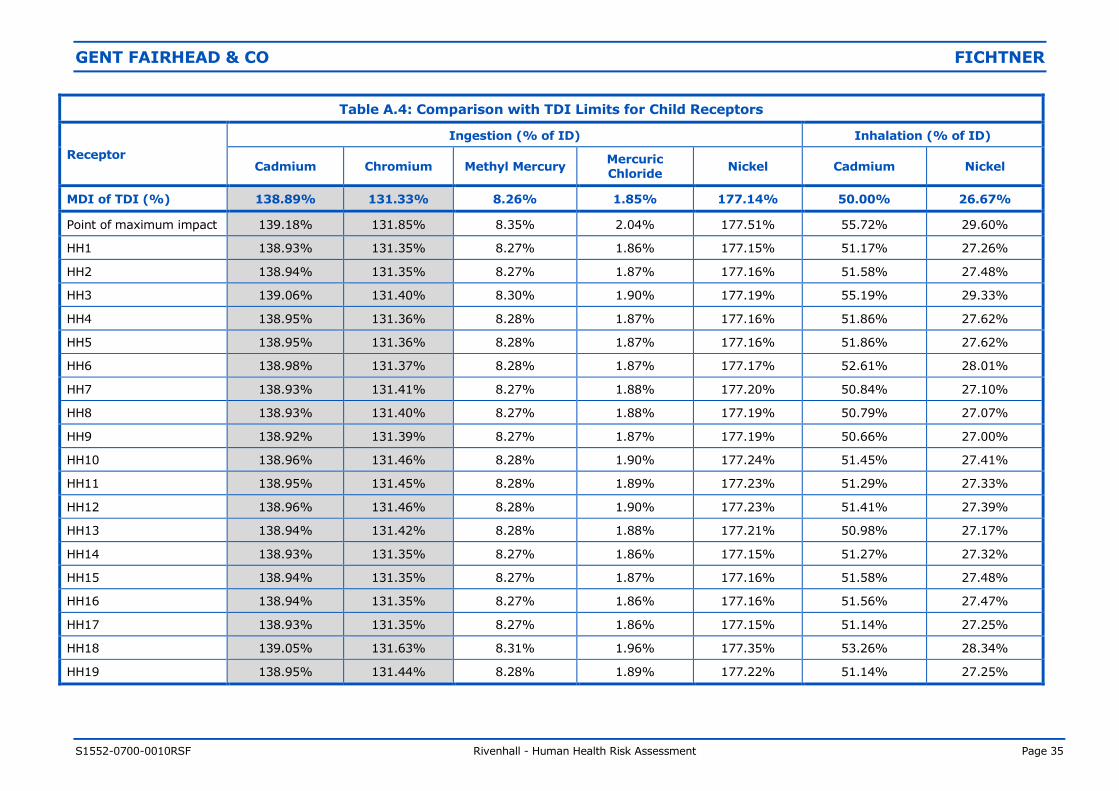
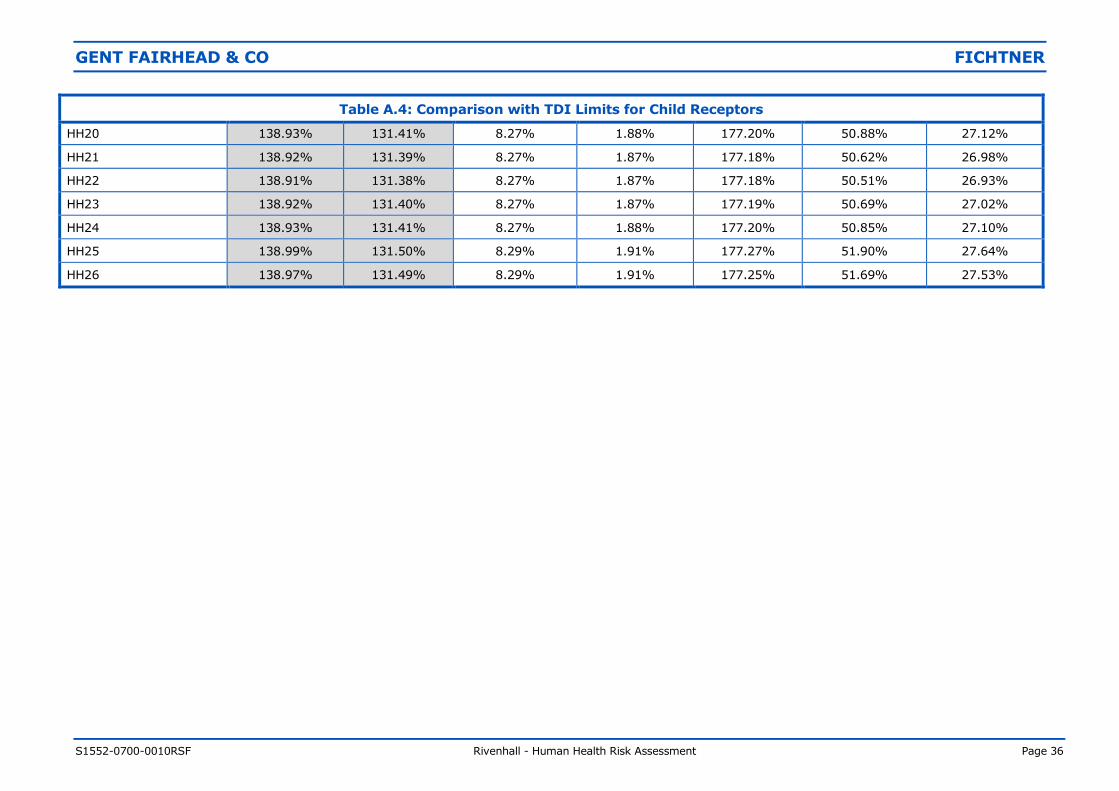
Table A.4: Comparison with TDI Limits for Child Receptors
Receptor
Ingestion (% of ID) Inhalation (% of ID)
Cadmium Chromium Methyl Mercury Mercuric Chloride
Nickel Cadmium Nickel
MDI of TDI (%) 138.89% 131.33% 8.26% 1.85% 177.14% 50.00% 26.67%
Point of maximum impact 139.18% 131.85% 8.35% 2.04% 177.51% 55.72% 29.60%
HH1 138.93% 131.35% 8.27% 1.86% 177.15% 51.17% 27.26%
HH2 138.94% 131.35% 8.27% 1.87% 177.16% 51.58% 27.48%
HH3 139.06% 131.40% 8.30% 1.90% 177.19% 55.19% 29.33%
HH4 138.95% 131.36% 8.28% 1.87% 177.16% 51.86% 27.62%
HH5 138.95% 131.36% 8.28% 1.87% 177.16% 51.86% 27.62%
HH6 138.98% 131.37% 8.28% 1.87% 177.17% 52.61% 28.01%
HH7 138.93% 131.41% 8.27% 1.88% 177.20% 50.84% 27.10%
HH8 138.93% 131.40% 8.27% 1.88% 177.19% 50.79% 27.07%
HH9 138.92% 131.39% 8.27% 1.87% 177.19% 50.66% 27.00%
HH10 138.96% 131.46% 8.28% 1.90% 177.24% 51.45% 27.41%
HH11 138.95% 131.45% 8.28% 1.89% 177.23% 51.29% 27.33%
HH12 138.96% 131.46% 8.28% 1.90% 177.23% 51.41% 27.39%
HH13 138.94% 131.42% 8.28% 1.88% 177.21% 50.98% 27.17%
HH14 138.93% 131.35% 8.27% 1.86% 177.15% 51.27% 27.32%
HH15 138.94% 131.35% 8.27% 1.87% 177.16% 51.58% 27.48%
HH16 138.94% 131.35% 8.27% 1.86% 177.16% 51.56% 27.47%
HH17 138.93% 131.35% 8.27% 1.86% 177.15% 51.14% 27.25%
HH18 139.05% 131.63% 8.31% 1.96% 177.35% 53.26% 28.34%
HH19 138.95% 131.44% 8.28% 1.89% 177.22% 51.14% 27.25%
GENT FAIRHEAD & CO FICHTNER
S1552-0700-0010RSF Rivenhall - Human Health Risk Assessment Page 36
Table A.4: Comparison with TDI Limits for Child Receptors
HH20 138.93% 131.41% 8.27% 1.88% 177.20% 50.88% 27.12%
HH21 138.92% 131.39% 8.27% 1.87% 177.18% 50.62% 26.98%
HH22 138.91% 131.38% 8.27% 1.87% 177.18% 50.51% 26.93%
HH23 138.92% 131.40% 8.27% 1.87% 177.19% 50.69% 27.02%
HH24 138.93% 131.41% 8.27% 1.88% 177.20% 50.85% 27.10%
HH25 138.99% 131.50% 8.29% 1.91% 177.27% 51.90% 27.64%
HH26 138.97% 131.49% 8.29% 1.91% 177.25% 51.69% 27.53%
GENT FAIRHEAD & CO FICHTNER
S1552-0700-0010RSF Rivenhall - Human Health Risk Assessment Page 37
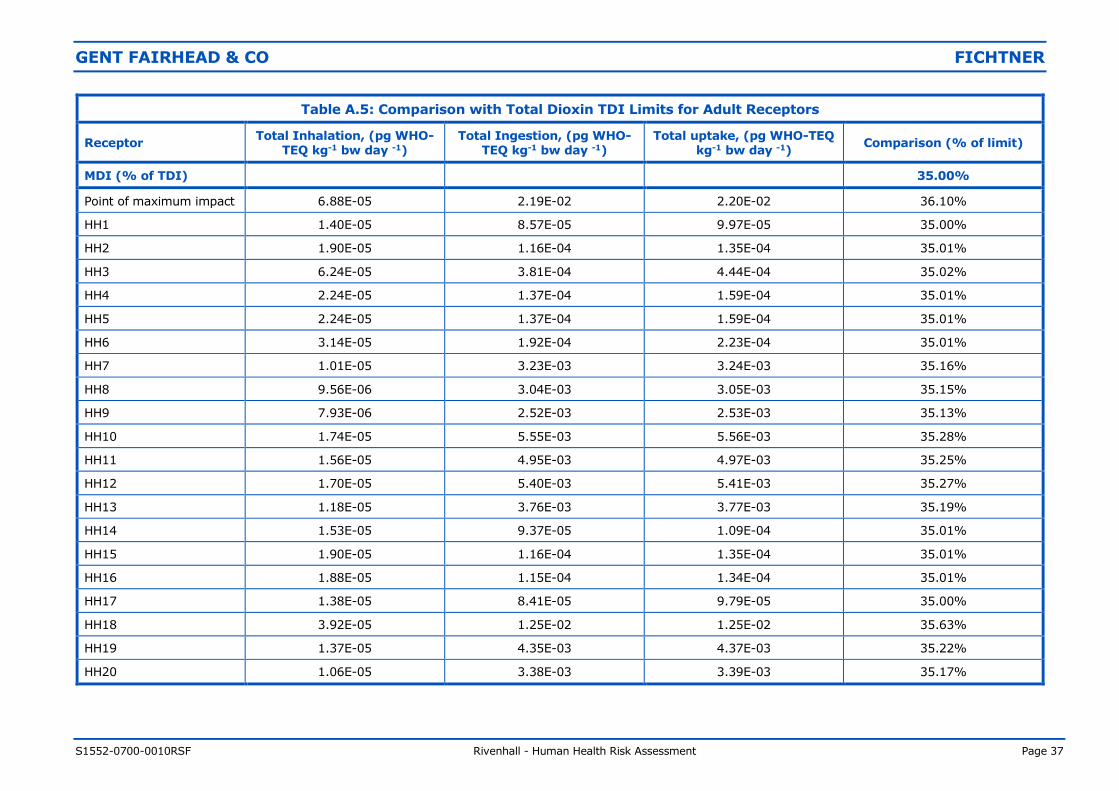
Table A.5: Comparison with Total Dioxin TDI Limits for Adult Receptors
Receptor Total Inhalation, (pg WHO-
TEQ kg-1 bw day -1) Total Ingestion, (pg WHO-
TEQ kg-1 bw day -1) Total uptake, (pg WHO-TEQ
kg-1 bw day -1) Comparison (% of limit)
MDI (% of TDI) 35.00%
Point of maximum impact 6.88E-05 2.19E-02 2.20E-02 36.10%
HH1 1.40E-05 8.57E-05 9.97E-05 35.00%
HH2 1.90E-05 1.16E-04 1.35E-04 35.01%
HH3 6.24E-05 3.81E-04 4.44E-04 35.02%
HH4 2.24E-05 1.37E-04 1.59E-04 35.01%
HH5 2.24E-05 1.37E-04 1.59E-04 35.01%
HH6 3.14E-05 1.92E-04 2.23E-04 35.01%
HH7 1.01E-05 3.23E-03 3.24E-03 35.16%
HH8 9.56E-06 3.04E-03 3.05E-03 35.15%
HH9 7.93E-06 2.52E-03 2.53E-03 35.13%
HH10 1.74E-05 5.55E-03 5.56E-03 35.28%
HH11 1.56E-05 4.95E-03 4.97E-03 35.25%
HH12 1.70E-05 5.40E-03 5.41E-03 35.27%
HH13 1.18E-05 3.76E-03 3.77E-03 35.19%
HH14 1.53E-05 9.37E-05 1.09E-04 35.01%
HH15 1.90E-05 1.16E-04 1.35E-04 35.01%
HH16 1.88E-05 1.15E-04 1.34E-04 35.01%
HH17 1.38E-05 8.41E-05 9.79E-05 35.00%
HH18 3.92E-05 1.25E-02 1.25E-02 35.63%
HH19 1.37E-05 4.35E-03 4.37E-03 35.22%
HH20 1.06E-05 3.38E-03 3.39E-03 35.17%
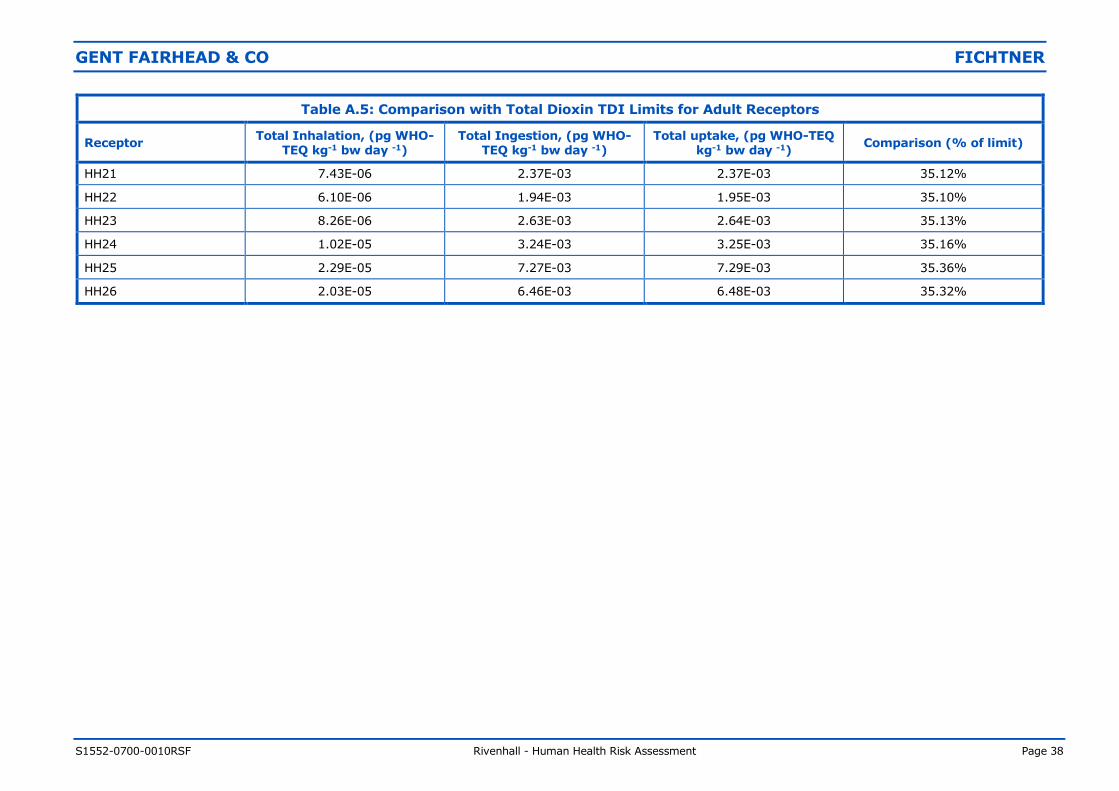
GENT FAIRHEAD & CO FICHTNER
S1552-0700-0010RSF Rivenhall - Human Health Risk Assessment Page 38
Table A.5: Comparison with Total Dioxin TDI Limits for Adult Receptors
Receptor Total Inhalation, (pg WHO-
TEQ kg-1 bw day -1) Total Ingestion, (pg WHO-
TEQ kg-1 bw day -1) Total uptake, (pg WHO-TEQ
kg-1 bw day -1) Comparison (% of limit)
HH21 7.43E-06 2.37E-03 2.37E-03 35.12%
HH22 6.10E-06 1.94E-03 1.95E-03 35.10%
HH23 8.26E-06 2.63E-03 2.64E-03 35.13%
HH24 1.02E-05 3.24E-03 3.25E-03 35.16%
HH25 2.29E-05 7.27E-03 7.29E-03 35.36%
HH26 2.03E-05 6.46E-03 6.48E-03 35.32%

GENT FAIRHEAD & CO FICHTNER
S1552-0700-0010RSF Rivenhall - Human Health Risk Assessment Page 39
Table A.6: Comparison with Total Dioxin TDI Limits for Adult Receptors
Receptor Total Inhalation, (pg WHO-
TEQ kg-1 bw day -1) Total Ingestion, (pg WHO-
TEQ kg-1 bw day -1) Total uptake, (pg WHO-TEQ
kg-1 bw day -1) Comparison (% of limit)
MDI (% of TDI) 90.00%
Point of maximum impact 8.67E-05 3.05E-02 3.06E-02 91.53%
HH1 1.77E-05 2.86E-04 3.04E-04 90.02%
HH2 2.39E-05 3.87E-04 4.11E-04 90.02%
HH3 7.87E-05 1.27E-03 1.35E-03 90.07%
HH4 2.83E-05 4.58E-04 4.86E-04 90.02%
HH5 2.83E-05 4.58E-04 4.86E-04 90.02%
HH6 3.96E-05 6.41E-04 6.80E-04 90.03%
HH7 1.28E-05 4.49E-03 4.51E-03 90.23%
HH8 1.20E-05 4.23E-03 4.25E-03 90.21%
HH9 9.99E-06 3.52E-03 3.53E-03 90.18%
HH10 2.20E-05 7.72E-03 7.75E-03 90.39%
HH11 1.96E-05 6.89E-03 6.91E-03 90.35%
HH12 2.14E-05 7.51E-03 7.53E-03 90.38%
HH13 1.49E-05 5.23E-03 5.25E-03 90.26%
HH14 1.93E-05 3.13E-04 3.33E-04 90.02%
HH15 2.40E-05 3.88E-04 4.12E-04 90.02%
HH16 2.37E-05 3.84E-04 4.08E-04 90.02%
HH17 1.74E-05 2.81E-04 2.99E-04 90.01%
HH18 4.94E-05 1.74E-02 1.74E-02 90.87%
HH19 1.72E-05 6.06E-03 6.08E-03 90.30%
HH20 1.34E-05 4.70E-03 4.72E-03 90.24%
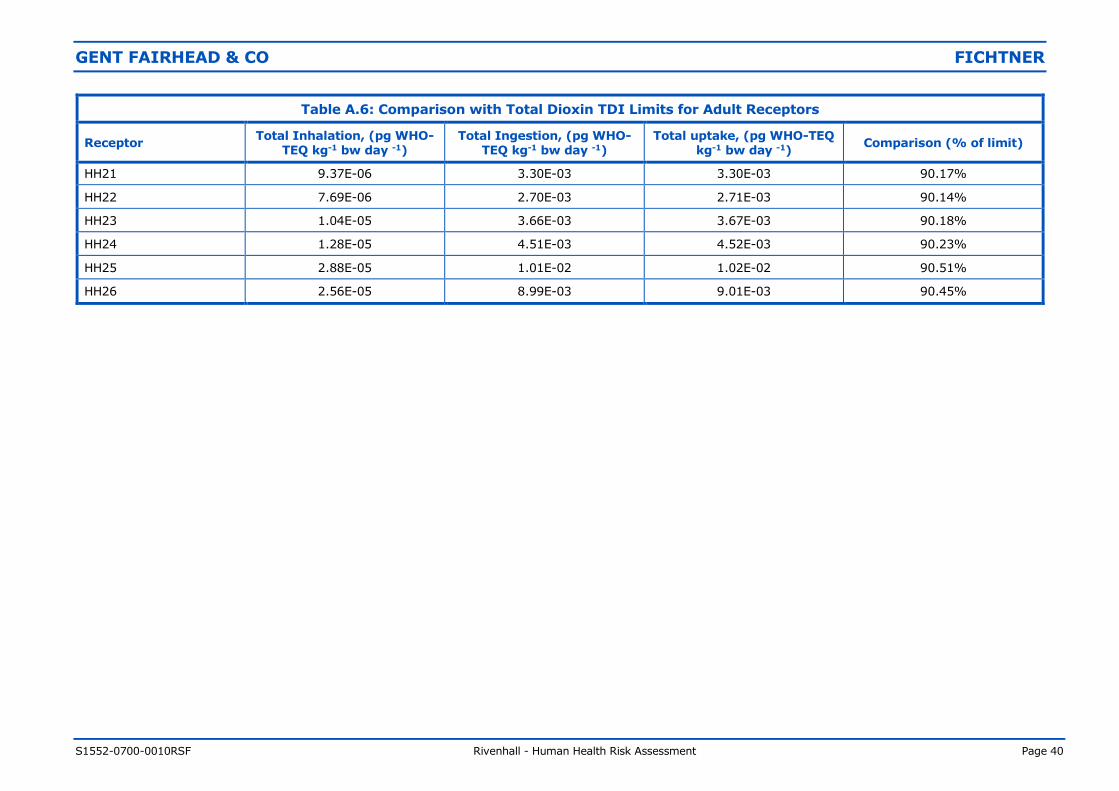
GENT FAIRHEAD & CO FICHTNER
S1552-0700-0010RSF Rivenhall - Human Health Risk Assessment Page 40
Table A.6: Comparison with Total Dioxin TDI Limits for Adult Receptors
Receptor Total Inhalation, (pg WHO-
TEQ kg-1 bw day -1) Total Ingestion, (pg WHO-
TEQ kg-1 bw day -1) Total uptake, (pg WHO-TEQ
kg-1 bw day -1) Comparison (% of limit)
HH21 9.37E-06 3.30E-03 3.30E-03 90.17%
HH22 7.69E-06 2.70E-03 2.71E-03 90.14%
HH23 1.04E-05 3.66E-03 3.67E-03 90.18%
HH24 1.28E-05 4.51E-03 4.52E-03 90.23%
HH25 2.88E-05 1.01E-02 1.02E-02 90.51%
HH26 2.56E-05 8.99E-03 9.01E-03 90.45%
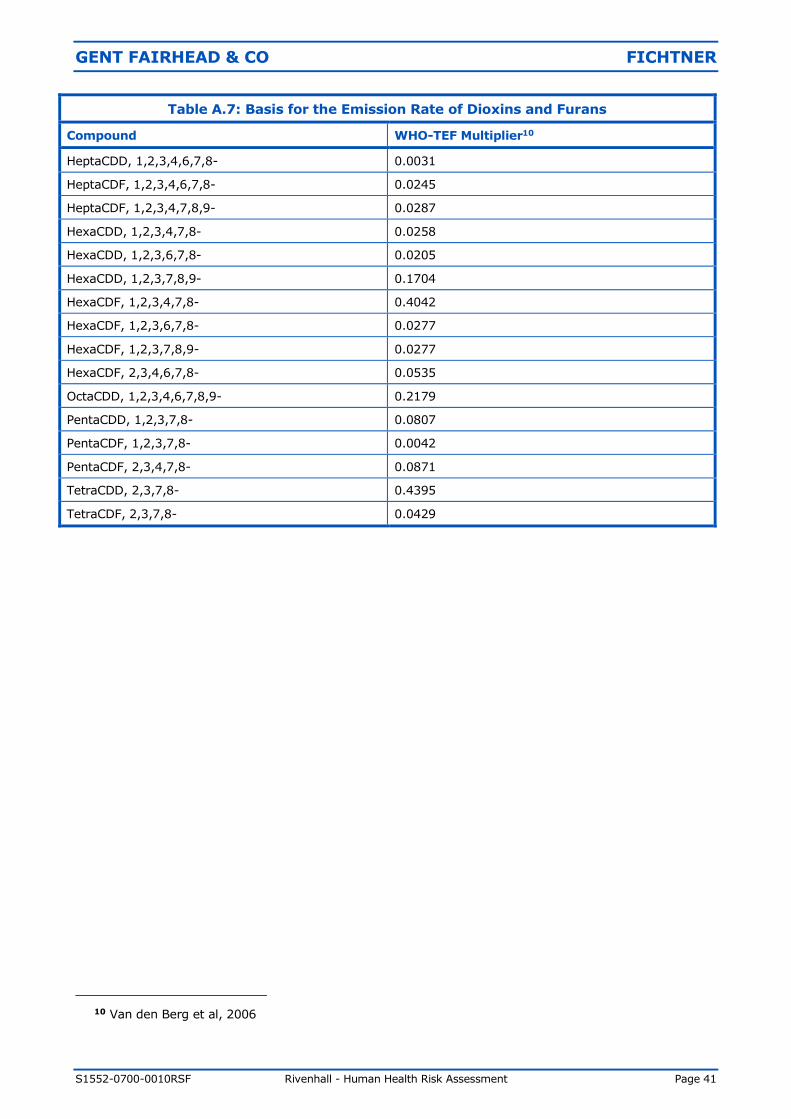
GENT FAIRHEAD & CO FICHTNER
S1552-0700-0010RSF Rivenhall - Human Health Risk Assessment Page 41
Table A.7: Basis for the Emission Rate of Dioxins and Furans
Compound WHO-TEF Multiplier10
HeptaCDD, 1,2,3,4,6,7,8- 0.0031
HeptaCDF, 1,2,3,4,6,7,8- 0.0245
HeptaCDF, 1,2,3,4,7,8,9- 0.0287
HexaCDD, 1,2,3,4,7,8- 0.0258
HexaCDD, 1,2,3,6,7,8- 0.0205
HexaCDD, 1,2,3,7,8,9- 0.1704
HexaCDF, 1,2,3,4,7,8- 0.4042
HexaCDF, 1,2,3,6,7,8- 0.0277
HexaCDF, 1,2,3,7,8,9- 0.0277
HexaCDF, 2,3,4,6,7,8- 0.0535
OctaCDD, 1,2,3,4,6,7,8,9- 0.2179
PentaCDD, 1,2,3,7,8- 0.0807
PentaCDF, 1,2,3,7,8- 0.0042
PentaCDF, 2,3,4,7,8- 0.0871
TetraCDD, 2,3,7,8- 0.4395
TetraCDF, 2,3,7,8- 0.0429
10 Van den Berg et al, 2006

GENT FAIRHEAD & CO FICHTNER
S1552-0700-0010RSF Rivenhall - Human Health Risk Assessment Page 42