Embed Size (px)
Citation preview
Submitted 17 October 2017Accepted 24 December 2017Published 24 January 2018
Corresponding authorJ. Alejandro Morales,[email protected]
Academic editorThomas Tullius
Additional Information andDeclarations can be found onpage 17
DOI 10.7717/peerj.4264
Copyright2018 Mendizabal-Ruiz et al.
Distributed underCreative Commons CC-BY 4.0
OPEN ACCESS
Genomic signal processing for DNAsequence clusteringGerardo Mendizabal-Ruiz, Israel Román-Godínez, Sulema Torres-Ramos,Ricardo A. Salido-Ruiz, Hugo Vélez-Pérez and J. Alejandro MoralesDepartamento de Ciencias Computacionales, Universidad de Guadalajara, Guadalajara, Mexico
ABSTRACTGenomic signal processing (GSP) methods which convert DNA data to numericalvalues have recently been proposed, which would offer the opportunity of employingexisting digital signal processing methods for genomic data. One of the most usedmethods for exploring data is cluster analysis which refers to the unsupervisedclassification of patterns in data. In this paper, we propose a novel approach forperforming cluster analysis of DNA sequences that is based on the use of GSP methodsand the K-means algorithm. We also propose a visualization method that facilitates theeasy inspection and analysis of the results and possible hidden behaviors. Our resultssupport the feasibility of employing the proposed method to find and easily visualizeinteresting features of sets of DNA data.
Subjects Bioinformatics, Computational Biology, GenomicsKeywords Sequence clustering, K-means, COX1, Genomic signal processing, DNA
INTRODUCTIONCluster analysis is one of the most common and useful tools in pattern recognition,statistical data analysis, and exploratory data mining. It has many applications such asimage segmentation, recognition of objects, document retrieval and others (Jain, Murty& Flynn, 1999). The main advantage of employing clustering techniques is the possibilityof finding a hidden structure in the data without the requirement of prior information orknowledge about it. A clustering task consists of dividing a dataset into groups (i.e., clusters)that share common properties or that are related in some way, according to given criteriaand similarity metrics (Baikey, 1994).
The most popular method used to perform cluster analysis is the K-meansalgorithm (Jain, 2010). K-Means clustering is an iterative partition technique whichfinds mutual exclusive spherical groups (Joshi & Kaur, 2013). The main advantage of theK-means algorithm is its ease of implementation and its linear time complexity (Jain,Murty & Flynn, 1999). However, the K-means algorithm rely on the frequent computationof similarity metrics between all of the elements to be clustered and the proposed centroidsof each of the k-clusters. Therefore, its application in practice is limited to the type of datafor which those similarity scores can be computed in a efficient way.
In bioinformatics, traditional methods for computing the similarity scores betweensequences consist of applying DNA and amino acid sequence alignment methods, whosemain objective is to identify portions of successive nucleotide or amino acids that are
How to cite this article Mendizabal-Ruiz et al. (2018), Genomic signal processing for DNA sequence clustering. PeerJ 6:e4264; DOI10.7717/peerj.4264

common in two or more sequences. They are then rearranged to easily visualize thosesimilar portions (White et al., 2010). The comparison of two sequences is known aspairwise sequence alignment (PSA). When more than two sequences are compared, theprocess is known as multiple sequence alignment (MSA) (Sharma, 2008).
One of the most popular applications of PSA is phylogenetic analysis. It consists ofestablishing an evolutionary relationship among nucleic acid or protein families sequences.It is generally depicted by the use of dichotomous trees, for which the branches representorganism separations. Branches that are close to each other, suggest a similar organism.By contrast, the farthest branches indicates large differences (Mount, 2004). Some of themost popular algorithms for MSA are ClustalW (Thompson, Higgins & Gibson, 1994),Muscle (Edgar, 2004), T-COFFEE (Notredame, Higgins & Heringa, 2000), MAFFT (Katohet al., 2005), and K-Align (Lassmann & Sonnhammer, 2005).
However, since these methods require large computational times for determiningsimilarity among sequences, the use of K-means is not feasible for this application.Therefore, other approaches for DNA clustering have been proposed based on the use ofthese similarity computation methods. Two of the most popular algorithms for clusteringbiological sequences are the CD-HIT (Li & Godzik, 2006) and the UCLUST (Edgar, 2010).Both algorithms use a greedy approach for identifying representative sequences thatcan be used as a ‘‘seed’’ to group all of the sequences that have a similarity score above acertain threshold. However, the computational resources necessary to perform the multiplesequence alignments remain the main challenge which limits the number of sequences thatcan be clustered.
More recently, an approach for the analysis of genomic data that has captured theattention of researchers in recent years, is the use of genomic signal processing (GSP) whichis based on the use of digital signal processing (DSP) theory and algorithms to analyze DNAor protein sequences. GSPmethods require the transformation ormapping of the biologicalsequences, usually represented as a string of characters (i.e., A, T, G and C) to a numericrepresentation (i.e., a signal) that can be processed using mathematical functions (Kwan& Arniker, 2009). Examples of the use of GSP methods include the identification ofprotein-coding regions in DNA sequences (Das & Turkoglu, 2017; Mabrouk, 2017; Das& Turkoglu, 2015; Inbamalar & Sivakumar, 2012; Marhon & Kremer, 2011; Akhtar, Epps& Ambikairajah, 2008; Akhtar, Epps & Ambikairajah, 2007; Rushdi & Tuqan, 2006; Yin& Yau, 2005; Kotlar, 2003; Anastassiou, 2000), finding for genomic repeats (Sharmaet al., 2004), determining the structural, thermodynamic, and bending properties ofDNA (Gabrielian & Pongor, 1996), biological sequence querying (Ravichandran et al.,2010), estimating of DNA sequence similarity (Mendizabal-Ruiz et al., 2017; Hoang, Yin &Yau, 2016; Yin, Yin & Wang, 2014; Borrayo et al., 2014; Cheever et al., 1989), and sequencealignment (Skutkova et al., 2015).
One of the main advantages of GSP methods is that the analysis of the genomic datacan be performed very quickly because of the optimal coding of the algorithms and theprocessors that have been designed specifically for those tasks.
Cluster analysis of DNA signals through the use of GSP methods have been previouslyproposed by Zhao, Duan & Yau (2011) and Hoang et al. (2015). However, these methods
Mendizabal-Ruiz et al. (2018), PeerJ, DOI 10.7717/peerj.4264 2/21

1For further details regarding the formaldefinition of a PSD refer to Stoica & Moses(2005).
are based on the computation of a number of features from the Fourier spectrumwhichmayreduce the dimensionality of the data and perhaps its discriminative power as comparedwith the use of the whole raw spectrum. Moreover, those works employed a hierarchicalclustering algorithm instead of the K-means. Comparatively, K-means properties allow usto generate plots that are different from the traditional dendrograms and that facilitate theexploration of the results.
In this paper, we propose an approach for performing cluster analysis of DNA sequencesthat is based on the use of GSP methods and the K-means algorithm. We also present avisualization method that allows us to easily inspect and analyze the results. Our resultsindicate the feasibility of employing the proposed method to find and easily visualizeinteresting features of sets of DNA data.
MATERIALS AND METHODSDNA sequence to signalIn order to be able to employ the DSP methods in genomic data, it is necessary to firstperform a transformation or mapping of the DNA sequences to be analyzed into numericalvalues representing the information contained by them. There are several proposed DNAnumerical representations. However, one of the most popular of this DNA to signalmapping is the Voss representation, which employs four binary indicator vectors, eachmeant to denote the presence of a nucleotide of each type at a specific location within theDNA sequence (Voss, 1992).
Given a DNA sequence α (e.g., α = ATTCGCAT ...) we can employ the Vossrepresentation to compute its corresponding fourth-dimensional DNA signal Xα byapplying Eq. (1)
X1(i)=
{1 if X(i)=A0 otherwise
X2(i)=
{1 if X(i)=G0 otherwise
X3(i)=
{1 if X(i)=C0 otherwise
X4(i)=
{1 if X(i)=T0 otherwise
(1)
By applying the Discrete Fourier transform to the DNA signal Xα , it is possible tocompute the power spectral density (PSD) Sα which describes how power of a signalor time series is distributed over frequency.1 In our case, the PSD is a descriptor of thenucleotide patterns that may be present within the DNA sequence (Borrayo et al., 2014).
The relatedness or similarity score of any two given DNA sequences α and β, can then beestimated by comparing the components of their PSDs d(Sα,Sβ) using a similarity metric(Mendizabal-Ruiz et al., 2017).
Mendizabal-Ruiz et al. (2018), PeerJ, DOI 10.7717/peerj.4264 3/21

DNA signal clusteringK-means is a two step algorithm which performs the partitioning of a given set ofobservations {O1,O2,...,Om} represented as a n-dimensional vector, into K ≤m clusters.Each cluster is represented by a centroid Cj with j ∈ [1,2,...,k], which is defined as apoint in a n-dimensional space generated by computing the average of each element of thevectors of the observations that belong to that cluster. In the first step, an observation isassigned to the cluster Cj that scores the highest similarity to the point represented by theobservation’s vector, according to a specific metric. In the second step, the centroids of thek clusters are updated, according to the observations assigned to them in the previous step.The best groups and their centroids are obtained by the minimization of the total sum ofthe distances between the observations and their corresponding centroids.
Consider a set of PSD �= [ω1,ω2,...,ωm] corresponding to a number m of differentDNA sequences. The K-means algorithm is applied to the data in � by considering thepower spectra as the vector that describes the DNA sequence in a n-dimensional space. Inthis work, we chose the Euclidean distance between these vectors as the similarity metric tobe employed by the K-means algorithm. Since the K-means results depends on the initiallabels assigned to each entry, which are assigned randomly, we repeat the computation 50times and keep the best convergence score. As a result, we obtain a label for each elementof � which defines the assigned cluster.
DNA clusters visualizationThe raw results of the clustering procedure may be difficult to analyze and interpret.Therefore, we propose to produce graphical representations of the results that can easilyprovide an insight into the DNA sequence clustering results. The generation of theproposed graphical representation (Fig. 1) from the K-means clustering result, consists ofthe following steps:1. Compute a main centroid point M in the n- dimensional space corresponding to the
geometrical center of the K centroids location computed as:
M [i] =1k
k∑j=1
Cj[i] (2)
where i∈ [1,2,...,n].2. For each cluster j, compute the Euclidean distance dj of its centroid Cj with respect to
the main centroidM :
dj =
√√√√ n∑i=1
(Cj[i]−M [i])2. (3)
3. Each centroid of the k clusters is sorted according to its distance to the main centroidand an angle is assigned to them, according to its index ι∈ [0,1,...,k] in the sortedarray:
θι= ι2πk. (4)
4. The main centroidM and the clusters centroids Cι are mapped into a two dimensionalspace φ, where the main centroid corresponds to the origin (i.e., the point withcoordinates (x = 0,y = 0)).
Mendizabal-Ruiz et al. (2018), PeerJ, DOI 10.7717/peerj.4264 4/21

Figure 1 Depiction of the DNA cluster visualization results structure proposed plot for a value ofk = 8.
Full-size DOI: 10.7717/peerj.4264/fig-1
5. Each centroid Cι is plotted as a point around the main centroidM point, according toits distance and its angle as computed by:xι= dιcos(θι) (5)
yι= dιsin(θι). (6)6. We sort each set of DNA sequences in � assigned to a specific centroid Cι, according
to the distance δz of each sequence z , with respect to its assigned centroid. The angleθz is also computed similarly to step 3.
7. Finally, each sequence z is then plotted into φ by computing their correspondentcoordinates as:xz = δz cos(θz)+xι (7)
yz = δz sin(θz)+yι. (8)
Experimental dataTo assess our DNA signal clustering method and the proposed visualization technique,we employed a set of 141 DNA sequences corresponding to the Cytochrome c oxidaseI gene (COXI) marker belonging to 131 different species obtained from the KyotoEncyclopedia of Genes and Genomes (KEGG) K02256 (Kanehisa et al., 2017; Kanehisaet al., 2016; Kanehisa & Goto, 2000). We selected the COXI marker because it performsa fundamental role in the terminal oxidative step for energy metabolism (Adkins &Honeycutt, 1994) and is a very well known marker commonly used for the identification
Mendizabal-Ruiz et al. (2018), PeerJ, DOI 10.7717/peerj.4264 5/21

of species (Patwardhan, Ray & Roy, 2014). In the selected set, a total of 112 organismshave only one copy. However, there are some species represented by more than onesequence. This is the case of the Yak, Bos grunniens (bom:102267288, bom:102278784,bom:22161768), a Bat,Myotis davidii (myd:102771221, myd:22203924), the Spotted greenpufferfish, Tetraodon nigroviridis (tng:BAE79219, tng:GSTEN00036010G001), the Pacificgiant oyster, Crassostrea gigas (crg:109618508, crg:109618509, crg:808829), Yarrowialipolytica (yli:YalifMp03, yli:YalifMp05, yli:YalifMp06), Loa loa, the parasite responsiblefor filariasis disease (loa:COX1, loa:LOAG_19059), the Castor oil tree, Ricinus communis(rcu:10221395, rcu:8272741), and the Picoplanktons, Ostreococus tauri (ota:OstapMp24,ota:OstapMp40), Bathycoccus prasinos (bpg:BathyMg00110, bpg:BathyMg00240), andMicromonas commoda (mis:MicpuN_mit45, mis:MicpuN_mit7). It is important to notethat all gene copies were considered during the experiments and that the selected organismsbelong to the total spectrum of the Eukaryote domain.
The selected organisms were manually organized according to their respective taxon,based on the Catalogue of Life (Roskov et al., 2017), and were divided into seven kingdoms,17 phyla, and 35 classes. To easily identify the different categories, we employed differentcolors and symbols as described in Fig. 2
RESULTSWe employed the proposed method to evaluate how the experimental dataset is clustered,when using different values of k. While there may be many different criteria to select thenumber of clusters to be employed, in this work, we examine the results that are obtainedemploying three values that we consider interesting: (i) k = 6 which correspond to thenumber of different kingdoms in the selected dataset, (ii) k= 17 which corresponds to thenumber of different phyla in the dataset, and (iii) k = 35 which corresponds to the totalnumber of classes in the selected dataset. The length of the PSD of each sequence to becompared was 4,100.
Figure 3 depicts the results obtained when the dataset was grouped into six clusters.It can be noted that the majority of the Chordates (blue-edge squares) are grouped
together in C-2, a small proportion of them (the Bat Myotis davidii, two copies of the YakBos grunniens and the second copy of the Spotted Green Pufferfish Tetraodon nigroviridis,are grouped in C-4 along with a plant (the second copy of the Castor oil tree Ricinuscommunis), and the rest are scattered in C-3 and C-6. It is remarkable that all of theTracheophytan plants (green-edge squares) with the exception of Castor Oil tree R.communis are grouped in C-1 while the Chlorophyta plants (mostly Picoplanktons definedby green-edge circles) are grouped in C-6 along with other organisms. The formation oftwo separated groups for the plants may be explained by the fact that despite belongingto the same kingdom, these phyla share very little morphology (Simpson, 2006). Note thatthe all of the Ascomycota fungi (yellow-edge squares) are grouped together in cluster C-3,while the single organism of the Basidiomycota phylum (yellow-edge circle) is clustered ina separate group.
All Arthropods (blue-edge right oriented triangles) are contained in the cluster C-5.Note that the length of all of the organisms with respect to the centroid of the cluster
Mendizabal-Ruiz et al. (2018), PeerJ, DOI 10.7717/peerj.4264 6/21

Fungi (11)
Plants (20)
* (2)
SAR (1)
Chromista (1)
{Blue}
{Yellow}
{Green}
{Red}
{Magenta}
{Cyan}
g (( )ww}ww}ww}}}}}}}}} { }
{ }
** ((22))
}}}}
** (2)){ }
{ }
{ }{{ {*}
{ }{
{ }}{ }
{ }
{ }
{ }{{ }
{ } }}}} Chordates (69)
}}}}} Arthropods (14)
}}}}} Nematods (5)
}}} Echinoderm (1)
}}}}}} chinodeerermEcE (1)
}}}} }}}}}}Hemichordate (1)
}}}}Mollusc (1)
Plathelminth (1)
( )
}}}}}}}Cnidarians (2)
}}}}}}}Placozoan (1)
}}} coozzooaooanPllaaccP (1)
}}}}}}}}(( ))
Porifera (1)
}}}}}}}} Ascomycota (10)
}}}}} Basidiomycota (1)
}}}}Tracheophyta (13)
}}}} Chlorophyta (7)
{ }{{{ }{{{ }}{ }}}{ {{ }
{ }}}}}{ }}}}}}{ }}}{ }
{ }
{ }
{ }
{ }
{ }}}}{{{{{{{ { {{{{{ }
{ } } }}}
{ }
{ }
{ }}}}}{ }
{ }
}{
{ }
{ }}{ }
{ }}}{ }
{ }
{{{{ Mammals (38)
{{ Birds (11)
{{ Reptiles (7)
{ {{
{{Amphibians (2)
{{Actinopterygii (7)
Chondrichthyes (1){ { {{{{{{{{ {{{{{{onndrrriichtthyhyyeeyyesesy (((((1))))
Ascidiacea (1)
{{{{ p ygg (( )
{{{{{ {{{Chhono d iii hhthhh ((1)) {{onondrddrdricichththyhyeeyyeses ((((11))Sarcopterygii (1)
{{{{{{{{{{Insects (13)
{
{{{{{ {{{{{Branchipod (1)
{{{{ Magnoliopsida (9)
{Secernentea (4)
{
{{{cecernentetea ((44))))
Enoplea (1)
{{ {{Saccharomycetes (6)
{{{{
{{y (( )
Sordariomycetes (2){{ {{{{{{{{ Sordariomyceteetes (((222)2)
Eurotiomycetes (2)
{{
{{Liliopsida (3)
{{ {{{{{{{{{{ Liliopsidsida (33))
Bryopsida (1)
{{
{Clorophyceae (1)
{{{{{{{{{{ Clorophyceaeae ((11))
Mamiellophyceae (3)
{{ {{
{{ p y (( )
Trebouxlophyceae (3)
Primates (12)(( )
Rodents (5)RRodentsts (5)
Lagomorpha (1)Lagommorporphaha (1)
Carnivors (4)Carnivorsrs (4)Artiodactylians (7)dactyyliansns ((7))
Cetacea (1)CeCetataceceaaaaCetaceaea ((((1)1)))(1)Perissodactyla (1)eririsss dodaac ytylalaassododacctytylaa ((( )1)((1)1)
Chiroptera (3)ChC irropoppteraraaaChChiri oppteterarra (((3)3)(3)Proboscidea (1)PrProroboboscidedeaaPPrrPrPrrobobo ososcicidededeaaeaa (((1))(1)1)((1)1)
Didelphimorphia (1)(( )
elplpphihihimmomoimomoorprprprpphihihihih aaaeellplpph aaa 1)1)(((1)1)1)Sarcophilus (1)
ppppp ppp ((( ))( )pprccopopopppphhihilhihilululusssSaSaSaS rcrcrccoopoppp uuusss
ppppppppp((( )((((1)1)(((((1)1)1))((( )))
Monotremata (1)
Diptera (8)DiDiDiptptptp erereraaaaa )(((8)8)8)Hymenoptera (1)
ppp ((( ))(Hyyymmmmemememennneenononoptptptptp erereraaaaa
pppp(1)1)(((1)1)1)p
Coleoptera (1)yyyyy (( ))((( ))
CoCoCoColeleleleoopopoppopppppteteterararaCC aappppp
(1)(1)((((1)1)1))ppLepidoptera (2)
(( ))(( ))ppppppppppLLeepiidododoptptptptppp eerertererraaaLLeeepppLeLeeepipipipippp dd aaaLppppppp
( ))(2)(2)((((2)2)2))Hempitera (1)
{Bluee}
{ Metazonans (96)
Kingdom Phylum Class Order Species
{Outline color} {Shape} {Fill color} HumanChimpanzeeBonoboWestern GorillaSumatran OrangutanWhite-cheeked GibbonRhesus MacaqueCrab-ea�ng MacaqueGreen monkeyGolden Snub-nosed monkeyCommon MarmosetBolivian squirrel monkeyMouseNorway Rat
Upper Galilee Mountains Blind Mole RatChinese Hamster / Stripped Dwarf Hamster
Naked Mole-ratRabbitDogGiant PandaPolar BearCatCow / Ca�leYakChiru (Tibetan antelope)GoatSheepPigCamelBaiji (Yangtze River Dolphin)HorseBrandt''s batBatBlack Flying Fox (Bat)African ElephantOpossumTasmanian DevilPlatypusChickenTurkeyJapanese QuailMallardZebra FinchCollared FlycatcherTibetan Ground-jayHooded CrowPeregrine FalconSaker FalconPigeonChinese AlligatorFlorida AlligatorChinese So�shell TurtleGreen Sea TurtleLizzardBurmese PythonGeckoAfrican Clawed FrogWestern Clawed FrogZebrafishTakifugu (Fugu fish)Spo�ed Green PufferfishZebra MbunaJapanese Medaka (Ricefish)Southern PlatyfishAtlan�c SalmonCoelacanthAustralian ghostsharkFlorida LanceletYellow sea SquirtPurple Sea UrchinAcorn wormFruit FlyFruit Fly (sechellia)Fruit Fly (simulans)Fruit Fly (yakuba)House flyAfrican malaria MosquitoYellow fever MosquitoSouthern House MosquitoRed Fire AntRed Flour BeetleSilkwormDiamondback MothPea aphidWater FleaC. elegansNearly C. elegansLympha�c FilariaEye FilariaTrichinosis ParasitePacific Giant OysterSchistosomiasisCoralFresh-water PolypPlacozoansSpongeYeastFilamentous moldMezcal YeastC. glabrataCheese YeastY. lipoly�caNiesslFusarium head blightA. nidulansBlack mouldCorn smutThale cressCanola (rape)Co�onSoybeanAppleCucumberCastor oil tree GrapeBeetJapanese riceMilletDate palmMossPicoplankton (C. reinhard�i)Picoplankton (O. tauri)Picoplankton (B. prasinos)Picoplankton (M. commoda)Picoplankton (C. subellipsoidea)Picoplankton (food) (C. variabilis)Picoplankton (biofuel) (A. protothecoides)Cyanoalgae thermoacidophilicIrish mossMalariaSoy parasite
123456789101112131415161718192021222324252627282930313233343536373839404142434445464748495051525354555657585960616263646566676869707172737475767778798081828384858687888990919293949596979899100101102103104105106107108109110111112113114115116117118119120121122123124125126127128129130131
Figure 2 Depiction of the selected organisms and their correspondence in the Tree of Life. The respec-tive hierarchic markings for each class is shown next to them. A detailed list of names and their KEGGentries is in Table S1. *These two organisms Galdieria sulphuraria (gsl:JL72_p19) and Chondrus crispus(ccp:ChcroMp03), a Cyanoalgae thermoacidophilic and Irish moss, respectively, do not have a reportedKingdom in the Tree of Life and were reported with the same Kingdom label ‘Unknown’.
Full-size DOI: 10.7717/peerj.4264/fig-2
Mendizabal-Ruiz et al. (2018), PeerJ, DOI 10.7717/peerj.4264 7/21

Figure 3 DNA clustering for marker COXI with k = 6.Full-size DOI: 10.7717/peerj.4264/fig-3
are smaller in comparison with the other organisms and their corresponding centroids,which indicate that arthropods in the selected dataset are all very far away from every otherorganism, something that is consistent with the Hebert, Ratnasingham & de Waard (2003)findings on COXI divergence analysis.
Mendizabal-Ruiz et al. (2018), PeerJ, DOI 10.7717/peerj.4264 8/21

Figure 4 DNA clustering for marker COXI with k = 17.Full-size DOI: 10.7717/peerj.4264/fig-4
Figure 4 depicts the results obtained when the dataset was grouped into 17 clusters.Note that cluster C-6 is a refined version of C-5 in k= 6, since one of the Cnidarians the
Fresh-water Polyp Hydra vulgaris (red-fill star), the Branchipod Water Flea Daphnia pulex(red-fill right-facing triangle), and the Hemichordate Acorn worm Saccoglossus kowalevskii
Mendizabal-Ruiz et al. (2018), PeerJ, DOI 10.7717/peerj.4264 9/21

(left-facing triangle) have moved to other clusters, leaving only insects in this group. Thetwo Cnidarians and the Hemichordate are now together in C-4, while the Branchipod isin C-16
Note that for this value of k, fungi grouped into three well-defined clusters (C-1, C-2, andC-15), with the exception of the Basidiomycota Corn smut Ustilago maydis (yellow-edgecircle) which keeps its grouping with other organisms. It is interesting that the twomembersof C-1 are two of the copies of Yarrowia lipolytica (yellow-edge square), while the otherfungi in C-15 are of heterogeneous classes.
The Tracheophyta plants cluster C-7 remains with the same organisms of classesMagnoliopsida (green-edge squares) and Liliopsida (green-edge red-fill square), whilethe group of the Chlorophyta plants separated the two copies of the PicoplanktomBathycoccus prasinos (green-edge red-fill circle) that end up together in C-10, and thePicoplankton Chlamydomonas reinhardtii (green-edge circle) which is grouped in C-4 withother organisms. The second copy of the Castor oil tree remained with the same organismsin C-14, which is exactly the same as C-4 in the k= 6.
The fact that the two copies of the Picoplankton B. prasinos (C-10) are both clusteredtogether apart from the other plants is because they are either very recent orthologueduplications or have not been verified accurately, as they have both the same sequenceentry in NCBI database (SequenceID: NC_023273.1) reported at different loci in itsmitochondrial genome (GeneID: 18158061 and GeneID: 18158101).
Chordates are separated into four clusters (C-5, C-8, C-11, and C-13) with all Hominidsgrouped together in C-5. C-8 is formed by two reptiles, one anfibious, and the fish, bothActinopterygii (blue-edge yellow-fill square) and Sacropterygii (blue-edge cyan-fill square),C-13 is formed with all the birds (blue-edge red-fill square), some reptiles (blue-edge blue-fill square), and the Naked Mole-rat Heterocephalus glaber, and C-11 with the rest of theChordates in a very compact group. Note that the result of the birds grouped with thereptiles may be explained by the evolutive theory that claim that the birds are descendant ofancient saurid reptiles. It is also interesting that reptiles tend to group with other organismsand not necessarily between them. This could be the result of high diversity of COXI amongreptiles, as reported by Vasconcelos et al. (2016).
Cluster C-9 contains two Secernentea patogens of the Onchocercidae order, LymphaticFilariaBrugia malay andEye FilariaLoa loa, both parasites of humans andother animals andhave a clear evolutive difference defined by the enviroment in which they live in, comparedwith the other two Secernentea of the free-living Rhabditida order Caenorhabditis elegansand Caenorhabditis briggsae. Our results agree with those of Prosser et al. (2013), wheresuccessfull COXI operational taxonomic units were developed to differenciate betweenparasitic and free-living taxa.
Note that one of the organisms with no assigned kingdom, the Cyanoalgaethermoacidophillic Galdieria sulphuraria generated its own cluster C-12.
It is interesting that some clusters are more compact than others (e.g., C-11 and C-6,vs. C-13 and C-7). The compactness of a cluster indicates the degree of relationship of theorganisms belonging to it with respect to a common reference (i.e., how similar they arebetween them).
Mendizabal-Ruiz et al. (2018), PeerJ, DOI 10.7717/peerj.4264 10/21

Figure 5 DNA clustering for marker COXI with k = 35.Full-size DOI: 10.7717/peerj.4264/fig-5
Figure 5 depicts the results obtained when the dataset was grouped into 35 clusters.Note that with some exceptions, most of the data in k = 35 is more clearly clustered
together by their respective class and some were downright to their order or even lowerphylogenies. For the plants, new clusters were generated: C-12 with the two copies ofPikoplanctom M. commoda, C-34 with the two copies of Picoplancton Ostreococcus tauri
Mendizabal-Ruiz et al. (2018), PeerJ, DOI 10.7717/peerj.4264 11/21

in the other, C-10 with the Japanese rice Oryza sativa japonica and the Moss Physcomitrellapatens, C-27 with the Picoplankton C. reinhardtii (which previously was the only plantclustered in C-4 for k= 17). Originally in k= 6, Picoplanktons were grouped together withother organisms, but isolated from the other plants. At this level of cluster decompositio,we can observe that Picoplanktons are all separated, probably because they are unicellularorganisms and will present large variation in the COXI marker (Lin et al., 2009).
C-17 and C-33 are well defined clusters of birds. C-20 is a group of flies from the Dipteraclass, the remaining non-fly Diptera, Lepidoptera and Hemiptera are grouped in C-3, whileC-32 includes the Red Flour Beetle Tribolium castaneum and the Red Fire Ant Solenopsisinvicta.
C-13 contains five out of the seven Artiodactylians, C-22 corresponds to the hominidieswhich did not change since k= 6 and the first and closest compact cluster C-26 correspondsto all of the remaining mammals.
A very interesting feature is that C-29 is the same multi-class cluster that appeared ink= 17 and k= 6 conformed by the BatM. davidii, both Yak B. grunniens copies, the secondCastor oil tree R. communis copy, and the Spotted green pufferfish T. nigroviridis. Whenwe explored the characteristics of those gene sequences, we found that all of them aresignificantly below the average gene size 1,545.8±124.5 bp. The NCBI database reportedthat all of them are notmitochondrial genes, but the product of nuclear genomic sequencingwhere scaffold primary assembly showed those fractions with alignment homology reportedto COXI, but not proven genetic activity. We also found that both the second and thirdcopies of Y. lipolytica in C-4 are significantly above the average COX1 gene size. These lasttwo genes correspond to coxI-i5 and coxI-i7 that contain unusually large exons 5 and 7respecively (NCBI GeneID: 802596; Sequence entry: NC_002659.1), which gives them theextra sequence length in the KEGG database.
The two Alligators A. sinensis and A. mississippiensis (blue-edge blue-fill squares)generated their own cluster in C-16. The fellow Reptiles, the Green Sea Turtle Cheloniamydas, the Burmese Python Python bivittatus and the Lizzard Anolis carolinensis, clusteredtogether with both frogs Xenopus laevis and Silurana tropicalis, the Zebrafish Danio rerioand the cartilaginous fish Australian ghostshark Callorhinchus milii (blue-edge magenta-fillsquare) in C-30, leaving C-19 as a better defined cluster with most ray-finned fish and onlythe Gekko japonicus barging in the group. The Chinese Softshell Turtle Pelodiscus sinensiscreated its own cluster in C-25.
Clusters C-18, C-6, C-11, C-27, C-2, C-9, C-25 and C-7 are one-organism clusters. Thatmay be explained because these organisms are the most external with respect to their classesor phyla. For instance, in C-18 we find the Cyanoalgae thermoacidophillic G. sulphuraria,while in C-6 we find the most outside group of the Metazoans that correspond to Poriferaphyla, the Sponge Amphimedon queenslandica. Moreover, k = 35 cluster distance spansfrom 276 to 653; just before the second half of the average distance, at 448 lies all of thelone clusters and most of the two-sequence cluster with the sole exception of the unpairedCOX1 gene sequence size C-29.
Mendizabal-Ruiz et al. (2018), PeerJ, DOI 10.7717/peerj.4264 12/21

Figure 6 K-means decomposition analysis.Full-size DOI: 10.7717/peerj.4264/fig-6
An interesting property observed in our experiments is that as we increase the numberof groups, the data corresponding to the kingdoms are separated at different rates. Figure 6depicts how the kingdoms are decomposed into a number of groups with respect to thenumber of clusters. Note that Metazoans separate faster as compared to Fungi and Plants.This may be explained by the large number of organisms belonging to this kingdom whichhave a greater chance to group together due to their high class similarities. Note thatthe second largest kingdom of Plants decompose faster than Fungi, which is the thirdlargest group.
To determine the validity of the results, we computed centroids for true kingdoms andwe compare these centroids to those discovered with our method. Figure 7 depicts themean square distances between each cluster centroid and the sequences assigned to thatcluster by the proposed method using K = 6, and the mean square distances between acluster centroid generated with the sequences corresponding to each of the six kingdomswere compared. Note that the centroid of sequences belonging to the plant kingdom hasa large similarity with respect to C-1 which contains most of the plants. Similarly, theMetazonans kingdom have a large similarity with C-2 which is conformed by the majorityof the Chordates. The Fungi kingdom depicts a large similarity with respect to C-3 whichcontains most of the fungi. Moreover, note that the other kingdoms depict a larger distancewith respect to the all the clusters.
Mendizabal-Ruiz et al. (2018), PeerJ, DOI 10.7717/peerj.4264 13/21

2When analyzing the processing times ofthe compared methods, it is important toconsider that the STARS was implementedin MATLAB without any parallelization, incomparison with the highly optimizedimplementations of ClustalW andparallelized UCLUST.
20
40
60
80
100
120C1 C2 C3 C4 C5 C6
Metazoa
Fungi
Plant
SAR
Chromista
Kingdom 4
Figure 7 Mean square distances between each cluster centroid and the sequences assigned to that clus-ter by the proposed method using k = 6, and the mean square distances between a cluster centroid gen-erated with the sequences corresponding to each of the six kingdoms.
Full-size DOI: 10.7717/peerj.4264/fig-7
Comparison with other cluster methodsWe evaluated the performance of the MATLAB implementation of proposed algorithm‘‘Signal Tool for the Analysis of the Relationship between Sequences’’ (i.e., STARS) interms of computational time with respect to ClustalW and UCLUST. While ClustalW isnot strictly a clustering method, we used it for comparison because it is one of the mostcommonly used tools to evaluate the similarity of multiple sequences. We employed a CPUIntel XEON E5-1650 at 3.50 GHz with 16 GB RAM.2 Table 1 list the processing time inseconds for the three methods for sets of 8, 17, 35, 70, and 141 sequences of COXI. The timerequired to transform the 141 sequences from strings of characters to their correspondingPSDs was 0.921 s and it is not considered in Table 1 since this is performed only one time.Note that the time required by STARS is significantly smaller with respect to ClustalW.UCLUST is time-constant at 1 s for every experiment, however, note that the number ofclusters generated by this method was practically the same number of sequences (i.e., themethod assigns a cluster to each sequence). This is because UCLUST requires a sequencesidentity range of at least 40% for amino acids and 65% for nucleotides (Edgar, 2010).
Table 2 list the processing times of five datasets of different number of sequences withdifferent length where UCLUST generated a number of clusters different from one clusterfor each sequence. Dataset A consisted of 31 sequences of Mammals with average lengthof 16,695 nucleotides labeled into to seven groups; Dataset B consisted of 38 sequences
Mendizabal-Ruiz et al. (2018), PeerJ, DOI 10.7717/peerj.4264 14/21
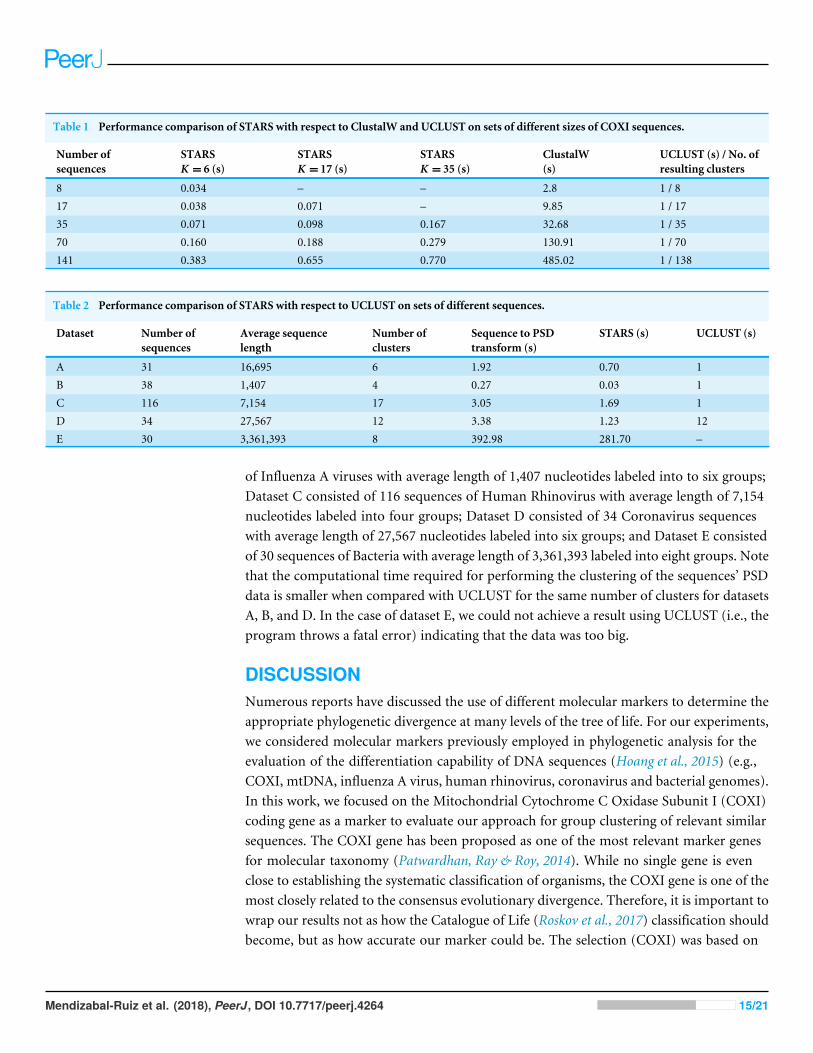
Table 1 Performance comparison of STARS with respect to ClustalW and UCLUST on sets of different sizes of COXI sequences.
Number ofsequences
STARSK = 6 (s)
STARSK = 17 (s)
STARSK = 35 (s)
ClustalW(s)
UCLUST (s) / No. ofresulting clusters
8 0.034 – – 2.8 1 / 817 0.038 0.071 – 9.85 1 / 1735 0.071 0.098 0.167 32.68 1 / 3570 0.160 0.188 0.279 130.91 1 / 70141 0.383 0.655 0.770 485.02 1 / 138
Table 2 Performance comparison of STARS with respect to UCLUST on sets of different sequences.
Dataset Number ofsequences
Average sequencelength
Number ofclusters
Sequence to PSDtransform (s)
STARS (s) UCLUST (s)
A 31 16,695 6 1.92 0.70 1B 38 1,407 4 0.27 0.03 1C 116 7,154 17 3.05 1.69 1D 34 27,567 12 3.38 1.23 12E 30 3,361,393 8 392.98 281.70 –
of Influenza A viruses with average length of 1,407 nucleotides labeled into to six groups;Dataset C consisted of 116 sequences of Human Rhinovirus with average length of 7,154nucleotides labeled into four groups; Dataset D consisted of 34 Coronavirus sequenceswith average length of 27,567 nucleotides labeled into six groups; and Dataset E consistedof 30 sequences of Bacteria with average length of 3,361,393 labeled into eight groups. Notethat the computational time required for performing the clustering of the sequences’ PSDdata is smaller when compared with UCLUST for the same number of clusters for datasetsA, B, and D. In the case of dataset E, we could not achieve a result using UCLUST (i.e., theprogram throws a fatal error) indicating that the data was too big.
DISCUSSIONNumerous reports have discussed the use of different molecular markers to determine theappropriate phylogenetic divergence at many levels of the tree of life. For our experiments,we considered molecular markers previously employed in phylogenetic analysis for theevaluation of the differentiation capability of DNA sequences (Hoang et al., 2015) (e.g.,COXI, mtDNA, influenza A virus, human rhinovirus, coronavirus and bacterial genomes).In this work, we focused on the Mitochondrial Cytochrome C Oxidase Subunit I (COXI)coding gene as a marker to evaluate our approach for group clustering of relevant similarsequences. The COXI gene has been proposed as one of the most relevant marker genesfor molecular taxonomy (Patwardhan, Ray & Roy, 2014). While no single gene is evenclose to establishing the systematic classification of organisms, the COXI gene is one of themost closely related to the consensus evolutionary divergence. Therefore, it is important towrap our results not as how the Catalogue of Life (Roskov et al., 2017) classification shouldbecome, but as how accurate our marker could be. The selection (COXI) was based on
Mendizabal-Ruiz et al. (2018), PeerJ, DOI 10.7717/peerj.4264 15/21
three criteria: (i) the marker must code for proteins since it has been already proven thatthese type of markers have steadier mutation rates, (ii) the marker should have alreadybeen employed in a wide range of the tree of life, at least for eukaryotes, and should be ableto discriminate for the intended groups, and (iii) the marker should have a homogeneouslength and have a minimum number of reported copies in the selected database, since bothduplication events and large indels may bias new cluster formation. To rule out any bias inthe clustering of organisms with respect to their downloaded sequences, we incorporatedall of their stored copies.
A possible expected result was that the clusters generated for each selected value of kwould correspond to the organization depicted in Fig. 2. However, since the K-meansmethod promote the generation of centroids in highly populated regions of the featurespace, it is more likely to obtain clusters of organisms that are highly related among them,instead of organisms related by possible common ancestors or groups with a small numberof less homogeneous organisms (e.g., primates formed a cluster early in small k values andkept together at larger numbers of k).
The COXI gene is one of the most accepted general markers to establish divergence(Patwardhan, Ray & Roy, 2014). It spans from Phylum to Class, and when using intronsin selected species, it has been shown to properly classify Genera and Species (Zardoya& Meyer, 1996). Our results were remarkably good in clustering up to the Family levelby using only the coding region and without the need to pretreat or manually curate thesequences.
Hebert, Ratnasingham & De Waard (2003) established a divergence rate from 0.01% to64% with a median of 8% across a number of species on 11 Metazoan phyla. In that study,Arthropod (with the exception of Lepidoptera and Diptera class) and Plathelminth phyladisplayed the greatest divergences, while Chordata showed the second lowest divergence.Our results showed high cohesiveness, particularly for Chordates, where they quicklyestablished stable, compact clusters, predominantly with their own classes. Since thedownloaded data for each phylum or class was not balanced, we had the opportunityto evaluate how the sequences are clustered in a real-life condition. For example, whensampling whole ecosystems (i.e., microbiomes), bacterial populations will not be balancedacross their species, but will show predominant phylogenetic diversity toward certaingroups. Our results show that our presented method is very sensitive to both, the relativeabundance of tight clusters, and the K -number. Far from being a disadvantage, we foundthat changing the number of clusters in an experiment may provide new insights about therelationship between the various sequences.
Sequence mutations of COXI coding regions have not been shown to distribute biastowards any segment or region, something like what happens to other markers such as theribosomal 16S gene, where changes on highly conserved regions are very few and slow, whilechanges on hypervariable regions show rapid changes that can determine divergence alongseveral phylogenetic groups, according to which hypervariable region is being evaluated. Ifthis would be the case, K -Means clustering may be adapted to steps of low mutation ratesbefore high mutation rate regions. COXI gene mutations spanning all of the sequence mayincrease the amount of spurious clustering due to converging hotspots.
Mendizabal-Ruiz et al. (2018), PeerJ, DOI 10.7717/peerj.4264 16/21
The presence of a spurious cluster that is gathered together by their size, is an indicationof the need to filter out sequences with large indels. Despite such mishaps, the proposedmethod is capable of performing an analysis of relationships between multiple DNAsequences with minimum handling and without the need of sequence alignment, whichresults in less human and computational time compared to traditional methods. We testedthis method with a number of markers (i.e., mammal mtDNA, influenza A virus, humanrhinovirus, coronavirus, and bacterial genomes) previously employed for Fourier DNAspectra phylogenetic analysis (Hoang et al., 2015), the results are shown in SupplementalInformation 1 of this article. Briefly, most sequences evaluated under our method clusterproperly and consistently with previous reports (Hoang et al., 2015). Also consistent withCOXI results, the most evident aspect is the tendency to prioritize division of heavilypopulated groups.
The proposed method may be used to evaluate the capability of a marker or gene todifferentiate between organisms at different levels, to identify subgroups within a set oforganisms, and perform classification of organisms with respect to known sequences orclassification of sections of a DNA sequence. Furthermore, this method can also be usedto perform similar analysis with amino acid sequences.
We have demonstrated that it is possible to group DNA sequences based on theirfrequency components. It is the subject of futurework to identify whether distinct frequencybands amount to greater weight in the clustering of sequences.
The proposed method has been coded and executed in MATLAB. The source code andthe datasets employed for the results presented in this paper are available at Github
CONCLUSIONWehave presented amethod for performing cluster analysis of DNA sequences that is basedon the use of GSP methods and the K-means algorithm. We also proposed a visualizationmethod that allows us to easily inspect and analyze the results and possible nontrivialrelationships. Our results indicate the feasibility of employing the proposed method to findand easily visualize interesting features of sets of DNA data.
ACKNOWLEDGEMENTSThe authors thank CONACyT and PRODEP for the provided support. Any opinions,findings, conclusions or recommendations expressed in this material are the soleresponsibility of the authors and may not reflect the views of the sponsors.
ADDITIONAL INFORMATION AND DECLARATIONS
FundingThe authors received no funding for this work.
Competing InterestsThe authors declare there are no competing interests.
Mendizabal-Ruiz et al. (2018), PeerJ, DOI 10.7717/peerj.4264 17/21

Author Contributions• Gerardo Mendizabal-Ruiz conceived and designed the experiments, performed theexperiments, analyzed the data, wrote the paper, prepared figures and/or tables, revieweddrafts of the paper.• Israel Román-Godínez and Ricardo A. Salido-Ruiz conceived and designedthe experiments, performed the experiments, analyzed the data, contributedreagents/materials/analysis tools, wrote the paper, reviewed drafts of the paper.• Sulema Torres-Ramos conceived and designed the experiments, performed theexperiments, contributed reagents/materials/analysis tools, wrote the paper, revieweddrafts of the paper.• Hugo Vélez-Pérez conceived and designed the experiments, contributed reagents/mate-rials/analysis tools, wrote the paper, prepared figures and/or tables, reviewed drafts ofthe paper.• J. Alejandro Morales conceived and designed the experiments, analyzed the data, wrotethe paper, prepared figures and/or tables, reviewed drafts of the paper.
Data AvailabilityThe following information was supplied regarding data availability:
Github: https://github.com/starsudg/STARS.git.
Supplemental InformationSupplemental information for this article can be found online at http://dx.doi.org/10.7717/peerj.4264#supplemental-information.
REFERENCESAdkins RM, Honeycutt RL. 1994. Evolution of the primate cytochrome c oxidase subunit
II gene. Journal of Molecular Evolution 38(3):215–231.Akhtar M, Epps J, Ambikairajah E. 2007. On DNA numerical representations for period-
3 based exon prediction. In: 2007 IEEE international workshop on genomic signalprocessing and statistics. Number 2. Tuusula: IEEE, 1–4.
Akhtar M, Epps J, Ambikairajah E. 2008. Signal processing in sequence analysis:advances in eukaryotic gene prediction. Journal of Selected Topics in Signal Processing2(3):310–321 DOI 10.1109/JSTSP.2008.923854.
Anastassiou D. 2000. Frequency-domain analysis of biomolecular sequences. Bioinfor-matics 16(12):1073–1081 DOI 10.1093/bioinformatics/16.12.1073.
Baikey KD. 1994. Numerical taxonomy and cluster analysis. In: Typologies and tax-onomies: an introduction to classification. USA: SAGE Publications, 34–65.
Borrayo E, Mendizabal-Ruiz EG, Vélez-Pérez H, Romo-Vázquez R, MendizabalAP, Morales JA. 2014. Genomic signal processing methods for computationof alignment-free distances from DNA sequences. PLOS ONE 9(11):e110954DOI 10.1371/journal.pone.0110954.
Cheever E, Searls D, KarunaratneW, Overton G. 1989. Using signal processingtechniques for DNA sequence comparison. In: Bioengineering conference, 1989,Proceedings of the 1989 fifteenth annual northeast. Piscataway: IEEE, 173–174.
Mendizabal-Ruiz et al. (2018), PeerJ, DOI 10.7717/peerj.4264 18/21

Das B, Turkoglu I. 2015. Fourier-based filtering approach for identification of protein-coding regions in DNA sequences. In: Signal processing and communications applica-tions conference (SIU), 2015 23th. Piscataway: IEEE, 2529–2532.
Das B, Turkoglu I. 2017. A novel numerical mapping method based on entropy fordigitizing DNA sequences. Neural Computing and Applications 1–9 Epub ahead ofprint Feb 22 2017 DOI 10.1007/s00521-017-2871-5.
Edgar RC. 2010. Search and clustering orders of magnitude faster than BLAST. Bioinfor-matics 26(19):2460–2461 DOI 10.1093/bioinformatics/btq461.
Edgar RC. 2004.MUSCLE: multiple sequence alignment with high accuracy and highthroughput. Nucleic Acids Research 32(5):1792–1797 DOI 10.1093/nar/gkh340.
Gabrielian A, Pongor S. 1996. Correlation of intrinsic DNA curvature with DNA prop-erty periodicity. FEBS Letters 393(1):65–68 DOI 10.1016/0014-5793(96)00855-1.
Hebert PD, Ratnasingham S, DeWaard JR. 2003. Barcoding animal life: cytochromec oxidase subunit 1 divergences among closely related species. Proceedingsof the Royal Society of London B: Biological Sciences 270(Suppl 1):S96–S99DOI 10.1098/rsbl.2003.0025.
Hoang T, Yin C, Yau S. 2016. Numerical encoding of DNA sequences by chaos gamerepresentation with application in similarity comparison. Genomics 108(3):134–142DOI 10.1016/j.ygeno.2016.08.002.
Hoang T, Yin C, Zheng H, Yu C, He RL, Yau SS-T. 2015. A new method to cluster DNAsequences using Fourier power spectrum. Journal of Theoretical Biology 372:135–145DOI 10.1016/j.jtbi.2015.02.026.
Inbamalar TM, Sivakumar R. 2012. Filtering approach to DNA signal processing. In:International proceedings of computer science and information tech, vol. 28. Singapore:IACSIT Press, 1–5.
Jain A. 2010. Data clustering: 50 years beyond K-means. Pattern Recognition Letters31(8):651–666 DOI 10.1016/j.patrec.2009.09.011.
Jain A, Murty M, Flynn P. 1999. Data clustering: a review. ACM Computing Surveys31(3):264–323 DOI 10.1145/331499.331504.
Joshi A, Kaur R. 2013. A review: comparative study of various clustering techniques indata mining. International Journal of Advanced Research in Computer Science andSoftware Engineering 3(3):55–57.
Kanehisa M, Furumichi M, TanabeM, Sato Y, Morishima K. 2017. KEGG: newperspectives on genomes, pathways, diseases and drugs. Nucleic Acids Research45(D1):D353–D361 DOI 10.1093/nar/gkw1092.
Kanehisa M, Goto S. 2000. KEGG: kyoto encyclopedia of genes and genomes. NucleicAcids Research 28(1):27–30 DOI 10.1093/nar/28.1.27.
Kanehisa M, Sato Y, KawashimaM, Furumichi M, TanabeM. 2016. KEGG asa reference resource for gene and protein annotation. Nucleic Acids Research44(D1):D457–D462 DOI 10.1093/nar/gkv1070.
Katoh K, Kuma K-I, Miyata T, Toh H. 2005. Improvement in the accuracy of multiplesequence alignment program MAFFT. Genome Informatics 16(1):22–33.
Mendizabal-Ruiz et al. (2018), PeerJ, DOI 10.7717/peerj.4264 19/21

Kotlar D. 2003. Gene prediction by spectral rotation measure: a new methodfor identifying protein-coding regions. Genome Research 13(8):1930–1937DOI 10.1101/gr.1261703.
KwanHK, Arniker SB. 2009. Numerical representation of DNA sequences. In: IEEEinternational conference on electro/in-formation technology, 2009. EIT’09. Piscataway:IEEE, 307–310.
Lassmann T, Sonnhammer EL. 2005. Kalign—an accurate and fast multiple sequencealignment algorithm. BMC Bioinformatics 6(1):298 DOI 10.1186/1471-2105-6-298.
LiW, Godzik A. 2006. Cd-hit: a fast program for clustering and comparing largesets of protein or nucleotide sequences. Bioinformatics 22(13):1658–1659DOI 10.1093/bioinformatics/btl158.
Lin S, Zhang H, Hou Y, Zhuang Y, Miranda L. 2009.High-level diversity of dinoflagel-lates in the natural environment, revealed by assessment of mitochondrial cox1 andcob genes for dinoflagellate DNA barcoding. Applied and Environmental Microbiology75(5):1279–1290 DOI 10.1128/AEM.01578-08.
MabroukM. 2017. Advanced genomic signal processing methods in DNA mappingschemes for gene prediction using digital filters. American Journal of Signal Processing7(1):12–24 DOI 10.5923/j.ajsp.20170701.02.
Marhon S, Kremer SC. 2011. Gene prediction based on DNA spectral analysis: aliterature review. Journal of Computational Biology 18(4):639–676DOI 10.1089/cmb.2010.0184.
Mendizabal-Ruiz G, Román-Godínez I, Torres-Ramos S, Salido-Ruiz R, Morales J.2017. On DNA numerical representations for genomic similarity computation. PLOSONE 12(3):e0173288 DOI 10.1371/journal.pone.0173288.
Mount DW. 2004. Alignment of pairs of sequences and multiple sequence alignment.In: Bioinformatics: sequence and genome analysis. New York: Cold Spring Harbor,51–204.
Notredame C, Higgins DG, Heringa J. 2000. T-Coffee: a novel method for fast andaccurate multiple sequence alignment. Journal of Molecular Biology 302(1):205–217DOI 10.1006/jmbi.2000.4042.
Patwardhan A, Ray S, Roy A. 2014.Molecular markers in phylogenetic studies—A review. Journal of Phylogenetics & Evolutionary Biology 2(2):Article 131DOI 10.4172/2329-9002-2-131.
Prosser SWJ, Velarde-Aguilar MG, León-Règagnon V, Hebert PDN. 2013. Advancingnematode barcoding: a primer cocktail for the cytochrome c oxidase subunit I genefrom vertebrate parasitic nematodes.Molecular Ecology Resources 13(6):1108–1115DOI 10.1111/1755-0998.12082.
Ravichandran L, Papandreou-Suppappola A, Spanias A, Lacroix Z, Legendre C. 2010.Time-frequency based biological sequence querying. In: 2010 IEEE internationalconference on Acoustics speech and signal processing (ICASSP). Piscataway: IEEE,4174–4177.
Roskov Y, Abucay L, Orrell T, Nicolson D, Bailly N, Kirk P, Bourgoin T, DeWaltR, DecockW, Van DeWever A, Nieukerken E, Zarucchi J, Penev L. 2017. In:
Mendizabal-Ruiz et al. (2018), PeerJ, DOI 10.7717/peerj.4264 20/21
Species 2000 & ITIS catalogue of life, 2017 annual checklist. Available at http://www.catalogueoflife.org/annual-checklist/ 2017 .
Rushdi A, Tuqan J. 2006. Gene identification using the Z-curve representation. In: 2006IEEE international conference on acoustics speed and signal processing proceedings Vol.2. Piscataway: IEEE, 1024–1027.
Sharma D, Issac B, Raghava G. PS, Ramaswamy R. 2004. Spectral Repeat Finder (SRF):identification of repetitive sequences using Fourier transformation. Bioinformatics20(9):1405–1412 DOI 10.1093/bioinformatics/bth103.
Sharma K. 2008. Bioinformatics: sequence alignment and Markov models. New York:McGraw Hill Professional.
SimpsonMG. 2006. Plant systematics. Second Edition. Amsterdam: Elsevier/AcademicPress.
Skutkova H, VitekM, Sedlar K, Provaznik I. 2015. Progressive alignment of genomicsignals by multiple dynamic time warping. Journal of Theoretical Biology 385:20–30DOI 10.1016/j.jtbi.2015.08.007.
Stoica P, Moses RL. 2005. Spectral analysis of signals. Vol. 452. Upper Saddle River:Pearson Prentice Hall.
Thompson JD, Higgins DG, Gibson TJ. 1994. CLUSTAL W: improving the sensi-tivity of progressive multiple sequence alignment through sequence weighting,position-specific gap penalties and weight matrix choice. Nucleic Acids Research22(22):4673–4680 DOI 10.1093/nar/22.22.4673.
Vasconcelos R, Montero-Mendieta S, Simó-Riudalbas M, Sindaco R, Santos X,Fasola M, Llorente G, Razzetti E, Carranza S. 2016. Unexpectedly high levels ofcryptic diversity uncovered by a complete dna barcoding of reptiles of the socotraarchipelago. PLOS ONE 11(3):e0149985 DOI 10.1371/journal.pone.0149985.
Voss RF. 1992. Evolution of long-range fractal correlations and 1/f noise in DNA base se-quences. Physical Review Letters 68(25):3805–3808 DOI 10.1103/PhysRevLett.68.3805.
White J, Navlakha S, Nagarajan N, Ghodsi M, Kingsford C, PopM. 2010. Alignmentand clustering of phylogenetic markers-implications for microbial diversity studies.BMC Bioinformatics 11(1):152 DOI 10.1186/1471-2105-11-152.
Yin C, Yau SS-T. 2005. A Fourier characteristic of coding sequences: origins and anon-Fourier approximation. Journal of Computational Biology 12(9):1153–1165DOI 10.1089/cmb.2005.12.1153.
Yin C, Yin XE,Wang J. 2014. A novel method for comparative analysis of DNAsequences by Ramanujan-Fourier transform. Journal of Computational Biology21(12):867–879 DOI 10.1089/cmb.2014.0120.
Zardoya R, Meyer A. 1996. Phylogenetic performance of mitochondrial protein-codinggenes in resolving relationships among vertebrates.Molecular Biology and Evolution13(7):933–942 DOI 10.1093/oxfordjournals.molbev.a025661.
Zhao B, Duan V, Yau SS-T. 2011. A novel clustering method via nucleotide-basedFourier power spectrum analysis. Journal of Theoretical Biology 279(1):83–89DOI 10.1016/j.jtbi.2011.03.029.
Mendizabal-Ruiz et al. (2018), PeerJ, DOI 10.7717/peerj.4264 21/21