Embed Size (px)
Citation preview
Genomic selection in agricultureAn overview of recent publications featuring Illumina® technology
3 An overview of recent publications featuring Illumina technology
TABLE OF CONTENTS
4 Introduction
5 General ConceptsUnderstanding the Basics: DNA, Genes, and Chromosomes
Understanding the Basics: Genetic Variation and Polymorphisms
Agriculture and Quantitative Traits
Marker-Assisted Selection and Genomic Selection
12 Implementation of Genomic SelectionEstablishing a Reference Genome
Genotyping
Genotyping by Sequencing
Implementation of Genomic Selection
22 Economic Considerations
26 Other Uses of Genomics
28 Glossary
30 Bibliography
This document highlights recent publications that demonstrate the use of Illumina technologies in immunology research. To learn more about the platforms and assays cited, visit www.illumina.com.
4 Genomic selection in agriculture
INTRODUCTION
Agriculture, the science of breeding in crops and animals, has been vital to the
evolution of Homo sapiens and their nourishment. Given the environmental changes,
population expansion, and the increasing demand for nutrition, the need to optimize
food production is and will be of fundamental importance in the coming years.1
Genomic selection (GS) is based on the principle that information from a large
number of markers distributed across the genome can be used to capture diversity
in that genome, sufficient to estimate breeding values without having a precise
knowledge of where specific genes are located. It was first described in 2001 by
Meuwissen and colleagues2 and hinges on developing a breeding equation using
a training population with known favorable (and unfavorable) traits. Breeders have
been using molecular markers for decades, but working on unknown genomes has
been challenging.3 Genetic information consisted of linkage maps with a few hundred
markers, at most, which did not fully represent the desirable traits. Furthermore, a
priori knowledge about a species’ genome and markers’ loci was necessary in order
to use them.
Advances in genetics, bioinformatics, and biotechnology present breeders with
powerful tools to advance agriculture beyond the early days of these limited marker
sets.4 Databases characterizing diversity within species are essential for driving
breeding decisions. Sequence data and well-characterized marker sets can now be
used to study phenotypes of interest. These data allow us to sequence new species,
perform meta-analyses among large datasets, unravel complex traits, and empower
our abilities in both marker-assisted selection (MAS) and GS. In the last few years,
these technologies have revolutionized breeding of both livestock and crops in a field
known as agrigenomics, the science of accelerating breeding decisions using whole
genome information. Agrigenomics is enabling and revolutionizing how breeding
decisions are made.
Figure 1. Agriculture, the science of breeding crops and animals, is the keystone of the global economy and health.
1. Eisler M. C., Lee M. R., Tarlton J. F., Martin G. B., Beddington J., et al. (2014) Agriculture: Steps to sustainable livestock. Nature 507: 32-34
2. Meuwissen T. H., Hayes B. J. and Goddard M. E. (2001) Prediction of total genetic value using genome-wide dense marker maps. Genetics 157: 1819-1829
3. Barabaschi D. T., A; Desiderio, F; Volante, A; Vaccino, P; Valè, PG; Cattivelli, L (2015) Next Generation Breeding. Plant Science In press:
4. McCouch S., Baute G. J., Bradeen J., Bramel P., Bretting P. K., et al. (2013) Agriculture: Feeding the future. Nature 499: 23-24
5 An overview of recent publications featuring Illumina technology
GENERAL CONCEPTS
Understanding the Basics: DNA, Genes, and Chromosomes
Anything that lives, from the simplest forms of life to more complex organisms, has
a genome. Deoxyribonucleic acid (DNA) is the molecule containing the information,
often described as a blueprint that encodes and regulates genes. In turn, genes will
be translated into proteins (by way of ribonucleic acid [RNA]) or contain regulatory
elements and make an organism what it is.
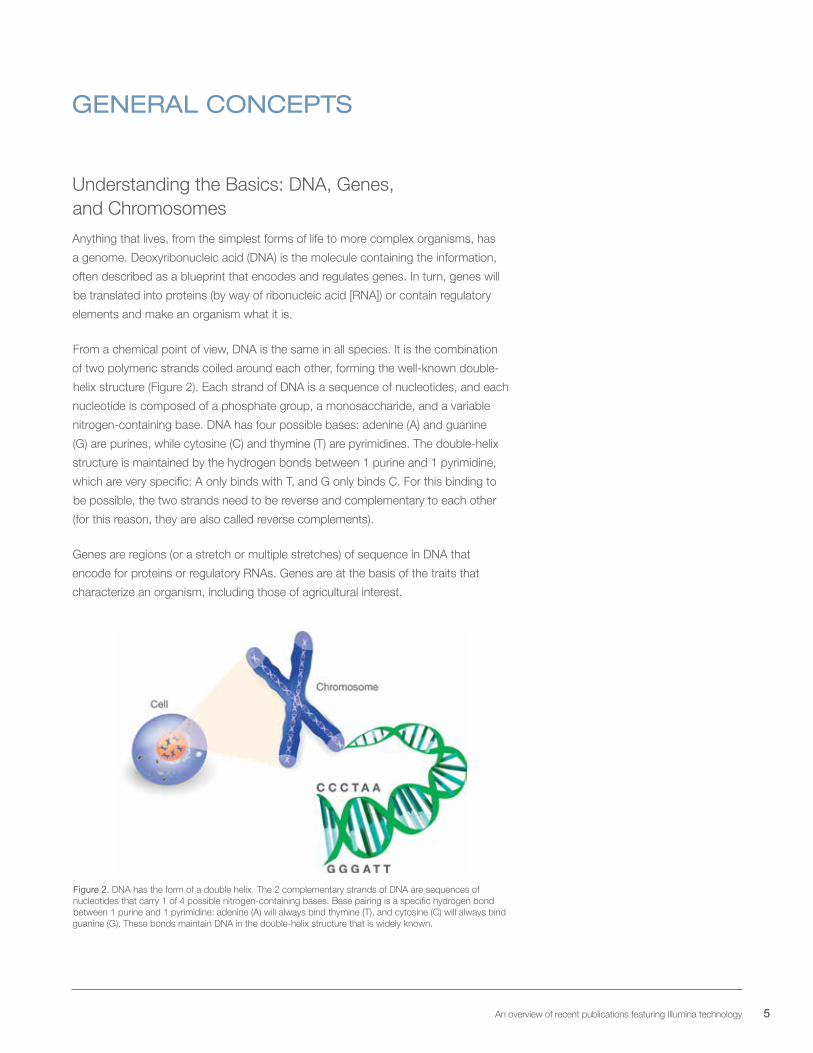
From a chemical point of view, DNA is the same in all species. It is the combination
of two polymeric strands coiled around each other, forming the well-known double-
helix structure (Figure 2). Each strand of DNA is a sequence of nucleotides, and each
nucleotide is composed of a phosphate group, a monosaccharide, and a variable
nitrogen-containing base. DNA has four possible bases: adenine (A) and guanine
(G) are purines, while cytosine (C) and thymine (T) are pyrimidines. The double-helix
structure is maintained by the hydrogen bonds between 1 purine and 1 pyrimidine,
which are very specific: A only binds with T, and G only binds C. For this binding to
be possible, the two strands need to be reverse and complementary to each other
(for this reason, they are also called reverse complements).
Genes are regions (or a stretch or multiple stretches) of sequence in DNA that
encode for proteins or regulatory RNAs. Genes are at the basis of the traits that
characterize an organism, including those of agricultural interest.
Figure 2. DNA has the form of a double helix. The 2 complementary strands of DNA are sequences of nucleotides that carry 1 of 4 possible nitrogen-containing bases. Base pairing is a specific hydrogen bond between 1 purine and 1 pyrimidine: adenine (A) will always bind thymine (T), and cytosine (C) will always bind guanine (G). These bonds maintain DNA in the double-helix structure that is widely known.
6 Genomic selection in agriculture
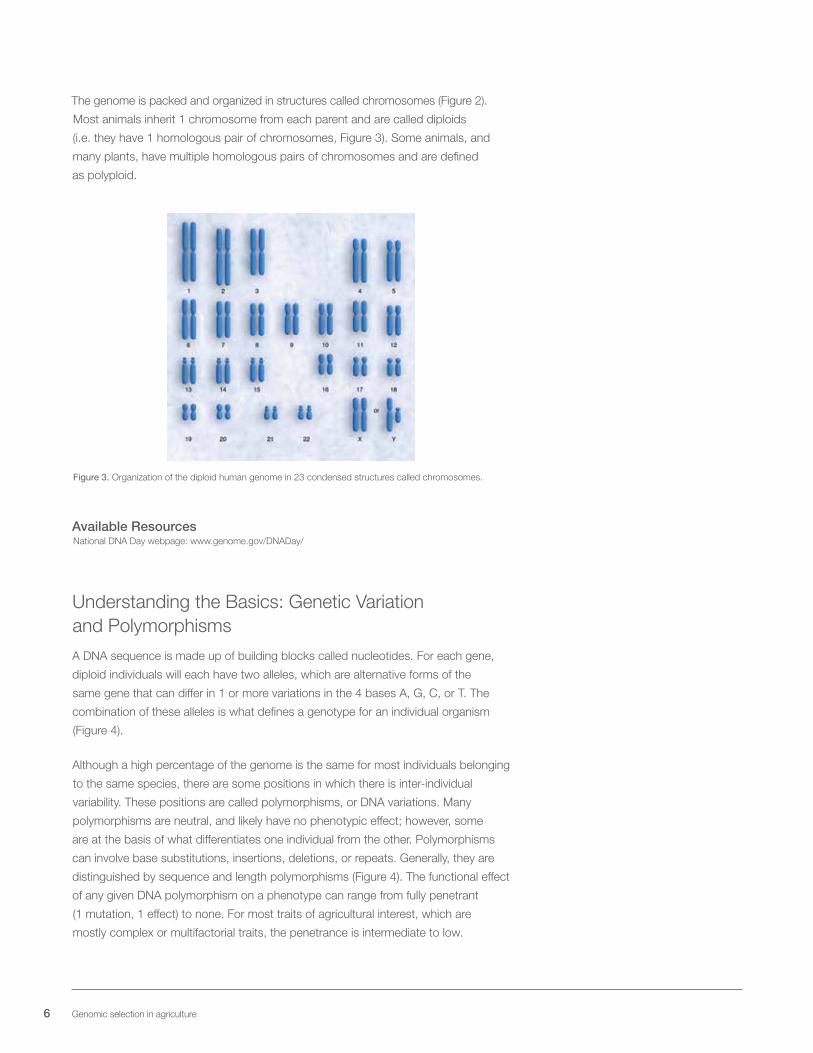
The genome is packed and organized in structures called chromosomes (Figure 2).
Most animals inherit 1 chromosome from each parent and are called diploids
(i.e. they have 1 homologous pair of chromosomes, Figure 3). Some animals, and
many plants, have multiple homologous pairs of chromosomes and are defined
as polyploid.
Figure 3. Organization of the diploid human genome in 23 condensed structures called chromosomes.
Available ResourcesNational DNA Day webpage: www.genome.gov/DNADay/
Understanding the Basics: Genetic Variation and Polymorphisms
A DNA sequence is made up of building blocks called nucleotides. For each gene,
diploid individuals will each have two alleles, which are alternative forms of the
same gene that can differ in 1 or more variations in the 4 bases A, G, C, or T. The
combination of these alleles is what defines a genotype for an individual organism
(Figure 4).
Although a high percentage of the genome is the same for most individuals belonging
to the same species, there are some positions in which there is inter-individual
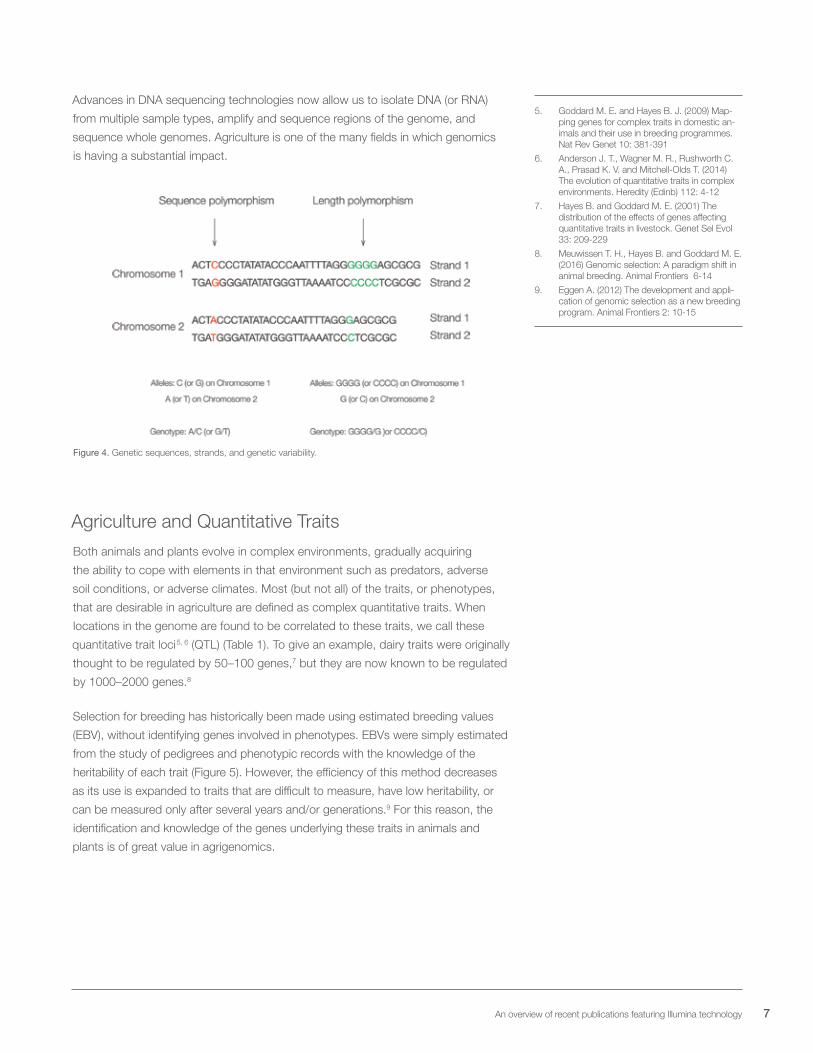
variability. These positions are called polymorphisms, or DNA variations. Many
polymorphisms are neutral, and likely have no phenotypic effect; however, some
are at the basis of what differentiates one individual from the other. Polymorphisms
can involve base substitutions, insertions, deletions, or repeats. Generally, they are
distinguished by sequence and length polymorphisms (Figure 4). The functional effect
of any given DNA polymorphism on a phenotype can range from fully penetrant
(1 mutation, 1 effect) to none. For most traits of agricultural interest, which are
mostly complex or multifactorial traits, the penetrance is intermediate to low.
7 An overview of recent publications featuring Illumina technology
Advances in DNA sequencing technologies now allow us to isolate DNA (or RNA)
from multiple sample types, amplify and sequence regions of the genome, and
sequence whole genomes. Agriculture is one of the many fields in which genomics
is having a substantial impact.
Figure 4. Genetic sequences, strands, and genetic variability.
Agriculture and Quantitative Traits
Both animals and plants evolve in complex environments, gradually acquiring
the ability to cope with elements in that environment such as predators, adverse
soil conditions, or adverse climates. Most (but not all) of the traits, or phenotypes,
that are desirable in agriculture are defined as complex quantitative traits. When
locations in the genome are found to be correlated to these traits, we call these
quantitative trait loci5, 6 (QTL) (Table 1). To give an example, dairy traits were originally
thought to be regulated by 50–100 genes,7 but they are now known to be regulated
by 1000–2000 genes.8
Selection for breeding has historically been made using estimated breeding values
(EBV), without identifying genes involved in phenotypes. EBVs were simply estimated
from the study of pedigrees and phenotypic records with the knowledge of the
heritability of each trait (Figure 5). However, the efficiency of this method decreases
as its use is expanded to traits that are difficult to measure, have low heritability, or
can be measured only after several years and/or generations.9 For this reason, the
identification and knowledge of the genes underlying these traits in animals and
plants is of great value in agrigenomics.
5. Goddard M. E. and Hayes B. J. (2009) Map-ping genes for complex traits in domestic an-imals and their use in breeding programmes. Nat Rev Genet 10: 381-391
6. Anderson J. T., Wagner M. R., Rushworth C. A., Prasad K. V. and Mitchell-Olds T. (2014) The evolution of quantitative traits in complex environments. Heredity (Edinb) 112: 4-12
7. Hayes B. and Goddard M. E. (2001) The distribution of the effects of genes affecting quantitative traits in livestock. Genet Sel Evol 33: 209-229
8. Meuwissen T. H., Hayes B. and Goddard M. E. (2016) Genomic selection: A paradigm shift in animal breeding. Animal Frontiers 6-14
9. Eggen A. (2012) The development and appli-cation of genomic selection as a new breeding program. Animal Frontiers 2: 10-15
8 Genomic selection in agriculture
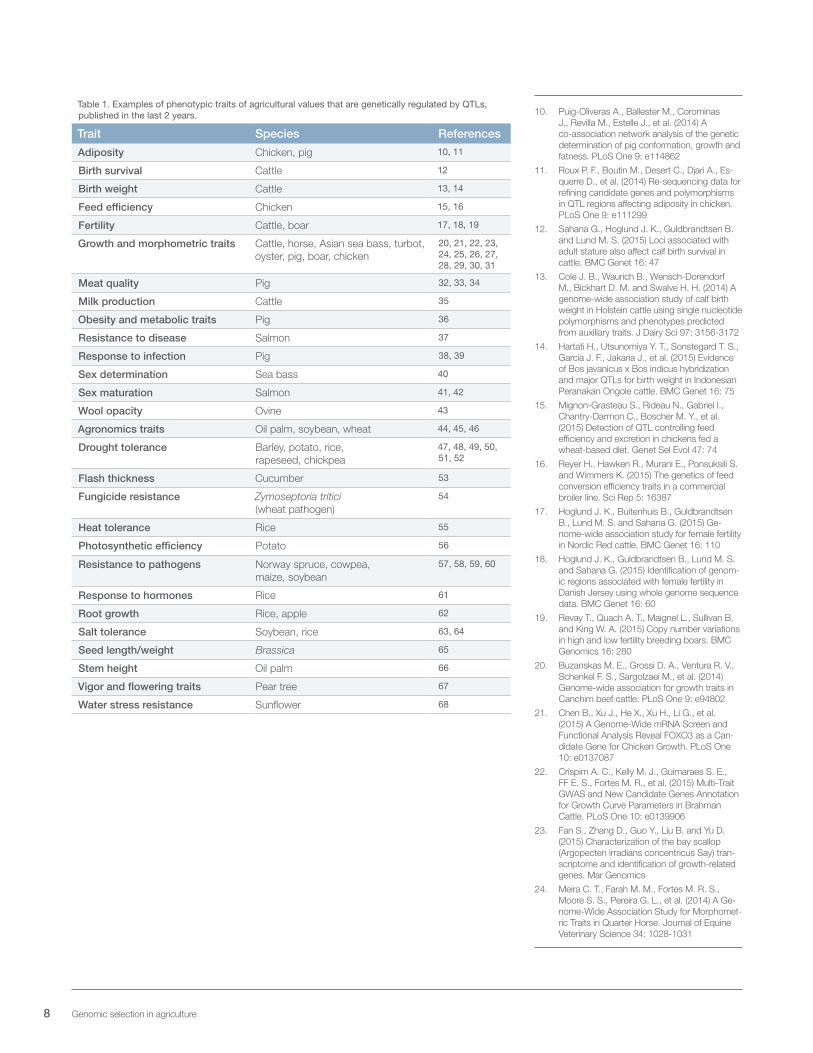
Table 1. Examples of phenotypic traits of agricultural values that are genetically regulated by QTLs, published in the last 2 years.
Trait Species References
Adiposity Chicken, pig 10, 11
Birth survival Cattle 12
Birth weight Cattle 13, 14
Feed efficiency Chicken 15, 16
Fertility Cattle, boar 17, 18, 19
Growth and morphometric traits Cattle, horse, Asian sea bass, turbot, oyster, pig, boar, chicken
20, 21, 22, 23, 24, 25, 26, 27, 28, 29, 30, 31
Meat quality Pig 32, 33, 34
Milk production Cattle 35
Obesity and metabolic traits Pig 36
Resistance to disease Salmon 37
Response to infection Pig 38, 39
Sex determination Sea bass 40
Sex maturation Salmon 41, 42
Wool opacity Ovine 43
Agronomics traits Oil palm, soybean, wheat 44, 45, 46
Drought tolerance Barley, potato, rice, rapeseed, chickpea
47, 48, 49, 50, 51, 52
Flash thickness Cucumber 53
Fungicide resistance Zymoseptoria tritici (wheat pathogen)
54
Heat tolerance Rice 55
Photosynthetic efficiency Potato 56
Resistance to pathogens Norway spruce, cowpea, maize, soybean
57, 58, 59, 60
Response to hormones Rice 61
Root growth Rice, apple 62
Salt tolerance Soybean, rice 63, 64
Seed length/weight Brassica 65
Stem height Oil palm 66
Vigor and flowering traits Pear tree 67
Water stress resistance Sunflower 68
10. Puig-Oliveras A., Ballester M., Corominas J., Revilla M., Estelle J., et al. (2014) A co-association network analysis of the genetic determination of pig conformation, growth and fatness. PLoS One 9: e114862
11. Roux P. F., Boutin M., Desert C., Djari A., Es-querre D., et al. (2014) Re-sequencing data for refining candidate genes and polymorphisms in QTL regions affecting adiposity in chicken. PLoS One 9: e111299
12. Sahana G., Hoglund J. K., Guldbrandtsen B. and Lund M. S. (2015) Loci associated with adult stature also affect calf birth survival in cattle. BMC Genet 16: 47
13. Cole J. B., Waurich B., Wensch-Dorendorf M., Bickhart D. M. and Swalve H. H. (2014) A genome-wide association study of calf birth weight in Holstein cattle using single nucleotide polymorphisms and phenotypes predicted from auxiliary traits. J Dairy Sci 97: 3156-3172
14. Hartati H., Utsunomiya Y. T., Sonstegard T. S., Garcia J. F., Jakaria J., et al. (2015) Evidence of Bos javanicus x Bos indicus hybridization and major QTLs for birth weight in Indonesian Peranakan Ongole cattle. BMC Genet 16: 75
15. Mignon-Grasteau S., Rideau N., Gabriel I., Chantry-Darmon C., Boscher M. Y., et al. (2015) Detection of QTL controlling feed efficiency and excretion in chickens fed a wheat-based diet. Genet Sel Evol 47: 74
16. Reyer H., Hawken R., Murani E., Ponsuksili S. and Wimmers K. (2015) The genetics of feed conversion efficiency traits in a commercial broiler line. Sci Rep 5: 16387
17. Hoglund J. K., Buitenhuis B., Guldbrandtsen B., Lund M. S. and Sahana G. (2015) Ge-nome-wide association study for female fertility in Nordic Red cattle. BMC Genet 16: 110
18. Hoglund J. K., Guldbrandtsen B., Lund M. S. and Sahana G. (2015) Identification of genom-ic regions associated with female fertility in Danish Jersey using whole genome sequence data. BMC Genet 16: 60
19. Revay T., Quach A. T., Maignel L., Sullivan B. and King W. A. (2015) Copy number variations in high and low fertility breeding boars. BMC Genomics 16: 280
20. Buzanskas M. E., Grossi D. A., Ventura R. V., Schenkel F. S., Sargolzaei M., et al. (2014) Genome-wide association for growth traits in Canchim beef cattle. PLoS One 9: e94802
21. Chen B., Xu J., He X., Xu H., Li G., et al. (2015) A Genome-Wide mRNA Screen and Functional Analysis Reveal FOXO3 as a Can-didate Gene for Chicken Growth. PLoS One 10: e0137087
22. Crispim A. C., Kelly M. J., Guimaraes S. E., FF E. S., Fortes M. R., et al. (2015) Multi-Trait GWAS and New Candidate Genes Annotation for Growth Curve Parameters in Brahman Cattle. PLoS One 10: e0139906
23. Fan S., Zhang D., Guo Y., Liu B. and Yu D. (2015) Characterization of the bay scallop (Argopecten irradians concentricus Say) tran-scriptome and identification of growth-related genes. Mar Genomics
24. Meira C. T., Farah M. M., Fortes M. R. S., Moore S. S., Pereira G. L., et al. (2014) A Ge-nome-Wide Association Study for Morphomet-ric Traits in Quarter Horse. Journal of Equine Veterinary Science 34: 1028-1031
9 An overview of recent publications featuring Illumina technology
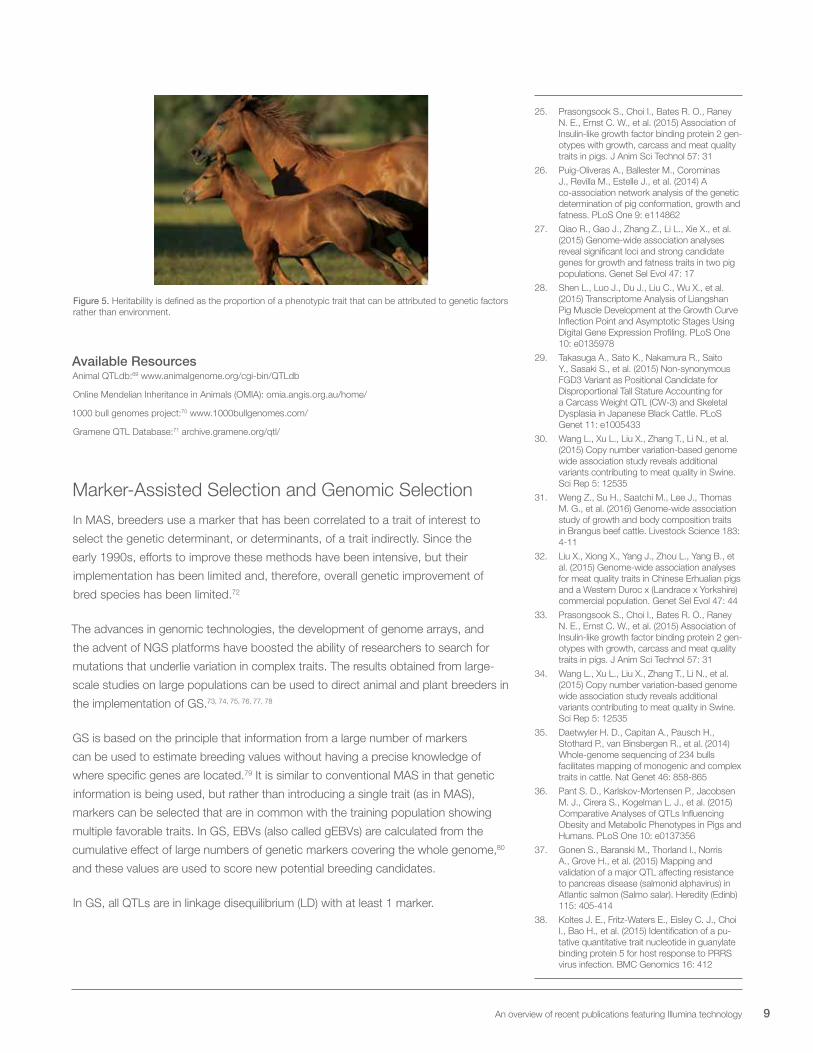
Figure 5. Heritability is defined as the proportion of a phenotypic trait that can be attributed to genetic factors rather than environment.
Available ResourcesAnimal QTLdb:69 www.animalgenome.org/cgi-bin/QTLdb
Online Mendelian Inheritance in Animals (OMIA): omia.angis.org.au/home/
1000 bull genomes project:70 www.1000bullgenomes.com/
Gramene QTL Database:71 archive.gramene.org/qtl/
Marker-Assisted Selection and Genomic Selection
In MAS, breeders use a marker that has been correlated to a trait of interest to
select the genetic determinant, or determinants, of a trait indirectly. Since the
early 1990s, efforts to improve these methods have been intensive, but their
implementation has been limited and, therefore, overall genetic improvement of
bred species has been limited.72
The advances in genomic technologies, the development of genome arrays, and
the advent of NGS platforms have boosted the ability of researchers to search for
mutations that underlie variation in complex traits. The results obtained from large-
scale studies on large populations can be used to direct animal and plant breeders in
the implementation of GS.73, 74, 75, 76, 77, 78
GS is based on the principle that information from a large number of markers
can be used to estimate breeding values without having a precise knowledge of
where specific genes are located.79 It is similar to conventional MAS in that genetic
information is being used, but rather than introducing a single trait (as in MAS),
markers can be selected that are in common with the training population showing
multiple favorable traits. In GS, EBVs (also called gEBVs) are calculated from the
cumulative effect of large numbers of genetic markers covering the whole genome,80
and these values are used to score new potential breeding candidates.
In GS, all QTLs are in linkage disequilibrium (LD) with at least 1 marker.
25. Prasongsook S., Choi I., Bates R. O., Raney N. E., Ernst C. W., et al. (2015) Association of Insulin-like growth factor binding protein 2 gen-otypes with growth, carcass and meat quality traits in pigs. J Anim Sci Technol 57: 31
26. Puig-Oliveras A., Ballester M., Corominas J., Revilla M., Estelle J., et al. (2014) A co-association network analysis of the genetic determination of pig conformation, growth and fatness. PLoS One 9: e114862
27. Qiao R., Gao J., Zhang Z., Li L., Xie X., et al. (2015) Genome-wide association analyses reveal significant loci and strong candidate genes for growth and fatness traits in two pig populations. Genet Sel Evol 47: 17
28. Shen L., Luo J., Du J., Liu C., Wu X., et al. (2015) Transcriptome Analysis of Liangshan Pig Muscle Development at the Growth Curve Inflection Point and Asymptotic Stages Using Digital Gene Expression Profiling. PLoS One 10: e0135978
29. Takasuga A., Sato K., Nakamura R., Saito Y., Sasaki S., et al. (2015) Non-synonymous FGD3 Variant as Positional Candidate for Disproportional Tall Stature Accounting for a Carcass Weight QTL (CW-3) and Skeletal Dysplasia in Japanese Black Cattle. PLoS Genet 11: e1005433
30. Wang L., Xu L., Liu X., Zhang T., Li N., et al. (2015) Copy number variation-based genome wide association study reveals additional variants contributing to meat quality in Swine. Sci Rep 5: 12535
31. Weng Z., Su H., Saatchi M., Lee J., Thomas M. G., et al. (2016) Genome-wide association study of growth and body composition traits in Brangus beef cattle. Livestock Science 183: 4-11
32. Liu X., Xiong X., Yang J., Zhou L., Yang B., et al. (2015) Genome-wide association analyses for meat quality traits in Chinese Erhualian pigs and a Western Duroc x (Landrace x Yorkshire) commercial population. Genet Sel Evol 47: 44
33. Prasongsook S., Choi I., Bates R. O., Raney N. E., Ernst C. W., et al. (2015) Association of Insulin-like growth factor binding protein 2 gen-otypes with growth, carcass and meat quality traits in pigs. J Anim Sci Technol 57: 31
34. Wang L., Xu L., Liu X., Zhang T., Li N., et al. (2015) Copy number variation-based genome wide association study reveals additional variants contributing to meat quality in Swine. Sci Rep 5: 12535
35. Daetwyler H. D., Capitan A., Pausch H., Stothard P., van Binsbergen R., et al. (2014) Whole-genome sequencing of 234 bulls facilitates mapping of monogenic and complex traits in cattle. Nat Genet 46: 858-865
36. Pant S. D., Karlskov-Mortensen P., Jacobsen M. J., Cirera S., Kogelman L. J., et al. (2015) Comparative Analyses of QTLs Influencing Obesity and Metabolic Phenotypes in Pigs and Humans. PLoS One 10: e0137356
37. Gonen S., Baranski M., Thorland I., Norris A., Grove H., et al. (2015) Mapping and validation of a major QTL affecting resistance to pancreas disease (salmonid alphavirus) in Atlantic salmon (Salmo salar). Heredity (Edinb) 115: 405-414
38. Koltes J. E., Fritz-Waters E., Eisley C. J., Choi I., Bao H., et al. (2015) Identification of a pu-tative quantitative trait nucleotide in guanylate binding protein 5 for host response to PRRS virus infection. BMC Genomics 16: 412
10 Genomic selection in agriculture
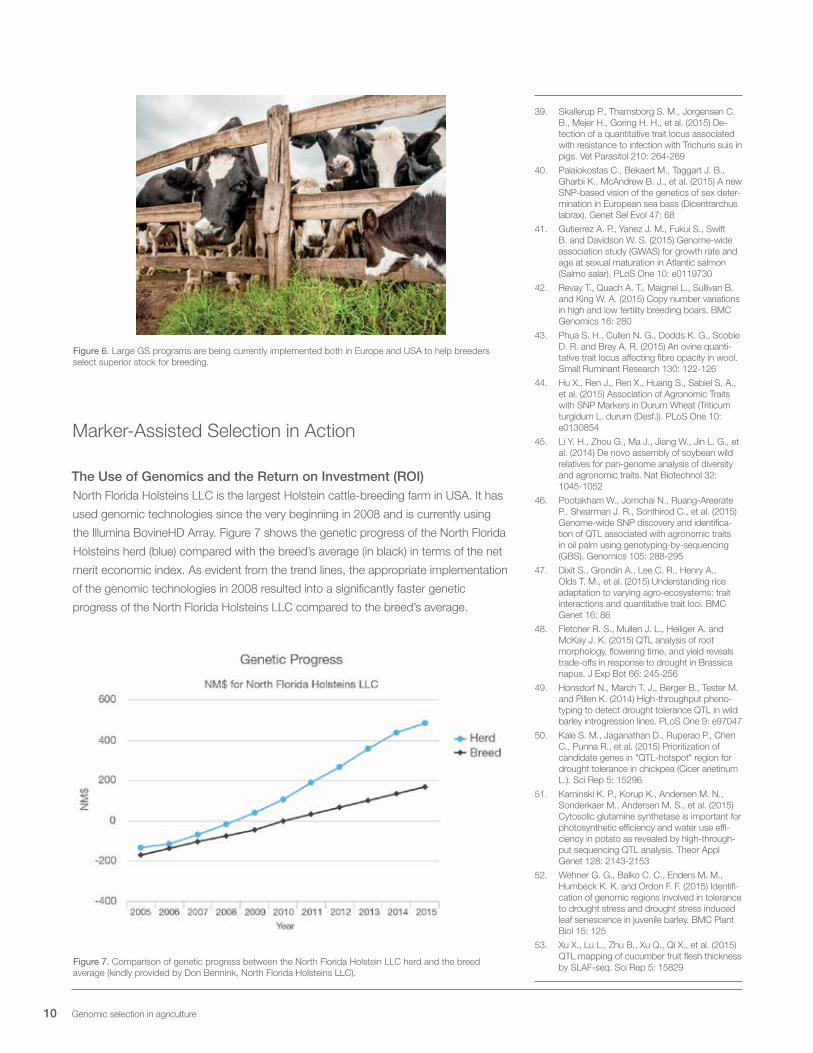
Figure 6. Large GS programs are being currently implemented both in Europe and USA to help breeders select superior stock for breeding.
Marker-Assisted Selection in Action
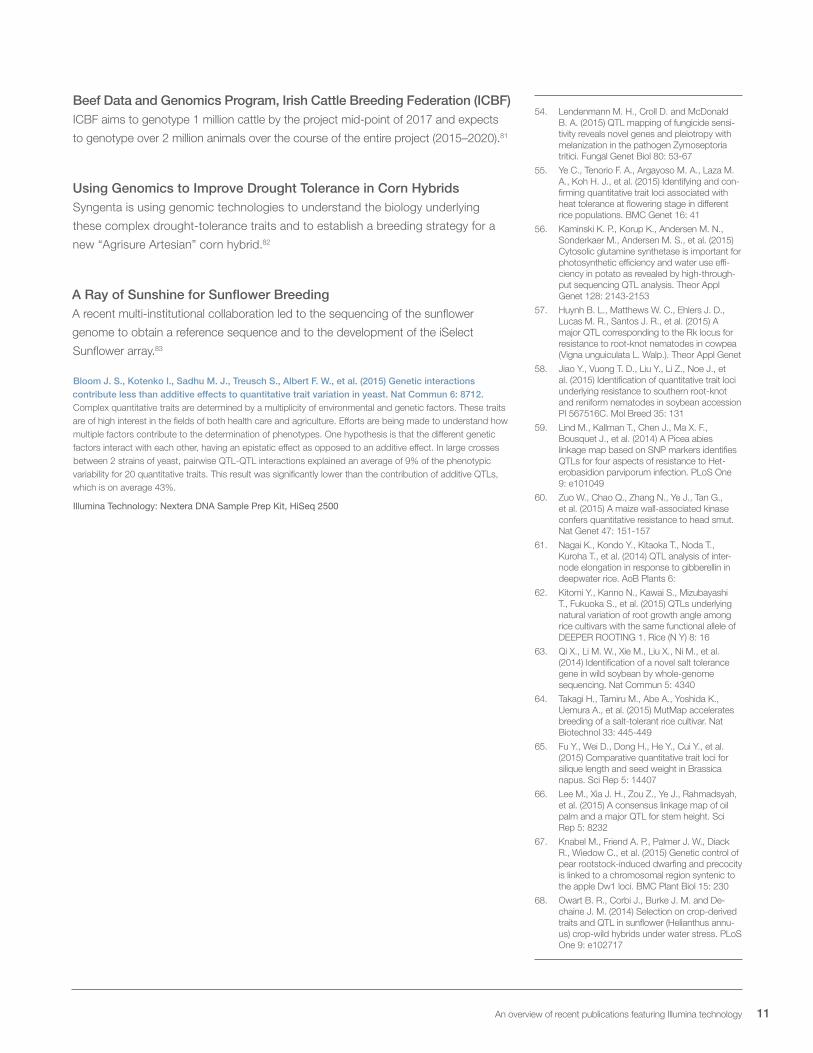
The Use of Genomics and the Return on Investment (ROI)North Florida Holsteins LLC is the largest Holstein cattle-breeding farm in USA. It has
used genomic technologies since the very beginning in 2008 and is currently using
the Illumina BovineHD Array. Figure 7 shows the genetic progress of the North Florida
Holsteins herd (blue) compared with the breed’s average (in black) in terms of the net
merit economic index. As evident from the trend lines, the appropriate implementation
of the genomic technologies in 2008 resulted into a significantly faster genetic
progress of the North Florida Holsteins LLC compared to the breed’s average.
Figure 7. Comparison of genetic progress between the North Florida Holstein LLC herd and the breed average (kindly provided by Don Bennink, North Florida Holsteins LLC).
39. Skallerup P., Thamsborg S. M., Jorgensen C. B., Mejer H., Goring H. H., et al. (2015) De-tection of a quantitative trait locus associated with resistance to infection with Trichuris suis in pigs. Vet Parasitol 210: 264-269
40. Palaiokostas C., Bekaert M., Taggart J. B., Gharbi K., McAndrew B. J., et al. (2015) A new SNP-based vision of the genetics of sex deter-mination in European sea bass (Dicentrarchus labrax). Genet Sel Evol 47: 68
41. Gutierrez A. P., Yanez J. M., Fukui S., Swift B. and Davidson W. S. (2015) Genome-wide association study (GWAS) for growth rate and age at sexual maturation in Atlantic salmon (Salmo salar). PLoS One 10: e0119730
42. Revay T., Quach A. T., Maignel L., Sullivan B. and King W. A. (2015) Copy number variations in high and low fertility breeding boars. BMC Genomics 16: 280
43. Phua S. H., Cullen N. G., Dodds K. G., Scobie D. R. and Bray A. R. (2015) An ovine quanti-tative trait locus affecting fibre opacity in wool. Small Ruminant Research 130: 122-126
44. Hu X., Ren J., Ren X., Huang S., Sabiel S. A., et al. (2015) Association of Agronomic Traits with SNP Markers in Durum Wheat (Triticum turgidum L. durum (Desf.)). PLoS One 10: e0130854
45. Li Y. H., Zhou G., Ma J., Jiang W., Jin L. G., et al. (2014) De novo assembly of soybean wild relatives for pan-genome analysis of diversity and agronomic traits. Nat Biotechnol 32: 1045-1052
46. Pootakham W., Jomchai N., Ruang-Areerate P., Shearman J. R., Sonthirod C., et al. (2015) Genome-wide SNP discovery and identifica-tion of QTL associated with agronomic traits in oil palm using genotyping-by-sequencing (GBS). Genomics 105: 288-295
47. Dixit S., Grondin A., Lee C. R., Henry A., Olds T. M., et al. (2015) Understanding rice adaptation to varying agro-ecosystems: trait interactions and quantitative trait loci. BMC Genet 16: 86
48. Fletcher R. S., Mullen J. L., Heiliger A. and McKay J. K. (2015) QTL analysis of root morphology, flowering time, and yield reveals trade-offs in response to drought in Brassica napus. J Exp Bot 66: 245-256
49. Honsdorf N., March T. J., Berger B., Tester M. and Pillen K. (2014) High-throughput pheno-typing to detect drought tolerance QTL in wild barley introgression lines. PLoS One 9: e97047
50. Kale S. M., Jaganathan D., Ruperao P., Chen C., Punna R., et al. (2015) Prioritization of candidate genes in "QTL-hotspot" region for drought tolerance in chickpea (Cicer arietinum L.). Sci Rep 5: 15296
51. Kaminski K. P., Korup K., Andersen M. N., Sonderkaer M., Andersen M. S., et al. (2015) Cytosolic glutamine synthetase is important for photosynthetic efficiency and water use effi-ciency in potato as revealed by high-through-put sequencing QTL analysis. Theor Appl Genet 128: 2143-2153
52. Wehner G. G., Balko C. C., Enders M. M., Humbeck K. K. and Ordon F. F. (2015) Identifi-cation of genomic regions involved in tolerance to drought stress and drought stress induced leaf senescence in juvenile barley. BMC Plant Biol 15: 125
53. Xu X., Lu L., Zhu B., Xu Q., Qi X., et al. (2015) QTL mapping of cucumber fruit flesh thickness by SLAF-seq. Sci Rep 5: 15829
11 An overview of recent publications featuring Illumina technology
Beef Data and Genomics Program, Irish Cattle Breeding Federation (ICBF)ICBF aims to genotype 1 million cattle by the project mid-point of 2017 and expects
to genotype over 2 million animals over the course of the entire project (2015–2020).81
Using Genomics to Improve Drought Tolerance in Corn HybridsSyngenta is using genomic technologies to understand the biology underlying
these complex drought-tolerance traits and to establish a breeding strategy for a
new “Agrisure Artesian” corn hybrid.82
A Ray of Sunshine for Sunflower BreedingA recent multi-institutional collaboration led to the sequencing of the sunflower
genome to obtain a reference sequence and to the development of the iSelect
Sunflower array.83
Bloom J. S., Kotenko I., Sadhu M. J., Treusch S., Albert F. W., et al. (2015) Genetic interactions contribute less than additive effects to quantitative trait variation in yeast. Nat Commun 6: 8712. Complex quantitative traits are determined by a multiplicity of environmental and genetic factors. These traits are of high interest in the fields of both health care and agriculture. Efforts are being made to understand how multiple factors contribute to the determination of phenotypes. One hypothesis is that the different genetic factors interact with each other, having an epistatic effect as opposed to an additive effect. In large crosses between 2 strains of yeast, pairwise QTL-QTL interactions explained an average of 9% of the phenotypic variability for 20 quantitative traits. This result was significantly lower than the contribution of additive QTLs, which is on average 43%.
Illumina Technology: Nextera DNA Sample Prep Kit, HiSeq 2500
54. Lendenmann M. H., Croll D. and McDonald B. A. (2015) QTL mapping of fungicide sensi-tivity reveals novel genes and pleiotropy with melanization in the pathogen Zymoseptoria tritici. Fungal Genet Biol 80: 53-67
55. Ye C., Tenorio F. A., Argayoso M. A., Laza M. A., Koh H. J., et al. (2015) Identifying and con-firming quantitative trait loci associated with heat tolerance at flowering stage in different rice populations. BMC Genet 16: 41
56. Kaminski K. P., Korup K., Andersen M. N., Sonderkaer M., Andersen M. S., et al. (2015) Cytosolic glutamine synthetase is important for photosynthetic efficiency and water use effi-ciency in potato as revealed by high-through-put sequencing QTL analysis. Theor Appl Genet 128: 2143-2153
57. Huynh B. L., Matthews W. C., Ehlers J. D., Lucas M. R., Santos J. R., et al. (2015) A major QTL corresponding to the Rk locus for resistance to root-knot nematodes in cowpea (Vigna unguiculata L. Walp.). Theor Appl Genet
58. Jiao Y., Vuong T. D., Liu Y., Li Z., Noe J., et al. (2015) Identification of quantitative trait loci underlying resistance to southern root-knot and reniform nematodes in soybean accession PI 567516C. Mol Breed 35: 131
59. Lind M., Kallman T., Chen J., Ma X. F., Bousquet J., et al. (2014) A Picea abies linkage map based on SNP markers identifies QTLs for four aspects of resistance to Het-erobasidion parviporum infection. PLoS One 9: e101049
60. Zuo W., Chao Q., Zhang N., Ye J., Tan G., et al. (2015) A maize wall-associated kinase confers quantitative resistance to head smut. Nat Genet 47: 151-157
61. Nagai K., Kondo Y., Kitaoka T., Noda T., Kuroha T., et al. (2014) QTL analysis of inter-node elongation in response to gibberellin in deepwater rice. AoB Plants 6:
62. Kitomi Y., Kanno N., Kawai S., Mizubayashi T., Fukuoka S., et al. (2015) QTLs underlying natural variation of root growth angle among rice cultivars with the same functional allele of DEEPER ROOTING 1. Rice (N Y) 8: 16
63. Qi X., Li M. W., Xie M., Liu X., Ni M., et al. (2014) Identification of a novel salt tolerance gene in wild soybean by whole-genome sequencing. Nat Commun 5: 4340
64. Takagi H., Tamiru M., Abe A., Yoshida K., Uemura A., et al. (2015) MutMap accelerates breeding of a salt-tolerant rice cultivar. Nat Biotechnol 33: 445-449
65. Fu Y., Wei D., Dong H., He Y., Cui Y., et al. (2015) Comparative quantitative trait loci for silique length and seed weight in Brassica napus. Sci Rep 5: 14407
66. Lee M., Xia J. H., Zou Z., Ye J., Rahmadsyah, et al. (2015) A consensus linkage map of oil palm and a major QTL for stem height. Sci Rep 5: 8232
67. Knabel M., Friend A. P., Palmer J. W., Diack R., Wiedow C., et al. (2015) Genetic control of pear rootstock-induced dwarfing and precocity is linked to a chromosomal region syntenic to the apple Dw1 loci. BMC Plant Biol 15: 230
68. Owart B. R., Corbi J., Burke J. M. and De-chaine J. M. (2014) Selection on crop-derived traits and QTL in sunflower (Helianthus annu-us) crop-wild hybrids under water stress. PLoS One 9: e102717
12 Genomic selection in agriculture
IMPLEMENTATION OF GENOMIC SELECTION
The implementation of GS relies on genetic markers that represent the complete
genome, the availability of large cohorts of individuals belonging to the same species,
and genomic prediction algorithms that combine genetic information with phenotypic
and pedigree data.
Establishing a Reference Genome
To date, hundreds of species have been sequenced at high coverage, and these
data are available in public databases.84 It may require a de novo sequencing project
when a reference genome is unavailable, or if the current reference is of poor quality.
The substantial efforts invested in DNA sequencing technologies over the last
decades, and the introduction of NGS, have resulted in a 100 million-fold decrease
in the cost per genome since 1990.85 To date, the cost for a raw megabase (Mb) of
DNA sequence is less than $0.1, and de novo sequencing projects have become
relatively routine.
Plants and animals can have very different genomes. Plants generally have more
complex genomes, often polyploid and containing high percentages of repetitive
sequences, compared to most animals. With the exception of certain fish, the
genomes of animals of agricultural interest are diploid.
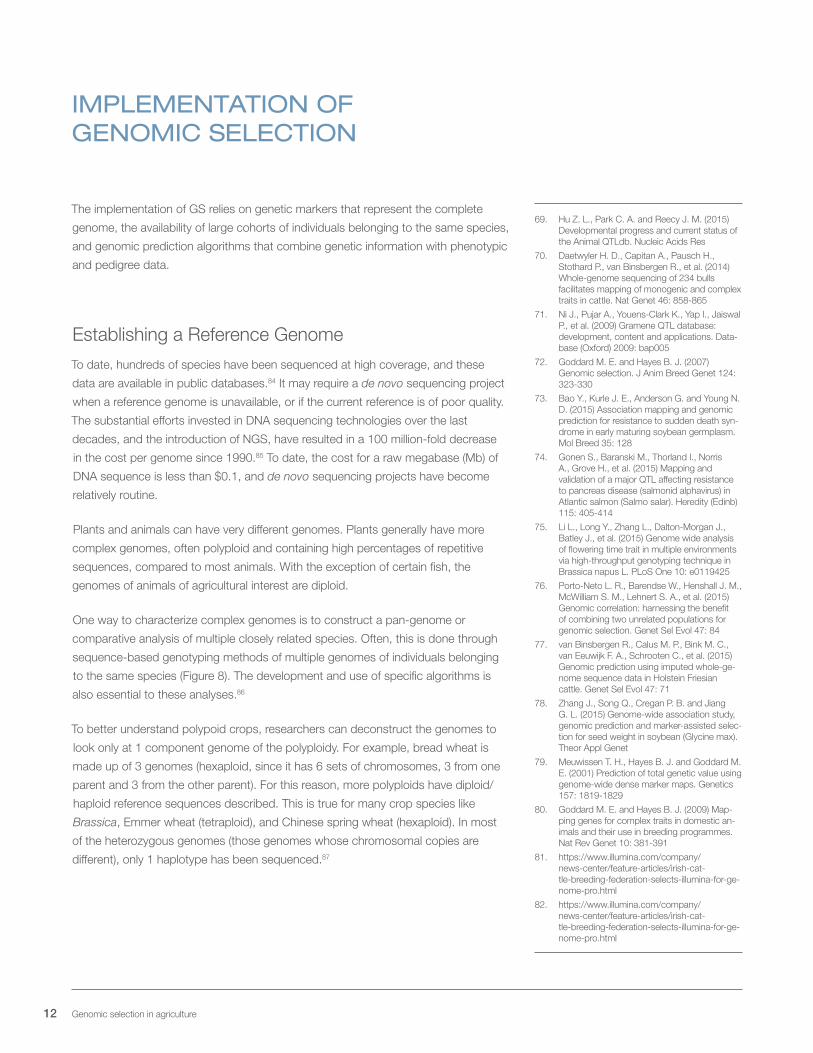
One way to characterize complex genomes is to construct a pan-genome or
comparative analysis of multiple closely related species. Often, this is done through
sequence-based genotyping methods of multiple genomes of individuals belonging
to the same species (Figure 8). The development and use of specific algorithms is
also essential to these analyses.86
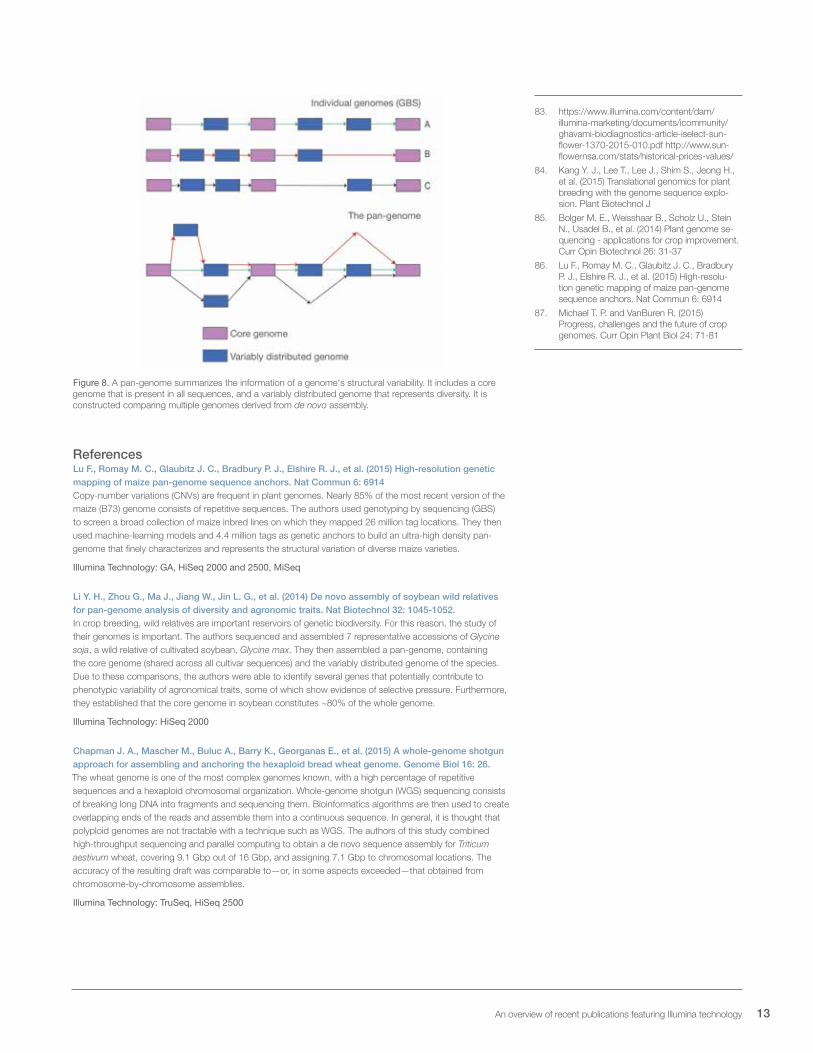
To better understand polypoid crops, researchers can deconstruct the genomes to
look only at 1 component genome of the polyploidy. For example, bread wheat is
made up of 3 genomes (hexaploid, since it has 6 sets of chromosomes, 3 from one
parent and 3 from the other parent). For this reason, more polyploids have diploid/
haploid reference sequences described. This is true for many crop species like
Brassica, Emmer wheat (tetraploid), and Chinese spring wheat (hexaploid). In most
of the heterozygous genomes (those genomes whose chromosomal copies are
different), only 1 haplotype has been sequenced.87
69. Hu Z. L., Park C. A. and Reecy J. M. (2015) Developmental progress and current status of the Animal QTLdb. Nucleic Acids Res
70. Daetwyler H. D., Capitan A., Pausch H., Stothard P., van Binsbergen R., et al. (2014) Whole-genome sequencing of 234 bulls facilitates mapping of monogenic and complex traits in cattle. Nat Genet 46: 858-865
71. Ni J., Pujar A., Youens-Clark K., Yap I., Jaiswal P., et al. (2009) Gramene QTL database: development, content and applications. Data-base (Oxford) 2009: bap005
72. Goddard M. E. and Hayes B. J. (2007) Genomic selection. J Anim Breed Genet 124: 323-330
73. Bao Y., Kurle J. E., Anderson G. and Young N. D. (2015) Association mapping and genomic prediction for resistance to sudden death syn-drome in early maturing soybean germplasm. Mol Breed 35: 128
74. Gonen S., Baranski M., Thorland I., Norris A., Grove H., et al. (2015) Mapping and validation of a major QTL affecting resistance to pancreas disease (salmonid alphavirus) in Atlantic salmon (Salmo salar). Heredity (Edinb) 115: 405-414
75. Li L., Long Y., Zhang L., Dalton-Morgan J., Batley J., et al. (2015) Genome wide analysis of flowering time trait in multiple environments via high-throughput genotyping technique in Brassica napus L. PLoS One 10: e0119425
76. Porto-Neto L. R., Barendse W., Henshall J. M., McWilliam S. M., Lehnert S. A., et al. (2015) Genomic correlation: harnessing the benefit of combining two unrelated populations for genomic selection. Genet Sel Evol 47: 84
77. van Binsbergen R., Calus M. P., Bink M. C., van Eeuwijk F. A., Schrooten C., et al. (2015) Genomic prediction using imputed whole-ge-nome sequence data in Holstein Friesian cattle. Genet Sel Evol 47: 71
78. Zhang J., Song Q., Cregan P. B. and Jiang G. L. (2015) Genome-wide association study, genomic prediction and marker-assisted selec-tion for seed weight in soybean (Glycine max). Theor Appl Genet
79. Meuwissen T. H., Hayes B. J. and Goddard M. E. (2001) Prediction of total genetic value using genome-wide dense marker maps. Genetics 157: 1819-1829
80. Goddard M. E. and Hayes B. J. (2009) Map-ping genes for complex traits in domestic an-imals and their use in breeding programmes. Nat Rev Genet 10: 381-391
81. https://www.illumina.com/company/news-center/feature-articles/irish-cat-tle-breeding-federation-selects-illumina-for-ge-nome-pro.html
82. https://www.illumina.com/company/news-center/feature-articles/irish-cat-tle-breeding-federation-selects-illumina-for-ge-nome-pro.html
13 An overview of recent publications featuring Illumina technology
Figure 8. A pan-genome summarizes the information of a genome's structural variability. It includes a core genome that is present in all sequences, and a variably distributed genome that represents diversity. It is constructed comparing multiple genomes derived from de novo assembly.
ReferencesLu F., Romay M. C., Glaubitz J. C., Bradbury P. J., Elshire R. J., et al. (2015) High-resolution genetic mapping of maize pan-genome sequence anchors. Nat Commun 6: 6914Copy-number variations (CNVs) are frequent in plant genomes. Nearly 85% of the most recent version of the maize (B73) genome consists of repetitive sequences. The authors used genotyping by sequencing (GBS) to screen a broad collection of maize inbred lines on which they mapped 26 million tag locations. They then used machine-learning models and 4.4 million tags as genetic anchors to build an ultra-high density pan-genome that finely characterizes and represents the structural variation of diverse maize varieties.
Illumina Technology: GA, HiSeq 2000 and 2500, MiSeq
Li Y. H., Zhou G., Ma J., Jiang W., Jin L. G., et al. (2014) De novo assembly of soybean wild relatives for pan-genome analysis of diversity and agronomic traits. Nat Biotechnol 32: 1045-1052.In crop breeding, wild relatives are important reservoirs of genetic biodiversity. For this reason, the study of their genomes is important. The authors sequenced and assembled 7 representative accessions of Glycine soja, a wild relative of cultivated soybean, Glycine max. They then assembled a pan-genome, containing the core genome (shared across all cultivar sequences) and the variably distributed genome of the species. Due to these comparisons, the authors were able to identify several genes that potentially contribute to phenotypic variability of agronomical traits, some of which show evidence of selective pressure. Furthermore, they established that the core genome in soybean constitutes ~80% of the whole genome.
Illumina Technology: HiSeq 2000
Chapman J. A., Mascher M., Buluc A., Barry K., Georganas E., et al. (2015) A whole-genome shotgun approach for assembling and anchoring the hexaploid bread wheat genome. Genome Biol 16: 26.The wheat genome is one of the most complex genomes known, with a high percentage of repetitive sequences and a hexaploid chromosomal organization. Whole-genome shotgun (WGS) sequencing consists of breaking long DNA into fragments and sequencing them. Bioinformatics algorithms are then used to create overlapping ends of the reads and assemble them into a continuous sequence. In general, it is thought that polyploid genomes are not tractable with a technique such as WGS. The authors of this study combined high-throughput sequencing and parallel computing to obtain a de novo sequence assembly for Triticum aestivum wheat, covering 9.1 Gbp out of 16 Gbp, and assigning 7.1 Gbp to chromosomal locations. The accuracy of the resulting draft was comparable to—or, in some aspects exceeded—that obtained from chromosome-by-chromosome assemblies.
Illumina Technology: TruSeq, HiSeq 2500
83. https://www.illumina.com/content/dam/illumina-marketing/documents/icommunity/ghavami-biodiagnostics-article-iselect-sun-flower-1370-2015-010.pdf http://www.sun-flowernsa.com/stats/historical-prices-values/
84. Kang Y. J., Lee T., Lee J., Shim S., Jeong H., et al. (2015) Translational genomics for plant breeding with the genome sequence explo-sion. Plant Biotechnol J
85. Bolger M. E., Weisshaar B., Scholz U., Stein N., Usadel B., et al. (2014) Plant genome se-quencing - applications for crop improvement. Curr Opin Biotechnol 26: 31-37
86. Lu F., Romay M. C., Glaubitz J. C., Bradbury P. J., Elshire R. J., et al. (2015) High-resolu-tion genetic mapping of maize pan-genome sequence anchors. Nat Commun 6: 6914
87. Michael T. P. and VanBuren R. (2015) Progress, challenges and the future of crop genomes. Curr Opin Plant Biol 24: 71-81
14 Genomic selection in agriculture
Figure 9. Wheat has one of the most complex genomes known.
Available resourcesDeNovoMagic Web Page: http://nrgene.com/genomic-product/denovo-magic/
The Genome OnLine Database (GOLD):88 https://gold.jgi.doe.gov/index
Phytozome:89 http://phytozome.jgi.doe.gov/pz/portal.html
PlantGDB:90 http://omia.angis.org.au/home/
Genotyping
Once the effort of assembling a genome is completed, it is necessary to find an
efficient method for obtaining data on large cohorts of the species of interest.
The sequencing and comparison of multiple individuals of different lines or breeds is
an extensive source of genomic markers.91 Once a reference sequence is available,
the assembly of multiple genomes is based on their alignments with the reference,
which makes it a feasible task.
However, even though the cost of whole-genome sequencing has declined
significantly in the last decades, it is still prohibitive to sequence the whole genome of
broad populations in a study or breeding program.
88. Pagani I., Liolios K., Jansson J., Chen I. M., Smirnova T., et al. (2012) The Genomes OnLine Database (GOLD) v.4: status of genomic and metagenomic projects and their associated metadata. Nucleic Acids Res 40: D571-579
89. Goodstein D. M., Shu S., Howson R., Neupane R., Hayes R. D., et al. (2012) Phyto-zome: a comparative platform for green plant genomics. Nucleic Acids Res 40: D1178-1186
90. Duvick J., Fu A., Muppirala U., Sabharwal M., Wilkerson M. D., et al. (2008) PlantGDB: a resource for comparative plant genomics. Nucleic Acids Res 36: D959-965
91. Eggen A. (2012) The development and appli-cation of genomic selection as a new breeding program. Animal Frontiers 2: 10-15
15 An overview of recent publications featuring Illumina technology
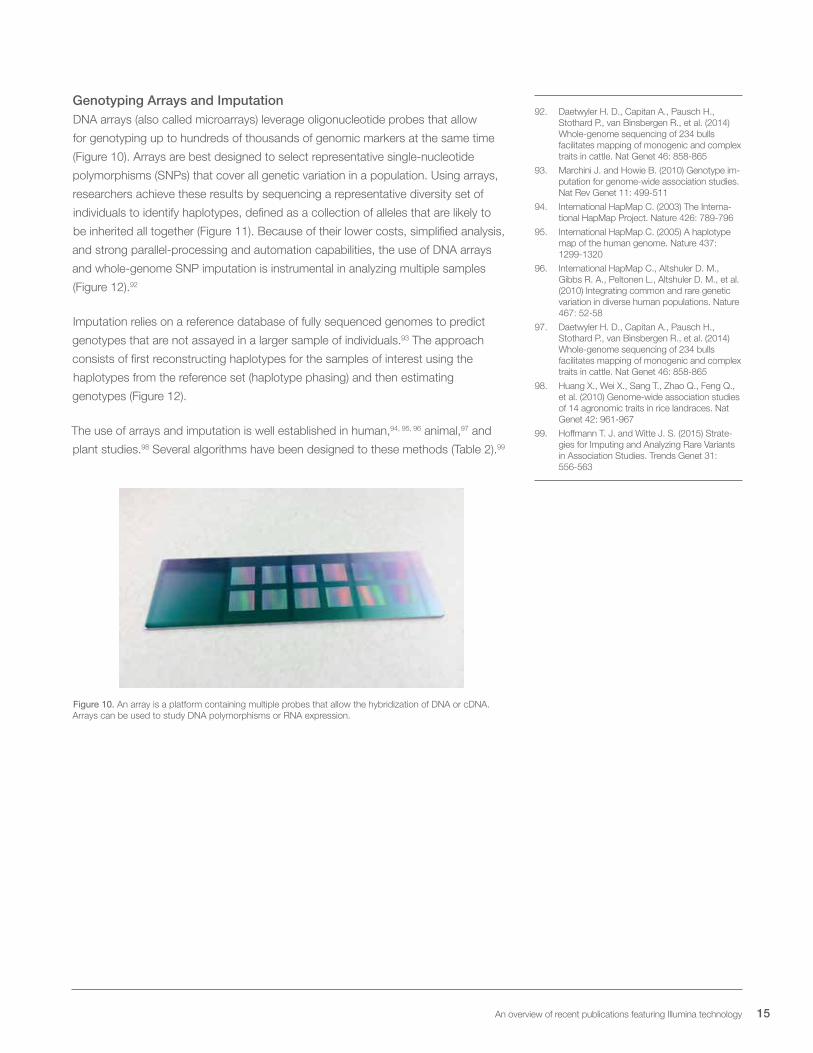
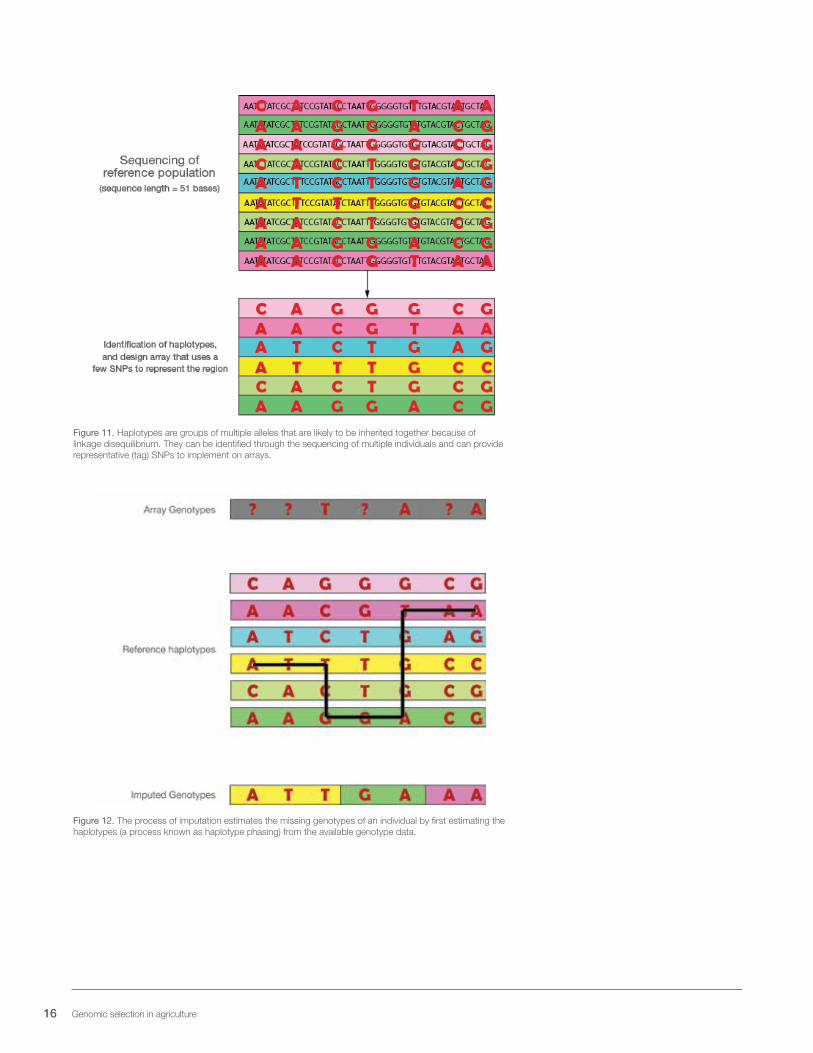
Genotyping Arrays and ImputationDNA arrays (also called microarrays) leverage oligonucleotide probes that allow
for genotyping up to hundreds of thousands of genomic markers at the same time
(Figure 10). Arrays are best designed to select representative single-nucleotide
polymorphisms (SNPs) that cover all genetic variation in a population. Using arrays,
researchers achieve these results by sequencing a representative diversity set of
individuals to identify haplotypes, defined as a collection of alleles that are likely to
be inherited all together (Figure 11). Because of their lower costs, simplified analysis,
and strong parallel-processing and automation capabilities, the use of DNA arrays
and whole-genome SNP imputation is instrumental in analyzing multiple samples
(Figure 12).92
Imputation relies on a reference database of fully sequenced genomes to predict
genotypes that are not assayed in a larger sample of individuals.93 The approach
consists of first reconstructing haplotypes for the samples of interest using the
haplotypes from the reference set (haplotype phasing) and then estimating
genotypes (Figure 12).
The use of arrays and imputation is well established in human,94, 95, 96 animal,97 and
plant studies.98 Several algorithms have been designed to these methods (Table 2).99
Figure 10. An array is a platform containing multiple probes that allow the hybridization of DNA or cDNA. Arrays can be used to study DNA polymorphisms or RNA expression.
92. Daetwyler H. D., Capitan A., Pausch H., Stothard P., van Binsbergen R., et al. (2014) Whole-genome sequencing of 234 bulls facilitates mapping of monogenic and complex traits in cattle. Nat Genet 46: 858-865
93. Marchini J. and Howie B. (2010) Genotype im-putation for genome-wide association studies. Nat Rev Genet 11: 499-511
94. International HapMap C. (2003) The Interna-tional HapMap Project. Nature 426: 789-796
95. International HapMap C. (2005) A haplotype map of the human genome. Nature 437: 1299-1320
96. International HapMap C., Altshuler D. M., Gibbs R. A., Peltonen L., Altshuler D. M., et al. (2010) Integrating common and rare genetic variation in diverse human populations. Nature 467: 52-58
97. Daetwyler H. D., Capitan A., Pausch H., Stothard P., van Binsbergen R., et al. (2014) Whole-genome sequencing of 234 bulls facilitates mapping of monogenic and complex traits in cattle. Nat Genet 46: 858-865
98. Huang X., Wei X., Sang T., Zhao Q., Feng Q., et al. (2010) Genome-wide association studies of 14 agronomic traits in rice landraces. Nat Genet 42: 961-967
99. Hoffmann T. J. and Witte J. S. (2015) Strate-gies for Imputing and Analyzing Rare Variants in Association Studies. Trends Genet 31: 556-563
16 Genomic selection in agriculture
Figure 11. Haplotypes are groups of multiple alleles that are likely to be inherited together because of linkage disequilibrium. They can be identified through the sequencing of multiple individuals and can provide representative (tag) SNPs to implement on arrays.
Figure 12. The process of imputation estimates the missing genotypes of an individual by first estimating the haplotypes (a process known as haplotype phasing) from the available genotype data.
17 An overview of recent publications featuring Illumina technology
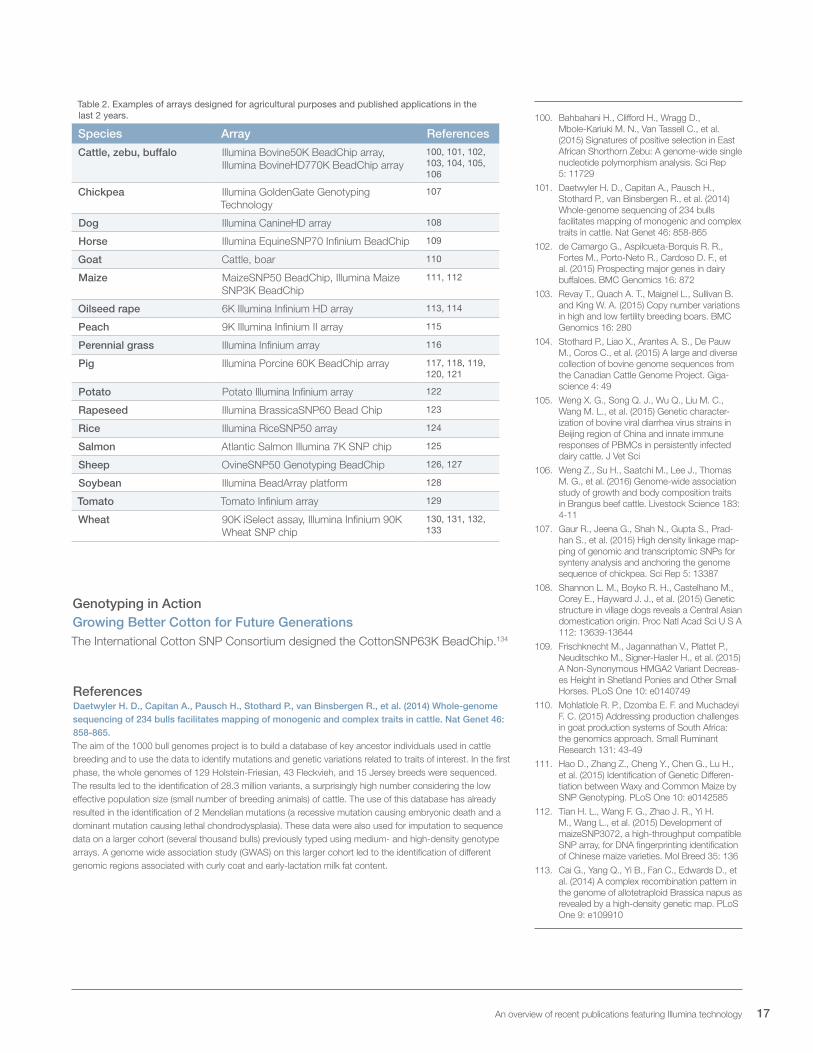
Table 2. Examples of arrays designed for agricultural purposes and published applications in the last 2 years.
Species Array References
Cattle, zebu, buffalo Illumina Bovine50K BeadChip array, Illumina BovineHD770K BeadChip array
100, 101, 102, 103, 104, 105, 106
Chickpea Illumina GoldenGate Genotyping Technology
107
Dog Illumina CanineHD array 108
Horse Illumina EquineSNP70 Infinium BeadChip 109
Goat Cattle, boar 110
Maize MaizeSNP50 BeadChip, Illumina Maize SNP3K BeadChip
111, 112
Oilseed rape 6K Illumina Infinium HD array 113, 114
Peach 9K Illumina Infinium II array 115
Perennial grass Illumina Infinium array 116
Pig Illumina Porcine 60K BeadChip array 117, 118, 119, 120, 121
Potato Potato Illumina Infinium array 122
Rapeseed Illumina BrassicaSNP60 Bead Chip 123
Rice Illumina RiceSNP50 array 124
Salmon Atlantic Salmon Illumina 7K SNP chip 125
Sheep OvineSNP50 Genotyping BeadChip 126, 127
Soybean Illumina BeadArray platform 128
Tomato Tomato Infinium array 129
Wheat 90K iSelect assay, Illumina Infinium 90K Wheat SNP chip
130, 131, 132, 133
Genotyping in ActionGrowing Better Cotton for Future GenerationsThe International Cotton SNP Consortium designed the CottonSNP63K BeadChip.134
ReferencesDaetwyler H. D., Capitan A., Pausch H., Stothard P., van Binsbergen R., et al. (2014) Whole-genome sequencing of 234 bulls facilitates mapping of monogenic and complex traits in cattle. Nat Genet 46: 858-865.The aim of the 1000 bull genomes project is to build a database of key ancestor individuals used in cattle breeding and to use the data to identify mutations and genetic variations related to traits of interest. In the first phase, the whole genomes of 129 Holstein-Friesian, 43 Fleckvieh, and 15 Jersey breeds were sequenced. The results led to the identification of 28.3 million variants, a surprisingly high number considering the low effective population size (small number of breeding animals) of cattle. The use of this database has already resulted in the identification of 2 Mendelian mutations (a recessive mutation causing embryonic death and a dominant mutation causing lethal chondrodysplasia). These data were also used for imputation to sequence data on a larger cohort (several thousand bulls) previously typed using medium- and high-density genotype arrays. A genome wide association study (GWAS) on this larger cohort led to the identification of different genomic regions associated with curly coat and early-lactation milk fat content.
100. Bahbahani H., Clifford H., Wragg D., Mbole-Kariuki M. N., Van Tassell C., et al. (2015) Signatures of positive selection in East African Shorthorn Zebu: A genome-wide single nucleotide polymorphism analysis. Sci Rep 5: 11729
101. Daetwyler H. D., Capitan A., Pausch H., Stothard P., van Binsbergen R., et al. (2014) Whole-genome sequencing of 234 bulls facilitates mapping of monogenic and complex traits in cattle. Nat Genet 46: 858-865
102. de Camargo G., Aspilcueta-Borquis R. R., Fortes M., Porto-Neto R., Cardoso D. F., et al. (2015) Prospecting major genes in dairy buffaloes. BMC Genomics 16: 872
103. Revay T., Quach A. T., Maignel L., Sullivan B. and King W. A. (2015) Copy number variations in high and low fertility breeding boars. BMC Genomics 16: 280
104. Stothard P., Liao X., Arantes A. S., De Pauw M., Coros C., et al. (2015) A large and diverse collection of bovine genome sequences from the Canadian Cattle Genome Project. Giga-science 4: 49
105. Weng X. G., Song Q. J., Wu Q., Liu M. C., Wang M. L., et al. (2015) Genetic character-ization of bovine viral diarrhea virus strains in Beijing region of China and innate immune responses of PBMCs in persistently infected dairy cattle. J Vet Sci
106. Weng Z., Su H., Saatchi M., Lee J., Thomas M. G., et al. (2016) Genome-wide association study of growth and body composition traits in Brangus beef cattle. Livestock Science 183: 4-11
107. Gaur R., Jeena G., Shah N., Gupta S., Prad-han S., et al. (2015) High density linkage map-ping of genomic and transcriptomic SNPs for synteny analysis and anchoring the genome sequence of chickpea. Sci Rep 5: 13387
108. Shannon L. M., Boyko R. H., Castelhano M., Corey E., Hayward J. J., et al. (2015) Genetic structure in village dogs reveals a Central Asian domestication origin. Proc Natl Acad Sci U S A 112: 13639-13644
109. Frischknecht M., Jagannathan V., Plattet P., Neuditschko M., Signer-Hasler H., et al. (2015) A Non-Synonymous HMGA2 Variant Decreas-es Height in Shetland Ponies and Other Small Horses. PLoS One 10: e0140749
110. Mohlatlole R. P., Dzomba E. F. and Muchadeyi F. C. (2015) Addressing production challenges in goat production systems of South Africa: the genomics approach. Small Ruminant Research 131: 43-49
111. Hao D., Zhang Z., Cheng Y., Chen G., Lu H., et al. (2015) Identification of Genetic Differen-tiation between Waxy and Common Maize by SNP Genotyping. PLoS One 10: e0142585
112. Tian H. L., Wang F. G., Zhao J. R., Yi H. M., Wang L., et al. (2015) Development of maizeSNP3072, a high-throughput compatible SNP array, for DNA fingerprinting identification of Chinese maize varieties. Mol Breed 35: 136
113. Cai G., Yang Q., Yi B., Fan C., Edwards D., et al. (2014) A complex recombination pattern in the genome of allotetraploid Brassica napus as revealed by a high-density genetic map. PLoS One 9: e109910
18 Genomic selection in agriculture
Shannon L. M., Boyko R. H., Castelhano M., Corey E., Hayward J. J., et al. (2015) Genetic structure in village dogs reveals a Central Asian domestication origin. Proc Natl Acad Sci U S A 112: 13639-13644.Village dogs are free-breeding human commensal populations of dogs that are much more genetically diverse, numerous, and geographically distributed as compared to purebreds. For these reasons, they are fundamental to the study of dogs’ ancestry and origin. The authors used a semicustom array of 185,805 markers to analyze autosomal, mitochondrial, and Y chromosome diversity in 549 village dogs from 38 countries and compared it with multiple purebred dogs belonging to 161 breeds, for a total of 4,676 purebred dogs. The results showed that some populations (such as those found in the Neotropics and the South Pacific) have European origins, some are admixtures between European dogs and indigenous dogs, while some populations from Asia and the Middle East (such as India, Vietnam, and Egypt) have very little admixture with Europeans. This last group also showed linkage disequilibrium patterns that suggest a Central Asian origin for domestication of dogs.
Illumina Technology: TruSeq DNA Sample Prep Kit, HiSeq 2000
Hulse-Kemp A. M., Lemm J., Plieske J., Ashrafi H., Buyyarapu R., et al. (2015) Development of a 63K SNP Array for Cotton and High-Density Mapping of Intraspecific and Interspecific Populations of Gossypium spp. G3 (Bethesda) 5: 1187-1209.Cotton provides both textile fiber and oilseed, and represents an important crop for both these reasons. However, genetic studies on cotton are challenging, given the complexity of the genome. This study aimed to develop a standardized large-scale genotyping platform for cotton. To do so, they combined results from 9 intraspecific and 4 interspecific studies to obtain SNP data and develop the CottonSNP63K array, containing 45,104 putative intraspecific SNPs and 17,954 putative interspecific SNPs. They then validated the array on 1,156 samples to generate cluster positions. Thus, they enabled use of the array across a diverse germplasm to facilitate breeding decisions on a global scale.
Illumina Technology: iSelect Infinium Array
Genotyping by Sequencing
GBS (as defined by Buckler et al, 2010)135 is a method that allows researchers to
obtain sequencing data at a reasonable price and to use it for genotyping purposes.
Because GBS does not need a priori knowledge of the sequence being studied, it
has some advantages over array-based methods in cases where the spacing of
markers along chromosomes is unavailable. It is widely used in species where a
reference genome is unknown.
GBS reduces the complexity of the genome by using reduced representation libraries
(RRL).136 These libraries are constructed by fragmenting the genome under study
through the use of restriction enzymes (REs). As REs cut specific sequence motifs,
RRL targets a specific region of the genome. The resulting fragments can be used for
high-coverage sequencing. The use of barcoded adapters also allows the study of
multiple sequences at the same time, a process called multiplexing.137
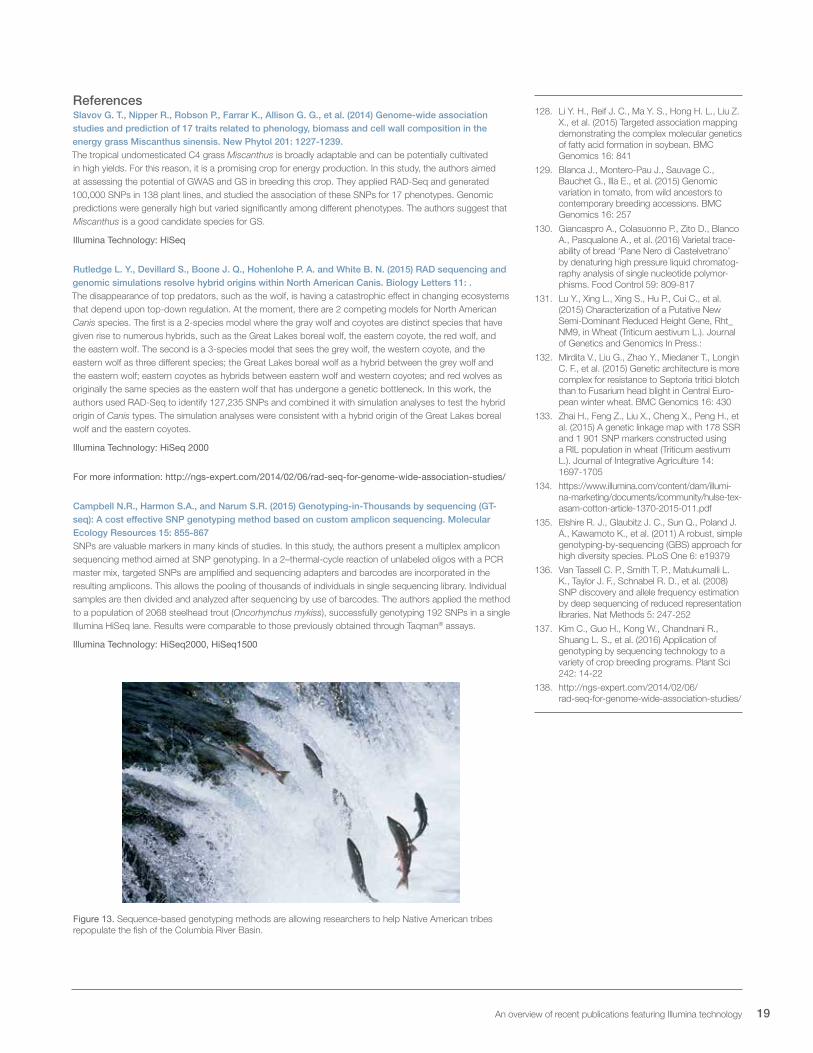
Genotyping by Sequencing in ActionRestoring and Managing Historical Columbia River Basin Fish Populations using GenomicsA team of geneticists from the University of Idaho’s Hagerman Fish Culture
Experiment Station for the Columbia River Inter-Tribal Fish Commission (CRITFC)
is working to help Native American tribes to repopulate the Columbia River Basin
salmon. To do this, they developed a GBS application that they called genotyping-in-
thousands by sequencing (GT-Seq).138
114. Cai G., Yang Q., Yi B., Fan C., Zhang C., et al. (2015) A bi-filtering method for processing single nucleotide polymorphism array data improves the quality of genetic map and accuracy of quantitative trait locus mapping in doubled haploid populations of polyploid Brassica napus. BMC Genomics 16: 409
115. Micheletti D., Dettori M. T., Micali S., Aramini V., Pacheco I., et al. (2015) Whole-Genome Analysis of Diversity and SNP-Major Gene Association in Peach Germplasm. PLoS One 10: e0136803
116. Blackmore T., Thomas I., McMahon R., Powell W. and Hegarty M. (2015) Genetic-geographic correlation revealed across a broad European ecotypic sample of perennial ryegrass (Lolium perenne) using array-based SNP genotyping. Theor Appl Genet 128: 1917-1932
117. Ai H., Fang X., Yang B., Huang Z., Chen H., et al. (2015) Adaptation and possible ancient interspecies introgression in pigs identified by whole-genome sequencing. Nat Genet 47: 217-225
118. Frantz L. A., Schraiber J. G., Madsen O., Megens H. J., Cagan A., et al. (2015) Evidence of long-term gene flow and selection during domestication from analyses of Eurasian wild and domestic pig genomes. Nat Genet 47: 1141-1148
119. Wang K., Liu D., Hernandez-Sanchez J., Chen J., Liu C., et al. (2015) Genome Wide Association Analysis Reveals New Production Trait Genes in a Male Duroc Population. PLoS One 10: e0139207
120. Wang L., Xu L., Liu X., Zhang T., Li N., et al. (2015) Copy number variation-based genome wide association study reveals additional variants contributing to meat quality in Swine. Sci Rep 5: 12535
121. Wiedmann R. T., Nonneman D. J. and Rohrer G. A. (2015) Genome-Wide Copy Number Variations Using SNP Genotyping in a Mixed Breed Swine Population. PLoS One 10: e0133529
122. Kolech S. A., Halseth D., De Jong W., Perry K., Wolfe D., et al. (2015) Potato Variety Diver-sity, Determinants and Implications for Potato Breeding Strategy in Ethiopia. Am. J. Potato Res. 92: 551-566
123. Luo X., Ma C., Yue Y., Hu K., Li Y., et al. (2015) Unravelling the complex trait of harvest index in rapeseed (Brassica napus L.) with association mapping. BMC Genomics 16: 379
124. Wu J., Feng F., Lian X., Teng X., Wei H., et al. (2015) Genome-wide Association Study (GWAS) of mesocotyl elongation based on re-sequencing approach in rice. BMC Plant Biol 15: 218
125. Pocwierz-Kotus A., Bernas R., Kent M. P., Lien S., Leliuna E., et al. (2015) Restitution and genetic differentiation of salmon populations in the southern Baltic genotyped with the Atlantic salmon 7K SNP array. Genet Sel Evol 47: 39
126. Ma Y., Zhang Q., Lu Z., Zhao X. and Zhang Y. (2015) Analysis of copy number variations by SNP50 BeadChip array in Chinese sheep. Genomics 106: 295-300
127. Nicoloso L., Bomba L., Colli L., Negrini R., Milanesi M., et al. (2015) Genetic diversity of Italian goat breeds assessed with a medi-um-density SNP chip. Genet Sel Evol 47: 62
19 An overview of recent publications featuring Illumina technology
ReferencesSlavov G. T., Nipper R., Robson P., Farrar K., Allison G. G., et al. (2014) Genome-wide association studies and prediction of 17 traits related to phenology, biomass and cell wall composition in the energy grass Miscanthus sinensis. New Phytol 201: 1227-1239.The tropical undomesticated C4 grass Miscanthus is broadly adaptable and can be potentially cultivated in high yields. For this reason, it is a promising crop for energy production. In this study, the authors aimed at assessing the potential of GWAS and GS in breeding this crop. They applied RAD-Seq and generated 100,000 SNPs in 138 plant lines, and studied the association of these SNPs for 17 phenotypes. Genomic predictions were generally high but varied significantly among different phenotypes. The authors suggest that Miscanthus is a good candidate species for GS.
Illumina Technology: HiSeq
Rutledge L. Y., Devillard S., Boone J. Q., Hohenlohe P. A. and White B. N. (2015) RAD sequencing and genomic simulations resolve hybrid origins within North American Canis. Biology Letters 11: .The disappearance of top predators, such as the wolf, is having a catastrophic effect in changing ecosystems that depend upon top-down regulation. At the moment, there are 2 competing models for North American Canis species. The first is a 2-species model where the gray wolf and coyotes are distinct species that have given rise to numerous hybrids, such as the Great Lakes boreal wolf, the eastern coyote, the red wolf, and the eastern wolf. The second is a 3-species model that sees the grey wolf, the western coyote, and the eastern wolf as three different species; the Great Lakes boreal wolf as a hybrid between the grey wolf and the eastern wolf; eastern coyotes as hybrids between eastern wolf and western coyotes; and red wolves as originally the same species as the eastern wolf that has undergone a genetic bottleneck. In this work, the authors used RAD-Seq to identify 127,235 SNPs and combined it with simulation analyses to test the hybrid origin of Canis types. The simulation analyses were consistent with a hybrid origin of the Great Lakes boreal wolf and the eastern coyotes.
Illumina Technology: HiSeq 2000
For more information: http://ngs-expert.com/2014/02/06/rad-seq-for-genome-wide-association-studies/
Campbell N.R., Harmon S.A., and Narum S.R. (2015) Genotyping-in-Thousands by sequencing (GT-seq): A cost effective SNP genotyping method based on custom amplicon sequencing. Molecular Ecology Resources 15: 855-867SNPs are valuable markers in many kinds of studies. In this study, the authors present a multiplex amplicon sequencing method aimed at SNP genotyping. In a 2–thermal-cycle reaction of unlabeled oligos with a PCR master mix, targeted SNPs are amplified and sequencing adapters and barcodes are incorporated in the resulting amplicons. This allows the pooling of thousands of individuals in single sequencing library. Individual samples are then divided and analyzed after sequencing by use of barcodes. The authors applied the method to a population of 2068 steelhead trout (Oncorhynchus mykiss), successfully genotyping 192 SNPs in a single Illumina HiSeq lane. Results were comparable to those previously obtained through Taqman® assays.
Illumina Technology: HiSeq2000, HiSeq1500
Figure 13. Sequence-based genotyping methods are allowing researchers to help Native American tribes repopulate the fish of the Columbia River Basin.
128. Li Y. H., Reif J. C., Ma Y. S., Hong H. L., Liu Z. X., et al. (2015) Targeted association mapping demonstrating the complex molecular genetics of fatty acid formation in soybean. BMC Genomics 16: 841
129. Blanca J., Montero-Pau J., Sauvage C., Bauchet G., Illa E., et al. (2015) Genomic variation in tomato, from wild ancestors to contemporary breeding accessions. BMC Genomics 16: 257
130. Giancaspro A., Colasuonno P., Zito D., Blanco A., Pasqualone A., et al. (2016) Varietal trace-ability of bread ‘Pane Nero di Castelvetrano’ by denaturing high pressure liquid chromatog-raphy analysis of single nucleotide polymor-phisms. Food Control 59: 809-817
131. Lu Y., Xing L., Xing S., Hu P., Cui C., et al. (2015) Characterization of a Putative New Semi-Dominant Reduced Height Gene, Rht_NM9, in Wheat (Triticum aestivum L.). Journal of Genetics and Genomics In Press.:
132. Mirdita V., Liu G., Zhao Y., Miedaner T., Longin C. F., et al. (2015) Genetic architecture is more complex for resistance to Septoria tritici blotch than to Fusarium head blight in Central Euro-pean winter wheat. BMC Genomics 16: 430
133. Zhai H., Feng Z., Liu X., Cheng X., Peng H., et al. (2015) A genetic linkage map with 178 SSR and 1 901 SNP markers constructed using a RIL population in wheat (Triticum aestivum L.). Journal of Integrative Agriculture 14: 1697-1705
134. https://www.illumina.com/content/dam/illumi-na-marketing/documents/icommunity/hulse-tex-asam-cotton-article-1370-2015-011.pdf
135. Elshire R. J., Glaubitz J. C., Sun Q., Poland J. A., Kawamoto K., et al. (2011) A robust, simple genotyping-by-sequencing (GBS) approach for high diversity species. PLoS One 6: e19379
136. Van Tassell C. P., Smith T. P., Matukumalli L. K., Taylor J. F., Schnabel R. D., et al. (2008) SNP discovery and allele frequency estimation by deep sequencing of reduced representation libraries. Nat Methods 5: 247-252
137. Kim C., Guo H., Kong W., Chandnani R., Shuang L. S., et al. (2016) Application of genotyping by sequencing technology to a variety of crop breeding programs. Plant Sci 242: 14-22
138. http://ngs-expert.com/2014/02/06/rad-seq-for-genome-wide-association-studies/
20 Genomic selection in agriculture
Implementation of Genomic Selection
The implementation of GS relies on the existence of breeding programs in which both
pedigree and genomic information are collected and recorded.139 Breeders can use
this information to select and breed the most promising animals. The advantages
of GS are that it can be implemented very early in life (therefore shortening the
generation intervals), it is not limited to 1 sex, and it is of particular usefulness for
those traits that are not easy to improve.140
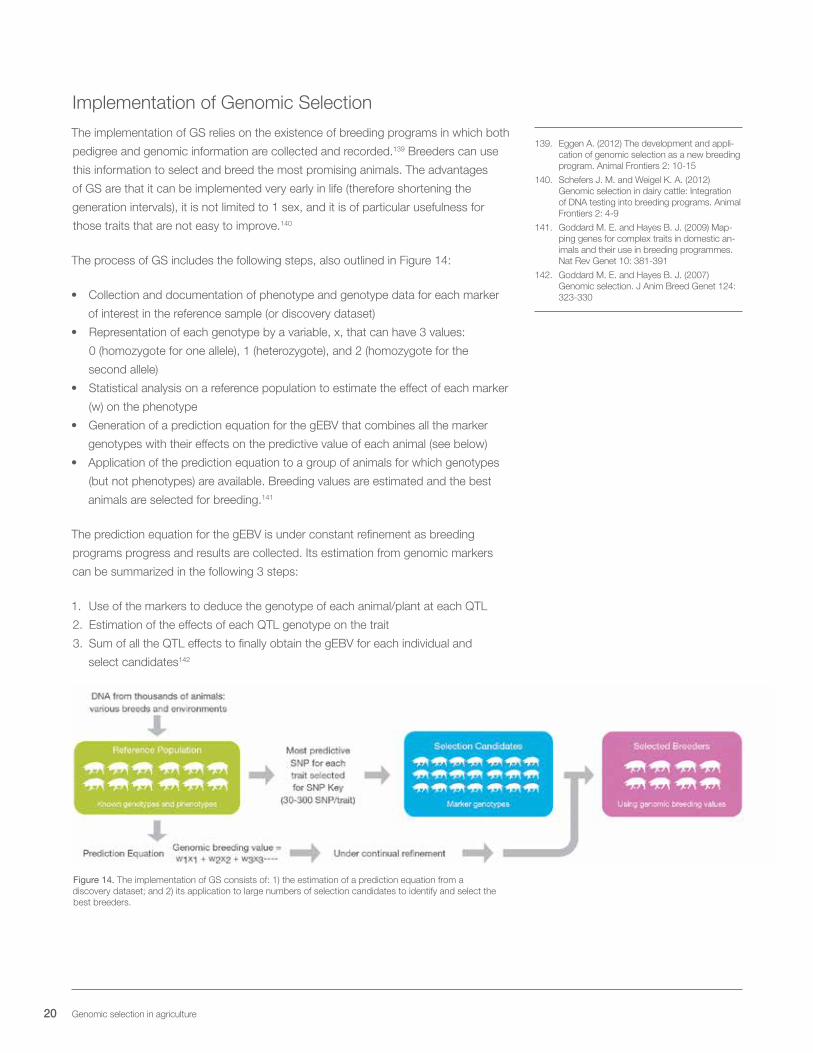
The process of GS includes the following steps, also outlined in Figure 14:
• Collection and documentation of phenotype and genotype data for each marker
of interest in the reference sample (or discovery dataset)
• Representation of each genotype by a variable, x, that can have 3 values:
0 (homozygote for one allele), 1 (heterozygote), and 2 (homozygote for the
second allele)
• Statistical analysis on a reference population to estimate the effect of each marker
(w) on the phenotype
• Generation of a prediction equation for the gEBV that combines all the marker
genotypes with their effects on the predictive value of each animal (see below)
• Application of the prediction equation to a group of animals for which genotypes
(but not phenotypes) are available. Breeding values are estimated and the best
animals are selected for breeding.141
The prediction equation for the gEBV is under constant refinement as breeding
programs progress and results are collected. Its estimation from genomic markers
can be summarized in the following 3 steps:
1. Use of the markers to deduce the genotype of each animal/plant at each QTL
2. Estimation of the effects of each QTL genotype on the trait
3. Sum of all the QTL effects to finally obtain the gEBV for each individual and
select candidates142
Figure 14. The implementation of GS consists of: 1) the estimation of a prediction equation from a discovery dataset; and 2) its application to large numbers of selection candidates to identify and select the best breeders.
139. Eggen A. (2012) The development and appli-cation of genomic selection as a new breeding program. Animal Frontiers 2: 10-15
140. Schefers J. M. and Weigel K. A. (2012) Genomic selection in dairy cattle: Integration of DNA testing into breeding programs. Animal Frontiers 2: 4-9
141. Goddard M. E. and Hayes B. J. (2009) Map-ping genes for complex traits in domestic an-imals and their use in breeding programmes. Nat Rev Genet 10: 381-391
142. Goddard M. E. and Hayes B. J. (2007) Genomic selection. J Anim Breed Genet 124: 323-330
21 An overview of recent publications featuring Illumina technology
Genomic Selection in Action
Genotyping Cattle for More Efficient Breeding and Higher-Quality Food SupplyGeneSeek is the leading provider of genetic diagnostics for identity and trait
evaluation in the agricultural biotechnology industry.143
ReferencesMuranty H., Troggio M., Sadok I. B., Rifaı¨ M. A., Aukwerken A., et al. (2015) Accuracy and response of genomic selection on key traits in apple breeding. Horticulture Research 2: 15060.The cultivation of fruit trees is a long process. The length of the juvenile phase of the development of trees delays the collection of phenotype information, and breeding programs last several years. The use of GS has the great potential of reducing this time while also increasing prediction accuracy and selection intensity. In this study, the authors assessed the utility of GS for key traits in several breeding programs. They analyzed a training population of 977 individuals derived from 20 pedigreed full-sib families, for which phenotypic data had been historically recorded for 10 traits related to productivity and fruit quality. They obtained genotypic data for 7829 SNPs by using an Illumina 20K SNP array. Using these data, they built a genomic prediction model that they then applied to estimate genomic breeding values for 5 application sib-families, for which data on 364 SNPs were available. Next, the authors phenotyped these additional 5 families prospectively for 1 year and compared the observations with the predicted breeding values. The accuracy of genomic prediction across the tested phenotypes ranged from 0.19 to 0.5, where the lower values were obtained for phenotypes with low heritability and/or for which phenotype distribution was skewed. These results highlight the potential of genomic selection in the cultivation of fruit trees.
Illumina Technology: BovineSNP50 BeadChip
143. https://www.illumina.com/content/dam/illumina-marketing/documents/icommunity/article_2014_12_geneseek_bovinesnp50.pdf
22 Genomic selection in agriculture
ECONOMIC CONSIDERATIONS
Starting in the early 2000s, several studies demonstrated the economic advantages
of genomic selection in animal breeding.144 This approach is also emerging for crop
selection.145
Traditional breeding and MAS had already remarkably improved animal and crop
productivity. For example, before the start of quantitative breeding, the average cow
produced a few thousand pounds of milk in its lifetime. The advent of quantitative
breeding, 70 years ago, raised this to about 20,000 lb.146
The advent of MAS has given a second boost to both livestock and crop productivity.
For example, the use of this technique in rice cultivars to develop disease-resistant
strains generated profit and, more importantly, saved thousands of lives.147
However, MAS has several limitations, for 2 main reasons:148
• Most of the traits of agricultural value are complex, and single markers are able to
explain only a small fraction of the genetic variance. As a result, the accuracy of
estimates for genotype-phenotype effects is low.
• For certain traits, the search for markers would require large sample sizes and
long selection cycles.
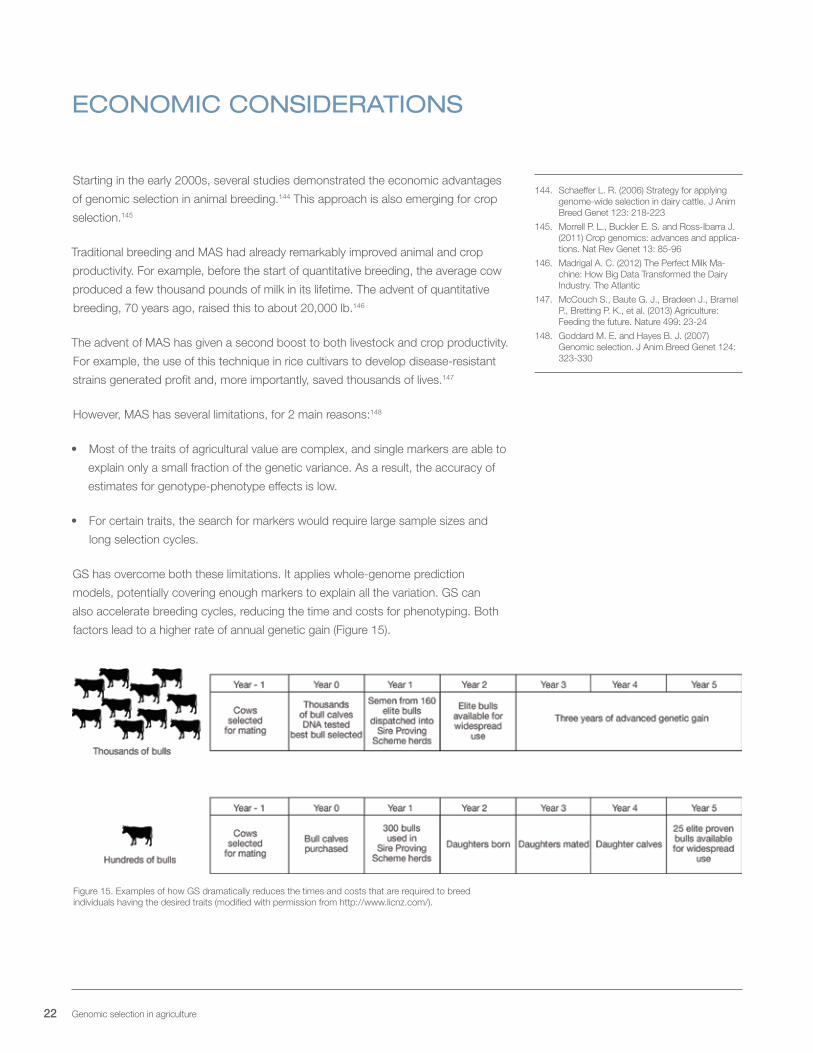
GS has overcome both these limitations. It applies whole-genome prediction
models, potentially covering enough markers to explain all the variation. GS can
also accelerate breeding cycles, reducing the time and costs for phenotyping. Both
factors lead to a higher rate of annual genetic gain (Figure 15).
Figure 15. Examples of how GS dramatically reduces the times and costs that are required to breed individuals having the desired traits (modified with permission from http://www.licnz.com/).
144. Schaeffer L. R. (2006) Strategy for applying genome-wide selection in dairy cattle. J Anim Breed Genet 123: 218-223
145. Morrell P. L., Buckler E. S. and Ross-Ibarra J. (2011) Crop genomics: advances and applica-tions. Nat Rev Genet 13: 85-96
146. Madrigal A. C. (2012) The Perfect Milk Ma-chine: How Big Data Transformed the Dairy Industry. The Atlantic
147. McCouch S., Baute G. J., Bradeen J., Bramel P., Bretting P. K., et al. (2013) Agriculture: Feeding the future. Nature 499: 23-24
148. Goddard M. E. and Hayes B. J. (2007) Genomic selection. J Anim Breed Genet 124: 323-330
23 An overview of recent publications featuring Illumina technology
Consider the following breeder’s equation:149
ΔG = i r σA / L
ΔG, genetic gain; i, selection intensity (directly proportional to population size and
proportion selected); r, accuracy (proportional to the reference population size); σA,
genetic variation within a population; L, generational interval
The use of GS allows the breeder to:
• increase i through the use of larger breeding populations
• increase r through the use of larger reference populations
• increase σA due to a more robust quantification of variation
• decrease L due to the reduction of the time required to obtain individuals carrying
the trait or traits of interest, as shown in Figure 15
All these factors contribute to a higher genetic gain and, consequently, a better yield
of an individual carrying the desired qualities.
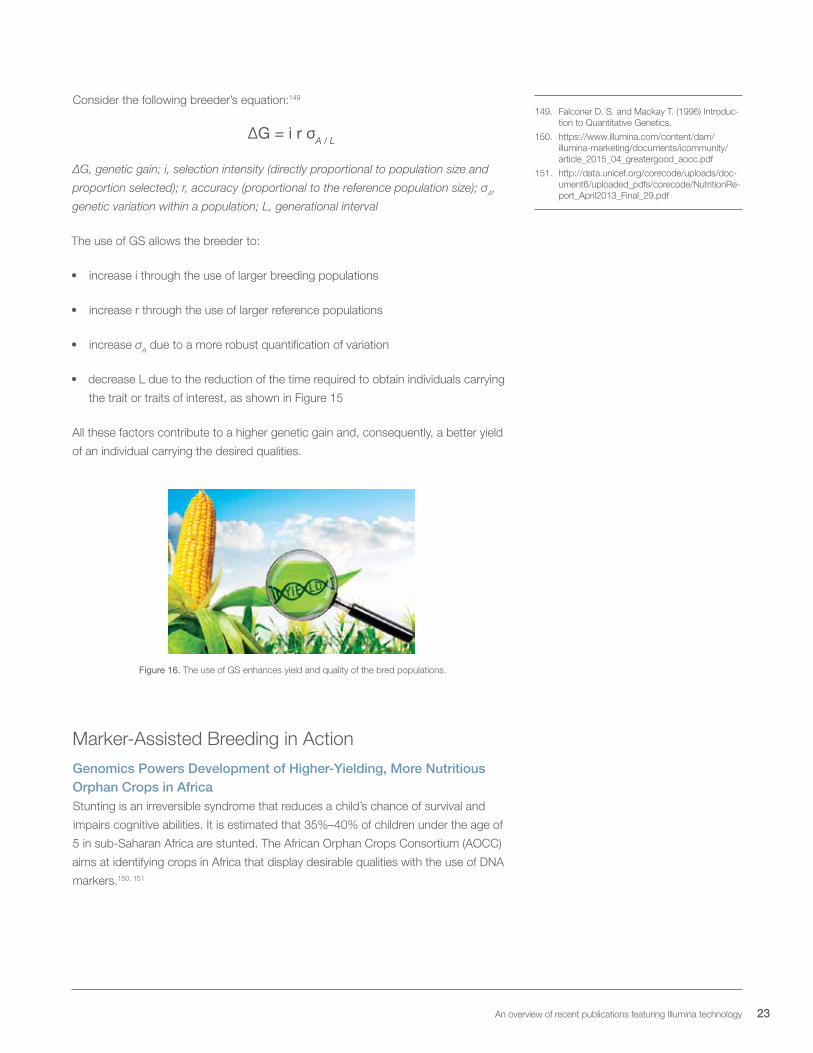
Figure 16. The use of GS enhances yield and quality of the bred populations.
Marker-Assisted Breeding in Action
Genomics Powers Development of Higher-Yielding, More Nutritious Orphan Crops in AfricaStunting is an irreversible syndrome that reduces a child’s chance of survival and
impairs cognitive abilities. It is estimated that 35%–40% of children under the age of
5 in sub-Saharan Africa are stunted. The African Orphan Crops Consortium (AOCC)
aims at identifying crops in Africa that display desirable qualities with the use of DNA
markers.150, 151
149. Falconer D. S. and Mackay T. (1996) Introduc-tion to Quantitative Genetics.
150. https://www.illumina.com/content/dam/illumina-marketing/documents/icommunity/article_2015_04_greatergood_aocc.pdf
151. http://data.unicef.org/corecode/uploads/doc-ument6/uploaded_pdfs/corecode/NutritionRe-port_April2013_Final_29.pdf
24 Genomic selection in agriculture
Genomic Data Adds Value in Marketing Holstein Sires GloballyThe implementation of genomic tools in Holstein cattle breeding is helping farmers
assess animals through the analysis of a combination of genotypic and phenotypic
data to make more informed decisions.152
Breeding the Best Angus Cattle Begins With the Best Genomics ToolsThree Trees Ranch in Coweta Country Georgia has replaced imaging with genomic
technologies since 2010.153
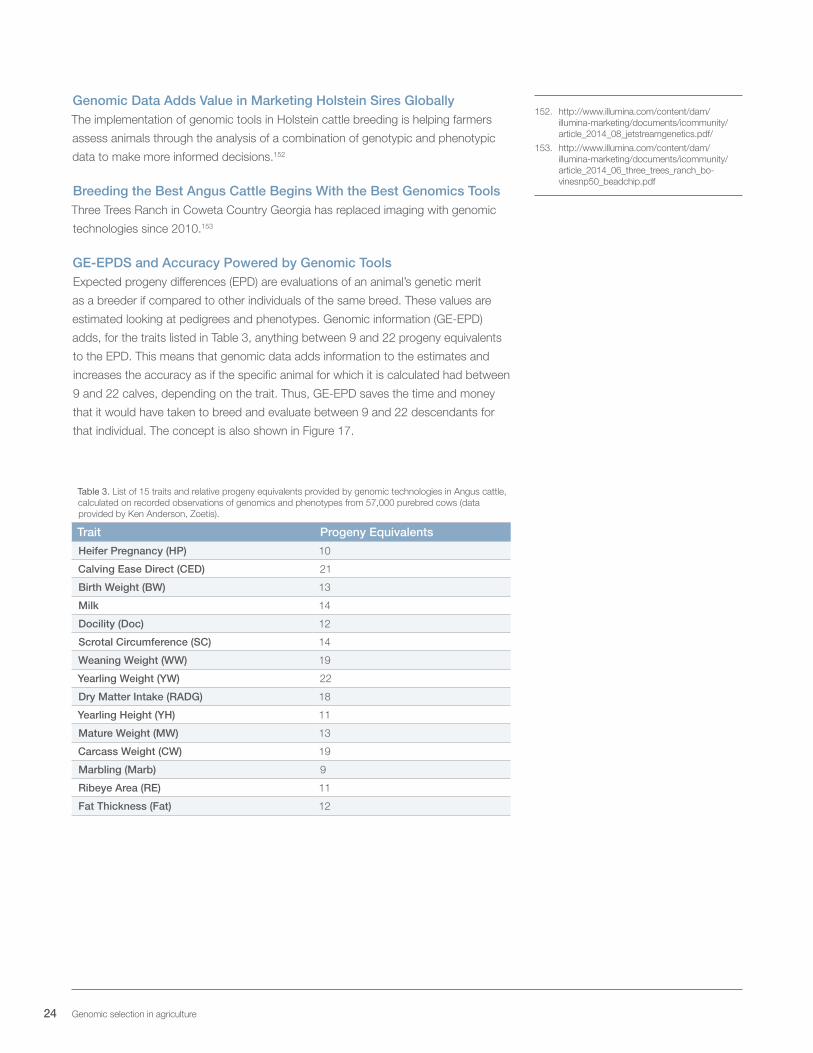
GE-EPDS and Accuracy Powered by Genomic ToolsExpected progeny differences (EPD) are evaluations of an animal’s genetic merit
as a breeder if compared to other individuals of the same breed. These values are
estimated looking at pedigrees and phenotypes. Genomic information (GE-EPD)
adds, for the traits listed in Table 3, anything between 9 and 22 progeny equivalents
to the EPD. This means that genomic data adds information to the estimates and
increases the accuracy as if the specific animal for which it is calculated had between
9 and 22 calves, depending on the trait. Thus, GE-EPD saves the time and money
that it would have taken to breed and evaluate between 9 and 22 descendants for
that individual. The concept is also shown in Figure 17.
Table 3. List of 15 traits and relative progeny equivalents provided by genomic technologies in Angus cattle, calculated on recorded observations of genomics and phenotypes from 57,000 purebred cows (data provided by Ken Anderson, Zoetis).
Trait Progeny Equivalents
Heifer Pregnancy (HP) 10
Calving Ease Direct (CED) 21
Birth Weight (BW) 13
Milk 14
Docility (Doc) 12
Scrotal Circumference (SC) 14
Weaning Weight (WW) 19
Yearling Weight (YW) 22
Dry Matter Intake (RADG) 18
Yearling Height (YH) 11
Mature Weight (MW) 13
Carcass Weight (CW) 19
Marbling (Marb) 9
Ribeye Area (RE) 11
Fat Thickness (Fat) 12
152. http://www.illumina.com/content/dam/illumina-marketing/documents/icommunity/article_2014_08_jetstreamgenetics.pdf/
153. http://www.illumina.com/content/dam/illumina-marketing/documents/icommunity/article_2014_06_three_trees_ranch_bo-vinesnp50_beadchip.pdf
25 An overview of recent publications featuring Illumina technology
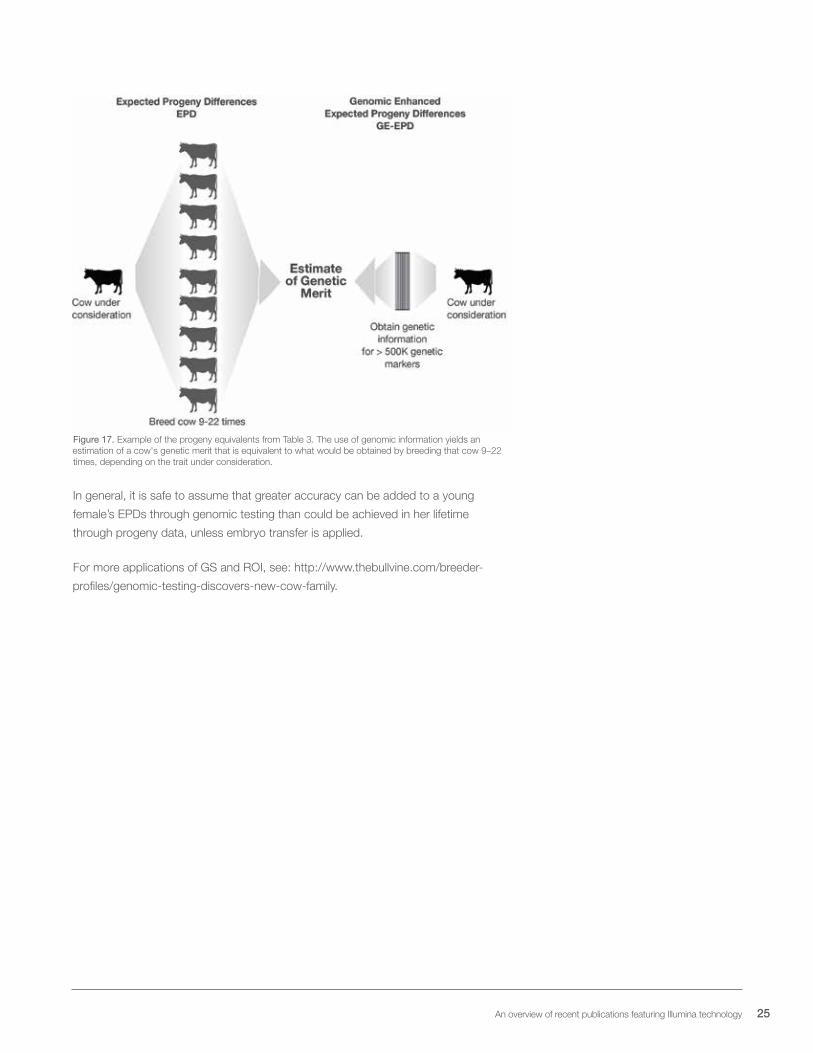
Figure 17. Example of the progeny equivalents from Table 3. The use of genomic information yields an estimation of a cow's genetic merit that is equivalent to what would be obtained by breeding that cow 9–22 times, depending on the trait under consideration.
In general, it is safe to assume that greater accuracy can be added to a young
female’s EPDs through genomic testing than could be achieved in her lifetime
through progeny data, unless embryo transfer is applied.
For more applications of GS and ROI, see: http://www.thebullvine.com/breeder-
profiles/genomic-testing-discovers-new-cow-family.
26 Genomic selection in agriculture
OTHER USES OF GENOMICS
The current levels at which GS is currently applied is variable from species to species.
Cows are the species on which this technique has been focused mostly, with many
other farm animals following quickly.
GS, however, is not the only application of genetics and genetic tools to agriculture.
With the increase of awareness on food security, parentage testing and traceability
are also issues of current major importance. Besides the obvious application to the
food industry, parentage and traceability also have important applications in those
species for which genomic selection and breeding is not yet a reality but a close goal.
Other applications of GS include the analysis of host-pathogen interactions and the
use of genetic variation to preserve biodiversity, to personalize the management of an
animal or plant, and to understand whether genome variability in a species has been
shaped by selective pressure. In the long term, all this information can be used for
the design of better breeding programs.154
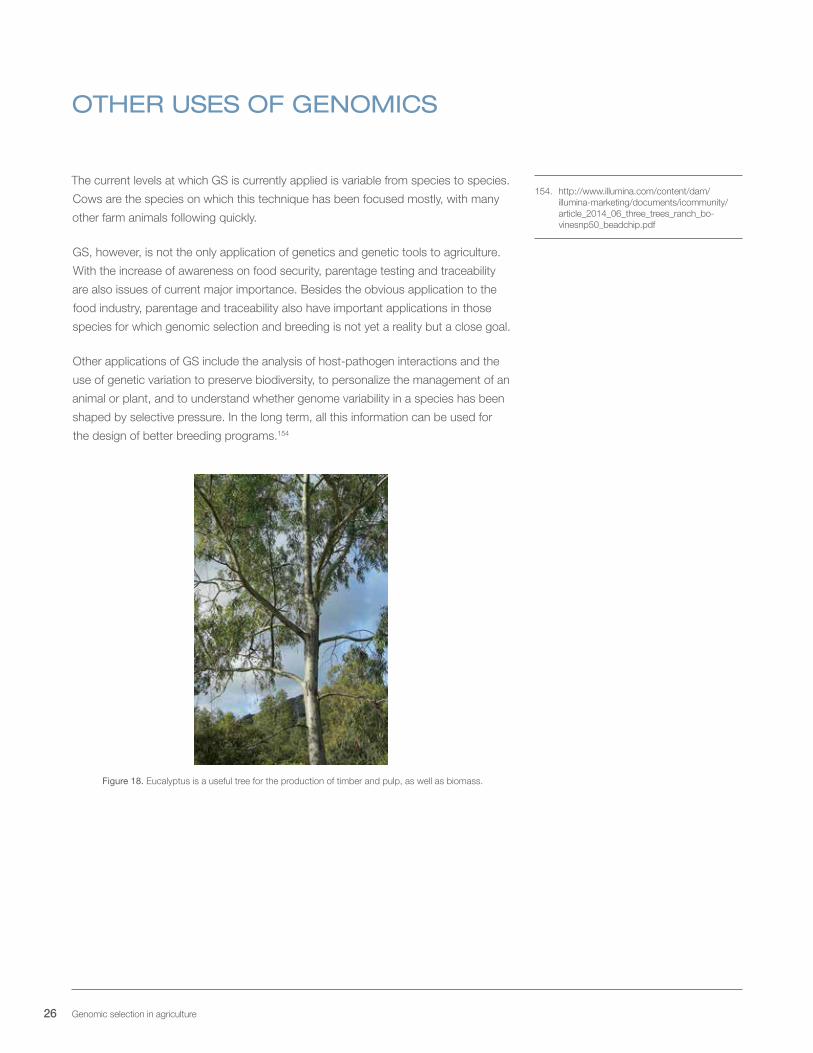
Figure 18. Eucalyptus is a useful tree for the production of timber and pulp, as well as biomass.
154. http://www.illumina.com/content/dam/illumina-marketing/documents/icommunity/article_2014_06_three_trees_ranch_bo-vinesnp50_beadchip.pdf
27 An overview of recent publications featuring Illumina technology
ReferencesTelfer E. J., Stovold G. T., Li Y., Silva-Junior O. B., Grattapaglia D. G., et al. (2015) Parentage Reconstruction in Eucalyptus nitens Using SNPs and Microsatellite Markers: A Comparative Analysis of Marker Data Power and Robustness. PLoS One 10: e0130601.Eucalyptus is a vigorous species that is useful for the production of both timber and pulp, and it is also a productive biomass producer. It is a preferentially outcrossed insect-pollinated species, which suffers considerable inbreeding depression if it undergoes related mating. The analysis of inbreeding for this species can be achieved efficiently by the use of molecular markers to reconstruct pedigrees and identify plants belonging to the same genetic line, a process known as parentage testing. This approach can be used to replace controlled pollination efficiently, a method that is both time-consuming and expensive. Traditionally, parentage studies used microsatellite panels. In this study, the authors used a panel of 106 SNPs to compare it with 2 microsatellite panels of 13 and 16 markers. They used these platforms in 26 open-pollinated offspring trees and 47 putative parents to test for parentage. In general, the SNP panel gave better quality results than both of the microsatellite markers, and it had a better resolution power in the reconstruction of pedigrees.
Illumina Technology: Illumina Infinium SNP Chip
Heaton M. P., Leymaster K. A., Kalbfleisch T. S., Kijas J. W., Clarke S. M., et al. (2014) SNPs for parentage testing and traceability in globally diverse breeds of sheep. PLoS One 9: e94851. The implementation of parentage testing is important in the study of pedigrees. As it refines pedigree accuracy, parentage testing increases genetic improvement. This study aimed to identify SNPs that could be used in diverse breeds of sheep, and also to identify a subset of SNPs that could be used in North American sheep. To do so, the authors studied 47,693 genotypes from 2915 sheep and 74 breed groups provided by the Sheep Genomics Consortium and previously genotyped with the Illumina Ovine SNP50 Bead Array. Of these, they selected 163 SNPs that were suitable for parentage testing. They demonstrated that each SNP was informative in average for 48 ± 5 breed groups, and identified nearby polymorphisms that could confound genotyping by Sanger sequencing of 166 from 54 breed groups. They then developed a matrix-assisted laser desorption ionization time-of-flight (MALDI TOF) genetic test with 109 of the initially identified SNPs that had scoring rates and accuracy above 99%. Next, the authors tested the developed panel in a blinded set of 96 families and estimated that the median estimates for probability of a coincidental march between two animals was 1.1 × 10-39, and the fraction of potential adults excluded from parentage was 0.999987. In this case, the use of a higher-density genetic panel allowed the development of a smaller panel of SNPs with a well-defined utility.
Illumina Technology: Illumina Ovine SNP50 Bead Array
28 Genomic selection in agriculture
GLOSSARY
Allele: One of several forms of a gene, usually arising due to a mutation in one of the
possible nucleotides (A, C, G, or T) that could be found at a genomic position.
Chromosome: A packaged structure made of proteins and containing significant
condensed fractions of the genome that is found in the nucleus. A species’
chromosomal asset contains the whole nuclear genome.
Complex trait: Traits, or phenotypes, that depend on the additive or epistatic effect
of multiple genetic and environmental factors.
Diploid: An organism whose genome contains 2 paired chromosomes, each one
inherited from one of the parents.
Deoxyribonucleic acid (DNA): The molecule that contains information necessary
to encode and regulate genes. These genes are either transcribed into RNA and
translated into proteins, or constitute regulatory elements of a living organism.
DNA sequence: A polymer of multiple nucleotides. The human genome, as well as
any of its fraction, is DNA sequence.
Estimated breeding value (EBV): The estimate of a breeder’s genetic value.
Gene: Region of DNA that is actively transcribed and encodes proteins or contains
regulatory elements. Genes are the building blocks of an organism.
Genetic improvement: Genetic change in a population of a domestic species bred
by artificial selection with the aim of making it more suitable for the purpose for which
it is bred.
Genomic selection (GS): Based on the principle that information from a large
number of markers can be used to estimate breeding values, without having a
precise knowledge of where specific genes are located.
Genotype: An individual’s combination of alleles at one specific locus.
Haplotype: A set of alleles that tends to be inherited together.
Haplotype phasing: Reconstructing an individual’s haplotype by looking at a smaller
number of variants and comparing them to haplotypes from a larger dataset.
Heritability: The proportion of phenotypic variance caused by genetic variations. It has
values that can range from 0.0, where the trait is fully determined by the environment
(e.g. trauma), to 1, where the trait’s variability is determined solely by genetics (eg,
Mendelian traits such as albinism and other coat color traits, or dwarfism).
29 An overview of recent publications featuring Illumina technology
Homologous pair: Two homologous chromosomes, each one inherited from one of
the parents.
Linkage Disequilibrium (LD): A measure of how often 2 alleles are inherited together
compared to what would be expected by chance. A high LD can either be a result of
linkage, or it can be an effect of nonrandom mating, selection, and/or population structure.
Locus: A particular position on the genome.
Marker: A genetic polymorphism where one of the alleles is associated with a trait of
interest, and the others are not.
Marker-assisted selection (MAS): The use of a marker to indirectly select the
genetic determinant, or determinants, of a trait.
Multiplex: Analysis of multiple regions of the DNA at the same time.
Nitrogen-containing base: Molecules that are found in DNA nucleotides containing
the element nitrogen. DNA has 4 possible bases: cytosine (C), guanine (G), adenine
(A), and thymine (T). A and G are purines, while C and T are pyrimidines.
Nucleotide: Building block of a DNA sequence. It is composed of a phosphate
group, a monosaccharide, and a variable nitrogen-containing base.
Parentage: The identity of an individual’s natural parents.
Penetrance: The extent to which a variant contributes to a specific trait. When
penetrance equals 0, the variant has no effect. If penetrance equals 1, the variant
has complete penetrance, and the trait will manifest in every carrier.
Phenotype: A combination of traits that results in an observable feature of an organism.
Polymorphism: A region of the genome that can have different alleles in
different individuals.
Polyploid: An organism whose genome contains more than 2 paired chromosomes.
Quantitative trait locus (QTL): A “quantitative” trait is a phenotype that can be
measured, as opposed to a discrete trait where only the presence or absence of a
phenotype can be assessed. A quantitative trait locus is a region of DNA that includes
genetic polymorphisms that are statistically associated with a quantitative trait.
Restriction enzyme: A protein that is capable of cutting DNA at a specific sequence
of nucleotides. Different restriction enzymes recognize different sequences.
Traceability: The capability of identifying where an organism originates by using
specific DNA polymorphisms.
Trait: A specific physical or behavioral characteristic of an organism that is either
inherited or determined by the environment.
30 Genomic selection in agriculture
BIBLIOGRAPHY
Ai H., Fang X., Yang B., Huang Z., Chen H., et al. (2015) Adaptation and possible ancient interspecies introgression in pigs identified by whole-genome sequencing. Nat Genet 47: 217-225
Anderson J. T., Wagner M. R., Rushworth C. A., Prasad K. V. and Mitchell-Olds T. (2014) The evolution of quantitative traits in complex environments. Heredity (Edinb) 112: 4-12
Bahbahani H., Clifford H., Wragg D., Mbole-Kariuki M. N., Van Tassell C., et al. (2015) Signatures of positive selection in East African Shorthorn Zebu: A genome-wide single nucleotide polymorphism analysis. Sci Rep 5: 11729
Bao Y., Kurle J. E., Anderson G. and Young N. D. (2015) Association mapping and genomic prediction for resistance to sudden death syndrome in early maturing soybean germplasm. Mol Breed 35: 128
Barabaschi D. T., A; Desiderio, F; Volante, A; Vaccino, P; Valè, PG; Cattivelli, L (2015) Next Generation Breeding. Plant Science In press:
Blackmore T., Thomas I., McMahon R., Powell W. and Hegarty M. (2015) Genetic-geographic correlation revealed across a broad European ecotypic sample of perennial ryegrass (Lolium perenne) using array-based SNP genotyping. Theor Appl Genet 128: 1917-1932
Blanca J., Montero-Pau J., Sauvage C., Bauchet G., Illa E., et al. (2015) Genomic variation in tomato, from wild ancestors to contemporary breeding accessions. BMC Genomics 16: 257
Bloom J. S., Kotenko I., Sadhu M. J., Treusch S., Albert F. W., et al. (2015) Genetic interactions contribute less than additive effects to quantitative trait variation in yeast. Nat Commun 6: 8712
Bolger M. E., Weisshaar B., Scholz U., Stein N., Usadel B., et al. (2014) Plant genome sequencing
- applications for crop improvement. Curr Opin Biotechnol 26: 31-37
Buzanskas M. E., Grossi D. A., Ventura R. V., Schenkel F. S., Sargolzaei M., et al. (2014) Genome-wide association for growth traits in Canchim beef cattle. PLoS One 9: e94802
Cai G., Yang Q., Yi B., Fan C., Edwards D., et al. (2014) A complex recombination pattern in the genome of allotetraploid Brassica napus as revealed by a high-density genetic map. PLoS One 9: e109910
Cai G., Yang Q., Yi B., Fan C., Zhang C., et al. (2015) A bi-filtering method for processing single nucleotide polymorphism array data improves the quality of genetic map and accuracy of quantitative trait locus mapping in doubled haploid populations of polyploid Brassica napus. BMC Genomics 16: 409
Chapman J. A., Mascher M., Buluc A., Barry K., Georganas E., et al. (2015) A whole-genome shotgun approach for assembling and anchoring the hexaploid bread wheat genome. Genome Biol 16: 26
Chen B., Xu J., He X., Xu H., Li G., et al. (2015) A Genome-Wide mRNA Screen and Functional Analysis Reveal FOXO3 as a Candidate Gene for Chicken Growth. PLoS One 10: e0137087
Cole J. B., Waurich B., Wensch-Dorendorf M., Bickhart D. M. and Swalve H. H. (2014) A genome-wide association study of calf birth weight in Holstein cattle using single nucleotide polymorphisms and phenotypes predicted from auxiliary traits. J Dairy Sci 97: 3156-3172
Crispim A. C., Kelly M. J., Guimaraes S. E., FF E. S., Fortes M. R., et al. (2015) Multi-Trait GWAS and New Candidate Genes Annotation for Growth Curve Parameters in Brahman Cattle. PLoS One 10: e0139906
Daetwyler H. D., Capitan A., Pausch H., Stothard P., van Binsbergen R., et al. (2014) Whole-genome sequencing of 234 bulls facilitates mapping of monogenic and complex traits in cattle. Nat Genet 46: 858-865
de Camargo G., Aspilcueta-Borquis R. R., Fortes M., Porto-Neto R., Cardoso D. F., et al. (2015) Prospecting major genes in dairy buffaloes. BMC Genomics 16: 872
Dixit S., Grondin A., Lee C. R., Henry A., Olds T. M., et al. (2015) Understanding rice adaptation to varying agro-ecosystems: trait interactions and quantitative trait loci. BMC Genet 16: 86
Duvick J., Fu A., Muppirala U., Sabharwal M., Wilkerson M. D., et al. (2008) PlantGDB: a resource for comparative plant genomics. Nucleic Acids Res 36: D959-965
Eggen A. (2012) The development and application of genomic selection as a new breeding program. Animal Frontiers 2: 10-15
Eisler M. C., Lee M. R., Tarlton J. F., Martin G. B., Beddington J., et al. (2014) Agriculture: Steps to sustainable livestock. Nature 507: 32-34
Elshire R. J., Glaubitz J. C., Sun Q., Poland J. A., Kawamoto K., et al. (2011) A robust, simple genotyping-by-sequencing (GBS) approach for high diversity species. PLoS One 6: e19379
Falconer D. S. and Mackay T. (1996) Introduction to Quantitative Genetics.
Fan S., Zhang D., Guo Y., Liu B. and Yu D. (2015) Characterization of the bay scallop (Argopecten irradians concentricus Say) transcriptome and identification of growth-related genes. Mar Genomics
Fletcher R. S., Mullen J. L., Heiliger A. and McKay J. K. (2015) QTL analysis of root morphology, flowering time, and yield reveals trade-offs in response to drought in Brassica napus. J Exp Bot 66: 245-256
Frantz L. A., Schraiber J. G., Madsen O., Megens H. J., Cagan A., et al. (2015) Evidence of long-term gene flow and selection during domestication from analyses of Eurasian wild and domestic pig genomes. Nat Genet 47: 1141-1148
Frischknecht M., Jagannathan V., Plattet P., Neuditschko M., Signer-Hasler H., et al. (2015) A Non-Synonymous HMGA2 Variant Decreases Height in Shetland Ponies and Other Small Horses. PLoS One 10: e0140749
Fu Y., Wei D., Dong H., He Y., Cui Y., et al. (2015) Comparative quantitative trait loci for silique length and seed weight in Brassica napus. Sci Rep 5: 14407
Gaur R., Jeena G., Shah N., Gupta S., Pradhan S., et al. (2015) High density linkage mapping of genomic and transcriptomic SNPs for synteny analysis and anchoring the genome sequence of chickpea. Sci Rep 5: 13387
Giancaspro A., Colasuonno P., Zito D., Blanco A., Pasqualone A., et al. (2016) Varietal traceability of bread ‘Pane Nero di Castelvetrano’ by denaturing high pressure liquid chromatography analysis of single nucleotide polymorphisms. Food Control 59: 809-817
Goddard M. E. and Hayes B. J. (2007) Genomic selection. J Anim Breed Genet 124: 323-330
Goddard M. E. and Hayes B. J. (2009) Mapping genes for complex traits in domestic animals and their use in breeding programmes. Nat Rev Genet 10: 381-391
31 An overview of recent publications featuring Illumina technology
Gonen S., Baranski M., Thorland I., Norris A., Grove H., et al. (2015) Mapping and validation of a major QTL affecting resistance to pancreas disease (salmonid alphavirus) in Atlantic salmon (Salmo salar). Heredity (Edinb) 115: 405-414
Goodstein D. M., Shu S., Howson R., Neupane R., Hayes R. D., et al. (2012) Phytozome: a comparative platform for green plant genomics. Nucleic Acids Res 40: D1178-1186
Gutierrez A. P., Yanez J. M., Fukui S., Swift B. and Davidson W. S. (2015) Genome-wide association study (GWAS) for growth rate and age at sexual maturation in Atlantic salmon (Salmo salar). PLoS One 10: e0119730
Hao D., Zhang Z., Cheng Y., Chen G., Lu H., et al. (2015) Identification of Genetic Differentiation between Waxy and Common Maize by SNP Genotyping. PLoS One 10: e0142585
Hartati H., Utsunomiya Y. T., Sonstegard T. S., Garcia J. F., Jakaria J., et al. (2015) Evidence of Bos javanicus x Bos indicus hybridization and major QTLs for birth weight in Indonesian Peranakan Ongole cattle. BMC Genet 16: 75
Hayes B. and Goddard M. E. (2001) The distribution of the effects of genes affecting quantitative traits in livestock. Genet Sel Evol 33: 209-229
Heaton M. P., Leymaster K. A., Kalbfleisch T. S., Kijas J. W., Clarke S. M., et al. (2014) SNPs for parentage testing and traceability in globally diverse breeds of sheep. PLoS One 9: e94851
Hoffmann T. J. and Witte J. S. (2015) Strategies for Imputing and Analyzing Rare Variants in Association Studies. Trends Genet 31: 556-563
Hoglund J. K., Buitenhuis B., Guldbrandtsen B., Lund M. S. and Sahana G. (2015) Genome-wide association study for female fertility in Nordic Red cattle. BMC Genet 16: 110
Hoglund J. K., Guldbrandtsen B., Lund M. S. and Sahana G. (2015) Identification of genomic regions associated with female fertility in Danish Jersey using whole genome sequence data. BMC Genet 16: 60
Honsdorf N., March T. J., Berger B., Tester M. and Pillen K. (2014) High-throughput phenotyping to detect drought tolerance QTL in wild barley introgression lines. PLoS One 9: e97047
Hu X., Ren J., Ren X., Huang S., Sabiel S. A., et al. (2015) Association of Agronomic Traits with SNP Markers in Durum Wheat (Triticum turgidum L. durum (Desf.)). PLoS One 10: e0130854
Hu Z. L., Park C. A. and Reecy J. M. (2015) Developmental progress and current status of the Animal QTLdb. Nucleic Acids Res
Huang X., Wei X., Sang T., Zhao Q., Feng Q., et al. (2010) Genome-wide association studies of 14 agronomic traits in rice landraces. Nat Genet 42: 961-967
Hulse-Kemp A. M., Lemm J., Plieske J., Ashrafi H., Buyyarapu R., et al. (2015) Development of a 63K SNP Array for Cotton and High-Density Mapping of Intraspecific and Interspecific Populations of Gossypium spp. G3 (Bethesda) 5: 1187-1209
Huynh B. L., Matthews W. C., Ehlers J. D., Lucas M. R., Santos J. R., et al. (2015) A major QTL corresponding to the Rk locus for resistance to root-knot nematodes in cowpea (Vigna unguiculata L. Walp.). Theor Appl Genet
Ibanez-Escriche N. and Simianer H. (2016) Animal breeding in the genomics era. Animal Frontiers 6: 4-5
International HapMap C. (2003) The International HapMap Project. Nature 426: 789-796
International HapMap C. (2005) A haplotype map of the human genome. Nature 437: 1299-1320
International HapMap C., Altshuler D. M., Gibbs R. A., Peltonen L., Altshuler D. M., et al. (2010) Integrating common and rare genetic variation in diverse human populations. Nature 467: 52-58
Jiao Y., Vuong T. D., Liu Y., Li Z., Noe J., et al. (2015) Identification of quantitative trait loci underlying resistance to southern root-knot and reniform nematodes in soybean accession PI 567516C. Mol Breed 35: 131
Kale S. M., Jaganathan D., Ruperao P., Chen C., Punna R., et al. (2015) Prioritization of candidate genes in "QTL-hotspot" region for drought tolerance in chickpea (Cicer arietinum L.). Sci Rep 5: 15296
Kaminski K. P., Korup K., Andersen M. N., Sonderkaer M., Andersen M. S., et al. (2015) Cytosolic glutamine synthetase is important for photosynthetic efficiency and water use efficiency in potato as revealed by high-throughput sequencing QTL analysis. Theor Appl Genet 128: 2143-2153
Kang Y. J., Lee T., Lee J., Shim S., Jeong H., et al. (2015) Translational genomics for plant breeding with the genome sequence explosion. Plant Biotechnol J
Kim C., Guo H., Kong W., Chandnani R., Shuang L. S., et al. (2016) Application of genotyping by sequencing technology to a variety of crop breeding programs. Plant Sci 242: 14-22
Kitomi Y., Kanno N., Kawai S., Mizubayashi T., Fukuoka S., et al. (2015) QTLs underlying natural variation of root growth angle among rice cultivars with the same functional allele of DEEPER ROOTING 1. Rice (N Y) 8: 16
Knabel M., Friend A. P., Palmer J. W., Diack R., Wiedow C., et al. (2015) Genetic control of pear rootstock-induced dwarfing and precocity is linked to a chromosomal region syntenic to the apple Dw1 loci. BMC Plant Biol 15: 230
Kolech S. A., Halseth D., De Jong W., Perry K., Wolfe D., et al. (2015) Potato Variety Diversity, Determinants and Implications for Potato Breeding Strategy in Ethiopia. Am. J. Potato Res. 92: 551-566
Koltes J. E., Fritz-Waters E., Eisley C. J., Choi I., Bao H., et al. (2015) Identification of a putative quantitative trait nucleotide in guanylate binding protein 5 for host response to PRRS virus infection. BMC Genomics 16: 412
Lee M., Xia J. H., Zou Z., Ye J., Rahmadsyah, et al. (2015) A consensus linkage map of oil palm and a major QTL for stem height. Sci Rep 5: 8232
Lendenmann M. H., Croll D. and McDonald B. A. (2015) QTL mapping of fungicide sensitivity reveals novel genes and pleiotropy with melanization in the pathogen Zymoseptoria tritici. Fungal Genet Biol 80: 53-67
Li L., Long Y., Zhang L., Dalton-Morgan J., Batley J., et al. (2015) Genome wide analysis of flowering time trait in multiple environments via high-throughput genotyping technique in Brassica napus L. PLoS One 10: e0119425
Li Y. H., Zhou G., Ma J., Jiang W., Jin L. G., et al. (2014) De novo assembly of soybean wild relatives for pan-genome analysis of diversity and agronomic traits. Nat Biotechnol 32: 1045-1052
Li Y. H., Reif J. C., Ma Y. S., Hong H. L., Liu Z. X., et al. (2015) Targeted association mapping demonstrating the complex molecular genetics of fatty acid formation in soybean. BMC Genomics 16: 841
Lind M., Kallman T., Chen J., Ma X. F., Bousquet J., et al. (2014) A Picea abies linkage map based on SNP markers identifies QTLs for four aspects of resistance to Heterobasidion parviporum infection. PLoS One 9: e101049
Liu X., Xiong X., Yang J., Zhou L., Yang B., et al. (2015) Genome-wide association analyses for meat quality traits in Chinese Erhualian pigs and a Western Duroc x (Landrace x Yorkshire) commercial population. Genet Sel Evol 47: 44
Lu F., Romay M. C., Glaubitz J. C., Bradbury P. J., Elshire R. J., et al. (2015) High-resolution genetic mapping of maize pan-genome sequence anchors. Nat Commun 6: 6914
Lu Y., Xing L., Xing S., Hu P., Cui C., et al. (2015) Characterization of a Putative New Semi-Dominant Reduced Height Gene, Rht_NM9, in Wheat (Triticum aestivum L.). Journal of Genetics and Genomics In Press.:
32 Genomic selection in agriculture
Luo X., Ma C., Yue Y., Hu K., Li Y., et al. (2015) Unravelling the complex trait of harvest index in rapeseed (Brassica napus L.) with association mapping. BMC Genomics 16: 379
Ma Y., Zhang Q., Lu Z., Zhao X. and Zhang Y. (2015) Analysis of copy number variations by SNP50 BeadChip array in Chinese sheep. Genomics 106: 295-300
Madrigal A. C. (2012) The Perfect Milk Machine: How Big Data Transformed the Dairy Industry. The Atlantic
Marchini J. and Howie B. (2010) Genotype imputation for genome-wide association studies. Nat Rev Genet 11: 499-511
McCouch S., Baute G. J., Bradeen J., Bramel P., Bretting P. K., et al. (2013) Agriculture: Feeding the future. Nature 499: 23-24
Meira C. T., Farah M. M., Fortes M. R. S., Moore S. S., Pereira G. L., et al. (2014) A Genome-Wide Association Study for Morphometric Traits in Quarter Horse. Journal of Equine Veterinary Science 34: 1028-1031
Meuwissen T. H., Hayes B. J. and Goddard M. E. (2001) Prediction of total genetic value using genome-wide dense marker maps. Genetics 157: 1819-1829
Meuwissen T. H., Hayes B. and Goddard M. E. (2016) Genomic selection: A paradigm shift in animal breeding. Animal Frontiers 6-14
Michael T. P. and VanBuren R. (2015) Progress, challenges and the future of crop genomes. Curr Opin Plant Biol 24: 71-81
Micheletti D., Dettori M. T., Micali S., Aramini V., Pacheco I., et al. (2015) Whole-Genome Analysis of Diversity and SNP-Major Gene Association in Peach Germplasm. PLoS One 10: e0136803
Mignon-Grasteau S., Rideau N., Gabriel I., Chantry-Darmon C., Boscher M. Y., et al. (2015) Detection of QTL controlling feed efficiency and excretion in chickens fed a wheat-based diet. Genet Sel Evol 47: 74
Mirdita V., Liu G., Zhao Y., Miedaner T., Longin C. F., et al. (2015) Genetic architecture is more complex for resistance to Septoria tritici blotch than to Fusarium head blight in Central European winter wheat. BMC Genomics 16: 430
Mohlatlole R. P., Dzomba E. F. and Muchadeyi F. C. (2015) Addressing production challenges in goat production systems of South Africa: the genomics approach. Small Ruminant Research 131: 43-49
Morrell P. L., Buckler E. S. and Ross-Ibarra J. (2011) Crop genomics: advances and applications. Nat Rev Genet 13: 85-96
Muranty H., Troggio M., Sadok I. B., Rifaı¨ M. A., Aukwerken A., et al. (2015) Accuracy and response of genomic selection on key traits in apple breeding. Horticulture Research 2: 15060
Nagai K., Kondo Y., Kitaoka T., Noda T., Kuroha T., et al. (2014) QTL analysis of internode elongation in response to gibberellin in deepwater rice. AoB Plants 6:
Ni J., Pujar A., Youens-Clark K., Yap I., Jaiswal P., et al. (2009) Gramene QTL database: development, content and applications. Database (Oxford) 2009: bap005
Nicoloso L., Bomba L., Colli L., Negrini R., Milanesi M., et al. (2015) Genetic diversity of Italian goat breeds assessed with a medium-density SNP chip. Genet Sel Evol 47: 62
Owart B. R., Corbi J., Burke J. M. and Dechaine J. M. (2014) Selection on crop-derived traits and QTL in sunflower (Helianthus annuus) crop-wild hybrids under water stress. PLoS One 9: e102717
Pagani I., Liolios K., Jansson J., Chen I. M., Smirnova T., et al. (2012) The Genomes OnLine Database (GOLD) v.4: status of genomic and metagenomic projects and their associated metadata. Nucleic Acids Res 40: D571-579
Palaiokostas C., Bekaert M., Taggart J. B., Gharbi K., McAndrew B. J., et al. (2015) A new SNP-based vision of the genetics of sex determination in European sea bass (Dicentrarchus labrax). Genet Sel Evol 47: 68
Pant S. D., Karlskov-Mortensen P., Jacobsen M. J., Cirera S., Kogelman L. J., et al. (2015) Comparative Analyses of QTLs Influencing Obesity and Metabolic Phenotypes in Pigs and Humans. PLoS One 10: e0137356
Phua S. H., Cullen N. G., Dodds K. G., Scobie D. R. and Bray A. R. (2015) An ovine quantitative trait locus affecting fibre opacity in wool. Small Ruminant Research 130: 122-126
Pocwierz-Kotus A., Bernas R., Kent M. P., Lien S., Leliuna E., et al. (2015) Restitution and genetic differentiation of salmon populations in the southern Baltic genotyped with the Atlantic salmon 7K SNP array. Genet Sel Evol 47: 39
Pootakham W., Jomchai N., Ruang-Areerate P., Shearman J. R., Sonthirod C., et al. (2015) Genome-wide SNP discovery and identification of QTL associated with agronomic traits in oil palm using genotyping-by-sequencing (GBS). Genomics 105: 288-295
Porto-Neto L. R., Barendse W., Henshall J. M., McWilliam S. M., Lehnert S. A., et al. (2015) Genomic correlation: harnessing the benefit of combining two unrelated populations for genomic selection. Genet Sel Evol 47: 84
Prasongsook S., Choi I., Bates R. O., Raney N. E., Ernst C. W., et al. (2015) Association of Insulin-like growth factor binding protein 2 genotypes with growth, carcass and meat quality traits in pigs. J Anim Sci Technol 57: 31
Puig-Oliveras A., Ballester M., Corominas J., Revilla M., Estelle J., et al. (2014) A co-association network analysis of the genetic determination of pig conformation, growth and fatness. PLoS One 9: e114862
Qi X., Li M. W., Xie M., Liu X., Ni M., et al. (2014) Identification of a novel salt tolerance gene in wild soybean by whole-genome sequencing. Nat Commun 5: 4340
Qiao R., Gao J., Zhang Z., Li L., Xie X., et al. (2015) Genome-wide association analyses reveal significant loci and strong candidate genes for growth and fatness traits in two pig populations. Genet Sel Evol 47: 17
Revay T., Quach A. T., Maignel L., Sullivan B. and King W. A. (2015) Copy number variations in high and low fertility breeding boars. BMC Genomics 16: 280
Reyer H., Hawken R., Murani E., Ponsuksili S. and Wimmers K. (2015) The genetics of feed conversion efficiency traits in a commercial broiler line. Sci Rep 5: 16387
Roux P. F., Boutin M., Desert C., Djari A., Esquerre D., et al. (2014) Re-sequencing data for refining candidate genes and polymorphisms in QTL regions affecting adiposity in chicken. PLoS One 9: e111299
Rutledge L. Y., Devillard S., Boone J. Q., Hohenlohe P. A. and White B. N. (2015) RAD sequencing and genomic simulations resolve hybrid origins within North American Canis. Biology Letters 11:
Sahana G., Hoglund J. K., Guldbrandtsen B. and Lund M. S. (2015) Loci associated with adult stature also affect calf birth survival in cattle. BMC Genet 16: 47
Schaeffer L. R. (2006) Strategy for applying genome-wide selection in dairy cattle. J Anim Breed Genet 123: 218-223
Schefers J. M. and Weigel K. A. (2012) Genomic selection in dairy cattle: Integration of DNA testing into breeding programs. Animal Frontiers 2: 4-9
Shannon L. M., Boyko R. H., Castelhano M., Corey E., Hayward J. J., et al. (2015) Genetic structure in village dogs reveals a Central Asian domestication origin. Proc Natl Acad Sci U S A 112: 13639-13644
Shen L., Luo J., Du J., Liu C., Wu X., et al. (2015) Transcriptome Analysis of Liangshan Pig Muscle Development at the Growth Curve Inflection Point and Asymptotic Stages Using Digital Gene Expression Profiling. PLoS One 10: e0135978
33 An overview of recent publications featuring Illumina technology
Skallerup P., Thamsborg S. M., Jorgensen C. B., Mejer H., Goring H. H., et al. (2015) Detection of a quantitative trait locus associated with resistance to infection with Trichuris suis in pigs. Vet Parasitol 210: 264-269
Slavov G. T., Nipper R., Robson P., Farrar K., Allison G. G., et al. (2014) Genome-wide association studies and prediction of 17 traits related to phenology, biomass and cell wall composition in the energy grass Miscanthus sinensis. New Phytol 201: 1227-1239
Stothard P., Liao X., Arantes A. S., De Pauw M., Coros C., et al. (2015) A large and diverse collection of bovine genome sequences from the Canadian Cattle Genome Project. Gigascience 4: 49
Takagi H., Tamiru M., Abe A., Yoshida K., Uemura A., et al. (2015) MutMap accelerates breeding of a salt-tolerant rice cultivar. Nat Biotechnol 33: 445-449
Takasuga A., Sato K., Nakamura R., Saito Y., Sasaki S., et al. (2015) Non-synonymous FGD3 Variant as Positional Candidate for Disproportional Tall Stature Accounting for a Carcass Weight QTL (CW-3) and Skeletal Dysplasia in Japanese Black Cattle. PLoS Genet 11: e1005433
Telfer E. J., Stovold G. T., Li Y., Silva-Junior O. B., Grattapaglia D. G., et al. (2015) Parentage Reconstruction in Eucalyptus nitens Using SNPs and Microsatellite Markers: A Comparative Analysis of Marker Data Power and Robustness. PLoS One 10: e0130601
Tian H. L., Wang F. G., Zhao J. R., Yi H. M., Wang L., et al. (2015) Development of maizeSNP3072, a high-throughput compatible SNP array, for DNA fingerprinting identification of Chinese maize varieties. Mol Breed 35: 136
van Binsbergen R., Calus M. P., Bink M. C., van Eeuwijk F. A., Schrooten C., et al. (2015) Genomic prediction using imputed whole-genome sequence data in Holstein Friesian cattle. Genet Sel Evol 47: 71
Van Tassell C. P., Smith T. P., Matukumalli L. K., Taylor J. F., Schnabel R. D., et al. (2008) SNP discovery and allele frequency estimation by deep sequencing of reduced representation libraries. Nat Methods 5: 247-252
Wang K., Liu D., Hernandez-Sanchez J., Chen J., Liu C., et al. (2015) Genome Wide Association Analysis Reveals New Production Trait Genes in a Male Duroc Population. PLoS One 10: e0139207
Wang L., Xu L., Liu X., Zhang T., Li N., et al. (2015) Copy number variation-based genome wide association study reveals additional variants contributing to meat quality in Swine. Sci Rep 5: 12535
Wehner G. G., Balko C. C., Enders M. M., Humbeck K. K. and Ordon F. F. (2015) Identification of genomic regions involved in tolerance to drought stress and drought stress induced leaf senescence in juvenile barley. BMC Plant Biol 15: 125
Weng X. G., Song Q. J., Wu Q., Liu M. C., Wang M. L., et al. (2015) Genetic characterization of bovine viral diarrhea virus strains in Beijing region of China and innate immune responses of PBMCs in persistently infected dairy cattle. J Vet Sci
Weng Z., Su H., Saatchi M., Lee J., Thomas M. G., et al. (2016) Genome-wide association study of growth and body composition traits in Brangus beef cattle. Livestock Science 183: 4-11
Wiedmann R. T., Nonneman D. J. and Rohrer G. A. (2015) Genome-Wide Copy Number Variations Using SNP Genotyping in a Mixed Breed Swine Population. PLoS One 10: e0133529
Wu J., Feng F., Lian X., Teng X., Wei H., et al. (2015) Genome-wide Association Study (GWAS) of mesocotyl elongation based on re-sequencing approach in rice. BMC Plant Biol 15: 218
Xu X., Lu L., Zhu B., Xu Q., Qi X., et al. (2015) QTL mapping of cucumber fruit flesh thickness by SLAF-seq. Sci Rep 5: 15829
Ye C., Tenorio F. A., Argayoso M. A., Laza M. A., Koh H. J., et al. (2015) Identifying and confirming quantitative trait loci associated with heat tolerance at flowering stage in different rice populations. BMC Genet 16: 41
Zhai H., Feng Z., Liu X., Cheng X., Peng H., et al. (2015) A genetic linkage map with 178 SSR and 1 901 SNP markers constructed using a RIL population in wheat (Triticum aestivum L.). Journal of Integrative Agriculture 14: 1697-1705
Zhang J., Song Q., Cregan P. B. and Jiang G. L. (2015) Genome-wide association study, genomic prediction and marker-assisted selection for seed weight in soybean (Glycine max). Theor Appl Genet
Zuo W., Chao Q., Zhang N., Ye J., Tan G., et al. (2015) A maize wall-associated kinase confers quantitative resistance to head smut. Nat Genet 47: 151-157
Illumina • 1.800.809.4566 toll-free (US) • +1.858.202.4566 tel • www.illumina.com
FOR RESEARCH USE ONLY© 2016 Illumina, Inc. All rights reserved. Illumina, IlluminaDx, BaseSpace, BeadArray, BeadXpress, cBot, CSPro, DASL, DesignStudio, Eco, GAIIx, Genetic Energy, Genome Analyzer, GenomeStudio, GoldenGate, HiScan, HiSeq, Infinium, iSelect, MiSeq, Nextera, NuPCR, SeqMonitor, Solexa, TruSeq, TruSight, VeraCode, the pumpkin orange color, and the Genetic Energy streaming bases design are trademarks or registered trademarks of Illumina, Inc. All other brands and names contained herein are the property of their respective owners. Pub. No. 1376-2016-002 Current as of 29 April 2016
This Scientific Publication Review is brought to you by Illumina, Inc.
Single Cell Research ReviewMost of the impetus for single-cell tissue sequencing has come from cancer research, where cell lineage and the detection of residual disease are of paramount concern. The same approaches are being used to improve our understanding of massively complex biological systems, such as neural development and immunology.
This document highlights recent publications that demonstrate the use of Illumina technology for single-cell sequencing and very low input applications and techniques.
Immunology Research ReviewRepertoire sequencing has enabled researchers to identify unique receptor variants found in individuals with susceptibility to hematological malignancies, autoimmune diseases, and allergen response.
Illumina next-generation sequencing provides the quality, throughput, and read lengths required by the research community to map the human immune response at high resolution. The emergence of new approaches such as phase-defined sequencing and single-cell sequencing can be expected to accelerate this knowledge base.
Scientific Publication Reviews can be accessed at www.illumina.com/pubreviews