Embed Size (px)
Citation preview

viruses
Article
Genomic Analysis of48 Paenibacillus larvae Bacteriophages
Casey Stamereilers 1, Christopher P. Fajardo 2, Jamison K. Walker 2, Katterinne N. Mendez 3 ID ,Eduardo Castro-Nallar 3 ID , Julianne H. Grose 2, Sandra Hope 2 and Philippos K. Tsourkas 1,*
1 School of Life Sciences, University of Nevada Las Vegas, Las Vegas, NV 89154, USA;[email protected]
2 Department of Microbiology and Molecular Biology, Brigham Young University, Provo, UT 84602, USA;[email protected] (C.P.F.); [email protected] (J.K.W.); [email protected] (J.H.G.);[email protected] (S.H.)
3 Center for Bioinformatics and Integrative Biology, Faculty of the Life Sciences, Universidad Andres Bello,Santiago 8370186, Chile; [email protected] (K.N.M.); [email protected] (E.C.-N.)
* Correspondence: [email protected]; Tel.: +01-702-895-3385
Received: 29 June 2018; Accepted: 16 July 2018; Published: 19 July 2018�����������������
Abstract: The antibiotic-resistant bacterium Paenibacillus larvae is the causative agent of Americanfoulbrood (AFB), currently the most destructive bacterial disease in honeybees. Phages that infectP. larvae were isolated as early as the 1950s, but it is only in recent years that P. larvae phage genomeshave been sequenced and annotated. In this study we analyze the genomes of all 48 currentlysequenced P. larvae phage genomes and classify them into four clusters and a singleton. The majorityof P. larvae phage genomes are in the 38–45 kbp range and use the cohesive ends (cos) DNA-packagingstrategy, while a minority have genomes in the 50–55 kbp range that use the direct terminal repeat(DTR) DNA-packaging strategy. The DTR phages form a distinct cluster, while the cos phages formthree clusters and a singleton. Putative functions were identified for about half of all phage proteins.Structural and assembly proteins are located at the front of the genome and tend to be conservedwithin clusters, whereas regulatory and replication proteins are located in the middle and rear of thegenome and are not conserved, even within clusters. All P. larvae phage genomes contain a conservedN-acetylmuramoyl-L-alanine amidase that serves as an endolysin.
Keywords: bacteriophages; Paenibacillus larvae; American foulbrood; comparative genomics;large terminase; N-acetylmuramoyl-L-alanine amidase; major capsid protein
1. Introduction
The gram-positive, spore-forming bacterium Paenibacillus larvae is the causative agent of Americanfoulbrood (AFB), the most destructive bacterial disease in honeybees (Apis mellifera) and one of theleading causes of their global population decline [1]. Although P. larvae exclusively infects honeybeelarvae and not adult bees, it is highly virulent and can wipe out an infected hive in a matter of daysif untreated [1]. P. larvae spores are easily spread by bees and the wind, and thus AFB is highlycontagious. Furthermore, P. larvae spores are extremely durable, lasting several decades [1]. In recentyears several P. larvae strains have developed antibiotic resistance, complicating treatment efforts [2–4].Although beekeepers in the United States still have moderate success in treating AFB using themacrolide antibiotic Tylosin Tartrate, in other jurisdictions, such as the European Union, the use ofantibiotics in honey is prohibited. If the infection does not clear, incineration of infected hives is theonly method for combating P. larvae outbreaks.
Viruses 2018, 10, 377; doi:10.3390/v10070377 www.mdpi.com/journal/viruses

Viruses 2018, 10, 377 2 of 29
Given this situation, there has been growing interest in phages that infect and lyse P. larvae.The first P. larvae phages were identified in the 1950s, with several more isolated in the followingdecades [5–13]. None of these were sequenced at the time, as genome sequencing was still prohibitivelyexpensive and AFB was routinely treated with antibiotics, and thus interest in P. larvae phages wasscant. However, in the last five years, the number of sequenced P. larvae phages has increasedsignificantly, standing at 48 as of this writing. P. larvae phages have been isolated and sequenced inPortugal [14], Germany [15], and the United States [16–21], with the latter accounting for the vastmajority of published genomes. In addition, six studies have been published within the last two yearson treating AFB with P. larvae phages or P. larvae phage endolysins [15,22–26].
The first P. larvae phage to have its genome sequenced was phiIBB_Pl23, isolated in Portugal,in 2013 [14], followed by phage HB10c2 in Germany [15], and phages Diva, Lily, Rani, Redbud, Shelly,Sitara and Tripp, isolated in North Carolina [16,17]. In 2015, the genomes of 9 P. larvae phages fromthe University of Nevada, Las Vegas (UNLV) were published [18], followed by the first comparativegenomics analysis of P. larvae phages [27]. Concurrently, a large number of P. larvae phages wereisolated at Brigham Young University (BYU) in Utah as part of BYU’s Phage Hunters course over theperiod 2014–2106, and the genomes of 26 of these were published in 2018 [19,20]. An additional fourgenomes from UNLV were published in 2018 [21], bringing the total number of published P. larvaephage genomes at 48, a number which will continue to grow in the future.
In the present study, we expand upon previous work, give an overview of the genomic landscapeof the 48 sequenced P. larvae phages, and perform a comparative analysis of their genomes. We groupphages into similarity clusters, identify similarities and differences between phages, identify proteinfunctions, and perform comparative analyses on conserved proteins.
2. Materials and Methods
The annotated genomes of phages published by groups other than ours were obtained from NCBIGenBank. For phages isolated by groups at UNLV and BYU, genome assembly was carried out usingGeneious 10.2.2 (Biomatters, Auckland, New Zealand) [28] with Medium-Low Sensitivity/Fast andchecking for contig circularization. Only phages that produced circularized contigs were annotatedand published.
The genome ends and DNA packaging strategy were identified by sequence similarity topreviously published P. larvae phages and also using the methods described in [29]. First, all BYUand UNLV phages were searched for the known 3′ overhang sequence “CGACTGCCC” near theterminase genes [16,18,19]. If this sequence was found near the terminase genes, the genome wasrearranged so that base 1 is the first base after the last “C” of the 3′ overhang sequence. Rearrangingthe genome in this manner resulted in the start of the small terminase gene being located 50 base pairs(bp) downstream of base 1, consistent with most published P. larvae phage genomes. In phagesDragolir, Wanderer and LincolnB, this 3′ overhang sequence was not found, but when thesegenomes were rearranged as described above, the genome ends were found to contain the sequence“CGACGGCCC”, indicating a point mutation in the 3’ overhang sequence. Phages Ash, Ley, C7Cdelta,Halcyone, Heath, Scottie, and Unity have sequence similarity to phage Tripp [17], which uses theDirect Terminal Repeats (DTR) packaging strategy, and we thus searched these phages for a DTRsequence. The DTR sequence was identified using Pile-up Analysis Using Starts & Ends (PAUSE)(cpt.tamu.edu/computer-resources/pause) and Geneious, looking for a sharply delimited region withdouble coverage depth, as detailed in [29] and shown in Figure 1. For this method to work, the phagegenomes must be sequenced with a PCR-free library preparation method, e.g., Illumina TruSeq(San Diego, CA, USA).
Annotation of the BYU and UNLV phage genomes was carried out at UNLV using DNA Master(cobamide2.bio.pitt.edu). Open reading frames (ORFs) were assigned a score α that determinedwhether they were identified as coding based on five criteria: (a) Number of auto-annotation programsthat identified the ORF as coding: Glimmer [30] (ccb.jhu.edu/software/glimmer), and the GeneMark

Viruses 2018, 10, 377 3 of 29
family of programs (exon.gatech.edu), specifically GeneMark [31], prokaryotic GeneMark.hmm [32](host trained with P. larvae ATCC 9545), Heuristic GeneMark.hmm [33], GeneMarkS (self-trained) [34],and GeneMark S2 (score can thus range from 0 to 6); (b) existence of coding potential predicted byGeneMarkS as in Figure 2 (score 0–5, based on height and ORF coverage); (c) existence of statisticallysignificant homology matches (BLAST, HMMer) (score 0–5, based on E-value and number of aminoacid residues); (d) filling of coding gap and existence of overlaps with other putative genes (score 0–5,based on gap filling and overlap length); and (e) whether the putative gene is part of an operon(start/stop overlaps with the stop/start of an upstream/downstream gene). Criterion (d) takes intoaccount the fact that phage genes seldom overlap (thus overlapping is penalized) and that phagegenomes do not have large noncoding gaps (thus gap filling is rewarded). Criterion (e) takes intoaccount the fact that many phages genes are part of an operon, while pseudo-genes are unlikely to be.Putative genes above a cutoff score (typically α = 8) were kept. Genes identified by only one programand genes <200 bp in length were thoroughly investigated as potential false positives. Coding gapslonger than 100 bp were thoroughly scrutinized to check for false negatives.
Viruses 2018, 10, x 3 of 30
coverage); (c) existence of statistically significant homology matches (BLAST, HMMer) (score 0–5,
based on E-value and number of amino acid residues); (d) filling of coding gap and existence of
overlaps with other putative genes (score 0–5, based on gap filling and overlap length); and (e)
whether the putative gene is part of an operon (start/stop overlaps with the stop/start of an
upstream/downstream gene). Criterion (d) takes into account the fact that phage genes seldom
overlap (thus overlapping is penalized) and that phage genomes do not have large noncoding gaps
(thus gap filling is rewarded). Criterion (e) takes into account the fact that many phages genes are
part of an operon, while pseudo-genes are unlikely to be. Putative genes above a cutoff score
(typically α=8) were kept. Genes identified by only one program and genes <200 bp in length were
thoroughly investigated as potential false positives. Coding gaps longer than 100 bp were thoroughly
scrutinized to check for false negatives.
Figure 1. Read coverage map obtained from Pile-up Analysis Using Starts & Ends PAUSE. The direct
terminal repeat sequence is located in the sharply delimited region of double coverage depth in clearly
visible in the image.
Figure 2. Coding potential map for two open reading frames (ORFs), obtained from GeneMarkS [34].
In the figure, two ORFs are shown, one with strong coding potential (left, score: 5) and one with weak
coding potential (right, score: 1). Upward ticks represent start codons, downward ticks represent stop
codons, and horizontal lines between ticks indicate ORFs. The first ORF has four possible start codons,
only one of which is located in front of the increase in coding potential (far left).
For each gene, start codons were assigned a score based on (a) the number of auto-annotation
programs that chose that start codon (0 to 6); (b) whether a start codon was located in front of the
increase in coding potential; (c) the number of amino acid residues in the top homology matches; (d)
the length of the resultant gap or overlap, (e) overlap with the stop codon of an upstream gene
(indicating an operon); and (f) Shine–Dalgarno score with settings Kibler6 and Karlin Medium in
Figure 1. Read coverage map obtained from Pile-up Analysis Using Starts & Ends PAUSE. The directterminal repeat sequence is located in the sharply delimited region of double coverage depth in clearlyvisible in the image.
Viruses 2018, 10, x 3 of 30
coverage); (c) existence of statistically significant homology matches (BLAST, HMMer) (score 0–5,
based on E-value and number of amino acid residues); (d) filling of coding gap and existence of
overlaps with other putative genes (score 0–5, based on gap filling and overlap length); and (e)
whether the putative gene is part of an operon (start/stop overlaps with the stop/start of an
upstream/downstream gene). Criterion (d) takes into account the fact that phage genes seldom
overlap (thus overlapping is penalized) and that phage genomes do not have large noncoding gaps
(thus gap filling is rewarded). Criterion (e) takes into account the fact that many phages genes are
part of an operon, while pseudo-genes are unlikely to be. Putative genes above a cutoff score
(typically α=8) were kept. Genes identified by only one program and genes <200 bp in length were
thoroughly investigated as potential false positives. Coding gaps longer than 100 bp were thoroughly
scrutinized to check for false negatives.
Figure 1. Read coverage map obtained from Pile-up Analysis Using Starts & Ends PAUSE. The direct
terminal repeat sequence is located in the sharply delimited region of double coverage depth in clearly
visible in the image.
Figure 2. Coding potential map for two open reading frames (ORFs), obtained from GeneMarkS [34].
In the figure, two ORFs are shown, one with strong coding potential (left, score: 5) and one with weak
coding potential (right, score: 1). Upward ticks represent start codons, downward ticks represent stop
codons, and horizontal lines between ticks indicate ORFs. The first ORF has four possible start codons,
only one of which is located in front of the increase in coding potential (far left).
For each gene, start codons were assigned a score based on (a) the number of auto-annotation
programs that chose that start codon (0 to 6); (b) whether a start codon was located in front of the
increase in coding potential; (c) the number of amino acid residues in the top homology matches; (d)
the length of the resultant gap or overlap, (e) overlap with the stop codon of an upstream gene
(indicating an operon); and (f) Shine–Dalgarno score with settings Kibler6 and Karlin Medium in
Figure 2. Coding potential map for two open reading frames (ORFs), obtained from GeneMarkS [34].In the figure, two ORFs are shown, one with strong coding potential (left, score: 5) and one with weakcoding potential (right, score: 1). Upward ticks represent start codons, downward ticks represent stopcodons, and horizontal lines between ticks indicate ORFs. The first ORF has four possible start codons,only one of which is located in front of the increase in coding potential (far left).

Viruses 2018, 10, 377 4 of 29
For each gene, start codons were assigned a score based on (a) the number of auto-annotationprograms that chose that start codon (0 to 6); (b) whether a start codon was located in front of theincrease in coding potential; (c) the number of amino acid residues in the top homology matches;(d) the length of the resultant gap or overlap, (e) overlap with the stop codon of an upstream gene(indicating an operon); and (f) Shine–Dalgarno score with settings Kibler6 and Karlin Medium in DNAMaster. Particular weight was given to criterion (b), with start codons located behind the increasein coding potential significantly penalizart codoned. All of a gene’s start codons were scored in thismanner, and the s with the highest score was chosen.
Putative protein function was inferred from searches of the NCBI nonredundant (nr) proteindatabase with BLASTP (blast.ncbi.nlm.nih.gov), searches of the NCBI Conserved Domain Database(CDD) (ncbi.nlm.nih.gov/Structure/cdd) with CD-Search [35], and searches of UniProtKB withHMMer (hmmer.org), using an E-value cutoff of 1 × 10⁻³ for all three. The result with the lowestE-value that was not a “hypothetical protein” was chosen as the putative function. In some instancesputative function was assigned by synteny (applicable to structural proteins and tail assembly proteins).Transmembrane domains were identified with TMHMM [36] and tRNAs with Aragorn [37] andtRNAScan [38].
Percent average nucleotide identity (ANI) between genomes was obtained by performing amultiple alignment using ClustalW [39] in Geneious, using the IUB cost matrix and default settings.Dot plots were made with Gepard 1.30 (cube.univie.ac.at/gepard) [40]. Gene content analysis wasperformed by grouping phage proteins into phams with Phamerator using the default (recommended)settings [41] and the results were visualized with SplitsTree [42]. Phage genome maps were generatedwith Phamerator using the “Align Two Sequences” algorithm of BLASTN and default window and stepsize, with an E-value cutoff of 1 × 10⁻⁴ [41]. Proteins phylogenies were constructed by aligning theiramino acid sequences using TranslatorX v1.1 (translatorx.co.uk) and Muscle v3.8.31 [43,44]. The best-fitamino acid substitution model was identified using a hierarchical scheme and tested using the BayesianInformation Criterion [45] as implemented in jModelTest2 [46]. Phylogenies were then inferred using aBayesian inference framework implemented in MrBayes v3.2.6 with two independent runs of 20 milliongenerations each and a sampling frequency of 1000 generations [47]. The first 5000 samples werediscarded, and convergence and mixing were evaluated using the average standard deviation of splitfrequencies and visually inspecting the traces in Tracer v1.6.0 (tree.bio.ed.ac.uk/software/tracer).Trees were midpoint rooted [48] and visualized with FigTree (tree.bio.ed.ac.uk/software/figtree).
3. Results
3.1. Phage Sources and Geographical Origin
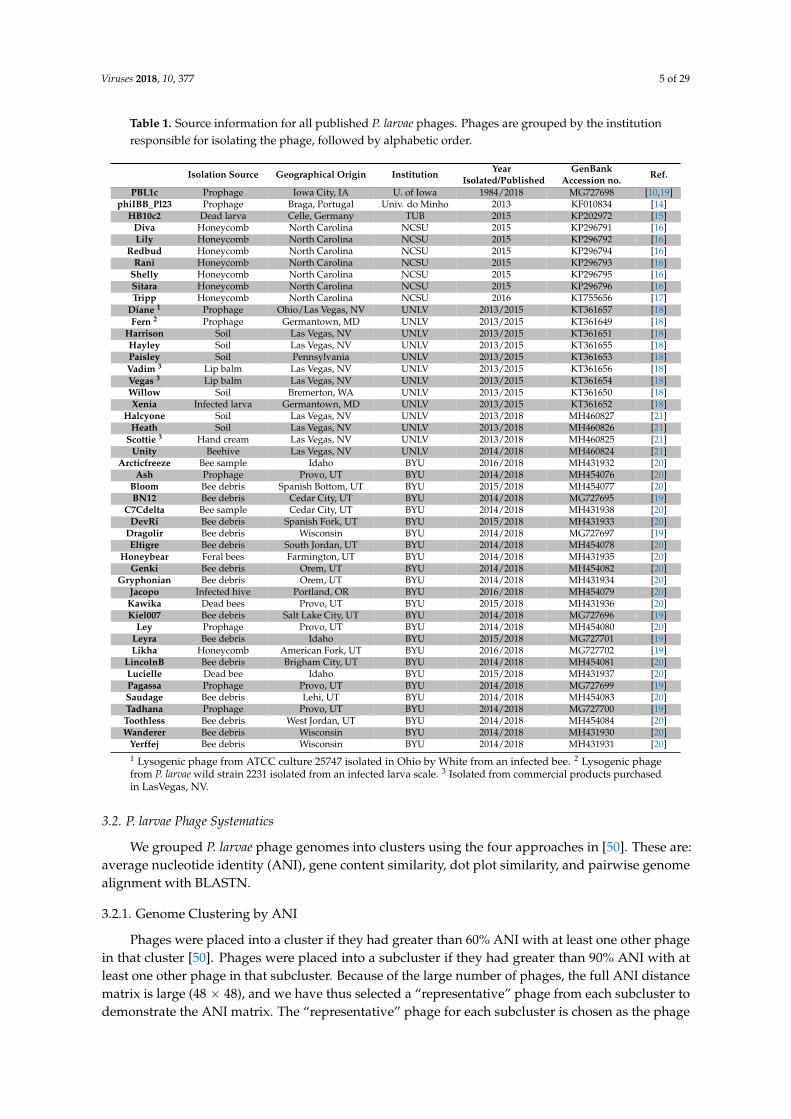
The phages’ isolation source, geographical origin, isolating institution, year isolated andpublished, and GenBank accession number are listed in Table 1. For prophages, the geographical originis that of the isolating institution. All but two of the phages (phiIBB_Pl23 from Portugal, HB10c2from Germany) were isolated in the United States. Of these, 25 were isolated by the BYU PhageHunters class, 13 were isolated at UNLV, 7 at North Carolina State University in Raleigh, NC, and 1 atthe University of Iowa (phage PBL1c). UNLV phages Harrison, Hayley, Halcyone and Heath wereisolated from soil underneath healthy beehives in the Las Vegas area. Phages Vadim, Vegas, and Scottiewere isolated from beeswax-containing commercial products (Burt’s Bees) purchased in Las Vegas.Phage Diane was isolated from an American Type Culture Collection (ATCC) culture isolated froman infected bee by White et al. in 1906 [49]. The BYU phages were isolated by students from eitherbee debris or lysogens, thus the majority, but not all, of these phages are from Utah. Phage PBL1c wasisolated in 1984 at the University of Iowa by Dingman et al. [10] and was sequenced in 2018 at BYU.
Viruses 2018, 10, 377 5 of 29
Table 1. Source information for all published P. larvae phages. Phages are grouped by the institutionresponsible for isolating the phage, followed by alphabetic order.
Isolation Source Geographical Origin Institution YearIsolated/Published
GenBankAccession no. Ref.
PBL1c Prophage Iowa City, IA U. of Iowa 1984/2018 MG727698 [10,19]phiIBB_Pl23 Prophage Braga, Portugal Univ. do Minho 2013 KF010834 [14]
HB10c2 Dead larva Celle, Germany TUB 2015 KP202972 [15]Diva Honeycomb North Carolina NCSU 2015 KP296791 [16]Lily Honeycomb North Carolina NCSU 2015 KP296792 [16]
Redbud Honeycomb North Carolina NCSU 2015 KP296794 [16]Rani Honeycomb North Carolina NCSU 2015 KP296793 [16]
Shelly Honeycomb North Carolina NCSU 2015 KP296795 [16]Sitara Honeycomb North Carolina NCSU 2015 KP296796 [16]Tripp Honeycomb North Carolina NCSU 2016 KT755656 [17]
Diane 1 Prophage Ohio/Las Vegas, NV UNLV 2013/2015 KT361657 [18]Fern 2 Prophage Germantown, MD UNLV 2013/2015 KT361649 [18]
Harrison Soil Las Vegas, NV UNLV 2013/2015 KT361651 [18]Hayley Soil Las Vegas, NV UNLV 2013/2015 KT361655 [18]Paisley Soil Pennsylvania UNLV 2013/2015 KT361653 [18]Vadim 3 Lip balm Las Vegas, NV UNLV 2013/2015 KT361656 [18]Vegas 3 Lip balm Las Vegas, NV UNLV 2013/2015 KT361654 [18]Willow Soil Bremerton, WA UNLV 2013/2015 KT361650 [18]Xenia Infected larva Germantown, MD UNLV 2013/2015 KT361652 [18]
Halcyone Soil Las Vegas, NV UNLV 2013/2018 MH460827 [21]Heath Soil Las Vegas, NV UNLV 2013/2018 MH460826 [21]
Scottie 3 Hand cream Las Vegas, NV UNLV 2013/2018 MH460825 [21]Unity Beehive Las Vegas, NV UNLV 2014/2018 MH460824 [21]
Arcticfreeze Bee sample Idaho BYU 2016/2018 MH431932 [20]Ash Prophage Provo, UT BYU 2014/2018 MH454076 [20]
Bloom Bee debris Spanish Bottom, UT BYU 2015/2018 MH454077 [20]BN12 Bee debris Cedar City, UT BYU 2014/2018 MG727695 [19]
C7Cdelta Bee sample Cedar City, UT BYU 2014/2018 MH431938 [20]DevRi Bee debris Spanish Fork, UT BYU 2015/2018 MH431933 [20]
Dragolir Bee debris Wisconsin BYU 2014/2018 MG727697 [19]Eltigre Bee debris South Jordan, UT BYU 2014/2018 MH454078 [20]
Honeybear Feral bees Farmington, UT BYU 2014/2018 MH431935 [20]Genki Bee debris Orem, UT BYU 2014/2018 MH454082 [20]
Gryphonian Bee debris Orem, UT BYU 2014/2018 MH431934 [20]Jacopo Infected hive Portland, OR BYU 2016/2018 MH454079 [20]Kawika Dead bees Provo, UT BYU 2015/2018 MH431936 [20]Kiel007 Bee debris Salt Lake City, UT BYU 2014/2018 MG727696 [19]
Ley Prophage Provo, UT BYU 2014/2018 MH454080 [20]Leyra Bee debris Idaho BYU 2015/2018 MG727701 [19]Likha Honeycomb American Fork, UT BYU 2016/2018 MG727702 [19]
LincolnB Bee debris Brigham City, UT BYU 2014/2018 MH454081 [20]Lucielle Dead bee Idaho BYU 2015/2018 MH431937 [20]Pagassa Prophage Provo, UT BYU 2014/2018 MG727699 [19]Saudage Bee debris Lehi, UT BYU 2014/2018 MH454083 [20]Tadhana Prophage Provo, UT BYU 2014/2018 MG727700 [19]Toothless Bee debris West Jordan, UT BYU 2014/2018 MH454084 [20]Wanderer Bee debris Wisconsin BYU 2014/2018 MH431930 [20]
Yerffej Bee debris Wisconsin BYU 2014/2018 MH431931 [20]1 Lysogenic phage from ATCC culture 25747 isolated in Ohio by White from an infected bee. 2 Lysogenic phagefrom P. larvae wild strain 2231 isolated from an infected larva scale. 3 Isolated from commercial products purchasedin LasVegas, NV.
3.2. P. larvae Phage Systematics
We grouped P. larvae phage genomes into clusters using the four approaches in [50]. These are:average nucleotide identity (ANI), gene content similarity, dot plot similarity, and pairwise genomealignment with BLASTN.
3.2.1. Genome Clustering by ANI
Phages were placed into a cluster if they had greater than 60% ANI with at least one other phagein that cluster [50]. Phages were placed into a subcluster if they had greater than 90% ANI with atleast one other phage in that subcluster. Because of the large number of phages, the full ANI distancematrix is large (48 × 48), and we have thus selected a “representative” phage from each subcluster todemonstrate the ANI matrix. The “representative” phage for each subcluster is chosen as the phage

Viruses 2018, 10, 377 6 of 29
with the highest average ANI to all other phages in its subcluster. Singletons (phages that do notbelong to a cluster or subcluster) are treated as representatives of their own subcluster. The ANIdistance matrix for representative phages is shown in Figure 3, while the full ANI distance matrix isincluded as Supplementary Figure S1.
Viruses 2018, 10, x 7 of 30
distance matrix for representative phages is shown in Figure 3, while the full ANI distance matrix is
included as Supplementary Figure S1.
Figure 3. Clusters of P. larvae phage genomes determined by average nucleotide identity.
There are several instances of phages with ANI > 99.9% to each other (i.e., differ by 40 or less
base pairs). The criterion we used to determine whether to publish such phages as separate is whether
the differences between their nucleotide sequences produce differences in the corresponding gene
products’ amino acid sequences (i.e., phenotypic differences). If that was the case, the phages were
published as distinct phages. If not, one of the phages was selected for publication and the other was
not published. We found that phages with ANI > 99.975% (i.e., no more than 10 bases different out of
40,000) were phenotypically identical, the sole exceptions to this being phages Fern and Willow (ANI
= 99.995%, Figure S1) and Diane, Vadim and Vegas (ANI = 99.989%, Figure S1). On the other hand, if
the ANI between two phages was less than 99.975%, this resulted in at least one phenotypic
difference.
Rather than an alphanumeric scheme for naming clusters and subclusters, as used previously
[27], we named clusters and subclusters after their representative phage, which will allow for easy
expansion of clusters should the number of clusters increase to more than 26. By far the largest cluster
is the first cluster on the left in Figure 3, named after phage Fern. This cluster contains 30 of the 48
sequenced P. larvae phage genomes (Figure S1) and consists of four subclusters (Fern, Rani, DevRi,
Xenia) and six singletons. The Fern subcluster is the largest subcluster, containing phages Pagassa,
Tadhana, Honeybear, Toothless, Fern, Willow, Lucielle, Saudage, BN12 and Kawika (Figure S1), all
of which were isolated at BYU or UNLV. The Rani subcluster contains phages Kiel007, Redbud, Rani,
Eltigre and HB10c2. The DevRi subcluster contains phages Arcticfreeze, DevRi, Bloom, Jacopo,
Genki, and Gryphonian. This subcluster is extremely tight, as all phages in it have >98% ANI with
each other. The Xenia subcluster contains phages Xenia, Shelly, and Leyra. Phages Likha,
phiIBB_Pl23, Yerffej, Sitara, Diva and PBL1c are singletons within the Fern cluster, although PBL1c
falls just short of the 90% cutoff for inclusion into the Xenia subcluster.
The Harrison cluster consists of phages Harrison and Paisley (Figure S1), while the Vegas cluster
consists of a very tight subcluster that contains phages Diane, Hayley, Vadim and Vegas, the
singleton phage Dragolir and the LincolnB subcluster consisting of phages LincolnB and Wanderer.
The Vegas and LincolnB subclusters are sufficiently different that they would form separate clusters,
however as phage Dragolir has >60% ANI with members of both subclusters, it joins the two
subclusters together into a single cluster.
Phage Lily is a singleton, with less than 50% ANI with any other P. larvae phage genome. The
Halcyone cluster contains all the DTR phages, and is comprised of the the Ash subcluster consisting
of the BYU phages Ash, C7Cdelta and Ley, the Halcyone subcluster, consisting of UNLV phages
Halcyone, Heath, Scottie and Unity, while phage Tripp from North Carolina is a singleton within the
cluster. Phage genomes in Halcyone cluster show less than 30% ANI with all other P. larvae phage
genomes. By comparison, a ClustalW alignment on two randomly generated 40 kbp DNA sequences
produces 40% ANI. Phages in the Halcyone cluster are thus very distant from all other P. larvae
phages.
Figure 3. Clusters of P. larvae phage genomes determined by average nucleotide identity.
There are several instances of phages with ANI > 99.9% to each other (i.e., differ by 40 or less basepairs). The criterion we used to determine whether to publish such phages as separate is whether thedifferences between their nucleotide sequences produce differences in the corresponding gene products’amino acid sequences (i.e., phenotypic differences). If that was the case, the phages were published asdistinct phages. If not, one of the phages was selected for publication and the other was not published.We found that phages with ANI > 99.975% (i.e., no more than 10 bases different out of 40,000) werephenotypically identical, the sole exceptions to this being phages Fern and Willow (ANI = 99.995%,Figure S1) and Diane, Vadim and Vegas (ANI = 99.989%, Figure S1). On the other hand, if the ANIbetween two phages was less than 99.975%, this resulted in at least one phenotypic difference.
Rather than an alphanumeric scheme for naming clusters and subclusters, as used previously [27],we named clusters and subclusters after their representative phage, which will allow for easy expansionof clusters should the number of clusters increase to more than 26. By far the largest cluster isthe first cluster on the left in Figure 3, named after phage Fern. This cluster contains 30 of the48 sequenced P. larvae phage genomes (Figure S1) and consists of four subclusters (Fern, Rani, DevRi,Xenia) and six singletons. The Fern subcluster is the largest subcluster, containing phages Pagassa,Tadhana, Honeybear, Toothless, Fern, Willow, Lucielle, Saudage, BN12 and Kawika (Figure S1), all ofwhich were isolated at BYU or UNLV. The Rani subcluster contains phages Kiel007, Redbud, Rani,Eltigre and HB10c2. The DevRi subcluster contains phages Arcticfreeze, DevRi, Bloom, Jacopo, Genki,and Gryphonian. This subcluster is extremely tight, as all phages in it have >98% ANI with each other.The Xenia subcluster contains phages Xenia, Shelly, and Leyra. Phages Likha, phiIBB_Pl23, Yerffej,Sitara, Diva and PBL1c are singletons within the Fern cluster, although PBL1c falls just short of the90% cutoff for inclusion into the Xenia subcluster.
The Harrison cluster consists of phages Harrison and Paisley (Figure S1), while the Vegas clusterconsists of a very tight subcluster that contains phages Diane, Hayley, Vadim and Vegas, the singletonphage Dragolir and the LincolnB subcluster consisting of phages LincolnB and Wanderer. The Vegasand LincolnB subclusters are sufficiently different that they would form separate clusters, however asphage Dragolir has >60% ANI with members of both subclusters, it joins the two subclusters togetherinto a single cluster.
Phage Lily is a singleton, with less than 50% ANI with any other P. larvae phage genome.The Halcyone cluster contains all the DTR phages, and is comprised of the the Ash subcluster consistingof the BYU phages Ash, C7Cdelta and Ley, the Halcyone subcluster, consisting of UNLV phagesHalcyone, Heath, Scottie and Unity, while phage Tripp from North Carolina is a singleton within thecluster. Phage genomes in Halcyone cluster show less than 30% ANI with all other P. larvae phage

Viruses 2018, 10, 377 7 of 29
genomes. By comparison, a ClustalW alignment on two randomly generated 40 kbp DNA sequencesproduces 40% ANI. Phages in the Halcyone cluster are thus very distant from all other P. larvae phages.
From these results, it is apparent that geographic origin is not correlated with genome sequencesimilarity. There are multiple instances of phages from widely different locations having very highANI (e.g., phages Xenia and Shelly, phages Fern and Willow, phages Diane and Vegas, and phagesRedbud and Kiel007 all have >99.5% ANI with each other). Even phages from different continents arefound in the same subcluster (e.g., HB10c2 and Kiel007, Rani or Redbud). On the other hand, phagesfrom the same location and even the same isolation source can be very dissimilar from each other(e.g., phages Diva, Lily and Tripp from North Carolina, and phages Halcyone and Harrison from theLas Vegas area).
3.2.2. Phage Clustering by Shared Gene Content Analysis
Due to the high degree of horizontal gene transfer between phages, construction of phylogenetictrees of complete phage genomes is not appropriate, but an alternative approach is to cluster phagegenomes by scoring them based on whether they contain a member of each of the protein phamsand visualize the results with SplitsTree [42], shown in Figure 4. Phage genomes were grouped intoclusters based on branch length. The clusters generated with this method are identical with the clustersgenerated by ANI. The complete list of all P. larvae phage protein phams and their members is given inSupplementary Table S1.
Viruses 2018, 10, x 8 of 30
From these results, it is apparent that geographic origin is not correlated with genome sequence
similarity. There are multiple instances of phages from widely different locations having very high
ANI (e.g., phages Xenia and Shelly, phages Fern and Willow, phages Diane and Vegas, and phages
Redbud and Kiel007 all have >99.5% ANI with each other). Even phages from different continents are
found in the same subcluster (e.g., HB10c2 and Kiel007, Rani or Redbud). On the other hand, phages
from the same location and even the same isolation source can be very dissimilar from each other
(e.g., phages Diva, Lily and Tripp from North Carolina, and phages Halcyone and Harrison from the
Las Vegas area).
3.2.2. Phage Clustering by Shared Gene Content Analysis
Due to the high degree of horizontal gene transfer between phages, construction of phylogenetic
trees of complete phage genomes is not appropriate, but an alternative approach is to cluster phage
genomes by scoring them based on whether they contain a member of each of the protein phams and
visualize the results with SplitsTree [42], shown in Figure 4. Phage genomes were grouped into
clusters based on branch length. The clusters generated with this method are identical with the
clusters generated by ANI. The complete list of all P. larvae phage protein phams and their members
is given in Supplementary Table S1.
Figure 4. Clustering of P. larvae phage genomes based on shared gene content. Genomes were scored
for shared gene content using Phamerator and graphed using SplitsTree4. Colored circles indicate the
assignment of phages to clusters based on genomic nucleotide content, with blue for the Fern cluster,
yellow for the Harrison cluster, orange for the singleton Lily, green for the Vegas cluster, and red for
the Halcyone cluster.
The low degree of gene content similarity between the Halcyone cluster and the other P. larvae
phages is reflected by the relatively long length of the Halcyone cluster branch. The high degree of
gene content similarity within the Fern and Harrison clusters is reflected by the short branches with
those clusters. The large Fern and DevRi subclusters within the Fern cluster are clearly visible. On
the other hand, the heterogeneity of the Vegas cluster is reflected by the greater branch length within
that cluster.
3.2.3. Phage Clustering by Contiguous Dot Plot Identity
A third way of grouping phages is using dot plots, with phages having >50% contiguous dot
plot identity with at least one other phage grouped into the same cluster [50]. A dot plot of all 48 P.
larvae phage genomes is shown in Figure 5. Clusters are highlighted by color, with blue for the Fern
Figure 4. Clustering of P. larvae phage genomes based on shared gene content. Genomes were scoredfor shared gene content using Phamerator and graphed using SplitsTree4. Colored circles indicate theassignment of phages to clusters based on genomic nucleotide content, with blue for the Fern cluster,yellow for the Harrison cluster, orange for the singleton Lily, green for the Vegas cluster, and red forthe Halcyone cluster.
The low degree of gene content similarity between the Halcyone cluster and the other P. larvaephages is reflected by the relatively long length of the Halcyone cluster branch. The high degree ofgene content similarity within the Fern and Harrison clusters is reflected by the short branches withthose clusters. The large Fern and DevRi subclusters within the Fern cluster are clearly visible. On theother hand, the heterogeneity of the Vegas cluster is reflected by the greater branch length withinthat cluster.

Viruses 2018, 10, 377 8 of 29
3.2.3. Phage Clustering by Contiguous Dot Plot Identity
A third way of grouping phages is using dot plots, with phages having >50% contiguous dotplot identity with at least one other phage grouped into the same cluster [50]. A dot plot of all48 P. larvae phage genomes is shown in Figure 5. Clusters are highlighted by color, with blue for theFern cluster, yellow for the Harrison cluster, green for the Vegas cluster, orange for Lily, and red for theHalcyone cluster.
The clusters generated by dot plot similarity are identical with those generated by ANI and genecontent analysis. There is very little genome conservation between the Halcyone cluster and all other P.larvae phage genomes, but fairly high genome conservation within that cluster. The Fern cluster phagesall have a high degree of genome conservation with each other, particularly at the front and rear ofthe genome, with the middle of the genome being sometimes divergent. The front end of the genomeis conserved across phages in the Fern, Harrison and Vegas clusters, while the rear of the genome isconserved between Lily and the Fern cluster. Phages within the Vegas cluster all have at least 50%contiguous dot plot similarity with each other, despite this cluster being the most heterogeneous.
Viruses 2018, 10, x 9 of 30
cluster, yellow for the Harrison cluster, green for the Vegas cluster, orange for Lily, and red for the
Halcyone cluster.
The clusters generated by dot plot similarity are identical with those generated by ANI and gene
content analysis. There is very little genome conservation between the Halcyone cluster and all other
P. larvae phage genomes, but fairly high genome conservation within that cluster. The Fern cluster
phages all have a high degree of genome conservation with each other, particularly at the front and
rear of the genome, with the middle of the genome being sometimes divergent. The front end of the
genome is conserved across phages in the Fern, Harrison and Vegas clusters, while the rear of the
genome is conserved between Lily and the Fern cluster. Phages within the Vegas cluster all have at
least 50% contiguous dot plot similarity with each other, despite this cluster being the most
heterogeneous.
Figure 5. Dot plot of all 48 P. larvae phage genomes. Phages are grouped into clusters if they have
>50% contiguous dotplot similarity with each other. Phage clusters are highlighted in color, with blue
for the Fern cluster, yellow for the Harrison cluster, green for the Vegas cluster, orange for Lily, and
red for the Halcyone cluster.
3.2.4. Phage Clustering with Pairwise Phage Genome Maps
Another way to represent the relationships between phages and group them into clusters is with
pairwise genome map comparisons [50]. Genome maps generated with Phamerator are shown in
Figure 6. Purple shading indicates areas of genome sequence similarity between two phage genomes
with E-value 0 as determined by the BLASTN “Align Two Sequences” (bl2seq) program. Other colors
indicate sequence similarity with higher E-value, with red indicating sequence similarity at the cutoff
E-value of 1 × 10⁻⁴ [48]. We grouped phages into the same cluster if they had greater than 50%
Figure 5. Dot plot of all 48 P. larvae phage genomes. Phages are grouped into clusters if theyhave >50% contiguous dotplot similarity with each other. Phage clusters are highlighted in color,with blue for the Fern cluster, yellow for the Harrison cluster, green for the Vegas cluster, orange forLily, and red for the Halcyone cluster.

Viruses 2018, 10, 377 9 of 29
3.2.4. Phage Clustering with Pairwise Phage Genome Maps
Another way to represent the relationships between phages and group them into clusters is withpairwise genome map comparisons [50]. Genome maps generated with Phamerator are shown inFigure 6. Purple shading indicates areas of genome sequence similarity between two phage genomeswith E-value 0 as determined by the BLASTN “Align Two Sequences” (bl2seq) program. Other colorsindicate sequence similarity with higher E-value, with red indicating sequence similarity at the cutoffE-value of 1 × 10⁻⁴ [48]. We grouped phages into the same cluster if they had greater than 50%BLASTN sequence similarity with each other. Pairwise genome maps are especially useful for showingregions of divergence among similar phages, possible instances of horizontal gene transfer, or geneloss. Regions of high similarity within larger regions of low similarity are indicative of horizontalgene transfer.
Viruses 2018, 10, 0 10 of 29
Figure 6. Pairwise genome maps genomes generated with Phamerator. Boxes represent genes,with boxes of the same color indicating genes in the same pham. Genes in a pham of their own(orphams) are uncolored. Shaded areas between genomes indicate regions of high nucleotide sequencesimilarity between phages as determined by BLASTN, with purple indicating the highest degree ofsimilarity (E-value = 0), and red the lowest (E-value = 1 × 10⁻⁴).
The clusters produced with pairwise genome maps are identical with those of the previous threemethods. Within the Fern cluster, approximately the first third of the genome is conserved amongall phages in the cluster, while the rear third of the genome is also generally conserved, with themiddle region varying between phages in different subclusters. Phage Toothless appears to be missingtwo genes present in phages Honeybear and Pagassa. There appears to be an instance of horizontalgene transfer between phages Kawika and Kiel and phages philIBB_Pl23 and Yerffej in the middle oftheir genomes. Phage Fern appears to have a region of divergence towards the rear of the genomewith the otherwise highly similar phage Tadhana. There are several instances of this phenomenonwithin the Fern subcluster. Phage HB10c2 appears to be missing a region present in phages Eltigreand Arcticfreeze. Phages Harrison and Paisley differ by only one gene located towards the rear of the
Figure 6. Pairwise genome maps genomes generated with Phamerator. Boxes represent genes,with boxes of the same color indicating genes in the same pham. Genes in a pham of their own(orphams) are uncolored. Shaded areas between genomes indicate regions of high nucleotide sequencesimilarity between phages as determined by BLASTN, with purple indicating the highest degree ofsimilarity (E-value = 0), and red the lowest (E-value = 1 × 10⁻⁴).

Viruses 2018, 10, 377 10 of 29
The clusters produced with pairwise genome maps are identical with those of the previous threemethods. Within the Fern cluster, approximately the first third of the genome is conserved amongall phages in the cluster, while the rear third of the genome is also generally conserved, with themiddle region varying between phages in different subclusters. Phage Toothless appears to be missingtwo genes present in phages Honeybear and Pagassa. There appears to be an instance of horizontalgene transfer between phages Kawika and Kiel and phages philIBB_Pl23 and Yerffej in the middle oftheir genomes. Phage Fern appears to have a region of divergence towards the rear of the genomewith the otherwise highly similar phage Tadhana. There are several instances of this phenomenonwithin the Fern subcluster. Phage HB10c2 appears to be missing a region present in phages Eltigreand Arcticfreeze. Phages Harrison and Paisley differ by only one gene located towards the rear of thegenome. In the Vegas subcluster, phage Hayley is missing two genes found in Diane, Vadim and Vegasbut is otherwise highly similar to them. Phage Dragolir is approximately 60% similar with the phagesin the Vegas subcluster, and serves as a link between the Vegas subcluster and phages LincolnB andWanderer, as in Figure S1. Interestingly, there appears to be an instance of horizontal gene transferbetween phage Lily and phages Wanderer and LincolnB. The phages within the Halcyone clusterare all fairly similar to one another, with Tripp being the most divergent. Phage Unity appears to bemissing a region found in phages Halcyone, Heath, and Scottie.
3.3. P. larvae Phage Genome Characteristics
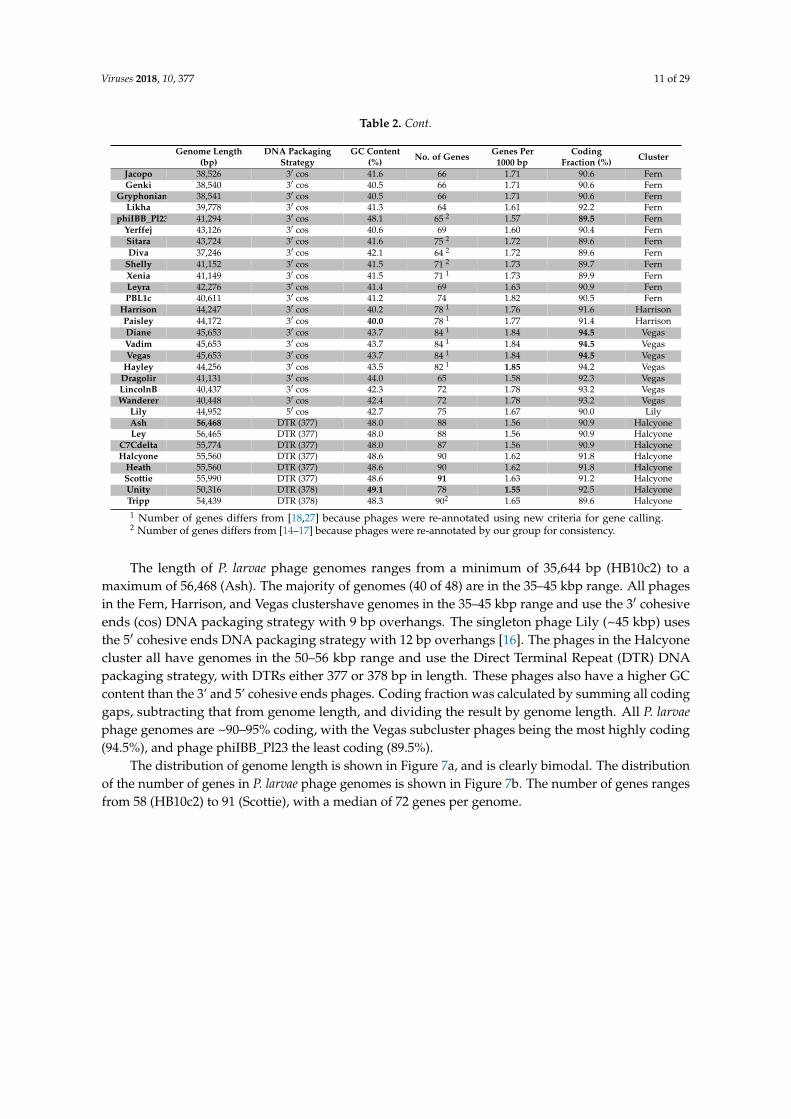
The key characteristics of the P. larvae phage genomes are listed in Table 2. These are genomelength, GC content, DNA packaging strategy, number of genes, gene density (genes per 1 kbp), codingfraction, and cluster they belong to. For the UNLV phages Diane, Fern, Harrison, Hayley, Paisley,Vadim, Vegas, Willow and Xenia, the number of genes differs from previous work [18,27] because thegenome annotation of these phages was revised with the updated protocol used to annotate the morerecently published phages. This also applies to phages phiIBB_Pl23, HB10c2, Diva, Rani, Redbud,Shelly, Sitara, Lily and Tripp [14–17], which were annotated and published by their respective groups,but were re-annotated by our group using our annotation protocol for the purposes of this paperfor consistency.
Table 2. Genomic characteristics of P. larvae phage genomes. Phages are grouped by cluster, with thelargest (Fern) cluster first, as in Figure S1. Bold indicates the maximum or minimum value of a genomiccharacteristic. For phages that use the DTR DNA packaging strategy, the length of the direct terminalrepeats is shown in parentheses.
Genome Length(bp)
DNA PackagingStrategy
GC Content(%) No. of Genes Genes Per
1000 bpCoding
Fraction (%) Cluster
Pagassa 40,035 3′ cos 42.0 66 1.65 91.2 FernHoneybear 40,054 3′ cos 41.9 66 1.65 91.2 FernToothless 38,832 3′ cos 42.0 64 1.65 91.0 FernTadhana 37,880 3′ cos 42.1 61 1.61 91.2 Fern
Fern 37,995 3′ cos 41.9 65 1 1.71 91.5 FernWillow 37,994 3′ cos 41.9 65 1 1.71 91.5 FernLucielle 37,947 3′ cos 41.8 65 1.71 91.3 FernSaudage 37,962 3′ cos 41.9 65 1.71 91.6 Fern
BN12 39,485 3′ cos 42.6 69 1.75 92.4 FernKawika 40,769 3′ cos 41.6 71 1.74 89.8 FernKiel007 37,985 3′ cos 41.8 62 1.63 91.7 FernRedbud 37,971 3′ cos 41.8 62 2 1.63 91.4 Fern
Rani 37,990 3′ cos 41.8 62 2 1.63 91.8 FernEltigre 38,675 3′ cos 41.4 67 1.73 92.1 FernHB10c2 35,644 3′ cos 41.8 58 2 1.63 91.2 Fern
Arcticfreeze 38,518 3′ cos 41.5 66 1.71 90.6 FernDevRi 38,520 3′ cos 41.5 66 1.71 90.6 FernBloom 38,519 3′ cos 41.5 66 1.71 90.6 Fern
Viruses 2018, 10, 377 11 of 29
Table 2. Cont.
Genome Length(bp)
DNA PackagingStrategy
GC Content(%) No. of Genes Genes Per
1000 bpCoding
Fraction (%) Cluster
Jacopo 38,526 3′ cos 41.6 66 1.71 90.6 FernGenki 38,540 3′ cos 40.5 66 1.71 90.6 Fern
Gryphonian 38,541 3′ cos 40.5 66 1.71 90.6 FernLikha 39,778 3′ cos 41.3 64 1.61 92.2 Fern
phiIBB_Pl23 41,294 3′ cos 48.1 65 2 1.57 89.5 FernYerffej 43,126 3′ cos 40.6 69 1.60 90.4 FernSitara 43,724 3′ cos 41.6 75 2 1.72 89.6 FernDiva 37,246 3′ cos 42.1 64 2 1.72 89.6 Fern
Shelly 41,152 3′ cos 41.5 71 2 1.73 89.7 FernXenia 41,149 3′ cos 41.5 71 1 1.73 89.9 FernLeyra 42,276 3′ cos 41.4 69 1.63 90.9 FernPBL1c 40,611 3′ cos 41.2 74 1.82 90.5 Fern
Harrison 44,247 3′ cos 40.2 78 1 1.76 91.6 HarrisonPaisley 44,172 3′ cos 40.0 78 1 1.77 91.4 HarrisonDiane 45,653 3′ cos 43.7 84 1 1.84 94.5 VegasVadim 45,653 3′ cos 43.7 84 1 1.84 94.5 VegasVegas 45,653 3′ cos 43.7 84 1 1.84 94.5 Vegas
Hayley 44,256 3′ cos 43.5 82 1 1.85 94.2 VegasDragolir 41,131 3′ cos 44.0 65 1.58 92.3 VegasLincolnB 40,437 3′ cos 42.3 72 1.78 93.2 VegasWanderer 40,448 3′ cos 42.4 72 1.78 93.2 Vegas
Lily 44,952 5′ cos 42.7 75 1.67 90.0 LilyAsh 56,468 DTR (377) 48.0 88 1.56 90.9 HalcyoneLey 56,465 DTR (377) 48.0 88 1.56 90.9 Halcyone
C7Cdelta 55,774 DTR (377) 48.0 87 1.56 90.9 HalcyoneHalcyone 55,560 DTR (377) 48.6 90 1.62 91.8 Halcyone
Heath 55,560 DTR (377) 48.6 90 1.62 91.8 HalcyoneScottie 55,990 DTR (377) 48.6 91 1.63 91.2 HalcyoneUnity 50,316 DTR (378) 49.1 78 1.55 92.5 HalcyoneTripp 54,439 DTR (378) 48.3 902 1.65 89.6 Halcyone1 Number of genes differs from [18,27] because phages were re-annotated using new criteria for gene calling.2 Number of genes differs from [14–17] because phages were re-annotated by our group for consistency.
The length of P. larvae phage genomes ranges from a minimum of 35,644 bp (HB10c2) to amaximum of 56,468 (Ash). The majority of genomes (40 of 48) are in the 35–45 kbp range. All phagesin the Fern, Harrison, and Vegas clustershave genomes in the 35–45 kbp range and use the 3′ cohesiveends (cos) DNA packaging strategy with 9 bp overhangs. The singleton phage Lily (~45 kbp) usesthe 5′ cohesive ends DNA packaging strategy with 12 bp overhangs [16]. The phages in the Halcyonecluster all have genomes in the 50–56 kbp range and use the Direct Terminal Repeat (DTR) DNApackaging strategy, with DTRs either 377 or 378 bp in length. These phages also have a higher GCcontent than the 3’ and 5’ cohesive ends phages. Coding fraction was calculated by summing all codinggaps, subtracting that from genome length, and dividing the result by genome length. All P. larvaephage genomes are ~90–95% coding, with the Vegas subcluster phages being the most highly coding(94.5%), and phage phiIBB_Pl23 the least coding (89.5%).
The distribution of genome length is shown in Figure 7a, and is clearly bimodal. The distributionof the number of genes in P. larvae phage genomes is shown in Figure 7b. The number of genes rangesfrom 58 (HB10c2) to 91 (Scottie), with a median of 72 genes per genome.

Viruses 2018, 10, 377 12 of 29
Viruses 2018, 10, x 12 of 30
PBL1c 40,611 3′ cos 41.2 74 1.82 90.5 Fern
Harrison 44,247 3′ cos 40.2 78 1 1.76 91.6 Harrison
Paisley 44,172 3′ cos 40.0 78 1 1.77 91.4 Harrison
Diane 45,653 3′ cos 43.7 84 1 1.84 94.5 Vegas
Vadim 45,653 3′ cos 43.7 84 1 1.84 94.5 Vegas
Vegas 45,653 3′ cos 43.7 84 1 1.84 94.5 Vegas
Hayley 44,256 3′ cos 43.5 82 1 1.85 94.2 Vegas
Dragolir 41,131 3′ cos 44.0 65 1.58 92.3 Vegas
LincolnB 40,437 3′ cos 42.3 72 1.78 93.2 Vegas
Wanderer 40,448 3′ cos 42.4 72 1.78 93.2 Vegas
Lily 44,952 5′ cos 42.7 75 1.67 90.0 Lily
Ash 56,468 DTR (377) 48.0 88 1.56 90.9 Halcyone
Ley 56,465 DTR (377) 48.0 88 1.56 90.9 Halcyone
C7Cdelta 55,774 DTR (377) 48.0 87 1.56 90.9 Halcyone
Halcyone 55,560 DTR (377) 48.6 90 1.62 91.8 Halcyone
Heath 55,560 DTR (377) 48.6 90 1.62 91.8 Halcyone
Scottie 55,990 DTR (377) 48.6 91 1.63 91.2 Halcyone
Unity 50,316 DTR (378) 49.1 78 1.55 92.5 Halcyone
Tripp 54,439 DTR (378) 48.3 902 1.65 89.6 Halcyone 1 Number of genes differs from [18,27] because phages were re-annotated using new criteria for gene
calling. 2 Number of genes differs from [14–17] because phages were re-annotated by our group for
consistency.
The length of P. larvae phage genomes ranges from a minimum of 35,644 bp (HB10c2) to a
maximum of 56,468 (Ash). The majority of genomes (40 of 48) are in the 35–45 kbp range. All phages
in the Fern, Harrison, and Vegas clustershave genomes in the 35–45 kbp range and use the 3′ cohesive
ends (cos) DNA packaging strategy with 9 bp overhangs. The singleton phage Lily (~45 kbp) uses the
5′ cohesive ends DNA packaging strategy with 12 bp overhangs [16]. The phages in the Halcyone
cluster all have genomes in the 50–56 kbp range and use the Direct Terminal Repeat (DTR) DNA
packaging strategy, with DTRs either 377 or 378 bp in length. These phages also have a higher GC
content than the 3’ and 5’ cohesive ends phages. Coding fraction was calculated by summing all
coding gaps, subtracting that from genome length, and dividing the result by genome length. All P.
larvae phage genomes are ~90–95% coding, with the Vegas subcluster phages being the most highly
coding (94.5%), and phage phiIBB_Pl23 the least coding (89.5%).
The distribution of genome length is shown in Figure 7a, and is clearly bimodal. The distribution
of the number of genes in P. larvae phage genomes is shown in Figure 7b. The number of genes ranges
from 58 (HB10c2) to 91 (Scottie), with a median of 72 genes per genome.
(a) (b)
Figure 7. Distribution of (a) P. larvae phage genome length and (b) number of genes in P. larvae phage
genomes.
We also calculate gene density (genes per 1000 bp) of P. larvae phage genomes. The number of
genes as a function of genome length is plotted in Figure 8. The most gene-dense phages are in the
Vegas subcluster (Diane, Hayley, Vadim, Vegas), while phage Unity is the least gene dense. The
Figure 7. Distribution of (a) P. larvae phage genome length and (b) number of genes in P. larvaephage genomes.
We also calculate gene density (genes per 1000 bp) of P. larvae phage genomes. The number ofgenes as a function of genome length is plotted in Figure 8. The most gene-dense phages are in the Vegassubcluster (Diane, Hayley, Vadim, Vegas), while phage Unity is the least gene dense. The genomes ofthe Vegas subcluster phages are so gene-dense that they have more genes than the genome of phageUnity, even though the latter is longer. The correlation coefficient between the number of genes andgenome length is 0.93, with a p-value of 0. A linear regression model fitted to the data predicts arelationship of the form y = 1.44x + 10.5, where y is the number of genes and x the genome length inthousands of base pairs, with p-value 0. The number of genes thus scales linearly with genome size.This data can be used in future to check newly annotated genomes for gene overcalling (many falsepositives) or undercalling (many false negatives).
A total of 3462 genes were identified in the 48 P. larvae phage genomes. The distribution of P. larvaephage gene length is shown in Figure 9. The distribution is highly non-normal, strongly right-tailed,with significant outliers. The longest identified gene is 3705 bp, the shortest 75 bp, with a mediangene length of 375 bp. Nine genes longer than 3000 bp were identified, and 21 shorter than 100 bp.The mode is the 200–300 bp length range (787 genes).
Viruses 2018, 10, x 13 of 30
genomes of the Vegas subcluster phages are so gene-dense that they have more genes than the
genome of phage Unity, even though the latter is longer. The correlation coefficient between the
number of genes and genome length is 0.93, with a p-value of 0. A linear regression model fitted to
the data predicts a relationship of the form y = 1.44x + 10.5, where y is the number of genes and x the
genome length in thousands of base pairs, with p-value 0. The number of genes thus scales linearly
with genome size. This data can be used in future to check newly annotated genomes for gene
overcalling (many false positives) or undercalling (many false negatives).
A total of 3462 genes were identified in the 48 P. larvae phage genomes. The distribution of P.
larvae phage gene length is shown in Figure 9. The distribution is highly non-normal, strongly right-
tailed, with significant outliers. The longest identified gene is 3705 bp, the shortest 75 bp, with a
median gene length of 375 bp. Nine genes longer than 3000 bp were identified, and 21 shorter than
100 bp. The mode is the 200–300 bp length range (787 genes).
Figure 8. Number of genes in P. larvae phage genomes as a function of genome length. The number
of genes y scales linearly with the genome length in thousands, x.
Figure 9. Distribution of P. larvae phage gene length.
Figure 8. Number of genes in P. larvae phage genomes as a function of genome length. The number ofgenes y scales linearly with the genome length in thousands, x.

Viruses 2018, 10, 377 13 of 29
Viruses 2018, 10, x 13 of 30
genomes of the Vegas subcluster phages are so gene-dense that they have more genes than the
genome of phage Unity, even though the latter is longer. The correlation coefficient between the
number of genes and genome length is 0.93, with a p-value of 0. A linear regression model fitted to
the data predicts a relationship of the form y = 1.44x + 10.5, where y is the number of genes and x the
genome length in thousands of base pairs, with p-value 0. The number of genes thus scales linearly
with genome size. This data can be used in future to check newly annotated genomes for gene
overcalling (many false positives) or undercalling (many false negatives).
A total of 3462 genes were identified in the 48 P. larvae phage genomes. The distribution of P.
larvae phage gene length is shown in Figure 9. The distribution is highly non-normal, strongly right-
tailed, with significant outliers. The longest identified gene is 3705 bp, the shortest 75 bp, with a
median gene length of 375 bp. Nine genes longer than 3000 bp were identified, and 21 shorter than
100 bp. The mode is the 200–300 bp length range (787 genes).
Figure 8. Number of genes in P. larvae phage genomes as a function of genome length. The number
of genes y scales linearly with the genome length in thousands, x.
Figure 9. Distribution of P. larvae phage gene length. Figure 9. Distribution of P. larvae phage gene length.
3.4. P. larvae Phage Functional Genomics
Statistically significant (E-value < 1 × 10⁻³) homology matches were found for over 90% ofP. larvae phage proteins with BLAST, HMMer, and CD-Search. A homology match to a protein withputative or known function was found for 1921 (~55%) P. larvae phage proteins. Gene products ofrepresentative phages from each cluster that have at least one statistically significant homology matchto a protein with either putative or known function are shown in Table 3. Cells are colored accordingto protein function. We classify phage genes into seven functional categories: (1) virion particle (teal);(2) virion assembly (burgundy); (3) host lysis (violet); (4) DNA replication/metabolism (tan); (5) generegulation, including putative transcription factors (green); (6) host-related functions (yellow); and (7)tRNAs (grey). Gene products whose function cannot be classified into these six categories due toinsufficient or conflicting information are left uncolored. Instances of two or more unrelated functionswith equally statistically significant matches are marked with a footnote, with the more plausiblefunction listed in the table, and the less plausible function listed in the footnotes at the end of the table.The complete version of Table 3 (all phages) is given in Supplementary Table S2. Gene products withthe following functions were identified in all P. larvae phage genomes: (1) large terminase; (2) portalprotein; (3) major capsid protein; (4 & 5) 2 tail assembly proteins; (6) tail tape measure protein;(7) N-acetylmuramoyl-L-alanine amidase; (8) a putative holin; and (9) several tail proteins. In addition,we identified at least one non-identical antirepressor in every genome. Although the overwhelmingmajority of homology matches were to P. larvae proteins, there were also common homology matchesto Geobacillus and Brevibacillus proteins.

Viruses 2018, 10, 377 14 of 29
Table 3. Gene products of representative P. larvae phage genomes with statistically significanthomology matches to proteins with known or putative function. Genes are highlighted accordingto function, with assembly genes in burgundy, structural genes in teal, lysis genes in purple, DNAreplication/metabolism genes in tan, regulatory genes in green, host function genes in yellow, andtRNAs in grey. Gene products whose function cannot be classified into these seven categories due toinsufficient or conflicting information are left uncolored.
Fern Harrison Vegas Dragolir Lily Halcyonesmall terminase gp1 gp1 gp1 gp1 gp1 gp5large terminase gp2 gp2 gp2 gp2 gp2 gp6portal protein gp3 gp3 gp3 gp3 gp4 gp7
Clp protease ClpP gp4 gp4 gp4 gp5capsid maturation protease gp4
minor capsid protein gp8Clp protease ClpB gp9
major capsid protein gp5 gp5 gp5 gp5 gp7 gp10head-tail connector complex gp7 gp7 gp7 gp6head-tail connector complex gp8 gp8 gp8 gp8
tail protein gp10 gp10tail sheath protein gp13tail tube protein gp14
major tail protein gp11 gp11 gp11 gp11tail assembly protein gp12 gp12 gp12 gp12 gp15 gp16tail assembly protein gp13 gp13 gp13 gp13 gp16 gp17
tail tape measure protein gp14 gp14 gp14 gp14 gp17 gp18tail protein gp15 gp15 gp15 gp15 gp18 gp19
late control protein gp19baseplate assembly protein gp20head-tail connector protein gp21
baseplate wedge gp22baseplate protein gp23
tail protein gp16 gp16 gp16 gp16 gp24 gp20tail protein gp17 gp17 gp17 gp17 gp25
putative holin bhlA gp20 1 gp20 1 gp201 gp20 1 gp28 1 gp22N-acetylmuramoyl-L-alanine amidase gp21 gp21 gp21 gp21 gp29 gp23
putative holin gp22 2 gp23 2 gp23 2 gp22 2 gp30 2
ABC-like transporter protein gp24transposase gp30
putative toxin-like protein gp24transcriptional regulator MarR gp28
toxin gp27 gp24XRE family transcriptional regulator gp25
transcriptional regulator gp31ankyrin-repeat containing protein gp31 3
Arc-like DNA binding protein gp32putative holin-like toxin gp33
Cro/C1 family transcriptional regulator gp33 gp26site-specific recombinase gp27
stress protein gp35integrase gp29 gp37 gp37
metallo-endopeptidase ImmA/Irre gp38 gp38membrane protein gp33membrane protein gp34membrane protein gp35
dipeptidylaminopeptidase/acylaminoacyl-peptidase gp37
recombinase/Integrase gp40XRE family transcriptional regulator gp30 gp41 gp39 gp39 gp38 gp32XRE family transcriptional regulator gp42 gp40 gp40 gp42 gp33
Cro/C1 family transcriptional regulator gp31 gp43antirepressor AntA gp41
excisionase gp32 gp42restriction endonuclease gp42

Viruses 2018, 10, 377 15 of 29
Table 3. Cont.
Fern Harrison Vegas Dragolir Lily HalcyoneRha family regulatory protein gp35
antirepressor Rha gp34 gp44 gp49antirepressor gp38 gp49 gp38
XRE family transcriptional regulator gp41excisionase gp45
DNA repair protein RecN gp42 gp52DNA recombinational protein RecT gp44 gp54
metallo-hydrolase gp45 gp55primosome component protein gp47 gp57
DNA replication protein gp47replicative DNA helicase gp48 gp58 gp48
DNA primase gp49DNA methylase gp60
single-stranded DNA binding protein,ERF superfamily gp57
single-stranded DNA binding protein gp58 gp52putative phosphomannomutase gp54transcriptional regulator AbrB gp63 gp47replication terminator protein gp64 gp48
primosome, DnaD subunit gp61DNA replication protein gp62 4
chromosome segregation protein SMC gp66 5 gp50AAA domain ATPase gp67 6 gp51
DEAD/DEAH box helicase gp69 gp54ABC-type transport system gp70
DNA primase gp71 7 gp56DNA polymerase I with exonuclease
domain gp59
DNA polymerase family A gp61DEDDh 3′-5′ exonuclease gp63endodeoxyribonuclease gp65 gp73 gp58 gp65
DNA-N-6-adenine methyltransferase gp61DNA–cytosine methyltransferase gp67 gp62DNA-cytosine methyltransferase gp63
resolvase RuvC gp59 gp68ribonucleoside-diphosphate reductase
subunit alpha gp67
ribonucleoside-diphosphate reductasesubunit beta gp68
deoxyuridine 5′ triphosphatenucleotidohydrolase gp69
antitoxin MazE gp76deoxynucleoside monophosphate kinase gp80
RNA polymerase sigma factor gp75 gp60 gp82transcriptional regulator ArpU gp61 gp73 gp70transcriptional activator RinA gp77 gp61
tRNA-Pro(tgg) gp62serine recombinase gp72membrane protein gp74
toxin HicA gp79antitoxin HicB gp62 gp75 gp80 gp74
toxin HicA gp63 gp76 gp75Putative transglycosylase gp64 gp77 gp81
HNH endonuclease/restrictionendonuclease McrA gp65
HNH endonuclease gp65 gp78 gp84 gp661 Also has strong BLAST and CDD matches to bacteriocin; 2 Also has strong BLAST matches to transposase;.3 Alsohas strong BLAST matches to toxin-like protein, FAA hydrolase, RNA polymerase sigma factor, DNA processingprotein DprA, inositol phosphorylceramide, DNA Smf single strand binding protein, transcriptional regulatoryprotein YclJ, toxin, and transposase; 4 Also has equally strong BLAST and CDD matches to chromosomal replicationinitiator protein DnaA; 5 Also has equally strong BLAST matches to DNA recombination protein RecF; 6 Also hasstrong BLAST matches to oxidoreductase, putative DNA helicase, putative RecA NTPase, ATP-dependent Lonprotease; 7 Also has equally strong BLAST matches to RecA family ATPase.

Viruses 2018, 10, 377 16 of 29
3.4.1. Assembly Genes
Proteins involved in phage assembly include the small and large terminase, Clp proteases, and twotail assembly proteins. Genes coding for these functions were identified in most P. larvae phage genomes.In some genomes a capsid maturation protease or scaffolding protein was identified. Assembly genesare located at the front of the genome. The small and large terminase are usually the first two genes inthe genome, with the large terminase located downstream of the small terminase. A large terminasehas been identified in all P. larvae phage genomes, but a small terminase was not identified in theHalcyone cluster phages. In several genomes, the small terminase was identified by synteny, when a300-bp gene was found immediately upstream of the large terminase. All tail assembly proteins werealso found by synteny, as none had homology matches to known tail assembly proteins. However, it isknown that most Siphoviridae have two tail assembly proteins located between the major tail proteinand the tail tape measure protein [51,52]. Given that a tail tape measure protein was identified in allP. larvae phage genomes, and a major tail protein in almost all genomes, and that in all such instancesthere are only two genes between the major tail protein and the tape measure protein, we assigned tailassembly function to these two genes. This was further confirmed when we identified a translationalframeshift between these genes, as is commonly found in tailed bacteriophages [20–22,51,52].
3.4.2. Structural Genes
Structural genes are all located at the front end of the genome in all P. larvae phage genomes,comprising the majority of the first 20 genes in the genome. It is likely that genes of unknown functionlocated in the front end of the genome have either structural or assembly function. We identified aportal protein, a major capsid protein, a tail tape measure protein, and several tail proteins in everyP. larvae phage genome. The tail tape measure protein is encoded by the longest gene in the genome inall of the phages, ranging in length between 2514 bp (Lily) to 3705 bp (Harrison and Vegas clusters).Structural genes are conserved within clusters, however no structural gene is conserved across allclusters. The phams in which the portal protein, major capsid protein, and tape measure protein aredistributed, and the pham members are given in Table 4. Each of these three proteins is distributedin four phams. The portal protein and major capsid proteins are identically distributed, with onepham containing the Fern cluster, Harrison cluster, and four of the seven members of the Vegas cluster,one pham containing phages Dragolir, LincolnB and Wanderer, one pham consisting of phage Lilyonly, and one pham consisting of the DTR phages (Halcyone cluster). For the tape measure protein,one pham consists of the Fern cluster, one pham consists of the Harrison and Vegas clusters, one phamconsists of phage Lily only, and one pham consists of the Halcyone cluster.
Table 4. Pham distribution and composition of the portal protein, major capsid protein, and tapemeasure protein. Entries in boldface indicate clusters, with the number of phages in the clusterin parentheses.
Pham 1 Pham 2 Pham 3 Pham 4
Portal
Fern (30)Harrison (2)
DianeHayleyVadimVegas
DragolirLincolnBWanderer
Lily Halcyone (8)
Major capsid
Fern (30)Harrison (2)
DianeHayleyVadimVegas
DragolirLincolnBWanderer
Lily Halcyone (8)
Tail tapemeasure Fern (30)
Harrison(2)
Vegas (6)Lily Halcyone (8)

Viruses 2018, 10, 377 17 of 29
In a previous study of the Enterobacteriaceae phages, temperate phage nature correlated stronglywith major capsid protein (MCP) matches in bacterial chromosomes [53]. A TBLASTN study of theMCP from each of the representative phages supported a temperate nature in that each had a >70%amino acid identity (AAI) match in a bacterial genome (Table 5).
Table 5. Best TBLASTN match of selected P. larvae phage major capsid proteins to Paenibacillus larvaephage major capsid proteins in bacterial chromosomes.
Phage Best TBLASTN bacterial match Accession # E-value (AAI)
Fern Paenibacillus larvae subsp. Larvae strain Eric I CP019651 0.0(87%)Harrison Paenibacillus larvae subsp. Larvae strain Eric I CP019651 0.0(100%)
Vegas Paenibacillus larvae subsp. Larvae strain Eric I CP019651 0.0(100%)Dragolir Paenibacillus formosus strain NF2 CP018145 0.0(72%)
Lily Paenibacillus larvae subsp. Larvae strain Eric IV CP019659 0.0 (99%)Halcyone Paenibacillus larvae subsp. Larvae strain Eric IV CP019659 0.0 (100%)
3.4.3. Host Lysis Genes
All P. larvae phage are lytic in vitro, including those isolated from prophages such as Diane,PBL1c, and Xenia. Tailed phages lyse their host by means of a holin/amidase cassette consisting ofa hydrophobic holin protein that punctures the host’s inner plasma membrane and a hydrophilicamidase that cleaves the host peptidoglycan wall [54–56]. A N-acetylmuramoyl-L-alanine amidasehas been identified in all P. larvae phage genomes. This is the most studied P. larvae phage protein,being the subject of at least two studies, and the only P. larvae phage protein whose function has beenexperimentally verified [22,25]. It is the chief gene responsible for lysing P. larvae, by cleaving itspeptidoglycan cell wall [22,25].
A putative holin was identified in all P. larvae phage genomes immediately upstream ofthe N-acetylmuramoyl-L-alanine amidase. In most genomes this gene forms an operon with theN-acetylmuramoyl-L-alanine amidase. This gene also has strong homology matches to bacteriocinfunction. The N-acetylmuramoyl-L-alanine amidase and putative holin are both distributed in twophams, with the 40 cohesive ends phages in one pham, and the eight DTR phages in the other.All P. larvae phage genomes except those in the Halcyone group also encode an additional proteinwith putative holin function either immediately downstream of the N-acetylmuramoyl-L-alanineamidase or two genes downstream. This protein is of the same length as the putative holin locatedupstream of the N-acetylmuramoyl-L-alanine amidase, but also has homology matches to transposasefunction. Both putative holins have transmembrane domains as predicted by TMHMM and thistogether with their location in the genome (especially the upstream holin that forms an operon withthe N-acetylmuramoyl-L-alanine amidase) strongly suggests they may have holin function.
Phages in the Fern and Vegas clusters also encode a protein near the end of the genome that hashomology matches to tranglycosylase function. Transglycosylases, also known as glycosyltransferases,cleave glycosidic bonds in the host glycan, and are thus used by phages for host lysis [57,58]. Howeverthe E-value of the homology matches for this protein are only of the order of 1 × 10⁻⁶, and this genethus requires further investigation.
3.4.4. DNA Replication and Metabolism Genes
All P. larvae phage genomes contain numerous genes with putative functions related to DNAreplication and metabolism. These include transposases, integrases, endonucleases, excisionases,methyltransferases, and others. This is by far the largest and most diverse functional category.An integrase has been identified in all but 4 P. larvae phage genomes, suggesting that most if not all ofthese phages possess lysogenic ability. The exceptions are phages Halcyone, Heath, Scottie, and Unity,in whose genomes an integrase was not identified. The majority of P. larvae phage genomes alsoencode at least one transposase, with some phages having multiple different transposases. In addition,

Viruses 2018, 10, 377 18 of 29
many P. larvae phages genomes encode an excisionase in the middle of the genome and a HNHendonuclease at the very end of the genome. None of the DNA replication/metabolism genes arefound in all genomes or conserved across clusters, and are often not conserved even within clusters.
3.4.5. Regulatory Genes
All P. larvae phage genomes contain genes that regulate gene expression, whether in the host or thephage itself. These include XRE (xenobiotic response element), Cro/Cl, AbrB (ambiactive repressor)and ArpU (autolysin regulatory protein) family transcriptional regulators. In addition all phagesencode one or more different antirepressors. Many regulatory proteins, in particular the XRE-familytranscriptional regulators, contain a helix-turn-helix domain. However, little is known about thefunction of these proteins in the P. larvae phage life cycle. Regulatory genes are the least conservedgenes in P. larvae phage genomes, with no regulatory gene found in all genomes, or conserved acrossor within clusters.
3.4.6. Host-Related Genes
P. larvae phage genomes encode a variety of host-related proteins, such as toxins, ABC transporters,stress proteins, metallo-hydrolases, toxin–antitoxin systems, and others. Host-related genes arehighly heterogeneous with none of these genes widespread among P. larvae phage genomes. The soleexception is a toxin–antitoxin system found in all genomes except Lily. The toxin–antitoxin system,while widespread, is not conserved, being distributed into several phams. In some genomes the HicAtoxin gene is located in front of the HicB antitoxin gene, while the opposite is true in other genomes.
3.4.7. tRNA Genes
A single tRNA gene was found in the genome of phage Dragolir. This is a tRNA-Pro(tgg) genecoding for a tryptophan tRNA. No tRNA genes were identified in any other P. larvae phage genome.
3.5. Comparative Analysis of P. larvae Large Terminase and DNA Packaging Strategy
As the protein responsible for packaging newly produced phage genomes into empty capsids,the large terminase (LT) is central to the P. larvae phage life cycle. A large terminase has been identifiedin every P. larvae phage genome, but there are only 10 distinct large terminases, as many closely relatedphages have identical large terminases. We constructed a multiple alignment of the 10 distinct P. larvaephage large terminases, and the resulting amino acid sequence identity (AAI) distance matrix andphylogenetic tree shown in Figure 10. The full AAI distance matrix of all 48 P. larvae phage largeterminases is included as Supplementary Figure S2.
The 10 distinct P. larvae phage large terminases are distributed in four phams, in a manner identicalto the portal protein (Table 4), with which the large terminase forms an operon. LT pham 1, the largestpham, consists of the large terminases of the phages in the Fern and Harrison clusters, and phagesDiane, Vadim, Vegas and Hayley, LT pham 2 consists of the large terminases of phages Dragolir,Wanderer and LincolnB, LT pham 3 consists of the large terminase of phage Lily, and LT pham 4consists of the large terminases of the Halcyone cluster.
The large terminases in LT pham 1 all have >98% AAI with each other (Supplementary Figure S2).Of the 30 phages in the Fern cluster, 23 share an identical large terminase, represented in Figure 10 byFern. The large terminase shared by phages Tadhana, Honeybear, and Toothless differs by one aminoacid from the large terminase of Fern but is of the same length (574 aa), implying a silent point mutation.Similarly, the large terminase of phages Bloom, Genki and Gryphonian also differs from that of Fern bya single amino acid (albeit a different one than the large terminase of Tadhana). Phages BN12, Diane,Hayley, Harrison, Paisley, Vadim and Vegas (represented by Vegas in Figure 10) share an identicallarge terminase that differs by 10 amino acids from those of the Fern cluster. The presence of phageBN12, a Fern cluster phage, in this group is unexpected, as this phage has more than 90% ANI with

Viruses 2018, 10, 377 19 of 29
phages in the Fern cluster and less than 50% ANI with phages in the Harrison and Vegas clusters,yet its large terminase is identical to that of the Harrison and Vegas cluster phages.
LT pham 2 consists of the large terminase shared by phages Dragolir, LincolnB and Wanderer,which is considerably shorter (530 aa) than and highly divergent from the large terminases of LTpham 1. This is despite the fact that phages Dragolir, LincolnB and Wanderer use the same DNApackaging strategy as the phages in LT pham 1 (3′ cohesive ends) and are in the same cluster withthe Vegas subcluster phages. It is thus apparent that the large terminase amino acid sequencedoes not align DNA packaging strategy or cluster assignment based on whole-genome sequencesimilarity. Phages within the same cluster can have dissimilar large terminases (e.g., Vegas andDragolir), while phages in different clusters may have very similar large terminases (e.g., Fern andVegas). Additionally, phages with the same DNA packaging strategy may have highly divergent largeterminases (e.g., Fern and Dragolir).
LT pham 3 consists of the large terminases of the Halcyone cluster. This pham consists of fourdistinct large terminases, which are all of the same length (594 aa) and are overall highly similar to oneanother (greater than 97% AAI). These large terminases are longer than and have only ~12% AAI withthe large terminases of LT pham 1 and LT pham 2. Low AAI is expected, as these phages use the DTRDNA packaging strategy.
LT pham 4 consists of the large terminase of phage Lily, an outlier that has less than 10%AAI with any other P. larvae phage large terminase. This value is lower than even the percent AAIbetween the large terminase of P. larvae phages and the large terminase of phages from different hosts(e.g., Mycobacterium, Brevibacillus). This is somewhat unexpected, as phage Lily uses the 5′ cohesiveends DNA packaging strategy, and we would expect it to have a large terminase somewhat similar tothat of the 3′ cohesive ends phages.
Large terminase phams are highlighted in different colors in the phylogenetic tree (Figure 10b),with LT pham 1 in blue, LT pham 2 in green, LT pham 3 in ref, and LT pham 4 in yellow. The highsimilarity of the large terminases of the 3′ cohesive ends phage (with the exception of the Dragolirsubcluster) is reflected by the short branch lengths in that section of the tree (blue). Similarly, the highsimilarity of the DTR phage large terminases is reflected in the very short lengths in their region of thetree (red), while the highly divergent large terminase of Lily has the longest branch length.
Viruses 2018, 10, x 20 of 30
the Vegas subcluster phages. It is thus apparent that the large terminase amino acid sequence does
not align DNA packaging strategy or cluster assignment based on whole-genome sequence
similarity. Phages within the same cluster can have dissimilar large terminases (e.g., Vegas and
Dragolir), while phages in different clusters may have very similar large terminases (e.g., Fern and
Vegas). Additionally, phages with the same DNA packaging strategy may have highly divergent
large terminases (e.g., Fern and Dragolir).
LT pham 3 consists of the large terminases of the Halcyone cluster. This pham consists of four
distinct large terminases, which are all of the same length (594 aa) and are overall highly similar to
one another (greater than 97% AAI). These large terminases are longer than and have only ~12% AAI
with the large terminases of LT pham 1 and LT pham 2. Low AAI is expected, as these phages use
the DTR DNA packaging strategy.
LT pham 4 consists of the large terminase of phage Lily, an outlier that has less than 10% AAI
with any other P. larvae phage large terminase. This value is lower than even the percent AAI between
the large terminase of P. larvae phages and the large terminase of phages from different hosts (e.g.,
Mycobacterium, Brevibacillus). This is somewhat unexpected, as phage Lily uses the 5′ cohesive ends
DNA packaging strategy, and we would expect it to have a large terminase somewhat similar to that
of the 3′ cohesive ends phages.
Large terminase phams are highlighted in different colors in the phylogenetic tree (Figure 10b),
with LT pham 1 in blue, LT pham 2 in green, LT pham 3 in ref, and LT pham 4 in yellow. The high
similarity of the large terminases of the 3′ cohesive ends phage (with the exception of the Dragolir
subcluster) is reflected by the short branch lengths in that section of the tree (blue). Similarly, the high
similarity of the DTR phage large terminases is reflected in the very short lengths in their region of
the tree (red), while the highly divergent large terminase of Lily has the longest branch length.
(a)
Figure 10. Cont.
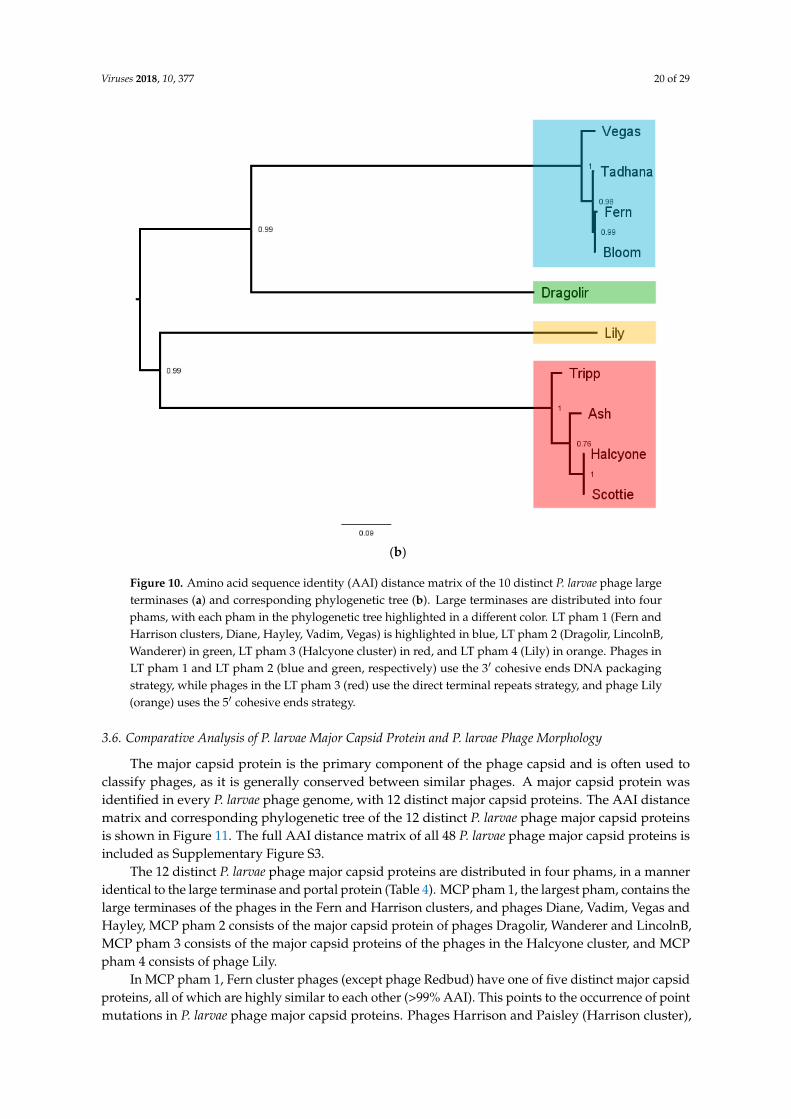
Viruses 2018, 10, 377 20 of 29Viruses 2018, 10, x 21 of 30
(b)
Figure 10. Amino acid sequence identity (AAI) distance matrix of the 10 distinct P. larvae phage large
terminases (a) and corresponding phylogenetic tree (b). Large terminases are distributed into four
phams, with each pham in the phylogenetic tree highlighted in a different color. LT pham 1 (Fern and
Harrison clusters, Diane, Hayley, Vadim, Vegas) is highlighted in blue, LT pham 2 (Dragolir,
LincolnB, Wanderer) in green, LT pham 3 (Halcyone cluster) in red, and LT pham 4 (Lily) in orange.
Phages in LT pham 1 and LT pham 2 (blue and green, respectively) use the 3′ cohesive ends DNA
packaging strategy, while phages in the LT pham 3 (red) use the direct terminal repeats strategy, and
phage Lily (orange) uses the 5′ cohesive ends strategy.
Figure 10. Amino acid sequence identity (AAI) distance matrix of the 10 distinct P. larvae phage largeterminases (a) and corresponding phylogenetic tree (b). Large terminases are distributed into fourphams, with each pham in the phylogenetic tree highlighted in a different color. LT pham 1 (Fern andHarrison clusters, Diane, Hayley, Vadim, Vegas) is highlighted in blue, LT pham 2 (Dragolir, LincolnB,Wanderer) in green, LT pham 3 (Halcyone cluster) in red, and LT pham 4 (Lily) in orange. Phages inLT pham 1 and LT pham 2 (blue and green, respectively) use the 3′ cohesive ends DNA packagingstrategy, while phages in the LT pham 3 (red) use the direct terminal repeats strategy, and phage Lily(orange) uses the 5′ cohesive ends strategy.
3.6. Comparative Analysis of P. larvae Major Capsid Protein and P. larvae Phage Morphology
The major capsid protein is the primary component of the phage capsid and is often used toclassify phages, as it is generally conserved between similar phages. A major capsid protein wasidentified in every P. larvae phage genome, with 12 distinct major capsid proteins. The AAI distancematrix and corresponding phylogenetic tree of the 12 distinct P. larvae phage major capsid proteinsis shown in Figure 11. The full AAI distance matrix of all 48 P. larvae phage major capsid proteins isincluded as Supplementary Figure S3.
The 12 distinct P. larvae phage major capsid proteins are distributed in four phams, in a manneridentical to the large terminase and portal protein (Table 4). MCP pham 1, the largest pham, contains thelarge terminases of the phages in the Fern and Harrison clusters, and phages Diane, Vadim, Vegas andHayley, MCP pham 2 consists of the major capsid protein of phages Dragolir, Wanderer and LincolnB,MCP pham 3 consists of the major capsid proteins of the phages in the Halcyone cluster, and MCPpham 4 consists of phage Lily.
In MCP pham 1, Fern cluster phages (except phage Redbud) have one of five distinct major capsidproteins, all of which are highly similar to each other (>99% AAI). This points to the occurrence of pointmutations in P. larvae phage major capsid proteins. Phages Harrison and Paisley (Harrison cluster),

Viruses 2018, 10, 377 21 of 29
Diane, Hayley, Vadim and Vegas (Vegas cluster) have an identical major capsid protein, which has 87%AAI with those of the Fern cluster, and is thus in the same pham. The high mutual similarity of themajor capsid proteins in MCP pham 1 is reflected in the branch lengths in Figure 11b. An outlier inthis pham is phage Redbud, whose major capsid has only 81% AAI with the Fern cluster major capsidproteins, even though it has >99% ANI with phages Rani and Kiel007 in the Fern cluster.
MCP pham 2 consists of the major capsid protein of Phages Dragolir, LincolnB and Wanderer.This major capsid protein is very divergent from the major capsid proteins in MCP pham 1(11% AAI on average), even though these three phages have ~60% ANI with phages in the Vegascluster. It thus appears that phages in different clusters can have similar major capsid proteins(e.g., Fern and Harrison), but phages in the same cluster can have very dissimilar major capsidproteins (e.g., Vegas and Dragolir).
MCP pham 3 consists of the major capsid protein of the phages in the Halcyone cluster. This phamconsists of 3 distinct major capsid proteins, all with >94% AAI to each other. The major capsid proteinshave ~10% AAI with those in the MCP phams 1 and 2. MCP pham 4 consists of the major capsidprotein of phage Lily, which is the most divergent of all (>10% AAI with any other MCP).
Electron micrographs of several P. larvae phages are shown in Figure 12. Additional micrographsof P. larvae phages have been published [10,15,20,27]. All known P. larvae phages are of the Siphoviridaemorphotype with long, filamentous, non-contractile tails approximately 150 nm in length. Images in thefirst six panels of electron micrographs (Figure 12A–F) are phages from the Fern cluster (MCP pham 1),while Figure 12G shows phage Wanderer (Vegas cluster, MCP pham 2) and Figure 12H shows phageAsh (Halcyone cluster, MCP pham 3). Phage PBL1c (Figure 12E) was originally isolated in the 1980s,and the new electron micrograph taken for this publication show an identical virion structure tothat in the electron micrographs of this phage taken in 1983 [10]. Of the six phages in MCP pham1, four (Eltigre, Bloom, Toothless, PBL1c) have prolate capsids approximately 100 nm by 50 nm,while phages BN12 and Pagassa have round capsids approximately 80 nm in diameter. Despite havinga different capsid shape, phages BN12 and Eltigre have an identical major capsid protein. The sameis true of phages Pagassa and PBL1c. Phage Wanderer has a prolate capsid similar to that of phagesToothless and PBL1c, even though its major capsid protein is in MCP pham 2 and very divergent fromthose of MCP pham 1. From these results it appears that the amino acid sequence of the major capsidprotein does not correlate with capsid shape, as phages with identical major capsid proteins can havedifferent capsid shapes (e.g., Eltigre and BN12), while phages with highly divergent major capsidproteins can have similar capsid shapes (e.g., Wanderer and Toothless). In addition, no differencesin the amino acid sequence of the portal proteins were correlated with capsid morphology whenexamining the Fern cluster. Phage Ash, whose pham is in MCP pham 3, has an icosahedral capsid,wholly different from that of the MCP pham 1 and MCP pham 2 phages.

Viruses 2018, 10, 377 22 of 29
Viruses 2018, 10, x 23 of 30
MCP pham 3, has an icosahedral capsid, wholly different from that of the MCP pham 1 and MCP
pham 2 phages.
(a)
(b)
Figure 11. AAI distance matrix of the 10 distinct P. larvae phage major capsid proteins (a) and
corresponding phylogenetic tree (b). Major capsid proteins are distributed into four phams, with each
pham in the phylogenetic tree highlighted in a different color. MCP pham 1 (Fern and Harrison
clusters, Diane, Hayley, Vadim, Vegas) is highlighted in blue, MCP pham 2 (Dragolir, LincolnB,
Wanderer) in green, MCP pham 3 (Halcyone cluster) in red, and MCP pham 4 (Lily) in orange.
Figure 12. Electron micrographs of phages from the Fern cluster: (A) Eltigre; (B) Bloom; (C) Toothless;
(D) BN12; (E) PBL1c; (F) Pagassa from the Vegas cluster: (G) Wanderer; and from the Halcyone
cluster: (H) Ash.
Figure 11. AAI distance matrix of the 10 distinct P. larvae phage major capsid proteins (a) andcorresponding phylogenetic tree (b). Major capsid proteins are distributed into four phams, with eachpham in the phylogenetic tree highlighted in a different color. MCP pham 1 (Fern and Harrison clusters,Diane, Hayley, Vadim, Vegas) is highlighted in blue, MCP pham 2 (Dragolir, LincolnB, Wanderer) ingreen, MCP pham 3 (Halcyone cluster) in red, and MCP pham 4 (Lily) in orange.
Viruses 2018, 10, x 23 of 30
MCP pham 3, has an icosahedral capsid, wholly different from that of the MCP pham 1 and MCP
pham 2 phages.
(a)
(b)
Figure 11. AAI distance matrix of the 10 distinct P. larvae phage major capsid proteins (a) and
corresponding phylogenetic tree (b). Major capsid proteins are distributed into four phams, with each
pham in the phylogenetic tree highlighted in a different color. MCP pham 1 (Fern and Harrison
clusters, Diane, Hayley, Vadim, Vegas) is highlighted in blue, MCP pham 2 (Dragolir, LincolnB,
Wanderer) in green, MCP pham 3 (Halcyone cluster) in red, and MCP pham 4 (Lily) in orange.
Figure 12. Electron micrographs of phages from the Fern cluster: (A) Eltigre; (B) Bloom; (C) Toothless;
(D) BN12; (E) PBL1c; (F) Pagassa from the Vegas cluster: (G) Wanderer; and from the Halcyone
cluster: (H) Ash.
Figure 12. Electron micrographs of phages from the Fern cluster: (A) Eltigre; (B) Bloom; (C) Toothless;(D) BN12; (E) PBL1c; (F) Pagassa from the Vegas cluster: (G) Wanderer; and from the Halcyone cluster:(H) Ash.

Viruses 2018, 10, 377 23 of 29
3.7. Comparative Analysis of P. larvae Phage N-acetylmuramoyl-L-alanine Amidase
A N-acetylmuramoyl-L-alanine amidase was identified in every P. larvae phage genome,with 12 distinct N-acetylmuramoyl-L-alanine amidases. The AAI distance matrix and correspondingphylogenetic tree of the 12 distinct N-acetylmuramoyl-L-alanine amidases is shown in Figure 13.The full AAI distance matrix of all 48 P. larvae phage N-acetylmuramoyl-L-alanine amidase is includedas Supplementary Figure S4.
Viruses 2018, 10, x 24 of 30
3.7. Comparative Analysis of P. larvae Phage N-acetylmuramoyl-L-alanine Amidase
A N-acetylmuramoyl-L-alanine amidase was identified in every P. larvae phage genome, with 12
distinct N-acetylmuramoyl-L-alanine amidases. The AAI distance matrix and corresponding
phylogenetic tree of the 12 distinct N-acetylmuramoyl-L-alanine amidases is shown in Figure 13. The
full AAI distance matrix of all 48 P. larvae phage N-acetylmuramoyl-L-alanine amidase is included as
Supplementary Figure S4.
(a)
(b)
Figure 13. AAI distance matrix (a) and phylogenetic tree (b) of the 20 distinct P. larvae phage N-
acetylmuramoyl-L-alanine amidases. These are distributed into two phams, one that contains the
amidases of all cohesive ends phages (blue), and one that contains the amidases of the Direct Terminal
Repeats (DTR) phages (red).
The N-acetylmuramoyl-L-alanine amidases are distributed in two phams. The two phams are
very distinct, with one pham containing the N-acetylmuramoyl-L-alanine amidases of the cohesive
ends phages (Amidase pham 1) and the other containing the N-acetylmuramoyl-L-alanine amidases
of the DTR phages (Amidase pham 2). The two phams are highly divergent, with only ~12% AAI
between them. On the other hand, the within-pham similarity is quite high: The N-acetylmuramoyl-
Figure 13. AAI distance matrix (a) and phylogenetic tree (b) of the 20 distinct P. larvae phageN-acetylmuramoyl-L-alanine amidases. These are distributed into two phams, one that containsthe amidases of all cohesive ends phages (blue), and one that contains the amidases of the DirectTerminal Repeats (DTR) phages (red).
The N-acetylmuramoyl-L-alanine amidases are distributed in two phams. The two phams are verydistinct, with one pham containing the N-acetylmuramoyl-L-alanine amidases of the cohesive ends

Viruses 2018, 10, 377 24 of 29
phages (Amidase pham 1) and the other containing the N-acetylmuramoyl-L-alanine amidases of theDTR phages (Amidase pham 2). The two phams are highly divergent, with only ~12% AAI betweenthem. On the other hand, the within-pham similarity is quite high: The N-acetylmuramoyl-L-alanineamidases of Amidase pham 1 all have greater than 90% AAI with each other, and theN-acetylmuramoyl-L-alanine amidases of Amidase pham 2 all have greater than 94% AAI witheach other. The divergence between the two phams is reflected in the length of the two mainbranches of the phylogenetic tree in Figure 13b, while the relative homogeneity of the two phams isreflected by the short length of the branches within each pham. The most divergent of the cohesiveends N-acetylmuramoyl-L-alanine amidases are those of phages Harrison, LincolnB, and Wanderer,while the most divergent of the DTR N-acetylmuramoyl-L-alanine amidases is that of phage Tripp.Interestingly, while the structural and assembly proteins of phage Lily are very divergent from thoseof all other P. larvae phages, its N-acetylmuramoyl-L-alanine amidase is very similar (>90% AAI) withthose of the other cohesive ends phages. The N-acetylmuramoyl-L-alanine amidase thus appears to bethe most conserved gene in the P. larvae phage genome.
The N-acetylmuramoyl-L-alanine amidases of the cohesive ends phages (Amidase pham 1) areall in the 223–225 aa length range, thus >90% AAI implies less than 22 amino acids different at most.The N-acetylmuramoyl-L-alanine amidases of the DTR phages are all 289 aa long and differ from eachother by no more than 15 amino acids at most. Phages within the same subcluster (e.g., the DevRi,Kiel007, Shelly, Vegas, Harrison, and Halcyone subclusters) have identical N-acetylmuramoyl-L-alanineamidases with the other members of their subcluster. The sole exception to this is the Fern subcluster,which contains several N-acetylmuramoyl-L-alanine amidases that are each slightly different fromeach other. It thus appears the N-acetylmuramoyl-L-alanine amidases generally align with cluster andsubcluster assignments based on whole-genome sequence similarity.
4. Discussion
In this study, we have analyzed and compared the genomes of all 48 currently sequenced andannotated P. larvae phage genomes. This number stood at zero as of 2012, reached 1 by 2014, 18 by 2016,and 48 as of this year. P. larvae phages were isolated from sources such as soil underneath hives,beehive products, bees, and beeswax-containing commercial products. A significant number wereisolated from P. larvae lysogens. Of the 48 sequenced P. larvae phages, 46 were isolated in the UnitedStates and two in Western Europe.
A major distinction between P. larvae phages can be drawn using the phages’ DNA packagingstrategy. Of the 48 P. larvae phages, 39 use the 3′ cohesive ends DNA packaging strategy, one usesthe 5′ cohesive ends DNA packaging strategy, and eight use the direct terminal repeats (DTR) DNApackaging strategy. Sequence similarity between phages that use different DNA packaging strategies isvery low, thus the broadest way to classify P. larvae phages is according to the DNA packaging strategythey use.
We place P. larvae phage genomes into clusters and subclusters based on four different methods(ANI, gene content, dot plots, BLASTN). Clusters and subclusters are named after the member withthe highest average ANI with other cluster members. All four classification methods produce identicalresults, organizing P. larvae phage genomes into four clusters and one singleton. The Fern cluster is thelargest cluster, containing 30 of the 48 P. larvae phage genomes, while the Harrison cluster containsonly two phages and phage Lily is a singleton. It is not known if this discrepancy in cluster size is dueto sampling bias or is a reflection of P. larvae phage biology. Given that the majority of the 48 P. larvaephages were isolated the western United States, it does appear that some P. larvae phages are morecommon than others. On the other hand, geography seems to have no role in the distribution ofP. larvae phage diversity, as there are multiple of instances of divergent phages isolated from the samenarrow geographical area, and phages from widely separated geographical areas showing a very highdegree of sequence similarity.

Viruses 2018, 10, 377 25 of 29
The overall picture of P. larvae phage systematics has both changed somewhat but also remainedsimilar since the last publication in this area [27]. The former cluster A has been split into the Harrisonand Vegas clusters, the former still only containing two phages while the size of the latter increased by3 phages. The former cluster B, now renamed the Fern cluster, still contains the majority of P. larvaephages and contains several subclusters and singletons. Previously identified subclusters have grownin size, and a new one (DevRi) has been added, while several phages that were formerly singletonsstill remain so, and several singletons have been added to this cluster. Phage Lily remains a singleton,while a new cluster, the Halcyone cluster has been added. Phage Lily remains the only P. larvae phagethat uses the 5′ cohesive ends strategy and is very divergent from all other P. larvae phages.
Pairwise genome map comparisons show that within clusters, the front and rear portions of thegenome are conserved, while the middle of the genome is often divergent. Pairwise genome mapcomparisons also reveal several instances of possible horizontal gene transfer between closely related,but also between unrelated phages. Several phages appear to be missing genes present in closelyrelated phages, while some phages appear to be missing large genome regions present in closelyrelated phages. There are also several instances of very closely related phages differing by less than40 base pairs, with the minimum difference between two phages being only 2 bases (Fern and Willow).Nevertheless, differences of even one base pair are sufficient to result in different amino acid sequences.
The size of P. larvae phage genomes ranges from 35 kbp to 56 kbp, with the majority of genomesin the 38–45 kbp range. A major distinction in genome length exists between the cohesive ends phagesand the DTR phages, with the cohesive ends phages having genomes exclusively in the 35–45 kbprange, and the DTR phages having genomes exclusively in the 50–55 kbp range. The DTR phages alsohave higher GC content. It is not known what role these differences play in the P. larvae phage lifecycle, as all known P. larvae phages are lytic in vitro but appear to be temperate based on close MCPhomologs found in bacterial genomes (Table 5). The number of genes in the P. larvae phage genomeranges from 58 to 91, with the number of genes scaling linearly with genome size.
Bioinformatics tools identify functions for approximately half of P. larvae phage proteins, which isrelatively high for bacteriophages. We identified proteins with the following functions in all 48 P. larvaephage genomes: (1) large terminase; (2) portal protein; (3) major capsid protein; (4 & 5) two tail assemblyproteins; (6) tail tape measure protein; (7) N-acetylmuramoyl-L-alanine amidase; (8) a putative holin;and (9) several tail proteins. We classified P. larvae phage protein function as (1) virion assembly;(2) structural; (3) lysis; (4) DNA replication/metabolism; (5) regulatory; and (6) host-related. Assemblyand structural genes are located at the front of the genome and tend to be conserved within clusters,in common with many tailed phages [59]. Lysis genes are located immediately downstream of structuraland assembly genes and also tend to be conserved within clusters. An N-acetylmuramoyl-L-alanineamidase gene was identified in all P. larvae phage genomes. This gene codes for the P. larvae phageendolysin. It is flanked upstream and downstream by two putative holin genes whose productscontain a transmembrane domain. However, holins are poorly conserved and difficult to identifybioinformatically as the homology matches of the putative holins are poor. A putative transglycosylasehas also been identified in some P. larvae phage genomes and could serve as a complementary endolysin.More work is needed to identify the lytic mechanisms of P. larvae phages and the genes involved.
DNA replication/metabolism genes and regulatory genes are located in the middle and rearportions of P. larvae phage genomes. Genes of this type are not conserved even within clusters, and theirrole in the P. larvae life cycle is often poorly known. The majority of P. larvae phage genomes containan integrase and one or more transposases, thus it is likely that the majority of P. larvae phages havelysogenic ability. This hypothesis is supported by the fact that TBLASTN searches of several phagemajor capsid proteins show t least a 70% match with bacterial genomes (Table 5). Integrases wereidentified in all but four phages (Halcyone, Heath, Scottie, and Unity). Halcyone and Heath wereisolated from soil underneath healthy hives, making them ideal candidates for treatment of P. larvaeinfections of honeybee hives. All P. larvae phage genomes encode host-related genes, with severalhaving potentially significant functions, such as toxins and metallo-hydrolases.

Viruses 2018, 10, 377 26 of 29
We performed a comparative analysis of three P. larvae phage proteins: the large terminase, themajor capsid protein, and the N-acetylmuramoyl-L-alanine amidase, each of which was identifiedin all 48 P. larvae phage genomes. The large terminases are distributed into four phams, with onepham containing the majority (34) of the large terminases. Phages with the same DNA packagingstrategy tend to have very similar large terminases, often differing by no more than one or two aminoacids, while showing very little similarity with the large terminases of phages that employ a differentDNA packaging strategy. An exception to this pattern is the large terminase of the 3’ cohesive endsphages Dragolir, LincolnB and Wanderer, which is very divergent from the large terminase of all otherP. larvae phages that use the 3′ cohesive ends DNA packaging strategy. The major capsid protein isdistributed in the same phams as the large terminase. Capsid shape is not correlated with major capsidprotein, as phages with the same major capsid protein can have different capsids, and phages withidentically-shaped capsids can have divergent major capsid proteins. The N-acetylmuramoyl-L-alanineamidases are grouped into two phams, one that contains the N-acetylmuramoyl-L-alanine amidasesof the P. larvae phages that use the cohesive ends DNA packaging strategy and one that containsthe N-acetylmuramoyl-L-alanine amidases of P. larvae phages that use the DTR packaging strategy.Within phams, differences between N-acetylmuramoyl-L-alanine amidases tend to be small. It iscurrently not known why there are two distinct types of N-acetylmuramoyl-L-alanine amidase andwhy they correlate with DNA packaging strategy, and what this means for the P. larvae phage the lifecycle, as both the DTR and cohesive ends phages are roughly equally competent at lysing P. larvae.Of the three proteins comparatively analyzed, the N-acetylmuramoyl-L-alanine amidase is the onethat most closely aligns with phage cluster grouping based on whole genome sequence similarity,as phages within the same subcluster tended to have very similar N-acetylmuramoyl-L-alanineamidases. The N-acetylmuramoyl-L-alanine amidase appears to be the most conserved P. larvaephage protein, as it is distributed in only two phams, with even the highly divergent phage Lily havinga N-acetylmuramoyl-L-alanine amidase that is very similar to those of other phages. Point mutationsappear to be frequent in P. larvae phage genomes, as there are many instances of large terminases,major capsid proteins, and N-acetylmuramoyl-L-alanine amidases of different phages differing by onlyone or two amino acids.
The number of sequenced P. larvae phage genomes has grown rapidly in recent years, as they areof great interest in combating AFB. Our comparative genomic study builds on previous work and weexpect the field of P. larvae phage genomics to grow further in the future. Key areas of further studyare: (1) the identification of the function of more P. larvae phage proteins, especially in the laboratoryas opposed to bioinformatically; (2) precise identification of the mechanisms by which P. larvae phageslyse their hosts, including identification of P. larvae phage holins and the role of transglycosylase;and (3) the role of phage-encoded beta-lactamases and toxins in P. larvae antibiotic resistance andvirulence. Other areas of interest are the mechanism by which P. larvae phages penetrate their host,the mechanisms by which P. larvae phages enter and exit lysogeny, identifying uses of P. larvae phageproteins for biotechnology applications, and understanding how P. larvae defend against infectionfrom phages.
Supplementary Materials: The following are available online at http://www.mdpi.com/1999-4915/10/7/377/s1,Figure S1. Complete ANI distance matrix of all P. larvae phage genomes. Figure S2. Complete AAI distance matrixof all P. larvae phage large terminases. Figure S3. Complete AAI distance matrix of all P. larvae phage major capsidproteins. Figure S4. Complete AAI distance matrix of all P. larvae phage N-acetylmuramoyl-L-alanine amidases.Table S1. Complete list of all P. larvae phage protein phams and their members. Table S2. Complete list of all P.larvae phage genes and their function.
Author Contributions: Conceptualization, P.K.T., J.H.G., and S.H.; Methodology, P.K.T., E. C-.N., J.H.G., and S.H.;Software, C.S., P.K.T., C.P.F., K.N.M.; Validation, P.K.T., J.H.G., and S.H.; Formal Analysis, P.K.T.; Investigation, C.S.,C.P.F., J.K.W., K.N.M., E.C.-N., J.H.G., S.H., and P.K.T.; Resources, E.C.-N., J.H.G., S.H., and P.K.T; Data Curation,C.S., C.P.F., J.K.W., S.H., and P.K.T.; Writing – Original Draft Preparation, P.K.T.; Writing – Review & Editing,J.H.G., S.H., P.K.T.; Visualization, C.S., C.P.F., K.N.M., E.C.-N., J.H.G., S.H., P.K.T.; Supervision, E.C.-N., S.H.,and P.K.T; Project Administration, P.K.T.; Funding Acquisition, P.K.T.

Viruses 2018, 10, 377 27 of 29
Funding: Research at UNLV was funded by National Institute of General Medical Sciences grant GM103440(NV INBRE), the UNLV School of Life Sciences, and the UNLV College of Sciences. E.C.-N. was funded byCONICYT-FONDECYT de iniciación en la investigación 11160905. Research at BYU was funded by the BYUMicrobiology & Molecular Biology Department, and private donations through LDS Philanthropies.
Acknowledgments: The authors thank Edwin Wilcox and his staff at the BYU sequencing center and MichaelStanding at the BYU Microscopy center. The authors are grateful to Douglas Dingman at the ConnecticutAgricultural Experiment Station, New Haven, for finding and donating frozen samples of PBL1c phage, which heisolated in 1984 and archived to make possible this phage’s sequencing. We further thank students in the BYUPhage Hunters course, and undergraduate students at BYU and UNLV who assisted in the project as mentoredresearch assistants.
Conflicts of Interest: The authors declare no conflict of interest. The founding sponsors, including private donorsthrough LDS Philanthropies, had no role in the design of the study; in the collection, analyses, or interpretation ofdata; in the writing of the manuscript, and in the decision to publish the results.
References
1. Genersch, E. American Foulbrood in honeybees and its causative agent, Paenibacillus larvae. J. Invertebr. Pathol.2009, 103, S10–S19. [CrossRef] [PubMed]
2. Murray, K.D.; Aronstein, K.A. Oxytetracycline-resistance in the honey bee pathogen Paenibacillus larvae isencoded on novel plasmid pMA67. J. Apic. Res. 2006, 45, 207–214. [CrossRef]
3. Miyagi, T.; Peng, C.Y.; Chuang, R.Y.; Mussen, E.C.; Spivak, M.S.; Doi, R.H. Verification ofoxytetracycline-resistant American foulbrood pathogen Paenibacillus larvae in the United States.J. Invertebr. Pathol. 2000, 75, 95–96. [CrossRef] [PubMed]
4. Tian, B.; Fadhil, N.H.; Powell, J.E.; Kwong, W.K.; Moran, N.A. Long-term exposure to antibiotics has causedaccumulation of resistance determinants in the gut microbiota of honeybees. MBio 2012, 3, e00377-12.[CrossRef] [PubMed]
5. Gochnauer, T.A. The isolation of a bacteriophage (bacterial virus) from Bacillus larvae. Bee World 1955, 36,101–103. [CrossRef]
6. Gochnauer, T.A. Some properties of a bacteriophage from Bacillus larvae. J. Invertebr. Pathol. 1970, 15, 149–156.[CrossRef]
7. Valerianov, T.; Popova, A.; Toshkov, A.S. Isolation from the soil of a bacteriophage lysing Bacillus larvae.Acta Microbiol. Virol. Immunol. 1976, 4, 81–85.
8. Drobnikova, V.; Ludvik, J. Bacteriophage of Bacillus larvae. J. Apic. Res. 1982, 21, 53–56. [CrossRef]9. Benada, O.; Ludvik, J.; Drobnikova, V. Morphology of a new bacteriophage isolated from Bacillus larvae.
Folia Microbiol. 1984, 29, 520–521. [CrossRef]10. Dingman, D.W.; Bakhiet, N.; Field, C.C.; Stahly, D.P. Isolation of two bacteriophages from Bacillus larvae,
PBL1 and PBL0.5, and partial characterization of PBL1. J. Gen. Virol. 1984, 65, 1101–1105. [CrossRef][PubMed]
11. Bakhiet, N.; Stahly, D.P. Properties of clear plaque mutants of the Bacillus larvae bacteriophages PBL0.5 andPBL 2. J. Invertebr. Pathol. 1988, 52, 78–83. [CrossRef]
12. Campana, C.F.; Bakhiet, N.; Stahly, D.P. Morphology of Bacillus larvae bacteriophage PBL3 and physical mapof its DNA. J. Invertebr. Pathol. 1991, 57, 141–143. [CrossRef]
13. Stahly, D.P.; Alippi, A.M.; Bakhiet, N.; Campana, C.F.; Novak, C.C.; Cox, R. PPL1c, a virulent mutantbacteriophage useful for identification of Paenibacillus larvae subspecies larvae. J. Invertebr. Pathol. 1999, 74,295–296. [CrossRef] [PubMed]
14. Oliveira, A.; Melo, L.D.R.; Kropinski, A.M.; Azeredo, J. Complete genome sequence of the broad-host-rangePaenibacillus larvae phage philBB_P123. Genome Announc. 2013, 1, e00438-13. [CrossRef] [PubMed]
15. Beims, H.; Wittman, J.; Bunk, B.; Sproer, C.; Rohde, C.; Gunther, G.; Rohde, M.; von der Ohe, W.; Steinert, M.Paenibacillus larvae–Directed bacteriophage HB10c2 and its application in American Foulbrood-affectedhoney bee larvae. Appl. Environ. Microbiol. 2015, 81, 5411–5419. [CrossRef] [PubMed]
16. Carson, S.; Bruff, E.; DeFoor, W.; Dums, J.; Groth, A.; Hatfield, T.; Iyer, A.; Joshi, K.; McAdams, S.;Miles, D.; et al. Genome sequences of six Paenibacillus larvae Siphoviridae phages. Genome Announc. 2015, 3,e00101-15. [CrossRef] [PubMed]

Viruses 2018, 10, 377 28 of 29
17. Abraham, J.; Bousquet, A.-C.; Bruff, E.; Carson, N.; Clark, A.; Connell, A.; Davis, Z.; Dums, J.;Everington, C.; Groth, A.; et al. Paenibacillus larvae Phage Tripp Genome Has 378-Base-Pair TerminalRepeats. Genome Announc. 2016, 4, e01498-15. [CrossRef] [PubMed]
18. Tsourkas, P.K.; Yost, D.; Krohn, A.; Leblanc, L.; Zhang, A.; Stamereilers, C.; Amy, P.S. Complete genomesequences of nine phages capable of infecting Paenibacillus larvae, the causative agent of American Foulbrooddisease of honeybees. Genome Announc. 2015, 3, e01120-15. [CrossRef] [PubMed]
19. Walker, J.K.; Merrill, B.D.; Berg, J.A.; Dhalai, A.; Dingman, D.W.; Fajardo, C.P.; Graves, K.; Hill, H.L.;Hilton, J.A.; Imahara, C.; et al. Complete genome sequences of Paenibacillus larvae phages BN12, Dragolir,Kiel007, Leyra, Likha, Pagassa, PBL1c, and Tadhana. Genome Announc. 2018, 6, e01601-17. [CrossRef]
20. Merrill, B.D.; Fajardo, C.P.; Hilton, J.A.; Payne, A.M.; Ward, A.T.; Walker, J.K.; Dhalai, A.; Imahara, C.;Mangohig, J.; Monk, J.; et al. Complete genome sequences of eighteen Paenibacillus larvae phages.Genome Announc. 2018, 24, e01602-17.
21. Yost, D.; Chang, C.; LeBlanc, C.; Cassin, E.; Peterman, C.; Rai, P.; Salisbury, A.; Barroga, N.; Cisneros, R.;Fersini, J.; et al. Complete genome sequences of four Paenibacillus larvae bacteriophages from the Las Vegasarea. Genome Announc. 2018. Submitted.
22. LeBlanc, L.; Nezami, S.; Yost, D.; Tsourkas, P.K.; Amy, P.S. Isolation and characterization of a novel phagelysin active against Paenibacillus larvae, a honeybee pathogen. Bacteriophage 2015, 5, e1080787. [CrossRef][PubMed]
23. Yost, D.G.; Tsourkas, P.; Amy, P.S. Experimental bacteriophage treatment of honeybees (Apis mellifera) infectedwith Paenibacillus larvae, the causative agent of American Foulbrood disease. Bacteriophage 2016, 6, e1122698.[CrossRef] [PubMed]
24. Ghorbani-Nezami, S.; LeBlanc, L.; Yost, D.G.; Amy, P.S. Phage therapy is effective in protecting honeybeelarvae from American Foulbrood disease. J. Insect. Sci. 2015, 15, 84–89. [CrossRef] [PubMed]
25. Oliveira, A.; Leite, M.; Kluskens, L.D.; Santos, S.B.; Melo, L.D.R.; Azeredo, J. The first Paenibacillus larvaebacteriophage endolysin (PlyPl123) with high potential to control American Foulbrood. PLoS ONE2015, 11, e0150157. [CrossRef]
26. Brady, T.S.; Merrill, B.D.; Hilton, J.A.; Payne, A.M.; Stephenson, M.B.; Hope, S. Bacteriophages as analternative to conventional antibiotic use for the prevention or treatment of Paenibacillus larvae in honeybeehives. J. Invert. Pathol. 2017, 150, 94–100. [CrossRef] [PubMed]
27. Stamereilers, C.; LeBlanc, L.; Yost, D.; Amy, P.S.; Tsourkas, P.K. Comparative genomics of 9 novelPaenibacillus larvae bacteriophages. Bacteriophage 2016, 6, e1220349. [CrossRef] [PubMed]
28. Kearse, M.; Moir, R.; Wilson, A.; Stones-Havas, S.; Cheung, M.; Sturrock, S.; Buxton, S.; Cooper, A.;Markowitz, S.; Duran, C.; et al. Geneious Basic: An integrated and extendable desktop software platform forthe organization and analysis of sequence data. Bioinformatics 2012, 28, 1647–1649. [CrossRef] [PubMed]
29. Merrill, B.D.; Ward, A.T.; Grose, J.H.; Hope, S. Software based analysis of bacteriophage genomes,physical ends and DNA packaging strategies. BMC Genom. 2016, 17, 679–695. [CrossRef] [PubMed]
30. Delcher, A.L.; Harmon, D.; Kasif, S.; White, O.; Salzberg, S. Improved microbial gene identification withGLIMMER. Nucl. Acids Res. 1999, 27, 4636–4641. [CrossRef] [PubMed]
31. Borodovsky, M.; McIninch, J. GeneMark: Parallel gene recognition for both DNA strands. Comput. Chem.1993, 17, 123–133. [CrossRef]
32. Lukashin, A.V.; Borodovsky, M. GeneMark.hmm: New solutions for gene finding. Nucl. Acids Res. 1998, 26,1107–1115. [CrossRef] [PubMed]
33. Besemer, J.; Borodovsky, M. Heuristic approach to deriving models for gene finding. Nucl. Acids Res. 1999,27, 3911–3920. [CrossRef] [PubMed]
34. Besemer, J.; Lomsadze, A.; Borodovsky, M. GeneMarkS: A self-training method for gene starts in microbialgenomes. Implications for finding sequence motifs in regulatory regions. Nucl. Acid Res. 2001, 29, 2607–2618.[CrossRef]
35. Marchler-Bauer, A.; Anderson, J.B.; Chitsaz, F.; Derbyshire, M.K.; DeWeese-Scott, C.; Fong, J.F.; Geer, L.Y.;Geer, R.C.; Gonzales, N.; Gwadz, M.; et al. CDD: Specific functional annotation with the Conserved DomainDatabase. Nucl. Acids Res. 2009, 37 (Suppl. 1), D205–D210. [CrossRef] [PubMed]
36. Krogh, A.; Larsson, B.; von Heijne, G.; Sonnhammer, E.L.L. Predicting transmembrane protein topologywith a hidden markov model: Application to complete genomes. J. Mol. Biol. 2001, 305, 567–580. [CrossRef][PubMed]

Viruses 2018, 10, 377 29 of 29
37. Laslett, D.; Canback, B. ARAGORN, a program to detect tRNA genes and tmRNA genes in nucleotidesequences. Nucl. Acids Res. 2004, 32, 11–16. [CrossRef] [PubMed]
38. Lowe, T.M.; Eddy, S.R. tRNAscan-SE: A program for improved detection of transfer RNA genes in genomicsequence. Nucl. Acids Res. 1997, 25, 955–964. [CrossRef] [PubMed]
39. Krumsiek, J.; Arnold, R.; Rattei, R. Gepard: A rapid and sensitive tool for creating dotplots on genome scale.Bioinformatics 2007, 23, 1026–1028. [CrossRef] [PubMed]
40. Thompson, J.D.; Higgins, D.G.; Gibson, T.J. CLUSTALW: Improving the sensitivity of progressive multiplesequence alignment through sequence weighting, position-specific gap penalties and weight matrix choice.Nucl. Acids Res. 1994, 22, 4673–4680. [CrossRef] [PubMed]
41. Cresawn, S.G.; Bogel, M.; Day, N.; Jacobs-Sera, D.; Hendrix, R.W.; Hatfull, G.R. Phamerator: A bioinformatictool for comparative bacteriophage genomics. BMC Bioinf. 2011, 12, 395–409. [CrossRef] [PubMed]
42. Huson, D.H.; Bryant, D. Application of phylogenetic networks in evolutionary studies. Mol. Biol. Evol. 2006,23, 254–267. [CrossRef] [PubMed]
43. Abascal, F.; Zardoya, R.; Telford, M.J. TranslatorX: Multiple alignment of nucleotide sequences guided byamino acid translations. Nucl. Acids Res. 2010, 38 (Suppl. 2), W7–W13. [CrossRef] [PubMed]
44. Edgar, R.C. MUSCLE: A multiple sequence alignment with high accuracy and high throughput.Nucl. Acids Res. 2004, 32, 1792–1797. [CrossRef] [PubMed]
45. Akaike, H. Likelihood and the Bayes procedure. In Selected Papers of Hirotugu Akaike; Parzen, E., Tanabe, K.,Kitagawa, G., Eds.; Springer: New York, NY, USA, 1994; pp. 309–332. ISBN 978-1-4612-1694-0.
46. Darriba, D.; Taboada, G.L.; Doallo, R.; Posada, D. jModelTest 2: More models, new heuristics and parallelcomputing. Nat. meth. 2012, 9, 772. [CrossRef] [PubMed]
47. Ronquist, F.; Teslenko, M.; Van Der Mark, P.; Ayres, D.L.; Darling, A.; Höhna, S.; Larget, B.; Liu, L.;Suchard, M.A.; Huelsenbeck, J.P. MrBayes 3.2: Efficient Bayesian phylogenetic inference and model choiceacross a large model space. Syst. Biol. 2012, 61, 539–542. [CrossRef] [PubMed]
48. Farris, J.S. Estimating phylogenetic trees from distance matrices. Am. Nat. 1972, 106, 645–668. [CrossRef]49. White, G.F. The Bacteria of the Apiary with Special Reference to Bee Disease; Bureau of Entomology Technical
Series; US Department of Agriculture: Washington, DC, USA, 1906; Volume 14, pp. 1–50.50. Hatfull, G.F.; Jacobs-Sera, D.; Lawrence, J.; Pope, W.H.; Russell, D.A.; Ko, C.-C.; Weber, R.J.; Patel, M.C.;
Germane, K.L.; Edgar, R.H.; et al. Comparative Genomic Analysis of 60 Mycobacteriophage genomes:Genome clustering, gene acquisition, and gene size. J. Mol. Biol. 2010, 397, 119–143. [CrossRef] [PubMed]
51. Xu, J.; Hendrix, R.W.; Duda, R.L. Conserved translational frameshift in dsDNA bacteriophage tail assemblygenes. Mol. Cell 2004, 16, 11–21. [CrossRef] [PubMed]
52. Xu, J.; Hendrix, R.W.; Duda, R.L. A balanced ratio of proteins from gene G and frameshift-extended gene GTis required for phage lambda tail assembly. J. Mol. Biol. 2013, 425, 3476–3487. [CrossRef] [PubMed]
53. Casjens, S.R.; Grose, J.H. Contributions of P2- and P22-like prophages to understanding the enormousdiversity and abundance of tailed bacteriophages. Virology 2016, 496, 255–276. [CrossRef] [PubMed]
54. Young, R. Bacteriophage lysis: mechanism and regulation. Microbiol. Rev. 1992, 56, 430–481. [PubMed]55. Wang, I.N.; Smith, D.L.; Young, R. Holins: the protein clocks of bacteriophage infections. Ann. Rev. Microbiol.
2000, 54, 799–825. [CrossRef] [PubMed]56. Young, R.; Wang, N.; Roof, D.W. Phages will out: strategies of host cell lysis. Trend Microbiol. 2000, 8, 120–128.
[CrossRef]57. Nelson, D.C.; Schmelcher, M.; Rodriguez-Rubio, L.; Klumpp, J.; Pritchard, D.G.; Dong, S.; Donovan, D.M.
Endolysins as antimicrobials. Adv. Virus Res. 2012, 83, 299–365. [CrossRef] [PubMed]58. Payne, K.M.; Hatfull, G.F. Mycobacteriophage endolysins: Diverse and modular enzymes with multiple
catalytic activities. PLoS ONE 2012, 7, e34052. [CrossRef] [PubMed]59. Casjens, S. Comparative genomics and evolution of the tailed-bacteriophages. Curr. Opin. Microbiol. 2005, 8,
451–458. [CrossRef] [PubMed]
© 2018 by the authors. Licensee MDPI, Basel, Switzerland. This article is an open accessarticle distributed under the terms and conditions of the Creative Commons Attribution(CC BY) license (http://creativecommons.org/licenses/by/4.0/).