Embed Size (px)
Citation preview

Genomewide Association Genomewide Association StudiesStudies
Genomewide Association StudiesGenomewide Association Studies
1. History1. History– Linkage vs. AssociationLinkage vs. Association– Power/Sample SizePower/Sample Size
2. Human Genetic Variation: SNPs2. Human Genetic Variation: SNPs 3. Direct vs. Indirect Association3. Direct vs. Indirect Association
– Linkage DisequilibriumLinkage Disequilibrium
4. SNP selection, Coverage, Study Designs4. SNP selection, Coverage, Study Designs 5. Genotyping Platforms5. Genotyping Platforms 6. Early (recent) GWA Studies6. Early (recent) GWA Studies
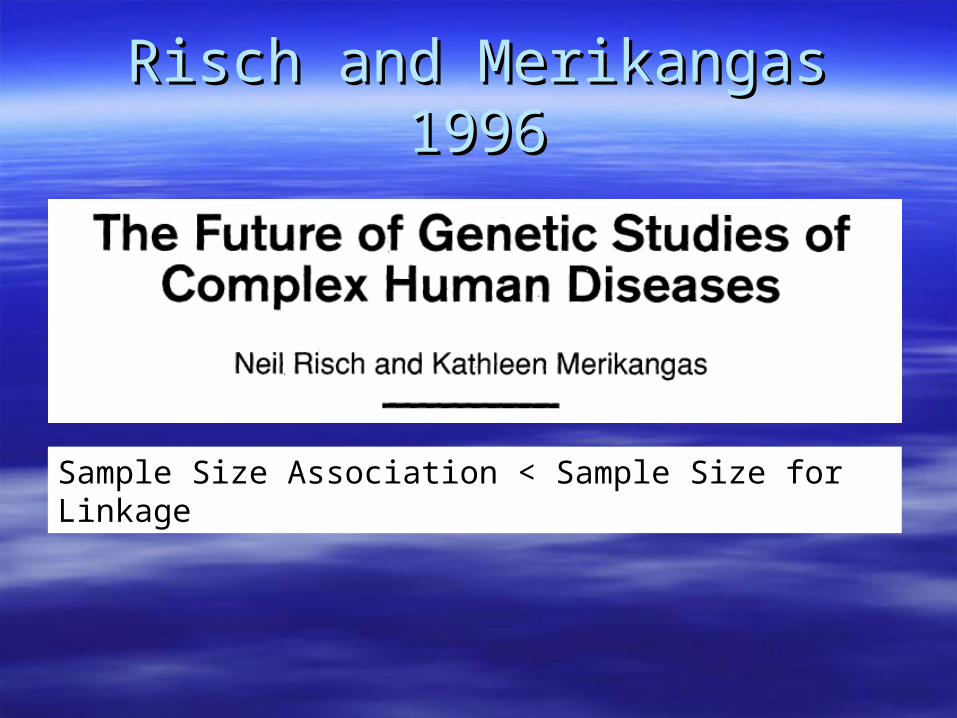
Risch and Merikangas 1996Risch and Merikangas 1996
Sample Size Association < Sample Size for Linkage
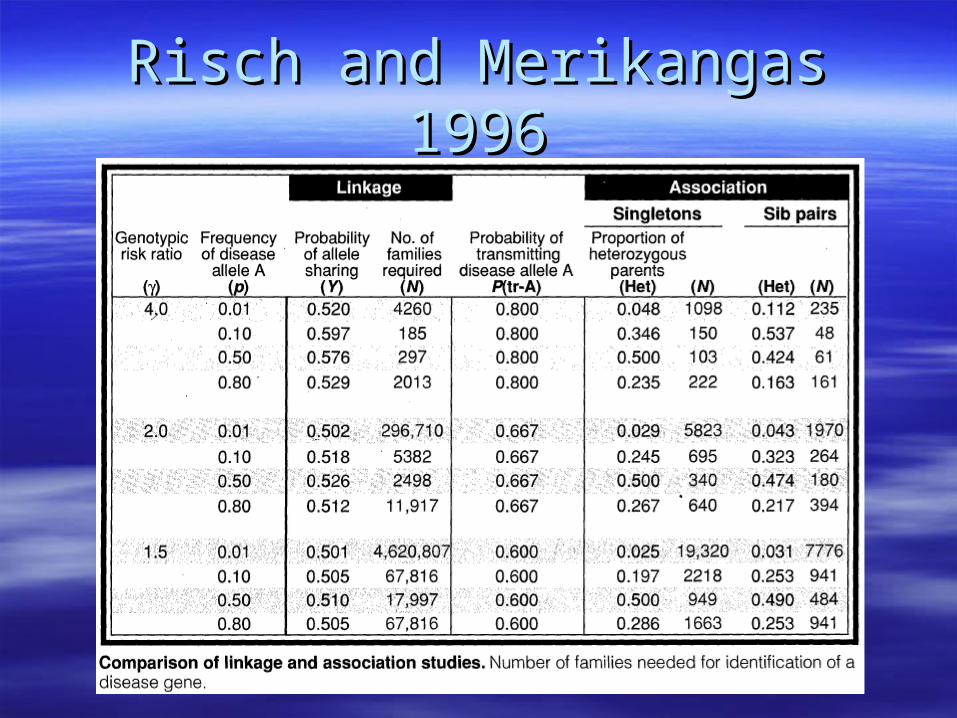
Risch and Merikangas 1996Risch and Merikangas 1996
Sample Size RequiredSample Size Required
Linkage Analysis with affected sib pairsLinkage Analysis with affected sib pairs
Transmission Disequilbrium Test (TDT)Transmission Disequilbrium Test (TDT)
TDT with affected sib pairsTDT with affected sib pairs
Affected Sib Pair Linkage AnalysisAffected Sib Pair Linkage Analysis
2 siblings/family2 siblings/family
Both sibs affectedBoth sibs affected
IBD IBD at the marker locusat the marker locus
Expect 50% on averageExpect 50% on average
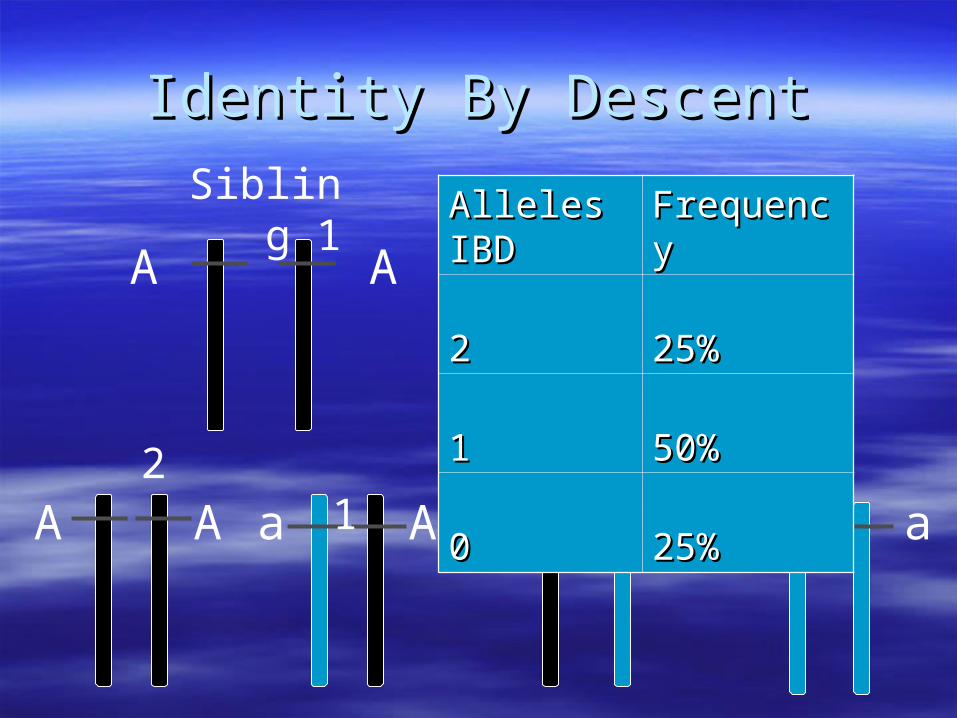
Identity By DescentIdentity By Descent
A A
A aa AA A aa
Sibling 1
2 1 1 0
Alleles IBDAlleles IBD FrequencyFrequency
22 25%25%
11 50%50%
00 25%25%
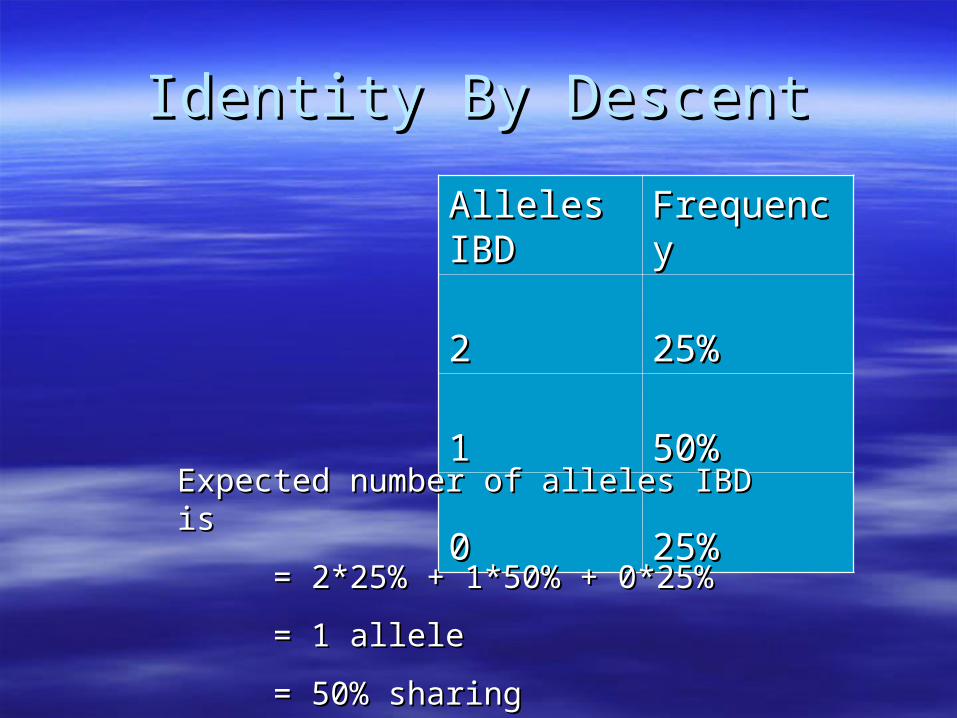
Identity By DescentIdentity By Descent
Alleles IBDAlleles IBD FrequencyFrequency
22 25%25%
11 50%50%
00 25%25%
Expected number of alleles IBD isExpected number of alleles IBD is
= 2*25% + 1*50% + 0*25%= 2*25% + 1*50% + 0*25%
= 1 allele= 1 allele
= 50% sharing= 50% sharing

Risch and Merikangas 1996Risch and Merikangas 1996
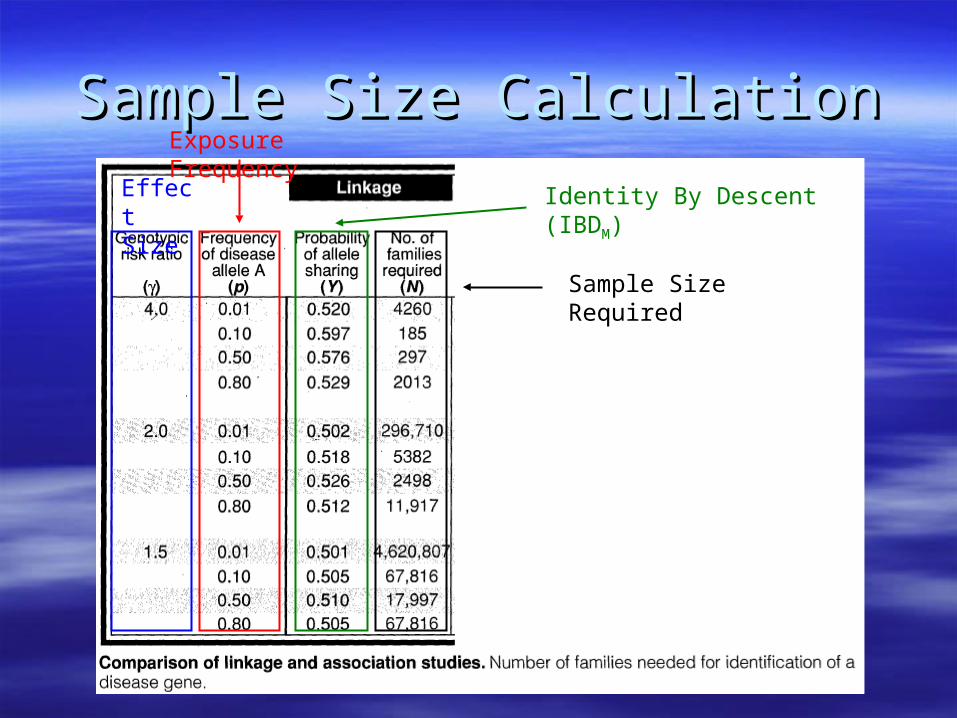
Sample Size CalculationSample Size CalculationEffect Size
Exposure Frequency
Identity By Descent (IBDM)
Sample Size Required
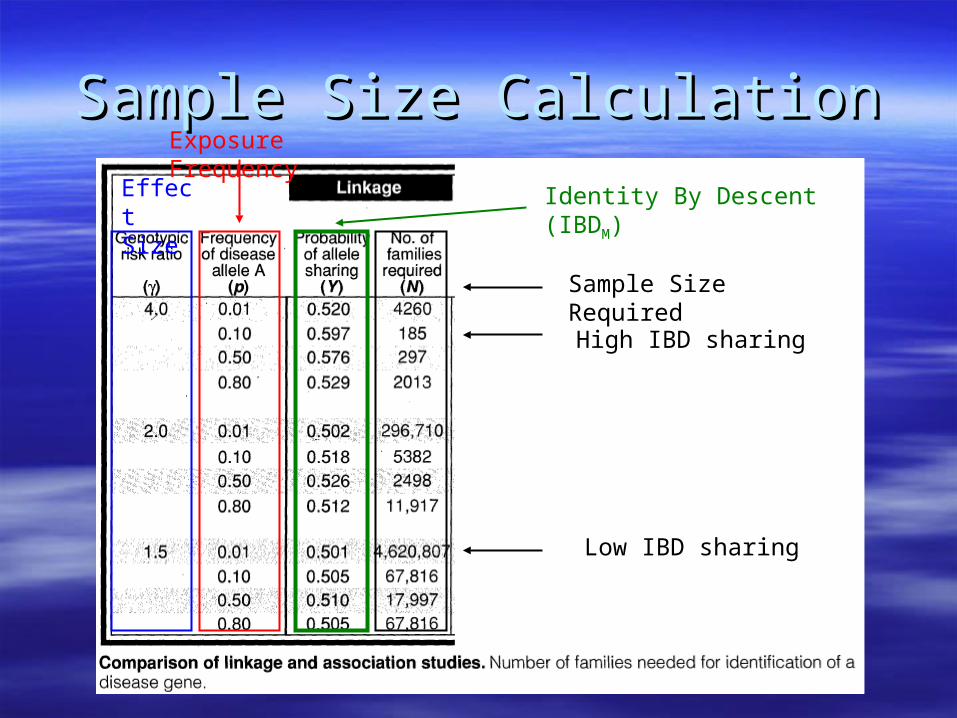
Sample Size CalculationSample Size CalculationEffect Size
Exposure Frequency
Identity By Descent (IBDM)
Sample Size Required
High IBD sharing
Low IBD sharing

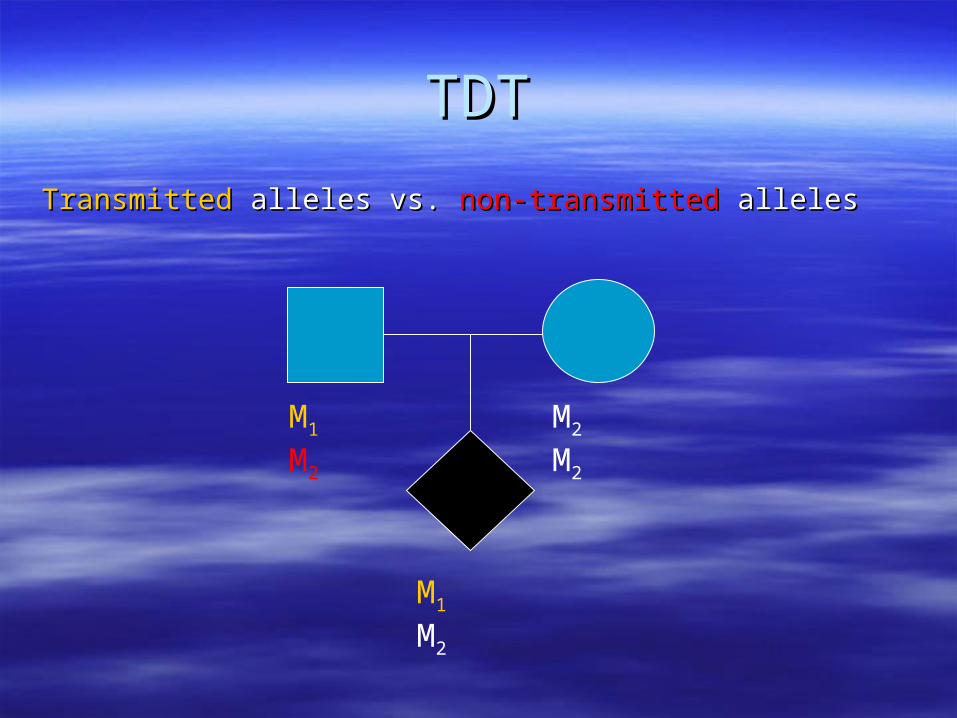
TDTTDT
TransmittedTransmitted alleles vs. alleles vs. non-transmittednon-transmitted alleles alleles
M1 M2 M2 M2
M1 M2

TDTTDT
TransmittedTransmitted alleles vs. alleles vs. non-transmittednon-transmitted alleles alleles
Non-Transmitted AlleleNon-Transmitted Allele
TransmittedTransmitted MM11 MM22
MM11 nn1111 nn1212
MM22 nn2121 nn2222
TDT = (n12 - n21)2
(n12 + n21)
Asymptotically 2 with
1 degree of freedom
TDTTDT
TransmittedTransmitted alleles vs. alleles vs. non-transmittednon-transmitted alleles alleles
M1 M2 M2 M2
M1 M2
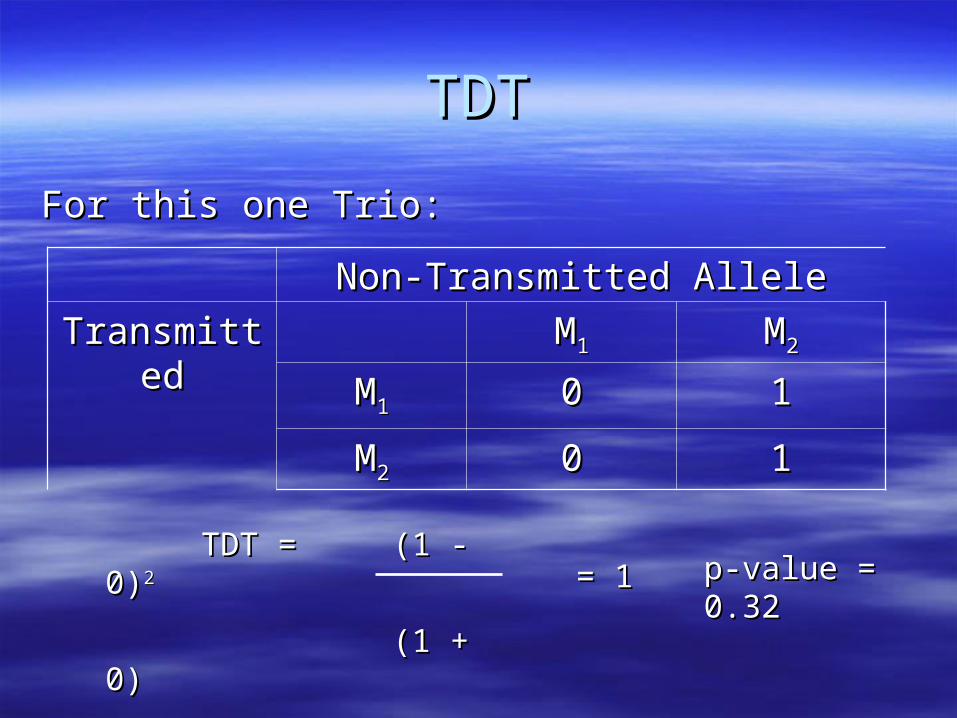
TDTTDT
For this one Trio:For this one Trio:
Non-Transmitted AlleleNon-Transmitted Allele
TransmittedTransmitted MM11 MM22
MM11 00 11
MM22 00 11
TDT = TDT = (1 - 0)(1 - 0)22
(1 + 0)(1 + 0)= 1= 1 p-value = 0.32p-value = 0.32
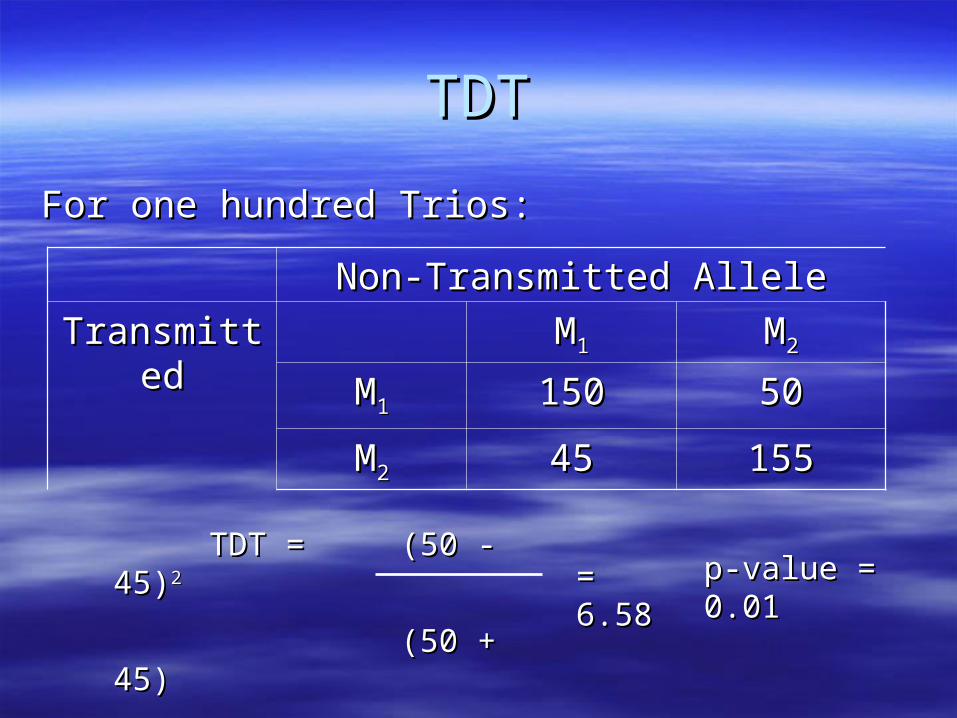
TDTTDT
For one hundred Trios:For one hundred Trios:
Non-Transmitted AlleleNon-Transmitted Allele
TransmittedTransmitted MM11 MM22
MM11 150150 5050
MM22 4545 155155
TDT = TDT = (50 - 45)(50 - 45)22
(50 + 45)(50 + 45)= 6.58= 6.58 p-value = 0.01p-value = 0.01
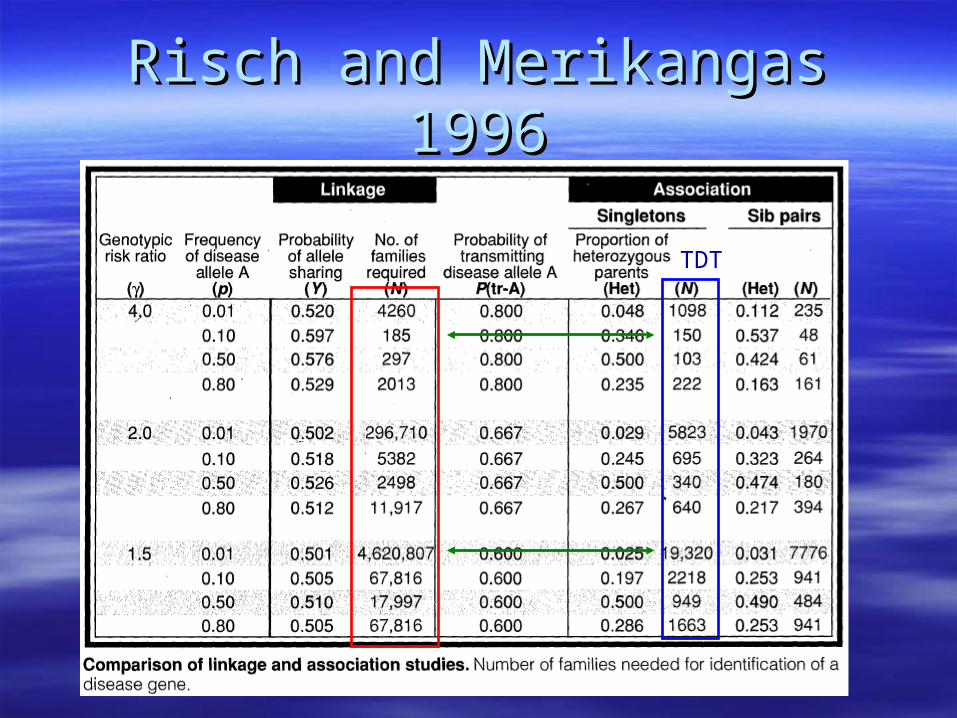
Risch and Merikangas 1996Risch and Merikangas 1996
TDT
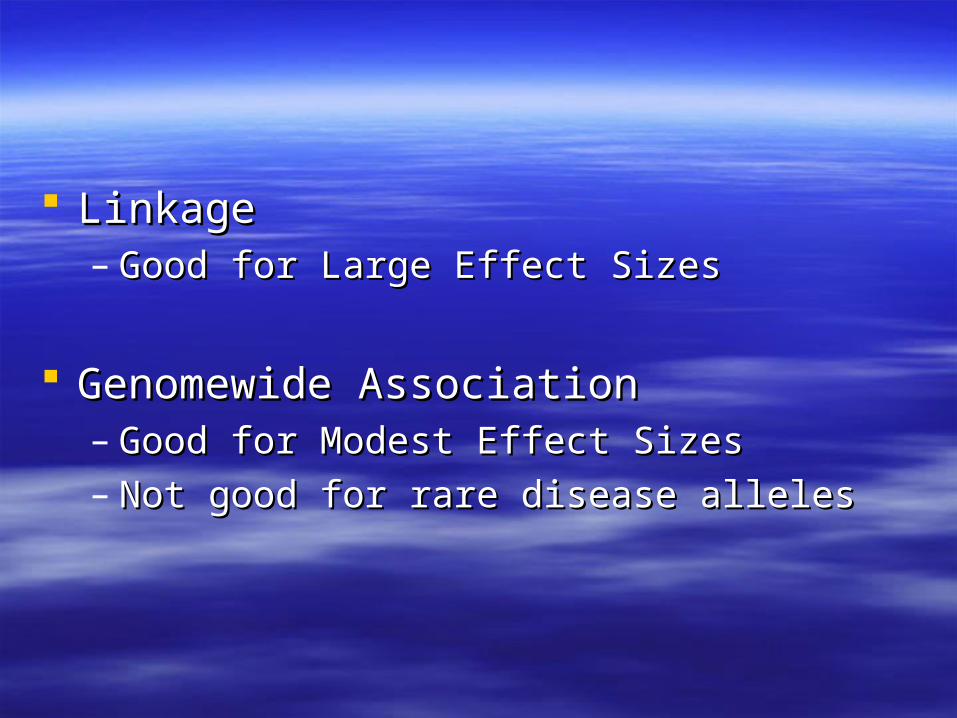
LinkageLinkage– Good for Large Effect SizesGood for Large Effect Sizes
Genomewide AssociationGenomewide Association– Good for Modest Effect SizesGood for Modest Effect Sizes– Not good for rare disease allelesNot good for rare disease alleles

Two HypothesesTwo Hypotheses
Common Disease-Common VariantCommon Disease-Common Variant– Common variantsCommon variants– Small to modest effectsSmall to modest effects
Rare VariantRare Variant– Rare variantsRare variants– Larger effectsLarger effects
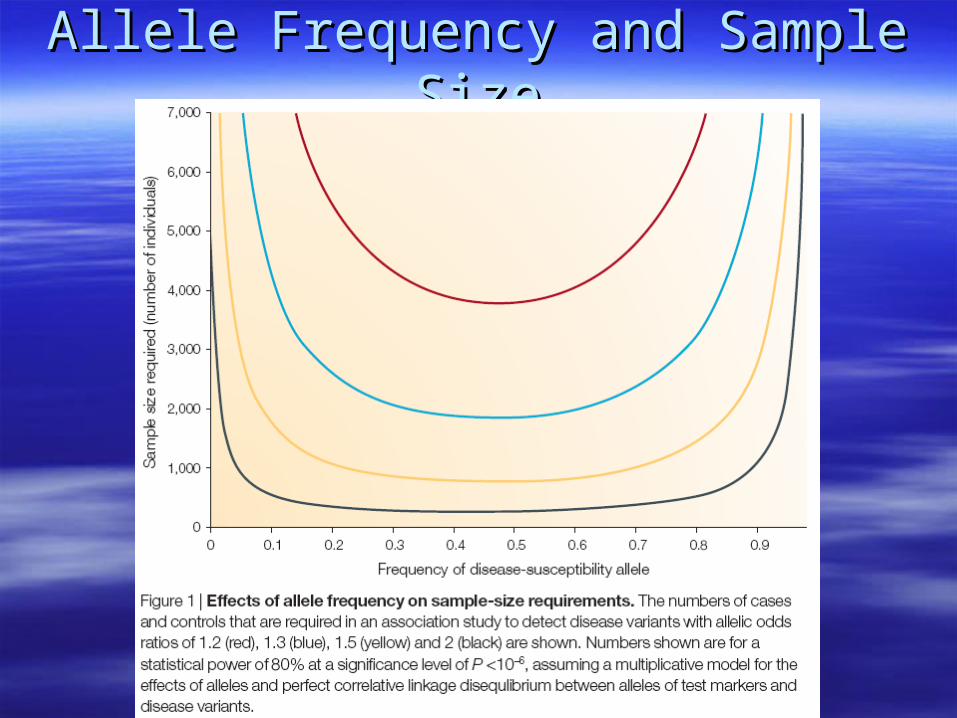
Allele Frequency and Sample SizeAllele Frequency and Sample Size
GWA IssuesGWA Issues
CostCost– Sample Size Sample Size
Effect SizeEffect Size Disease Allele FrequencyDisease Allele Frequency Multiple TestingMultiple Testing
– SNP selectionSNP selection How many?How many? Which SNPs?Which SNPs? Available Genotyping PlatformsAvailable Genotyping Platforms
Types of VariantsTypes of Variants
Single Nucleotide Polymorphism (SNP)Single Nucleotide Polymorphism (SNP)
Insertion/Deletion (indel)Insertion/Deletion (indel)
Microsatellite or Short Tandem Repeat (STR)Microsatellite or Short Tandem Repeat (STR)

What is a SNP?What is a SNP?
AAGTCAGTCTAGGAAGTCAGTCTAGGAATCGGGTCGGG
TTCAGTCAGATCCTTCAGTCAGATCCTTAGCCCAGCCC
TTCAGTCAGATCCTTCAGTCAGATCCCCAGCCCAGCCC
AAGTCAGTCTAGGAAGTCAGTCTAGGGGTCGGGTCGGG
Chromosome 1
Chromosome 2
SNPSNP

What is an insertion/deletion?What is an insertion/deletion?
AAGTCAGTCTAGGAAGTCAGTCTAGGAATCGGGTCGGG
TTCAGTCAGATCCTTCAGTCAGATCCTTAGCCCAGCCC
TTCAGTCAGATCCTTCAGTCAGATCCCTCTAGCCCAGCCC
AAGTCAGTCTAGGAAGTCAGTCTAGGGAGATCGGGTCGGG
Chromosome 1
Chromosome 2
Insertion/DeletionInsertion/Deletion
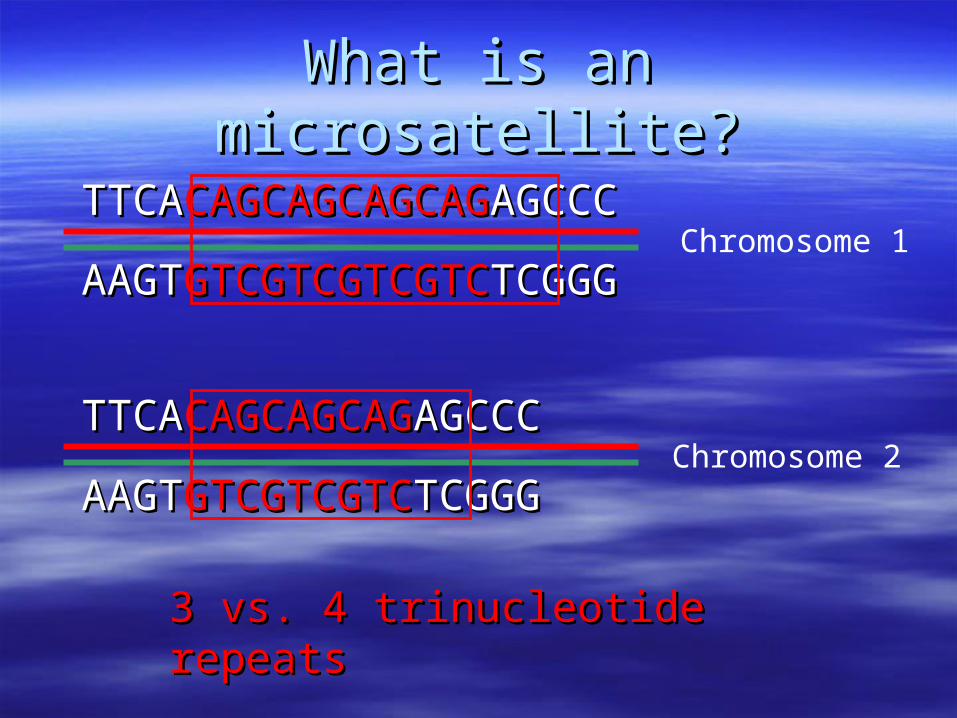
What is an microsatellite?What is an microsatellite?
AAGTAAGTGTCGTCGTCGTCGTCGTCGTCGTCTCGGGTCGGG
TTCATTCACAGCAGCAGCAGCAGCAGCAGCAGAGCCCAGCCC
TTCATTCACAGCAGCAGCAGCAGCAGAGCCCAGCCC
AAGTAAGTGTCGTCGTCGTCGTCGTCTCGGGTCGGG
Chromosome 1
Chromosome 2
3 vs. 4 trinucleotide repeats3 vs. 4 trinucleotide repeats

Relative frequency of each type of Relative frequency of each type of variantvariant
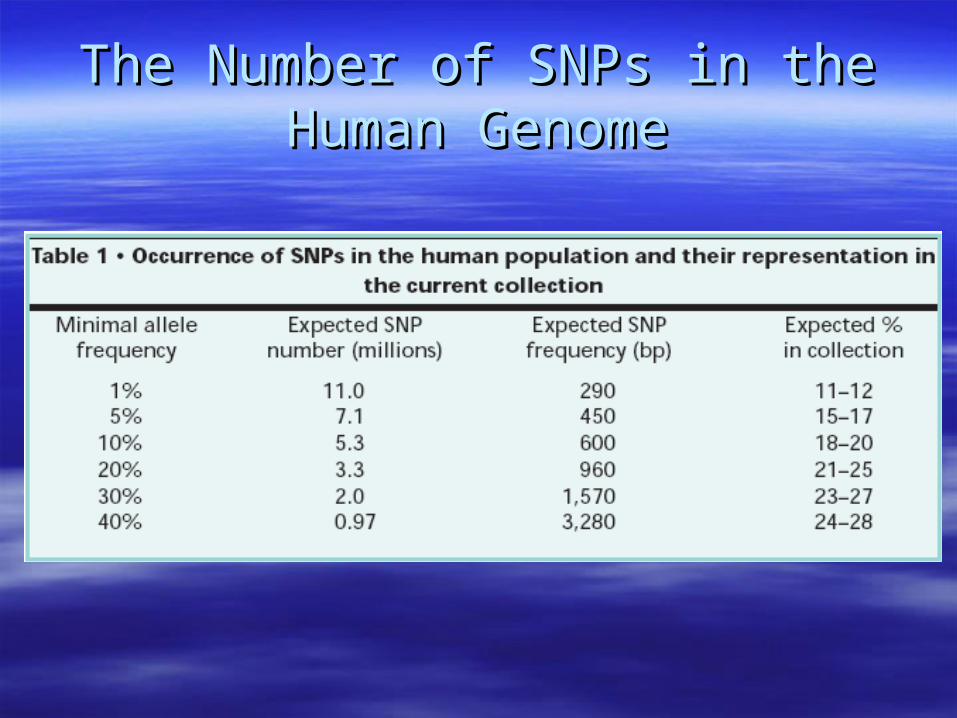
The Number of SNPs in the Human The Number of SNPs in the Human GenomeGenome

How many SNPs?How many SNPs?
6 billion humans6 billion humans 12 billion chromosomes12 billion chromosomes 1% frequency SNP1% frequency SNP 120 million copies of the minor allele120 million copies of the minor allele
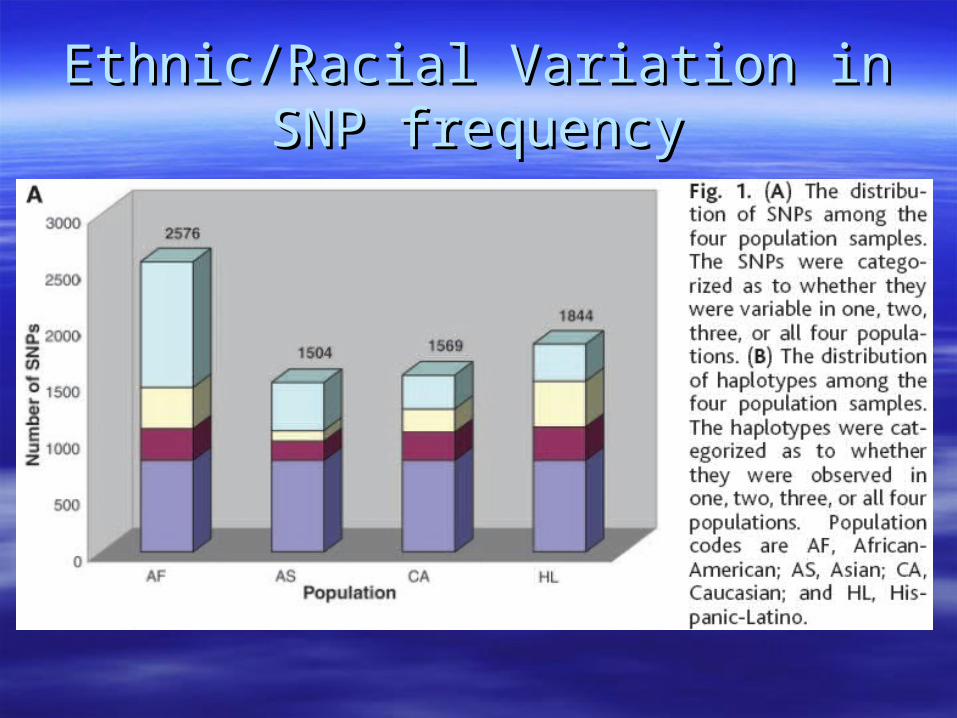
Ethnic/Racial Variation in SNP Ethnic/Racial Variation in SNP frequencyfrequency

Rare SNPs across populationsRare SNPs across populations
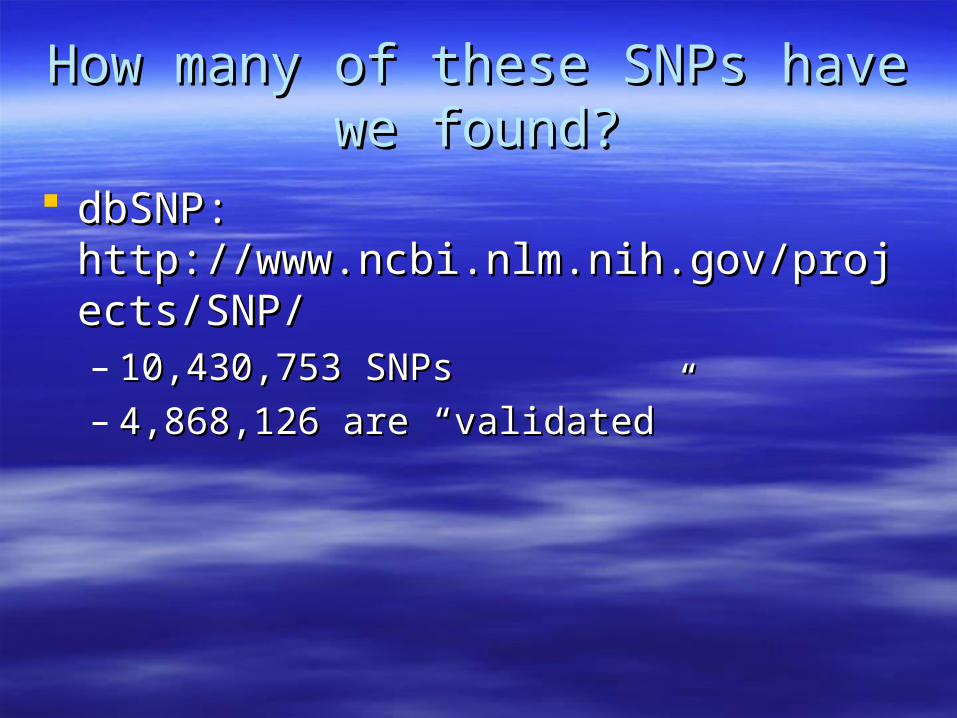
How many of these SNPs have we How many of these SNPs have we found?found?
dbSNP: dbSNP: http://www.ncbi.nlm.nih.gov/projects/SNP/http://www.ncbi.nlm.nih.gov/projects/SNP/– 10,430,753 SNPs10,430,753 SNPs– 4,868,126 are “validated”4,868,126 are “validated”
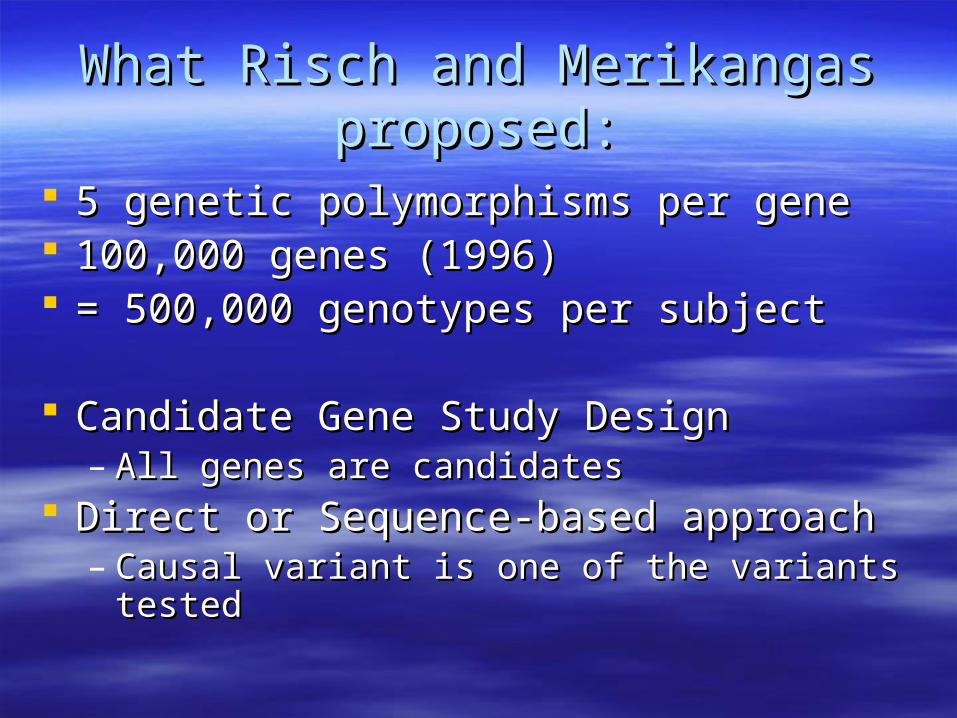
What Risch and Merikangas What Risch and Merikangas proposed:proposed:
5 genetic polymorphisms per gene5 genetic polymorphisms per gene 100,000 genes (1996)100,000 genes (1996) = 500,000 genotypes per subject= 500,000 genotypes per subject
Candidate Gene Study DesignCandidate Gene Study Design– All genes are candidatesAll genes are candidates
Direct or Sequence-based approachDirect or Sequence-based approach– Causal variant is one of the variants testedCausal variant is one of the variants tested
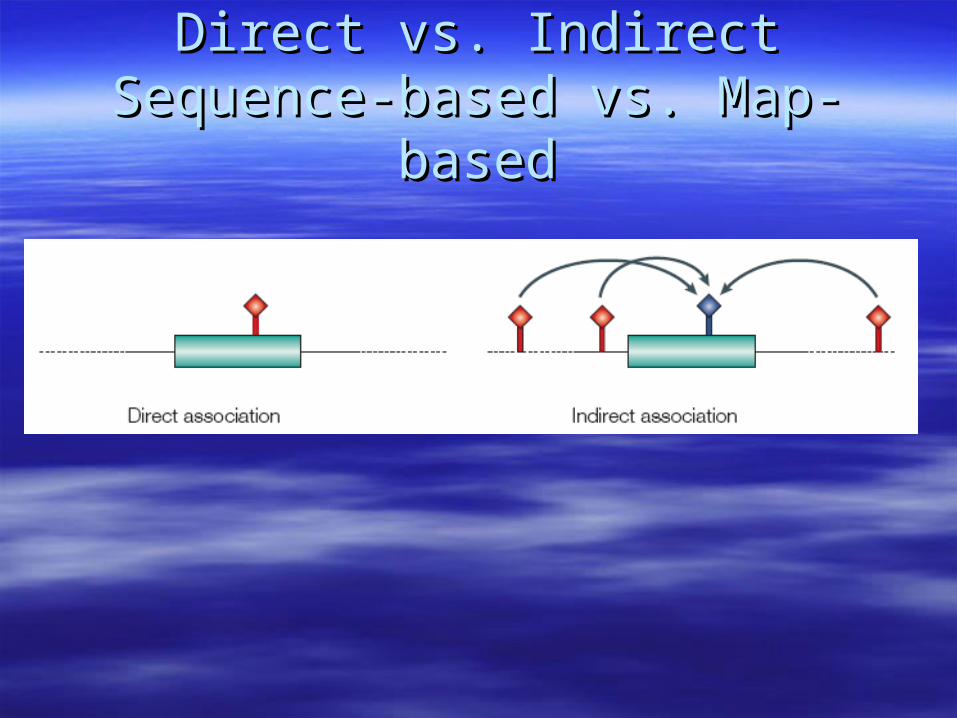
Direct vs. IndirectDirect vs. IndirectSequence-based vs. Map-basedSequence-based vs. Map-based
Indirect Association relies on LD Indirect Association relies on LD DecayDecay
Variants that are close will have high LDVariants that are close will have high LD
Variants that are far apart will have low LDVariants that are far apart will have low LD
Indirect Association is a form of Indirect Association is a form of
Positional CloningPositional Cloning
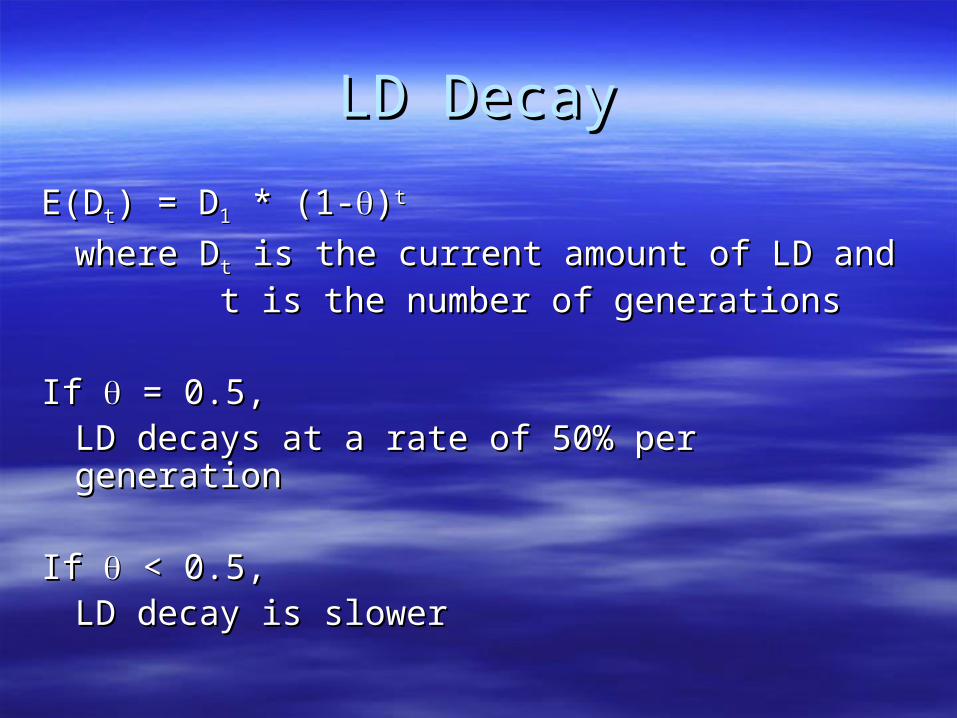
LD DecayLD Decay
E(DE(Dtt) = D) = D11 * (1- * (1-))tt
where Dwhere Dtt is the current amount of LD and is the current amount of LD and
t is the number of generationst is the number of generations
If If = 0.5, = 0.5, LD decays at a rate of 50% per generationLD decays at a rate of 50% per generation
If If < 0.5, < 0.5, LD decay is slowerLD decay is slower

LD Decay over timeLD Decay over time

Observed LD DecayObserved LD Decay
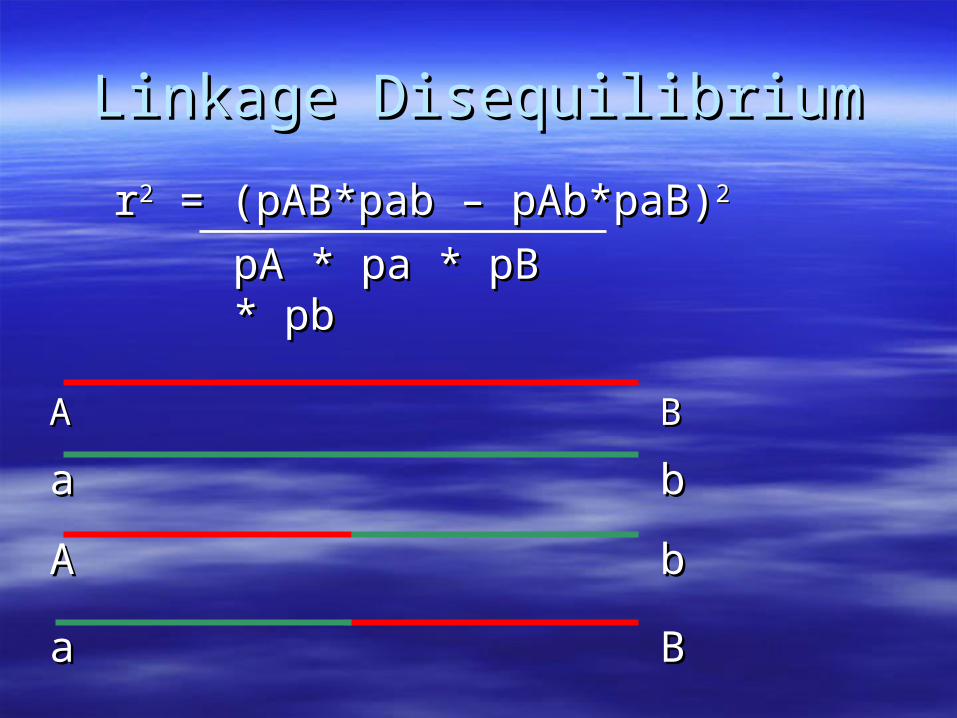
Linkage DisequilibriumLinkage Disequilibrium
AA BB
aa bb
AA bb
aa BB
rr22 = (pAB*pab – pAb*paB) = (pAB*pab – pAb*paB)22
pA * pa * pB * pbpA * pa * pB * pb
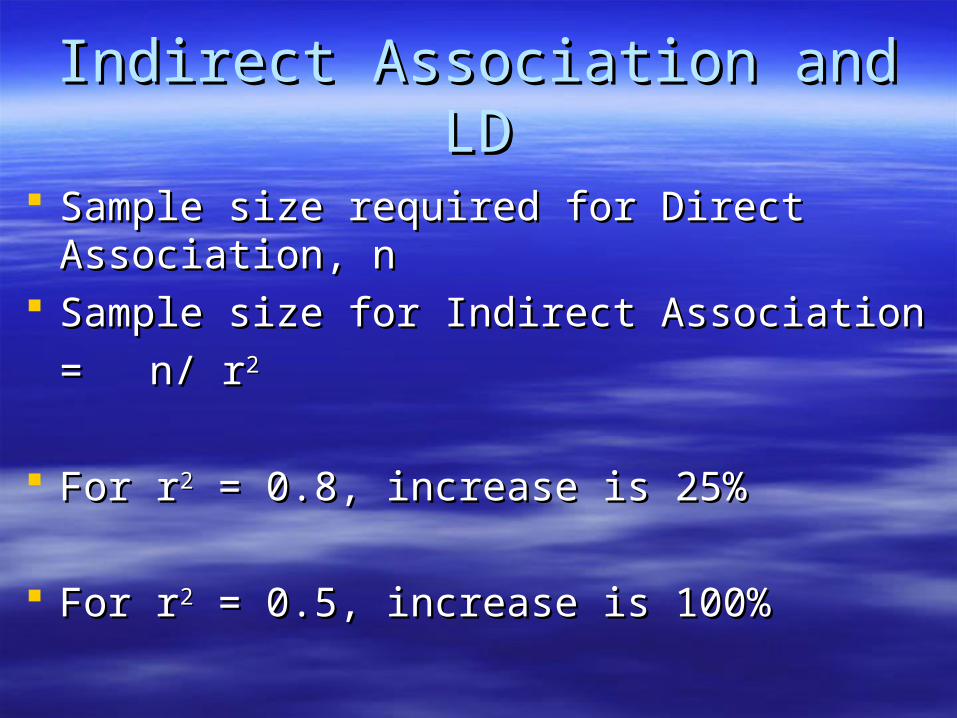
Indirect Association and LDIndirect Association and LD
Sample size required for Direct Association, nSample size required for Direct Association, n Sample size for Indirect AssociationSample size for Indirect Association
== n/ rn/ r22
For rFor r22 = 0.8, increase is 25% = 0.8, increase is 25%
For rFor r22 = 0.5, increase is 100% = 0.5, increase is 100%

CoverageCoverage
Percent of all SNPs captured by genotyped Percent of all SNPs captured by genotyped SNPsSNPs
More genotyped SNPs = better coverageMore genotyped SNPs = better coverage
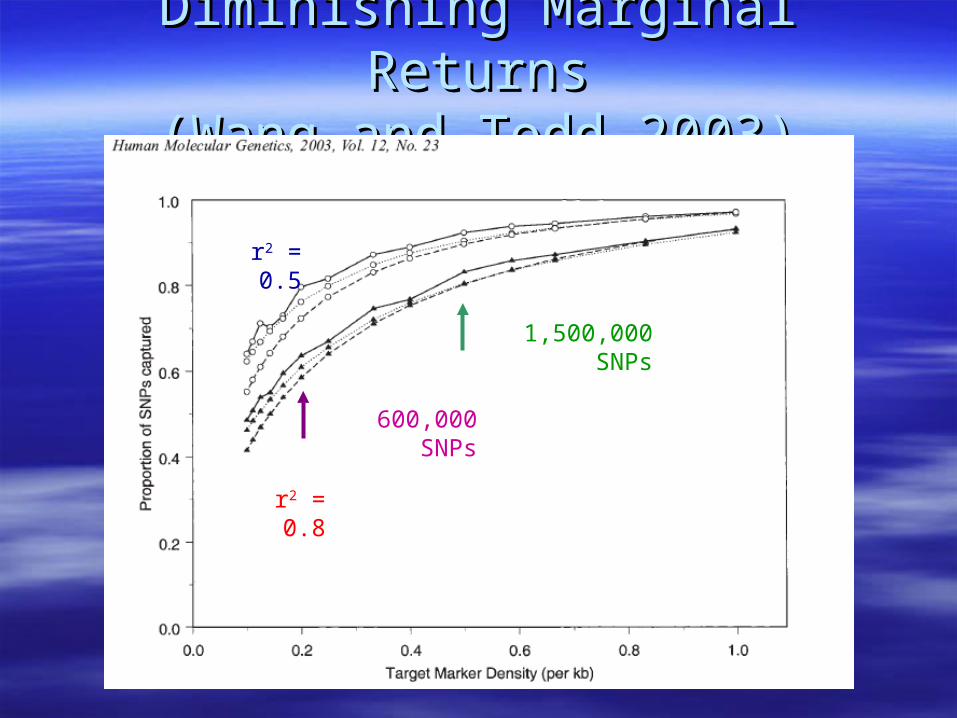
Diminishing Marginal ReturnsDiminishing Marginal Returns(Wang and Todd 2003)(Wang and Todd 2003)
r2 = 0.5
r2 = 0.8
600,000 SNPs
1,500,000 SNPs
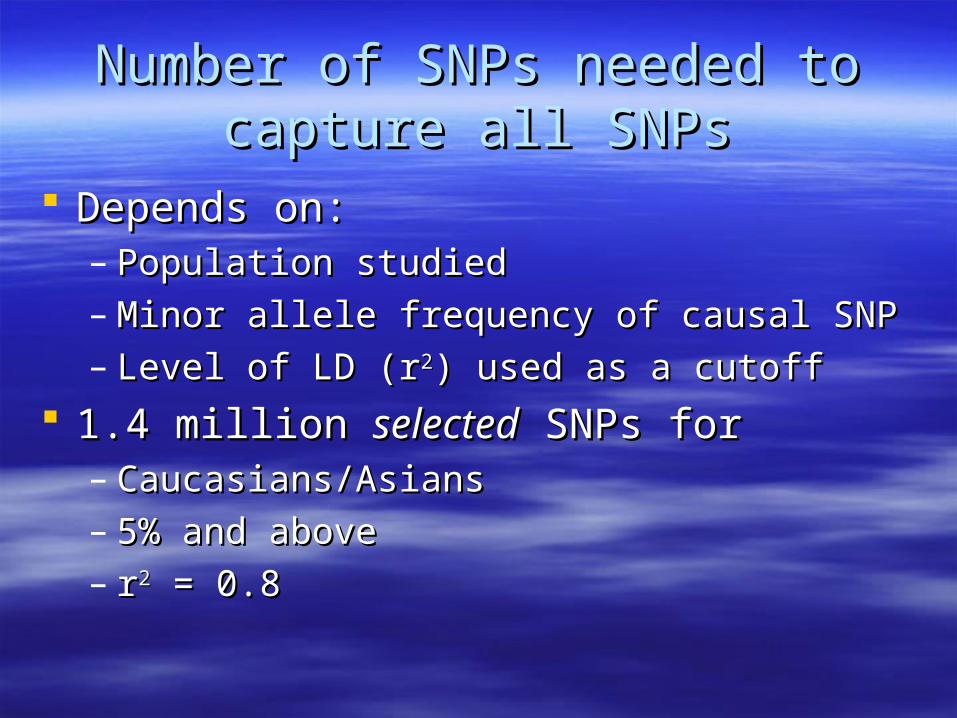
Number of SNPs needed to capture Number of SNPs needed to capture all SNPsall SNPs
Depends on:Depends on:– Population studiedPopulation studied– Minor allele frequency of causal SNPMinor allele frequency of causal SNP– Level of LD (rLevel of LD (r22) used as a cutoff) used as a cutoff
1.4 million 1.4 million selectedselected SNPs for SNPs for– Caucasians/AsiansCaucasians/Asians– 5% and above5% and above– rr22 = 0.8 = 0.8
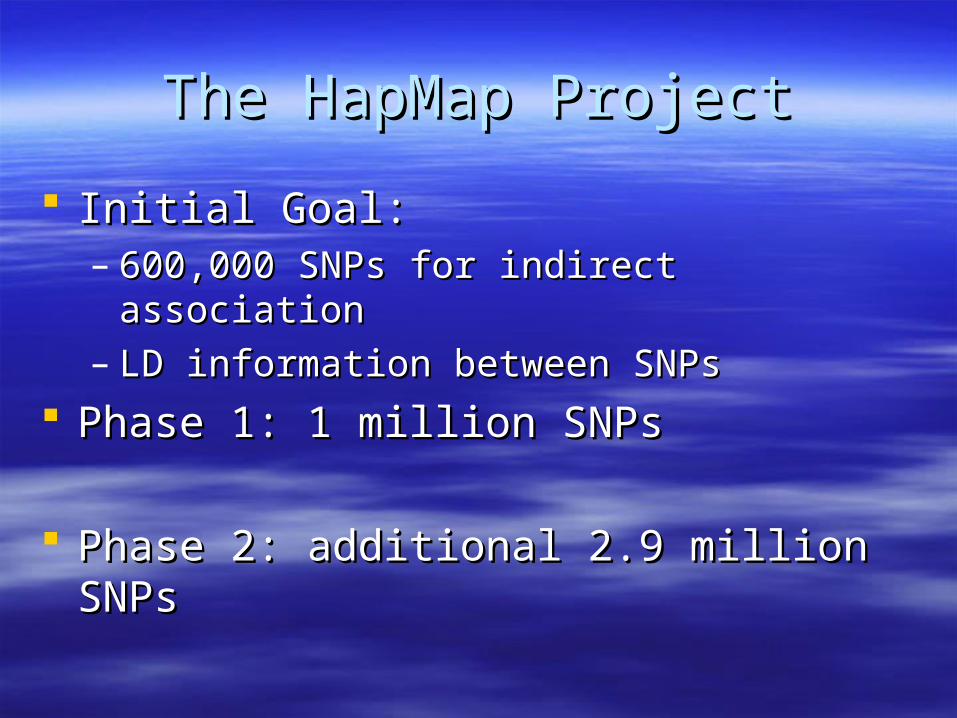
The HapMap ProjectThe HapMap Project
Initial Goal:Initial Goal:– 600,000 SNPs for indirect association600,000 SNPs for indirect association– LD information between SNPsLD information between SNPs
Phase 1: 1 million SNPsPhase 1: 1 million SNPs
Phase 2: additional 2.9 million SNPsPhase 2: additional 2.9 million SNPs

HapMapHapMap
270 subjects270 subjects 45 Chinese45 Chinese 45 Japanese45 Japanese 90 Yoruban and 90 European-American90 Yoruban and 90 European-American
– 30 Trios30 Trios– 2 parents, 1 child2 parents, 1 child
HapMapHapMap
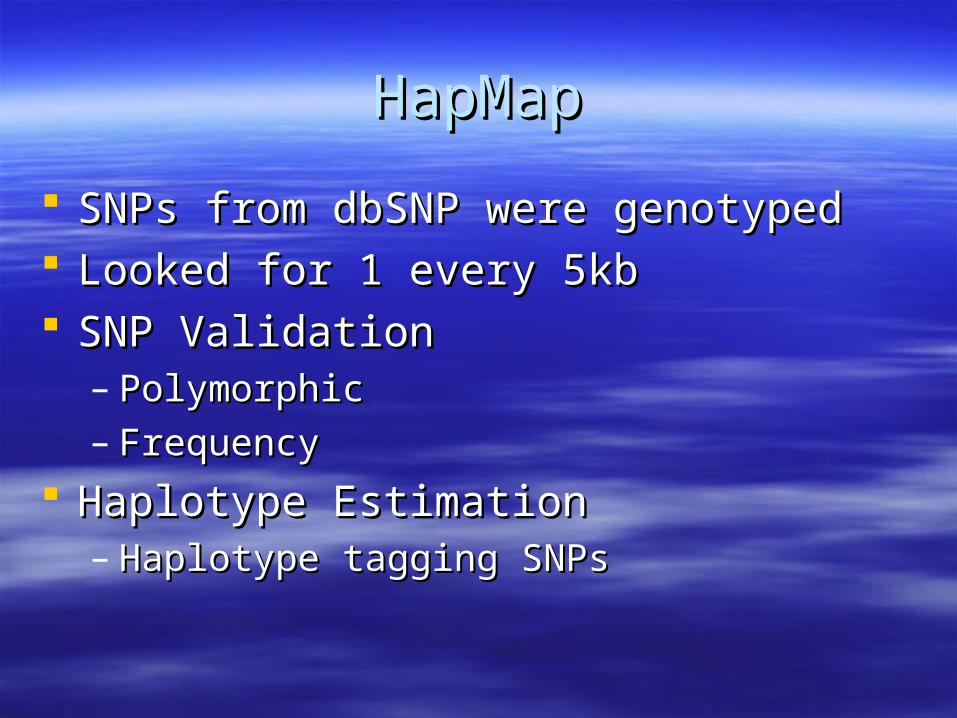
SNPs from dbSNP were genotypedSNPs from dbSNP were genotyped Looked for 1 every 5kbLooked for 1 every 5kb SNP ValidationSNP Validation
– PolymorphicPolymorphic– FrequencyFrequency
Haplotype EstimationHaplotype Estimation– Haplotype tagging SNPsHaplotype tagging SNPs

Haplotype TaggingHaplotype Tagging
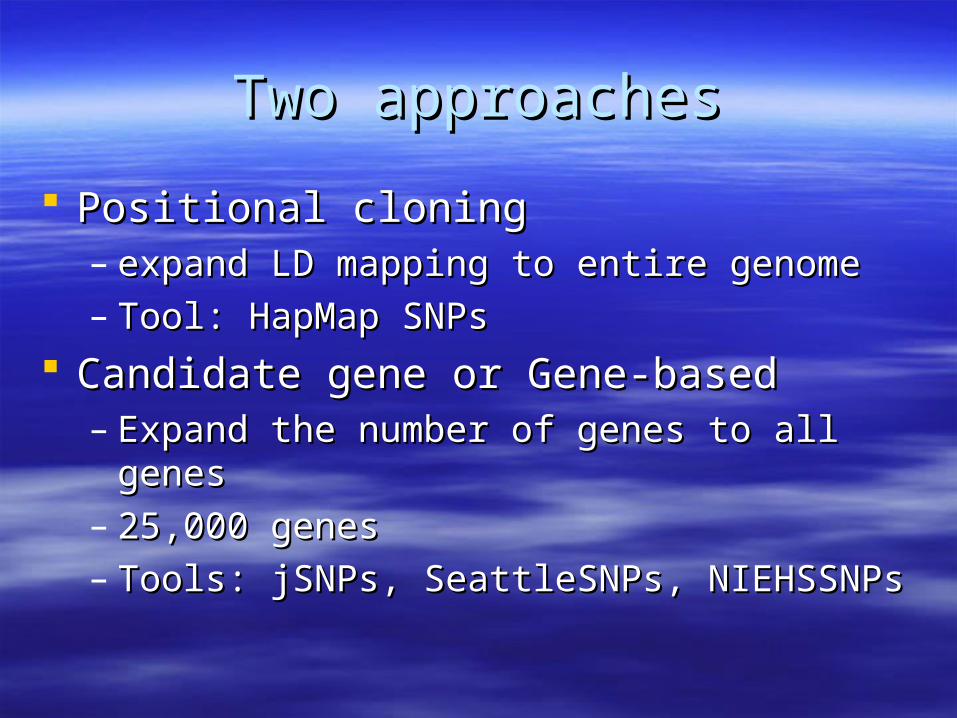
Two approachesTwo approaches
Positional cloningPositional cloning– expand LD mapping to entire genomeexpand LD mapping to entire genome– Tool: HapMap SNPsTool: HapMap SNPs
Candidate gene or Gene-basedCandidate gene or Gene-based– Expand the number of genes to all genesExpand the number of genes to all genes– 25,000 genes25,000 genes– Tools: jSNPs, SeattleSNPs, NIEHSSNPsTools: jSNPs, SeattleSNPs, NIEHSSNPs

Genome-wide AssociationGenome-wide Association
LD Based
Gene Based
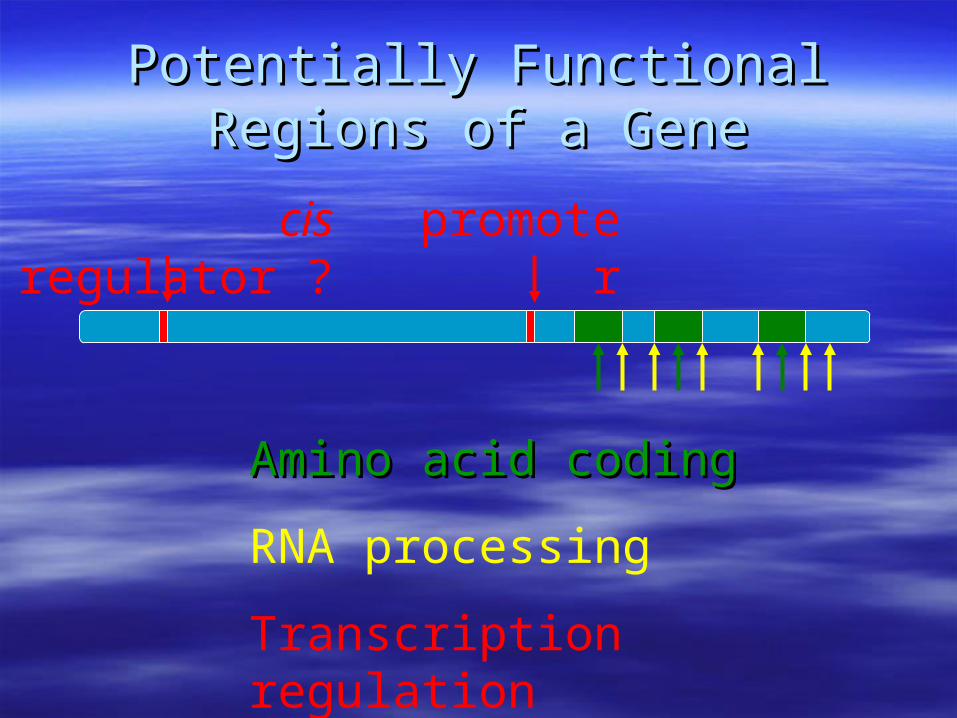
Potentially Functional Regions of a Potentially Functional Regions of a GeneGene
cis regulator ?
Amino acid codingAmino acid coding
RNA processing
Transcription regulation
promoter
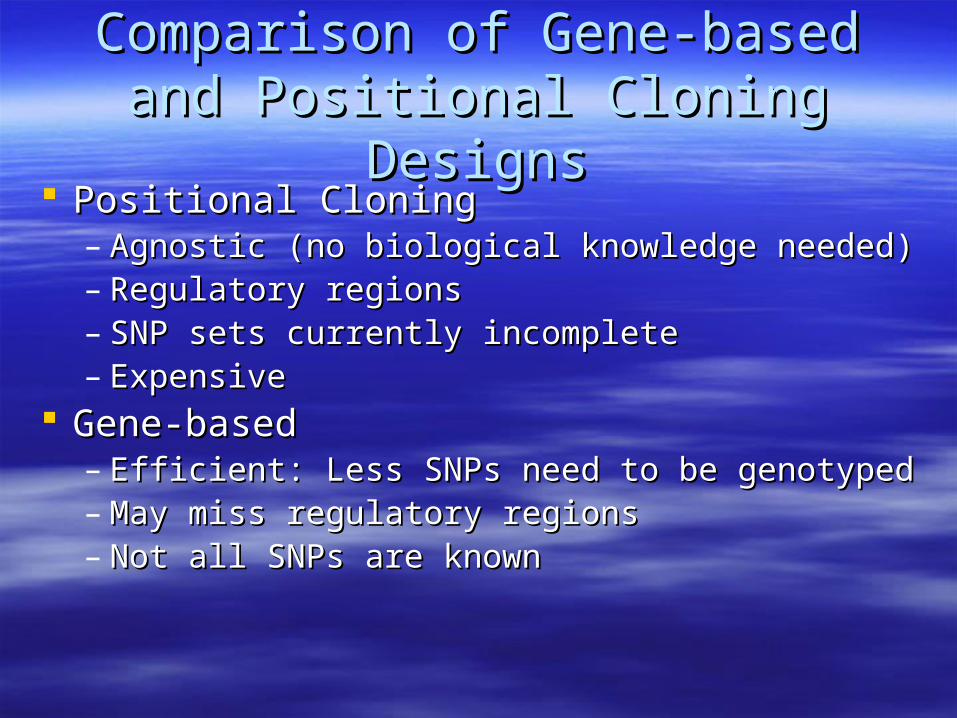
Comparison of Gene-based and Comparison of Gene-based and Positional Cloning DesignsPositional Cloning Designs
Positional CloningPositional Cloning– Agnostic (no biological knowledge needed)Agnostic (no biological knowledge needed)– Regulatory regionsRegulatory regions– SNP sets currently incompleteSNP sets currently incomplete– ExpensiveExpensive
Gene-basedGene-based– Efficient: Less SNPs need to be genotypedEfficient: Less SNPs need to be genotyped– May miss regulatory regionsMay miss regulatory regions– Not all SNPs are knownNot all SNPs are known
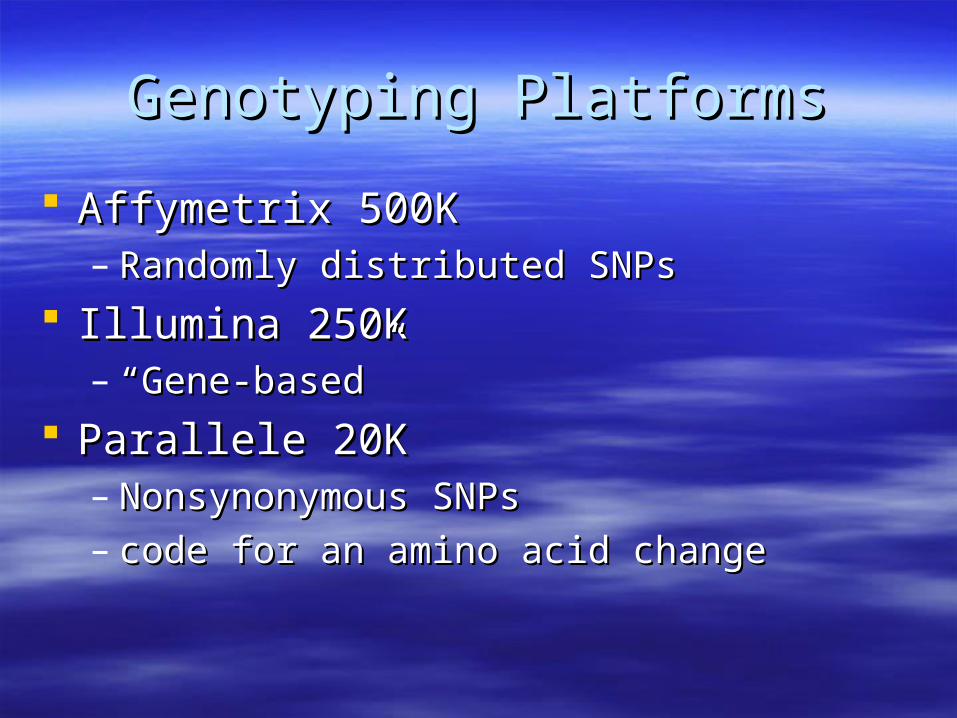
Genotyping PlatformsGenotyping Platforms
Affymetrix 500KAffymetrix 500K– Randomly distributed SNPsRandomly distributed SNPs
Illumina 250KIllumina 250K– ““Gene-based”Gene-based”
Parallele 20KParallele 20K– Nonsynonymous SNPsNonsynonymous SNPs– code for an amino acid changecode for an amino acid change

Multistage Study DesignsMultistage Study Designs

1,2,
3,…
……
……
……
……
,N
1,2,3,……………………………,M
SNPs
Sam
ples
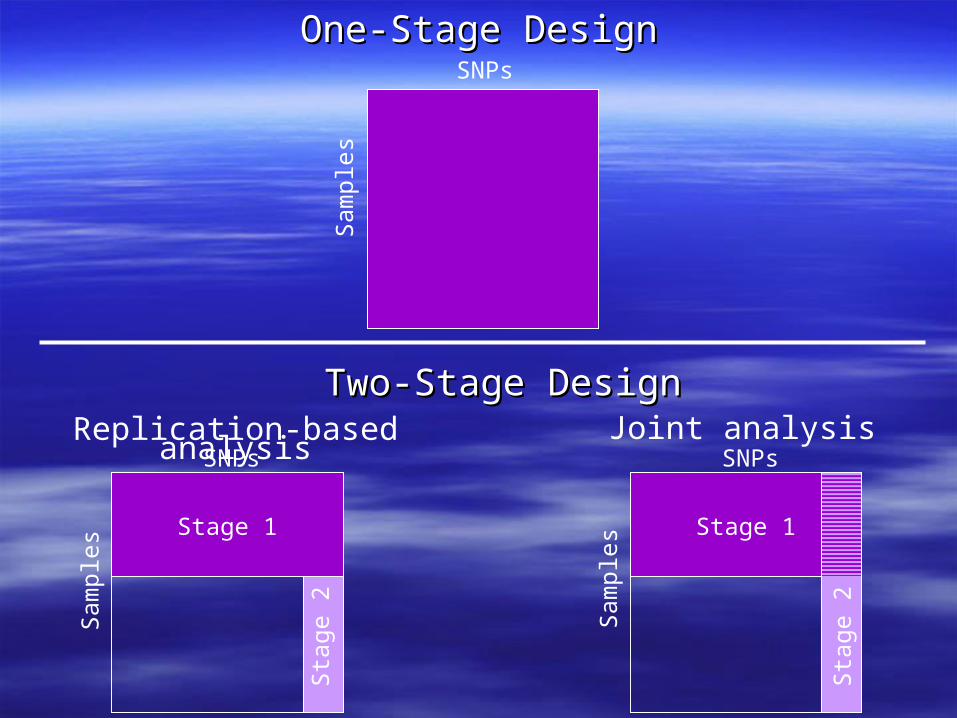
One-Stage DesignOne-Stage Design
Stage 1
Sta
ge 2
samples
markers
Two-Stage DesignTwo-Stage Design
1,2,3,……………………………,M
SNPs
Sam
ples
1,2,
3,…
……
……
……
……
,N
One- and Two-Stage GWA DesignsOne- and Two-Stage GWA Designs
SNPs
Sam
ples
Replication-based analysisSNPs
Sam
ples
Stage 1
Stag
e 2
One-Stage DesignOne-Stage Design
Joint analysisSNPs
Sam
ples
Stage 1
Stag
e 2
Two-Stage DesignTwo-Stage Design
Multistage DesignsMultistage Designs
Joint analysis is more power than replicationJoint analysis is more power than replication
p-value in Stage 1 must be liberalp-value in Stage 1 must be liberal
Lower cost—do Lower cost—do notnot gain power gain power
GWA studies have been publishedGWA studies have been published
Myocardial InfarctionMyocardial Infarction– 65K Gene-based SNPs65K Gene-based SNPs
Age related Macular DegenerationAge related Macular Degeneration– Affymetrix 100KAffymetrix 100K
Parkinson’s DiseaseParkinson’s Disease– Perlegen 200K chipPerlegen 200K chip– 1,793 SNPs in second stage1,793 SNPs in second stage
Myocardial InfarctionMyocardial Infarction
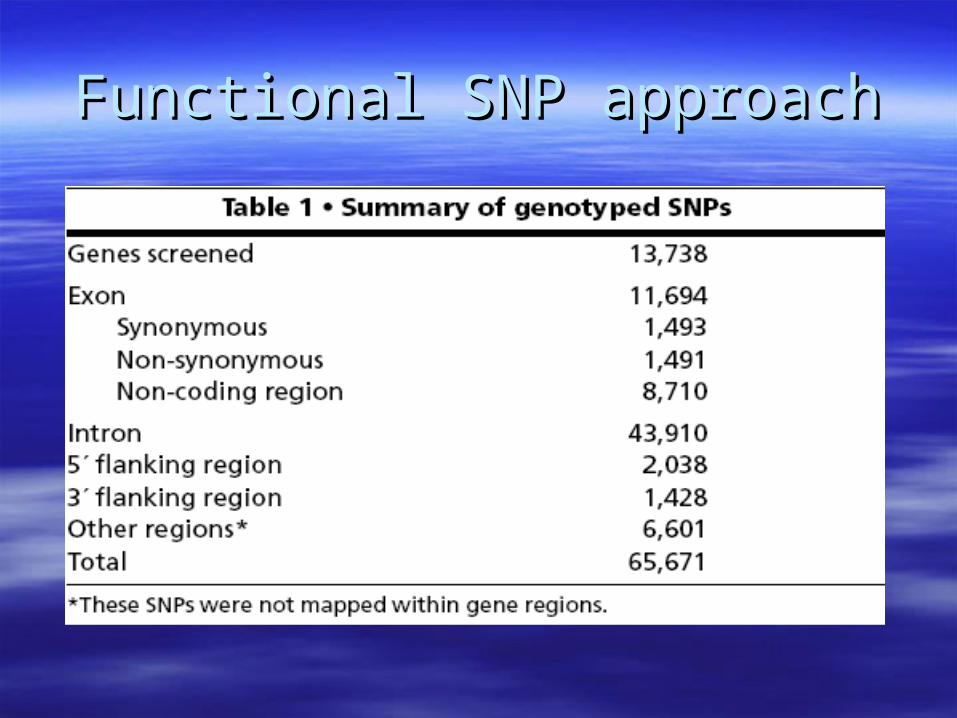
Functional SNP approachFunctional SNP approach
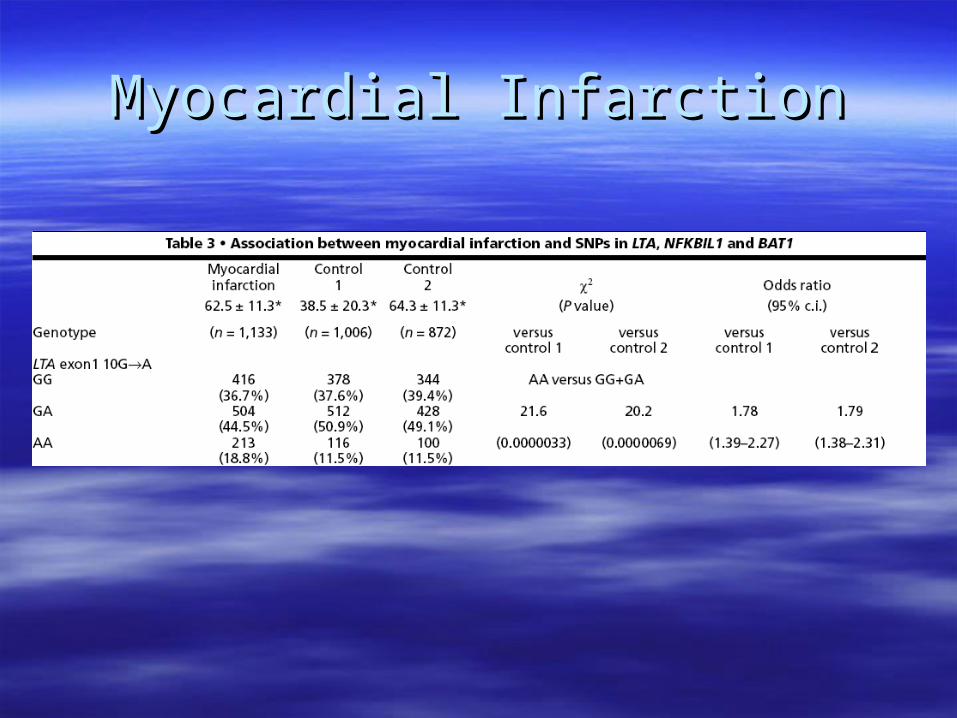
Myocardial InfarctionMyocardial Infarction
Macular DegenerationMacular Degeneration
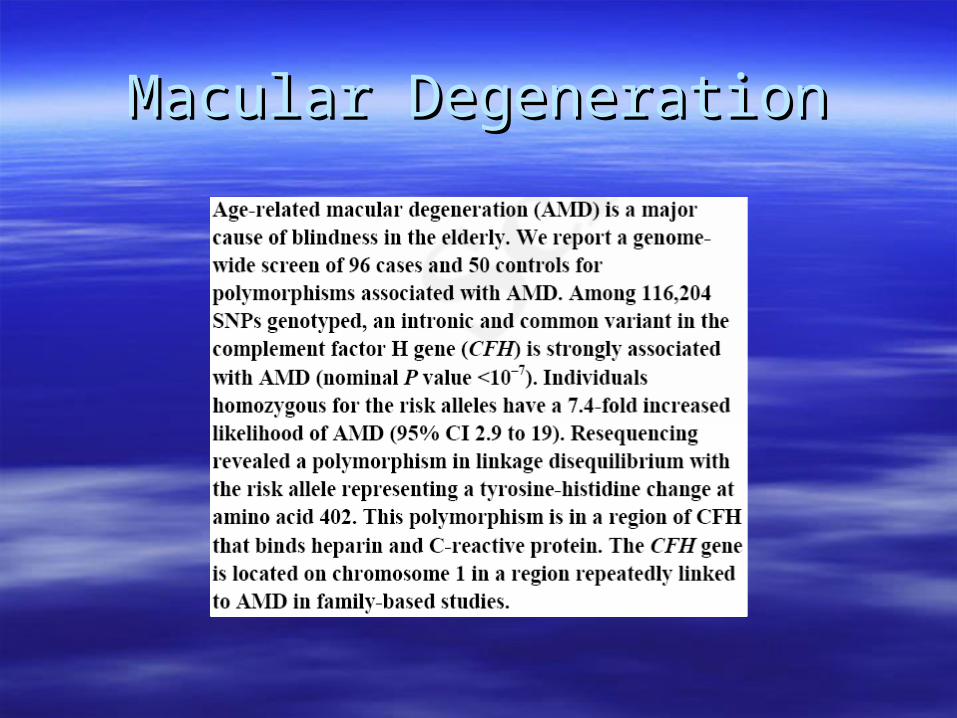
Macular DegenerationMacular Degeneration
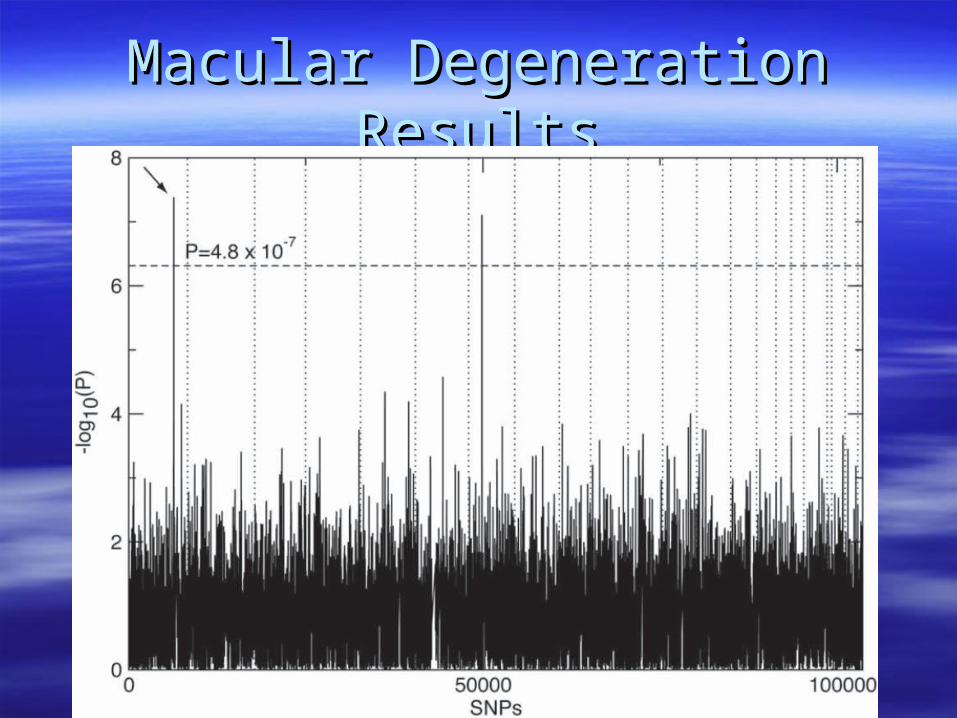
Macular Degeneration ResultsMacular Degeneration Results
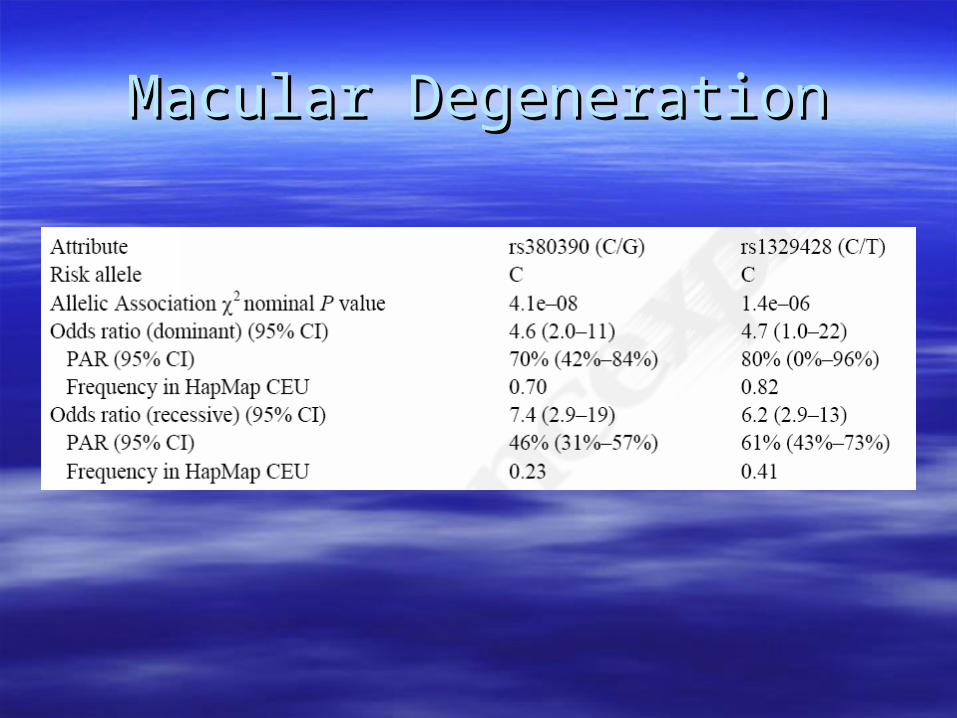
Macular DegenerationMacular Degeneration
Macular DegenerationMacular Degeneration
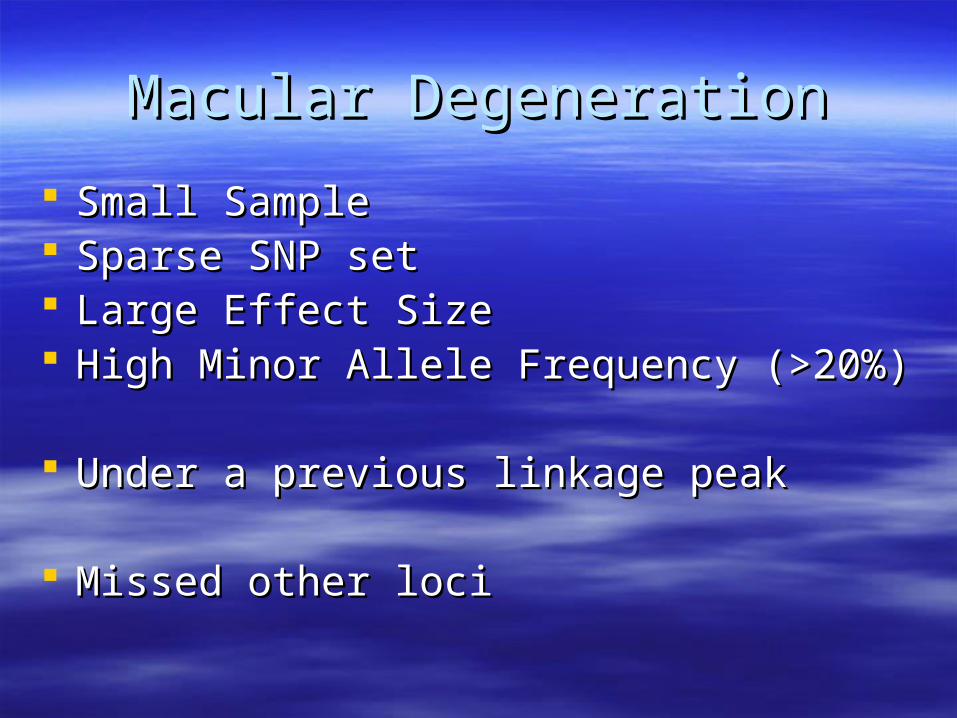
Small SampleSmall Sample Sparse SNP setSparse SNP set Large Effect SizeLarge Effect Size High Minor Allele Frequency (>20%)High Minor Allele Frequency (>20%)
Under a previous linkage peakUnder a previous linkage peak
Missed other lociMissed other loci
Parkinson’s DiseaseParkinson’s Disease
Parkinson’s DiseaseParkinson’s Disease
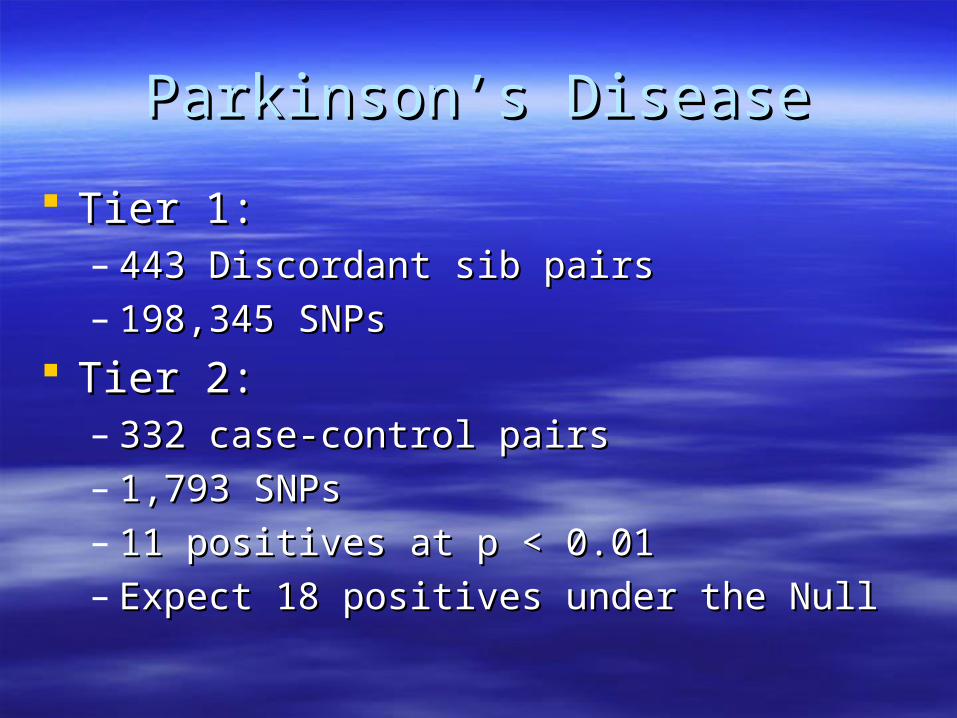
Tier 1:Tier 1:– 443 Discordant sib pairs443 Discordant sib pairs– 198,345 SNPs198,345 SNPs
Tier 2:Tier 2:– 332 case-control pairs332 case-control pairs– 1,793 SNPs1,793 SNPs– 11 positives at p < 0.0111 positives at p < 0.01– Expect 18 positives under the NullExpect 18 positives under the Null
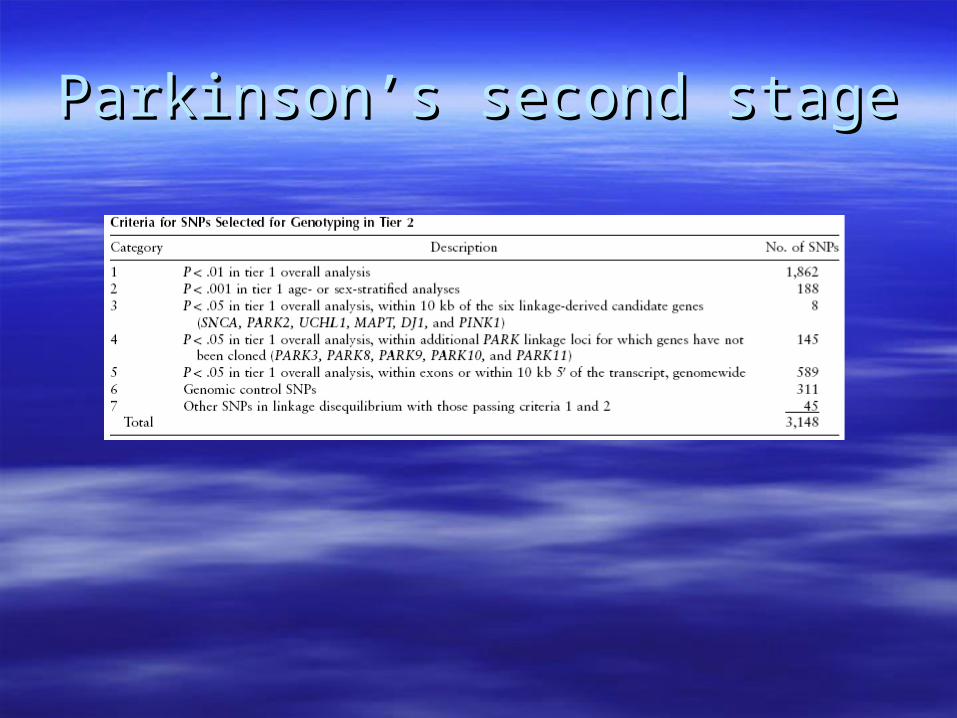
Parkinson’s second stageParkinson’s second stage


![Mendelian vs. Complex / Linkage vs. Associationyurii/courses/2013.04_Oporto/Mendelian vs...Mendelian vs. Complex / Linkage vs. Association Yurii S. Aulchenko yurii [dot] aulchenko](https://img.pdfslide.us/doc/110x75/5e1977d43e5a620c4c583f58/mendelian-vs-complex-linkage-vs-association-yuriicourses201304oportomendelian.jpg)