Embed Size (px)
Citation preview
ORIGINAL RESEARCHpublished: 17 July 2018
doi: 10.3389/fpls.2018.00987
Frontiers in Plant Science | www.frontiersin.org 1 July 2018 | Volume 9 | Article 987
Edited by:
Christophe Le May,
Agrocampus Ouest, France
Reviewed by:
Yessica Rico,
Instituto de Ecología (INECOL), Mexico
Sebastian Eves-van Den Akker,
University of Cambridge,
United Kingdom
*Correspondence:
Benjamin Mimee
Specialty section:
This article was submitted to
Plant Microbe Interactions,
a section of the journal
Frontiers in Plant Science
Received: 21 March 2018
Accepted: 18 June 2018
Published: 17 July 2018
Citation:
Gendron St-Marseille A-F, Lord E,
Véronneau P-Y, Brodeur J and
Mimee B (2018) Genome Scans
Reveal Homogenization and Local
Adaptations in Populations of the
Soybean Cyst Nematode.
Front. Plant Sci. 9:987.
doi: 10.3389/fpls.2018.00987
Genome Scans RevealHomogenization and LocalAdaptations in Populations of theSoybean Cyst NematodeAnne-Frédérique Gendron St-Marseille 1,2, Etienne Lord 1, Pierre-Yves Véronneau 1,
Jacques Brodeur 2 and Benjamin Mimee 1*
1 Saint-Jean-sur-Richelieu Research and Development Centre, Agriculture and Agri-Food Canada, Saint-Jean-sur-Richelieu,
QC, Canada, 2 Institut de Recherche en Biologie Végétale (IRBV), Université de Montréal, Montréal, QC, Canada
Determining the adaptive potential of alien invasive species in a new environment
is a key concern for risk assessment. As climate change is affecting local climatic
conditions, widespread modifications in species distribution are expected. Therefore, the
genetic mechanisms underlying local adaptations must be understood in order to predict
future species distribution. The soybean cyst nematode (SCN), Heterodera glycines
Ichinohe, is a major pathogen of soybean that was accidentally introduced in most
soybean-producing countries. In this study, we explored patterns of genetic exchange
between North American populations of SCN and the effect of isolation by geographical
distance. Genotyping-by-sequencing was used to sequence and compare 64 SCN
populations from the United States and Canada. At large scale, only a weak correlation
was found between genetic distance (Wright’s fixation index, FST) and geographic
distance, but local effects were strong in recently infested states. Our results also showed
a high level of genetic differentiation within some populations, allowing them to adapt to
new environments and become established in new soybean-producing areas. Bayesian
genome scan methods identified 15 loci under selection for climatic or geographic
co-variables. Among these loci, two non-synonymous mutations were detected in
SMAD-4 (mothers against decapentaplegic homolog 4) and DOP-3 (dopamine receptor
3). High-impact variants linked to these loci by genetic hitchhiking were also highlighted
as putatively involved in local adaptation of SCN populations to new environments.
Overall, it appears that strong selective pressure by resistant cultivars is causing a large
scale homogenization with virulent populations.
Keywords: Bayesian outlier detection, genetic diversity, genotyping-by-sequencing,Heterodera glycines, isolation
by distance
INTRODUCTION
The introduction of an organism into a new environment can have unpredictable detrimentalconsequences, including public health problems, losses in biodiversity and ecosystem services orcrop yield losses due to exotic weeds, insects and pathogens, altogether resulting in significanteconomic impact (Pimentel et al., 2005). Unfortunately, the steady increase in international trade
Gendron St-Marseille et al. Population Genetics of Heterodera glycines
facilitates the movement and introduction of new invasivespecies (Hulme, 2009). In addition, climate change is alteringenvironmental conditions and could change the species’distribution range or favor their establishment in previouslyunsuitable habitats (Early and Sax, 2014). It is thereforeimperative to carry out specific risk assessment in order to targetspecies to be controlled. Alien invasive species, by definition,did not evolve in the biogeographic habitat in which they areintroduced. Consequently, they are often poorly adapted to theirnew environment. Generally, the most successful invaders willhave a high potential for rapid adaptation through phenotypicplasticity or microevolution (Novak, 2007). Understanding thegenetic mechanisms of local adaptation is therefore critical topredict future species distribution.
Plant-parasitic nematodes are microscopic worms that reduceglobal annual food production by 12.3% and cause more thanUS$157 billion in economic losses worldwide (Hassan et al.,2013). In North America, one of the most damaging species isthe soybean cyst nematode (SCN), Heterodera glycines Ichinohe.Since its first detection in 1954 in Hanover County, NorthCarolina, SCN has been reported in almost every soybean-producing county in the United States (Davis and Tylka, 2000),as well as in southwestern Ontario, Canada (Anderson et al.,1988). During the 2000s, SCN colonized several new northernlocalities in the United States (North Dakota in 2003; Mathewet al., 2015) and Eastern Canada (northeastern Ontario in 2007and Québec in 2013; Mimee et al., 2014). A few studies haveinvestigated SCN dispersal, which seems to follow a northwardand eastward pathway in North America (Tylka and Marett,2017). This dispersion pattern correlates with the expansion ofsoybean cultivation following the introduction of new soybeanvarieties with shorter maturity periods and improved toleranceto drought and cold (Shurtleff and Aoyagi, 2010; Yu, 2011).
It is expected that SCN would survive and multiplythroughout the current North American soybean-growing areaand complete at least two generations at its northern limit(Gendron St-Marseille, 2013). Climate warming should also favorthe establishment of SCN at higher latitudes and increase thenumber of generations per year in most regions. However,these predictions are based strictly on temperature requirementsand do not account for the intrinsic capacity of SCN to adaptto new environmental conditions. Genetic variations within apopulation reflect its evolutionary potential and result from fourevolutionary forces that affect individual fitness: mutation, geneflow, selection, and genetic drift (Eizaguirre and Baltazar-Soares,2014). For most organisms, including SCN, the relative weightsof these forces can differ significantly. Mutations are rare eventsthat should not contribute significantly to SCN adaptations ina short time frame. Gene flow depends on the dispersal abilityof an organism, which for SCN is achieved mainly by means ofhuman activities at the short spatial scale (Kristjansson, 2010).In addition, wind and flooding can carry SCN cysts over verylong distances, and contribute to its dispersal at the regionaland continental scales. Many different selection pressures canshape the genetic structure of SCN populations, but host plantis probably the strongest selection factor. The ability of SCN toreproduce on a given soybean genotype differs greatly depending
on its resistance genes and the nematode’s virulence profile (HGtype) (Colgrove and Niblack, 2008; Niblack et al., 2008). Thus,management decisions by growers (for example, the systematicuse of resistant cultivars) can result in a strong selection pressure.Finally, the influence of genetic drift will also depend on pestcontrol strategies, because they contribute to dictate populationsize, although it was shown for cyst nematodes that geneticdiversity can be very high within a single cyst (Green et al.,1970). Each nematode female can mate with several males andlay hundreds of eggs that can survive for at least a decade in thesoil (Slack et al., 1972). Thus, even if the diversity appears reduceddue to genetic drift under strong selection by resistant cultivars,most alleles probably persist for several years in the population ina “dormant” state.
In other cyst nematode species, genetic diversity at thepopulation level has been studied by means of severaltechniques, including microsatellite markers, ITS-RFLP (internaltranscribed spacer–restriction fragment length polymorphism),RAPD (random amplified polymorphic DNA), and 2-DGE (two-dimensional gel electrophoresis) (e.g., Blok et al., 1997; Grenieret al., 2001; Plantard et al., 2008; Boucher et al., 2013). However,these methods focus only on specific sections of the genome,yield very few markers, or do not allow precise comparisonsamong populations. For example, Eves-van den Akker et al.(2015) recently published a metagenetic approach to genotypepopulations of the pale cyst nematode, Globodera pallida. Whilethis method was shown powerful to rapidly evaluate geneticdiversity and distribution of specific mitotypes, it is based on veryfew neutral markers, which prevent any assessment for selection.Genome scan is an interesting approach for the identification ofgenetic loci involved in adaptation to specific selection pressure.It was notably used in G. pallida to identify genomic regionsassociated with virulence on resistant potato cultivars (Eoche-Bosy et al., 2017).
Despite rapid advances in next-generation sequencing (NGS)technologies, sequencing a large number of individual genomesat high coverage in order to perform population genetic studiesremains very expensive and may require important quantitiesof DNA from individuals. Elshire et al. (2011) developed agenotyping-by-sequencing (GBS) protocol to rapidly identifysingle-nucleotide polymorphisms (SNPs). The GBS techniqueand other restriction-site-associated DNA (RAD) sequencingmethods produce large quantities of reads that do not cover theentire genome but have higher sequencing depth, thus reducingsequencing errors (Gautier et al., 2013; Anand et al., 2016). Locigenerated by GBS can be present in both coding and non-codingregions and will be shared between all populations owing to theconservation of restriction sites (Cariou et al., 2013). Finally,GBS does not require any prior genomic information for thespecies being studied, which is an important consideration forSCN since there is no reference genome yet. The optimal genecoverage to reduce the amount of missing data depends onthe choice of restriction enzyme (Fu et al., 2016). Fortunately,optimal gene coverage was already tested for the closely relatedspecies Globodera rostochiensis (Mimee et al., 2015).
The main objectives of this study were to (1) investigate thegenetic relationships among SCN populations fromUnited States
Frontiers in Plant Science | www.frontiersin.org 2 July 2018 | Volume 9 | Article 987
Gendron St-Marseille et al. Population Genetics of Heterodera glycines
and Canada, (2) detect isolation by geographical distance (IBD)between SCN populations from United States and Canada, (3)detect genetic loci under selection associated to environmentaland climatic parameters, and (4) identify the putative genefunctions contributing to the adaptation of SCN populations tospecific environmental conditions.
MATERIALS AND METHODS
Soybean Cyst Nematode PopulationsSampling and Genotyping-by-SequencingA total of 64 field populations of SCN, representative ofthe area currently infested in North America, were sampledor provided by collaborators from 11 US states (Delaware,Iowa, Illinois, Indiana, Kansas, Michigan, Minnesota, Missouri,North Dakota, Ohio, South Dakota) and one Canadianprovince (Ontario) (Figure 1). For DNA extraction, 40 cystswere randomly chosen from each population and pooledtogether. Eggs were extracted from each cyst and thenwashed twice in sterile filtered water. Total genomic DNAof each pool was extracted using the DNeasy Blood andTissue Kit (Qiagen, Mississauga, ON, Canada) following themanufacturer’s instructions. DNA extracts were quantified usingQubit fluorometric quantification (ThermoFisher Scientific,Burlington, ON, Canada) and normalized at 2 ng/µL prior tolibrary preparation and sequencing. These steps were performedfollowing standard protocols (Elshire et al., 2011; Poland et al.,2012) at the Institute for Integrative and Systems Biology (IBIS;Université Laval, Québec City, QC, Canada). Genotyping-by-sequencing was performed using themethod described byMimeeet al. (2015) with a combination of two restriction enzymes(PstI/MspI) (New England Biolabs, Whitby, ON, Canada). Afterthe restriction enzyme treatment, all samples (one compositeper field population) were barcoded and multiplexed to obtaina single library for the 64 samples, which was sequenced on threeIon Proton chips (ThermoFisher Scientific) at IBIS.
Single-Nucleotide Polymorphism CallingThe UNEAK pipeline (Lu et al., 2013), which is part of theTASSEL 3.0 bioinformatics analysis package (Bradbury et al.,2007), was used to process the raw reads, since no completereference genome is yet available for H. glycines. This pipelineis designed to call SNPs de novo, without a reference genomewith high stringency. Only sequences containing a single putativeSNP (1-bp mismatch) per sequencing read were kept. Beforeanalysis, the SNPs were further filtered with a minimum coverage(minCov) of 20 reads, a maximum coverage (maxCov) of 10,000reads, and a minimum allele frequency (MAF) of 0.01.
Population GeneticsClustering of SCN populations using PCA was carried out usingthe prcomp function from the stats package in R software (R CoreTeam, 2017). The poppr package (v2.4.1) in R (Kamvar et al.,2014) was used to investigate the genetic relationship betweenpopulations and to build a phylogenetic tree (Provesti’s distance,10,000 bootstraps, neighbor-joining algorithm counting missingdata as equivalent in the distance computation). Visualization of
sample coordinates and phylogenetic relationship analyses werecarried out using the phytools 0.6–20 package in R (Revell, 2017).
Fixation index (FST) values (Wright, 1943) were calculatedusing the classical approach (Hartl and Clark, 2007) with thePoPoolation2 software (Kofler et al., 2011) to evaluate the geneticdifferentiation between each pair of populations. Furthermore,the effect of isolation by distance on population structure wastested using the correlation between the genetic distance ratio[FST/(1–FST)], as defined by Rousset (1997), and the geographicdistance of population pairs in kilometers (km). The geographicdistance between each sample location was calculated withthe haversine formula using the geosphere package in R. Toexamine the significance of the relationship between the geneticdistance ratio and the pairwise geographic distance distances, weperformed a Mantel test (Spearman rank correlation) using thevegan package in R with 999 permutations. To evaluate the effectof time on population genetic differentiation, linear regressionanalyses were run in R software using pairwise FST distancesbased on a point of origin selected on the basis of the first reportsof SCN in North America. In our dataset, the closest sample tothe oldest population was located in Clarkton, Missouri (MO1)(Hegge, 1957; Tylka and Marett, 2017). To access the geneticisolation from the MO1 location, a Spearman rank correlation(rs) test was performed at a 0.95 confidence level.
Populations from three states (North Dakota, Minnesota,Illinois) were selected as case studies to evaluate the local (short-scale) genetic differentiation. These states were chosen becausethere were sufficient samples for comparison and because (i)North Dakota shows a recent introduction of SCN and acontinuous northward dispersal of the nematode (Nelson andBradley, 2003; Mathew et al., 2015); (ii) Minnesota has a longerhistory of SCN, with the nematode being first detected in1978 and the infested area still expanding each year (Zhenget al., 2006); (iii) in Illinois SCN has been well established inevery county for many years (Riggs, 2004; Tylka and Marett,2017).
Outlier Detection and Their AssociationWith Environmental VariablesTwo geographic and four climatic covariables were investigatedas possible factors explaining loci under selection: latitude(LAT), longitude (LONG), annual mean air temperature (BIO1),maximum air temperature of the warmest month (BIO5), annualprecipitation (BIO12), and total precipitation of the warmestquarter (BIO18). All climatic variables were retrieved fromthe WorldClim global climate database, version 1.4 (Fick andHijmans, 2017), corresponding to historic conditions (1960–1990). The spatial resolution used for the bioclimatic analysis wasset at 30 s or 0.86 km2.
To detect correlations between variations in populationallele frequencies of SNPs and environmental factors, we usedthree different Bayesian methods (software programs): BayPass,version 2.1 (Gautier, 2015), BayeScan, version 2.1 (Foll andGaggiotti, 2008), and BayeScEnv, version 1.1 (de Villemereuiland Gaggiotti, 2015). For each program, triplicate runs withdifferent random seeds were performed with a pilot run of
Frontiers in Plant Science | www.frontiersin.org 3 July 2018 | Volume 9 | Article 987
Gendron St-Marseille et al. Population Genetics of Heterodera glycines
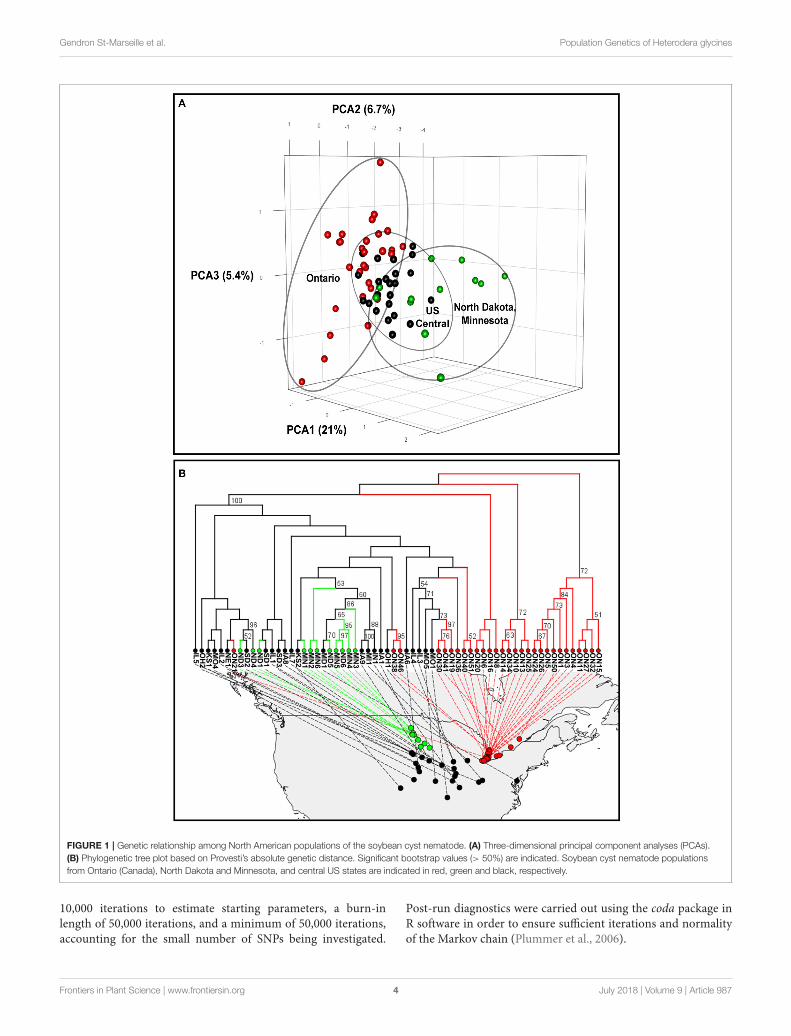
FIGURE 1 | Genetic relationship among North American populations of the soybean cyst nematode. (A) Three-dimensional principal component analyses (PCAs).
(B) Phylogenetic tree plot based on Provesti’s absolute genetic distance. Significant bootstrap values (> 50%) are indicated. Soybean cyst nematode populations
from Ontario (Canada), North Dakota and Minnesota, and central US states are indicated in red, green and black, respectively.
10,000 iterations to estimate starting parameters, a burn-inlength of 50,000 iterations, and a minimum of 50,000 iterations,accounting for the small number of SNPs being investigated.
Post-run diagnostics were carried out using the coda package inR software in order to ensure sufficient iterations and normalityof the Markov chain (Plummer et al., 2006).
Frontiers in Plant Science | www.frontiersin.org 4 July 2018 | Volume 9 | Article 987
Gendron St-Marseille et al. Population Genetics of Heterodera glycines
The first software, BayPass, identifies genetic markers subjectto selection by covariates such as phenotypic or environmentalvariables associated with the population of interest (Gautier,2015). This application is based on the BAYENVmodel proposedby Coop et al. (2010) and Günther and Coop (2013), but withseveral modifications detailed in Gautier (2015), including thereprogramming of the Markov chain Monte Carlo (MCMC)algorithm. For BayPass, we used a pool-size file with the –d0yij option set at 800 and 20 pilot runs with a length of10,000 iterations, a burn-in length of 50,000 iterations, anda chain length of 50,000 iterations. For each SNP, BayPassgenerates a Bayes factor (BF), quantifying evidence against thenull hypothesis, and an empirical Bayesian p-value (eBPis), ametric measuring the difference between observed data and asimulated set of data (posterior distribution) (Kass and Raftery,1995; Andraszewicz et al., 2015; Gautier, 2015). To be consideredunder selection, a SNP had to meet two criteria: a BF greater than10 (BF > 10) and an eBPis lower than 0.05 (eBPis < 0.05).
The second software, BayeScan, uses a Bayesian likelihoodmethod that assumes a Dirichlet distribution of allele frequenciesbetween populations (Foll, 2012). This program estimates theprobability that each locus is subject to selection by using alogistic regression on the two locus-population FST coefficients.This Bayesian method uses a reversible-jump MCMC algorithmto calculate a posterior probability that each locus is underselection. The decision criterion to determine whether a locus islikely to be under a strong selection is the q-value (Foll, 2012),analog to a false discovery rate (FDR) p-value, that must be under0.05. A second decision criterion was applied to further endorsethe selected outliers: the ratio of posterior probabilities (PO).The PO threshold to affirm that a locus was under selection,in comparison with a neutral model, was set to 0.91, whichcorresponds to a strong relationship on the Jeffreys scale (Foll,2012). We used BayeScan with the default parameters, but we setthe minimum number of iterations to 50,000, the length of 20pilot runs to 10,000 iterations, and the burn-in length to 50,000iterations.
The third software, BayeScEnv, is similar to BayeScan and usesthe FST index to detect loci with a high level of differentiationin comparison with the entire genome. This program allowsa normalization vector to be applied to the environmentaldata instead of only a binary combination, thus generating alower number of false positives, according to the creators ofthe software (de Villemereuil and Gaggiotti, 2015). We usedBayeScEnv with the default parameters, with the number ofiterations set to 50,000 and 20 pilot runs with a length of 10,000iterations. We used the reported q-value, which is related to theFDR, as our decision criterion, considering only SNPs with aq-value less than 0.05.
Localization of Outlier Loci, Gene Function,and Genic EnvironmentThe SNPs identified in short reads were first retrieved froma draft SCN genome available from SCNBase (https://www.scnbase.org/) by means of BLASTN with the default parameters,except for a smaller word size of 4, with the Blast2GO application
(Conesa et al., 2005). Many of the identified SNP-containingfragments matched multiple genes or genome locations (seeSupplementary Tables 3–5). To assign a putative gene functionto each SNP, we compared the aligned sequences to the NationalCenter for Biotechnology Information (NCBI) protein databaseby means of BLASTX and BLASTP (Altschul et al., 1990) ona subset of sequences (nematodes, taxid: 6231) or to all of theNCBI non-redundant (nr) sequence database with an E-valuesignificance cutoff of 1e−5.
As our GBS sequencing covers approximately 0.8% of thegenome (see Results section), we explored the genomic regionsaround outlier loci for genetic hitchhiking in whole-genomesequences from four populations of different origin and distinctvirulence profile (ON1, ON34, IL4, and KS2). Sequencinglibraries were prepared using the Nextera XT DNA LibraryPreparation Kit (Illumina, San Diego, CA) and sequenced ona MiSeq sequencer (Illumina) using the MiSeq Reagent Kit v3(600-cycle). Reads were demultiplexed using the Sabre softwareprogram (https://github.com/najoshi/sabre) and processed withTrimmomatic (v0.32) (Bolger et al., 2014) to remove adaptersand barcodes. Alignment on the draft reference genome (seeabove) was done using SAMtools (v0.1.19) (Li et al., 2009) andBWA (v0.7.12) (Li and Durbin, 2009). Only a window of ±50 kb around the 15 loci under selection was retained for thegenic environment analysis. Variants were called with freebayes(v1.0.2) (Garrison and Marth, 2012) and snpeff (v4.2) (Cingolaniet al., 2012). Distribution of allele frequencies in these fourpopulations for each gene variant was compared with the allelefrequency of the corresponding loci under selection in the samepopulation in the genotyping-by-sequencing dataset. Only SNPsexhibiting a similar allele frequency and having a high impact onthe predicted protein product were retained in our analysis.
RESULTS
Genotyping-by-SequencingA total of 192,576,709 short reads were obtained from thesequencing of the DNA from the 64 SCN populations, followingdigestion by the PstI/MspI restriction enzymes. The H. glycineseffective genome length was estimated to be 96,752,286 bp, withan average of one PstI restriction site every 12,688 bases (E.Lord, private communication, 2017). On the basis of the sequencesize used by the UNEAK (Universal Network-Enabled AnalysisKit) pipeline (first 64 bp of each read), the expected horizontalcoverage was approximately 0.8% of the total SCN genome, andthe vertical coverage at each locus, considering the number ofreads obtained, was 400×. Before filtering, the UNEAK pipelineidentified 3,172 variants. After filtering for low coverage andselecting only SNP variants, two datasets were generated. The firstdataset contained 245 SNPs without missing data (loci sequencedin all populations), and the second contained 804 SNPs withmissing data (Sequences and coverage in Supplementary Table 7).
Population StructurePrincipal Component AnalysisA principal component analysis (PCA) was performed using thedataset without missing data, which contained 245 SNPs. The
Frontiers in Plant Science | www.frontiersin.org 5 July 2018 | Volume 9 | Article 987
Gendron St-Marseille et al. Population Genetics of Heterodera glycines
PCA plot of the 64 North American SCN populations revealed ageographically ordered pattern (Figure 1A). Overall, the Ontariopopulations showed the greatest dispersion, indicating they aremore genetically differentiated, while the central regions ofthe US showed more clustered populations. Also, the groupcontaining populations from Minnesota and North Dakota (ingreen in Figure 1A) was clearly different from the Ontariopopulations by the first axis, which explained 21% of the totalvariation. All populations from the central states, although theyoriginated frommany states and covered amuch wider area, wereless diverse and more clustered together.
Phylogenetic TreeTo better understand the population structure of eachpopulation, we used the 804-SNP dataset to conduct aphylogenetic analysis based on Provesti’s distance. The inferredneighbor-joining phylogenetic tree (Figure 1B) showed thatmost of the Ontario samples (in red in Figure 1B) were differentfrom the rest of the North American populations. Some samplesfrom Ontario were found to be different from each others andmore similar to those of central states. Such a pattern can also beobserved in the PCA analysis (Figure 1A).
Genetic DifferentiationOverall, we observed an average value for Wright’s fixation index(FST) of 0.15 ± 0.07. However, pairwise genetic distance washighly variable, with a minimum FST of 0.005 and a maximumFST of 0.53 (Supplementary Table 1). The highest FST value wasfound between two of the most remote populations, ND6 fromNorth Dakota and ON41 fromOntario, which were separately byapproximately 1,720 km. On the other hand, the lowest FST valuewas observed between ON3 and ON5, which were separated byonly 17.9 km. In general, higher FST values were found in distantpopulations, especially between populations from Minnesota(MN4 and MN5), North Dakota (ND3 and ND6), South Dakota(SD2), and Ontario (ON6, ON13, ON25, ON41, and ON46).
Isolation by DistanceThe analysis of the relationship between genetic distance [FST/(1–FST)] and geographic distance (km) for all pairs of populationsrevealed a significant (p = 0.012) but weak effect of isolation bydistance, with a Mantel correlation (r) of only 0.135. However,when analyzing the effect of isolation by distance at the localscale, a different pattern was found.With respect to US states withrecent SCN history, a strong and significant positive correlationwas observed between the genetic and geographic distances inNorth Dakota (r = 0.430, p = 0.013) and Minnesota (r = 0.730,p = 0.006). In contrast, no correlation was found among thepopulations from Illinois (r =−0.170, p= 0.767).
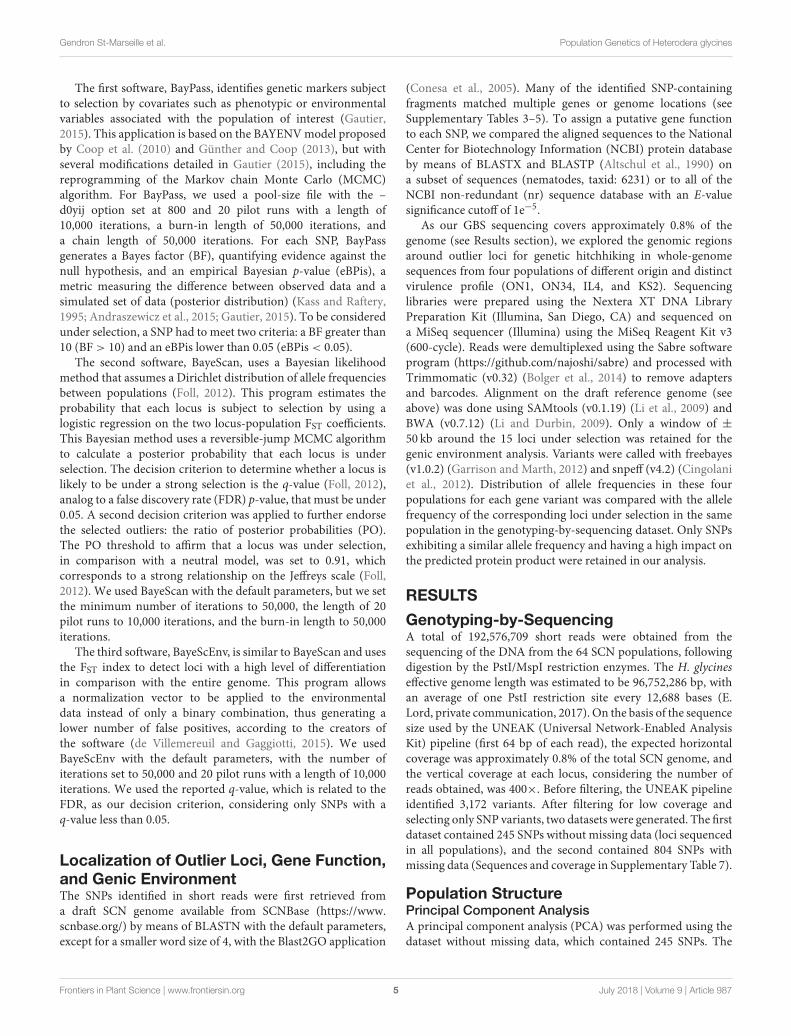
To further explore the contribution of isolation by distanceto the genetic differentiation of United States and Canadapopulations of SCN, we compared the genetic distance of eachpopulation from a theoretical ancestor population (MO1) usingthe 245-SNP dataset. This analysis included 38 independentpopulations that were separated by 273 to 1,367 km fromMO1 (Figure 2A). The genetic-distance ratio to the “oldestpopulation” varied from 0.06 for IL1 (386 km apart) to 0.52 for
FIGURE 2 | Distribution of soybean cyst nematode populations used in this
study (small dots) and identification of the “oldest” sample in the dataset
(MO1, large dot) (A) as well as the relationship between genetic distance
[FST/(1–FST )] and geographic distance (B). Linear regression line is shown
with 95% confidence intervals estimated using 1,000 bootstrap replicates.
ND6 (1,327 km apart) (Supplementary Table 2) and an overallmoderate (rs = 0.535) but significant (p = 0.001) relationshipwas observed between genetic distance and geographic distance(Figure 2B).
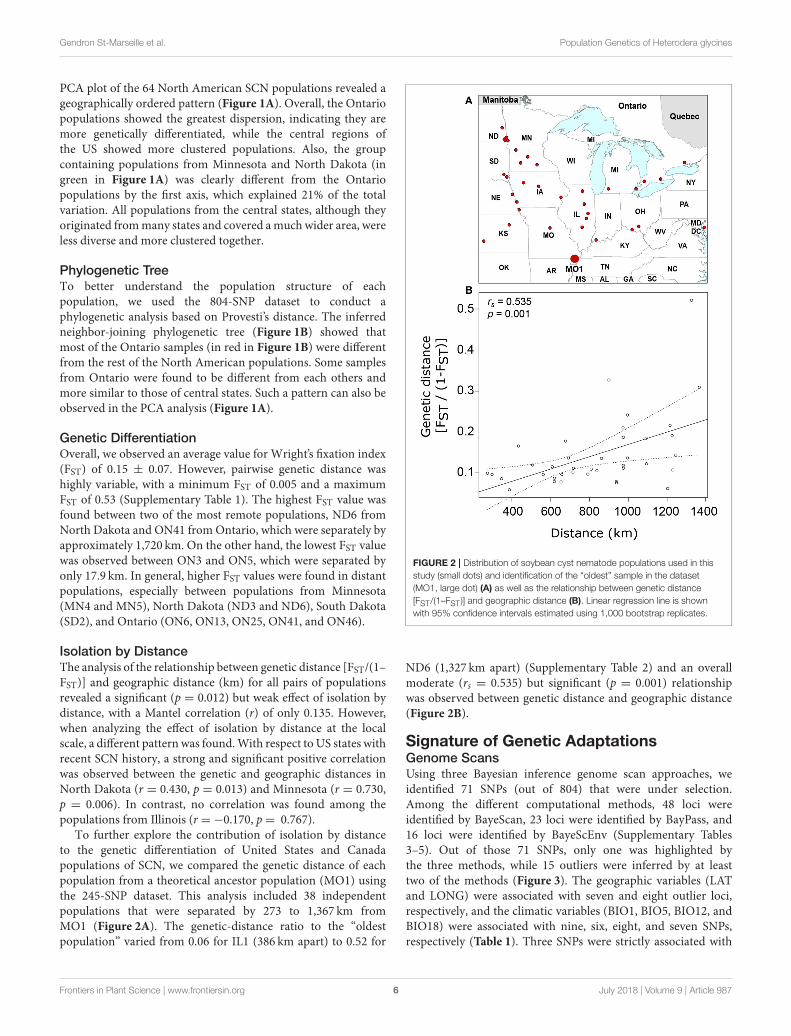
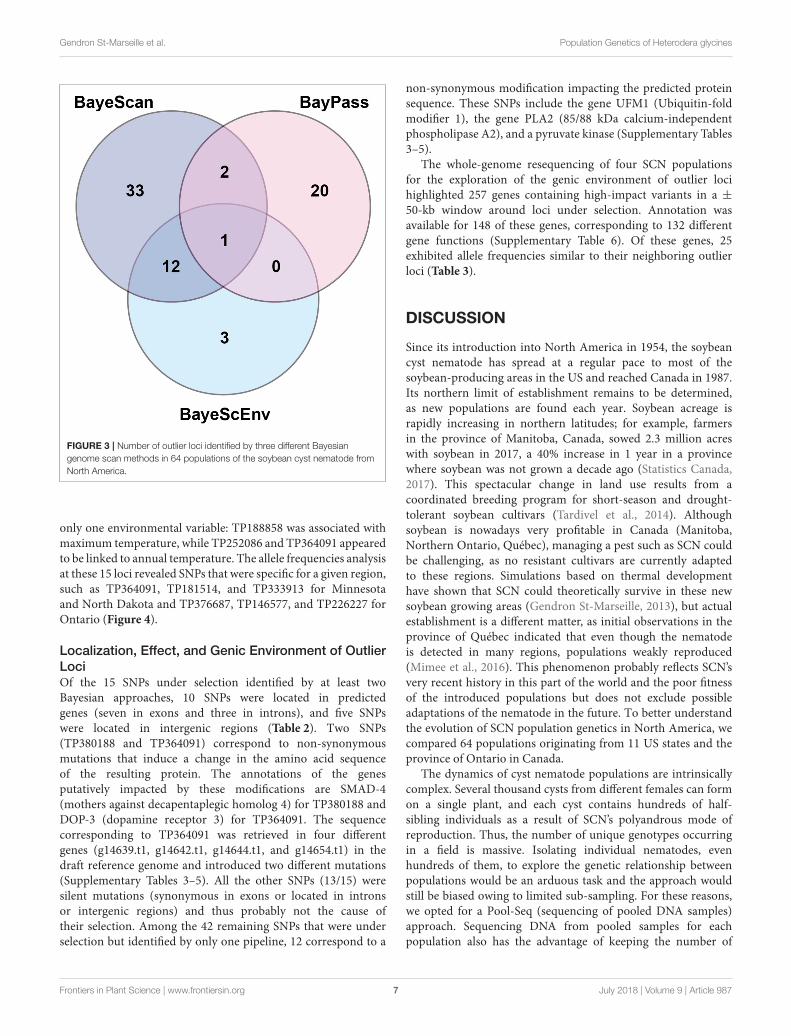
Signature of Genetic AdaptationsGenome ScansUsing three Bayesian inference genome scan approaches, weidentified 71 SNPs (out of 804) that were under selection.Among the different computational methods, 48 loci wereidentified by BayeScan, 23 loci were identified by BayPass, and16 loci were identified by BayeScEnv (Supplementary Tables3–5). Out of those 71 SNPs, only one was highlighted bythe three methods, while 15 outliers were inferred by at leasttwo of the methods (Figure 3). The geographic variables (LATand LONG) were associated with seven and eight outlier loci,respectively, and the climatic variables (BIO1, BIO5, BIO12, andBIO18) were associated with nine, six, eight, and seven SNPs,respectively (Table 1). Three SNPs were strictly associated with
Frontiers in Plant Science | www.frontiersin.org 6 July 2018 | Volume 9 | Article 987
Gendron St-Marseille et al. Population Genetics of Heterodera glycines
FIGURE 3 | Number of outlier loci identified by three different Bayesian
genome scan methods in 64 populations of the soybean cyst nematode from
North America.
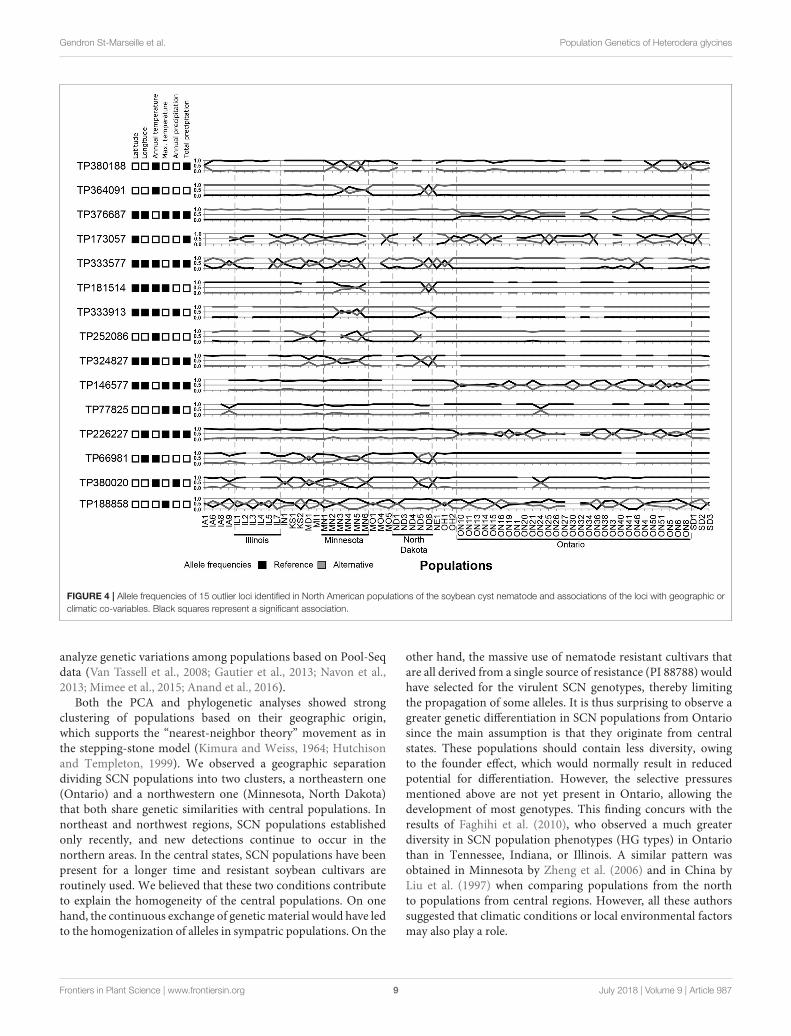
only one environmental variable: TP188858 was associated withmaximum temperature, while TP252086 and TP364091 appearedto be linked to annual temperature. The allele frequencies analysisat these 15 loci revealed SNPs that were specific for a given region,such as TP364091, TP181514, and TP333913 for Minnesotaand North Dakota and TP376687, TP146577, and TP226227 forOntario (Figure 4).
Localization, Effect, and Genic Environment of Outlier
LociOf the 15 SNPs under selection identified by at least twoBayesian approaches, 10 SNPs were located in predictedgenes (seven in exons and three in introns), and five SNPswere located in intergenic regions (Table 2). Two SNPs(TP380188 and TP364091) correspond to non-synonymousmutations that induce a change in the amino acid sequenceof the resulting protein. The annotations of the genesputatively impacted by these modifications are SMAD-4(mothers against decapentaplegic homolog 4) for TP380188 andDOP-3 (dopamine receptor 3) for TP364091. The sequencecorresponding to TP364091 was retrieved in four differentgenes (g14639.t1, g14642.t1, g14644.t1, and g14654.t1) in thedraft reference genome and introduced two different mutations(Supplementary Tables 3–5). All the other SNPs (13/15) weresilent mutations (synonymous in exons or located in intronsor intergenic regions) and thus probably not the cause oftheir selection. Among the 42 remaining SNPs that were underselection but identified by only one pipeline, 12 correspond to a
non-synonymous modification impacting the predicted proteinsequence. These SNPs include the gene UFM1 (Ubiquitin-foldmodifier 1), the gene PLA2 (85/88 kDa calcium-independentphospholipase A2), and a pyruvate kinase (Supplementary Tables3–5).
The whole-genome resequencing of four SCN populationsfor the exploration of the genic environment of outlier locihighlighted 257 genes containing high-impact variants in a ±
50-kb window around loci under selection. Annotation wasavailable for 148 of these genes, corresponding to 132 differentgene functions (Supplementary Table 6). Of these genes, 25exhibited allele frequencies similar to their neighboring outlierloci (Table 3).
DISCUSSION
Since its introduction into North America in 1954, the soybeancyst nematode has spread at a regular pace to most of thesoybean-producing areas in the US and reached Canada in 1987.Its northern limit of establishment remains to be determined,as new populations are found each year. Soybean acreage israpidly increasing in northern latitudes; for example, farmersin the province of Manitoba, Canada, sowed 2.3 million acreswith soybean in 2017, a 40% increase in 1 year in a provincewhere soybean was not grown a decade ago (Statistics Canada,2017). This spectacular change in land use results from acoordinated breeding program for short-season and drought-tolerant soybean cultivars (Tardivel et al., 2014). Althoughsoybean is nowadays very profitable in Canada (Manitoba,Northern Ontario, Québec), managing a pest such as SCN couldbe challenging, as no resistant cultivars are currently adaptedto these regions. Simulations based on thermal developmenthave shown that SCN could theoretically survive in these newsoybean growing areas (Gendron St-Marseille, 2013), but actualestablishment is a different matter, as initial observations in theprovince of Québec indicated that even though the nematodeis detected in many regions, populations weakly reproduced(Mimee et al., 2016). This phenomenon probably reflects SCN’svery recent history in this part of the world and the poor fitnessof the introduced populations but does not exclude possibleadaptations of the nematode in the future. To better understandthe evolution of SCN population genetics in North America, wecompared 64 populations originating from 11 US states and theprovince of Ontario in Canada.
The dynamics of cyst nematode populations are intrinsicallycomplex. Several thousand cysts from different females can formon a single plant, and each cyst contains hundreds of half-sibling individuals as a result of SCN’s polyandrous mode ofreproduction. Thus, the number of unique genotypes occurringin a field is massive. Isolating individual nematodes, evenhundreds of them, to explore the genetic relationship betweenpopulations would be an arduous task and the approach wouldstill be biased owing to limited sub-sampling. For these reasons,we opted for a Pool-Seq (sequencing of pooled DNA samples)approach. Sequencing DNA from pooled samples for eachpopulation also has the advantage of keeping the number of
Frontiers in Plant Science | www.frontiersin.org 7 July 2018 | Volume 9 | Article 987
Gendron St-Marseille et al. Population Genetics of Heterodera glycines
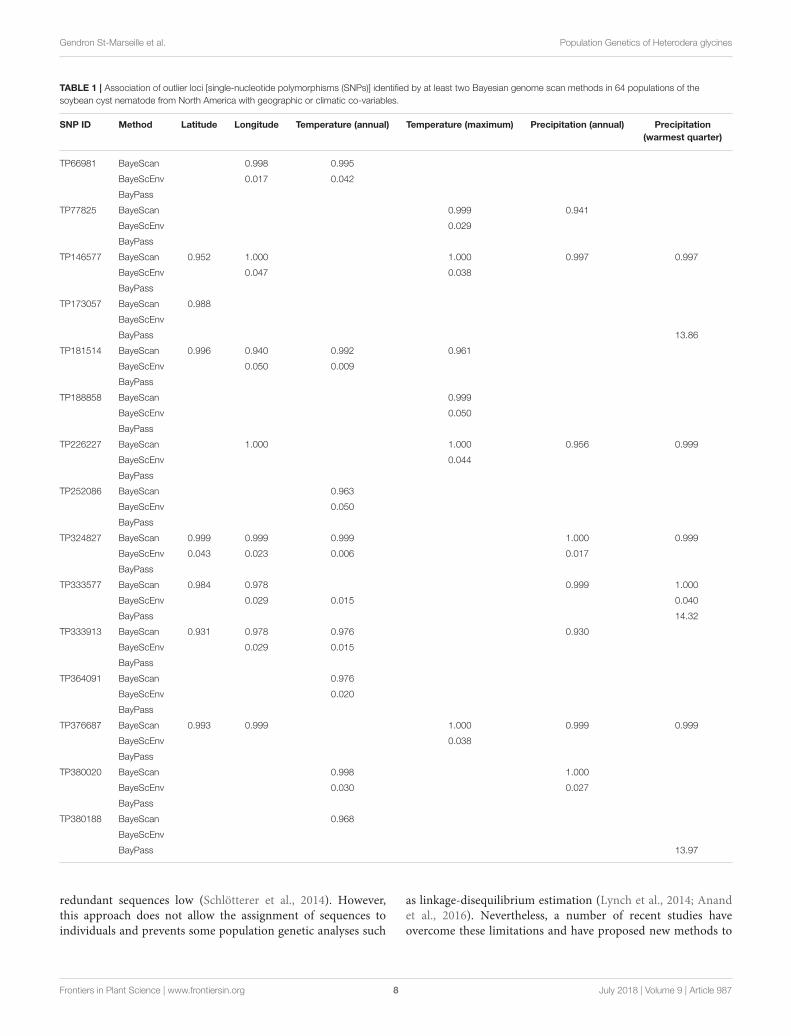
TABLE 1 | Association of outlier loci [single-nucleotide polymorphisms (SNPs)] identified by at least two Bayesian genome scan methods in 64 populations of the
soybean cyst nematode from North America with geographic or climatic co-variables.
SNP ID Method Latitude Longitude Temperature (annual) Temperature (maximum) Precipitation (annual) Precipitation
(warmest quarter)
TP66981 BayeScan 0.998 0.995
BayeScEnv 0.017 0.042
BayPass
TP77825 BayeScan 0.999 0.941
BayeScEnv 0.029
BayPass
TP146577 BayeScan 0.952 1.000 1.000 0.997 0.997
BayeScEnv 0.047 0.038
BayPass
TP173057 BayeScan 0.988
BayeScEnv
BayPass 13.86
TP181514 BayeScan 0.996 0.940 0.992 0.961
BayeScEnv 0.050 0.009
BayPass
TP188858 BayeScan 0.999
BayeScEnv 0.050
BayPass
TP226227 BayeScan 1.000 1.000 0.956 0.999
BayeScEnv 0.044
BayPass
TP252086 BayeScan 0.963
BayeScEnv 0.050
BayPass
TP324827 BayeScan 0.999 0.999 0.999 1.000 0.999
BayeScEnv 0.043 0.023 0.006 0.017
BayPass
TP333577 BayeScan 0.984 0.978 0.999 1.000
BayeScEnv 0.029 0.015 0.040
BayPass 14.32
TP333913 BayeScan 0.931 0.978 0.976 0.930
BayeScEnv 0.029 0.015
BayPass
TP364091 BayeScan 0.976
BayeScEnv 0.020
BayPass
TP376687 BayeScan 0.993 0.999 1.000 0.999 0.999
BayeScEnv 0.038
BayPass
TP380020 BayeScan 0.998 1.000
BayeScEnv 0.030 0.027
BayPass
TP380188 BayeScan 0.968
BayeScEnv
BayPass 13.97
redundant sequences low (Schlötterer et al., 2014). However,this approach does not allow the assignment of sequences toindividuals and prevents some population genetic analyses such
as linkage-disequilibrium estimation (Lynch et al., 2014; Anandet al., 2016). Nevertheless, a number of recent studies haveovercome these limitations and have proposed new methods to
Frontiers in Plant Science | www.frontiersin.org 8 July 2018 | Volume 9 | Article 987
Gendron St-Marseille et al. Population Genetics of Heterodera glycines
FIGURE 4 | Allele frequencies of 15 outlier loci identified in North American populations of the soybean cyst nematode and associations of the loci with geographic or
climatic co-variables. Black squares represent a significant association.
analyze genetic variations among populations based on Pool-Seqdata (Van Tassell et al., 2008; Gautier et al., 2013; Navon et al.,2013; Mimee et al., 2015; Anand et al., 2016).
Both the PCA and phylogenetic analyses showed strongclustering of populations based on their geographic origin,which supports the “nearest-neighbor theory” movement as inthe stepping-stone model (Kimura and Weiss, 1964; Hutchisonand Templeton, 1999). We observed a geographic separationdividing SCN populations into two clusters, a northeastern one(Ontario) and a northwestern one (Minnesota, North Dakota)that both share genetic similarities with central populations. Innortheast and northwest regions, SCN populations establishedonly recently, and new detections continue to occur in thenorthern areas. In the central states, SCN populations have beenpresent for a longer time and resistant soybean cultivars areroutinely used. We believed that these two conditions contributeto explain the homogeneity of the central populations. On onehand, the continuous exchange of geneticmaterial would have ledto the homogenization of alleles in sympatric populations. On the
other hand, the massive use of nematode resistant cultivars thatare all derived from a single source of resistance (PI 88788) wouldhave selected for the virulent SCN genotypes, thereby limitingthe propagation of some alleles. It is thus surprising to observe agreater genetic differentiation in SCN populations from Ontariosince the main assumption is that they originate from centralstates. These populations should contain less diversity, owingto the founder effect, which would normally result in reducedpotential for differentiation. However, the selective pressuresmentioned above are not yet present in Ontario, allowing thedevelopment of most genotypes. This finding concurs with theresults of Faghihi et al. (2010), who observed a much greaterdiversity in SCN population phenotypes (HG types) in Ontariothan in Tennessee, Indiana, or Illinois. A similar pattern wasobtained in Minnesota by Zheng et al. (2006) and in China byLiu et al. (1997) when comparing populations from the northto populations from central regions. However, all these authorssuggested that climatic conditions or local environmental factorsmay also play a role.
Frontiers in Plant Science | www.frontiersin.org 9 July 2018 | Volume 9 | Article 987
Gendron St-Marseille et al. Population Genetics of Heterodera glycines
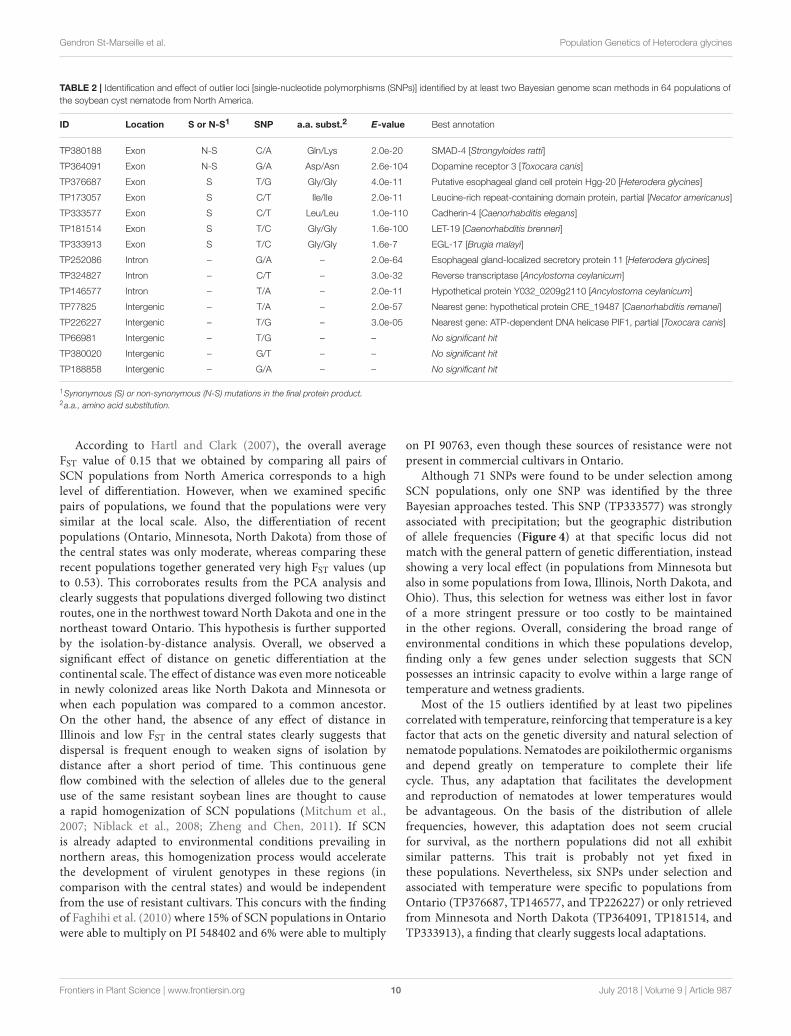
TABLE 2 | Identification and effect of outlier loci [single-nucleotide polymorphisms (SNPs)] identified by at least two Bayesian genome scan methods in 64 populations of
the soybean cyst nematode from North America.
ID Location S or N-S1 SNP a.a. subst.2 E-value Best annotation
TP380188 Exon N-S C/A Gln/Lys 2.0e-20 SMAD-4 [Strongyloides ratti]
TP364091 Exon N-S G/A Asp/Asn 2.6e-104 Dopamine receptor 3 [Toxocara canis]
TP376687 Exon S T/G Gly/Gly 4.0e-11 Putative esophageal gland cell protein Hgg-20 [Heterodera glycines]
TP173057 Exon S C/T Ile/Ile 2.0e-11 Leucine-rich repeat-containing domain protein, partial [Necator americanus]
TP333577 Exon S C/T Leu/Leu 1.0e-110 Cadherin-4 [Caenorhabditis elegans]
TP181514 Exon S T/C Gly/Gly 1.6e-100 LET-19 [Caenorhabditis brenneri]
TP333913 Exon S T/C Gly/Gly 1.6e-7 EGL-17 [Brugia malayi]
TP252086 Intron – G/A – 2.0e-64 Esophageal gland-localized secretory protein 11 [Heterodera glycines]
TP324827 Intron – C/T – 3.0e-32 Reverse transcriptase [Ancylostoma ceylanicum]
TP146577 Intron – T/A – 2.0e-11 Hypothetical protein Y032_0209g2110 [Ancylostoma ceylanicum]
TP77825 Intergenic – T/A – 2.0e-57 Nearest gene: hypothetical protein CRE_19487 [Caenorhabditis remanei]
TP226227 Intergenic – T/G – 3.0e-05 Nearest gene: ATP-dependent DNA helicase PIF1, partial [Toxocara canis]
TP66981 Intergenic – T/G – – No significant hit
TP380020 Intergenic – G/T – – No significant hit
TP188858 Intergenic – G/A – – No significant hit
1Synonymous (S) or non-synonymous (N-S) mutations in the final protein product.2a.a., amino acid substitution.
According to Hartl and Clark (2007), the overall averageFST value of 0.15 that we obtained by comparing all pairs ofSCN populations from North America corresponds to a highlevel of differentiation. However, when we examined specificpairs of populations, we found that the populations were verysimilar at the local scale. Also, the differentiation of recentpopulations (Ontario, Minnesota, North Dakota) from those ofthe central states was only moderate, whereas comparing theserecent populations together generated very high FST values (upto 0.53). This corroborates results from the PCA analysis andclearly suggests that populations diverged following two distinctroutes, one in the northwest toward North Dakota and one in thenortheast toward Ontario. This hypothesis is further supportedby the isolation-by-distance analysis. Overall, we observed asignificant effect of distance on genetic differentiation at thecontinental scale. The effect of distance was even more noticeablein newly colonized areas like North Dakota and Minnesota orwhen each population was compared to a common ancestor.On the other hand, the absence of any effect of distance inIllinois and low FST in the central states clearly suggests thatdispersal is frequent enough to weaken signs of isolation bydistance after a short period of time. This continuous geneflow combined with the selection of alleles due to the generaluse of the same resistant soybean lines are thought to causea rapid homogenization of SCN populations (Mitchum et al.,2007; Niblack et al., 2008; Zheng and Chen, 2011). If SCNis already adapted to environmental conditions prevailing innorthern areas, this homogenization process would acceleratethe development of virulent genotypes in these regions (incomparison with the central states) and would be independentfrom the use of resistant cultivars. This concurs with the findingof Faghihi et al. (2010) where 15% of SCN populations in Ontariowere able to multiply on PI 548402 and 6% were able to multiply
on PI 90763, even though these sources of resistance were notpresent in commercial cultivars in Ontario.
Although 71 SNPs were found to be under selection amongSCN populations, only one SNP was identified by the threeBayesian approaches tested. This SNP (TP333577) was stronglyassociated with precipitation; but the geographic distributionof allele frequencies (Figure 4) at that specific locus did notmatch with the general pattern of genetic differentiation, insteadshowing a very local effect (in populations from Minnesota butalso in some populations from Iowa, Illinois, North Dakota, andOhio). Thus, this selection for wetness was either lost in favorof a more stringent pressure or too costly to be maintainedin the other regions. Overall, considering the broad range ofenvironmental conditions in which these populations develop,finding only a few genes under selection suggests that SCNpossesses an intrinsic capacity to evolve within a large range oftemperature and wetness gradients.
Most of the 15 outliers identified by at least two pipelinescorrelated with temperature, reinforcing that temperature is a keyfactor that acts on the genetic diversity and natural selection ofnematode populations. Nematodes are poikilothermic organismsand depend greatly on temperature to complete their lifecycle. Thus, any adaptation that facilitates the developmentand reproduction of nematodes at lower temperatures wouldbe advantageous. On the basis of the distribution of allelefrequencies, however, this adaptation does not seem crucialfor survival, as the northern populations did not all exhibitsimilar patterns. This trait is probably not yet fixed inthese populations. Nevertheless, six SNPs under selection andassociated with temperature were specific to populations fromOntario (TP376687, TP146577, and TP226227) or only retrievedfrom Minnesota and North Dakota (TP364091, TP181514, andTP333913), a finding that clearly suggests local adaptations.
Frontiers in Plant Science | www.frontiersin.org 10 July 2018 | Volume 9 | Article 987
Gendron St-Marseille et al. Population Genetics of Heterodera glycines
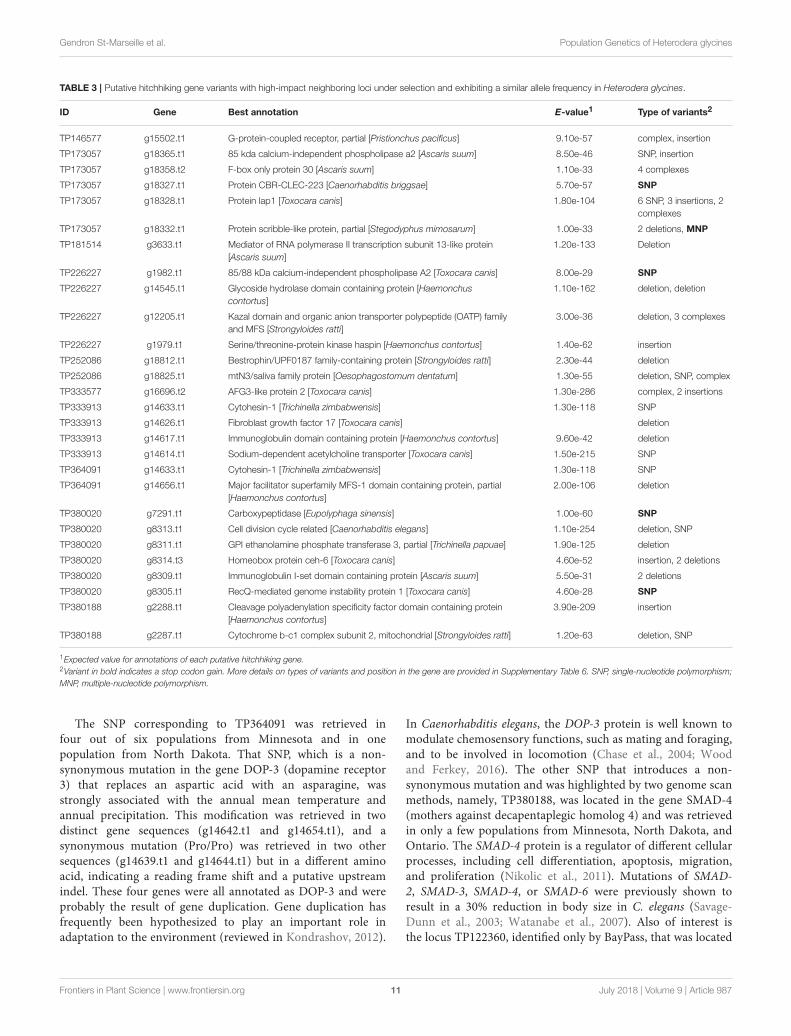
TABLE 3 | Putative hitchhiking gene variants with high-impact neighboring loci under selection and exhibiting a similar allele frequency in Heterodera glycines.
ID Gene Best annotation E-value1 Type of variants2
TP146577 g15502.t1 G-protein-coupled receptor, partial [Pristionchus pacificus] 9.10e-57 complex, insertion
TP173057 g18365.t1 85 kda calcium-independent phospholipase a2 [Ascaris suum] 8.50e-46 SNP, insertion
TP173057 g18358.t2 F-box only protein 30 [Ascaris suum] 1.10e-33 4 complexes
TP173057 g18327.t1 Protein CBR-CLEC-223 [Caenorhabditis briggsae] 5.70e-57 SNP
TP173057 g18328.t1 Protein lap1 [Toxocara canis] 1.80e-104 6 SNP, 3 insertions, 2
complexes
TP173057 g18332.t1 Protein scribble-like protein, partial [Stegodyphus mimosarum] 1.00e-33 2 deletions, MNP
TP181514 g3633.t1 Mediator of RNA polymerase II transcription subunit 13-like protein
[Ascaris suum]
1.20e-133 Deletion
TP226227 g1982.t1 85/88 kDa calcium-independent phospholipase A2 [Toxocara canis] 8.00e-29 SNP
TP226227 g14545.t1 Glycoside hydrolase domain containing protein [Haemonchus
contortus]
1.10e-162 deletion, deletion
TP226227 g12205.t1 Kazal domain and organic anion transporter polypeptide (OATP) family
and MFS [Strongyloides ratti]
3.00e-36 deletion, 3 complexes
TP226227 g1979.t1 Serine/threonine-protein kinase haspin [Haemonchus contortus] 1.40e-62 insertion
TP252086 g18812.t1 Bestrophin/UPF0187 family-containing protein [Strongyloides ratti] 2.30e-44 deletion
TP252086 g18825.t1 mtN3/saliva family protein [Oesophagostomum dentatum] 1.30e-55 deletion, SNP, complex
TP333577 g16696.t2 AFG3-like protein 2 [Toxocara canis] 1.30e-286 complex, 2 insertions
TP333913 g14633.t1 Cytohesin-1 [Trichinella zimbabwensis] 1.30e-118 SNP
TP333913 g14626.t1 Fibroblast growth factor 17 [Toxocara canis] deletion
TP333913 g14617.t1 Immunoglobulin domain containing protein [Haemonchus contortus] 9.60e-42 deletion
TP333913 g14614.t1 Sodium-dependent acetylcholine transporter [Toxocara canis] 1.50e-215 SNP
TP364091 g14633.t1 Cytohesin-1 [Trichinella zimbabwensis] 1.30e-118 SNP
TP364091 g14656.t1 Major facilitator superfamily MFS-1 domain containing protein, partial
[Haemonchus contortus]
2.00e-106 deletion
TP380020 g7291.t1 Carboxypeptidase [Eupolyphaga sinensis] 1.00e-60 SNP
TP380020 g8313.t1 Cell division cycle related [Caenorhabditis elegans] 1.10e-254 deletion, SNP
TP380020 g8311.t1 GPI ethanolamine phosphate transferase 3, partial [Trichinella papuae] 1.90e-125 deletion
TP380020 g8314.t3 Homeobox protein ceh-6 [Toxocara canis] 4.60e-52 insertion, 2 deletions
TP380020 g8309.t1 Immunoglobulin I-set domain containing protein [Ascaris suum] 5.50e-31 2 deletions
TP380020 g8305.t1 RecQ-mediated genome instability protein 1 [Toxocara canis] 4.60e-28 SNP
TP380188 g2288.t1 Cleavage polyadenylation specificity factor domain containing protein
[Haemonchus contortus]
3.90e-209 insertion
TP380188 g2287.t1 Cytochrome b-c1 complex subunit 2, mitochondrial [Strongyloides ratti] 1.20e-63 deletion, SNP
1Expected value for annotations of each putative hitchhiking gene.2Variant in bold indicates a stop codon gain. More details on types of variants and position in the gene are provided in Supplementary Table 6. SNP, single-nucleotide polymorphism;
MNP, multiple-nucleotide polymorphism.
The SNP corresponding to TP364091 was retrieved infour out of six populations from Minnesota and in onepopulation from North Dakota. That SNP, which is a non-synonymous mutation in the gene DOP-3 (dopamine receptor3) that replaces an aspartic acid with an asparagine, wasstrongly associated with the annual mean temperature andannual precipitation. This modification was retrieved in twodistinct gene sequences (g14642.t1 and g14654.t1), and asynonymous mutation (Pro/Pro) was retrieved in two othersequences (g14639.t1 and g14644.t1) but in a different aminoacid, indicating a reading frame shift and a putative upstreamindel. These four genes were all annotated as DOP-3 and wereprobably the result of gene duplication. Gene duplication hasfrequently been hypothesized to play an important role inadaptation to the environment (reviewed in Kondrashov, 2012).
In Caenorhabditis elegans, the DOP-3 protein is well known tomodulate chemosensory functions, such as mating and foraging,and to be involved in locomotion (Chase et al., 2004; Woodand Ferkey, 2016). The other SNP that introduces a non-synonymous mutation and was highlighted by two genome scanmethods, namely, TP380188, was located in the gene SMAD-4(mothers against decapentaplegic homolog 4) and was retrievedin only a few populations from Minnesota, North Dakota, andOntario. The SMAD-4 protein is a regulator of different cellularprocesses, including cell differentiation, apoptosis, migration,and proliferation (Nikolic et al., 2011). Mutations of SMAD-2, SMAD-3, SMAD-4, or SMAD-6 were previously shown toresult in a 30% reduction in body size in C. elegans (Savage-Dunn et al., 2003; Watanabe et al., 2007). Also of interest isthe locus TP122360, identified only by BayPass, that was located
Frontiers in Plant Science | www.frontiersin.org 11 July 2018 | Volume 9 | Article 987
Gendron St-Marseille et al. Population Genetics of Heterodera glycines
in the UFM1 (ubiquitin-fold modifier 1) genes (g7250.t1 andg7228.t1). A deletion in this gene in C. elegans, although reducingreproduction rate and life span, increased the survival of thisnematode under oxidative or heat stress (Hertel et al., 2013).
For the majority of the loci, their selection probably resultsfrom genetic hitchhiking rather than a direct contribution toadaptation. To explore that possibility, we analyzed the genicenvironment in a± 50 kb window around each SNP in four SCNpopulations. Genes containing high-impact genetic variationsand exhibiting the same allele frequencies as the associated SNPunder selection were of particular interest. Two of these genes(g18327.t1 and g15502.t1) coded for G-protein-coupled receptors(GPCR). These proteins are members of a large and very diversemultigene family with hundreds of occurrences in the C. elegansgenome (Bockaert and Pin, 1999; Bargmann, 2006). The GCPRare crucial in sensing the local environment and were shownto evolve following alterations in habitat or foraging behavior(Nei et al., 2008). Four genes coding for proteins implicated inmetabolite transport into the cell were also identified (g12205.t1,g14656.t1, g18812.t1, and g18825.t1), as was one gene involvedin the regulation of those proteins (g18365.t1). All these proteinsare required tomaintain homeostasis in the cell and to respond tolocal environmental changes. In a similar study using the fungusFagus sylvatica, Pluess et al. (2016) found that a version of apotassium transporter was associated with lower precipitationand could contribute to the regulation of growth under dryconditions. Structural changes in the body of an organism as aresult of microevolution can also confer a significant advantage interms of resisting more adverse environmental conditions, suchas drought or high temperatures (Hazel and Williams, 1990). Inour study, mutations were observed in two genes involved incell-membrane and cell-wall stability (g18328.t1 and g8311.t1).Lastly, modifications in genes involved in the regulation oftranscription (g2288.t1 and g3633.t1) and in the maturation ofproteins (g14633.t1 and g18358.t2) have the potential to radicallychange the proteome of the adapted organism.
Although some SCN genes were found to be under selectionand local adaptation was found to be underway in this study,our results also indicate that there is no critical adaptiveevent required for SCN establishment in northern latitudes.
Consequently, all populations should theoretically survive andmultiply at high latitudes. The risk is thus real for new soybeanareas where cultivars resistant to SCN are not available at thistime. Of course, the method we used does not explore the entiregenome, and a pan-genomic study of these populations couldreveal other loci under selection in an evolutionary process.
DATA AVAILABILITY STATEMENT
The raw data supporting the conclusions of this manuscript willbe made available by the authors, without undue reservation, toany qualified researcher.
AUTHOR CONTRIBUTIONS
BM, A-FG, and JB conceived and designed the experiments.A-FG, EL, and P-YV performed the experiments and analyzed thedata. A-FG, EL, and BM wrote the paper. All the authors revisedthe manuscript.
ACKNOWLEDGMENTS
The authors thank Drs. Thomas Baum and Andrew Severinfor graciously making SCN genome sequences available to usbefore public release on scnbase.org. The authors also thank TomWelacky (AAFC) and Terry Niblack (OSU) for providing SCNpopulations. The authors wish to acknowledge the contributionof Génome Québec, Genome Canada, the Government ofCanada, the Ministère de l’Économie, Science et Innovationdu Québec, Semences Prograin Inc., Syngenta Canada Inc.,Sevita Genetics, La Coop Fédérée, Grain Farmers of Ontario,Saskatchewan Pulse Growers, Manitoba Pulse and SoybeanGrowers, the Canadian Field Crop Research Alliance and LesProducteurs de grains du Québec.
SUPPLEMENTARY MATERIAL
The Supplementary Material for this article can be foundonline at: https://www.frontiersin.org/articles/10.3389/fpls.2018.00987/full#supplementary-material
REFERENCES
Altschul, S. F., Gish, W., Miller, W., Myers, E. W., and Lipman, D.J. (1990). Basic local alignment searchtool. J. Mol. Biol. 215, 403–410.doi: 10.1016/S0022-2836(05)80360-2
Anand, S., Mangano, E., Barizzone, N., Bordoni, R., Sorosina, M., Clarelli, F., et al.(2016). Next generation sequencing of pooled samples: guideline for variants’filtering. Sci. Rep. 6:33735. doi: 10.1038/srep33735
Anderson, T. R., Welacky, T. W., Olechowski, H. T., Ablett, G., and Ebsary, B.A. (1988). First report of Heterodera glycines on soybeans in Ontario, Canada.Plant Dis. 72:453. doi: 10.1094/PD-72-0453C
Andraszewicz, S., Scheibehenne, B., Rieskamp, J., Grasman, R., Verhagen, J., andWagenmakers, E.-J. (2015). An introduction to Bayesian hypothesis testing formanagement research. J. Manag. 41, 521–543. doi: 10.1177/0149206314560412
Bargmann, C. I. (2006). Comparative chemosensation from receptors to ecology.Nature 444, 295–301. doi: 10.1038/nature05402
Blok, V. C., Phillips, M. S., and Harrower, B. E. (1997). Comparisonof British populations of potato cyst nematodes with populations fromcontinental Europe and South America using RAPDs. Genome 40, 286–293.doi: 10.1139/g97-040
Bockaert, J., and Pin, J. P. (1999). Molecular tinkering of G protein-coupled receptors: an evolutionary success. EMBO J. 18, 1723–1729.doi: 10.1093/emboj/18.7.1723
Bolger, A. M., Lohse, M., and Usadel, B. (2014). Trimmomatic: a flexibletrimmer for illumina sequence data. Bioinformatics 30, 2114–2120.doi: 10.1093/bioinformatics/btu170
Boucher, A. C., Mimee, B., Montarry, J., Bardou-Valette, S., Bélair, G., Moffett, P.,et al. (2013). Genetic diversity of the golden potato cyst nematode Globoderarostochiensis and determination of the origin of populations in Quebec, Canada.Mol. Phylogenet. Evol. 69, 75–82. doi: 10.1016/j.ympev.2013.05.020
Bradbury, P. J., Zhang, Z., Kroon, D. E., Casstevens, T. M., Ramdoss, Y.,and Buckler, E. S. (2007). TASSEL: software for association mapping
Frontiers in Plant Science | www.frontiersin.org 12 July 2018 | Volume 9 | Article 987
Gendron St-Marseille et al. Population Genetics of Heterodera glycines
of complex traits in diverse samples. Bioinformatics 23, 2633–2635.doi: 10.1093/bioinformatics/btm308
Cariou, M., Duret, L., and Charlat, S. (2013). Is RAD-seq suitable for phylogeneticinference? An in silico assessment and optimization. Ecol. Evol. 3, 846–852.doi: 10.1002/ece3.512
Chase, D. L., Pepper, J. S., and Koelle, M. R. (2004). Mechanism of extrasynapticdopamine signaling in Caenorhabditis elegans. Nat. Neurosci. 7, 1096–1103.doi: 10.1038/nn1316
Cingolani, P., Platts, A., Wang, L. L., Coon, M., Nguyen, T., Wang, L., et al.(2012). A program for annotating and predicting the effects of single nucleotidepolymorphisms, SnpEff: SNPs in the genome of Drosophila melanogaster strainw1118; iso-2; iso-3. Fly 6, 80–92. doi: 10.4161/fly.19695
Colgrove, A. L., and Niblack, T. L. (2008). Correlation of female indicesfrom virulence assays on inbred lines and field populations of Heterodera
glycines. J. Nematol. 40, 39–45.Conesa, A., Götz, S., García-Gómez, J. M., Terol, J., Talón, M., and Robles,
M. (2005). Blast2GO: a universal tool for annotation, visualization andanalysis in functional genomics research. Bioinformatics 21, 3674–3676.doi: 10.1093/bioinformatics/bti610
Coop, G., Witonsky, D., Di Rienzo, A., and Pritchard, J. K. (2010). Usingenvironmental correlations to identify loci underlying local adaptation.Genetics 185, 1411–1423. doi: 10.1534/genetics.110.114819
Davis, E. L., and Tylka, G. L. (2000). Soybean cyst nematode disease. Plant HealthInstr. doi: 10.1094/PHI-I-2000-0725-01
de Villemereuil, P., and Gaggiotti, O. E. (2015). A new FST-based method touncover local adaptation using environmental variables. Meth. Ecol. Evol. 6,1248–1258. doi: 10.1111/2041-210X.12418
Early, R., and Sax, D. F. (2014). Climatic niche shifts between species’ native andnaturalized ranges raise concern for ecological forecasts during invasions andclimate change. Glob. Ecol. Biogeogr. 23, 1356–1365. doi: 10.1111/geb.12208
Eizaguirre, C., and Baltazar-Soares, M. (2014). Evolutionary conservation-evaluating the adaptive potential of species. Evol. Appl. 7, 963–967.doi: 10.1111/eva.12227
Elshire, R. J., Glaubitz, J. C., Sun, Q., Poland, J. A., Kawamoto, K., Buckler, E. S.,et al. (2011). A robust, simple genotyping-by-sequencing (GBS) approach forhigh diversity species. PLoS ONE 6:e19379. doi: 10.1371/journal.pone.0019379
Eoche-Bosy, D., Gautier, M., Esquibet, M., Legeai, F., Bretaudeau, A., Bouchez,O., et al. (2017). Genome scans on experimentally evolved populations revealcandidate regions for adaptation to plant resistance in the potato cyst nematodeGlobodera pallida.Mol. Ecol. 26, 4700–4711. doi: 10.1111/mec.14240
Eves-van den Akker, S., Lilley, C. J., Reid, A., Pickup, J., Anderson, E., Cock,P. J., et al. (2015). A metagenetic approach to determine the diversity anddistribution of cyst nematodes at the level of the country, the field and theindividual.Mol. Ecol. 24, 5842–5851. doi: 10.1111/mec.13434
Faghihi, J., Donald, P. A., Noel, G., Welacky, T. W., and Ferris, V. R. (2010).Soybean resistance to field populations of Heterodera glycines in selectedgeographic areas. Plant Health Prog. doi: 10.1094/PHP-2010-0426-01-RS
Fick, S. E., and Hijmans, R. J. (2017). WorldClim 2: new 1-km spatial resolutionclimate surfaces for global land areas. Int. J. Climatol. 37, 4302–4315.doi: 10.1002/joc.5086
Foll, M. (2012). BayeScan v2.1 UserManual. Available online at: http://cmpg.unibe.ch/software/BayeScan/files/BayeScan2.1_manual.pdf
Foll, M., and Gaggiotti, O. E. (2008). A genome-scan method to identify selectedloci appropriate for both dominant and codominant markers: a Bayesianperspective. Genetics 180, 977–993. doi: 10.1534/genetics.108.092221
Fu, Y.-B., Peterson, G. W., and Dong, Y. (2016). Increasing genomesampling and improving SNP genotyping for genotyping-by-sequencingwith new combinations of restriction enzymes. G3 6, 845–856.doi: 10.1534/g3.115.025775
Garrison, E., and Marth, G. (2012). Haplotype-Based Variant Detection fromShort-Read Sequencing. arXiv [preprint] arXiv:1207.3907.
Gautier, M. (2015). Genome-wide scan for adaptive divergence andassociation with population-specific covariates. Genetics 201, 1555–1579.doi: 10.1534/genetics.115.181453
Gautier, M., Gharbi, K., Cezard, T., Foucaud, J., Kerdelhué, C., Pudlo, P.,et al. (2013). The effect of RAD allele dropout on the estimation ofgenetic variation within and between populations. Mol. Ecol. 22, 3165–3178.doi: 10.1111/mec.12089
Gendron St-Marseille, A.-F. (2013). Le nématode à Kyste du Soja (Heteroderaglycines) : Enjeux des Changements Climatiques sur sa Distribution, saReproduction et sur les Probabilités de Synchronisme Avec le Soja (Glycinemax) au Québec. Master’s Thesis, Université de Sherbrooke, Sherbrooke, QC.Available online at: http://hdl.handle.net/11143/7214
Green, C. D., Greet, D. N., and Jones, F. G. W. (1970). The influence of multiplemating on the reproduction and genetics of Heterodera rostochiensis and H.
schachtii. Nematologica 16, 309–326. doi: 10.1163/187529270X00333Grenier, E., Bossis, M., Fouville, D., Renault, L., and Mugniéry, D. (2001).
Molecular approaches to the taxonomic position of Peruvian potato cystnematodes and gene pool similarities in indigenous and imported populationsof Globodera. Heredity 86, 277–290. doi: 10.1046/j.1365-2540.2001.00826.x
Günther, T., and Coop, G. (2013). Robust identification of local adaptation fromallele frequencies. Genetics 195, 205–220. doi: 10.1534/genetics.113.152462
Hartl, D. L., and Clark, A. G. (2007). Principles of Population Genetics. 4th Edn.Sunderland, Massachusetts Sinauer Associates.
Hassan, M. A., Pham, T. H., Shi, H., and Zheng, J. (2013). Nematodes threatsto global food security. Acta. Agric. Scand. B. Soil Plant Sci. 63, 420–425.doi: 10.1080/09064710.2013.794858
Hazel, J. R., and Williams, E. E. (1990). The role of alterations in membrane lipidcomposition in enabling physiological adaptation of organisms to their physicalenvironment. Prog. Lipid Res. 29, 167–227. doi: 10.1016/0163-7827(90)90002-3
Hegge, A. H. (1957). Soybean cyst nematode, Heterodera glycines, in Missouri.Plant Dis. Rep. 41:201.
Hertel, P., Daniel, J., Stegehake, D., Vaupel, H., Kailayangiri, S., Gruel, C.,et al. (2013). The ubiquitin-fold modifier 1 (Ufm1) cascade of Caenorhabditiselegans. J. Biol. Chem. 288, 10661–10671. doi: 10.1074/jbc.M113.458000
Hulme, P. E. (2009). Trade, transport and trouble: managing invasivespecies pathways in an era of globalization. J. Appl. Ecol. 46, 10–18.doi: 10.1111/j.1365-2664.2008.01600.x
Hutchison, D. W., and Templeton, A. R. (1999). Correlation of pairwise geneticand geographic distance measures: inferring the relative influences of gene flowand drift on the distribution of genetic variability. Evolution 53, 1898–1914.doi: 10.1111/j.1558-5646.1999.tb04571.x
Kamvar, Z. N., Tabima, J. F., and Grünwald, N. J. (2014). Poppr: an R packagefor genetic analysis of populations with clonal, partially clonal, and/or sexualreproduction. PeerJ 2:e281. doi: 10.7717/peerj.281
Kass, R. E., and Raftery, A. E. (1995). Bayes factors. J. Am. Stat. Assoc. 90, 773–795.doi: 10.1080/01621459.1995.10476572
Kimura, M., and Weiss, G. H. (1964). The stepping stone model of populationstructure and the decrease of genetic correlation with distance. Genetics 49,561–576.
Kofler, R., Pandey, R. V., and Schlötterer, C. (2011). PoPoolation2: identifyingdifferentiation between populations using sequencing of pooled DNA samples(pool-Seq). Bioinformatics 27, 3435–3436. doi: 10.1093/bioinformatics/btr589
Kondrashov, F. A. (2012). Gene duplication as a mechanism of genomicadaptation to a changing environment. Proc. R. Soc. B. 279, 5048–5057.doi: 10.1098/rspb.2012.1108
Kristjansson, G. (2010). 09−59.Plant Health Risk Assessment Unit of the ScienceAdvice Division: Canadian Food Inspection Agency. 45p.
Li, H., and Durbin, R. (2009). Fast and accurate short read alignmentwith Burrows–Wheeler Transform. Bioinformatics 25, 1754–1760.doi: 10.1093/bioinformatics/btp324
Li, H., Handsaker, B., Wysoker, A., Fennell, T., Ruan, J., Homer, N., et al.(2009). The sequence alignment/map format and SAMtools. Bioinformatics 25,2078–2079. doi: 10.1093/bioinformatics/btp352
Liu, X. H., Li, J. Q., and Zhang, D. S. (1997). History and status of soybean cystnematode in China. Int. J. Nematol. 7, 18–25.
Lu, F., Lipka, A. E., Glaubitz, J., Elshire, R., Cherney, J. H., Casler, M. D., et al.(2013). Switchgrass genomic diversity, ploidy, and evolution: novel insightsfrom a network-based SNP discovery protocol. PLoS Genet. 9:e1003215.doi: 10.1371/journal.pgen.1003215
Lynch, M., Bost, D., Wilson, S., Maruki, T., and Harrison, S. (2014). Population-genetic inference from pooled-sequencing data. Genome Biol. Evol. 6,1210–1218. doi: 10.1093/gbe/evu085
Mathew, F., Markell, S., Jantzi, D., Yan, G., Nelson, B., and Helms, T. (2015).Soybean cyst nematode. Plant Disease Management. Fargo, ND: North DakotaState University Extension Service), p. 4.
Frontiers in Plant Science | www.frontiersin.org 13 July 2018 | Volume 9 | Article 987
Gendron St-Marseille et al. Population Genetics of Heterodera glycines
Mimee, B., Duceppe, M.-O., Véronneau, P.-Y., Lafond-Lapalme, J., Jean, M.,Belzile, F., et al. (2015). A new method for studying population genetics of cystnematodes based on Pool-Seq and genomewide allele frequency analysis. Mol.
Ecol. Resour. 15, 1356–1365. doi: 10.1111/1755-0998.12412Mimee, B., Gagnon, A.-È., Colton-Gagnon, K., and Tremblay, É. (2016). Portrait
de la situation du nématode à kyste du soja (Heterodera glycines) au Québec(2013–2015). Phytoprotection 96, 33–42. doi: 10.7202/1038941ar
Mimee, B., Peng, H., Popovic, V., Yu, Q., Duceppe, M.-O., Tétreault, M.-P.,et al. (2014). First report of soybean cyst nematode (Heterodera glycines
Ichinohe) on soybean in the province of Quebec, Canada. Plant Dis. 98:429.doi: 10.1094/PDIS-07-13-0782-PDN
Mitchum, M. G., Wrather, J. A., Heinz, R. D., Shannon, J. G., andDanekas, G. (2007). Variability in distribution and virulence phenotypesof Heterodera glycines in Missouri during 2005. Plant Dis. 91, 1473–1476.doi: 10.1094/PDIS-91-11-1473
Navon, O., Sul, J. H., Han, B., Conde, L., Bracci, P. M., Riby, J., et al. (2013).Rare variant association testing under low-coverage sequencing. Genetics 194,769–779. doi: 10.1534/genetics.113.150169
Nei, M., Niimura, Y., and Nozawa, M. (2008). The evolution of animalchemosensory receptor gene repertoires: roles of chance and necessity. Nat.Rev. Genet. 9, 951–963. doi: 10.1038/nrg2480
Nelson, B. D., and Bradley, C. A. (2003). Soybean cyst nematode (SCN). Fargo,ND: North Dakota State University. Available online at: https://www.ndsu.edu/pubweb/$\sim$bernelso/soydiseases/cyst.shtml
Niblack, T. L., Colgrove, A. L., Colgrove, K., and Bond, J. P. (2008). Shift invirulence of soybean cyst nematode is associated with use of resistance fromPI 88788. Plant Health Prog. doi: 10.1094/PHP-2008-0118-01-RS
Nikolic, A., Kojic, S., Knezevic, S., Krivokapic, Z., Ristanovic, M., andRadojkovic, D. (2011). Structural and functional analysis of SMAD4 genepromoter in malignant pancreatic and colorectal tissues: detection of twonovel polymorphic nucleotide repeats. Cancer Epidemiol. 35, 265–271.doi: 10.1016/j.canep.2010.10.002
Novak, S. J. (2007). The role of evolution in the invasion process. PNAS 104,3671–3672. doi: 10.1073/pnas.0700224104
Pimentel, D., Zuniga, R., and Morrison, D. (2005). Update on the environmentaland economic costs associated with alien-invasive species in the United States.Ecol. Econ. 52, 273–288. doi: 10.1016/j.ecolecon.2004.10.002
Plantard, O., Picard, D., Valette, S., Scurrah, M., Grenier, E., and Mugniéry,D. (2008). Origin and genetic diversity of Western European populationsof the potato cyst nematode (Globodera pallida) inferred frommitochondrial sequences and microsatellite loci. Mol. Ecol. 17, 2208–2218.doi: 10.1111/j.1365-294X.2008.03718.x
Pluess, A. R., Frank, A., Heiri, C., Lalagüe, H., Vendramin, G. G., and Oddou-Muratorio, S. (2016). Genome–environment association study suggests localadaptation to climate at the regional scale in Fagus sylvatica. New Phytol. 210,589–601. doi: 10.1111/nph.13809
Plummer, M., Best, N., Cowles, K., and Vines, K. (2006). CODA: convergencediagnosis and output analysis for MCMC. R News 6, 7–11. Available online at:http://oro.open.ac.uk/22547/
Poland, J. A., Brown, P. J., Sorrells, M. E., and Jannink, J. L. (2012).Development of high-density genetic maps for barley and wheat using anovel two-enzyme genotyping-by-sequencing approach. PLoS ONE 7:e32253.doi: 10.1371/journal.pone.0032253
R Core Team (2017). R: A Language and Environment For Statistical Computing.Vienna, R Foundation for Statistical Computing. Available online at: http://www.R-project.org/
Revell, L. J. (2017). Phylogenetic Tools for Comparative Biology (and other things).Available online at: https://cran.r-project.org/web/packages/phytools/phytools.pdf
Riggs, R. D. (2004). “History and distribution,” in Biology and Management
of Soybean Cyst Nematode, 2nd Edn, eds D. P. Schmitt, J. A. Wrather,
R. D. Riggs (Marceline, MO: Schmitt and Associates of Marceline),9–40.
Rousset, F. (1997). Genetic differentiation and estimation of gene flow fromF-statistics under isolation by distance. Genetics 145, 1219–1228.
Savage-Dunn, C., Maduzia, L. L., Zimmerman, C. M., Roberts, A. F., Cohen,S., Tokarz, R., et al. (2003). Genetic screen for small body size mutants inC. elegans reveals many TGFβ pathway components. Genesis 35, 239–247.doi: 10.1002/gene.10184
Schlötterer, C., Tobler, R., Kofler, R., and Nolte, V. (2014). Sequencing pools ofindividuals – Mining genome-wide polymorphism data without big funding.Nat. Rev. Genetics 15, 749–763. doi: 10.1038/nrg3803
Shurtleff, W., and Aoyagi, A. (2010). History of Soybeans and Soyfoods in Canada
(1831–2010): Extensively Annotated Bibliography and Sourcebook. Lafayette,CA: Soyinfo Center.
Slack, D. A., Riggs, R. D., and Hamblen, M. L. (1972). The effect of temperatureand moisture on the survival of Heterodera glycines in the absence of a host. J.Nematol. 4, 263–266.
Statistics Canada (2017). Table 001–0017–Estimated Areas, Yield, Production,
Average Farm Price and Total Farm Value of Principal Field Crops, in Imperial
Units, Annual, CANSIM (Database). [Accessed: November 20, 2017]. Availableonline at: http://www5.statcan.gc.ca/cansim/a26?lang=eng&id=10017
Tardivel, A., Sonah, H., Belzile, F., and O’Donoughue, L. S. (2014). Rapididentification of alleles at the soybean maturity gene E3 using genotypingby sequencing and a haplotype-based approach. Plant Genome 7, 1–9.doi: 10.3835/plantgenome2013.10.0034
Tylka, G. L., and Marett, C. C. (2017). Known distribution of the soybean cystnematode, Heterodera glycines, in the United States and Canada: 1954 to 2017.Plant Health Prog. 18, 167–168. doi: 10.1094/PHP-05-17-0031-BR
Van Tassell, C., Smith, T. P., Matukumalli, L. K., Taylor, J. F., Schnabel, R. D.,Taylor, L., et al. (2008). SNP discovery and allele frequency estimation bydeep sequencing of reduced representation libraries. Nat. Methods 5, 247–252.doi: 10.1038/nmeth.1185
Watanabe, N., Ishihara, T., and Ohshima, Y. (2007). Mutants carrying two sma
mutations are super small in the nematode C. elegans. Genes Cells 12, 603–609.doi: 10.1111/j.1365-2443.2007.01077.x
Wood, J. F., and Ferkey, D. M. (2016). “GRK roles in C. elegans,” in G Protein-
Coupled Receptor Kinases, eds V. V. Gurevich, and J. J. G. Tesmer (New York,NY: Springer), 283–299.
Wright, S. (1943). Isolation by distance. Genetics 28, 114–138.Yu, Q. (2011). “Soybean cyst nematode (Heterodera glycines ichinohe),” in Soybean
Physiology and Biochemistry, ed H. A. El-Shemy (Rijeka: InTech Europe),461–474. Available online at: http://cdn.intechopen.com/pdfs-wm/22782.pdf
Zheng, J., Li, Y., and Chen, S. (2006). Characterization of the virulencephenotypes of Heterodera glycines in Minnesota. J. Nematol. 38, 383–390.
Zheng, J. Z., and Chen, S. Y. (2011). Estimation of virulence type and level ofsoybean cyst nematode field populations in response to resistant cultivars. J.Entomol. Nematol. 3, 37–43. Available online at: http://www.academicjournals.org/journal/JEN/article-abstract/791181810204
Conflict of Interest Statement: The authors declare that the research wasconducted in the absence of any commercial or financial relationships that couldbe construed as a potential conflict of interest.
Copyright © 2018 Her Majesty the Queen in Right of Canada, as represented
by Agriculture and Agri-Food Canada (AAFC). This is an open-access article
distributed under the terms of the Creative Commons Attribution License (CC BY).
The use, distribution or reproduction in other forums is permitted, provided the
original author(s) and the copyright owner(s) are credited and that the original
publication in this journal is cited, in accordance with accepted academic practice.
No use, distribution or reproduction is permitted which does not comply with these
terms.
Frontiers in Plant Science | www.frontiersin.org 14 July 2018 | Volume 9 | Article 987