Embed Size (px)
Citation preview
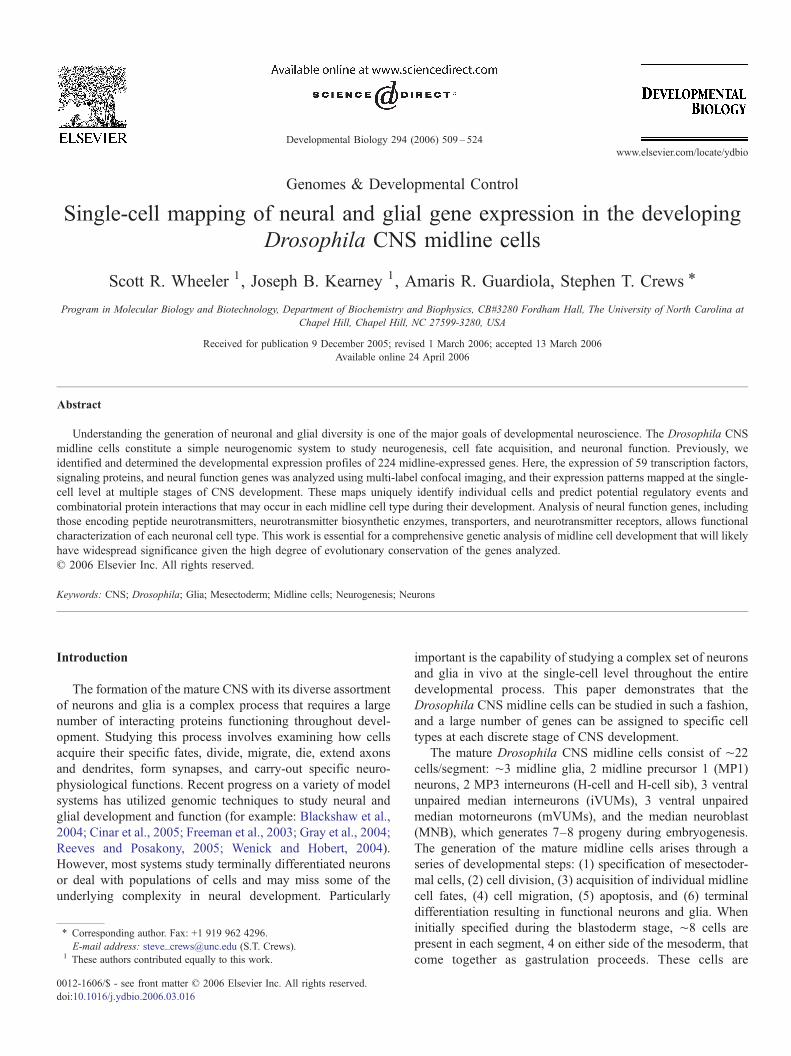
Developmental Biology 294 (2006) 509–524www.elsevier.com/locate/ydbio
Genomes & Developmental Control
Single-cell mapping of neural and glial gene expression in the developingDrosophila CNS midline cells
Scott R. Wheeler 1, Joseph B. Kearney 1, Amaris R. Guardiola, Stephen T. Crews ⁎
Program in Molecular Biology and Biotechnology, Department of Biochemistry and Biophysics, CB#3280 Fordham Hall, The University of North Carolina atChapel Hill, Chapel Hill, NC 27599-3280, USA
Received for publication 9 December 2005; revised 1 March 2006; accepted 13 March 2006Available online 24 April 2006
Abstract
Understanding the generation of neuronal and glial diversity is one of the major goals of developmental neuroscience. The Drosophila CNSmidline cells constitute a simple neurogenomic system to study neurogenesis, cell fate acquisition, and neuronal function. Previously, weidentified and determined the developmental expression profiles of 224 midline-expressed genes. Here, the expression of 59 transcription factors,signaling proteins, and neural function genes was analyzed using multi-label confocal imaging, and their expression patterns mapped at the single-cell level at multiple stages of CNS development. These maps uniquely identify individual cells and predict potential regulatory events andcombinatorial protein interactions that may occur in each midline cell type during their development. Analysis of neural function genes, includingthose encoding peptide neurotransmitters, neurotransmitter biosynthetic enzymes, transporters, and neurotransmitter receptors, allows functionalcharacterization of each neuronal cell type. This work is essential for a comprehensive genetic analysis of midline cell development that will likelyhave widespread significance given the high degree of evolutionary conservation of the genes analyzed.© 2006 Elsevier Inc. All rights reserved.
Keywords: CNS; Drosophila; Glia; Mesectoderm; Midline cells; Neurogenesis; Neurons
Introduction
The formation of the mature CNS with its diverse assortmentof neurons and glia is a complex process that requires a largenumber of interacting proteins functioning throughout devel-opment. Studying this process involves examining how cellsacquire their specific fates, divide, migrate, die, extend axonsand dendrites, form synapses, and carry-out specific neuro-physiological functions. Recent progress on a variety of modelsystems has utilized genomic techniques to study neural andglial development and function (for example: Blackshaw et al.,2004; Cinar et al., 2005; Freeman et al., 2003; Gray et al., 2004;Reeves and Posakony, 2005; Wenick and Hobert, 2004).However, most systems study terminally differentiated neuronsor deal with populations of cells and may miss some of theunderlying complexity in neural development. Particularly
⁎ Corresponding author. Fax: +1 919 962 4296.E-mail address: [email protected] (S.T. Crews).
1 These authors contributed equally to this work.
0012-1606/$ - see front matter © 2006 Elsevier Inc. All rights reserved.doi:10.1016/j.ydbio.2006.03.016
important is the capability of studying a complex set of neuronsand glia in vivo at the single-cell level throughout the entiredevelopmental process. This paper demonstrates that theDrosophila CNS midline cells can be studied in such a fashion,and a large number of genes can be assigned to specific celltypes at each discrete stage of CNS development.
The mature Drosophila CNS midline cells consist of ∼22cells/segment: ∼3 midline glia, 2 midline precursor 1 (MP1)neurons, 2 MP3 interneurons (H-cell and H-cell sib), 3 ventralunpaired median interneurons (iVUMs), 3 ventral unpairedmedian motorneurons (mVUMs), and the median neuroblast(MNB), which generates 7–8 progeny during embryogenesis.The generation of the mature midline cells arises through aseries of developmental steps: (1) specification of mesectoder-mal cells, (2) cell division, (3) acquisition of individual midlinecell fates, (4) cell migration, (5) apoptosis, and (6) terminaldifferentiation resulting in functional neurons and glia. Wheninitially specified during the blastoderm stage, ∼8 cells arepresent in each segment, 4 on either side of the mesoderm, thatcome together as gastrulation proceeds. These cells are
510 S.R. Wheeler et al. / Developmental Biology 294 (2006) 509–524
characterized by expression of the single-minded (sim) gene,which acts as a master regulator that is required for allsubsequent midline transcription and development (Crews,2003; Nambu et al., 1991). Five of these 8 cells are the midlineprecursors (MPs), each will divide only once to generate twoneurons. In contrast, the MNB is a stem cell that dividesmultiple times to produce a characteristic clone of midlineneurons (Bossing and Technau, 1994; Schmid et al., 1999),similar to neuroblasts in the lateral CNS. The glial progenitorsalso undergo multiple rounds of cell division to produce ∼10midline glia, although the exact number of glial progenitors isunknown. During mid-embryogenesis, the midline cells migrateinward to their final positions, and differentiate into matureneurons and glia. The ∼10 midline glial cells that arise by mid-embryogenesis are depleted by apoptosis, with 2–3 mature gliaremaining to ensheathe the axon commissures (Bergmann et al.,2002; Jacobs, 2000). Thus, the midline cells display a diversityof cell types, modes of cell division, developmental programs,and functions.
Because of their characteristic midline location, identifyinggenes expressed in CNS midline cells is easy. Using this feature,we employed in situ hybridization to identify and initiallycharacterize the expression of 224 midline-expressed genes ateach stage of embryonic development (Kearney et al., 2004);we have subsequently expanded this to include a total of 278midline-expressed genes (unpublished data). Sixty-four genesare expressed in mesectodermal cells (stages 5–8; stagingaccording to Campos-Ortega and Hartenstein, 1997), 162 inmidline primordia (stages 9–12), 65 in mature midline glia, and131 in mature midline neurons (mature cells span stages 13 to17). Furthermore, these genes encode 72 transcription factorsand 44 signaling proteins, thus representing a large number ofgenes likely to play roles in midline cell development.
Despite these significant advances in midline gene identifi-cation and developmental biology, progress in understandingthe genetic basis of how midline neurons and glia are generatedhas been hindered by the inability to distinguish each midlinecell type during their development. This deficiency makes itdifficult to interpret genetic experiments. In this paper, thisweakness is addressed by combining in situ hybridization,immunostaining, and confocal microscopy to study midlinegene expression with single-cell resolution. Here, we mapped59 genes to individual midline cell types at four developmen-tally important stages (9, 11, 13, and 17). Included in this set ofgenes are 27 transcription factors and 9 signaling proteins. Wealso mapped the expression patterns in neurons of 11 genes thatencode peptide neurotransmitters, neurotransmitter biosyntheticenzymes, vesicular and membrane transporters, and neurotrans-mitter receptors providing insight into their unique neuronalcharacteristics. These maps allow the construction of detaileddevelopmental pathways for each midline cell type that chart thechanges in gene expression that occur during embryogenesis,and illustrate the relationships between midline cells fromstages 11 to 17. Many of the genes identified are likely toregulate developmental and transcriptional events that culmi-nate in the mature set of midline neurons and glia. Using theinformation presented in this paper, genetic analysis of these
genes and others have the potential to provide a comprehensive,genome-wide view of neural and glial development andfunction.
Materials and methods
Drosophila strains
CNS midline cells were visualized using a variety of lacZ and Gal4 lines.These include: 3.7-sim-lacZ (all early midline cells; Nambu et al., 1991), C544-Gal4 (MP1s; Landgraf et al., 2003), MzVUM-Gal4 (mVUMs; Landgraf et al.,2003), 807-Gal4 (mVUMs; A. Brand, unpublished), per-Gal4 (H-cell sib andiVUMs; Plautz et al., 1997), TH-Gal4 (H-cell; Friggi-Grelin et al., 2003), andsim-Gal4 (all CNS midline cells; Xiao et al., 1996). UAS lines included: UAS-tau-lacZ (Callahan and Thomas, 1994), UAS-GFP-lacZ.nls (Y. Hiromi and S.West, unpublished), and UAS-tau-GFP.
Sources of cloned DNA for in situ hybridization
cDNA clones from the Open Biosystems BDGP collection (v1 and v2)(Stapleton et al., 2002) were used to prepare in situ hybridization probes for mostof the genes analyzed. Six other genes (CG33528, CG8394, DAT, hh, SoxN, andTbh) were PCR-amplified using gene-specific primers from either genomicDNA or cDNA prepared from Drosophila embryonic or larval RNA.
In situ hybridization and immunostaining
In situ hybridization and immunostaining were performed as previouslydescribed (Kearney et al., 2004). Primary antibodies used were anti-Futsch(MAb 22C10; Developmental Studies Hybridoma Bank, DSHB), mouse anti-β-galactosidase (Promega), rabbit anti-β-galactosidase (Cappel), rabbit anti-Castor (Kambadur et al., 1998), anti-Engrailed MAb 4D9 (Patel et al., 1989a),rabbit anti-Even-skipped (East Asian Distribution Center; EADC; Kosman etal., 1998), rabbit anti-GFP (Abcam), guinea pig anti-Hunchback (EADC), rabbitanti-Paired (EADC), anti-Prospero MAb (DSHB), guinea pig anti-Runt(EADC), rat anti-Single minded (Ward et al., 1998), rabbit anti-Sloppy paired1 (EADC), mouse anti-Tau (Sigma), and rabbit anti-Sanpodo (O'Connor-Gilesand Skeath, 2003).
Results
Experimental approach
From a set of 278 identified CNS midline genes andmarkers (Kearney et al., 2004), a group of 59 RNA probes,antibodies, and lacZ and Gal4 lines was selected to generatemolecular maps at several stages of midline cell development(maps and images available at http://www.unc.edu/∼crews).These genes were selected because they encode (1) transcrip-tion factors and signaling proteins likely to play importantroles in midline cell development, and (2) neural functionproteins that mediate the excitable properties of neurons. Fourdevelopmental stages (9, 11, 13, and 17) were chosen as theyrepresent useful milestones in the development of these cells.We first identified the gross morphology of the midline cellsat each stage and then overlaid gene expression patterns usingfluorescent in situ hybridization and immunostaining. Midlinecells were identified using a CNS midline-specific driver, sim-Gal4, which in combination with UAS-tau-lacZ (Callahan andThomas, 1994) or UAS-tau-GFP, marks all midline cells atstages 11–17 (Figs. 2A, 4A, 5A insets). For stage 9, themidline cells were visualized using an antibody against Sim
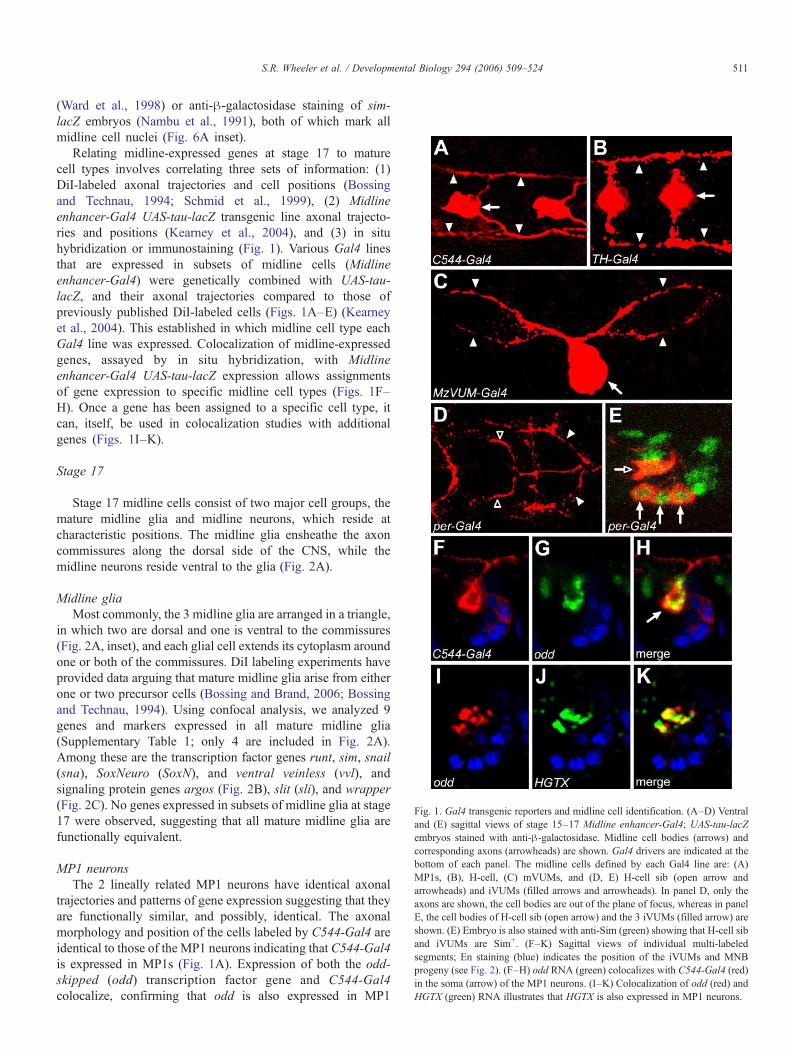
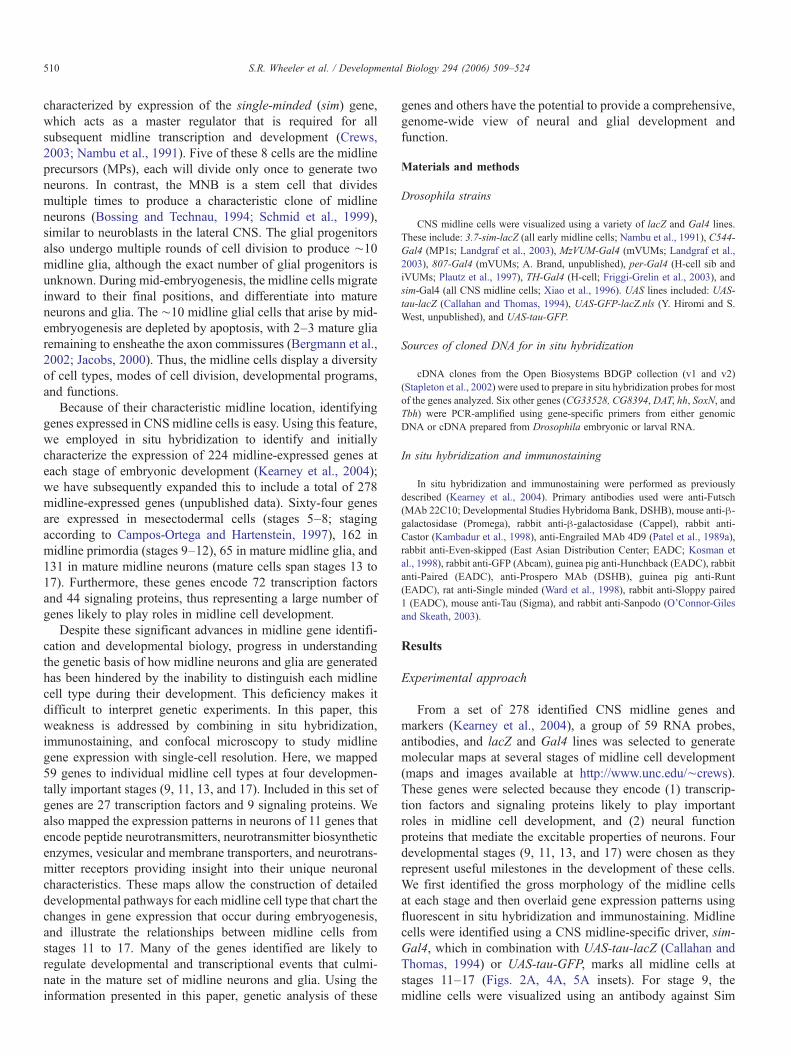
Fig. 1. Gal4 transgenic reporters and midline cell identification. (A–D) Ventraland (E) sagittal views of stage 15–17 Midline enhancer-Gal4; UAS-tau-lacZembryos stained with anti-β-galactosidase. Midline cell bodies (arrows) andcorresponding axons (arrowheads) are shown. Gal4 drivers are indicated at thebottom of each panel. The midline cells defined by each Gal4 line are: (A)MP1s, (B), H-cell, (C) mVUMs, and (D, E) H-cell sib (open arrow andarrowheads) and iVUMs (filled arrows and arrowheads). In panel D, only theaxons are shown, the cell bodies are out of the plane of focus, whereas in panelE, the cell bodies of H-cell sib (open arrow) and the 3 iVUMs (filled arrow) areshown. (E) Embryo is also stained with anti-Sim (green) showing that H-cell siband iVUMs are Sim+. (F–K) Sagittal views of individual multi-labeledsegments; En staining (blue) indicates the position of the iVUMs and MNBprogeny (see Fig. 2). (F–H) odd RNA (green) colocalizes with C544-Gal4 (red)in the soma (arrow) of the MP1 neurons. (I–K) Colocalization of odd (red) andHGTX (green) RNA illustrates that HGTX is also expressed in MP1 neurons.
511S.R. Wheeler et al. / Developmental Biology 294 (2006) 509–524
(Ward et al., 1998) or anti-β-galactosidase staining of sim-lacZ embryos (Nambu et al., 1991), both of which mark allmidline cell nuclei (Fig. 6A inset).
Relating midline-expressed genes at stage 17 to maturecell types involves correlating three sets of information: (1)DiI-labeled axonal trajectories and cell positions (Bossingand Technau, 1994; Schmid et al., 1999), (2) Midlineenhancer-Gal4 UAS-tau-lacZ transgenic line axonal trajecto-ries and positions (Kearney et al., 2004), and (3) in situhybridization or immunostaining (Fig. 1). Various Gal4 linesthat are expressed in subsets of midline cells (Midlineenhancer-Gal4) were genetically combined with UAS-tau-lacZ, and their axonal trajectories compared to those ofpreviously published DiI-labeled cells (Figs. 1A–E) (Kearneyet al., 2004). This established in which midline cell type eachGal4 line was expressed. Colocalization of midline-expressedgenes, assayed by in situ hybridization, with Midlineenhancer-Gal4 UAS-tau-lacZ expression allows assignmentsof gene expression to specific midline cell types (Figs. 1F–H). Once a gene has been assigned to a specific cell type, itcan, itself, be used in colocalization studies with additionalgenes (Figs. 1I–K).
Stage 17
Stage 17 midline cells consist of two major cell groups, themature midline glia and midline neurons, which reside atcharacteristic positions. The midline glia ensheathe the axoncommissures along the dorsal side of the CNS, while themidline neurons reside ventral to the glia (Fig. 2A).
Midline gliaMost commonly, the 3 midline glia are arranged in a triangle,
in which two are dorsal and one is ventral to the commissures(Fig. 2A, inset), and each glial cell extends its cytoplasm aroundone or both of the commissures. DiI labeling experiments haveprovided data arguing that mature midline glia arise from eitherone or two precursor cells (Bossing and Brand, 2006; Bossingand Technau, 1994). Using confocal analysis, we analyzed 9genes and markers expressed in all mature midline glia(Supplementary Table 1; only 4 are included in Fig. 2A).Among these are the transcription factor genes runt, sim, snail(sna), SoxNeuro (SoxN), and ventral veinless (vvl), andsignaling protein genes argos (Fig. 2B), slit (sli), and wrapper(Fig. 2C). No genes expressed in subsets of midline glia at stage17 were observed, suggesting that all mature midline glia arefunctionally equivalent.
MP1 neuronsThe 2 lineally related MP1 neurons have identical axonal
trajectories and patterns of gene expression suggesting that theyare functionally similar, and possibly, identical. The axonalmorphology and position of the cells labeled by C544-Gal4 areidentical to those of the MP1 neurons indicating that C544-Gal4is expressed in MP1s (Fig. 1A). Expression of both the odd-skipped (odd) transcription factor gene and C544-Gal4colocalize, confirming that odd is also expressed in MP1
512 S.R. Wheeler et al. / Developmental Biology 294 (2006) 509–524
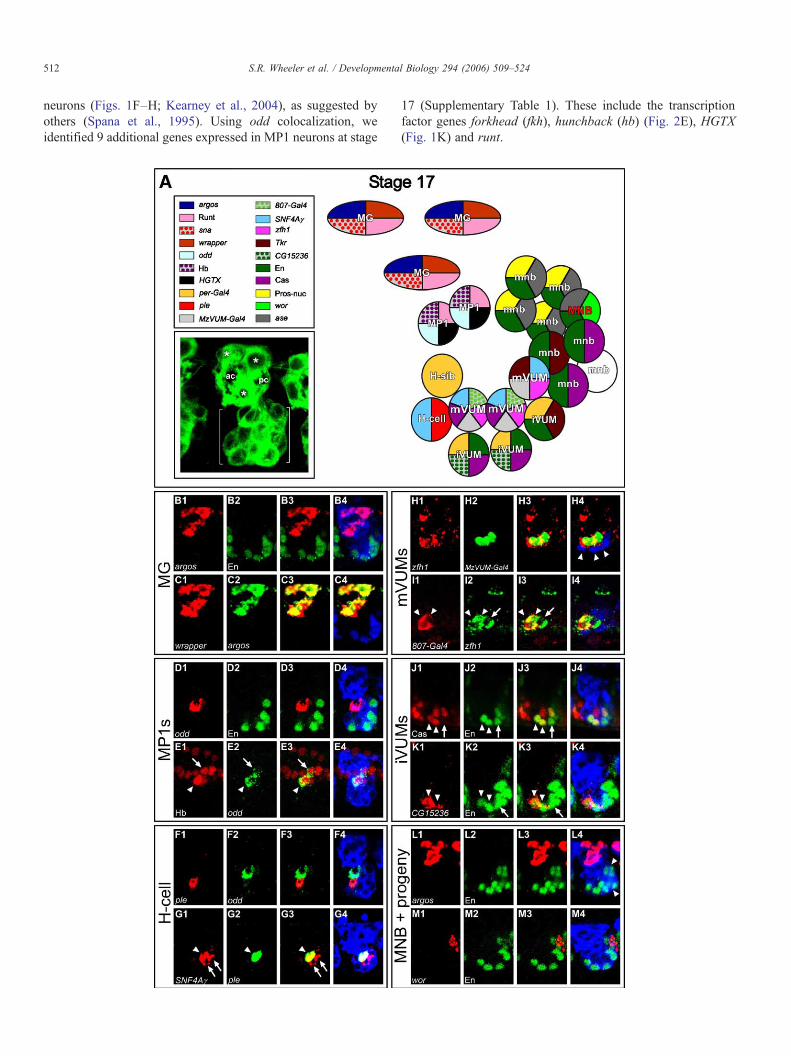
neurons (Figs. 1F–H; Kearney et al., 2004), as suggested byothers (Spana et al., 1995). Using odd colocalization, weidentified 9 additional genes expressed in MP1 neurons at stage
17 (Supplementary Table 1). These include the transcriptionfactor genes forkhead (fkh), hunchback (hb) (Fig. 2E), HGTX(Fig. 1K) and runt.
513S.R. Wheeler et al. / Developmental Biology 294 (2006) 509–524
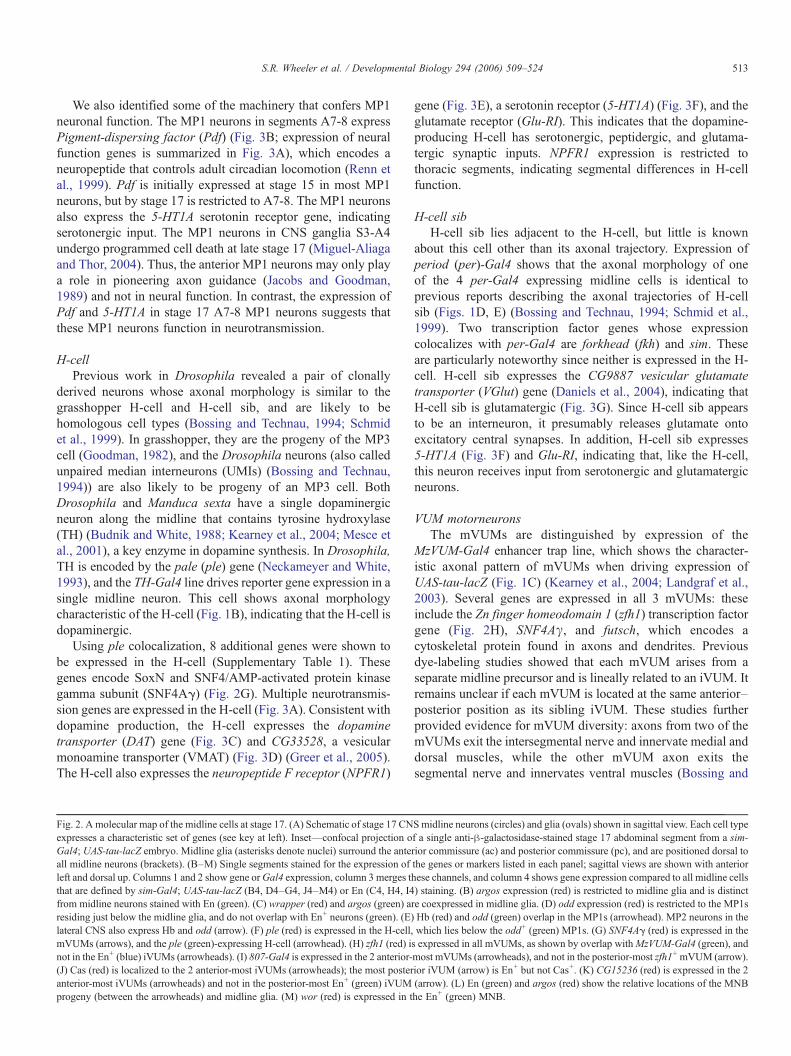
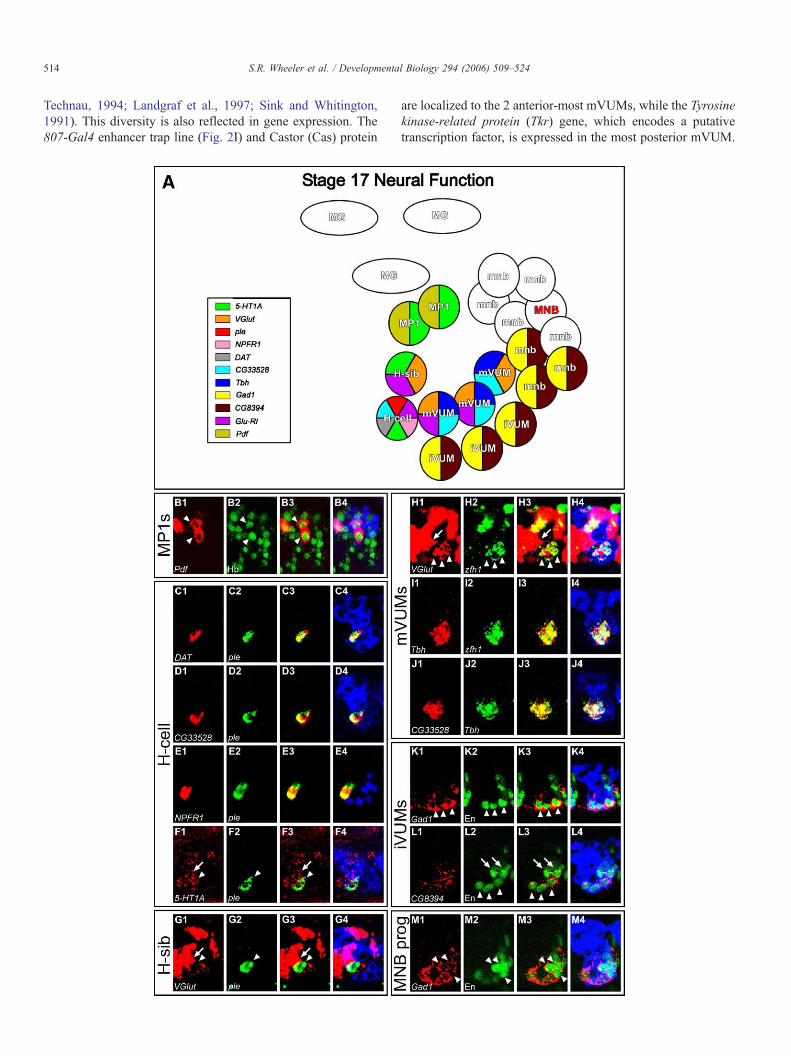
We also identified some of the machinery that confers MP1neuronal function. The MP1 neurons in segments A7-8 expressPigment-dispersing factor (Pdf) (Fig. 3B; expression of neuralfunction genes is summarized in Fig. 3A), which encodes aneuropeptide that controls adult circadian locomotion (Renn etal., 1999). Pdf is initially expressed at stage 15 in most MP1neurons, but by stage 17 is restricted to A7-8. The MP1 neuronsalso express the 5-HT1A serotonin receptor gene, indicatingserotonergic input. The MP1 neurons in CNS ganglia S3-A4undergo programmed cell death at late stage 17 (Miguel-Aliagaand Thor, 2004). Thus, the anterior MP1 neurons may only playa role in pioneering axon guidance (Jacobs and Goodman,1989) and not in neural function. In contrast, the expression ofPdf and 5-HT1A in stage 17 A7-8 MP1 neurons suggests thatthese MP1 neurons function in neurotransmission.
H-cellPrevious work in Drosophila revealed a pair of clonally
derived neurons whose axonal morphology is similar to thegrasshopper H-cell and H-cell sib, and are likely to behomologous cell types (Bossing and Technau, 1994; Schmidet al., 1999). In grasshopper, they are the progeny of the MP3cell (Goodman, 1982), and the Drosophila neurons (also calledunpaired median interneurons (UMIs) (Bossing and Technau,1994)) are also likely to be progeny of an MP3 cell. BothDrosophila and Manduca sexta have a single dopaminergicneuron along the midline that contains tyrosine hydroxylase(TH) (Budnik and White, 1988; Kearney et al., 2004; Mesce etal., 2001), a key enzyme in dopamine synthesis. In Drosophila,TH is encoded by the pale (ple) gene (Neckameyer and White,1993), and the TH-Gal4 line drives reporter gene expression in asingle midline neuron. This cell shows axonal morphologycharacteristic of the H-cell (Fig. 1B), indicating that the H-cell isdopaminergic.
Using ple colocalization, 8 additional genes were shown tobe expressed in the H-cell (Supplementary Table 1). Thesegenes encode SoxN and SNF4/AMP-activated protein kinasegamma subunit (SNF4Aγ) (Fig. 2G). Multiple neurotransmis-sion genes are expressed in the H-cell (Fig. 3A). Consistent withdopamine production, the H-cell expresses the dopaminetransporter (DAT) gene (Fig. 3C) and CG33528, a vesicularmonoamine transporter (VMAT) (Fig. 3D) (Greer et al., 2005).The H-cell also expresses the neuropeptide F receptor (NPFR1)
Fig. 2. A molecular map of the midline cells at stage 17. (A) Schematic of stage 17 CNexpresses a characteristic set of genes (see key at left). Inset—confocal projection oGal4; UAS-tau-lacZ embryo. Midline glia (asterisks denote nuclei) surround the anteall midline neurons (brackets). (B–M) Single segments stained for the expression ofleft and dorsal up. Columns 1 and 2 show gene orGal4 expression, column 3 merges tthat are defined by sim-Gal4; UAS-tau-lacZ (B4, D4–G4, J4–M4) or En (C4, H4, I4from midline neurons stained with En (green). (C) wrapper (red) and argos (green) aresiding just below the midline glia, and do not overlap with En+ neurons (green). (E)lateral CNS also express Hb and odd (arrow). (F) ple (red) is expressed in the H-cell,mVUMs (arrows), and the ple (green)-expressing H-cell (arrowhead). (H) zfh1 (red) inot in the En+ (blue) iVUMs (arrowheads). (I) 807-Gal4 is expressed in the 2 anterior-(J) Cas (red) is localized to the 2 anterior-most iVUMs (arrowheads); the most posteranterior-most iVUMs (arrowheads) and not in the posterior-most En+ (green) iVUMprogeny (between the arrowheads) and midline glia. (M) wor (red) is expressed in t
gene (Fig. 3E), a serotonin receptor (5-HT1A) (Fig. 3F), and theglutamate receptor (Glu-RI). This indicates that the dopamine-producing H-cell has serotonergic, peptidergic, and glutama-tergic synaptic inputs. NPFR1 expression is restricted tothoracic segments, indicating segmental differences in H-cellfunction.
H-cell sibH-cell sib lies adjacent to the H-cell, but little is known
about this cell other than its axonal trajectory. Expression ofperiod (per)-Gal4 shows that the axonal morphology of oneof the 4 per-Gal4 expressing midline cells is identical toprevious reports describing the axonal trajectories of H-cellsib (Figs. 1D, E) (Bossing and Technau, 1994; Schmid et al.,1999). Two transcription factor genes whose expressioncolocalizes with per-Gal4 are forkhead (fkh) and sim. Theseare particularly noteworthy since neither is expressed in the H-cell. H-cell sib expresses the CG9887 vesicular glutamatetransporter (VGlut) gene (Daniels et al., 2004), indicating thatH-cell sib is glutamatergic (Fig. 3G). Since H-cell sib appearsto be an interneuron, it presumably releases glutamate ontoexcitatory central synapses. In addition, H-cell sib expresses5-HT1A (Fig. 3F) and Glu-RI, indicating that, like the H-cell,this neuron receives input from serotonergic and glutamatergicneurons.
VUM motorneuronsThe mVUMs are distinguished by expression of the
MzVUM-Gal4 enhancer trap line, which shows the character-istic axonal pattern of mVUMs when driving expression ofUAS-tau-lacZ (Fig. 1C) (Kearney et al., 2004; Landgraf et al.,2003). Several genes are expressed in all 3 mVUMs: theseinclude the Zn finger homeodomain 1 (zfh1) transcription factorgene (Fig. 2H), SNF4Aγ, and futsch, which encodes acytoskeletal protein found in axons and dendrites. Previousdye-labeling studies showed that each mVUM arises from aseparate midline precursor and is lineally related to an iVUM. Itremains unclear if each mVUM is located at the same anterior–posterior position as its sibling iVUM. These studies furtherprovided evidence for mVUM diversity: axons from two of themVUMs exit the intersegmental nerve and innervate medial anddorsal muscles, while the other mVUM axon exits thesegmental nerve and innervates ventral muscles (Bossing and
Smidline neurons (circles) and glia (ovals) shown in sagittal view. Each cell typef a single anti-β-galactosidase-stained stage 17 abdominal segment from a sim-rior commissure (ac) and posterior commissure (pc), and are positioned dorsal tothe genes or markers listed in each panel; sagittal views are shown with anteriorhese channels, and column 4 shows gene expression compared to all midline cells) staining. (B) argos expression (red) is restricted to midline glia and is distinctre coexpressed in midline glia. (D) odd expression (red) is restricted to the MP1sHb (red) and odd (green) overlap in the MP1s (arrowhead). MP2 neurons in thewhich lies below the odd+ (green) MP1s. (G) SNF4Aγ (red) is expressed in thes expressed in all mVUMs, as shown by overlap withMzVUM-Gal4 (green), andmost mVUMs (arrowheads), and not in the posterior-most zfh1+mVUM (arrow).ior iVUM (arrow) is En+ but not Cas+. (K) CG15236 (red) is expressed in the 2(arrow). (L) En (green) and argos (red) show the relative locations of the MNBhe En+ (green) MNB.
514 S.R. Wheeler et al. / Developmental Biology 294 (2006) 509–524
Technau, 1994; Landgraf et al., 1997; Sink and Whitington,1991). This diversity is also reflected in gene expression. The807-Gal4 enhancer trap line (Fig. 2I) and Castor (Cas) protein
are localized to the 2 anterior-most mVUMs, while the Tyrosinekinase-related protein (Tkr) gene, which encodes a putativetranscription factor, is expressed in the most posterior mVUM.
515S.R. Wheeler et al. / Developmental Biology 294 (2006) 509–524
Since the gene expression profiles of the 2 anterior-mostmVUMs are similar, and distinct from the posterior-mostmVUM, it is reasonable to propose that axons from the 2anterior-most mVUMs exit the intersegmental nerve, and theposterior-most mVUM axons exit the segmental nerve, but thishas not been directly demonstrated.
Glutamate is the primary neurotransmitter used by insectmotorneurons, and, not surprisingly, the mVUMs expressVGlut (Fig. 3H). In addition to being glutamatergic, themVUMs express Tyramine β-hydroxylase (Tbh), whichencodes the key biosynthetic enzyme for the production ofoctopamine, a modulatory monoamine neurotransmitter (Fig.3I). In addition, the mVUMs express CG33528, a vesicularmonoamine transporter gene (Fig. 3J). These neuronssynapse widely throughout the somatic musculature, consis-tent with a neuromodulatory role in controlling movement(Landgraf et al., 1997; Sink and Whitington, 1991). The twoanterior mVUMs express Glu-RI, suggesting that these cellsreceive glutamatergic input, and further distinguishes thesecells from the posterior-most mVUM, which does notexpress Glu-RI.
VUM interneuronsThe 3 iVUMs are the ventral-most midline neurons, and
engrailed (en) serves as a reliable marker for these cells (Sieglerand Jia, 1999). Using en colocalization and cellular position, weidentified 10 additional markers localized to iVUMs (Supple-mentary Table 1). The fkh and sim transcription factor genes areexpressed in all iVUMs, along with per-Gal4 (Figs. 1D, E).Despite having identical initial axonal trajectories (Bossing andTechnau, 1994), iVUMs exhibit differences in gene expression.Both Cas protein (Fig. 2J) and CG15236 expression (Fig. 2K)are localized to the 2 anterior-most iVUMs, while Tkr isexpressed in the most posterior iVUM. Expression of neuralfunction genes in iVUMs provides insight into their physio-logical roles. All 3 iVUMs are inhibitory GABAergic neuronsas they express Gad1, the gene encoding a key enzyme inGABA biosynthesis (Fig. 3K), and CG8394, a putative GABAvesicular transporter gene (VIAAT) (Fig. 3L). While present inall iVUMs, the levels of Gad1 generally appear higher in theanterior-most and posterior-most cells, and lowest in the middlecell.
MNB and progenyThe MNB is the one midline neuronal cell that undergoes
multiple rounds of cell division. By stage 17, 7–8 clonallyrelated MNB progeny reside within a tight cluster of cells in theposterior of the ganglion. The MNB is likely present at stage 17
Fig. 3. A map of neural function genes expressed at stage 17. (A) Schematic of sVentral and (C–M) sagittal views are shown with anterior left and dorsal up. (B) P(C–F) Colocalization with ple (green) shows that the following genes (red) are ex(arrowhead). 5-HT1A is also expressed in the ple− H-cell sib (arrow). (G) VGlut (red(arrowhead). (H) VGlut (red) is expressed in the zfh1+ (green) mVUMs (arrowheamVUMs. (J) CG33528 (red) is expressed in the Tbh+ (green) mVUMs. (K) Gad1 (expressed in En+ (green) iVUMs (arrowheads), as well as a subset of En+ MNB pr(arrowheads).
because one cell in the MNB cluster expresses worniu (wor)(Fig. 2M) and asense (ase), two transcription factor genes thatmark the MNB earlier in development (see stage 13). The MNBand 6–7 of its progeny express en (Fig. 2L), while ∼1 progenycell in each segment does not. The progeny of the MNB alsodisplay other differences in gene expression. The Prospero(Pros) transcription factor is localized to nuclei in 2–4 MNBprogeny that are adjacent to the MNB, while Cas protein ispresent in two progeny that do not contain Pros. In the lateralCNS, Pros is observed in ganglion mother cells (GMCs) andtransiently in their neuronal progeny (Spana and Doe, 1995).Thus, the Pros+ MNB progeny are likely recently born neurons,while the Cas+ Pros− cells are older MNB progeny. Consistentwith this interpretation, Cas protein localizes to a subset ofPros+ MNB progeny at stage 13. In addition, Tkr is expressed ina single progeny cell that does not contain either Cas or Pros,suggesting that there are at least 3 distinct subsets. Theexpression of ase, en, fkh, and per-Gal4 in some, but not all,MNB progeny suggests that there may be further distinctionsamong MNB progeny.
Three to five MNB progeny express Gad1 (Fig. 3M) and theCG8394 GABA vesicular transporter gene (Fig. 3L), indicatingthat these cells are GABAergic neurons. These neurons arerelatively ventral in the MNB progeny cluster, but their exactrelationship to other MNB progeny markers has not beendetermined. We did not detect expression of genes encodingdopaminergic, glutamatergic, or octopaminergic biosyntheticenzymes or transporters in the remaining MNB progeny. Eitherthese cells use a different transmitter or they have not yet fullydifferentiated into functional neurons.
Stage 13
The stage 13 CNS represents an intermediate stage ofdevelopment in which most midline neurons and glia haveformed and axonal outgrowth has begun. All of the neuronsexpress embryonic lethal, abnormal vision (elav), a marker forpostmitotic neurons (Robinow and White, 1991). However, thecells are immature and not fully differentiated. The midlinecells at stage 13 have undergone all of their MP and glialdivisions, but the MNB has only undergone 1–2 divisions, with2–3 more remaining during embryogenesis. In general, themidline neurons at stage 13 have the same position as they doat stage 17 (Fig. 4A, inset). This conserved arrangement aidedin the identification of distinct neurons and glia. Moreover,many genes expressed at stage 13 are also expressed at stage 17(31/39), further facilitating the identification of midline celltypes.
tage 17 CNS midline cells summarizing neural function gene expression. (B)df (red) and Hb (green) colocalize in the MP1s (arrowheads) of segment A7.pressed in the H-cell: (C) DAT, (D) CG33528, (E) NPFR1, and (F) 5-HT1A) is expressed in H-cell sib (arrow), but not in the adjacent ple+ (green) H-cellds) and the H-cell sib (arrow). (I) Tbh (red) is expressed in the zfh1+ (green)red) is expressed in the En+ (green) iVUMs (arrowheads). (L) CG8394 (red) isogeny (arrows). (M) Gad1 (red) is expressed in ∼3 En+ (green) MNB progeny
516 S.R. Wheeler et al. / Developmental Biology 294 (2006) 509–524
Midline gliaUnlike stage 17, at stage 13 there exist two populations of
midline glia, anterior midline glia (AMG) and posterior midlineglia (PMG), which can be identified based on their position,morphology, and marker gene expression. A subset of the AMGwill persist to stage 17 to become mature midline glia, while the
remainder of the AMG and all of the PMG will undergoapoptosis (Bergmann et al., 2002; Dong and Jacobs, 1997).There is currently no data describing the lineal relationshipsamong PMG or between AMG and PMG. Using colocalizationwith argos and wrapper, which mark all midline glia, we haveidentified a total of 14 genes expressed in midline glia
517S.R. Wheeler et al. / Developmental Biology 294 (2006) 509–524
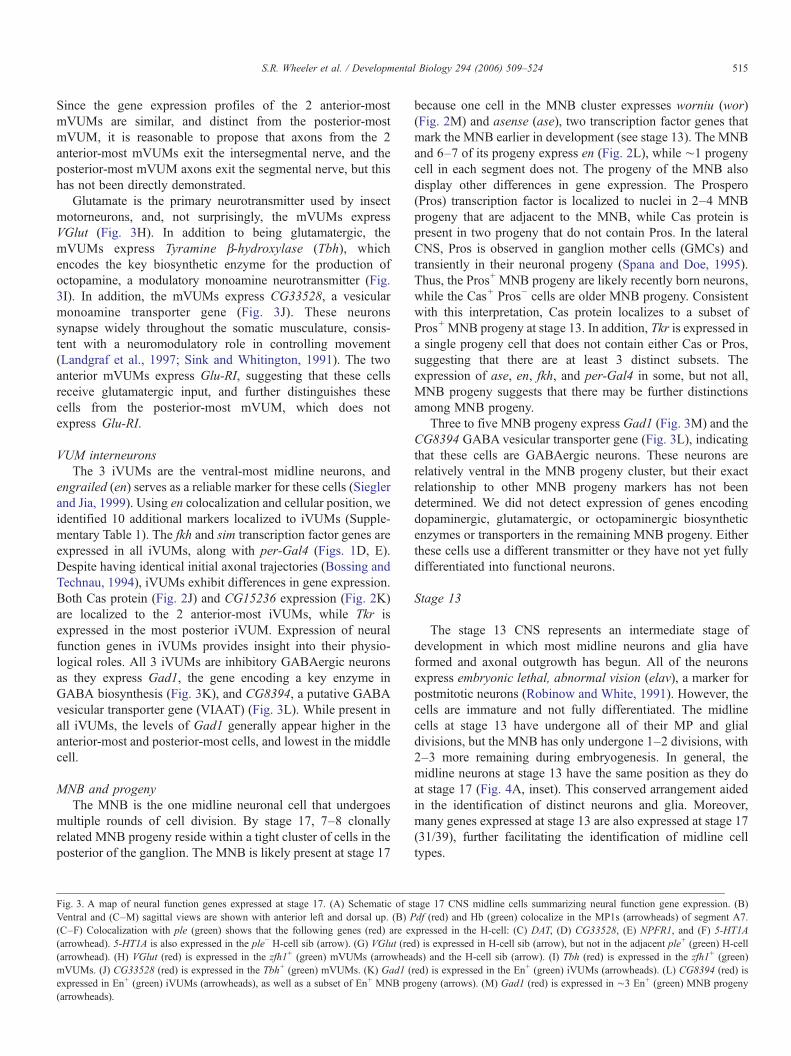
(Supplementary Table 2; Fig. 4A). Ten are expressed in allmidline glia including: (1) Dichaete, sim, sna (Fig. 4B), SoxN,and vvl, which encode transcription factors, (2) argos and slit,which encode signaling proteins, (3) wrapper, which encodesan adhesion protein, and (4) CG31145 and CG32244, two genesof unknown function. Four genes are expressed in subsets ofstage 13 midline glia. CG8965 and runt (Fig. 4C) are expressedin AMG, while Cad74A and en (Figs. 4B, C) are expressed inPMG, indicating that the two populations of midline glia aremolecularly distinct. However, the genes we examined did notdistinguish subpopulations of either AMG or PMG.
MP1 and MP3 neuronsThe 2 MP1 neurons are positioned just posterior and ventral
to the AMG, and the 2 MP3 progeny reside ventral to the MP1neurons and just anterior to the VUM neurons (Fig. 4A). Bystage 13, the MP1 and MP3 progeny express elav and areextending axons, indicating that they are in the process of neuraldifferentiation. The stage 13 MP1 neurons have a similarexpression profile to those at stage 17, and they express 9 of the11 genes found at stage 17 (Supplementary Tables 1 and 2),including odd and hb (Figs. 4D, E). Furthermore, the two stage13 MP1 neurons show an identical profile of gene expression toone another, as also observed at stage 17. The MP3 progeny, H-cell and H-cell sib, can be distinguished at stage 13 bydifferences in gene expression, indicating they have acquiredtheir respective cell fates by this time of development: 4 genesare expressed only in the H-cell, 2 genes are expressed only inH-cell sib, and 4 genes are expressed in both cells (Supple-mentary Table 2). The immature nature of the MP1 and MP3neurons is reflected in the observation that only 2 neuralfunction genes expressed in these cells at stage 17 are expressedat stage 13: ple (Fig. 4G) and CG33528. One of the majordifferences between stages 13 and 17 involves the transcriptionfactor-encoding genes nubbin (nub) (Figs. 4D, F) and POUdomain protein 2 (pdm2) (Fig. 4E) that are expressed in bothMP1 and MP3 neurons at stage 13 but are absent at stage 17.
VUM neuronsLike the MP1 and MP3 neurons, the expression profiles of
the stage 13 VUMs indicate that they are immature neurons.The VUMs are elav+ and can be distinguished as mVUM oriVUM based on position and gene expression, but they do notyet express most of the neural function genes observed at stage
Fig. 4. A molecular map of the midline cells at stage 13. (A) Schematic of midline celstage 13 abdominal segment from a sim-Gal4; UAS-tau-lacZ embryo. Midline neuronPMG (arrowheads). ac—anterior commissure, pc—posterior commissure. (B) sna (r(yellow arrowheads and arrow). In this segment, some AMG (white arrow) and PMGis localized to the AMG (white arrowheads) and MP1 neurons (arrows), and does no(green) are coexpressed in the MP1 neurons (arrowhead). (E) The MP1 neurons (arexpressed in the lateral CNS (arrows). (F) nub (red) is expressed in the H-cell (arrowhcell (arrow) expresses both ple (red) and SNF4Aγ (green). SNF4Aγ is also expressedcolocalize in mVUMs (arrowheads). (I) All of the mVUMs (arrowheads) express fd5Tkr (red). fd59A and Tkr are coexpressed in one progeny of the MNB (arrow). (J) A(yellow arrowhead) and 1 MNB progeny coexpress Tkr (red) and En. (K) wor (red) isprogeny (arrow). (L) The MNB (arrowhead) expresses ase (red) and shows corticallocalization and are occasionally observed with ase expression. (M) Spdo is expressed
17. The stage 13 mVUMs share the expression of most genes (8/9) with their stage 17 counterparts, with forkhead domain 59A(fd59A) as an exception, whereas all of the stage 13 iVUMgenes examined are also expressed at stage 17. At stage 13,differences among the mVUMs can be recognized: only theposterior-most mVUM expresses Tkr (Fig. 4I), and only the twoanterior-most mVUMs contain Cas protein. The iVUMs differin exactly the same way (Fig. 4J), indicating that at stage 13, justlike stage 17, the anterior-most 4 VUMs differ from theposterior-most 2 VUMs.
MNB and progenyBy stage 13, the MNB has generated about half of its
progeny. The MNB can be recognized due to its asymmetriccortical localization of Pros (Fig. 4L), a characteristic of activelydividing neuroblasts (Spana and Doe, 1995). At stage 13, thereare 2–4 MNB progeny in each segment, indicating that at leasttwo additional MNB stem cell divisions must follow to generatethe 7–8 MNB progeny observed at stage 17. The MNBexpresses 5 transcription factors genes, ase (Fig. 4L), en (Fig.4K), pros (Figs. 4L, M), sim, and wor (Fig. 4K), in addition tosanpodo (spdo) (Fig. 4M), which functions in Notch signaling(O'Connor-Giles and Skeath, 2003). Unlike the MNB, theMNB progeny possess nuclear Pros (Fig. 4L) and a subset iselav+. Similar to stage 17, two MNB progeny are Cas+ and oneexpresses Tkr (Fig. 4J). While both en+ and en− MNB progenyare found at stage 17, all of the MNB progeny observed at stage13 express en indicating that either en is extinguished in some ofthe stage 13 progeny, as observed in grasshopper (Jia andSiegler, 2002), or that some progeny generated after stage 13 donot express en.
Stage 11
Stage 11 (Fig. 5A) represents a critical stage of development,of which little is known. Most midline glial division hasoccurred by mid-stage 11, but the MNB has yet to divide.Patterns of gene expression are complex indicating that cells areacquiring specific fates, and considerable cell movement isoccurring. Consequently, we have mapped the expression ofgenes encoding transcription factors and signaling proteins thatlikely mediate the development of the midline cells at this stage.Midline cells at stage 11 can be grouped into three broadcategories: (1) glial cells, which express argos and wrapper, (2)
ls at stage 13. Inset—confocal projection of a single anti-β-galactosidase-staineds (brackets) reside between the 2 populations of midline glia, AMG (arrows) anded) is expressed in both AMG (white arrowheads and arrow) and the En+ PMG(yellow arrow) have not yet migrated to their final dorsal position. (C) Runt (red)t overlap with the En+ (green) PMG (yellow arrowheads). (D) nub (red) and oddrowhead) express both pdm2 (red) and Hb (green). Both pdm2 and Hb are alsoead) and H-cell sib (arrow) that lie just dorsal to the En+ iVUMs (*). (G) The H-in mVUMs (arrowheads). (H) zfh1 (red) and MzVUM-Gal4 (green) expression
9A (green), while only the posterior-most mVUM (yellow arrowhead) expressesll 3 iVUMs (arrowheads) express En (green), while the most posterior iVUMexpressed in the En+ (green) MNB (arrowhead), and is often observed in MNBlocalization of Pros protein (green). MNB progeny (arrows) show nuclear Prosin the MNB (arrowhead) and the nuclear Pros+ (green) MNB progeny (arrows).
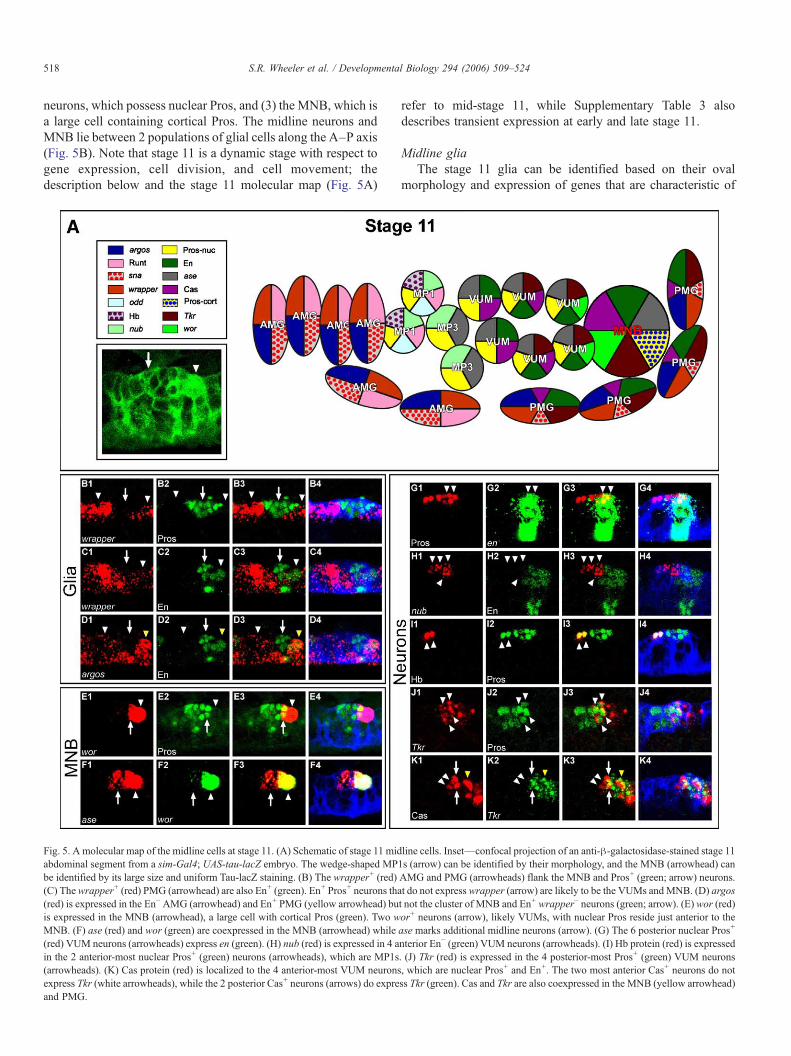
518 S.R. Wheeler et al. / Developmental Biology 294 (2006) 509–524
neurons, which possess nuclear Pros, and (3) the MNB, which isa large cell containing cortical Pros. The midline neurons andMNB lie between 2 populations of glial cells along the A–P axis(Fig. 5B). Note that stage 11 is a dynamic stage with respect togene expression, cell division, and cell movement; thedescription below and the stage 11 molecular map (Fig. 5A)
Fig. 5. A molecular map of the midline cells at stage 11. (A) Schematic of stage 11 midabdominal segment from a sim-Gal4; UAS-tau-lacZ embryo. The wedge-shaped MPbe identified by its large size and uniform Tau-lacZ staining. (B) The wrapper+ (red)(C) Thewrapper+ (red) PMG (arrowhead) are also En+ (green). En+ Pros+ neurons tha(red) is expressed in the En− AMG (arrowhead) and En+ PMG (yellow arrowhead) buis expressed in the MNB (arrowhead), a large cell with cortical Pros (green). Two wMNB. (F) ase (red) and wor (green) are coexpressed in the MNB (arrowhead) while(red) VUM neurons (arrowheads) express en (green). (H) nub (red) is expressed in 4 ain the 2 anterior-most nuclear Pros+ (green) neurons (arrowheads), which are MP1s(arrowheads). (K) Cas protein (red) is localized to the 4 anterior-most VUM neuronsexpress Tkr (white arrowheads), while the 2 posterior Cas+ neurons (arrows) do expreand PMG.
refer to mid-stage 11, while Supplementary Table 3 alsodescribes transient expression at early and late stage 11.
Midline gliaThe stage 11 glia can be identified based on their oval
morphology and expression of genes that are characteristic of
line cells. Inset—confocal projection of an anti-β-galactosidase-stained stage 111s (arrow) can be identified by their morphology, and the MNB (arrowhead) canAMG and PMG (arrowheads) flank the MNB and Pros+ (green; arrow) neurons.t do not expresswrapper (arrow) are likely to be the VUMs andMNB. (D) argost not the cluster of MNB and En+ wrapper− neurons (green; arrow). (E) wor (red)or+ neurons (arrow), likely VUMs, with nuclear Pros reside just anterior to thease marks additional midline neurons (arrow). (G) The 6 posterior nuclear Pros+
nterior En− (green) VUM neurons (arrowheads). (I) Hb protein (red) is expressed. (J) Tkr (red) is expressed in the 4 posterior-most Pros+ (green) VUM neurons, which are nuclear Pros+ and En+. The two most anterior Cas+ neurons do notss Tkr (green). Cas and Tkr are also coexpressed in the MNB (yellow arrowhead)
519S.R. Wheeler et al. / Developmental Biology 294 (2006) 509–524
stages 13 and 17 midline glia, including wrapper (Figs. 5B, C),argos (Fig. 5D), CG32244, sna, and vvl. There are ∼4 glialocated in the posterior of the segment that contain Cas andexpress Tkr and en (Fig. 5D): we conclude that they are PMGbased on location and expression of en, which is a markercharacteristic of PMG at stage 13. The AMG consist of ∼6 cellsthat reside in the anterior part of the segment, and express runt,but not en. Thus, even at stage 11, the two populations ofmidline glia are distinct.
Midline neuronsThe 10 midline neurons found at mid-stage 11 are likely to
be the immature MP1, MP3, and VUM neurons. These cells arecharacterized by elav expression, indicating that they areneurons (Robinow and White, 1991), and by nuclear Pros,indicating that they have not matured (Spana and Doe, 1995).However, they can be divided into subgroups based ondifferential gene expression. One observation is that patternsof gene expression generally come in pairs: this suggests that atmid-stage 11, the 2 neurons derived from each MP are not yetdistinct. Thus, expression of these different fates occursbetween mid-stage 11 and stage 13. The 6 posterior nuclearPros+ neurons express en (Fig. 5G), while the 4 anterior-mostPros+ neurons express nub (Fig. 5H). The nub+ cells can befurther subdivided into 2 anterior, wedge-shaped cells (Fig. 5A,inset) that express hb (Fig. 5I), odd, and runt, whereas theadjacent, more posterior 2 cells do not express any of thesegenes. The anterior cells are likely MP1 neurons, since the only
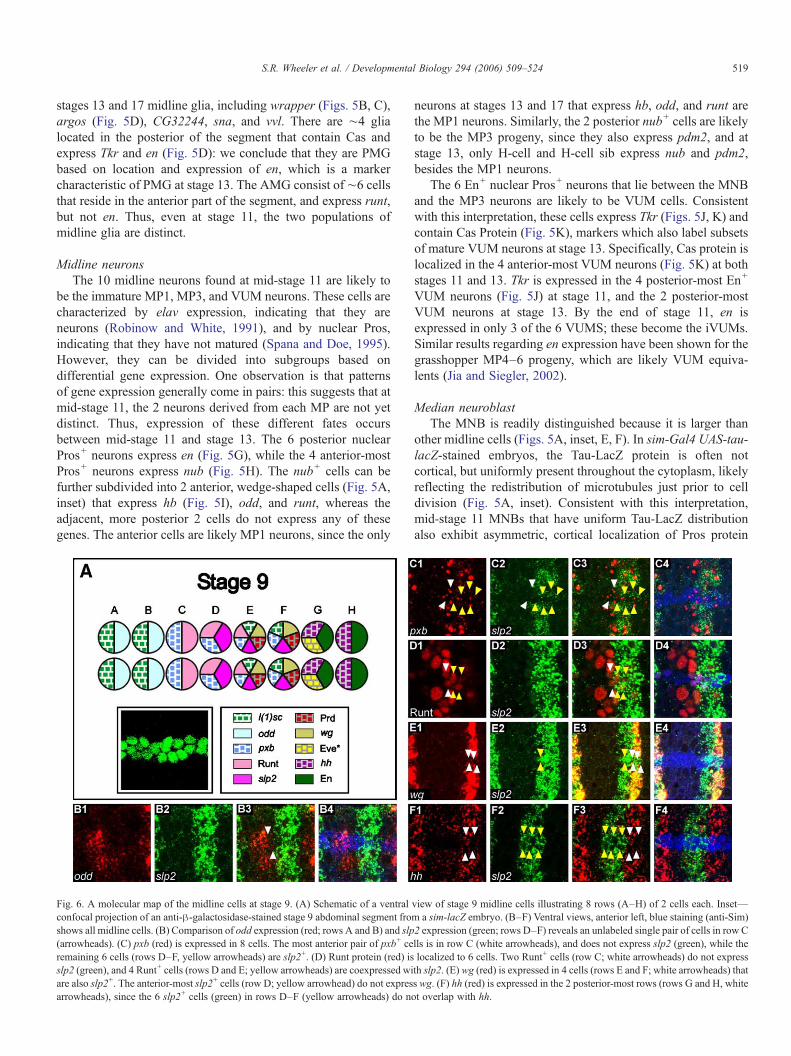
Fig. 6. A molecular map of the midline cells at stage 9. (A) Schematic of a ventralconfocal projection of an anti-β-galactosidase-stained stage 9 abdominal segment froshows all midline cells. (B) Comparison of odd expression (red; rows A and B) and slp(arrowheads). (C) pxb (red) is expressed in 8 cells. The most anterior pair of pxb+ ceremaining 6 cells (rows D–F, yellow arrowheads) are slp2+. (D) Runt protein (red) isslp2 (green), and 4 Runt+ cells (rows D and E; yellow arrowheads) are coexpressed wiare also slp2+. The anterior-most slp2+ cells (row D; yellow arrowhead) do not expresarrowheads), since the 6 slp2+ cells (green) in rows D–F (yellow arrowheads) do n
neurons at stages 13 and 17 that express hb, odd, and runt arethe MP1 neurons. Similarly, the 2 posterior nub+ cells are likelyto be the MP3 progeny, since they also express pdm2, and atstage 13, only H-cell and H-cell sib express nub and pdm2,besides the MP1 neurons.
The 6 En+ nuclear Pros+ neurons that lie between the MNBand the MP3 neurons are likely to be VUM cells. Consistentwith this interpretation, these cells express Tkr (Figs. 5J, K) andcontain Cas Protein (Fig. 5K), markers which also label subsetsof mature VUM neurons at stage 13. Specifically, Cas protein islocalized in the 4 anterior-most VUM neurons (Fig. 5K) at bothstages 11 and 13. Tkr is expressed in the 4 posterior-most En+
VUM neurons (Fig. 5J) at stage 11, and the 2 posterior-mostVUM neurons at stage 13. By the end of stage 11, en isexpressed in only 3 of the 6 VUMS; these become the iVUMs.Similar results regarding en expression have been shown for thegrasshopper MP4–6 progeny, which are likely VUM equiva-lents (Jia and Siegler, 2002).
Median neuroblastThe MNB is readily distinguished because it is larger than
other midline cells (Figs. 5A, inset, E, F). In sim-Gal4 UAS-tau-lacZ-stained embryos, the Tau-LacZ protein is often notcortical, but uniformly present throughout the cytoplasm, likelyreflecting the redistribution of microtubules just prior to celldivision (Fig. 5A, inset). Consistent with this interpretation,mid-stage 11 MNBs that have uniform Tau-LacZ distributionalso exhibit asymmetric, cortical localization of Pros protein
view of stage 9 midline cells illustrating 8 rows (A–H) of 2 cells each. Inset—m a sim-lacZ embryo. (B–F) Ventral views, anterior left, blue staining (anti-Sim)2 expression (green; rows D–F) reveals an unlabeled single pair of cells in row Clls is in row C (white arrowheads), and does not express slp2 (green), while thelocalized to 6 cells. Two Runt+ cells (row C; white arrowheads) do not expressth slp2. (E) wg (red) is expressed in 4 cells (rows E and F; white arrowheads) thats wg. (F) hh (red) is expressed in the 2 posterior-most rows (rows G and H, whiteot overlap with hh.
520 S.R. Wheeler et al. / Developmental Biology 294 (2006) 509–524
(Fig. 5E), which is a hallmark of asymmetrically dividing lateralCNS neuroblasts (Spana and Doe, 1995). Cortical localizationof Pros is transient, as it is not observed in all stage 11 MNBsexamined. The expression of 8 additional transcription factorgenes was localized in the MNB, including ase (Fig. 5F), cas,en, lethal of scute (l(1)sc), pros, Tkr, wor (Fig. 5E), and zfh1.Several of these genes are not specific for the MNB, but theircombination distinguishes the MNB from other midline cells.
Stage 9
The stage 9 midline cells represent an early stage ofdevelopment in which the midline cells do not show obvioussigns of neural or glial differentiation, yet it is possible thatimportant cell fate decisions are occurring at this time. At stage9, the midline cells have recently divided and are looselyarranged in two columns of ∼8 cells each (Fig. 6A). There isvariability in the number of cells (∼16 cells, varying from 14–20, using En staining as a segmental marker) and relativeposition of specific midline cells within each segment. Tosimplify the schematic of the molecular map at this stage (Fig.6A), we illustrate the stage 9 midline cells as two perfectlyspaced columns of 8 cells each and depict gene expressionpatterns in paired cells. However, variability causes geneexpression in individual segments to commonly differ from thisidealized view.
We examined the expression of 17 genes (SupplementaryTable 4), most of which are expressed in patterns that areorthogonal to the A–P axis. These genes were selected based ontheir well-established roles in intrasegmental patterning of theepidermis (Nusslein-Volhard and Wieschaus, 1980), as well asother roles in segmentation and neurogenesis. The l(1)sc, odd,runt, sloppy paired 1 (slp1), sloppy paired 2 (slp2), paired (prd),even skipped (eve), and en genes encode transcription factors,and pxb, wingless (wg), and hedgehog (hh) encode signalingproteins. The two anterior-most pairs of cells (rows A and B)express l(1)sc and odd (Fig. 6B), while the third pair (row C)expresses both pxb (Fig. 6C) and runt (Fig. 6D). The next threepairs of cells (rows D, E, and F) all express slp2 (Figs. 6B–F)and pxb (Fig. 6C), and can be subdivided into three distincttypes. The most anterior of these rows (row D) also expressesrunt (Fig. 6D), whereas row E expresses l(1)sc, prd, runt, andwg (Fig. 6E), and row F expresses l(1)sc, prd, and wg, but notrunt. The posterior-most 2 pairs of cells (rows G and H) expressboth en and hh (Fig. 6F), and row G also expresses eve inalternating segments. Together, the expression patterns of thesegenes define 7 molecularly distinct types of midline cellsarrayed along the A–P axis. Because of the dynamic nature ofgene expression at stage 9 and the lack of genes that areexpressed consistently from stage 9 onward, the relationshipsbetween these cells and their stage 11, 13, and 17 counterpartsare unclear.
Discussion
The major goal of this paper is to provide a series of geneexpression maps, derived from a large gene set, that describe the
development of the Drosophila CNS midline cells in molecularterms. While previous research identified the various midlinecell types, relatively little is known regarding the molecularmechanisms that govern midline cell development. Our studyfollowed gene expression throughout development, and inspec-tion of the data suggests relationships between midline cells andpotential molecular pathways of development. Many of thegenes analyzed are well-known transcription factors andsignaling proteins that are likely to play important develop-mental roles. Furthermore, the mapping of genes encodingpeptide neurotransmitters, neurotransmitter biosyntheticenzymes, neurotransmitter receptors, and transporters will beuseful for understanding CNS midline neural function and itsregulation. This work will be invaluable for continuing genome-wide assignment of gene expression to individual midline celltypes, for genetic analysis, and for study of transcriptionalcontrol during development. Because many of these genes areconserved across species, these data will provide importantinsight for understanding neural development in metazoans.
CNS midline cell relationships and transcriptional cascades
Analysis of gene expression in midline cells reveals how thestage 11 primordial cells develop into mature neurons and glia.Thus, AMG, PMG, MNB, and immature MP1s, MP3s, andVUMs can all be identified at stage 11 based on their similaritiesin gene expression to stages 13 and 17. While not proof of cellrelationships, examination of gene expression for multiplegenes expressed in each cell type provides a consistent view. Incontrast, the relationship between specific midline cells at stage9 and earlier to mature midline cell types is unclear, althoughrecent work has provided some insight (Bossing and Brand,2006). An early model proposed a detailed scheme of midlinecell development, and indicated that midline cell types acquiretheir individual identities prior to the division from 8 to 16 cells(embryonic stage 8) (Klämbt et al., 1991). However, criticalexperimental support was lacking. In contrast, Bossing andBrand (2006) proposed a model in which the identities of somemidline cell types are specified by a combination oftranscription factors and signaling pathways after the 16 cellstage. In this model, wg and hh signaling define a group of cellsin the anterior of the segment that initiate en expression duringstage 10 and are integrated into the next anterior segment. It issuggested that this group of cells gives rise to the en+ MNB andVUM neurons. However, Bossing and Brand (2006) do notaccount for the PMG, the en+ group of 3–4 midline glia that arepresent at the posterior of each segment beginning at stage 11(Figs. 4, 5; Dong and Jacobs, 1997; Kearney et al., 2004). Thus,the exact identities of the cells that arise from this cluster areuncertain. Our gene expression analysis indicates at least 7different pairs of midline cells at stage 9. However, expressionof most of these genes does not persist past stage 10, and thosethat do (en, l(1)sc, odd, and runt) are dynamically expressedand, therefore, are unreliable lineage markers. Thus, our data donot provide insight into lineage relationships between stages 9and 11, but provides molecular markers with which models canbe tested.
521S.R. Wheeler et al. / Developmental Biology 294 (2006) 509–524
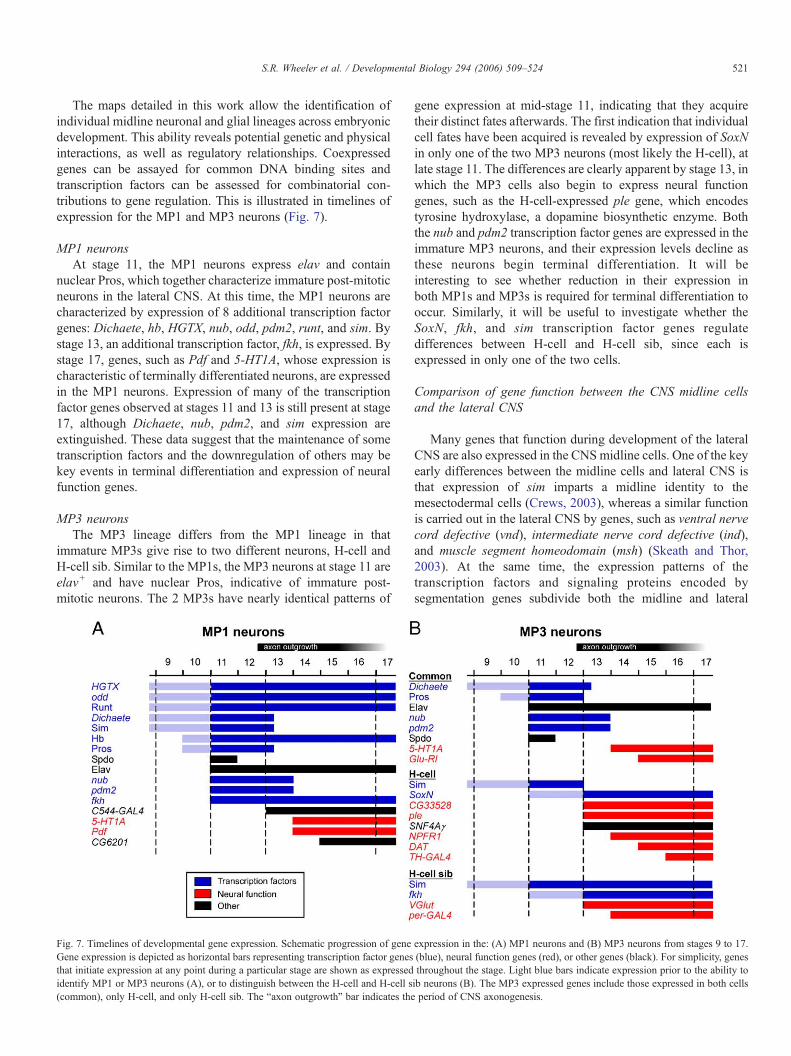
The maps detailed in this work allow the identification ofindividual midline neuronal and glial lineages across embryonicdevelopment. This ability reveals potential genetic and physicalinteractions, as well as regulatory relationships. Coexpressedgenes can be assayed for common DNA binding sites andtranscription factors can be assessed for combinatorial con-tributions to gene regulation. This is illustrated in timelines ofexpression for the MP1 and MP3 neurons (Fig. 7).
MP1 neuronsAt stage 11, the MP1 neurons express elav and contain
nuclear Pros, which together characterize immature post-mitoticneurons in the lateral CNS. At this time, the MP1 neurons arecharacterized by expression of 8 additional transcription factorgenes: Dichaete, hb, HGTX, nub, odd, pdm2, runt, and sim. Bystage 13, an additional transcription factor, fkh, is expressed. Bystage 17, genes, such as Pdf and 5-HT1A, whose expression ischaracteristic of terminally differentiated neurons, are expressedin the MP1 neurons. Expression of many of the transcriptionfactor genes observed at stages 11 and 13 is still present at stage17, although Dichaete, nub, pdm2, and sim expression areextinguished. These data suggest that the maintenance of sometranscription factors and the downregulation of others may bekey events in terminal differentiation and expression of neuralfunction genes.
MP3 neuronsThe MP3 lineage differs from the MP1 lineage in that
immature MP3s give rise to two different neurons, H-cell andH-cell sib. Similar to the MP1s, the MP3 neurons at stage 11 areelav+ and have nuclear Pros, indicative of immature post-mitotic neurons. The 2 MP3s have nearly identical patterns of
Fig. 7. Timelines of developmental gene expression. Schematic progression of geneGene expression is depicted as horizontal bars representing transcription factor genesthat initiate expression at any point during a particular stage are shown as expressedidentify MP1 or MP3 neurons (A), or to distinguish between the H-cell and H-cell s(common), only H-cell, and only H-cell sib. The “axon outgrowth” bar indicates the
gene expression at mid-stage 11, indicating that they acquiretheir distinct fates afterwards. The first indication that individualcell fates have been acquired is revealed by expression of SoxNin only one of the two MP3 neurons (most likely the H-cell), atlate stage 11. The differences are clearly apparent by stage 13, inwhich the MP3 cells also begin to express neural functiongenes, such as the H-cell-expressed ple gene, which encodestyrosine hydroxylase, a dopamine biosynthetic enzyme. Boththe nub and pdm2 transcription factor genes are expressed in theimmature MP3 neurons, and their expression levels decline asthese neurons begin terminal differentiation. It will beinteresting to see whether reduction in their expression inboth MP1s and MP3s is required for terminal differentiation tooccur. Similarly, it will be useful to investigate whether theSoxN, fkh, and sim transcription factor genes regulatedifferences between H-cell and H-cell sib, since each isexpressed in only one of the two cells.
Comparison of gene function between the CNS midline cellsand the lateral CNS
Many genes that function during development of the lateralCNS are also expressed in the CNSmidline cells. One of the keyearly differences between the midline cells and lateral CNS isthat expression of sim imparts a midline identity to themesectodermal cells (Crews, 2003), whereas a similar functionis carried out in the lateral CNS by genes, such as ventral nervecord defective (vnd), intermediate nerve cord defective (ind),and muscle segment homeodomain (msh) (Skeath and Thor,2003). At the same time, the expression patterns of thetranscription factors and signaling proteins encoded bysegmentation genes subdivide both the midline and lateral
expression in the: (A) MP1 neurons and (B) MP3 neurons from stages 9 to 17.(blue), neural function genes (red), or other genes (black). For simplicity, genesthroughout the stage. Light blue bars indicate expression prior to the ability toib neurons (B). The MP3 expressed genes include those expressed in both cellsperiod of CNS axonogenesis.
522 S.R. Wheeler et al. / Developmental Biology 294 (2006) 509–524
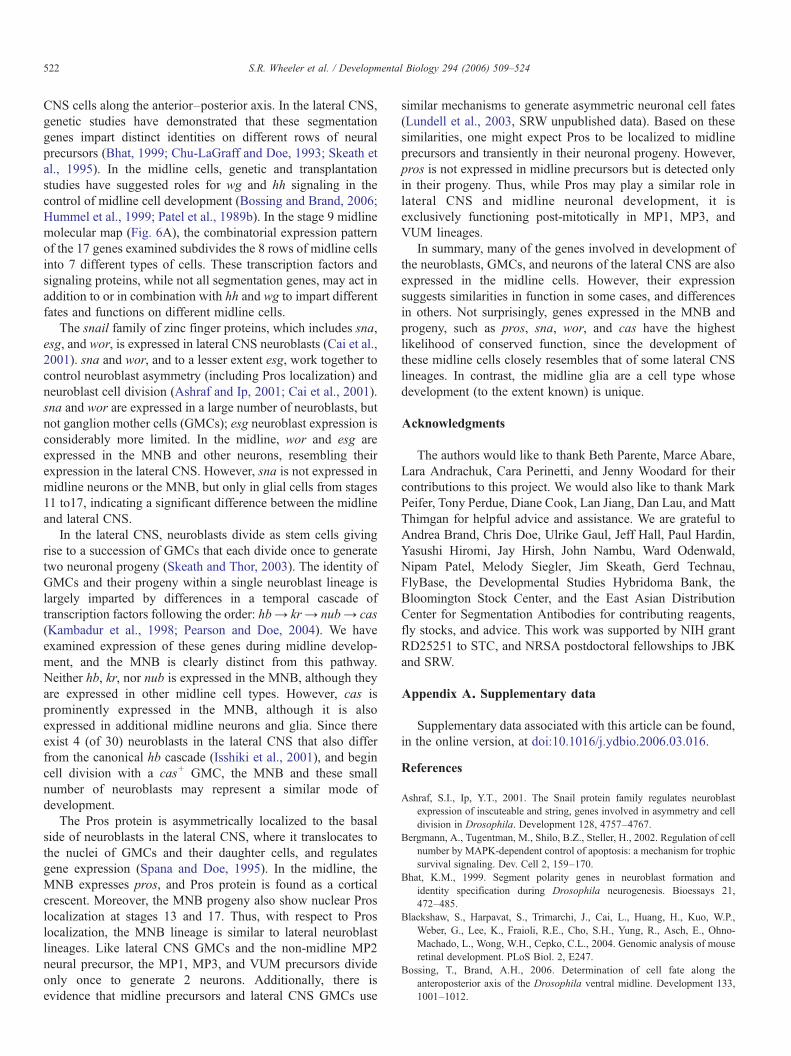
CNS cells along the anterior–posterior axis. In the lateral CNS,genetic studies have demonstrated that these segmentationgenes impart distinct identities on different rows of neuralprecursors (Bhat, 1999; Chu-LaGraff and Doe, 1993; Skeath etal., 1995). In the midline cells, genetic and transplantationstudies have suggested roles for wg and hh signaling in thecontrol of midline cell development (Bossing and Brand, 2006;Hummel et al., 1999; Patel et al., 1989b). In the stage 9 midlinemolecular map (Fig. 6A), the combinatorial expression patternof the 17 genes examined subdivides the 8 rows of midline cellsinto 7 different types of cells. These transcription factors andsignaling proteins, while not all segmentation genes, may act inaddition to or in combination with hh and wg to impart differentfates and functions on different midline cells.
The snail family of zinc finger proteins, which includes sna,esg, and wor, is expressed in lateral CNS neuroblasts (Cai et al.,2001). sna and wor, and to a lesser extent esg, work together tocontrol neuroblast asymmetry (including Pros localization) andneuroblast cell division (Ashraf and Ip, 2001; Cai et al., 2001).sna and wor are expressed in a large number of neuroblasts, butnot ganglion mother cells (GMCs); esg neuroblast expression isconsiderably more limited. In the midline, wor and esg areexpressed in the MNB and other neurons, resembling theirexpression in the lateral CNS. However, sna is not expressed inmidline neurons or the MNB, but only in glial cells from stages11 to17, indicating a significant difference between the midlineand lateral CNS.
In the lateral CNS, neuroblasts divide as stem cells givingrise to a succession of GMCs that each divide once to generatetwo neuronal progeny (Skeath and Thor, 2003). The identity ofGMCs and their progeny within a single neuroblast lineage islargely imparted by differences in a temporal cascade oftranscription factors following the order: hb→ kr→ nub→ cas(Kambadur et al., 1998; Pearson and Doe, 2004). We haveexamined expression of these genes during midline develop-ment, and the MNB is clearly distinct from this pathway.Neither hb, kr, nor nub is expressed in the MNB, although theyare expressed in other midline cell types. However, cas isprominently expressed in the MNB, although it is alsoexpressed in additional midline neurons and glia. Since thereexist 4 (of 30) neuroblasts in the lateral CNS that also differfrom the canonical hb cascade (Isshiki et al., 2001), and begincell division with a cas+ GMC, the MNB and these smallnumber of neuroblasts may represent a similar mode ofdevelopment.
The Pros protein is asymmetrically localized to the basalside of neuroblasts in the lateral CNS, where it translocates tothe nuclei of GMCs and their daughter cells, and regulatesgene expression (Spana and Doe, 1995). In the midline, theMNB expresses pros, and Pros protein is found as a corticalcrescent. Moreover, the MNB progeny also show nuclear Proslocalization at stages 13 and 17. Thus, with respect to Proslocalization, the MNB lineage is similar to lateral neuroblastlineages. Like lateral CNS GMCs and the non-midline MP2neural precursor, the MP1, MP3, and VUM precursors divideonly once to generate 2 neurons. Additionally, there isevidence that midline precursors and lateral CNS GMCs use
similar mechanisms to generate asymmetric neuronal cell fates(Lundell et al., 2003, SRW unpublished data). Based on thesesimilarities, one might expect Pros to be localized to midlineprecursors and transiently in their neuronal progeny. However,pros is not expressed in midline precursors but is detected onlyin their progeny. Thus, while Pros may play a similar role inlateral CNS and midline neuronal development, it isexclusively functioning post-mitotically in MP1, MP3, andVUM lineages.
In summary, many of the genes involved in development ofthe neuroblasts, GMCs, and neurons of the lateral CNS are alsoexpressed in the midline cells. However, their expressionsuggests similarities in function in some cases, and differencesin others. Not surprisingly, genes expressed in the MNB andprogeny, such as pros, sna, wor, and cas have the highestlikelihood of conserved function, since the development ofthese midline cells closely resembles that of some lateral CNSlineages. In contrast, the midline glia are a cell type whosedevelopment (to the extent known) is unique.
Acknowledgments
The authors would like to thank Beth Parente, Marce Abare,Lara Andrachuk, Cara Perinetti, and Jenny Woodard for theircontributions to this project. We would also like to thank MarkPeifer, Tony Perdue, Diane Cook, Lan Jiang, Dan Lau, and MattThimgan for helpful advice and assistance. We are grateful toAndrea Brand, Chris Doe, Ulrike Gaul, Jeff Hall, Paul Hardin,Yasushi Hiromi, Jay Hirsh, John Nambu, Ward Odenwald,Nipam Patel, Melody Siegler, Jim Skeath, Gerd Technau,FlyBase, the Developmental Studies Hybridoma Bank, theBloomington Stock Center, and the East Asian DistributionCenter for Segmentation Antibodies for contributing reagents,fly stocks, and advice. This work was supported by NIH grantRD25251 to STC, and NRSA postdoctoral fellowships to JBKand SRW.
Appendix A. Supplementary data
Supplementary data associated with this article can be found,in the online version, at doi:10.1016/j.ydbio.2006.03.016.
References
Ashraf, S.I., Ip, Y.T., 2001. The Snail protein family regulates neuroblastexpression of inscuteable and string, genes involved in asymmetry and celldivision in Drosophila. Development 128, 4757–4767.
Bergmann, A., Tugentman, M., Shilo, B.Z., Steller, H., 2002. Regulation of cellnumber by MAPK-dependent control of apoptosis: a mechanism for trophicsurvival signaling. Dev. Cell 2, 159–170.
Bhat, K.M., 1999. Segment polarity genes in neuroblast formation andidentity specification during Drosophila neurogenesis. Bioessays 21,472–485.
Blackshaw, S., Harpavat, S., Trimarchi, J., Cai, L., Huang, H., Kuo, W.P.,Weber, G., Lee, K., Fraioli, R.E., Cho, S.H., Yung, R., Asch, E., Ohno-Machado, L., Wong, W.H., Cepko, C.L., 2004. Genomic analysis of mouseretinal development. PLoS Biol. 2, E247.
Bossing, T., Brand, A.H., 2006. Determination of cell fate along theanteroposterior axis of the Drosophila ventral midline. Development 133,1001–1012.
523S.R. Wheeler et al. / Developmental Biology 294 (2006) 509–524
Bossing, T., Technau, G.M., 1994. The fate of the CNS midline progenitors inDrosophila as revealed by a new method for single cell labelling.Development 120, 1895–1906.
Budnik, V., White, K., 1988. Catecholamine-containing neurons in Drosophilamelanogaster: distribution and development. J. Comp. Neurol. 268,400–413.
Cai, Y., Chia, W., Yang, X., 2001. A family of snail-related zinc finger proteinsregulates two distinct and parallel mechanisms that mediate Drosophilaneuroblast asymmetric divisions. EMBO J. 20, 1704–1714.
Callahan, C.A., Thomas, J.B., 1994. Tau-beta-galactosidase, an axon-targetedfusion protein. Proc. Natl. Acad. Sci. U. S. A. 91, 5972–5976.
Campos-Ortega, J.A., Hartenstein, V., 1997. The Embryonic Development ofDrosophila melanogaster. Springer Verlag, Berlin.
Chu-LaGraff, Q., Doe, C.Q., 1993. Neuroblast specification and formationregulated by wingless in the Drosophila CNS. Science 261,1594–1597.
Cinar, H., Keles, S., Jin, Y., 2005. Expression profiling of GABAergic motorneurons in Caenorhabditis elegans. Curr. Biol. 15, 340–346.
Crews, S.T., 2003. Drosophila bHLH-PAS developmental regulatory proteins.In: Crews, S.T. (Ed.), PAS Proteins: Regulators and Sensors of Developmentand Physiology. Kluwer.
Daniels, R.W., Collins, C.A., Gelfand, M.V., Dant, J., Brooks, E.S., Krantz,D.E., DiAntonio, A., 2004. Increased expression of the Drosophilavesicular glutamate transporter leads to excess glutamate release and acompensatory decrease in quantal content. J. Neurosci. 24, 10466–10474.
Dong, R., Jacobs, J.R., 1997. Origin and differentiation of supernumerarymidline glia in Drosophila embryos deficient for apoptosis. Dev. Biol. 190,165–177.
Freeman, M.R., Delrow, J., Kim, J., Johnson, E., Doe, C.Q., 2003. Unwrappingglial biology: Gcm target genes regulating glial development, diversifica-tion, and function. Neuron 38, 567–580.
Friggi-Grelin, F., Coulom, H., Meller, M., Gomez, D., Hirsh, J., Birman, S.,2003. Targeted gene expression in Drosophila dopaminergic cells usingregulatory sequences from tyrosine hydroxylase. J. Neurobiol. 54,618–627.
Goodman, C.S., 1982. Embryonic development of identified neurons in thegrasshopper. In: Spitzer, N.C. (Ed.), Neuronal Development. Plenum,pp. 171–212.
Gray, P.A., Fu, H., Luo, P., Zhao, Q., Yu, J., Ferrari, A., Tenzen, T., Yuk, D.I.,Tsung, E.F., Cai, Z., Alberta, J.A., Cheng, L.P., Liu, Y., Stenman, J.M.,Valerius, M.T., Billings, N., Kim, H.A., Greenberg, M.E., McMahon, A.P.,Rowitch, D.H., Stiles, C.D., Ma, Q., 2004. Mouse brain organizationrevealed through direct genome-scale TF expression analysis. Science 306,2255–2257.
Greer, C.L., Grygoruk, A., Patton, D.E., Ley, B., Romero-Calderon, R., Chang,H.Y., Houshyar, R., Bainton, R.J., Diantonio, A., Krantz, D.E., 2005. Asplice variant of the Drosophila vesicular monoamine transporter contains aconserved trafficking domain and functions in the storage of dopamine,serotonin, and octopamine. J. Neurobiol.
Hummel, T., Schimmelpfeng, K., Klambt, C., 1999. Commissure formation inthe embryonic CNS of Drosophila: I. Identification of the required genefunctions. Dev. Biol. 209, 381–398.
Isshiki, T., Pearson, B., Holbrook, S., Doe, C.Q., 2001. Drosophila neuroblastssequentially express transcription factors which specify the temporal identityof their neuronal progeny. Cell 106, 511–521.
Jacobs, J.R., 2000. The midline glia of Drosophila: a molecular geneticmodel for the developmental functions of glia. Prog. Neurobiol. 62,475–508.
Jacobs, J.R., Goodman, C.S., 1989. Embryonic development of axon pathwaysin theDrosophila CNS: II. Behavior of pioneer growth cones. J. Neurosci. 9,2412–2422.
Jia, X.X., Siegler, M.V., 2002. Midline lineages in grasshopper produceneuronal siblings with asymmetric expression of Engrailed. Development129, 5181–5193.
Kambadur, R., Koizumi, K., Stivers, C., Nagle, J., Poole, S.J., Odenwald,W.F., 1998. Regulation of POU genes by castor and hunchbackestablishes layered compartments in the Drosophila CNS. Genes Dev.12, 246–260.
Kearney, J.B., Wheeler, S.R., Estes, P., Parente, B., Crews, S.T., 2004. Geneexpression profiling of the developing Drosophila CNS midline cells. Dev.Biol. 275, 473–492.
Klämbt, C., Jacobs, J.R., Goodman, C.S., 1991. The midline of the Drosophilacentral nervous system: a model for the genetic analysis of cell fate, cellmigration, and growth cone guidance. Cell 64, 801–815.
Kosman, D., Small, S., Reinitz, J., 1998. Rapid preparation of a panel ofpolyclonal antibodies to Drosophila segmentation proteins. Dev. GenesEvol. 208, 290–294.
Landgraf, M., Bossing, T., Technau, G.M., Bate, M., 1997. The origin, location,and projections of the embryonic abdominal motorneurons of Drosophila. J.Neurosci. 17, 9642–9655.
Landgraf, M., Sanchez-Soriano, N., Technau, G.M., Urban, J., Prokop, A.,2003. Charting the Drosophila neuropile: a strategy for the standardisedcharacterisation of genetically amenable neurites. Dev. Biol. 260,207–225.
Lundell, M.J., Lee, H.K., Perez, E., Chadwell, L., 2003. The regulation ofapoptosis by Numb/Notch signaling in the serotonin lineage of Drosophila.Development 130, 4109–4121.
Mesce, K.A., DeLorme, A.W., Brelje, T.C., Klukas, K.A., 2001. Dopamine-synthesizing neurons include the putative H-cell homologue in the mothManduca sexta. J. Comp. Neurol. 430, 501–517.
Miguel-Aliaga, I., Thor, S., 2004. Segment-specific prevention of pioneerneuron apoptosis by cell-autonomous, postmitotic Hox gene activity.Development 131, 6093–6105.
Nambu, J.R., Lewis, J.L., Wharton, K.A., Crews, S.T., 1991. The Drosophilasingle-minded gene encodes a helix–loop–helix protein which acts as amaster regulator of CNS midline development. Cell 67, 1157–1167.
Neckameyer, W.S., White, K., 1993. Drosophila tyrosine hydroxylase isencoded by the pale locus. J. Neurogenet. 8, 189–199.
Nusslein-Volhard, C., Wieschaus, E., 1980. Mutations affecting segmentnumber and polarity in Drosophila. Nature 287, 795–801.
O'Connor-Giles, K.M., Skeath, J.B., 2003. Numb inhibits membrane localiza-tion of Sanpodo, a four-pass transmembrane protein, to promote asymmetricdivisions in Drosophila. Dev. Cell 5, 231–243.
Patel, N.H., Marin-Blanco, E., Coleman, K.G., Poole, S.J., Ellis, M.C.,Kornberg, T.B., Goodman, C.S., 1989a. Expression of engrailed proteins inarthropods, annelids, and chordates. Cell 58, 955–968.
Patel, N.H., Schafer, B., Goodman, C.S., Holmgren, R., 1989b. The role ofsegment polarity genes during Drosophila neurogenesis. Genes Dev. 3,890–904.
Pearson, B.J., Doe, C.Q., 2004. Specification of temporal identity in thedeveloping nervous system. Annu. Rev. Cell Dev. Biol. 20,619–647.
Plautz, J.D., Kaneko, M., Hall, J.C., Kay, S.A., 1997. Independentphotoreceptive circadian clocks throughout Drosophila. Science 278,1632–1635.
Reeves, N., Posakony, J.W., 2005. Genetic programs activated byproneural proteins in the developing Drosophila PNS. Dev. Cell 8,413–425.
Renn, S.C., Park, J.H., Rosbash, M., Hall, J.C., Taghert, P.H., 1999. A pdfneuropeptide gene mutation and ablation of PDF neurons each cause severeabnormalities of behavioral circadian rhythms in Drosophila. Cell 99,791–802.
Robinow, S., White, K., 1991. Characterization and spatial distribution of theELAV protein during Drosophila melanogaster development. J. Neurobiol.22, 443–461.
Schmid, A., Chiba, A., Doe, C.Q., 1999. Clonal analysis of Drosophilaembryonic neuroblasts: neural cell types, axon projections and muscletargets. Development 126, 4653–4689.
Siegler, M.V., Jia, X.X., 1999. Engrailed negatively regulates the expression ofcell adhesion molecules connectin and neuroglian in embryonic Drosophilanervous system. Neuron 22, 265–276.
Sink, H., Whitington, P.M., 1991. Location and connectivity of abdominalmotoneurons in the embryo and larva of Drosophila melanogaster. J.Neurobiol. 22, 298–311.
Skeath, J.B., Thor, S., 2003. Genetic control of Drosophila nerve corddevelopment. Curr. Opin. Neurobiol. 13, 8–15.

524 S.R. Wheeler et al. / Developmental Biology 294 (2006) 509–524
Skeath, J.B., Zhang, Y., Holmgren, R., Carroll, S.B., Doe, C.Q., 1995.Specification of neuroblast identity in the Drosophila embryonic centralnervous system by gooseberry-distal. Nature 376, 427–430.
Spana, E.P., Doe, C.Q., 1995. The prospero transcription factor is asymmet-rically localized to the cell cortex during neuroblast mitosis in Drosophila.Development 121, 3187–3195.
Spana, E.P., Kopczynski, C., Goodman, C.S., Doe, C.Q., 1995. Asymmetriclocalization of numb autonomously determines sibling neuron identity in theDrosophila CNS. Development 121, 3489–3494.
Stapleton, M., Liao, G., Brokstein, P., Hong, L., Carninci, P., Shiraki,T., Hayashizaki, Y., Champe, M., Pacleb, J., Wan, K., Yu, C.,Carlson, J., George, R., Celniker, S., Rubin, G.M., 2002. The
Drosophila gene collection: identification of putative full-lengthcDNAs for 70% of D. melanogaster genes. Genome Res. 12,1294–1300.
Ward, M.P., Mosher, J.T., Crews, S.T., 1998. Regulation of Drosophila bHLH-PAS protein cellular localization during embryogenesis. Development 125,1599–1608.
Wenick, A.S., Hobert, O., 2004. Genomic cis-regulatory architecture and trans-acting regulators of a single interneuron-specific gene battery in C. elegans.Dev. Cell 6, 757–770.
Xiao, H., Hrdlicka, L.A., Nambu, J.R., 1996. Alternate function of the single-minded and rhomboid genes in development of the Drosophila ventralneuroectoderm. Mech. Dev. 58, 65–74.