Embed Size (px)
Citation preview
Genome wide identification of NBS-LRR genes in Brassica and
their association with disease resistance in Brassica napus
Salman F. Alamery
BSC (Biochemistry)
MSC (Molecular Biology and Biotechnology)
A thesis submitted for the degree of Doctor of Philosophy at
The University of Queensland in 2015
School of Agriculture and Food Sciences
i
Abstract
Brassica napus (canola/rapeseed/oilseed rape) is an important commercial oilseed crop in Australia
with an annual production of approximately 1.6 million tons of oil. Canola is an important source of
edible vegetable oil and has a broad range of industrial purposes. Blackleg disease (stem canker)
caused by the fungal pathogen Leptosphaeria maculans, is one of the most devastating diseases in
B. napus. This disease causes significant yield losses with an annual average loss of 15 to 48 %,
although losses can reach up to 80% worldwide, mainly in Europe, Australia and Canada.
In order to develop an effective strategy to control the blackleg disease, there is a need to identify
blackleg resistance genes in Brassica species and understand the genetic interaction between plant
resistance genes and the pathogen avirulence genes. Thus, identification of Nucleotide Binding Site-
Leucine Rich Repeat (NBS-LRR) resistance genes is one of the most important objectives of
understanding resistance. NBS-LRR resistance genes have been extensively studied because they
represent the largest class of disease resistance genes and play a critical role in defending plants
from pathogens.
The objective of this study was to perform comprehensive analysis on identification and
characterization of NBS-LRR genes in the B. napus genome and to study the synteny and
conservation of NBS-LRR genes between Brassica species. In this study, a total of 641, 249 and
443 NBS-LRR encoding genes in B. napus, B. rapa and B. oleracea, respectively, were identified.
The comparative analysis between B. napus and its progenitor species indicated that NBS-LRR
genes exhibited similar gene structure, genomic location, arrangement in clusters and syntenic
relationships. The results provide evidence that there was a selective advantage to maintaining
similar features of NBS-LRR genes in B. napus to both B. rapa and B. oleracea following
polyploidization. More than 60% of NBS LRR genes from the progenitor species were conserved.
The differences in NBS-LRR gene conservation could be attributed to gene losses or selection
pressure to offer species-specific or cultivars-specific resistance.
This study found that the NBS-LRR resistance genes are physically clustered and individual genes
involved in clusters were more polymorphic and subject to evolutionary process than singleton
genes. These clusters, which have been described in many other species, provide a reservoir of
genetic variation influenced by tandem duplication and selection pressure. In addition, there was a
significant correlation and co-localization between the number of NBS-LRR genes within the
disease QTL intervals and the number of genes involved in gene clusters or duplication. This

ii
correlation provides evidence that NBS-LRR are distributed and clustered throughout the genome
and tends to be linked and associated with disease QTL intervals.
Genetic studies have identified the gene for gene interactions between avirulence (Avr) genes in L.
maculans and their corresponding Rlm (Resistance to Leptosphaeria maculans) genes in B. napus.
In addition, genetic mapping studies have shown that there are five major resistance genes on
chromosome A7: Rlm1, Rlm3, Rlm4, Rlm7, and Rlm9. At present, none of the genetically mapped
Rlm genes on chromosome A7 have been sequenced and validated in B. napus.
A total of 12 NBS-LRR and 18 LRR-containing resistance genes were on B. napus chromosome A7
located within the Rlm QTL region of interest. The comparative analysis of these resistance genes
between Brassica species confirmed the gene synteny and conservation. However, there was
considerable variation; either gene presence/absence or substantial differences in the protein
sequence. The comparative analysis allowed making an initial prediction and prioritization for
targeting these identified genes for further characterization and validation. In this study, a candidate
gene approach, combined with comparative analysis, was exploited for identification of Rlm9
candidate genes in B. napus. The candidate gene approach identified six NBS-LRR and eight LRR-
containing genes associated with the Rlm9 QTL region. The NBS-LRR genes were selected for
further analysis as highest priority candidate genes.
These results provide the first in-depth molecular characterization of NBS-LRR genes in B. napus
providing potential candidate gene for disease resistance trait in B. napus. More importantly, this
work has significantly increased our understanding about blackleg resistance in B. napus and major
disease resistance genes have been identified.

iii
Declaration by author
This thesis is composed of my original work, and contains no material previously published or
written by another person except where due reference has been made in the text. I have clearly
stated the contribution by others to jointly-authored works that I have included in my thesis.
I have clearly stated the contribution of others to my thesis as a whole, including statistical
assistance, survey design, data analysis, significant technical procedures, professional editorial
advice, and any other original research work used or reported in my thesis. The content of my thesis
is the result of work I have carried out since the commencement of my research higher degree
candidature and does not include a substantial part of work that has been submitted to qualify for
the award of any other degree or diploma in any university or other tertiary institution. I have
clearly stated which parts of my thesis, if any, have been submitted to qualify for another award.
I acknowledge that an electronic copy of my thesis must be lodged with the University Library and,
subject to the policy and procedures of The University of Queensland, the thesis be made available
for research and study in accordance with the Copyright Act 1968 unless a period of embargo has
been approved by the Dean of the Graduate School.
I acknowledge that copyright of all material contained in my thesis resides with the copyright
holder(s) of that material. Where appropriate I have obtained copyright permission from the
copyright holder to reproduce material in this thesis.

iv
Publications during candidature
Peer reviewed journal publications
Raman, H., Dalton-Morgan, J., Diffey, S., Raman, R., Alamery, S., Edwards, D. & Batley, J. 2014.
SNP markers-based map construction and genome-wide linkage analysis in Brassica
napus. Plant Biotechnology Journal, 12, 851-860.
Dalton-Morgan, J., Hayward, A., Alamery, S., Tollenaere, R., Mason, A., Campbell, E., Patel, D.,
Lorenc, M., Yi, B., Long, Y., Meng, J., Raman, R., Raman, H., Lawley, C., Edwards, D. &
Batley, J. 2014. A high-throughput SNP array in the amphidiploid species Brassica
napus shows diversity in resistance genes. Functional & Integrative Genomics, 1-13.
Chalhoub, B., Denoeud, F., Liu, S., Parkin, I. A. P., Tang, H., Wang, X., Chiquet, J., Belcram, H.,
Tong, C., Samans, B., Corréa, M., Da Silva, C., Just, J., Falentin, C., Koh, C. S., Le
Clainche, I., Bernard, M., Bento, P., Noel, B., Labadie, K., Alberti, A., Charles, M., Arnaud,
D., Guo, H., Daviaud, C., Alamery, S., Jabbari, K., Zhao, M., Edger, P. P., Chelaifa, H.,
Tack, D., Lassalle, G., Mestiri, I., Schnel, N., Le Paslier, M.-C., Fan, G., Renault, V., Bayer,
P. E., Golicz, A. A., Manoli, S., Lee, T.-H., Thi, V. H. D., Chalabi, S., Hu, Q., Fan, C.,
Tollenaere, R., Lu, Y., Battail, C., Shen, J., Sidebottom, C. H. D., Wang, X., Canaguier, A.,
Chauveau, A., Bérard, A., Deniot, G., Guan, M., Liu, Z., Sun, F., Lim, Y. P., Lyons, E.,
Town, C. D., Bancroft, I., Wang, X., Meng, J., Ma, J., Pires, J. C., King, G. J., Brunel, D.,
Delourme, R., Renard, M., Aury, J.-M., Adams, K. L., Batley, J., Snowdon, R. J., Tost, J.,
Edwards, D., Zhou, Y., Hua, W., Sharpe, A. G., Paterson, A. H., Guan, C. & Wincker, P.
2014. Early allopolyploid evolution in the post-Neolithic Brassica napus oilseed
genome. Science, 345, 950-953.
Salman Alamery, Reece Tollenaere, Philipp E. Bayer, Boulos Chalhoub, David Edwards and
Jacqueline Batley (2015) Genome wide identification and characterization of NBS-LRR
resistance genes in Brassica napus, Plant Biotechnology journal (submitted).
Salman Alamery, David Edwards and Jacqueline Batley (2015) Association and localization of
NBS-LRR genes with disease resistance QTL in Brassica napus, international Journal of
Genomics (submitted).

v
Publications included in this thesis
Chalhoub, B., Denoeud, F., Liu, S., Parkin, I. A. P., Tang, H., Wang, X., Chiquet, J., Belcram, H.,
Tong, C., Samans, B., Corréa, M., Da Silva, C., Just, J., Falentin, C., Koh, C. S., Le
Clainche, I., Bernard, M., Bento, P., Noel, B., Labadie, K., Alberti, A., Charles, M., Arnaud,
D., Guo, H., Daviaud, C., Alamery, S., Jabbari, K., Zhao, M., Edger, P. P., Chelaifa, H.,
Tack, D., Lassalle, G., Mestiri, I., Schnel, N., Le Paslier, M.-C., Fan, G., Renault, V., Bayer,
P. E., Golicz, A. A., Manoli, S., Lee, T.-H., Thi, V. H. D., Chalabi, S., Hu, Q., Fan, C.,
Tollenaere, R., Lu, Y., Battail, C., Shen, J., Sidebottom, C. H. D., Wang, X., Canaguier, A.,
Chauveau, A., Bérard, A., Deniot, G., Guan, M., Liu, Z., Sun, F., Lim, Y. P., Lyons, E.,
Town, C. D., Bancroft, I., Wang, X., Meng, J., Ma, J., Pires, J. C., King, G. J., Brunel, D.,
Delourme, R., Renard, M., Aury, J.-M., Adams, K. L., Batley, J., Snowdon, R. J., Tost, J.,
Edwards, D., Zhou, Y., Hua, W., Sharpe, A. G., Paterson, A. H., Guan, C. & Wincker, P.
2014. Early allopolyploid evolution in the post-Neolithic Brassica napus oilseed
genome. Science, 345, 950-953 (accepted). Included in Chapter 3
Contributor Statement of contribution
Salman Alamery (Candidate) NBS-LRR gene analysis, identification and
comparative analysis 40%
Jacqueline Batley NBS-LRR gene analysis, group leader 10%
Reece Tollenaere NBS-LRR gene analysis, identification and
comparative analysis 10%
Philipp E. Bayer
NBS-LRR gene analysis, bioinformatics 40% Chuchuan Fan
Yong Pyo Lim
Sahana Manoli

vi
Salman Alamery, Reece Tollenaere, Philipp E. Bayer, Boulos Chalhoub, David Edwards and
Jacqueline Batley (2015) Genome wide identification and characterization of NBS-LRR
resistance genes in Brassica napus, Plant Biotechnology journal (submitted). Included as Chapter
2 and 3
Contributor Statement of contribution
Salman Alamery (Candidate) Designed experiments (60%)
Conducted experiments (100%)
Sequence data analysis (60%)
Wrote the paper (100%)
Jacqueline Batley Designed experiments (40%)
Edited paper (50%)
David Edwards Edited paper (30%)
Boulos Chalhoub Edited paper (20%)
Philipp E. Bayer Sequence data analysis (20%)
Reece Tollenaere Sequence data analysis (20%)
Salman Alamery, David Edwards and Jacqueline Batley (2015) Association and localization of
NBS-LRR genes with disease resistance QTL in Brassica napus, International Journal of
Genomics (submitted). Included as Chapter 4
Contributor Statement of contribution
Salman Alamery (Candidate) Designed experiments (60%)
Conducted experiments (100%)
Wrote the paper (100%)
Jacqueline Batley Designed experiments (40%)
Edited paper (50%)
David Edwards Edited paper (50%)

vii
Contributions by others to the thesis
Prof Jacqueline Batley contributed to the conception and supervision of the research and assisted
with editing of writing. Illumina read mapping of Skipton and Ag-Spectrum reads and running of
the MAST/MEME pipeline was performed by Prof Edwards’ bioinformatics group.
Statement of parts of the thesis submitted to qualify for the award of another degree
None

viii
Acknowledgements
I am pleased to dedicate this thesis to all people who have helped and supported me during my PhD
study.
First of all, I would like to acknowledge and extend my deep gratitude to my principal advisor, Prof
Jacqueline Batley for supervision and providing me with the opportunity to conduct my PhD
research. She has been constantly supportive and encouraging throughout my PhD study. I have
learned a lot from her expertise and without her, this thesis wouldn’t have been completed. I greatly
appreciated her advices, friendship and the time taken to read my papers and thesis. I look forward
to further collaboration with in the future.
I also wish to thank my co-advisor, Prof David Edwards and his bioinformatics group at the
University of Queensland for assisting with bioinformatics analysis.
I would also like to extend my gratitude to all the members of the Batley group and the staff and
students at CILR at the University of Queensland, who I have been lucky enough to share a lab with
them. In particular, I would like to thank Reece Tollenaere for his friendship, helpful discussions.
I would like to thank A/Prof Elizabeth Aitken and Dr Brett Ferguson for their contributions to the
university assessment process and constructive advice during candidature reviews.
I would like to acknowledge King Saud University, Saudi Arabia, for a PhD Scholarship and
financial support during my study. Acknowledge is also made to the University of Queensland,
School of Agricultural and Food Sciences for study courses and research facilities to achieve my
PhD degree.
Above all, I would like to thank my wife, Alya and my daughters, Eman and Lean for their support,
great patience, love and encouragement at all times.

ix
Keywords
Brassica, Leptosphaeria maculans, blackleg disease, comparative genomics, NBS-LRR resistance
gene, gene cluster, candidate genes, disease resistance QTL
Australian and New Zealand Standard Research Classifications (ANZSRC)
ANZSRC code: 060702 Plant Cell and Molecular Biology, 40%
ANZSRC code: 060408 Genomics, 50%
ANZSRC code: 060704 Plant Pathology, 10%
Fields of Research (FoR) Classification
FoR code: 0607, Plant Biology, 80%
FoR code: 0601, Biochemistry and Cell Biology, 20%

x
Table of Contents
Abstract ............................................................................................................................................ i
Declaration by author ................................................................................................................... iii
Acknowledgements ...................................................................................................................... viii
Chapter 1 : Literature review ........................................................................................................... 2
1.1 Introduction ........................................................................................................................... 2
1.2 Brassica napus and related species ....................................................................................... 2
1.3 Brassica genome sequencing: an overview ........................................................................... 3
1.4 Identifying and characterizing the structure of NBS-LRR genes in Brassica ...................... 4
1.5 Genetics of disease resistance in Brassica ............................................................................ 6
1.6 The fungal pathogen Leptosphaeria maculans: Biology and blackleg disease ..................... 8
1.7 Molecular interaction between Brassica and L. maculans .................................................... 9
1.8 Genetic mapping of blackleg resistance genes in Brassica species .................................... 12
1.9 Introgression of blackleg resistance genes into the B. napus genome: attempts and
challenges ....................................................................................................................................... 17
1.10 Genomic approaches for identification of candidate resistance genes ................................ 19
1.10.1 Comparative analysis based candidate gene identification .......................................... 20
1.10.2 Sequence based candidate gene identification ............................................................. 21
1.10.3 SNP genotyping and association with candidate genes ............................................... 22
1.11 Research aims and significance ........................................................................................... 26
Chapter 2 : Genome wide identification and characterization of NBS-LRR resistance genes in
Brassica napus .................................................................................................................................. 30
2.1 Abstract ............................................................................................................................... 30
2.2 Introduction ......................................................................................................................... 31
2.3 Methods ............................................................................................................................... 33
2.3.1 Brassica genome and gene prediction ......................................................................... 33
2.3.2 Identification of NBS-LRR genes in B. napus by MEME/ MAST analysis................ 33
2.3.3 Identification of NBS-LRR genes in B. napus by CNLs and TNLs for validation ..... 33
2.3.4 Correlation between the MAST output and CNL/TNL BLAST results ...................... 34
2.3.5 Manual annotation check and characterization of candidate NBS-LRR genes ........... 34
2.3.6 Multiple alignment and phylogenetic analysis............................................................. 34
2.3.7 NBS-LRR genes cluster and duplication analyses ....................................................... 35
2.4 Results ................................................................................................................................. 36
2.4.1 Genome wide identification of B. napus NBS-LRR genes .......................................... 36

xi
2.4.2 Genomic distribution and organisation of NBS-LRR encoding genes in the B. napus
genome ………………………………………………………………………………………..40
2.4.3 NBS-LRR gene clustering ........................................................................................... 44
2.4.4 Alignment and phylogenetic analysis .......................................................................... 45
2.4.5 NBS-LRR gene duplication ......................................................................................... 49
2.5 Discussion ........................................................................................................................... 53
2.5.1 Genome wide identification of B. napus NBS-LRR genes .......................................... 53
2.5.2 Alignment and phylogenetic analysis .......................................................................... 55
2.5.3 NBS-LRR gene clustering ........................................................................................... 56
2.5.4 NBS-LRR gene duplication ......................................................................................... 57
Chapter 3 : Comparative and conservation analysis of NBS-LRR genes in Brassica ............... 61
3.1 Abstract ............................................................................................................................... 61
3.2 Introduction ......................................................................................................................... 62
3.3 Methods ............................................................................................................................... 64
3.3.1 Brassica reference genomes ......................................................................................... 64
3.3.2 Identification of NBS-LRR genes in B. rapa and B. oleracea .................................... 64
3.3.3 Reciprocal Best BLAST (RBB) of NBS-LRR for comparative analysis between B.
napus, B. rapa and B. oleracea................................................................................................... 64
3.4 Results ................................................................................................................................. 65
3.4.1 Comparison of the distribution of B. napus NBS-LRR genes to its related diploid
species B. rapa and B. oleracea .................................................................................................. 65
3.4.2 Conservation analysis of B. napus NBS-LRR genes to its related diploid species B.
rapa and B. oleracea ................................................................................................................... 75
3.4.3 Comparative analysis of chromosome A7 and C6 in B. napus .................................... 76
3.5 Discussion ........................................................................................................................... 79
3.5.1 Comparison of the distribution of B. napus NBS-LRR genes to its related diploid
progenitor species B. rapa and B. oleracea ................................................................................ 79
3.5.2 Conservation analysis of B. napus NBS-LRR genes to its related diploid species B.
rapa and B. oleracea ................................................................................................................... 80
3.5.3 Comparative analysis of chromosomes A7 and C6 in B. napus .................................. 82
Chapter 4 : Association and localization of NBS-LRR genes with disease resistance QTL in
Brassica napus .................................................................................................................................. 84
4.1 Abstract ............................................................................................................................... 84
4.2 Introduction ......................................................................................................................... 85
4.3 Methods ............................................................................................................................... 88
4.3.1 Brassica reference genome sequences ......................................................................... 88

xii
4.3.2 Identification of QTL intervals in B. napus by marker homology BLAST search ...... 88
4.4 Results ................................................................................................................................. 89
4.4.1 Identification and localization of QTL intervals in B. napus ....................................... 89
4.4.2 Co-localization and association of NBS-LRR genes and QTL intervals ..................... 99
4.5 Discussion ......................................................................................................................... 105
4.5.1 Identification and localization of QTL intervals in B. napus ..................................... 105
4.5.2 Co-localization and association of NBS-LRR genes and QTL intervals ................... 107
Chapter 5 : Comparative analysis enabled the identification of candidate Rlm9 blackleg
resistance genes in Brassica napus ................................................................................................ 110
5.1 Abstract ............................................................................................................................. 110
5.2 Introduction ....................................................................................................................... 111
5.3 Methods ............................................................................................................................. 113
5.3.1 Brassica genome and gene prediction ....................................................................... 113
5.3.2 Identification of NBS-LRR and LRR- containing genes in B. napus ........................ 113
5.3.3 Comparative analysis of NBS-LRR and LRR-containing gene on the A7 and C6
chromosome of B. napus .......................................................................................................... 113
5.3.4 Genetic mapping of the Rlm9 QTL ............................................................................ 113
5.3.5 SNP genotyping of B. napus cultivars ....................................................................... 114
5.3.6 Extraction of genomic DNA ...................................................................................... 116
5.3.7 PCR amplification and sequencing of Rlm9 candidate genes .................................... 116
5.3.8 DNA Sequencing and Sequence Analysis ................................................................. 118
5.4 Results ............................................................................................................................... 119
5.4.1 Identification and characterization of NBS LRR and LRR-containing genes on B.
napus chromosome A7 ............................................................................................................. 119
5.4.2 Comparative analysis of NBS-LRR and LRR-containing genes on chromosome A7 of
B. napus ………………………………………………………………………………………122
5.4.3 Haplotype analysis of Rlm9 and mapping potential SNPs in B. napus...................... 127
5.4.4 The identification of candidate Rlm9 blackleg resistance genes in B. napus ............ 130
5.4.4.1 Candidate gene BnDRG 13..................................................................................... 132
5.4.4.2 Candidate gene BnDRG 14..................................................................................... 132
5.4.4.3 Candidate gene BnDRG 17..................................................................................... 132
5.4.4.4 Candidate gene BnDRG19...................................................................................... 133
5.4.4.5 Candidate gene BnDRG20...................................................................................... 133
5.4.4.6 Candidate gene BnDRG 23..................................................................................... 133
5.4.5 Amplification and sequencing of Rlm9 candidate genes ........................................... 134
5.5 Discussion ......................................................................................................................... 145

xiii
5.5.1 Identification and characterization of NBS-LRR and LRR-containing genes on B.
napus chromosome A07 ........................................................................................................... 145
5.5.2 Comparative analysis of NBS-LRR and LRR-containing genes on chromosome A7
………………………………………………………………………………………145
5.5.3 Haplotype analysis of Rlm9 and mapping potential SNPs on B. napus ..................... 147
5.5.4 The physical location and identification of candidate Rlm9 blackleg resistance gene in
B. napus ………………………………………………………………………………………148
5.5.5 Amplification and sequencing Rlm9 candidate genes ................................................ 149
Chapter 6 : General discussion and future directions ................................................................ 153
6.1 Genome wide identification of NBS-LRR resistance genes in Brassica .......................... 153
6.2 Identification of candidate blackleg resistance genes in B. napus .................................... 155
6.3 Future directions ................................................................................................................ 158
Bibliography................................................................................................................................ 160

xiv
List of Figures
Figure 1.1: The genomic relationships between the six cultivated Brassica species indicating the
genome composition (U, 1935). ........................................................................................................... 3
Figure 1.2: The domain structure of NBS-LRR proteins in plants. Taken from (McHale et al.,
2006). ................................................................................................................................................... 5
Figure 1.3: Blackleg infection symptoms on B. napus caused by L. maculans .................................. 9
Figure 1.4: The mode of activation the plant immune responses by PAMP-triggered immunity
(PTI) and effector-triggered immunity (ETI). .................................................................................... 10
Figure 1.5: The infection outcomes between Brassica R genes and L. maculans Avr genes
according to the gene for gene interaction.. ....................................................................................... 11
Figure 1.6: Integration the partial genetic map of Rlm4 QTL on chromosome A7 of B. napus
against the physical map of B. rapa. .................................................................................................. 17
Figure 1.7: Sequence based identification of Rlm4 candidate gene using NGS data.. ..................... 22
Figure 1.8: The principles of whole genome genotyping using the Illumina infinium assay. .......... 25
Figure 1.9: Schematic representation of genomics based identification of candidate resistance
gene(s) used in this study. .................................................................................................................. 28
Figure 2.1: Example of representation of motif patterns in NBS-LRR genes in B. napus.. ............. 39
Figure 2.2: Physical locations of NBS-LRR genes on the chromosome of the A genome of B.
napus.. ................................................................................................................................................ 42
Figure 2.3: Physical locations of NBS-LRR genes on the chromosome of the C genome of B.
napus.. ................................................................................................................................................ 43
Figure 2.4: A phylogenetic tree of 176 CNL encoding genes of B. napus for NBS domains based
on the neighbour-joining method using MEGA 6.0 software.. .......................................................... 47
Figure 2.5: A phylogenetic tree of 366 TNL encoding genes of B. napus for NBS domains based on
the neighbour-joining method using MEGA 6.0 software. ................................................................ 48
Figure 2.6: Inter-genomic and intra-genomic duplication relationship of NBS-LRR -genes between
the two sub-genomes of B. napus: the A and C genomes.. ................................................................ 50
Figure 3.1: The distribution of NBS-LRR genes in the A genome of B. napus and B. rapa
(Chalhoub et al., 2014). ...................................................................................................................... 69
Figure 3.2: The distribution of NBS-LRR genes in the C genome of B. napus and B. oleracea
(Chalhoub et al., 2014). ...................................................................................................................... 69
Figure 3.3: The proportion of TNL and CNL genes to the total number of NBS-LRR genes in B.
napus, B. rapa and B. oleracea. ......................................................................................................... 70
Figure 3.4: Comparative organization of NBS-LRR genes between the An genome of B. napus and
Ar genome of B. rapa (chromosomes A1 to A5).). ........................................................................... 71
Figure 3.5: Comparative organization of NBS-LRR genes between the An genome of B. napus and
Ar genome of B. rapa (chromosomes A6 to A10).. ........................................................................... 72
Figure 3.6: Comparative organization of NBS-LRR genes between the Cn genome of B. napus and
Co genome of B. oleracea (chromosomes C1 to C5).. ...................................................................... 73
Figure 3.7: Comparative organization of NBS-LRR genes between the Cn genome of B. napus and
Co genome of B. oleracea (chromosomes C6 to C9).. ...................................................................... 74
Figure 3.8: Comparative chromosomal map of NBS-LRR genes on chromosomes A7 and C6
between B. napus (Bn), B. rapa (Br) and B. oleracea (Bo). .............................................................. 77

xv
Figure 3.9: A phylogenetic tree of TNL and CNL genes located on chromosomes A7 and C6 in B.
napus and the diploid species B. rapa and B. oleracea based on a neighbour-joining method using
MEGA 6.0 software. .......................................................................................................................... 78
Figure 4.1: The location of disease resistance loci QTL in the chromosomal map of B. napus. ..... 98
Figure 4.2: The correlation between the number of NBS-LRR genes within the 2Mbp flanking
regions of QTL and the number of NBS-LRR genes involved in gene clusters .............................. 103
Figure 4.3: The correlation between the number of NBS-LRR genes within the 2Mbp flanking
regions of QTL and the number of duplicated NBS-LRR genes. .................................................... 104
Figure 5.1: Distribution of NBS-LRR and LRR-containing genes on chromosome A7 of B. napus.
.......................................................................................................................................................... 121
Figure 5.2: Comparative chromosomal map of NBS-LRR genes on chromosomes A7 and C6
between B. napus (Bn), B. rapa (Br) and B. oleracea (Bo). ............................................................ 125
Figure 5.3: Comparative chromosomal map of LRR-containing genes on chromosomes A7 and C6
between B. napus (Bn), B. rapa (Br) and B. oleracea (Bo). s ......................................................... 126
Figure 5.4: Mapping based identification of the Rlm9 candidate gene using marker physical
mapping, NBS LRR genome wide identification and SNP haplotypes.. ......................................... 131
Figure 5.5: Comparison of deduced amino acid sequences of BnDRG 13 in B. napus Darmor A7 to
its homologous genes in B. napus Tapidor and B. rapa. ................................................................. 137
Figure 5.6: Comparison of deduced amino acid sequences of BnDRG 14 in B. napus Darmor A7 to
its homologous genes in B. napus Tapidor A7 and B. rapa............................................................. 138
Figure 5.7: Comparison of deduced amino acid sequences of BnDRG 17 in B. napus Darmor A7 to
its homologous genes in B. napus Darmor C6 and B. rapa. ............................................................ 139
Figure 5.8: Comparison of deduced amino acid sequences of BnDRG 19 in B. napus Darmor A7 to
its homologous genes in B. napus Darmor C6, B. napus Tapidor A7 and B. rapa. ........................ 140
Figure 5.9: Comparison of deduced amino acid sequences of BnDRG 20 in B. napus Darmor A7 to
its homologous genes in B. napus Darmor C6 and B. rapa. ............................................................ 142
Figure 5.10: Comparison of deduced amino acid sequences of BnDRG 23 in B. napus Darmor A7
to its homologous genes in B. napus Tapidor A7. ........................................................................... 143
Figure 5.11: Assembly of B. napus Skipton and Ag-Spectrum sequence short reads to B. napus
Darmor reference genome within the Rlm9 candidate resistance genes: BnDRG 12, BnDRG 13 ,
BnDRG 18 and BnDRG 19............................................................................................................... 144

xvi
List of Tables
Table 1.1: Resistance genes to L. maculans that have been identified in Brassica species based on
genetics and mapping studies. ............................................................................................................ 15
Table 2.1: The total number of predicted NBS-LRR genes identified in the B. napus genome. The
comparison between methods used: MEME / MAST and CNL and TNL BLAST .......................... 37
Table 2.2: NBS-LRR specific motifs sequence identified with MEME/MAST. .............................. 38
Table 2.3: The distribution and organisation of candidate NBS-LRR genes in B. napus ................. 41
Table 2.4: The number of NBS-LRR genes classified into different classes and their subfamilies
and domain compositions................................................................................................................... 44
Table 2.5: Conserved and consensus sequence of NBS domain motifs found in the NBS-LRR genes
identified in B. napus ......................................................................................................................... 46
Table 2.6: The correlation between B. napus NBS-LRR intra-genomic and inter-genomic
duplications and conserved blocks found between B. napus and Arabidopsis .................................. 52
Table 3.1: The total number of predicted NBS-LRR genes identified in the three Brassica genomes.
The table shows comparison between the methods used: MEME / MAST and CNL and TNL
BLAST ............................................................................................................................................... 65
Table 3.2: The number of candidate NBS-LRR genes in B. napus. The total numbers of genes in
each chromosome with their classification into TNL or CNL as well as the reciprocal best BLAST
results are presented ........................................................................................................................... 66
Table 3.3: The number of candidate NBS-LRR genes in B. rapa and B. oleracea. The total numbers
of genes in each chromosome with their classification into TNL or CNL as well as the reciprocal
best BLAST results are presented. ..................................................................................................... 67
Table 3.4: Comparative analysis of synteny of NBS-LRR genes in B. napus to its progenitor species
............................................................................................................................................................ 68
Table 3.5: Comparative analysis of the number of NBS-LRR genes in the three Brassica species
and the reciprocal best BLAST hits ................................................................................................... 75
Table 4.1: Marker homology search of clubroot resistance QTL flanking or linked markers for
identification of QTL intervals in B. napus ....................................................................................... 92
Table 4.2: Marker homology search of downy mildew resistance QTL flanking or linked markers
for identification of QTL intervals in B. napus .................................................................................. 94
Table 4.3: Marker homology search of blackleg resistance QTL flanking or linked markers for
identification of QTL intervals in B. napus ....................................................................................... 96
Table 4.4: Correlation between the number of NBS-LRR resistance genes and disease resistance
QTL intervals in chromosomes of B. napus .................................................................................... 100
Table 5.1: List of B. napus cultivars genotyped with the SNP genotyping assay........................... 115
Table 5.2: List of the B. napus cultivars and their Rlm complement used for the PCR amplification
.......................................................................................................................................................... 117
Table 5.3: List of primer pairs used for long range PCR amplification of Rlm9 candidate genes . 117
Table 5.4: List of characterized NBS-LRR and LRR-containing genes on chromosome A7 of B.
napus cv. Darmor. Candidate Rlm9 genes located within the Rlm9 QTL are highlighted .............. 120
Table 5.5: Comparative analysis of the number of NBS-LRR and LRR-containing genes on
chromosomes A7 and C6 of the three Brassica species: B. napus, B. rapa and B. oleracea .......... 122
Table 5.6: The potential SNPs on chromosome A7 with a good correlation to the Rlm9 gene and
association with disease and susceptibility in B. napus cultivars. ................................................... 128
Table 5.7: Mapping and annotation of the potential SNPs identified in B. napus cv. Darmor ....... 129
xvii
Table 5.8: Comparative analysis of NBS-LRR Rlm9 candidate genes between B. napus cv. Darmor,
B. napus cv. Tapidor and B. rapa. The sequence identity is based on protein sequence alignment 135
Table 5.9: The coverage of Skipton and Ag-Spectrum sequence short reads of candidate Rlm9
genes on B. napus. The identity is based on gene sequence alignment ........................................... 136

xviii
List of Abbreviations
Avr gene Avirulence gene
AvrLm Avirulence to Leptosphaeria maculans
BnDRG Brassica napus Disease Resistance Gene
CC Coiled-Coil domain
CNL CC-NBS-LRR
CNV Copy Number Variation
LRR-RLKs Leucine Rich Repeat -Receptor-Like Kinase
LRR-RLPs Leucine Rich Repeat -Receptor-Like Proteins
MAST Motif Alignment Search Tool
Mbp Millions Base Pairs
MEME Multiple Em for Motif Elicitation
NBS-LRR Nucleotide Binding Site- Leucine Rich Repeat protein
NGS Next-Generation Sequencing
QTL Quantitative Trait Loci
R gene Resistance gene
RBB Reciprocal Best BLAST
RGA Resistance Gene Analogues
Rlm Resistance to Leptosphaeria maculans
SCAR Sequence-Characterized Amplified Region
SNP Single Nucleotide Polymorphism
SSR Simple Sequence Repeat Marker
SV Structural Variation
TIR Toll/ Interleukin-1 Receptor domain
TNL TIR-NBS-LRR
WGD Whole Genome Duplication

1
Chapter 1
Literature Review

2
Chapter 1 : Literature review
1.1 Introduction
Brassica napus (canola/rapeseed/oilseed rape) is an important commercial oilseed crop in Australia
with an annual production of approximately 3 million tons of oil (AOF, 2014). Canola is an
important source of edible vegetable oil and has a broad range of industrial purposes. However,
blackleg disease (stem canker) caused by the fungal pathogen Leptosphaeria maculans, is one of
the most devastating diseases in B. napus. This disease causes significant yield losses with an
annual average losses of 15 to 48% although losses can reach up to 80% worldwide (Marcroft and
Bluett, 2008). An effective strategy to control blackleg disease is to develop resistant B. napus
varieties via interspecific hybridization or genetic transformation. This can be facilitated by the
identification of blackleg resistance genes in B. napus and application of these genes in the breeding
programs. The recent completion of the B. napus, B. rapa and B. oleracea genome sequences
provides invaluable genomics resources to accelerate this research. Furthermore, it allows the study
of the conservation of these genes between Brassica species. This literature review provides insight
about the genome wide NBS-LRR comparison and scope for identification of candidate resistance
genes associated with disease resistance QTL in Brassica. It also highlights significant progress that
has recently been made in mapping and identification of resistance genes in B. napus against L.
maculans.
1.2 Brassica napus and related species
Brassica is one of the most important genera in the Brassicaceae family due to its agricultural and
economic importance. Six of the important Brassica species are: B. juncea, B. napus, B. nigra, B.
oleracea, B. rapa and B. carinata. The genetic relationships among these different diploid and
amphidiploid Brassica species are described according to their genome composition (termed “A” ,
“B” and “C”) by U’s triangle (Figure 1.1) (U, 1935).

3
Figure 1.1: The genomic relationships between the six cultivated Brassica species indicating the
genome composition (U, 1935).
Brassicas are important sources of fresh and preserved vegetables and condiments. For instance, B.
oleracea and B. rapa represent many of the vegetables in our daily diet such as cauliflower,
broccoli and cabbage (all B. oleracea), Chinese cabbage (B. rapa) and various mustards (B. nigra)
(Paterson et al., 2001).
B. napus originated from interspecific hybridisation between the diploids B. rapa (A genome) and
B. oleracea (C genome) resulting in an amphidiploid genome (AACC, n=19). B. napus is cultivated
worldwide as the most productive Brassica oilseed species and is grown primarily for its seed
which yield approximately 40% oil making it the second important oilseed crop in the world after
soybean (Snowdon et al., 2007). Total oilseed production in 2014/15 was estimated to be 530
million metric tons, with rapeseed contributing 71.8 million metric tons (USDA, 2014). Canola oil
is used for cooking, in margarine and other edible products in the food processing industry as
healthy edible oil.
1.3 Brassica genome sequencing: an overview
Sequencing of Brassica genomes has been the main focus of Brassica researchers worldwide
because Brassicas are an excellent model species for studying the evolution of polyploid crop
plants. Brassica species contain many triplicated genomic segments and subsequent rearrangements

4
such as inversions, insertions, deletions, and substitutions (Jiang et al., 2011). Genome sequencing
projects for Brassica species, especially B. rapa and B. oleracea, were initiated after the
establishment of the multinational Brassica genome project in 2002 (http://www.brassica.info)
(Hong et al., 2008, Wang et al., 2011).
The rapid development of second-generation sequencing technology and advanced bioinformatics
programs has resulted in the completion of genome sequences of B. napus (Chalhoub et al., 2014),
B. rapa (Wang et al., 2011) and B. oleracea (Liu et al., 2014, Parkin et al., 2014). These Brassica
genome projects also aimed to produce reference genomes for genetic and genomic studies
(Hayward et al., 2011). Illumina whole genome sequencing has been adopted for Brassica species
resulting in the generation of large datasets of short read sequence information for different B.
napus cultivars (Imelfort and Edwards, 2009). Illumina sequencing technology (HiSeq2000)
provides high throughput sequence information generating hundreds of millions of paired short read
sequences (100 - 150 bp) in a single run. If there is a reference genome available, these short reads
can be physically mapped to the reference genome and used to search for sequence variations in
candidate genes underlying QTL regions. Bioinformatics tools such as genome browsers provide a
convenient way to visualise the short reads against a reference genome to identify sequence
coverage, SNPs, coding regions and other annotations (Batley and Edwards, 2009).
1.4 Identifying and characterizing the structure of NBS-LRR genes in Brassica
Plants have developed sophisticated defence mechanisms to recognise and respond to a wide range
of pathogens. Resistance (R) genes are involved in direct or indirect interaction with avirulence
(Avr) genes in order to trigger a defence response. Thus, understanding the molecular structure and
function of R genes has been crucial for plant resistance research. Over the last few decades, a vast
number of R genes have been cloned from a wide range of plant species. These R genes are diverse
in terms of their structure, function and evolution, but they can be grouped into five different
classes, based on structural similarities of their predicted protein products (Staskawicz et al., 1995,
Liu et al., 2007). The largest class includes proteins with putative nucleotide binding site (NBS) and
leucine-rich repeats (LRR). These NBS-LRR genes can be subdivided into two distinct types based
on the structure of their N-terminal domain either a coiled-coil (CC) motif or a Toll/ Interleukin-1
Receptor (TIR) domain (Figure 1.2) (Meyers et al., 2003). The NBS region is thought to be
important for ATP binding activity and comprises of a P-loop, Kinase 2a, Kinase 3 and GLPL
motifs. The LRRs may be the main determinant in recognition specificity of the avirulence gene
product and as components of a signal transduction pathway (Ellis et al., 2000b).

5
Figure 1.2: The domain structure of NBS-LRR proteins in plants. Taken from (McHale et al.,
2006).
Genome wide analysis of NBS-LRR genes in many plant species including rice (Monosi et al.,
2004) sorghum (Paterson et al., 2009), Arabidopsis (Meyers et al., 2003, Tan et al., 2007) and
papaya (Porter et al., 2009) showed that they are widely distributed throughout the genome with
approximately 0.6–1.8% of genes encoding NBS-LRRs at a density of 0.3–1.6 genes per megabase.
A study of NBS-LRR genes in the B. rapa genome (550Mbp) predicted a lower number of NBS-
encoding genes than in other sequenced crops (Mun et al., 2009). However, at the time of the study
the B. rapa genome had not been fully sequenced. Now this is completed (Wang et al., 2011), a
comprehensive assessment of NBS-LRR genes can be undertaken. Theoretically, the number of
NBS-LRR genes in the B. rapa genome should be higher than in Arabidopsis because the B. rapa
genome has undergone genome triplication since divergence from the common ancestor of
Arabidopsis. Another significant finding was that almost 50% of NBS family members were
detected as tandem arrays within homogenous clusters suggesting tandem duplication in
combination with polyploidy played an important role in the expansion of NBS-LRR genes in the
Brassica genome (Fourmann et al., 2001, Vicente and King, 2001, Mun et al., 2009). Overall, B.
rapa can be used as a source to identify NBS-LRR genes for common pathogens of Brassica crops
(Mun et al., 2009).
A more recent study (Yu et al., 2014) has identified 206, 176 and 157 NBS-LRR genes in B. rapa,
B. oleracea and Arabidopsis, respectively. They found that the number of NBS-LRR genes in these
three species was very close despite the genome size and complexity. This is surprising as B. rapa
and B. oleracea genomes would be expected to contain higher numbers of NBS-LRR genes than in

6
Arabidopsis because the B. rapa and B. oleracea genomes have undergone extensive genome
triplication events.
Resistance genes can occur as a single gene in allelic series or as tightly linked genes (within a gene
cluster) conferring different resistance specificities (Leister, 2004). Thus, race-specific resistance
might have evolved and be present in clusters resulting from tandem duplications of paralogous
sequences (Meyers et al., 2005, McDowell and Simon, 2006, Kaur et al., 2009). Indeed, previous
studies revealed that R genes are often present as tightly linked genes with high homology and are
prone to gene duplication and recombination, and thus evolve more rapidly than the rest of genome
(Grant et al., 1998). For this reason, functional polymorphism at R loci could maintain multiple
alleles or linked genes with different recognition capabilities that would recognize novel pathogen
variants (Grant et al., 1998).
The molecular basis of the resistance responses to pathogens in plants depends on the specificities
of the interactions between the Avr and R gene. The genetic analysis of plant NBS-LRR genes has
shown that they are highly related in sequence and present as multiple alleles of a simple locus or
several closely related resistance genes. Multiple resistance gene specificities can be encoded by
different allelic variants of resistance genes by which each allele can provide resistance to different
pathogen types (Ellis et al., 2000a). An example of allelic forms at the NBS-LRR locus is RPP
(recognition of peronospora parasitica) in Arabidopsis (McDowell et al., 1998) and several alleles
of the L gene in flax encode different flax rust resistance specificities (Ellis et al., 1999).
1.5 Genetics of disease resistance in Brassica
There are two types of disease resistance in Brassica species: qualitative and quantitative. The exact
type of resistance is controlled by different genetic interactions and determines resistance during
specific stages of plant growth: seedling and adult stage resistance (Ferreira et al., 1995b, Ansan-
Melayah et al., 1998, Pilet et al., 1998).
Seedling resistance is qualitative, single-gene race specific and expressed during the cotyledon
stage (Delourme et al., 2006). This resistance typically depends on the presence of a resistance (R)
gene in the plant and a corresponding avirulence (Avr) gene in the pathogen, where if the Avr gene
does not correspond to the R gene in the plant, the plant is susceptible to disease. This is a very
effective resistance and operates through R gene activity when a pathogen infects the cotyledons of
the seedling, subsequently preventing infection spread to the whole plant (Johnson and Lewis,
1994). By contrast, adult resistance is a partial resistance, known as quantitative resistance, and is
controlled by multiple genes. This is race non-specific resistance. It was suggested that quantitative

7
resistance genes work together in a complex interaction with many pathogen Avr genes. Adult plant
infection is the most damaging in terms of quality and yield losses (Zhu et al., 1993, Delourme et
al., 2008).
In spite of the fact that seedling and adult resistance are under separate genetic control: monogenic
and polygenic, respectively, and they are differentially expressed in the plant (Ferreira et al.,
1995a), the genes involved at both stages might be closely linked in quantitative trait loci (QTL)
(Salisbury et al., 1995, Delourme et al., 2006). For instance, two closely linked but distinct loci
mediating resistance at the seedling and adult plant stage of B. napus breeding lines were mapped to
chromosome A7 within 5-10 cM of each other (Ferreira et al., 1995b).
As with many crops, Brassicas are susceptible to many serious diseases including fungi, bacteria
and viruses which cause a major impact on canola production worldwide. In the three major
cultivated Brassica species, B. napus B. rapa, and B. oleracea, clubroot (caused by
Plasmodiophora brassicae), downy mildew (caused by Hyaloperonospora Parasitica) and blackleg
(caused by Leptosphaeria maculans) diseases have become an increasing problem causing heavy
yield losses to Brassica crops world-wide and have been a major focus in the Brassica disease
resistance research (Delourme et al., 2011).
Clubroot disease occurs worldwide to all cruciferous vegetable and oil crops, including Brassica
species. Different sources of resistance to clubroot have been found in B. oleracea, B. rapa and B.
napus (Hirai, 2006, Suwabe et al., 2006, Diederichsen et al., 2009, Piao et al., 2009, Verma et al.,
2014). These different studies suggested that the interaction between Plasmodiophora brassicae and
Brassica are classified as race-specific resistance. To date, two major resistance genes: Crr1a and
CRa, which confer resistance to clubroot in B. rapa, have been identified and cloned. They both
encode a TIR-NBS-LRR protein (Ueno et al., 2012, Hatakeyama et al., 2013).
The downy mildew disease causes damage to production of Brassica species worldwide, including
Australia. While it causes severe destruction on young seedlings, the disease still causes yield and
quality reduction at adult-plant stages. For instance, in Australia, outbreaks of downy mildew
disease at the early seedling stage have caused losses of canola production (Ge et al., 2008). Several
major qualitative resistance loci to downy mildew have been identified in B. rapa and B. oleracea
(Farinhó et al., 2007, Yu et al., 2009, Kim et al., 2011, Carlier et al., 2012). In addition, multiple
sources of resistance have been reported in B. napus (Nashaat et al., 1997, Ge et al., 2008). They
showed that the resistance is more likely to be controlled by a major resistance gene.

8
1.6 The fungal pathogen Leptosphaeria maculans: Biology and blackleg disease
Leptosphaeria maculans is the causal agent of blackleg disease (also termed stem canker or phoma
disease) of Brassica crops. L. maculans has a broad host range within the Brassicaceae infecting
numerous cruciferous species including Raphanus sativus (radish), R. raphanistrum (wild radish),
Sinapis alba (white mustard) and cultivated Brassica crops; such as B. napus, B. rapa, B. juncea
and B. oleracea (Johnson and Lewis, 1994, Williams and Fitt, 1999). Moreover, the model plant
Arabidopsis, also a member of the Brassicaceae, is a host for L. maculans (Rouxel and Balesdent,
2005).
Blackleg is the most serious fungal disease of Brassicas worldwide, and can lead to drastic losses of
up to 80% of canola production (Fitt et al., 2006). Blackleg disease is primarily of economic
importance in the main canola growing areas of Europe, Australia and North America (West et al.,
2001). For instance, the value of Canola production in Australia is around AUD $500 million
annually (Wang et al., 2009) with an average 15% yield loss occurring due to L. maculans infection.
Infection symptoms occur at various stages of crop development causing cotyledon and leaf lesions
prominent during the vegetative phase of the plant, progressing to canker development in the
susceptible cultivars (Figure 1.3) (Delourme et al., 2008). This latter stage results from the fungus
invading cells in the stem cortex, resulting in a blackened canker; hence the name “blackleg” and
causing lodging of the plants (Guo and Fernando, 2005, Fernando et al., 2007). The severity of
blackleg has increased in recent years due to intensification of cultivation and production, rapid
evolution of the pathogen population and lack of sustainable management strategies. Thus, there is
an urgent need to establish effective management of blackleg.

9
Figure 1.3: Blackleg infection symptoms on B. napus caused by L. maculans. (A) blackleg lesions
on leaves (source: Canola Council of Canada) (B) blackleg lesions from multiple infections
(Courtesy C. Bradley, American Phytopathological Society) (C) blackleg stem lesion (source:
Canola Council of Canada) (D) interior of stem infected with blackleg(source: Canola Council of
Canada) (E) interior of stem infected with different levels of blackleg severity (source: Canola
Council of Canada) (F) black root form of blackleg as compared to healthy root (source: DEPI,
Victoria).
L. maculans is a haploid fungus, with a small genome size of about 45 Mbp, predicted to encode
10,000-13,000 genes within 16 chromosomes (Rouxel et al., 2011). The Leptosphaeria Genome
Consortium was established in 2004 by Genoscope (CEA) (http://www.genoscope. cns.fr) and the
genome was completed and published in 2011. The genome sequence has been annotated,
assembled and publically released on NCBI (Howlett, 2004, Rouxel et al., 2011).
1.7 Molecular interaction between Brassica and L. maculans
Traditionally, the gene for gene hypothesis is used to explain genetic interactions between the host
plants and their pathogens. This concept proposes that for each resistance gene in the host there is a
specific gene corresponding to avirulence in the pathogen (Dangl and Jones, 2001). Basically, the
gene for gene interaction suggests direct or indirect recognition of pathogen Avr-encoded effectors
by the protein product encoded by the corresponding R gene. Often R genes encode nucleotide
binding site- Leucine rich repeat (NBS-LRR) proteins leading to the induction of a signalling
cascade and subsequent downstream defence responses (Bent, 1996).

10
Plants operate a defence response against pathogens at two levels: pattern-triggered immunity (PTI)
and effector-triggered immunity (ETI) (Dodds and Rathjen, 2010) (Figure 1.4). PTI involves the
recognition of pathogen associated molecular patterns (PAMPs) and trigger low levels of defence
activation. The pathogen is able to suppress PTI by effector proteins delivered into the plant.
However, PTI results in initiation of ETI. The ETI is gene for gene resistance in which the
interaction is between disease resistance proteins and specific effectors (Avr proteins). This is
mediated largely by nucleotide binding-site-leucine rich repeat (NBS-LRR) proteins. ETI triggers a
stronger resistance response and often causes localized cell death described as a hypersensitive
response (HR) and prevents further infection (Collier and Moffett, 2009, Tsuda and Katagiri, 2010).
Figure 1.4: The mode of activation of the plant immune responses by PAMP-triggered immunity (PTI) and
effector-triggered immunity (ETI). Adopted from (Alcázar and Parker, 2011).
In the Brassica–L. maculans pathosystem, a typical gene-for-gene interaction has been reported,
where the outcome of the infection (resistance or susceptibility) depends on the presence of an R
gene in the plant and one corresponding (Avr ) gene in the pathogen (Figure 1.5) (Ansan-Melayah
et al., 1998, Balesdent et al., 2001, Balesdent et al., 2002). A set of differential interactions between
Brassica species and L. maculans were utilized at the seedling stage using a cotyledon inoculation
test (Williams and Delwiche, 1979). This determined the presence of the Avr gene required for race
specific resistance in various Brassica species and cultivars with known R gene complements based
on genetic mapping (Balesdent et al., 2002).

11
Figure 1.5: The infection outcomes between Brassica R genes and L. maculans Avr genes
according to the gene for gene interaction. Only when the R gene is corresponding to the Avr gene,
is the plant resistant against the pathogen.
Genetic studies have identified the gene for gene interactions between Avr genes in L. maculans and
their corresponding Rlm (Resistance to Leptosphaeria maculans) genes in B. napus. For example,
Rlm1/AvrLm1 and Rlm2/ AvrLm2 interactions were found in the B. napus cultivars, Quinta and
Glacier, respectively (Ansan-Melayah et al., 1998).
Effector-triggered immunity (ETI), a pathogen race-specific resistance, is a well-studied example of
host-resistance and has been observed in most plant species, including B. napus (Jones & Dangl,
2006; Poland et al., 2009). The existence of ETI between B. napus and L. maculans has been
described between the Rlm1 and LepR 3 genes and AvrLm1 gene (Raman et al., 2012a, Larkan et
al., 2013) and between the Rlm 2 gene and AvrLm2 gene (Larkan et al., 2014).
Genetic mapping of avirulence genes revealed four unlinked genomic regions of L. maculans
associated with host specificity: the AvrLm1–AvrLm2–AvrLm6 cluster, the AvrLm3–AvrLm4–
AvrLm7 cluster, AvrLm5, AvrLm8 and AvrLm11 (Balesdent et al., 2002, Fernando et al., 2007,
Balesdent et al., 2013). This cluster of Avr genes in L. maculans has been described as the first
example of Avr gene clustering in fungi. It was suggested that there might be a relationship between
Avr gene clustering in L. maculans and a counterpart clustering of R genes in B. napus (Delourme et
al., 2004).

12
To date, several avirulence genes in L. maculans have been cloned: AvrLm1 (Gout et al., 2006),
AvrLm2 (Ghanbarnia et al., 2015), AvrLm6 (Fudal et al., 2007) and AvrLm4-7 (Parlange et al.,
2009) confers avirulence towards two different resistance genes, Rlm4 and Rlm7. AvrLm11
(Balesdent et al., 2013) and AvrLmJ1 (Van de Wouw et al., 2014).
The availability of genome sequences has led to the identification of candidate resistance genes and
provides the opportunity to validate the interaction between R genes and Avr genes using sequence
information, genetic transformation, phenotyping and gene expression analysis. However,
Agrobacterium -mediated transient expression (Agroinfiltration) is an alternative and quick
approach for validating a candidate R gene (Vaghchhipawala et al., 2011, Ma et al., 2012). It is a
rapid and simple technique to study gene function and host-pathogen interaction and protein-protein
interaction (Bendahmane et al., 2000, Wroblewski et al., 2005, Dodds et al., 2006). It is based on
infiltration of Agrobacterium tumefaciens cultures into intact plant leaves (tobacco) to co-express a
candidate R gene with its corresponding Avr gene. This triggers a defence response that results in
localized cell death at the site of infection termed a hypersensitive response (HR) indicating that
these are functional R-Avr gene interaction. In this study, the validation can be done if both R and
Avr gene sequences are known. For instance, candidate blackleg resistance genes such as Rlm4 can
be validated due to the presence of the cloned AvrLm4 gene. Whereas, candidate Rlm9 genes cannot
be validated as AvrLm9 has not been cloned or sequenced.
1.8 Genetic mapping of blackleg resistance genes in Brassica species
All the blackleg resistance genes identified to date have been found on the A genome of B. napus
with none found on the C genome (Ananga et al., 2006, Leflon et al., 2007). This is supported by
the absence of Rlm1, Rlm2 or Rlm4 in the diploid C genome species, B. oleracea when screened
against L. maculans isolates harbouring AvrLm1, AvrLm2 and AvrLm4 alleles (Rouxel et al.,
2003b).
To date, ten race specific Rlm genes have been genetically mapped and identified in B. napus. By
screening B. napus cultivars with a differential set of L. maculans isolates, Rlm1 was identified in
the cultivar Quinta (Ansan-Melayah et al., 1998), LEM1, LmR1 and cRLMm, are present in the
cultivars Major, Shiralee and Maluka, respectively, Rlm2 and Rlm3 in the cultivar Glacier
(Balesdent et al., 2002), Rlm4 in the cultivars Jet Neuf (Balesdent et al., 2001) and Skipton (Raman
et al., 2012), Rlm7 in non-commercial lines (Balesdent et al., 2002), and Rlm9 in the cultivar
Darmor (Delourme et al., 2004).

13
Genetic mapping studies have showed that all resistance genes in B. napus are organised in clusters
in two genomic regions: the Rlm2 resistance gene on chromosome A10 is associated with adult
resistance (Pilet et al., 2001) and five specific resistance genes: Rlm1, Rlm3, Rlm4, Rlm7, and Rlm9
are on chromosome A7 (Delourme et al., 2004) (Table 1.1).
Rlm1 was suggested to be distinct from Rlm3 because they both occur in one cultivar and they
genetically map to different positions. In addition, Rlm1 and Rlm4 are linked, not allelic and can be
present in the same cultivar. Rlm3 and Rlm4 are found in many rapeseed cultivars and are rarely
present together in a single cultivar (Delourme et al., 2006). Indeed, the existence of Rlm1, Rlm3,
Rlm4, Rlm7 and Rlm9 as a cluster of tightly linked genes has never been observed. Thus, it is
impossible to judge if these genes are a cluster of tightly linked genes, or a single gene with
different alleles, or a combination of both (Delourme et al., 2004).
Rlm4 provides effective resistance against isolates with the avirulence gene AvrLm4 (Rouxel et al.,
2003b, Raman et al., 2012b) and is present in the French cultivars Major and Jet Neuf, as well as
Australian cultivars including Maluka, Dunkeld and Skipton. However, the cultivar Westar is
highly susceptible to blackleg (lack of any Rlm4 genes) and shows a reciprocal translocation break
point close to the Rlm4 locus in A7, making fine mapping extremely difficult (Rimmer, 2006).
Interestingly, an AvrLm4-7 locus in L. maculans has dual interaction specificity to resistance genes
Rlm4 and Rlm7 in B. napus, yet it is unclear if Rlm4 and Rlm7 represent allelic forms of the same
resistance gene. It was suggested that deletion of AvrLm4-7 may be the major event leading to
acquisition of virulence towards Rlm7 resistance whilst mutation of a single nucleotide is sufficient
to avoid Rlm4- mediated recognition of AvrLm4-7 (Parlange et al., 2009).
The genes LEM1, LmR1, cRLMm and cRLMrb present in different B. napus cultivars were also
mapped onto chromosome A7 (Table 1.1) (Mayerhofer et al., 1997, Rimmer, 2006). LEM1 was
found to confer seedling resistance to an isolate containing Avr1-2-4-7 (Ferreira et al., 1995a) and to
be located within an extensive intra-chromosomal tandem duplication region (Mayerhofer et al.,
2005). However, LmR1, cRLMm and cRLMrb are likely to be identical to Rlm4, and are present in
the cultivars Major and Maluka (Rouxel et al., 2003b).
Four dominant race specific resistance genes were also identified in the A genome of B. rapa: Rlm8
(Balesdent et al., 2002), LepR1 a single dominant gene mapped on chromosome A2, LepR2 which
maps to chromosome A10 (Yu et al., 2005) and LepR3 mapped to chromosome A10, 15–20 cM
from LepR2 (Li and Cowling, 2003). It is also proposed that LepR3 is not identical to LepR2 (Yu et
al., 2008) and LepR3 possibly corresponds to Rlm1 (Van De Wouw et al., 2009). Another two

14
resistance genes BLMR1 and BLMR2 have been identified. The former may provide cotyledonary
stage resistance whereas the latter has a role in preventing infection development (Long et al.,
2011). Interestingly, LepR3 was located between BLMR1 and BLMR2 and represents the resistance
combination of BLMR1 and BLMR2 (Table 1.1) (Yu et al., 2008, Long et al., 2011). LepR3 was
first blackleg resistance gene in Brassica to be cloned in B. napus lines with introgressions from B.
rapa ssp. Sylvestris (Larkan et al., 2013). It belongs to a receptor-like protein (RLP) family.
The LepR4 resistance gene was mapped to chromosome A6 and two different alleles LepR4a and
LepR4b were mapped to the same position. LepR4 was found as a recessive gene conferring a wide
spectrum of resistance to the fungus isolates (Yu et al., 2012). In addition, the B. rapa genome
might harbour genes previously identified in B. napus such as Rlm1, Rlm2, Rlm4 and Rlm7 as
previous studies have (Leflon et al., 2007) suggested that these genes are orthologous and are
located in the same position in B. rapa and B. napus (Rana et al., 2004, Delourme et al., 2006).
The B genome Brassica species B. nigra contains two resistance genes: Lm1 and Rlm10 (Table 1.1)
(Chèvre et al., 1996, Wretblad et al., 2003). Plants containing Lm1 have improved resistance to L.
maculans in the cotyledon and adult stage when it is overexpressed in B. napus (Wretblad et al.,
2003). Significantly, the Lm1 gene belongs to the serine/theronine kinase family (Howlett, 2004). It
is expected that B. nigra carries a number of different resistance genes in the B genome (Zhu et al.,
1993, Chèvre et al., 1996), which are yet to be reported. Zhu et al. (1993) reported that the
resistance in B. nigra is polygenic, controlled by a small number of genes located on chromosome
B3. The Rlm10 gene introgression location into B. napus is thought to be on A7 (Chèvre et al.,
1997, Dixelius, 1999).
In the amphidiploid AABB species B. juncea, resistance to L. maculans was suggested to be
mediated by two genes called Rlm5 and Rlm6 (Table 1.1) (Rimmer and van den Berg, 1992, Keri et
al., 1997, Balesdent et al., 2002, Leflon et al., 2007). Additionally, the lm2 gene identified in B.
napus hybrids, derived from B. juncea, was highly effective against a wide range of L. maculans
isolates at the cotyledon stage (Saal et al., 2004). Sequence-characterized amplified regions (SCAR)
markers were developed based on amplification of resistance gene analogues (RGA) in which they
are isolated by PCR with degenerate primers designed from the highly conserved motifs of
resistance genes. The SCAR marker was strongly associated to the resistance locus lm2 in B. napus,
B. rapa and B. oleracea. Sequence analysis of this gene revealed significant homology to two
putative R genes on a resistance gene cluster on chromosome 5 of Arabidopsis (Saal and Struss,
2005).

15
Table 1.1: Resistance genes to L. maculans that have been identified in Brassica species based on
genetics and mapping studies.
Species Resistance gene
Corresponding avirulence gene
Gene location in B. napus
Comments
B. napus
LEM1 Avr1-2-4-7 A7 May be identical to Rlm4
LmR1 AvrLm4 A7 May be identical to Rlm4
cRLMm AvrLm4 A7 May be identical to Rlm4
cRLMb AvrLm4 A7 May be identical to Rlm4
Rlm1 Avrlm1 A7 Distinct from Rlm3 and Rlm4
Rlm2 Avrlm2 A10 Associated with adult resistance
Rlm3 Avrlm3 A7 Linked , not allelic to Rlm1.
Rlm4 AvrLm4 A7 Linked, not allelic to Rlm1. rarely present together with Rlm3
Rlm7 AvrLm7 A7 This might be allelic variant of Rlm4
Rlm9 AvrLm9 A7 Rlm3, Rlm4, Rlm7 and Rlm9 as cluster of tightly linked genes
B. rapa
Rlm8 AvrLm8 -- --
LepR1 -- A2 Introgressed into B. napus from B. rapa
LepR2 -- A10 Introgressed into B. napus from B. rapa
LepR3 -- A10
Mapped close to LepR2, not identical to LepR2 LepR3 is possibly corresponding to Rlm1 Introgressed into B. napus from B. rapa
LepR4 A6 A recessive gene, two alleles
BLMR1 -- A10 LepR3 was located in between BLMR1 and BLMR2
BLMR2 -- A10 --
B. nigra Lm1 -- A3
Cotyledon and adult resistance
Rlm10 -- A7 --
B. juncea
Rlm5 AvrLm5 A8 --
Rlm6 AvrLm6 A8 May be identical to r j lm2
r j lm2 -- --
Identified in B. napus and B. juncea hybrids effective to different L. maculans isolates at cotyledon stage

16
Arabidopsis was recently found to be resistant to a wide range of L. maculans isolates. It is believed
that a dominant resistance (R) gene encoding a nucleotide binding site - leucine-rich repeats (NBS-
LRR) is required to confer resistance. To date, three genes have been identified as Arabidopsis
thaliana Resistance to Leptosphaeria maculans named AtRlm1, AtRlm2 and AtRlm3 (Staal et al.,
2006, Staal et al., 2008). Two TIR-NBS- LRR genes: AtRlm1 and AtRlm2 are present in the
different genotypes Col and Ler and are mapped on chromosomes 1 and 4, respectively. AtRLM1
was found to share a similarity to a homologous region on chromosome 4 that corresponds to
AtRLM2 indicating that they are closely related and may have evolved through gene duplication
(Staal et al., 2006). AtRLM3 encodes an NBS-LRR and is another candidate that appears to act as a
critical downstream component of AtRlm1 (Meyers et al., 2003, Staal et al., 2006, Staal and
Dixelius, 2008, Staal et al., 2008). Since it has been shown that blackleg resistance genes in B.
napus (LepR1, LmR1, CLmR1, Rlm1, Rlm3, Rlm7 and Rlm9) are mapped to genomic loci that
correspond to the chromosome segment on Arabidopsis chromosome 1 harbouring AtRlm1
(Mayerhofer et al., 2005), it could be hypothesized that L. maculans resistance genes are related to
the NBS-LRR protein family. Also of importance is to study the level of sequence conservation in
blackleg resistance genes in Brassica species and Arabidopsis since little is known about sequence
information of resistance genes identified so far.
According to the most recent study (Raman et al., 2012b), simple sequence repeat (SSR) markers
have been linked to a Rlm4 blackleg resistance QTL region in a segregating population derived
from the B. napus cultivars: Skipton and Ag-Spectrum. This region has been physically mapped to
scaffold 3 on chromosome A7 of the sequenced B. rapa genome. Therefore, it could be
hypothesized Rlm4 and other resistance genes mapped to B. napus chromosome A7 are present on
intervals homologous to the B. rapa chromosome A7 regions with considerable sequence variations
due to gene duplication and recombination events (Figure 1.6).
Taken together, although many studies have identified numerous blackleg disease resistance QTL
and qualitative genes, it is impossible to compare or even use homology searches between these
studies because of different marker systems being used, along with differences in the cultivars used,
blackleg isolates and inoculum concentrations present at each location. Thus, the use of map-based
cloning to identify a gene underlying the QTL region is relatively difficult through map based
cloning because the region is still large and often not tightly linked to the resistance gene(s). This is
often further complicated by the complexity of the genomic region due to duplication and
rearrangement events. As a consequence, it is difficult to determine if these genes are truly different
genes or allelic variants.

17
Figure 1.6: Integration the partial genetic map of Rlm4 QTL on chromosome A7 of B. napus
against the physical map of B. rapa. This is by using 12 linked SSR markers (Raman et al., 2012b).
1.9 Introgression of blackleg resistance genes into the B. napus genome: attempts and
challenges
Attempts have been made to transfer blackleg resistance genes in B. napus breeding programs
through interspecific hybridization (Rimmer and van den Berg, 1992, Chèvre et al., 1996). A
resistance gene from B. juncea (later described as Rlm6 by (Chèvre et al., 1997, Chèvre et al., 2008)
as well as the gene, rjLM2 (Saal et al., 2004) were introduced into B. napus. The resistance was
effective at the seedling stage in spring and winter type genetic backgrounds of B. napus against
various L. maculans isolates. However, subsequent transfer from the B genome has been
unsuccessful, presumably due to a low level of homology between the two genomes or lack of
introgression of the B genome genes into B. napus (Salisbury et al., 1995).
The cultivar Surpass 400 was developed as a blackleg resistant cultivar by crossing B. napus and B.
rapa (Crouch et al., 1994). The resistance obtained was assumed to be as a result of introgresion of
the genes LepR1, LepR2 and LepR3 from B. rapa (Yu et al., 2005, Yu et al., 2008). Li and Cowling
(2003) reported a complete resistance to blackleg in ‘Surpass 400’ when tested against Australian
isolates at the time of its release in 2001. However, there are evidences of resistance breakdown in
blackleg resistant varieties in France (Rouxel et al., 2003b, Brun et al., 2010) and Australia
18
(Sprague et al., 2006). The breakdown of the Rlm1 resistance in France occurred within three years
of release due to L. maculans population changes from avirulence (AvrLm1) to virulence
(avrLm1)(Rouxel et al., 2011). In 2001, the cultivar surpass 400 was released commercially and
showed a highly resistant response to blackleg in the field. However, this resistance become
similarly ineffective after only three years due to a rapid increase in the local pathogen populations
of isolates virulent on LepR3 (Li and Cowling, 2003, Rouxel et al., 2003b). There is also evidence
of sequential breakdown of major resistances genes Rlm9, Rlm2 and Rlm4 in France, as well as
Rlm4 in Australia after widespread use of cultivars containing these genes (Rouxel and Balesdent,
2005).
Breeding for B. napus blackleg resistance has faced challenges with respect to the stability and
durability of resistance genes. The loss of resistance stability and rapid breakdown of race specific
genes is most likely associated with a major shift in populations of L. maculans towards altered Avr
composition (Balesdent et al., 2001, Fitt et al., 2006, Sprague et al., 2006).
Crop rotation, of cultivars containing different resistance genes, could be a suitable approach to
maximize the durability and stability of the resistance and minimize the selection pressure on
avirulence isolates to overcome the resistance genes. The rotation is aimed to decrease the incidence
of blackleg through reduced exposure to inoculum and not imposing a selection pressure on the
fungus to rapidly evolve towards virulence.
The breakdown of resistance seen in France in 2000 (Rouxel et al., 2003a) and Australia in 2003
(Sprague et al., 2006) was a result of rapid change of the frequency of virulence alleles of
avirulence genes. The frequency of virulence alleles of avirulence genes changed significantly
depending on the resistance gene present in the cultivar. Hence, rotation provides a way to reduce
the change of the frequency of virulent isolates towards a particular resistance gene upon exposure
to difference complements of resistance genes in the canola cultivars. For example, when a cultivar
with Rlm1 is grown, the frequency of virulence towards Rlm1 will be selected for and increase in
number. However, if a cultivar with Rlm4 is grown the following year, the frequency of virulence
will be shifted towards Rlm4. In this case, rotation of cultivars with different resistance genes
should reduce the selection pressure on fungus isolate to evolve (Marcroft et al., 2012b).
It is recommended that the cultivars containing a different combination of resistance genes be
rotated every four years, in order to minimize selection pressure on the fungus and increase
durability of cultivars (Marcroft et al., 2004). However, it was found that not all resistance genes
can be rotated with each other. For instance, cultivars with Rlm1 resistance should not be rotated

19
with cultivars with Rlm6 resistance (Marcroft et al., 2012b). This is because the selection towards
AvrLm1 in the pathogen also results in increase the frequency of virulence of AvrLm6 as these two
genes are tightly linked in the pathogen genome.
Thus, identification of these resistance genes and understanding of the genetic interaction between
resistance gene and avirulence genes is required for development of specific resistance gene
rotation.
1.10 Genomic approaches for identification of candidate resistance genes
Candidate resistance genes are putatively genes that are essential components of plant immune
systems and can be broadly classified as those potential genes involved in the initial recognition or
interaction with pathogen avirulence gene to trigger a defence response. Quantitative trait locus
(QTL) mapping is frequently used to identify genomic regions associated with a phenotypic trait of
interest. The association of candidate resistance genes or major resistance genes and QTL has been
widely noted (Gebhardt and Valkonen, 2001, Quint et al., 2003, Wisser et al., 2005). The nucleotide
binding site–leucine rich repeat (NBS-LRR) class of R genes has been found to be potential
candidate resistance genes co-localized with disease resistance QTL such as in barley, potato and
apple (Ramalingam et al., 2003, Calenge et al., 2005, Bakker et al., 2011). However, although
numerous disease resistance QTL have been identified, isolating and cloning a gene underlying the
QTL/gene mapped region is relatively difficult through map based cloning because the region is
still large and contains hundreds of genes that often not tightly linked to the resistance gene(s). This
is often further complicated by the complexity of the genomic region due to duplication and
rearrangement events.
An alternative approach, the candidate genes approach was exploited in this project to analyse the
disease resistance QTL using a homology search. One of the major steps in the candidate gene
approach is the physical identification and characterization of QTL region using genomics analysis.
The physical gene mapping determines the gene location and its relative distance to the QTL region
and other adjacent genes on the chromosome. This allows narrowing and prioritizing the number of
associated candidate resistance genes for further sequencing and functional studies. Thus, candidate
resistance gene identification becomes much faster and less expensive for rapid cloning and
sequencing of the gene/s responsible for plant-pathogen interactions.

20
1.10.1 Comparative analysis based candidate gene identification
Genome comparative analysis is a powerful tool for genetic studies to investigate the resistance
gene organisation, conservation and evolution of related species. It allows the study of conserved
genomic segments with gene content, synteny, collinearity and conservation between related
species at the micro-level in selected chromosomal regions such as QTL region or at the macro-
level in the whole genome. Determining orthologous and syntenic genes within genomic regions
among closely related species is important to identify structural or functional similarities/
differences. This also enables the confirmation of potential inversion, insertion, gene
presence/absence and gene sequence homology (Lyons et al., 2008, Tang et al., 2008).
The availability of a reference genome sequence allows the identification of position of the QTL in
the chromosome and prediction of the full complement of genes that encode the resistance gene.
When a QTL of the species under study is located in a syntenic region on its related species, the
resistance genes are likely to be found in a syntenic relationship and show high or divergent
sequence conservation (Paterson et al., 2000, Cheng et al., 2012a).
Several studies have shown aspects of genome evolution and organization between Brassica
genomes and the genome of A. thaliana (Parkin et al., 2005, Cheung et al., 2009, Trick et al., 2009).
The close relationship of the genus Brassica to A. thaliana was exploited in identifying the
candidate gene for a major flowering time QTL in B. nigra (Osterberg et al., 2002) and seed weight
in Brassica napus (Cai et al., 2012). In addition, this strategy has been used to identify blackleg
resistance genes in B. napus (Mayerhofer et al., 2005, Fopa Fomeju et al., 2014) and clubroot
resistance gene in B. rapa (Suwabe et al., 2006, Suwabe et al., 2012).
In the comparative analysis strategy, candidate resistance genes are likely to be structurally and
functionally conserved between related species providing insight into the evolution of these genes.
Therefore, the comparative analysis of the resistance gene sequences not only revealed the level of
conservation but also identified potential target genes showing or associated with disease resistance
QTL.
Candidate genes can be further studied via analysis of gene expression. The level of R genes
expression is regulated to ensure correct resistance responses. They are expressed constitutively at a
very low level which changes slightly following pathogen infection (Graham et al., 2000, Joshi and
Nayak, 2011). However, structurally and functionally conserved R genes are likely to show changes
in expression pattern contributing to the R gene diversity and resistance specificities. These related
R genes with different recognition specificities can be found within or between plant species as

21
single or a multiple alleles recognizing a particular pathogen race. The gene duplication followed by
sequence divergence in polyploid species such as B. napus is a primary mechanism for altering
expression patterns and causing phenotypic variations (Hanada et al., 2009, Wang et al., 2012).
Differential expression levels of orthologous or paralogous NBS-LRR genes reflect the expression
divergence and contribute to functional diversification (Blanc and Wolfe, 2004).
1.10.2 Sequence based candidate gene identification
Next-generation sequencing (NGS) technologies have advanced rapidly in the past few years,
providing the ability to sequence reference genomes as well as re-sequence cultivars of interest
(Duran et al., 2010, Malory et al., 2011). The combination of resistance genes profiling with next-
generation sequencing offers enormous advantages for genetic studies. Re-sequencing is used to
identify genetic variation between individuals, which can provide molecular genetic markers and
insights into gene function (Imelfort et al., 2009). Thus, the increasing use of next-generation
sequencing technologies has impact on disease gene discovery by speeding up the identification of
potentially candidate genes by their probability of being shown disease-relevant mutations.
These NGS strategies produce millions of sequencing reads in a single run, producing large
amounts of short-sequencing reads that are aligned/mapped to a reference genome sequence. This
way, the sequence reads were anchored to comparable sites in the target sequences, which allow the
alignment of the reads directly without the need of a prior assembly step (Batley and Edwards,
2009). Once this has been achieved, it is possible to determine read coverage and variation and
identify and characterise polymorphisms for candidate genes between individuals. Thus, the NGS
reads that mapped to the gene regions of interest can be used to assess complete sequence
divergence between the contrasting genotypes.
The approach was recently utilized to identify a candidate Rlm4 resistance gene. By taking
advantage of the B. rapa reference genome sequence (A genome) and next generation sequence
data (short reads) for B. napus cultivars, including the cultivars Skipton and Ag-Spectrum which
differed in resistance to Rlm4, the putative Rlm4 blackleg resistance genes can be identified among
candidate NBS-LRR genes located within the physically mapped Rlm4 QTL region on chromosome
A7. Preliminary data suggests that duplication and clustering of tightly linked genes in the QTL
region containing R genes on A7 indicate that the cloning of Rlm4 may also identify additional
blackleg resistance genes (Tollenaere et al., 2012) (Figure 1.7).
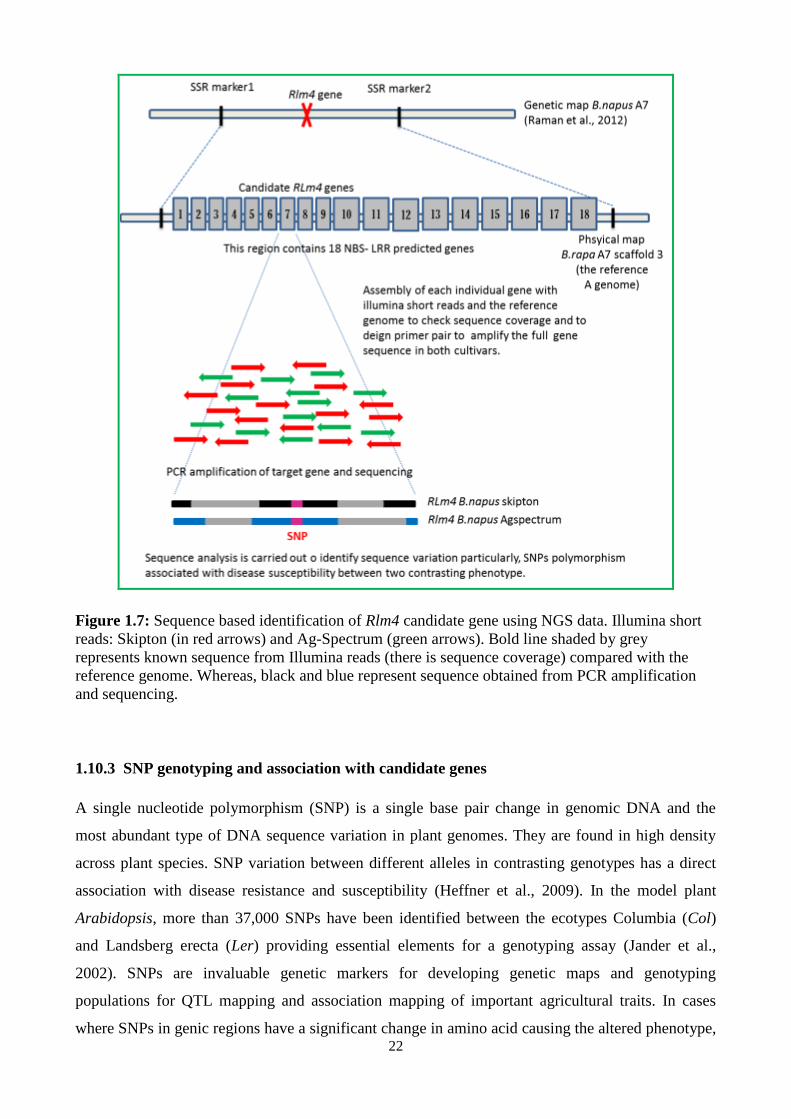
22
Figure 1.7: Sequence based identification of Rlm4 candidate gene using NGS data. Illumina short
reads: Skipton (in red arrows) and Ag-Spectrum (green arrows). Bold line shaded by grey
represents known sequence from Illumina reads (there is sequence coverage) compared with the
reference genome. Whereas, black and blue represent sequence obtained from PCR amplification
and sequencing.
1.10.3 SNP genotyping and association with candidate genes
A single nucleotide polymorphism (SNP) is a single base pair change in genomic DNA and the
most abundant type of DNA sequence variation in plant genomes. They are found in high density
across plant species. SNP variation between different alleles in contrasting genotypes has a direct
association with disease resistance and susceptibility (Heffner et al., 2009). In the model plant
Arabidopsis, more than 37,000 SNPs have been identified between the ecotypes Columbia (Col)
and Landsberg erecta (Ler) providing essential elements for a genotyping assay (Jander et al.,
2002). SNPs are invaluable genetic markers for developing genetic maps and genotyping
populations for QTL mapping and association mapping of important agricultural traits. In cases
where SNPs in genic regions have a significant change in amino acid causing the altered phenotype,

23
these SNPs are known as perfect markers. In B. napus, existing genomic resources for SNP
discovery and the ability to associate SNPs variation with particular traits creates an efficient
approach for gene identification (Westermeier et al., 2009, Edwards and Batley, 2010).
Genotyping is the process of identifying polymorphism between individuals in a genome or
genomic region. SNP genotyping has become extremely important to study the distribution of SNPs
and the relationship between SNPs and phenotypic variation in a populations (Syvanen, 2005). SNP
genotyping currently has many applications in plant genomics: identification of candidate resistance
genes, haplotype determination, quantitative trait loci (QTL) mapping, association mapping and
comparative genomics. SNP genotyping can be further used for the positional cloning of the
candidate gene underlying QTL and as a diagnostic marker (Kaur et al., 2012).
Genome wide association of SNPs and their correlation to a segregating population would
significantly identify regions that are associated with a particular phenotype gene (Rafalski, 2002).
The identification of SNPs for specific candidate genes might provide a direct correlation of allele
function with specific trait variation. Thus, SNP genotyping technologies provide an effective
approach for fine genetic mapping narrowing QTL region and its association with disease and
susceptibility. They are now routinely used to identify loci that are associated with many complex
traits (McCarthy et al., 2008).
The identification of candidate genes for flowering time in Brassica using EST-based SNP markers
has been possible (Li et al., 2009). There are many successful examples of identification of closely
linked SNP markers underlying QTL region to enhance resolution within the target locus and
narrow the number of candidate genes. For example, in rice, a number of SNPs had been
functionally associated with variation for the yield (Yu et al., 2011a). In soybean, SNP genotyping
improved narrowing the QTL for the aphid resistance gene, Rag1 with two linked SNP markers
and additional candidate genes were identified (Kim et al., 2010).
SNP genotyping involves selecting very large numbers of SNP markers, precisely located on a
genome, for detection of alleles and their association with a phenotype. Then, SNPs within the QTL
of interest are physically mapped to the reference genome and the genotypic data is compared
across different species, cultivars or segregating lines. Ultimately, a group of SNPs located within
the functional gene or at a small physical distance from the gene will be associated and identified.
This strategy provides a good solution to the problems associated with positional cloning and
physical mapping.

24
High-throughput genotyping assays (Infinium assay ) developed by Illumina have proven successful
and efficient for many crops (Chagné et al., 2007, Kaur et al., 2012) and could serve as the platform
of choice for SNP validation as well as for genotyping large populations (Durstewitz et al., 2010,
Hu et al., 2012)
The Infinium assay is a whole genome SNP genotyping assay which is capable of multiplexing
from 3,000 up to 1 million SNPs across a large number of individuals. It enables large-scale
analysis spanning the entire genome offering an ideal method to narrow down candidate
polymorphic SNPs for the whole genome. The Infinium assay develops BeadChips with customized
SNP content enabling virtually unlimited multiplexing in SNP genotyping. These BeadChips are
commercially available with a variable number of fixed or custom SNPs. Illumina BeadChips can
process up to 24 samples simultaneously, with four able to be processed at once, providing high
genome coverage, array efficiency and genotype call accuracy. Each SNP locus is assayed and
analysed independently for each sample yielding highly intensity genotype calls (Illumina,
www.illumina.com).
The Infinium assay consists of four steps (Figure 1.8), a whole-genome amplification and
fragmentation step, hybridisation to immobilised SNP-specific primers on BeadChips, followed by
single base extension with labelled nucleotides. The primers hybridise adjacent to the SNP and are
extended with a single fluorescently labelled dideoxynucleotide corresponding to the SNP allele.
The intensities of the bead’s fluorescence are detected by the iScan Reader (Illumina) to generate
the genotype calls (Illumina, www.illumina.com).
Allelic discrimination occurs through single-base primer extension reactions using a two-colour
assay. Data consists of two intensity values (X, Y) for each SNP, with intensity for each one of the
fluorescent dyes associated with the two alleles of the SNP. After normalization, the alleles
measured by the X colour are called the A alleles, whereas the alleles measured by the Y colour are
called the B alleles. Then, clustering and GeneCall (call rate) algorithms are used to determine the
genotype call depending on the clustering of tested samples at each SNP locus (Illumina,
www.illumina.com).
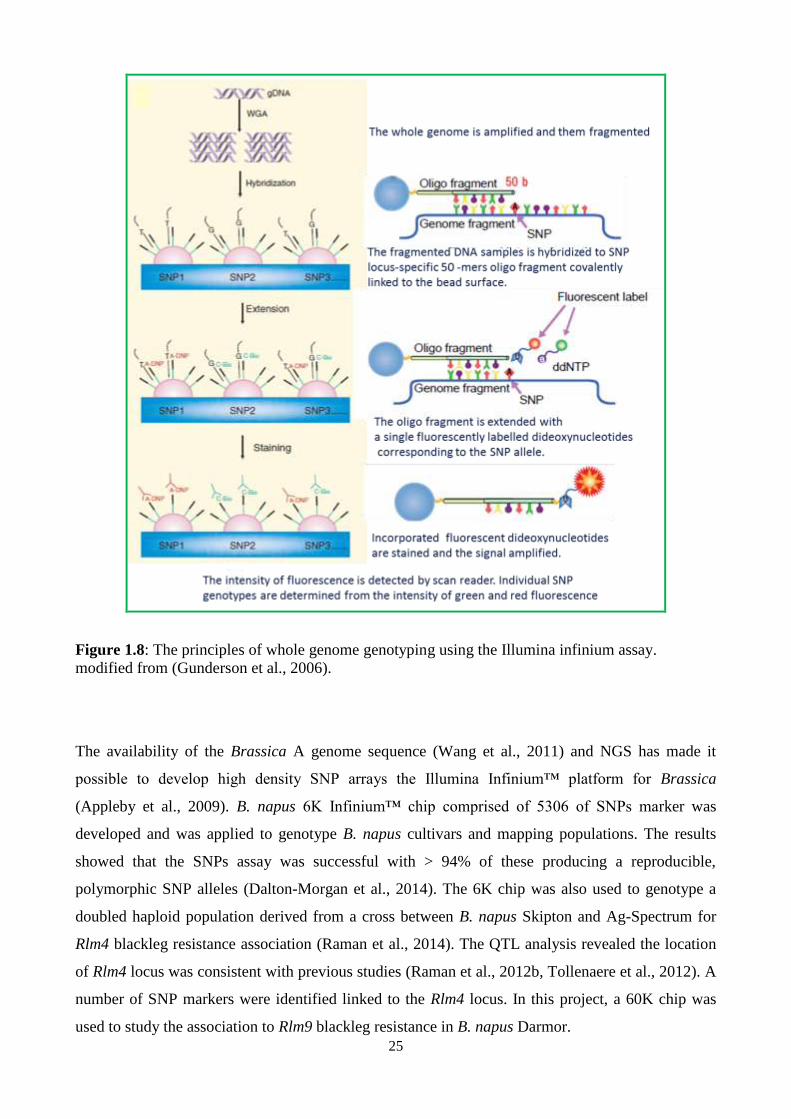
25
Figure 1.8: The principles of whole genome genotyping using the Illumina infinium assay.
modified from (Gunderson et al., 2006).
The availability of the Brassica A genome sequence (Wang et al., 2011) and NGS has made it
possible to develop high density SNP arrays the Illumina Infinium™ platform for Brassica
(Appleby et al., 2009). B. napus 6K Infinium™ chip comprised of 5306 of SNPs marker was
developed and was applied to genotype B. napus cultivars and mapping populations. The results
showed that the SNPs assay was successful with > 94% of these producing a reproducible,
polymorphic SNP alleles (Dalton-Morgan et al., 2014). The 6K chip was also used to genotype a
doubled haploid population derived from a cross between B. napus Skipton and Ag-Spectrum for
Rlm4 blackleg resistance association (Raman et al., 2014). The QTL analysis revealed the location
of Rlm4 locus was consistent with previous studies (Raman et al., 2012b, Tollenaere et al., 2012). A
number of SNP markers were identified linked to the Rlm4 locus. In this project, a 60K chip was
used to study the association to Rlm9 blackleg resistance in B. napus Darmor.

26
1.11 Research aims and significance
In order to understand disease resistance in Brassicas, the identification and characterization of
NBS-LRR genes in Brassica is important to provide comprehensive analysis into the resistance
genetics and genomic structure of NBS-LRR in Brassica species and disease resistance gene
conservation and evolution. Thus, the identification of NBS-LRR genes further leads to
identification and validation of potential sources of resistance genes involved in blackleg disease
resistance or other diseases in Brassica. In this project, the utilization and integration of the
information of genomics resources such as availability of Brassica genome sequences, NGS data,
SNP genotyping and QTL genetic maps are the foundation for identification of a candidate NBS-
LRR gene linked to disease traits allowing rapid cloning of functional resistance genes (Figure 1.9).
My primary motivation for the present study was to address the need for genome wide NBS-LRR
gene identification and characterization to identify candidate resistance genes within disease
resistance QTL interval. In particular, the identification of candidate Rlm9 blackleg resistance genes
in B. napus because B. napus cv. Darmor, which contains the Rlm9 resistance gene, was used as the
reference for B. napus genome sequencing.
The genetic studies have mapped all the resistance genes for the devastating pathogen
Leptosphaeria maculans to the A genome with none mapped to the C genome in Brassica species.
Thus, the blackleg resistance genes should be retained and conserved in the A genome of B. napus
and B. rapa, whereas, they are probably absent or highly divergent in the C genome of B. napus and
B. oleracea. By characterizing and comparing these NBS-LRR genes in these species, it would be
possible to identify candidate blackleg resistance genes and assess their genetic diversity between
Brassica species.
The primary objectives are:
1- A comprehensive study of NBS-LRR genes can be undertaken to provide new insights into
the genetic diversity of the R genes in Brassica species and to understand the genomic
architecture of this gene family. This involves identification and characterization of
candidate NBS-LRR genes and determines their distribution, domain structure, gene
clustering and duplication. Thus, the advances in Brassica genome sequencing enable
identification of large number of disease resistance genes and their characterization and
evolutionary relationships.
2- Comparative analysis of NBS-LRR genes between B. napus compared to B. rapa and B.
oleracea. The identification of candidate genes in Brassica species and studying the genome

27
organization and genetic diversity through comparative genomics will help to understand
NBS-LRR conservation and evolution. The better understanding of the syntenic structure of
NBS-LRR genes in ancestral genomes is required to study the genomic rearrangements such
as duplication and translocation within the B. napus genome that have occurred during
evolution. Previously, mapping and comparative studies have demonstrated that Brassica
species had undergone genome duplications and rearrangements. It would be interesting to
find how NBS LRR genes have been affected by the genome duplication and rearrangement
events in Brassica.
3- Study the correlation or association between a given diseases QTL regions and the candidate
NBS-LRR genes. This would allow identification of the physical location of QTL regions
into genome chromosomal maps and association of the QTL intervals with the genome wide
identification of disease resistance NBS LRR genes.
4- To identify candidate gene(s) for blackleg resistance in B. napus using all available
genomics resources such as QTL mapping, comparative studies and SNP genotyping. It
should be possible to tighten the QTL region and further narrow the list of candidate genes.
Then, the potential candidate resistance genes are to be identified and further subject to
sequence comparison studies.
This project is the first to conduct comprehensive analysis of NBS- LRR genes in the B. napus
genome and present comparative analysis of NBS-LRR genes between B. napus and its progenitor
species: B. rapa and B. oleracea. It will also enable identification of a large number of resistance
genes in Brassica species. In addition, the project will enrich the Brassica database with resistance
genes for several disease resistance traits, in particular, blackleg disease. The identification of
blackleg resistance genes in Brassica will provide some understanding of the key molecular
components of disease and enhance development and breeding of resistant varieties of B. napus.

28
Figure 1.9: Schematic representation of genomics based identification of candidate resistance gene(s) used in this study.

29
Chapter 2
Genome wide identification and
characterization of NBS-LRR
resistance genes in Brassica napus

30
Chapter 2 : Genome wide identification and characterization of NBS-LRR
resistance genes in Brassica napus
*This chapter contributed towards a paper being submitted
2.1 Abstract
Plant disease resistance genes play a critical role in providing resistance against pathogens. The
largest family of resistance genes are the nucleotide binding site (NBS) and leucine rich repeat
(LRR) genes. They are classified into two major subfamilies, TIR-NBS-LRR (TNL) proteins and
CC-NBS-LRR (CNL) proteins. The availability of the genome sequence of Brassica napus provides
an important resource to study the NBS-LRR structure and genomic organization.
This chapter presents a comprehensive overview of the genome wide NBS-LRR identification and
gene diversity in B. napus. A total of 641 NBS-LRR genes were identified in B. napus comprising
of a ratio of 1:2 of TNL to CNL genes. Further domain structure analysis revealed that 60% of the
NBS LRR genes are typical resistance gene with all three domains and the remaining are partially
deleted or truncated. Fifty nine percent of the NBS-LRR genes were found to be physically
clustered and individual genes involved in clusters were more polymorphic and subject to
evolutionary selection pressure. Fifty percent of the total NBS-LRR genes in B. napus were
identified as duplicates, suggesting a high level of genomic duplication and rearrangement.
This chapter provides a valuable resource for identification and association of candidate NBS-LRR
genes linked to disease resistance QTL allowing rapid cloning of functional NBS-LRR genes and
understanding the functional diversity.

31
2.2 Introduction
Plant disease resistance genes (R genes) are important components of the genetic resistance defence
mechanisms in plants. R genes are involved in a direct or indirect interaction with avirulence (Avr)
genes in order to trigger a defence response. Thus, understanding the molecular structure and
function of R genes has been crucial for plant resistance research. Genome sequencing efforts of
plant species have facilitated genome wide analysis of NBS-LRR genes in many plant species. For
examples, 438 genes in potato (Jupe et al., 2012), 535 genes in rice (Zhou et al., 2004), 333 genes in
Medicago truncatula (Ameline-Torregrosa et al., 2008), 402 genes in Populus trichocarpa (Kohler
et al., 2008), 221 genes in sorghum (Paterson et al., 2009), 167 genes in Arabidopsis (Yu et al.,
2014) and 355 genes in cotton (Wei et al., 2013). These studies showed that the NBS-LRR class of
genes is abundant and widely distributed throughout the genome. Moreover, genetic and genomics
studies demonstrated that the majority of NSB-LRR genes are present in gene clusters in plant
genomes (Hulbert et al., 2001). The clustered arrangement of these genes may be a critical attribute
of the generation of novel resistance specificities via gene duplication or recombination (Meyers et
al., 2003).
Sequence analyses revealed that NBS domains share a high degree of homology and have a number
of conserved motifs (Wan et al., 2012). To date, eight conserved motifs have been identified in the
NBS domains of NBS LRR classes including P-loop, kinase-2, kinase-3a, GLPL, RNBS-A-TIR,
RNBS-D-TIR, RNBS-A-non-TIR and RNBS-D-non-TIR (Wan et al., 2013). The conserved motifs
of NBS domains assist in cloning NBS-LRR genes via PCR amplification, alignment for
phylogenetic analyses and classification of NBS-LRR genes (Meyers et al., 2003).
The NBS-LRR proteins contain three domains: a NBS domain, a C-terminal LRR domain and an
N-terminal domain of either Toll Interleukin-1 receptor (TIR) or a coiled coil (CC). The NBS-LRR
genes can be subdivided into two distinct types based on the structure of their N-terminal domain:
either a coiled-coil (CC) motif or a Toll Interleukin-1 Receptor (TIR) domain (Meyers et al., 2003).
These form the two major subfamilies of plant NBS-LRR proteins: TIR-NBS-LRR proteins (TNLs)
and CC-NBS-LRR proteins (CNLs). The TNL group of genes has been observed only in dicot plant
species (Meyers et al., 1999, Goff et al., 2002). Whereas, CNLs (sometimes called non-TNL) are
found in both dicot and monocot plant species. Both families are involved in defence mechanisms
against pathogens in different signalling pathways. They are distinct in their NBS conserved
sequence motifs and therefore are found in separate clusters in phylogenetic analyses (McHale et
al., 2006).
32
A comprehensive study of NBS-LRR genes was undertaken to provide new insights into the genetic
diversity of the resistance genes in Brassica species and to understand the genomic architecture of
this gene family. This study is the first to conduct genome wide identification of NBS-LRR genes in
the B. napus genome (Chalhoub et al., 2014).
The main objective of this chapter is to identify NBS-LRR genes, characterize the functional
domain and motifs, and determine the distribution of NBS-LRR genes on the B. napus
chromosomes. It also aims to study the conservation, gene clustering and duplication of the NBS-
LRR genes. As a result, this will provide a valuable resource for identification of candidate NBS
LRR genes linked to disease traits allowing rapid cloning of functional NBS LRR genes.

33
2.3 Methods
2.3.1 Brassica genome and gene prediction
The genome sequence and gene annotation of B. napus cv. Darmor was used as the reference
genome for genomic studies on B. napus (Chalhoub et al., 2014).
2.3.2 Identification of NBS-LRR genes in B. napus by MEME/ MAST analysis
The MAST/MEME (Motif Alignment Search Tool/Multiple Em for Motif Elicitation) suite of
software was used to identify predicted genes that contain motif homology to known disease
resistance genes (Bailey et al., 2009). NBS-LRR “positive” and non NBS-LRR “negative” sequence
training sets which were consensus of 20 amino acid motifs derived from MEME analysis (Jupe et
al., 2012) were used as queries in a MAST search against the predicted genes of the B. napus
genome. Predicted genes were considered to be candidate CNL or TNL if the reported MAST E-
value were ≤ E-24
.
2.3.3 Identification of NBS-LRR genes in B. napus by CNLs and TNLs for validation
To further validate the results from the MAST output, consensus sequences of plant CNLs and
TNLs (Cannon et al., 2002, Cannon et al., 2004) were obtained from a previous study (Ameline-
Torregrosa et al., 2008). Candidate genes containing NBS domains were identified using tBLASTn
and BLASTp (maximum E-value 1E-5) (Altschul et al., 1997) performed using the consensus
sequences below against the B. napus cv. Darmor genome. Candidate NBS-LRR proteins were
provisionally assigned to either the CNL or TNL groups on the basis of similarity.
Consensus of CNLs used for BLAST search was as follows:
erpsestiVGletmleklwnrLledndvgivgiyGMGGVGKTTLatqifNdfdvkgehFdrviWVvVSkefnvekiqqdIl
ekLglgdeewlekteeekaaeienLfqlLegKkfLLvLDDvWekevdLdkigvpfPdrenGsKvlfTTRsesvavcgdmgv
dxmevecLtpeeAWeLFqkkvfentlksdpeieelaKevvkkCgGLPLAlkVlGgllacKrtvqEWkraievlssslaaefsg
messilpvLklSYdnLppelKsCFLYcalFPEDykIekekLieyWiaEGfideseggetaedvGyeylgeLVrrsLleegdk
tdnetsrketVkMHDvvREmALwiaseegfkeviiVraGvglreipnvkswntvrRmSlmnneieelldspenpklrsLltlllq
snsh.
Consensus of TNLs used for BLAST search was as follows:
RDFddlVGiEaHlekmksLLcLdsdeVrMVGIwGPaGIGKTTIARALfsqLSssFqlsaFmenlrgsyStrpaglD
eYsmKLhLQeqfLSkILnqkDikIhHLGvieERLkdqKVLIiLDDVDdleQLdALAketqWFGpGSRIIVT
TeDkqLLkaHgInhIYeVgfPSkeeALqIFCrsAFgQnsPpdGFeeLAreVtkLaGnLPLGLrVlGSsLRGkske
eWedmLpRLrtsLDgkIekvLrvsYDgLhekDqaLFLhIACfFNgekvdyVkalLadsnLDVrqGLkvLadKSLI
hisplgdgtieMHnLLqqLGReIVrkQsidePgKRqFLvDaeeIcdVLtdnTGtgsVlGIslDtseieeelnIsekAFeg
MrNLqFLriykksfrddgk.

34
2.3.4 Correlation between the MAST output and CNL/TNL BLAST results
The NBS-LRR candidate genes identified from the MAST output were compared with CNL and
TNL BLAST results to validate the NBS LRR genes and to classify them according to the BLAST
similarity to either the CNL or TNL groups. Furthermore, any candidate NBS-LRR that did not
correlate between the two approaches was subject to further search against NCBI non-redundant
nucleotide database.
2.3.5 Manual annotation check and characterization of candidate NBS-LRR genes
The annotation of all identified NBS-LRR gene were manually checked using gene prediction
programs to obtain information on complete open reading frames (ORFs). Every individual gene
sequence was manually annotated and the annotation compared between all gene prediction
programs. The prediction programs used were FGENSH (http://www.softberry.com), Genscan
(http://genes.mit.edu/GENSCAN.html) and AUGUSTUS (http://bioinf.uni-
greifswald.de/augustus/).
All predicted NBS-LRR genes were surveyed to further determine their domain structure and
whether they contained TIR, CC, NBS, and/or LRR motifs. The predicted genes were searched for
similarity to known proteins using BLASTp (Altschul et al., 1997) with a threshold of E-value < -
10 against the NCBI non-redundant (nr) protein database. The structural information on protein
domains was used to classify the NBS-LRR genes into subfamilies.
2.3.6 Multiple alignment and phylogenetic analysis
Alignment and phylogenetic analyses were performed with all NBS-LRR proteins. The NBS region
was defined as the region extending from the P-loop to the MHDV motif, which contains about 300
amino acids, using the corresponding conserved motifs from B. rapa (Mun et al., 2009).
To extract the NBS domain, CNL and TNL consensus sequences were aligned with NBS-LRR
genes using alignment in Geneious Pro v6.1.2 (Kearse et al., 2012) and then the NBS domain
manually extracted from the P loop motif to the MHDV motif or in case there is a missing motif,
the NBS domain extracted to get other internal motifs. In addition, a search comparison in NCBI
non-redundant (nr) protein database was used to extract the NBS domain and also to determine the
type and length of NBS motifs within the NBS domain.

35
Genes with ≤ 50% of total NBS domain length, such as genes with partial NBS domains with length
less than 150 aa or genes lacking NBS domains such as TIR genes, TIR-LRR genes and linker LRR
genes were excluded from phylogenetic analysis.
The NBS sequences were then aligned using CLUSTAL W (Thompson et al., 1994). A
phylogenetic tree was constructed using the neighbour-joining method (Saitou and Nei, 1987) with
bootstrap multiple alignment resampling set at 1000. These functions were performed using
Molecular Evolutionary Genetics Analysis (MEGA) software version 6.0 (Tamura et al., 2013).
2.3.7 NBS-LRR genes cluster and duplication analyses
NBS-LRR gene clusters were determined by their physical position on each chromosome according
to criteria previously published and widely used (Holub, 2001, Richly et al., 2002, Meyers et al.,
2003). The parameter to define a cluster was three or more NBS-LRR genes that occurred within a
maximum of eight non-NBS genes. Furthermore, the distance between neighbouring NBS-LRRs
was required to be ≤ 200 kb.
Gene duplication was defined in accordance with the criteria previously published and widely used
(Zhou et al., 2004): (1) the alignment covered more than 70% of the longer gene, and (2) the
aligned region had an identity >70%. A block of duplications was defined if more than one gene in
a gene cluster was involved in the duplication. Homologous or paralogous genes were confirmed by
the BLASTp comparison of all the predicted NBS-LRR proteins against each other with E-value of
E-20. This stringent E-value of E-20 was used to ensure the correct definition of singleton genes as
those having only one copy in the genome.

36
2.4 Results
2.4.1 Genome wide identification of B. napus NBS-LRR genes
The genome wide identification of NBS-LRR resistance genes has become an essential component
for better understanding of the genomics and evolution of R genes and resistance genetics. This
study is the first to perform comprehensive analysis on identification and characterization of NBS-
LRR genes in the B. napus genome taking advantages of the recent sequence completion of the
genome. Two methods were used to identify candidate NBS-LRR genes: MEME/MAST analysis
and CNL and TNL consensus sequences. MEME was used in combination with a positive sequence
set of characterised NBS-LRR protein sequences, from diverse plant species, and a negative
sequence set, containing diverse nucleotide binding protein sequences, to create a list of 20
sequence motifs putatively characteristic of NBS-LRR proteins which were then used as queries in
a MAST search against the predicted genes of the B. napus genome. Subsequently, predicted genes
were considered to be candidate CC or TIR NBS LRRs if the reported MAST E-value were ≤ E-24
.
In addition, candidate genes containing NBS domains were identified based on a BLASTp and
tBLASTn search of CNL and TNL consensus sequences as a query at a cut-off value of E -5 to
ensure that there were no other related genes missing from the gene prediction.
The initial classification of candidate NBS-LRR genes into CNLs or TNLs were mostly based on
CNL/TNL consensus BLAST results, as well as taking into account the presence of the TIR domain
motifs among motifs composition in the MAST output. However, the MEME/MAST analysis was
found to be highly dependent on the gene prediction. If the gene prediction is very accurate, an
improved output is obtained. For instance, the MAST E-value could drop down below the cut off
due to the gene annotation splitting one gene into multiple small genes. Furthermore, manual
checking of gene annotation revealed some inaccuracies and there were some genes with predicted
amino acid sequence that was still not complete due to sequence errors leading to insertion of false
introns or false start or stop codons. These were mainly the genes in the MAST output with E-value
close to the cut off E-24. Therefore, in our analysis, less stringent criteria was applied in order to
avoid underestimation of the total number of NBS-LRR genes in B. napus.
Furthermore, an essential component of our analysis was the manual re-annotation of individual
NBS-LRR genes that had been partially mis-annotated during the automated annotation process due
to minor errors such as incorrect start codon predictions, splicing errors, missed or extra exons,
fused genes or split genes. This step assisted to obtain reliable downstream analysis in domain
structure phylogenetic relation and to define gene duplications.
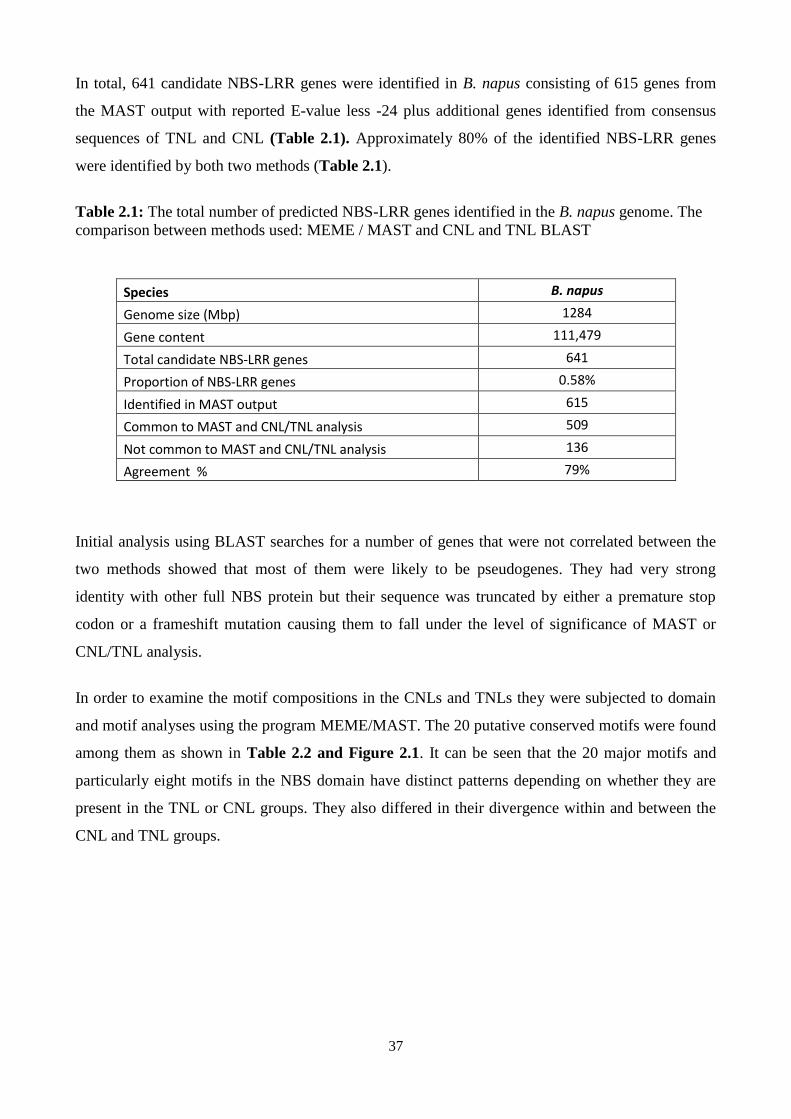
37
In total, 641 candidate NBS-LRR genes were identified in B. napus consisting of 615 genes from
the MAST output with reported E-value less -24 plus additional genes identified from consensus
sequences of TNL and CNL (Table 2.1). Approximately 80% of the identified NBS-LRR genes
were identified by both two methods (Table 2.1).
Table 2.1: The total number of predicted NBS-LRR genes identified in the B. napus genome. The
comparison between methods used: MEME / MAST and CNL and TNL BLAST
Initial analysis using BLAST searches for a number of genes that were not correlated between the
two methods showed that most of them were likely to be pseudogenes. They had very strong
identity with other full NBS protein but their sequence was truncated by either a premature stop
codon or a frameshift mutation causing them to fall under the level of significance of MAST or
CNL/TNL analysis.
In order to examine the motif compositions in the CNLs and TNLs they were subjected to domain
and motif analyses using the program MEME/MAST. The 20 putative conserved motifs were found
among them as shown in Table 2.2 and Figure 2.1. It can be seen that the 20 major motifs and
particularly eight motifs in the NBS domain have distinct patterns depending on whether they are
present in the TNL or CNL groups. They also differed in their divergence within and between the
CNL and TNL groups.
Species B. napus
Genome size (Mbp) 1284
Gene content 111,479
Total candidate NBS-LRR genes 641
Proportion of NBS-LRR genes 0.58%
Identified in MAST output 615
Common to MAST and CNL/TNL analysis 509
Not common to MAST and CNL/TNL analysis 136
Agreement % 79%

38
Table 2.2: NBS-LRR specific motifs sequence identified with MEME/MAST.
Motif No. Length
(bp) Motif domain
Group or class
Motif sequence
1 21 P-loop kinase 1 NB-ARC CNL/TNL PIWGMGGVGKTTLARAVYNDP
2 21 GLPL NB-ARC CNL/TNL CGGLPLAIKVWGGMLAGKQKT
3 15 Kinase 2 NB-ARC CNL/TNL YLVVLDDVWDTDQWD
4 15 RNBS-B NB-ARC CNL/TNL GSRIIITTRNKHVAN
5 15 RNBS-D NB-ARC CNL LKPCFLYCAIFPEDY
6 21 MHDV NB-ARC CNL/TNL CRMHDMMHDMCWYKAREQNFV
7 15 RNBS-A NB-ARC CNL HFDCRAWVCVSQQYD
8 21 -- Linker CNL/TNL MEDVGEYYFNELINRSMFQPI
9 21 LRR LRR CNL/TNL LIHLRYLNLSGTNIKHLPASI
10 19 RNBA-C NB-ARC CNL/TNL YHMQFLSHEESWQLFHKHA
11 19 LRR LRR CNL/TNL MPNLETLDIRNCPNLEEIP
12 21 -- Pre-NB CNL IDRNKLIWLWMAEGFVPHENG
13 15 -- NB-ARC CNL/TNL NEIMPILRLSYHHLP
14 25 TIR 3 TIR TNL QIVIPIFYDVDPSDVRHQTGSFGEA
15 17 -- Pre-NB CNL DAAYDAEDVIDSFKYHA
16 50 -- Monocot -- AIKDIQEQLQKVADRRDRNKVFVPHPTRPIAIDPCLRALYAEATELVGIY
17 21` TIR 2 TIR TNL KNYATSRWCLNELVKIMECKE
18 50 EDVID Monocot CNL ETSSFELMDLLGERWVPPVHLREFKSFMPSQLSALRGWIQRDPSHLSNLS
19 27 LRR LRR -- FLDIACFFRGRKKDYVMQILESCDFGA
20 21 TIR 1 TIR TNL KYDVFLSFRGPDTRKTFTSHL

39
Figure 2.1: Example of representation of motif patterns in NBS-LRR genes in B. napus. The different coloured boxes indicated distinct motifs
as shown in boxes below identified by MEME/MAST program. Refer to Table 2.2 for the type of each motif.

40
2.4.2 Genomic distribution and organisation of NBS-LRR encoding genes in the B. napus
genome
To find the distribution of NBS-LRR genes in the B. napus genome, the genes were plotted on a
chromosomal map based on their physical position in the genome. The NSB-LRR genes were found
to be distributed randomly and unevenly across the genome. The TNLs and CNLs are present on all
19 chromosomes in B. napus. However, TNL genes are more widely distributed across the B. napus
chromosomes (Figures 2.2 and 2.3).
The comparison of the total number of NBS-LRRs and whether they were classified as TNLs or
CNLs in both A and C genomes showed that there was a predominant presence of TNLs over CNLs
with about 70% of the genes comprising TNLs. This represents a ratio of 1:2.5 of CNLs to TNLs
(Table 2.3).
Approximately 40% of the NBS-LRR genes in the A genome of B. napus are located on
chromosomes A9 and A2 harbouring 58 and 44 genes, respectively. The chromosomes A5 and A10
contain the lowest number of NBS-LRR genes in the A genome (Figure 2.2). In the C genome,
chromosome C9 has the highest number of NBS-LRR genes followed by chromosome C3 (Figure
2.3).
All predicted NBS-LRR genes were surveyed to further determine their domain structure order to
classify these NBS genes with their predicted domains into subfamilies accordingly. The analysis of
the 641 candidate NBS-LRR genes against the non-redundant protein database and MEME/MAST
identified 366 (57%) genes were typical or regular NBS-LRR genes: 124 CNLs and 242 TNLs
(Table 2.4). These 366 genes show highly conserved NBS regions and complete open reading
frames. The remaining 188 genes (29%) were classified as non–regular genes because of the lack of
specific domains. These genes were classified into three distinct groups for TNL and CNL. Non-
regular TNLs were TN (74), N (9) and NL (43). Non-regular CNLs were classified as: CN (24), N
(8) and NL (23). These non-regular genes were described as partial or truncated within the N-
terminal domains and/or absence of LRR domains. In addition, 87 TIR genes which lack both NBS
and LRR domain were also identified in B. napus.
Furthermore, 75 NBS-LRR genes (44 CNL and 31 TNL (21 TIR + 10 TNL) are encoded by a single
reading frame without introns (single exon). The average number of exons in the total NBS-LRR is
4 exons where the average in CNLs is 3 exons, which was lower than that in TNLs which have an
average of 5 exons.

41
Table 2.3: The distribution and organisation of candidate NBS-LRR genes in B. napus
Ch
rom
oso
me
Tota
l
TNL
CN
L
No
. of
gen
e
clu
ste
r
No
. of
gen
e in
clu
ste
rs
No
. of
du
plic
ate
d
gen
es
(TN
L+C
NL)
No
. of
du
plic
ate
d
gen
es in
cl
ust
ers
A g
eno
me
B. n
ap
us
Dar
mo
r
A1 28 17 11 2 7 18(10+8) 4
A2 44 33 11 5 31 22(20+2) 15
A3 24 20 4 5 18 16(13+3) 6
A4 13 12 1 1 7 5(5+0) 3
A5 10 4 6 1 4 9(3+6) 5
A6 21 7 14 2 6 16(5+11) 5
A7 19 16 3 2 10 14(14+0) 8
A8 24 17 7 3 12 13(9+4) 3
A9 58 38 20 10 43 38(23+5) 24
A10 11 7 4 0 0 6(4+2) 0
Total 252 171 81 31 138
(54%) 157 (106+51)
(62%) 73 (28%)
C g
en
om
e B
. na
pu
s D
arm
or
C1 37 24 13 3 21 16(9+7) 10
C2 51 47 4 5 34 21(18+3) 13
C3 56 46 10 7 35 20(14+6) 12
C4 18 12 6 1 4 5(3+2) 2
C5 19 11 8 4 13 13(8+5) 7
C6 44 33 11 4 30 28(20+8) 17
C7 38 30 8 5 25 14(10+4) 8
C8 39 21 18 4 23 19(9+10) 11
C9 79 62 17 8 55 26(19+7) 18
Total 381 286 95 41 240
(62%) 162 (110+52)
(42%) 98 (25%)
Un assigned
8 4 4 0 0 0 0
Total 641 461 180 72 378
(59%) 319
(50%) 171
(53%)

42
Figure 2.2: Physical locations of NBS-LRR genes on the chromosome of the A genome of B. napus. Closed circles and triangles above and below
each chromosome (grey bars) with different colour system are designated for class: TNL and CNL, and their subfamily. The black straight line
connecting the NBS-LRR genes represents tandemly duplicated genes. Genes inside red rectangles represent homogenous cluster, whereas the blue
rectangles represent heterogeneous cluster. Numbers above the rectangles represent cluster size in kbp. Chromosome lengths are shown in megabase
pairs on the scale at top.

43
Figure 2.3: Physical locations of NBS-LRR genes on the chromosome of the C genome of B. napus. Closed circles and triangles above and below
each chromosome (grey bars) with different colour system are designated for class: TNL and CNL, and their subfamily. The black straight line
connecting the NBS-LRR genes represents tandemly duplicated genes. Genes inside red rectangles represent homogenous cluster, whereas the blue
rectangles represent heterogeneous cluster. Numbers above the rectangles represent cluster size in kbp. Chromosome lengths are shown in megabase
pairs on the scale at top.

44
Table 2.4: The number of NBS-LRR genes classified into different classes and their subfamilies
and domain compositions
2.4.3 NBS-LRR gene clustering
The gene cluster was defined as a cluster of three or more NBS-LRR genes located within the 200
kb or the presence of no more than eight non- NBS-LRR genes between the two adjacent NBS-LRR
genes. Using these parameters, 59% (378) of the total NBS-LRR genes identified in B. napus reside
in a gene cluster and are unevenly distributed over the chromosomes. Interestingly, the A and C
sub-genome in B. napus exhibited similar patterns of gene clustering. Moreover, some of these
NBS-LRR genes are located closely to clustered genes or even create a rich region of NBS-LRR
genes. A total of 72 clusters were observed in B. napus where the highest number was 10 clusters
found in A9 followed by 8 clusters in C9 and 7 clusters in C3 (Figures 2.2 and 2.3). The
chromosome A10 does not have any NBS-LRR clusters. The highest gene number in a cluster was
found in C6 and C9 with 11 genes followed by 10 genes in C9 and 9 genes in A2. The average
number of genes in a cluster was 5 genes where the average in the A genome (average 4 genes) was
found to be smaller than in the C genome (average 6 genes). With respect to TNLs and CNLs
clustering, there were more TNL clusters (23 clusters across the A genomes and 28 clusters on the
C genome) than CNL clusters (6 clusters on the A genome and 8 clusters on the C genome).
Although CNLs are rarely mixed with TNL genes, there are two mixed clusters of TNLs and CNLs
in the A genome and 6 mixed clusters in the C genome.
In addition, cluster size was determined by the sequence length between the two NBS-LRR located
on both side of the gene cluster. The cluster size varied in the A genome between 10 kbp (cluster in
A8) and 488 kbp (cluster in A9) (Figure 2.2). For the C genome, the cluster size varied between
14kbp (cluster in C8) and 837kbp (cluster in C9) (Figure 2.3).
When combining phylogenetic analyses and physical clustering of NBS-LRR genes, out of the total
72 clusters, 32 clusters were located in monophyletic clades and shared recent common ancestor.
CNL 180 TNL 461 Total 641
CNL - NBS - LRR 124 TIR - NBS - LRR 242 Regular
NBS-LRR gene 366(57%)
NBS - LRR 23 NBS - LRR 43
None Regular
NBS-LRR gene 188(29%)
NBS 8 NBS 9
CC - NBS 24 TIR - NBS 74
LINKER-LRR 1 LINKER-LRR 3
TIR - LRR 3
TIR 87 87(14%)

45
These clusters were considered to be homogeneous (highly similar to other NBS genes in the same
genomic cluster). The remaining 40 clusters are heterogeneous, as they contained more distantly
related NBS-LRR genes.
2.4.4 Alignment and phylogenetic analysis
To assess the sequence diversity and evolutionary relationships among the predicted NBS-LRR
genes, a phylogenetic tree was estimated from the protein alignment of the conserved NBS
domains. NBS sequences were used because they are present in both CNL and TNL proteins and
contain numerous conserved motifs that assist proper alignment. The alignment and phylogenetic
analysis of 176 CNL genes and 366 TNL genes were performed separately to identify the similarity
and relationship between genes. There were many genes excluded from the analysis due to more
than 50% deletion in the NBS domain or lack of an NBS domain, such as TIR genes. The multiple
alignments showed that the eight major motifs differed in their conserved residue and there was
divergence between TNLs and CNLs (Table 2.5).
Two phylogenetic trees were constructed separately using a neighbour-joining (NJ) method from
NBS sequences of CNLs and TNLs (CNL, Figure 2.4 and TNL, Figure 2.5). Bootstrap values
(1000 replicates) were used as a tree reliability test to estimate the confidence for each branch point.
From the values obtained in the bootstrap analysis, it was apparent that most of tree branches had a
value of more than 50% confidence. There were branches with low bootstrap scores in which it
does not necessarily indicate unreliable branching, but low confidence of assigning a particular
group.
The analysis revealed different evolutionary patterns of CNL and TNL genes. The phylogenetic
trees were divided into clades on the basis of clade rooting. This resulted in 16 clades for CNLs and
20 clades for TNLs (Figures 2.4 and 2.5).
The phylogenetic trees of TNLs and CNLs with their chromosome of origin provide a relationship
between genes from homeologous chromosome. Therefore, the TNL genes located in the
homeologous chromosomes of B. napus sub-genomes were likely found in the same clade. For
example, TNLs on chromosome A7 are often present in the same clade as TNLs on chromosome
C6 (Figure 2.5). There were 26 TNLs on chromosome C6 located next to 14 TNLs on chromosome
A7. This further confirms that the genes involved in formation of homogeneous clusters in
chromosomes A7 and C6 tend to be located in the same clade.

46
Table 2.5: Conserved and consensus sequence of NBS domain motifs found in the NBS-LRR genes identified in B. napus
Class Motif Consensus sequence* Class Motif Consensus sequence*
TNL
P-loop Kinase 1 VRMIGIWGPAGIGKTTIARALFNQLS
CNL
P-loop Kinase 1 VGIVGIYGMGGVGKTTLLRQINN
RNBS-A DDYNLKGIXXLLHLQEELLSKILNQK RNBS-A VIWVVVSQXFXDXXXGLDXXKKIQQ
Kinase 2 HLGVAXERLKDKKVLVVLDDVDDLXQLE
Kinase 2 LXXKKFLLVLDDIWXKVDLDWDLIGVPF
RNBS-B WFGPGSRIIITTRDK RNBS-B NGCKVVFTTRSXEVCGRMGXDDPM
RNBS-C HIYEVXFPSXXEALQIFCXYAFGQKSPP
RNBS-C VXCLTXEEAWELFXKKVGE
GLPL LAXEVVXLAGGLPLGLRVLGSXLRGKSXEEW
GLPL VAXKCGGLPLALNVIGE
RNBS-D LRXSYDGLXXEDKXLFLHIACFFNG
RNBS-D KSCFLYCALFPEDYKIXKEXLIEYWIAEG
MHDV MHXLLQQXGREIVR MHDV VKMHDVVREMALWIAS
* Conserved and Consensus amino acid sequence was derived from ClustalW multiple alignments of all predicted TNL or CNL genes. Bold residues indicate conserved sequence
identical to the motifs detected in Brassica rapa (Mun et al., 2009) and CNL/TNL consensus sequence (Ameline-Torregrosa et al., 2008). There is high agreement in conserved
sequence of NBS motifs between B. rapa and CNL/TNL consensus sequences

47
Figure 2.4: A phylogenetic tree of 176 CNL encoding genes of B. napus for NBS domains based
on the neighbour-joining method using MEGA 6.0 software. The numbers on the branches indicate
the percentage of 1000 bootstrap replicates. The tree only shows values > 50%. Gene names are
intended to represent chromosome and domain configurations. The blue and red coloured branches
are to separate the clades. The closed green triangle represent a homogenous cluster on
chromosome C6 where all genes sequence are related and located within a clade as well as their
relationship with genes on homologous chromosome A7 as represented by unfilled green triangles.

48
Figure 2.5: A phylogenetic tree of 366 TNL encoding genes of B. napus for NBS domains based on
the neighbour-joining method using MEGA 6.0 software. The numbers on the branches indicate the
percentage of 1000 bootstrap replicates. The tree only shows values > 50%. Gene names are
intended to represent chromosome and domain configurations. The blue and red coloured branches
are to separate the clades. The closed green triangles represent a homogenous cluster on
chromosome C6 where all genes sequence are related and located within a clade as well as their
relationship with genes on homologous chromosome A7, as represented by unfilled green triangles.

49
2.4.5 NBS-LRR gene duplication
The gene duplications of B. napus NBS-LRRs were confirmed by the BLAST comparison of all the
predicted proteins against each other. A total of 319 (50%) of the total NBS-LRR genes were
identified as duplicates (Table 2.3). There were 216 TNL duplicates and 103 CNL. The number of
duplicated genes was consistent between the two sub-genomes. Among the 19 chromosomes,
chromosome A9, C6 and C9 contain the highest number of duplicated NBS-LRR genes.
The duplicated genes were distributed randomly and 53% (171 duplicated genes) of total duplicate
genes were involved in formation of gene clusters, which may explain that tandem duplication plays
a role in gene cluster expansion (Table 2.3). Gene clusters containing tandemly duplicated genes
are shown in Figures 2.2 and 2.3. For instance, the gene cluster in chromosome A1 consists of
three TNL duplicates and one gene outside the cluster. Another example is the gene cluster in
chromosome A5 where all CNL genes are duplicates and form a cluster.
Two types of genomic duplication were observed (Figure 2.6). Intra-genomic duplications within
the B. napus A or C sub-genome are involved in duplication events at the level of an intra-
chromosomal region of the sub-genome. The A and C genomes had 16 and 24 duplication events,
respectively, involved in intra-chromosomal duplications. Moreover, chromosome A4 and A7 did
not show intra-genomic duplications. In contrast, inter-genomic duplication between the B. napus
genome (between A and C genome) involved a duplication between homeologous chromosomes of
the A and C genomes. There were 41 duplication events involved in duplicate loci between A and C
genome. The duplicated genes showed collinearity between homeologous chromosomes. For
example, 14 genes on chromosome A1 were collinear with chromosome C1 (Figure 2.6). However,
there are examples where they had a collinear relationship with a gene in non-homeologous
chromosomes. For example, five genes in chromosome A1 were collinear with a gene on
chromosome C3, C5 and C7 (Figure 2.6).
Furthermore, block duplication is considered as segmental duplication and defined as duplication of
a chromosomal region that includes more than one gene. Eleven duplication blocks were observed
between the B. napus homeologous chromosomes in which a block contained four to five genes
together in the duplication.

50
Figure 2.6: Inter-genomic and intra-genomic duplication relationship of NBS-LRR -genes between
the two sub-genomes of B. napus: the A and C genomes. Coloured lines represent the relationship
of paralogous gene pairs between homeologous chromosomes. Red lines represent the gene
duplication between chromosomes within a sub-genome. Black lines represent the gene duplication
between homologous chromosomes with collinearity. Blue lines represent the gene duplication
between non homeologous chromosomes. The green block represents a duplicated block where
there is more than one gene involved in duplication. Chromosomes are scaled based on the number
of NBS-LRR genes.

51
A study identified 21 conserved blocks within the Arabidopsis genome which showed synteny to
almost 90% of the B. napus genome (Parkin et al., 2005). This ancestral karyotype (AK) block
system was used to find a correlation between the B. napus NBS-LRR duplications and the
conserved blocks.
According to the conserved AK blocks relationships with B. napus chromosomes, the duplication
between NBS-LRR genes was defined as duplication between conserved genome regions within B.
napus chromosomes similar to the pattern of conserved blocks. Hence, the duplications between B.
napus chromosomes can be predicted based on the conserved blocks patterns between different
chromosomes. For example, conserved block 3A appeared in six chromosomes: A1, A3, A5, C1,
C3 and C5 (Table 2.6) suggesting that duplication may occur between them. This results in
comparison of the genome duplications based on NBS-LRR genes within and between B. napus A
and C sub-genomes.
In this study, the NBS-LRR genes duplication patterns in all B. napus chromosomes would be
expected to be correlated with the conserved AK blocks (Parkin et al., 2005). For instance, there
were two intra-genomic duplications in A1 with A6 and A8. The correlation indicated that the
duplication could occur between A1 and A8 but not with A6, because the conserved blocks in A1
have similar conserved blocks in A8 whereas there are no matching blocks between A1 and A6.
The correlation between NBS-LRR gene duplication and conserved blocks were significant as I
found that duplication pattern matching was about 70% and 85% in intra-genomic and inter-
genomic duplications, respectively (Table 2.6).

52
Table 2.6: The correlation between B. napus NBS-LRR intra-genomic and inter-genomic duplications and conserved blocks found between B. napus
and Arabidopsis
chr Arabidopsis Conserved blocks1 NBS-LRR
Intra-genomic duplication 2
Duplicated patterns
matching3
NBS-LRR Inter-genomic Duplication2
Duplicated patterns matching3
A1 4B 3A
A6 , A8 A8 C1 , C3 , C5, C7 , C9 C1 , C3 , C5 , C7
A2 5A 5E 1E 5D 3B 5B 5F
A10 A10 C1 , C2 , C7 C2 , C7
A3 5A 5E 2C 2B 4A 3A 4B
A9 A9 C2 , C3 , C7 C2, C3 , C7
A4 3D 4B 5C 2B 2C
--- --- C3 , C4 C3 , C4
A5 2C 1B 1C 3A
A9 --- C4 , C5 , C6 , C9 C4 , C6 , C5
A6 1C 1A 1B 5E 5F 5B 5C 3B 5D
A1 , A8 , A9 A8 , A9 C1 , C2 , C5, C6 , C7 , C8 , C9 C2 , C5, C6 , C7 , C8 , C9
A7 2A 1B 2B 3D 1E
--- --- C6 C6
A8 1C 4B 1B 1A
A1 , A6 , A9 A6 , A9 C1 , C3 , C5 , C6 , C7 , C8 C1 , C3 , C5 , C6 , C7 , C8
A9 4A 5B 1D 5D 4A 1B 3D 2B 1A
A3 , A5 , A6 , A8 A3 , A6 , A8 C2 , C3 , C4 , C5 , C7 , C8 , C9 C2 , C3 , C4 , C5 , C7 , C8 , C9
A10 1A 5E 5A
A2 A2 C2 , C6 , C9 C1 , C2
16 11(68%) 41 35(85%)
C1 4B 3A
C2 , C3 , C5 , C6 , C7 C3 , C5 A1 , A2 , A6 , A8 A1 , A8
C2 5A 5E 1E 5D 3B 5B 5F
C7 , C9 C7 , C9 A2 , A3 , A6 , A9 , A10 A2 , A3 , A6 , A9 , A10
C3 5A 5E 2C 2B 4A 3A 3B 3C 1B 4B C1 , C6 , C7 , C9 C1 , C7 , C9 A3 , A8 , A9 A3 , A8 , A9
C4 2C 2B 1D 3D 4B 5C 2B 2C
C9 C9 A4 , A5 , A9 A4 , A5 , A9
C5 1A 1B 3A
C1 , C8 , C9 C1 , C8 A1 , A5 , A6 , A8 , A9 A1 , A5 , A6 , A8 , A9
C6 1C 1E
C3 --- A1 , A5, A6 , A7 , A8 , A10 A5, A6 , A7 , A8
C7 2A 1B 5D 3B 5C 5B 4B
C1, C2 , C3 C1 , C2 , C3 A1 , A2 , A3 , A6 , A9 A1 , A2 , A3 , A6 , A9
C8 1C 4B 1A 1B 3D 1A
C1 , C5 C1 , C5 A6 , A8 , A9 A6 , A8 , A9
C9 4A 5B 5F 1D 5D 4A 5E 5A
C2 , C4 , C5 C2 , C4 A1 , A2 , A3 , A5 , A6 , A9 , A10 A2 , A3 , A6 , A9 , A10
24 17(70%) 41 35(85%)
1. Identified genome conserved blocks showing conservation of loci content and order between Arabidopsis and B. napus genome (Parkin et al., 2005). Blocks are arranged in
order from the top to bottom of the B. napus chromosomes.
2. The NBS-LRR gene intra-genomic or inter-genomic duplication confirmed by BLAST comparison of each individual NBS-LRR against all NBS-LRR genes in B. napus.
Then, the chromosome was determined based on the location of NBS-LRR gene in B. napus chromosomes
3. Based on the correlation between conserved blocks and NBS-LRR duplications on B. napus chromosomes.

53
2.5 Discussion
2.5.1 Genome wide identification of B. napus NBS-LRR genes
The recent whole genome sequencing of B. napus enables the genome wide identification, mapping
and characterization of candidate NBS-LRR genes in economically important plants such as
Brassica species. The genome wide NBS-LRR resistance genes have been extensively studied
because they represent the largest class of disease resistance gene and play a critical role in
defending plants from pathogens. Thus, identification of NBS-LRR resistance genes is one of the
most important objectives of understanding the resistance genetics. Here, this study aimed to
analyse the Brassica genomes for identification and characterization of candidate NBS-LRR genes
and to determine their distribution, domain structure, gene clustering, duplication and conservation.
In this study, I have characterized the complete set of 641 NBS-LRR genes in the Darmor B. napus
genome with about 70% of the genes comprising TNLs. This represents a ratio of 1:2.5 of CNLs to
TNLs. The TNL genes make the largest proportion of the NBS LRR genes and show large domain
diversity compared with the CNLs genes, as was also previously reported in B. rapa (Mun et al.,
2009, Yu et al., 2014), Arabidopsis (Meyers et al., 2003, Yu et al., 2014), Medicago truncatula
(Ameline-Torregrosa et al., 2008), poplar (Kohler et al., 2008) and linseed (Kale et al., 2012). The
high number of NBS-LRR resistance genes identified in this study could be explained mainly by the
complexity of the B. napus genome duplication and recombination
The predominance of TNL or CNL genes in a genome may be contributed by the nature of
pathogens that infect the plant species, or may be driven by another evolutionary force that could be
related to the success of one or another type of NBS-LRR genes (Leister, 2004, Lozano et al.,
2012). Moreover, TNL types are found widely in dicot genomes but not in monocot genomes,
whereas the CNL type is found in both monocot and dicot genomes (Bai et al., 2002).
The NBS-LRR genes were found to be distributed randomly and unevenly across the genomes. This
uneven distribution of NBS-LRR genes on chromosomes appears to be common in plants such as in
Arabidopsis, rice and poplar (Meyers et al., 2003, Zhou et al., 2004, Kohler et al., 2008, Yang et al.,
2008).
Most NBS-LRRs (59%) were found to be in clustered in the B. napus genome. This compares to
61% of all NBS genes in clusters in Arabidopsis (Meyers et al., 2003), 50% in Medicago truncatula
(Ameline-Torregrosa et al., 2008) and 58% in potato (Jupe et al., 2012). Large numbers of TNL

54
genes occur in clusters and tend to form large cluster, whereas, most of the CNLs were not in
clusters (singletons). This attributes to the predominance of TNLs to CNLs in B. napus.
Several identification approaches are available for NBS-LRRs, such as Pfam, mining ESTs, or
cloning resistance gene analogues (RGAs) using degenerate PCR. However, these methods each
have disadvantages. For example, RGAs has the limitation that the number of R genes identified is
affected by PCR and sequencing qualities. Pfam only finds gene models existing in the search
database, which might cause underestimation of the number of R genes. In this study, the MEME
and MAST analysis used in Jupe et al (2012) is a web based tool and the most common motif-
finding tool. The analysis is feasible and very efficient in identifying common specific motifs
between homologous protein sequences that show different motif compositions. By utilizing NBS-
LRR specific motifs from wide range of plant species, it enables 20 NBS-LRR specific motifs to be
distinguished between NBS-LRR subfamilies: TNLs and CNLs. In contrast, the domain based
identification of large NBS-LRR gene family members is very laborious and time-consuming. It
involves conserved domain searches followed by generating a hidden Markov models (HMMs)
profile. The domain based search does not identify homologous protein sequences if a domain has
diverged to another family.
Here, a combination of MAST and CNL/TNL analyses were utilized to have a more feasible and
accurate identification of potential candidate NBS-LRRs. The MEME/MAST analysis relies on 20
sequence motifs, putatively characteristic of NBS-LRR proteins, as queries against the predicted
genes of the B. napus genome to search for genes containing patterns matching the motifs giving an
E-value for each hit. Therefore, it is highly dependent on the gene prediction and annotation.
As expected, MEME/MAST analyses not only identified the number of NBS-LRR gene but, also
identified specific consensus sequence motifs for B. napus NBS-LRR genes showing similar motifs
sequence and patterns to those in other plants species such as Arabidopsis, potato, papaya, poplar
and Medicago. In contrast, consensus CNL and TNL analysis using either tBLASTn against
nucleotide sequence of the genome or BLASTp against amino acid sequence of the genome were
straightforward approaches to identify any gene or protein sequence with characteristics of NBS-
LRRs or even pseudogenes. The TNL and CNL consensus sequence BLAST analyses are suitable
for any plant genomes that have not yet been completed or assembled. In addition, CNL and TNL
consensus sequence were useful to ensure no related NBS-LRR genes are missing from the gene
prediction and mis-annotated. Thus, this analysis shows a good correlation between the two
methods indicating that it is deep enough for the genome wide identification of NBS-LRR genes
across the Brassica genomes.

55
The B. napus NBS-LRR genes were further divided into regular and non-regular NBS-LRR
encoding genes. The regular NBS-LRR genes have all domains and a complete open reading frame
whereas the non-regular NBS-LRR resistance genes have partial motifs of the NBS domain or lack
CC, TIR or LRR domains. They are probably considered as truncated or pseudogenes. For example,
TIR, TIR-NBS, and CC-NBS and NBS- LRR genes have been described in plant genomes and were
often distributed unevenly and surrounded regular NBS-LRR genes, for example in Arabidopsis
(Meyers et al., 2003), Medicago truncatula (Ameline-Torregrosa et al., 2008) and potato (Jupe et
al., 2012). One possible explanation for the presence of non-regular NBS-LRR genes is the partial
deletion of redundant NBS-LRR genes after whole genome duplication occurred. Interestingly, the
non-regular CNL or TNL genes were dispersed with regular genes among various clades throughout
the phylogenetic tree, indicating a diverse rather than a monophyletic origin due to domain deletion.
Thus, I anticipate that these non-regular NBS-LRR genes might show significant polymorphism
between B. napus cultivars.
Additionally, genes that encode for only a TIR domain lacking both NBS and LRR domains in B.
napus were reported. These genes might be truncated NBS LRR genes or a part of TIR containing
proteins as they have been previously identified in Arabidopsis and B. rapa (Meyers et al., 2002, Yu
et al., 2014). The majority of TIR genes were found residing in a cluster mixed with TNL and TN
suggesting they might have derived from TNs or TNLs and co-evolved (Yang et al., 2008). Thus,
TIR genes could interact and function together with TNL or NL proteins for their involvement in a
disease resistance response (Nandety et al., 2013).
The exon structure in TNLs is more complex than CNLs with an average of five exons in TNLs and
three exons in CNLs. The average number of exons in the total NBS-LRR is four exons. This result
is consistent with previous findings in B. rapa and A. thaliana. In B. rapa, the average exon number
in NBS-LRR genes was 4.2, but CNLs and TNLs have 2.3 and 5.2, respectively. Similarly, In A.
thaliana, NBS-LRR genes contain 4.2 exons, but CNLs and TNLs have 2.2 and 5.3 exons per gene
on average, respectively (Meyers et al., 2003, Mun et al., 2009).
2.5.2 Alignment and phylogenetic analysis
In the phylogenetic analysis using NBS domains, the NBS domain sequences in CNLs formed
distinct clades separated by higher genetic distances than in the TNLs. In addition, the average
number of genes per clades was similar for both TNLs and CNLs, despite there being a much larger
number of TNLs. This suggests that the NBS domains in CNLs were relatively more diverged in
sequence than TNLs due to greater selective pressure on the CNLs. This phenomenon was also

56
observed in previous studies in Fabaceae, Brassicaceae, Poaceae, and Solanaceae species (Bai et al.,
2002, Cannon et al., 2002, Wan et al., 2013). The results here concur with the hypothesis that the
CNL family is highly diverse and originated prior to the split between gymnosperms and
angiosperms while, the TNL family is more homogeneous and are found only in dicotyledons,
suggesting that the family arose after the divergence of monocotyledons and dicotyledons. In
addition, it can be attributed to the exon structure where the CNL proteins are mostly encoded by a
single exon, unlike TNLs that usually are encoded by a complex exon structure (Tarr and
Alexander, 2009). In this study, I also found that the TNL family of genes showed complex
structures and various domains (TIR, NBS, and LRR) which were often separated by introns and
usually consisted of many short exons in the LRR region.
Phylogenetic relationships also showed that the NBS-LRR genes located in the homeologous
chromosomes of the B. napus sub-genomes were likely to be found in the same clade. For instance,
the phylogenetic and sequence comparison between most of TNL genes in chromosomes A7 and C6
were found to be related to each other and located in the same clade suggesting that these genes
have been maintained without substantial divergence or selection pressure during B. napus
formation from its progenitor species. In addition, I found mixed clades dominated by sequences
from one chromosome (and usually from one or a small number of genomic clusters), but many also
contained small numbers of sequences from other chromosomes. This could arise in several ways:
by chromosomal rearrangements or by large-scale genomic duplication. Accordingly, this further
confirmed that gene duplication in B. napus might play a major role in the expansion and diversity
of NBS-LRR encoding genes.
2.5.3 NBS-LRR gene clustering
The combination of phylogenetic analyses and physical clustering of NBS-LRR genes was used to
study the nature of genes involved in clusters and whether they share homology. More
homogeneous than heterogeneous cluster were found (Figure 2.2 and 2.3). The existence of highly
related homologies in NBS-LRR gene clusters implies that NBS-LRR gene duplication can lead to
gain of resistance function (Grant et al., 1998). This is compared to heterogeneous clusters where
genes involved in the cluster are distantly related. These clusters of mixed unrelated genes could
have arisen as a result of either selective pressures or arranged and co-localized randomly in the
genome (Richly et al., 2002, Meyers et al., 2003). Moreover, clusters contain genes from non-
regular NBS LRR genes often located adjacent to regular NBS-LRR genes in gene clusters and this
is consistent with phylogenetic lineages. Therefore, the clustered organisation and arrangement of
these genes may be a critical attribute allowing the generation of novel resistance specificities via

57
intergenic rearrangement, duplication (especially tandem duplication) or gene conversion (Hulbert
et al., 2001).
Previously, it was hypothesized (Friedman and Baker, 2007) that R-gene distribution and quantity is
dependent on the size and cluster complexity of these genes so that these NBS-LRR genes keep
growing in number, complexity and expand the different functions of these genes. Thus, there could
be a correlation between the gene number and the size in the gene clusters as the large cluster size is
often associated with a higher gene number.
In addition, it has been suggested (Guo et al., 2011) that analyses of individual genes involved in
clusters provided evidence of gene diversity and selection pressure, suggesting NBS-LRR genes
within clusters to be more polymorphic and prone to evolutionary process while, singleton genes
remain a simple locus with no relatives in the genome reflect a relatively stable region. This is
supported by the finding that the gene clusters contained tandemly duplicated genes and formed
homogeneous clusters of many related genes.
2.5.4 NBS-LRR gene duplication
Since allotetraploid B. napus was formed from two ancestral diploid genomes of B. rapa and B.
oleracea via a polyploidization process, B. napus has undergone extensive genome rearrangement
and duplication. The level of gene duplication in the B. napus genome is thought to be significant
and there are high levels of genomic redundancy (Parkin et al., 2003, Rana et al., 2004, Parkin et al.,
2005). Thus, gene duplication, including tandem and whole-genome duplication (WGD) could have
resulted in a substantial increase or substitution of the gene number to compensate the gene losses
during formation of B. napus.
In this study, I found that 50% of B. napus NBS-LRR were duplicated, or in pairs of paralogs. The
distribution of duplicate genes was random which could be as a result of genome rearrangements or
gene loss/gain occurring after whole genome duplication events.
Intra-genomic and inter-genomic duplication events between B. napus NBS-LRR genes has been
observed suggesting that these genes possibly originated via tandem duplication where duplicated
genes are contiguous with its original copy. There was considerable collinearity between duplicated
genes in homeologous chromosomes, with the exception of some showing duplication between non
homeologous chromosomes due to possible translocation or genome mis-assembly.

58
In addition, block duplication between the B. napus homeologous chromosomes were observed and
considered as segmental duplication and defined as duplication of a chromosomal region that
includes more than one gene. It can be assumed that the duplication block might suggest gene losses
or rearrangement in B. napus. However, the level of genomic duplication reported based on NBS-
LRR genes is insufficient to provide a better resolution about the segmental duplication. Therefore,
this could be determined by analysis of sequence information flanking the NBS LRR genes.
A study by (Parkin et al., 2005) identified almost 90% of the B. napus mapped into conserved
syntenic blocks relative to Arabidopsis. In this study, I utilized the comparative duplication analysis
with conserved blocks to find the correlation with the intra-genomic and inter-genomic duplication
of NBS-LRR genes. This showed that these conserved blocks can be correlated with NBS-LRR
duplication, with about 70 to 85%. It was found that conserved blocks within Arabidopsis had
similar chromosomal rearrangements between A and C genome. This further supports my finding
that the NBS-LRR duplication between B. napus sub-genomes exhibited similar duplication
patterns suggesting that the NBS-LRR genes in B. napus might have experienced tandem gene
duplications and chromosomal rearrangements between the A and C genomes. However, the
duplications that did not correlate may be due to genome mis-assembly, or it may be due to location
of NBS-LRR genes in a region not covered by conserved blocks.
The duplication of NBS-LRR genes may be related to its physical location or cluster and occur
between chromosomes in two sub-genomes on B. napus. Theoretically, NBS-LRR derived from
gene duplications would share high similarity to NBS-LRR in the same or different genomic
clusters. It been suggested that duplication in combination with divergent selection acting on
duplicated genes, influences the generation of gene diversity within existing gene clusters (Parniske
and Jones, 1999, Richly et al., 2002, Wei et al., 2013). Approximately, 53% of duplicated genes
were involved in formation of gene clusters. This indicates that gene clusters could be chromosomal
hot spots in which the NBS genes get duplicated and then gene clusters may have been expanded by
tandem duplication followed by selection pressure (Wei et al., 2013). Indeed, previous studies
revealed that NBS-LRR genes are often present as tightly linked genes with high homology and are
prone to gene duplication and recombination, and thus evolve more rapidly than the rest of genome
(Grant et al., 1998). Therefore, the clustered distribution of NBS-LRR genes provides a reservoir of
genetic variation by which new specificities to pathogens can evolve via gene duplication
(Michelmore and Meyers, 1998, Yang et al., 2008). For instance, duplicated genes could be allelic
variants that show specificity for different pathogen strains. Together, these findings suggested that

59
tandem duplication in combination with recombination and selection pressure played a major role in
NBS gene expansion and diversity in B. napus.

60
Chapter 3
Comparative and conservation
analysis of NBS-LRR genes in
Brassica
*This chapter contributed to the science paper being published (Chalhoub et al., 2014)

61
Chapter 3 : Comparative and conservation analysis of NBS-LRR genes in
Brassica
3.1 Abstract
NBS-LRR genes are one of the most dominant gene families in plant genomes. The recent
completion of the genome sequences of B. napus and its related species: B. rapa and B. oleracea
provide an important opportunity for identification and comparative analysis of disease resistance
genes. The comparative analysis enables the understanding of the genomic structure and
conservation between Brassica species.
This chapter presents a comprehensive NBS-LRR comparative analysis between the three Brassica
species: B. napus, B. rapa and B. oleracea. From the genome wide NBS-LRR identification, a total
of 641, 249 and 443 NBS-LRR genes have been identified in B. napus, B. rapa and B. oleracea,
respectively. The distribution and synteny of NBS-LRR genes in the A genomes of B. napus and B.
rapa and C genomes of B. napus and B. oleracea are consistent and highly conserved in size and
orientation, particularly regions containing major gene clusters. This provided evidence that there
was a selective advantage to maintaining similar features of NBS-LRR genes in B. napus to both B.
rapa and B. oleracea following polyploidization. However, the differences in NBS-LRR gene
numbers could be attributed to gene losses or selection pressure to offer novel resistance genes in
the three species. More than 60% of NBS-LRR genes from the progenitor species were conserved
and maintained in B. napus. The differences in NBS-LRR content and conservation between B.
napus and its progenitors suggest differential selection for disease resistance that is either shared or
divergent.
This chapter provides an insight into NBS-LRR genome organisation and evolution between
Brassica species and enables understanding the candidate genes similarities and differences for
disease resistance traits.

62
3.2 Introduction
Comparative genomics is the study of sequence similarity/differences and chromosomal distribution
of gene homologues in related species. Comparative analysis provides an insight into genome
organisation, rearrangement and evolution between related species. The degree to which genome
comparison can facilitate cross-species analysis of gene evolution and function depends on the
conservation of gene content and synteny, collinearity between homologous chromosomes or
genomes.
The conservation of the NBS-LRR genes has been used to study the genomic architecture because
they are abundant, widely distributed throughout the genome and present in gene clusters. Genome
wide analyses of NBS-LRR genes in many genomes have showed that NBS-LRR genes are diverse
in number, structure and organization and suggested that these genes do not distribute randomly
within a genome (Baumgarten et al., 2003, Plocik et al., 2004, Yang et al., 2008, Zhang et al., 2011,
Gu et al., 2014, Yu et al., 2014). They often occur in a cluster at a specific location on the
chromosome. NBS-LRR genes and their syntenic positions were found conserved across the
genomes of tomato and potato (Pan et al., 2000).
Genomic comparison of NBS-LRR sequence similarity and chromosomal distribution in related
species is important to understand different perspectives towards NBS-LRR gene evolution. The
variation in NBS-LRR gene diversity within a species may be a fundamentally important strategy to
produce novel resistance specificities (Li et al., 2010). Evolutionary mechanisms generating
resistance gene diversity such as duplication, homeologous recombination and diversifying
selection have been proposed to contribute to the conservation and evolution of resistance genes
(Meyers et al., 2003, Ameline-Torregrosa et al., 2008, Ratnaparkhe et al., 2011). Comparative
analyses in soybean showed that the polyploidization did not result in increasing the number of
NBS-LRR genes. However, divergent selection acting on duplicated genes could result in creating
NBS-LRR number/cluster variation (Richly et al., 2002, Ashfield et al., 2012). NBS-LRR clustering
due to duplication and recombination may also be important factors that influence the evolution of
resistance genes.
Allotetraploid B. napus was formed from two ancestral diploid genomes of B. rapa and B. oleracea
via a polyploidization process. Previous studies have shown extensive genome collinearity and
structural conservation between Brassica species (Parkin et al., 2005, Cheung et al., 2009, Jiang et
al., 2011, Cheng et al., 2012a). However, considerable genome changes may have occurred via
duplication events (tandem duplication of genes), genomic rearrangements and homeologous

63
recombination between the A and C genomes. This often causes novel variations in B. napus
relative to its progenitors.
Polyploidization is considered to be the major mechanism of duplication in plants genomes. The
duplicated genes are produced by duplications arising from the alloploidy nature and post-
speciation duplications. The duplication arising by polyploidization originated from the ancestral
species, whereas the post speciation duplications take place independently after the polyploidization
event (Lawton-Rauh, 2003, Carretero-Paulet and Fares, 2012). In comparative genomics, it is
possible to examine the origin of duplications in polyploidy of B. napus through orthology,
paralogy and syntenic relationships to its ancestral species: B. rapa and B. oleracea. However, this
can be challenging in B. napus due the homeologous relationships between the progenitor genomes
as it is requires extensive genome wide analysis.
The completed genome sequences of the three Brassica species: B. napus (Chalhoub et al., 2014),
B. rapa (Wang et al., 2011) and B. oleracea (Parkin et al., 2014) offer a great opportunity for
functional and comparative analysis of genetic diversity and evolution between these Brassica
species. For instance, the effect of genomic variations on important genes such as disease resistance
genes can be studied.
Understanding the syntenic structure of NBS-LRR genes in ancestral genomes is required for
informative synteny analysis between different genomes. It also helps to study the genomic
rearrangements, such as duplication and translocation that might have occurred within the B. napus
genome. The comparative analysis serves as an invaluable resource for the identification and
cloning of the candidate genes and establishing an evolutionary relationship between species to
address the question of how NBS-LRR genes orthologous are highly conserved and evolved in B.
napus when compared to its two ancestral species in regards to disease resistance genetics.
The aim of this chapter is to find the NBS-LRR gene orthology and collinearity relationships
between B. napus and its diploid progenitor species: B. rapa and B .oleracea.

64
3.3 Methods
3.3.1 Brassica reference genomes
The genome sequence and annotation of B. napus cv. Darmor was used as the reference genome
(Chalhoub et al., 2014). The genome sequences of B. rapa v3.0 (Wang et al., 2011) and B. oleracea
cv. To1000 v1.0 (Parkin et al., 2014) were also used for comparative analysis.
3.3.2 Identification of NBS-LRR genes in B. rapa and B. oleracea
NBS-LRR candidate genes in B. rapa and B. oleracea were identified using the same methods in B.
napus as described in Chapter 2 section 2.3.2 and 2.3.4.
3.3.3 Reciprocal Best BLAST (RBB) of NBS-LRR for comparative analysis between B.
napus, B. rapa and B. oleracea
A reciprocal best BLAST (RBB) analysis was used to compare which of the NBS-LRR genes
predicted across the three genomes: B. napus, B. rapa and B. oleracea, were conserved. The NBS
LRR genes from B. rapa (v3.0) were compared with the identified NBS LRR genes from the B.
napus cv. Darmor (A genome) and vice versa using BLAST. The identified NBS-LRR genes from
B. oleracea (To1000 v1.0) were also compared with identified NBS-LRR genes from the B. napus
cv. Darmor (C genome), and vice-versa using BLAST.
The NBS-LRR genes were used to determine the chromosomal synteny between B. napus and B.
rapa as well as B. napus and B. oleracea according to their chromosome positions. Genes showing
orthology and collinearity were regarded as syntenic genes.

65
3.4 Results
3.4.1 Comparison of the distribution of B. napus NBS-LRR genes to its related diploid
species B. rapa and B. oleracea
The identification of NBS-LRR gene indicates that there are 641 NBS-LRR encoding genes in B.
napus. In the diploid species, a total 249 genes in B. rapa and 443 genes in B. oleracea were
identified (Table 3.1). The proportion of all genes encoding NBS-LRR in B. napus, B. rapa and B.
oleracea are 0.58%, 0.60% and 0.75%, respectively (Table 3.1).
Table 3.1: The total number of predicted NBS-LRR genes identified in the three Brassica genomes.
The table shows comparison between the methods used: MEME / MAST and CNL and TNL
BLAST
The number and distribution of NBS-LRR genes in the A and C genome of B. napus compared to
the A genome of B. rapa or C genome of B. oleracea are consistent across the chromosomes and
exhibit similar patterns (Tables 3.2 and 3.3 and Figures 3.1 and 3.2). The comparison of the total
number of NBS-LRRs and whether they were classified as TNL or CNL in both A and C genomes
also showed that the proportion of CNLs and TNLs was consistent across the three species, with
approximately 70% of NBS-LRR genes comprising TNLs (Figure 3.3). This represents a ratio of
1:2 of TNLs and CNLs in the A genome and 1:2.5 in C genome. The NBS-LRR in B. rapa and B.
oleracea were organised in gene clusters with approximately 53% and 61%, respectively. This is
very similar to the gene cluster percentage in B. napus (54% for A genome and 62% for C genome,
an average of 59%).
Species B. napus B. oleracea B. rapa
Genome size (Mbp) 1284 650 552
Gene content 111,479 59,225 41,019
Total candidate NBS-LRR genes 641 443 249
Proportion of NBS-LRR genes 0.58% 0.74% 0.60%
Identified in MAST output 615 437 248
Common to MAST and CNL/TNL analysis
509 379 208
Agreement % 79% 85% 83%

66
Table 3.2: The number of candidate NBS-LRR genes in B. napus. The total numbers of genes in
each chromosome with their classification into TNL or CNL as well as the reciprocal best BLAST
results are presented
Chromosome Total TNL CNL Reciprocal best BLAST
total conserved
TNL CNL A
gen
om
e B
. na
pu
s D
arm
or
A1 28 17 11 17 9 8
A2 44 33 11 26 24 2
A3 24 20 4 15 11 4
A4 13 12 1 6 6 0
A5 10 4 6 5 2 3
A6 21 7 14 11 4 7
A7 19 16 3 12 10 2
A8 24 17 7 12 8 4
A9 58 38 20 40 29 11
A10 11 7 4 5 5 0
Total in A genome
252 171
(68%) 81
(32%) 149 108 41
C g
en
om
e B
. na
pu
s D
arm
or
C1 37 24 13 25 14 11
C2 51 47 4 32 29 3
C3 56 46 10 33 27 6
C4 18 12 6 11 7 4
C5 19 11 8 14 7 7
C6 44 33 11 33 27 6
C7 38 30 8 32 25 7
C8 39 21 18 24 13 11
C9 79 62 17 54 42 12
Total in C genome
381 286
(75%) 95
(24%) 258 191 67
Unassigned 8 4 4 2 1 1
Total 641
461 (71%)
180 (28%)
409 300 109

67
Table 3.3: The number of candidate NBS-LRR genes in B. rapa and B. oleracea. The total numbers
of genes in each chromosome with their classification into TNL or CNL as well as the reciprocal
best BLAST results are presented.
Chromosome Total TNL CNL Reciprocal best BLAST
Total conserved
TNL CNL
A g
eno
me
B. r
ap
a
A1 18 10 8 16 8 8
A2 39 36 3 24 22 2
A3 29 25 4 16 12 4
A4 8 8 0 6 6 0
A5 11 2 9 5 1 4
A6 25 7 18 12 6 6
A7 19 16 3 13 11 2
A8 22 14 8 11 7 4
A9 59 40 19 41 29 12
A10 9 6 3 4 4 0
Unassigned 10 4 6 1 1 0
Total in B. rapa 249 168
(68%) 81
(32%) 149 107 42
C g
en
om
e B
. ole
race
a
C1 33 18 15 23 14 9
C2 52 43 9 30 27 3
C3 52 43 9 30 23 7
C4 24 15 9 10 5 5
C5 18 9 9 14 7 7
C6 45 32 13 31 24 7
C7 49 40 9 34 29 5
C8 41 23 18 27 12 15
C9 87 66 21 51 38 13
Unassigned 42 30 12 10 8 2
Total in B. oleracea
443 319
(72%) 124
(28%) 260 187 73

68
Table 3.4: Comparative analysis of synteny of NBS-LRR genes in B. napus to its progenitor
species
Chro Total Conserved Syntenic
genes
Syntenic genes in cluster
No. of conserved genes in clusters
No. of conserved genes not in clusters
A g
eno
me
B. n
ap
us
Dar
mo
r
A1 28 17 13 5 4 13
A2 44 26 20 16 17 9
A3 24 15 13 10 6 9
A4 13 6 3 2 2 4
A5 10 5 4 1 1 4
A6 21 11 7 2 3 8
A7 19 12 10 4 5 6
A8 24 12 10 5 5 6
A9 58 40 35 30 32 8
A10 11 5 4 1 0 5
Total in A genome
252 149 119 76 75 72
C g
en
om
e B
. na
pu
s D
arm
or
C1 37 25 21 12 13 12
C2 51 32 15 12 21 11
C3 56 33 26 20 20 13
C4 18 11 8 5 6 5
C5 19 14 14 10 10 4
C6 44 33 29 23 22 10
C7 38 32 31 25 21 11
C8 39 24 19 18 14 10
C9 79 54 42 33 33 20
Total in C genome
381 258 205 158 160 96
Unassigned
8 -- -- -- -- --
Total 641 409 324
(50%) 234
(72%) 235 168

69
Figure 3.1: The distribution of NBS-LRR genes in the A genome of B. napus and B. rapa
(Chalhoub et al., 2014).
Figure 3.2: The distribution of NBS-LRR genes in the C genome of B. napus and B. oleracea
(Chalhoub et al., 2014).

70
Figure 3.3: The proportion of TNL and CNL genes to the total number of NBS-LRR genes in B.
napus, B. rapa and B. oleracea.
Further NBS-LRR physical location of B. napus when compared to its diploid progenitors of B.
rapa and B. oleracea was performed to assess the NBS-LRR genes synteny and clustering (Figures
3.4, 3.5, 3.6 and 3.7). Comparison of the NBS-LRR genes of B. napus chromosomes with their
homeologous counterparts in the B. rapa and B. oleracea genomes indicated that the NBS-LRR
distribution showed clear syntenic and collinearity relationships between the A genome of B. napus
and B. rapa and the C genome of B. napus and B. oleracea. Approximately 324 (50%) of NBS-
LRR in the A and C genomes of B. napus were found to be syntenic and collinear to their respective
progenitor genomes (Table 3.4). They were highly consistent in size and orientation between
homeologous chromosomes in B. napus and its related species especially at the gene clustering
level (Figures 3.4, 3.5, 3.6 and 3.7). In addition, 72% of these syntenic and collinear genes in B.
napus were located within a gene cluster (Tables 3.4). However, there was evidence from local
gene clusters that the genes have been formed or lost between corresponding chromosomes of the
three Brassica species. In total, there were eight gene clusters formed in B. napus (four clusters in
the A genome and four clusters in the C genome) whereas there were ten gene clusters lost from the
B. napus (three clusters in the A genome and seven clusters in the C genomes) compared to the
diploid progenitors. For example, there are two gene clusters present on B. napus chromosome A1,
but absent in B. rapa. Likewise, two gene clusters are absent from B. napus chromosome C2 and C3
compared to B. oleracea.

71
Figure 3.4: Comparative organization of NBS-LRR genes between the An genome of B. napus and
Ar genome of B. rapa (chromosomes A1 to A5). Circles and triangles designate TNL and CNL
genes, respectively. Solid triangles and circles represent where the genes have orthologous copies,
blue and red symbols represent where genes were found to be in a cluster and grey symbols
represent where genes were not in a cluster. Unfilled symbols show genes without orthologs. A
solid line between genes represents genes that have a syntenic relationship in clusters, dotted lines
between genes show genes with syntenic relationships, but not in clusters. Chromosome lengths are
shown in Mb pairs. Published in (Chalhoub et al., 2014).

72
Figure 3.5: Comparative organization of NBS-LRR genes between the An genome of B. napus and
Ar genome of B. rapa (chromosomes A6 to A10). Circles and triangles designate TNL and CNL
genes, respectively. Solid triangles and circles represent where the genes have orthologous copies,
blue and red symbols represent where genes were found to be in a cluster and grey symbols
represent where genes were not in a cluster. Unfilled symbols show genes without orthologs. A
solid line between genes represents genes that have a syntenic relationship in clusters, dotted lines
between genes show genes with syntenic relationships, but not in clusters. Chromosome lengths are
shown in Mb pairs. Published in (Chalhoub et al., 2014).

73
Figure 3.6: Comparative organization of NBS-LRR genes between the Cn genome of B. napus and
Co genome of B. oleracea (chromosomes C1 to C5). Circles and triangles designate TNL and CNL
genes, respectively. Solid triangles and circles represent where the genes have orthologous copies,
blue and red symbols represent where genes were found to be in a cluster and grey symbols
represent where genes were not in a cluster. Unfilled symbols show genes without orthologs. A
solid line between genes represents genes that have a syntenic relationship in clusters, dotted lines
between genes show genes with syntenic relationships, but not in clusters. Chromosome lengths are
shown in Mb pairs. Published in (Chalhoub et al., 2014).

74
Figure 3.7: Comparative organization of NBS-LRR genes between the Cn genome of B. napus and
Co genome of B. oleracea (chromosomes C6 to C9). Circles and triangles designate TNL and CNL
genes, respectively. Solid triangles and circles represent where the genes have orthologous copies,
blue and red symbols represent where genes were found to be in a cluster and grey symbols
represent where genes were not in a cluster. Unfilled symbols show genes without orthologs. A
solid line between genes represents genes that have a syntenic relationship in clusters, dotted lines
between genes show genes with syntenic relationships, but not in clusters. Chromosome lengths are
shown in Mb pairs. Published in (Chalhoub et al., 2014).

75
3.4.2 Conservation analysis of B. napus NBS-LRR genes to its related diploid species B. rapa
and B. oleracea
In order to identify orthologous genes between each pair of genomes, the NBS-LRR genes
identified in the B. napus genome were individually compared to genes in both B. rapa and B.
oleracea by reciprocal best BLAST (RBB) to determine the number of reciprocal best hits for each
pairwise comparison.
In total 260 and 149 B. napus NBS-LRR have orthologous genes in B. oleracea and B. rapa,
respectively. NBS-LRR gene conservation was evident among the Brassica species representing
more than 60% of the genes in B. napus, B. rapa and B. oleracea which are conserved (retained)
(Tables 3.4 and 3.5). In contrast, 100 NBS-LRR genes were lost in the B. napus A genome and 183
in the C genome. There were also NBS-LRR genes present in B. napus which are absent in B. rapa
and B. oleracea; 103 and 121, respectively (Table 3.5).
In addition, the level of conservation (presence/absence and homology) tends to be higher within
gene clusters. There was high conservation in genes involved in gene cluster than singleton genes.
Approximately 80 (53%) and 160 (61%) of conserved genes in the A and C genome, respectively,
were within gene clusters. This compared to 96 (37%) and 72 (48%) of singleton genes were
conserved in A and C genome, respectively (Tables 3.4 and 3.5). There was conservation bias
towards TNLs in the A genome with 63% of TNLs conserved compared to 53% of CNLs
conserved. The conservation patterns do not seem to be consistent within the C genome (Tables 3.4
and 3.5).
Table 3.5: Comparative analysis of the number of NBS-LRR genes in the three Brassica species
and the reciprocal best BLAST hits
Genome B. oleracea C genome
B. napus Darmor
C genome
B. rapa A genome
B. napus Darmor
A genome
Total NBS LRR 443 381 249 252
Total TNL and CNL 319 , 124 286 , 95 168 , 81 171 , 81
Reciprocal BLAST hits conserved genes “retained”
260 (60%) 260 (75%) 149 (60%) 149 (60%)
Conserved TNL and CNL 187 , 73 192 , 68 107 , 42 108 , 41
% Conserved TNL and CNL 58% , 58% 67% , 71% 63% , 52% 63% , 52%
No. of conserved genes in cluster 160 (61%) 75 (50%)
No. of conserved genes not in cluster 96 (37%) 72 (48%)
Not conserved 183 121 100 103
Lost 183 0 100 0
Gained 0 121 0 103

76
3.4.3 Comparative analysis of chromosome A7 and C6 in B. napus
The genome wide NBS-LRR analysis enabled us to study the synteny and conservation comparison
of NBS-LRR genes on homeologous chromosomes A7 and C6 with their homologous counterparts
in B. rapa and B. oleracea. The gene content was similar with 19 NBS-LRR genes on chromosome
A7 of both B. rapa and B. napus, and 44 NBS-LRR genes on chromosome C6 in B. napus
compared to 45 genes in B. oleracea. There were 14 NBS-LRR genes involved in inter-genomic
duplications between B. napus A7 and C6 (Figure 3.8). The duplication events showed consistent
patterns with syntenic orthologous relationship. The comparison between chromosomes A7 genes in
B. napus and B. rapa showed 15 genes were orthologous and showed a clear syntenic relationship.
Similarly, 33 genes from chromosomes C6 in B. napus and B. oleracea were orthologous and
showed a clear syntenic relationship.
The comparison indicated that 15 and 33 genes on chromosomes A7 and C6, respectively, in B.
napus were produced by polyploidization. In addition, there were two tandemly duplicated genes on
chromosome C6 of B. napus produced by post-speciation (gene duplication) (Figure 3.8).
Phylogenetic analysis was further performed to study the relationships between the NBS-LRR
genes on A7 and C6. Figure 3.9 shows the phylogenetic analysis of NBS-LRR genes on
chromosomes A7 and C6 in B. napus and their homologs in its diploid progenitor species: B. rapa
and B. oleracea. As expected, the phylogenetic analysis separates the TNL and CNL gene products
into two distinct clades (Figure 3.9). TNL and CNL groups were further divided into distinct
subgroups represented by conserved and orthologous genes from all the three species grouped
together. The number of NBS-LRR genes for the three species in each subgroup was almost
identical. For example, two TNL subgroups were found to be the largest, containing 19 NBS-LRR
genes in total. A greater part in this subgroup was from B. napus (nine genes) compared to five
genes from B. rapa and five genes from B. oleracea.

77
Figure 3.8: Comparative chromosomal map of NBS-LRR genes on chromosomes A7 and C6
between B. napus (Bn), B. rapa (Br) and B. oleracea (Bo). The squares and triangles represent
NBS-LRR type: TNL and CNL, respectively. Genes in syntenic relationships are connected by
lines. Red lines show inter-genomic duplications between B. napus A7 and C6. Closed bars are
orthologous genes. Genes within green squares are in a gene cluster.

78
Figure 3.9: A phylogenetic tree of TNL and CNL genes located on chromosomes A7 and C6 in B.
napus and the diploid species B. rapa and B. oleracea based on a neighbour-joining method using
MEGA 6.0 software. The numbers on branches indicate the percentage of 1000 bootstrap replicates.
The coloured squares indicate the gene origin: red from B. napus, blue from B. rapa and green from
B. oleracea.

79
3.5 Discussion
3.5.1 Comparison of the distribution of B. napus NBS-LRR genes to its related diploid
progenitor species B. rapa and B. oleracea
In this study, a total of 249 and 443 NBS-LRR genes in B. rapa and B. oleracea, respectively, were
identified. This is compared to 641 NBS-LRR genes in the B. napus cv. Darmor genome. This
shows a gene reduction in B. napus compared to the diploid progenitors, which meets the
expectation that the number of NBS-LRR genes is reduced in B. napus compared to B. rapa and B.
oleracea due to gene losses during the polyploidization events.
A recent study (Yu et al., 2014) has identified 206, 176 and 157 NBS-LRR genes in B. rapa, B.
oleracea and Arabidopsis, respectively. The NBS-LRR genes were identified through Hidden
Markov Model (HMM) profile corresponding to the Pfam NBS family domain. The number of
NBS-LRR identified in B. rapa was close to what is identified in here, but, the number of NBS-
LRR in B. oleracea was underestimated compared to this study. They also found that the number of
NBS-LRR genes in these three species was very close despite the differences in genome size and
complexity. This is surprising as B. rapa and B. oleracea genomes would be expected to contain
higher numbers of NBS-LRR genes than Arabidopsis because the B. rapa and B. oleracea genomes
have undergone extensive genome triplication events since divergence from the common ancestor
of Arabidopsis. The difference may be due to a poorer quality genome sequence assembly than was
used in this study.
The comparison of the total number of NBS-LRRs and whether they were classified as TNLs or
CNLs in both the A and C genomes showed that the proportion of CNLs and TNLs was consistent
across the three species, with about 70% of NBS-LRR genes comprising TNLs. This represents a
ratio of 1:2 of TNL and CNL in the A genome and a ratio of 1:2.5 in the C genome. This is
consistent with findings in Arabidopsis (Meyers et al., 2003).
The proportion of all genes encoding NBS-LRR in B. napus, B. rapa and B. oleracea are 0.58%,
0.60% and 0.75%, respectively, which is in line with estimates for other plant species that range
between 0.6- 1.8% (Meyers et al., 2003, Monosi et al., 2004, Ameline-Torregrosa et al., 2008,
Kohler et al., 2008, Yang et al., 2008). Thus, there does not seem to be correlation between genome
size and the number of NBS LRR genes. This is consistent with a previous study which suggested
that the relationship between total predicted gene number and total NBS-LRR gene number is likely
to be non-linear and not proportional to genome size (Porter et al., 2009).

80
The distribution and synteny of NBS-LRR genes in the A genomes of B. napus and B. rapa and C
genomes of B. napus and B. oleracea are consistent. Indeed, they are highly conserved in size and
orientation particularly region containing major gene clusters since 72% of these syntenic and
collinear genes in B. napus were located within gene cluster. The gene conservation and syntenic
relationship between sub-genomes has been found previously in other plants (Lagercrantz, 1998,
Grant et al., 2000, McCouch, 2001). However, loss of synteny for a gene cluster or presence of non-
orthologous genes in a local cluster suggests gene deletion, translocation or divergence in the B.
napus genome. This study also confirmed the absence or presence at the DNA level of gene clusters
by which a gene cluster is formed in B. napus, whereas there is no corresponding gene cluster in the
diploid genome of either B. rapa or B. oleracea in syntenic regions in the chromosomes.
Overall, these comparisons do not reveal significant deletion of NBS-LRR in B. napus as compared
to the diploid species. Thus, B. napus may have been subjected to less evolutionary selection or
pressure leading to maintaining NBS-LRR properties with its diploid progenitors.
3.5.2 Conservation analysis of B. napus NBS-LRR genes to its related diploid species B. rapa
and B. oleracea
The reciprocal best BLAST between the three genomes indicated that about 60% of NBS-LRR
genes were conserved and retained in the three Brassica species. These conserved orthologous
genes indicate that they have been maintained after polyploidisation. However, there could be an
underestimation in conserved orthologous genes due to the fact that reciprocal best BLAST counts
only once if a gene is duplicated. Previous studies on the fate of duplicated genes in polyploids
found that the duplicated resistance genes are preferentially lost after genome duplication, most
likely via a deletion mechanism (Nobuta et al., 2005, Yu et al., 2005, Yang et al., 2008). After
hybridisation of B. napus from B. rapa and B. oleracea, NBS-LRR genes in Brassica species
experienced species-specific gene deletion resulting in gene losses. A similar phenomenon of
redundant NBS-LRR gene loss has also been reported in other plant genomes presumably because
the duplicates would have redundant functions (Bancroft, 2001, Rana et al., 2004).
The duplicate genes were classified as resulting from polyploidization or post-speciation. Based on
their conservation and synteny, it can be difficult to distinguish among orthologs and paralogs
without extensive genome wide analysis. However, the results gave indication that a large number
of duplicated genes were originated via polyploidization from the ancestral species: B. rapa and B.
oleracea, while the tandemly duplicated genes were more likely produced by post speciation
duplications.

81
Gene conservation in syntenic region between B. napus and its related species: B. rapa and B.
oleracea suggests that orthologous copies are likely to retain their original function whilst, non-
orthologous genes in B. napus may have become specific or gained novel disease resistance. A
study by Yang et al. (2008) suggested that species specific NBS-LRR genes tend to be chromosome
specific and arranged in one or a small number of genomic cluster. In my study, the conservation
analysis revealed that there were more conserved NBS-LRR genes in gene clusters than singletons
suggesting that the chromosomal locations of NBS-LRR gene clusters show significant level of
conservation between B. napus and its related species: B. rapa and B. oleracea. In addition, this
also may suggest different evolutionary patterns for singleton and clustered NBS-LRR genes.
Further studies would be required to investigate whether the orthologous genes maintained in B.
napus show similar or divergent gene expression. In previous studies, gene expression data has
suggested that most duplicated NBS-LRR genes exhibited different expression patterns (Tan et al.,
2007, Cheng et al., 2012b).
The differences in NBS-LRR genes between the B. napus genome and its diploid species: B. rapa
and B. oleracea represent genes losses compared to B. rapa and B. oleracea as well as genes gained
in B. napus. The NBS-LRR genes reduction is expected in B. napus compared to B. rapa and B.
oleracea mainly due to gene losses via deletion during the polyploidization events. At the same
time, gene duplication and recombination have also created novel NBS-LRR resistance genes
specific to B. napus and have resulted in substitution of the gene number to compensate the gene
losses during formation of B. napus. A study by Yue et al. (2012) suggested that the NBS-LRR
gene number difference within species is either driven by gene losses or expansion through
duplication or divergence. Moreover, previous studies have shown evidence of gene loss and gain in
B. napus (Cho et al., 2010, Chalhoub et al., 2014). It could be speculated that the NBS-LRR genes
lost in B. napus suggested that these genes in B. rapa and B. oleracea might be species or disease
specific and have undergone different selection pressure to offer a novel resistance to same
pathogen or some pathogens for B. napus.
Together, the variation in NBS-LRR gene number between B. napus and the diploid species
indicates that only a single copy of some NBS-LRR genes may be conserved in the B. napus
genome, whilst the presence of resistance genes in B. napus and not the diploids may suggest
exposure to different pathogen stresses between the species, which has driven NBS-LRR genes
evolution. Furthermore, the differences in NBS-LRR gene numbers and conservation between B.

82
napus and its progenitors could be also attributed to genome mis-assembly and/or annotation
differences. Moreover, the cultivar specific differences are another factor affecting the NBS-LRR
variation as some NBS-LRR genes were present in one genotype but absent in another.
3.5.3 Comparative analysis of chromosomes A7 and C6 in B. napus
The number of NBS-LRR genes on chromosomes A7 and C6 between the three species were
consistent suggesting that they might have been maintained and not affected much during the
formation of B. napus.
Moreover, a comparative phylogenetic relationship of the NBS-LRR genes located on
chromosomes A7 and C6 in B. napus B. oleracea and B. rapa represents two major groups of TNL
and CNL genes from the three species. The phylogenetic comparison revealed that NBS-LRR
sequences from the three species are grouped together indicating that these are highly conserved
and suggests gene duplication from a common ancestral source of NBS-LRR genes. It also showed
that orthologous genes located in the homeologous chromosomes were likely found in the same
subgroups. This further confirmed that tandem duplication plays a major role in the duplication of
NBS-LRR genes. Thus, it appears that these NBS-LRR genes in B. rapa and B .oleracea may have
undergone similar selection pressure to offer novel resistance to same or different pathogen for B.
napus.
This study found several candidate NBS-LRR genes in B. napus that could confer resistance to
blackleg disease caused by L. maculans, the most devastating fungal pathogen of B. napus. These
genes were conserved orthologous genes in B. rapa and shared a duplicated copy in both
chromosomes A7 and C6 suggesting chromosomal duplication or rearrangements of this region. An
interesting NBS-LRR cluster on B. napus A7 and B. rapa A7 associated with candidate resistance
genes was identified. Further comparison analyses are discussed in more details later in chapter 5.

83
Chapter 4
Association and localization of NBS-
LRR genes with disease resistance
QTL in Brassica napus

84
Chapter 4 : Association and localization of NBS-LRR genes with disease
resistance QTL in Brassica napus
*This chapter contributed towards a paper being submitted
4.1 Abstract
The availability of the genome sequence and disease resistance NBS-LRR genes, together with
linked or flanking markers and QTL genetic maps, provide an efficient strategy to examine the
characteristics of QTL intervals. The association and co-localization between NBS-LRRs and
disease resistance QTL is a common feature of plant genomes. Here, this chapter presents the study
of the association and correlation between disease resistance QTL intervals and the NBS-LRR
resistance genes in Brassica napus.
A total of 27 QTL intervals for qualitative resistance to clubroot, downy mildew and blackleg
disease resistance traits in B. napus were identified and classified into primary and homeologous
QTL intervals. It also indicated that the QTL intervals in B. napus were originally contributed by
the parental species: B. rapa and B. oleracea. The identified QTL intervals appeared to co-localize
with NBS-LRR genes. There was a significant correlation between the number of NBS-LRR genes
within the QTL intervals and the number of genes involved in gene clusters. These gene clusters
and duplicated genes were likely to be associated with QTL.
The results provide evidence that NBS-LRR gene clusters are associated with disease resistance
QTL. The comparative analysis of disease resistance QTL between B. napus and its related species
reveal the structural conservation of NBS-LRR genes and provide a set of candidate resistance
genes. Further investigation of the similarity/divergence in sequence and gene content of these
QTLs will help elucidate their conservation and evolution.
85
4.2 Introduction
In the three major cultivated Brassica species, B. napus B. rapa, and B. oleracea, clubroot (caused
by Plasmodiophora brassicae), downy mildew (caused by Hyaloperonospora Parasitica) and
blackleg (caused by Leptosphaeria maculans) diseases have become an increasing problem causing
heavy yield losses to Brassica crops world-wide and have been a major focus in Brassica disease
resistance research (Delourme et al., 2011).
Genetic studies have identified the gene for gene interactions between Avr genes in L. maculans and
their corresponding Rlm (Resistance to Leptosphaeria maculans) genes in B. napus. All the
blackleg resistance genes identified to date have been found on the A genome of B. napus, with
none found on the C genome (Rouxel et al., 2003b, Ananga et al., 2006, Leflon et al., 2007). In
addition, genetic mapping studies have shown that all blackleg resistance genes in B. napus are
organised in clusters in two genomic regions: the Rlm2 resistance gene on chromosome A10 (Pilet
et al., 2001) and five specific resistance genes: Rlm1, Rlm3, Rlm4, Rlm7, and Rlm9 on chromosome
A7 (Delourme et al., 2004, Mayerhofer et al., 2005). It remains unclear whether these genes are a
cluster of tightly linked genes, or a single gene with different alleles, or a combination of both
(Delourme et al., 2004). Other blackleg resistance genes have also been identified on the A genome
of B. rapa: LepR1 on chromosome A2 and LepR2 on chromosome A10 (Yu et al., 2005) , LepR3 on
chromosome A10 (Li and Cowling, 2003, Larkan et al., 2014) and BLMR1 and BLMR2 on
chromosome A10 (Long et al., 2011). Recently, the first blackleg resistance gene in Brassica,
LepR3, has also been cloned in B. napus lines with introgressions from B. rapa ssp. Sylvestris
(Larkan et al., 2013).
Different sources of resistance to clubroot have been found in B. oleracea, B. rapa and B. napus
(Hirai, 2006, Diederichsen et al., 2009). At least eight clubroot resistance loci have been identified
in B. rapa and allocated to five different chromosomes: Crr1 on A8, Crr2 on A1, Crr4 on A6
(Suwabe et al., 2006), CRc on A2 (Sakamoto et al., 2008), CRa, CRb , CRk and Crr3 on A3 (Piao
et al., 2004, Saito et al., 2006, Hayashida et al., 2008, Sakamoto et al., 2008). In B. oleracea,
various QTL have also been reported (Landry et al., 1992, Figdore et al., 1993, Grandclément and
Thomas, 1996, Voorrips et al., 1997, Moriguchi et al., 1999, Rocherieux et al., 2004, Nomura et al.,
2005). Recently, two major QTL: PbBo(Anju)1 and PbBo(Anju)3 on chromosomes C2 and C3,
respectively, and other QTLs with minor effects have been identified (Nagaoka et al., 2010). This
study also showed that the B. rapa chromosomal regions harbouring B. rapa clubroot resistance
gene specific markers are homologous to the corresponding region of B. oleracea.
86
Several major qualitative resistance loci to downy mildew have been identified in Brassica species.
In B. oleracea, four resistance loci have been identified: Pp523 on chromosome C8(Farinhó et al.,
2004, Farinhó et al., 2007, Carlier et al., 2011, Carlier et al., 2012), the dominant single locus Ppa3
(Singh et al., 2012), downy mildew resistance locus Dm (Giovannelli et al., 2002) and
PpALG1(Alabaça, 2009). In B. rapa, three resistance loci were found, BraDM on chromosome A8
(Yu et al., 2009, Li et al., 2011, Yu et al., 2011b), the BrRHP1 locus on chromosome A1 (Kim et
al., 2011) and candidate resistance gene locus RPP13MK on chromosome A9 (Yu et al., 2010). In
addition, multiple sources of resistance have been reported in B. napus (Nashaat et al., 1997, Ge et
al., 2008).
Although numerous disease resistance QTL and qualitative genes mapped as QTL have been
identified, isolating and cloning a gene underlying the QTL/gene mapped region is relatively
difficult through map based cloning because the QTL region is still large and often not tightly
linked to the candidate gene(s). This is often further complicated by the complexity of the genomic
region due to duplication and rearrangement events. The availability of functional genome
annotations makes it possible to investigate the association and distribution between NBS-LRR
resistance genes and disease resistance QTL. The association of qualitative resistance (R) genes or
major resistance genes and QTL has been widely noted (Gebhardt and Valkonen, 2001, Quint et al.,
2003, Wisser et al., 2005). Candidate NBS-LRR resistance genes were previously found to be co-
localized with disease resistance QTL such as barley, potato and apple (Ramalingam et al., 2003,
Calenge et al., 2005, Bakker et al., 2011). Therefore, the significant co-localization of NBS-LRR
and QTL provide an excellent template for further studies of the involvement of NBS-LRR with
disease resistance QTL and genetic mapping of qualitative genes in B. napus.
The genetic maps are an important component representing sets of inherited DNA markers in
relation to the position of a gene conferring a trait. In contrast, the physical gene mapping
determines the location and function of a gene on a chromosome and its relative distance to the
QTL. Thus, genomic approaches can be used to analyse the disease resistance QTL using a
homology search. The sequence information and genome position of markers linked to, or flanking,
the previously reported QTL can be used to identify the physical boundaries of the QTL region onto
genome chromosomal maps. This allows narrowing down the size and position of the QTL to a
small genomic region in which candidate genes can be found based on the genome wide
identification of disease resistance NBS-LRR genes. Once the physical distance of the QTL and
flanking markers are determined, the correlation or association between a given disease’s QTL
regions and the associated NBS-LRR genes is further studied to enable prioritization and selection
of potential NBS-LRR candidate genes. Additionally, NBS-LRR genes associated with the QTL

87
physical and flanking markers can be used as a comparative approach to study the conservation and
syntenic regions between B. napus and its progenitor species, B. rapa and B. oleracea.
This chapter describes the physical location identification of disease resistance QTL intervals for
three important disease resistance traits in B. napus: blackleg, clubroot and downy mildew. It also
presents the physical association between QTL intervals and the numbers of NBS-LRR genes to
address the question whether the clustered and duplicated NBS-LRR genes are structurally and
functionally relevant to disease resistance QTL characteristics. If the clustering of functionally
related disease resistance genes occurred within QTL as a result of evolutionary mechanisms such
as duplication and divergent selection pressure, it is possible that the NBS-LRR gene/cluster
associated with QTL contributes to genetic variation and is under selection for the functional
conservation.

88
4.3 Methods
4.3.1 Brassica reference genome sequences
The genome sequence and annotation of B. napus cv. Darmor v6 was used as the reference genome
(Chalhoub et al., 2014). The genome sequence of B. rapa v3.0 (Wang et al., 2011) and B. oleracea
cv. To1000 v1.0 (Parkin et al., 2014) were also used for comparative analysis. The NBS-LRR gene
annotation and identification was described previously in chapters 2 and 3.
4.3.2 Identification of QTL intervals in B. napus by marker homology BLAST search
To identify the location of QTL intervals on the genome, available marker data and sequences were
retrieved from previously published studies (Tables 4.1, 4.2 and 4.3). These sequences were used
to perform homology searches against the reference genomes using BLAST (maximum E-value 1E-
1) (Altschul et al., 1997). Markers with 100% identical sequence alignments, with over 90%
coverage and that each marker of a QTL region were placed on the same chromosome
corresponding to the genetic map were selected. If the markers could not be placed on the
chromosome, or had no BLAST hit, they were discarded from the analysis.
The physical position of each marker was assigned based on the BLAST hit position of the marker
sequences against the reference genomic sequence. The genetic locations of associated QTL
intervals were estimated based on the distance between linked or flanking markers. For each QTL
interval, any NBS-LRR genes located within the markers flanking the QTL interval were
considered associated and included in the analysis. The correlation between the number of NBS-
LRR genes and disease QTL intervals was analysed using linear regression in Microsoft Excel.
For co-mapping the QTL intervals between B. napus and its progenitor species, B. rapa and B.
oleracea, the BLAST searches of the QTL linked or flanking markers with respect to their physical
hit locations, order and coverage were compared between them. A syntenic region in B. rapa and B.
oleracea was characterized by marker locations present in the same chromosome and in the same
order as in B. napus.

89
4.4 Results
4.4.1 Identification and localization of QTL intervals in B. napus
The genetic mapping studies (Piao et al., 2009, Delourme et al., 2011) indicated the presence of
several resistance genes for clubroot and downy mildew in the Brassica A and C genomes with
most of these genes showing race specificity. Similarly, blackleg resistance is controlled by a major
gene for gene interaction and the resistance is contributed by the Brassica A genome. Thus, these
identified QTL intervals are for qualitative resistance controlled by major resistance genes that have
been identified in B. napus, B. rapa or B. oleracea.
A number of flanking, or linked, markers of these disease resistance QTL for qualitative genes in
the three species: B. napus, B. rapa, and B. oleracea, were utilized to determine the physical
location of QTL intervals on the B. napus genome. The QTL flanking or linked markers were
initially screened by BLAST homology searches to locate their physical positions on the genome,
then, the location of QTL intervals on the genome were estimated.
A total of 27 QTL intervals for qualitative resistance to clubroot, downy mildew and blackleg in B.
napus were identified. The number of QTL detected ranged from 12 QTL intervals for clubroot and
downy mildew and three QTL intervals for blackleg (Tables 4.1, 4.2 and 4.3). The distribution of
these QTL was found across all 19 of the B. napus chromosomes except A4, A5 and C6. The length
of the QTL intervals ranged from 0.7 to 23 Mbp with the majority (66 %) of the identified QTL
intervals less than 2.8 Mbp in length (Table 4.4).
Twelve QTL intervals involved in clubroot resistance were identified in B. napus (Table 4.1 and
Figure 4.1). These QTL intervals corresponded to the eight and two clubroot resistance loci which
have been identified in B. rapa and B. oleracea, respectively. These 12 QTL intervals were
classified into eight primary QTL intervals corresponding to their respective genetic maps and four
homeologous QTL intervals due to the amphidiploid nature of B. napus. The eight primary QTL
intervals in B. napus are Crr1 on chrA8, Crr2 on chrA1, Crr3 and CRk on chrA3, CRa and CRb on
chrA3, Crr4 on chrA6, CRc on chrA2, pbBo(Anju)1 on chrC2 and PbBo(Anju)3 on chrC3 (Table
4.1). The four homeologous QTL intervals in B. napus are Crr3 on chrC3, Crr4 on chrC6, CRa and
CRb on chrC7 and pbBo(Anju)1 on chrA2 (Table 4.1). The primary Crr3 QTL is overlapping with
the primary CRk QTL, so they are considered as one primary QTL for both Crr3 and CRk locus.
The primary and homeologous CRa QTL are overlapping with the primary and homeologous CRb
QTL, so they are considered as one primary QTL and one homeologous QTL for both CRa and CRb
locus.

90
Likewise, 12 QTL intervals involved in downy mildew resistance were identified in B. napus
(Table 4.2 and Figure 4.1). These QTL intervals were corresponding to the three mildew
resistance loci which have been identified each in B. rapa and B. oleracea. These QTL intervals
were also classified into seven primary QTL intervals and five homeologous QTL intervals. The
seven primary QTL intervals in B. napus are BraDM on chrA8, RPP13MK on chrA9, BrRHP1 on
chrA1, two Pp523 on chrC8 and PpALG1 on chrC4 and Dm on chrC2 (Table 2). The five
homeologous QTL intervals in B. napus are RPP13MK on chrC9, two BrRHP1 on chrC1, two
Pp523 on chrA9 (Table 4.2). The BrRHP1 locus had two homeologous QTL intervals separated by
a region of ~14 Mbp, so they are considered as two separate QTL intervals. The Pp523 locus had
two primary QTL intervals and two homeologous QTL intervals separated by a 19 Mbp region, so
they are considered as two separate QTL intervals.
The flanking markers search and QTL intervals for blackleg resistance was restricted only to the A
genome of B. napus because genetic mapping studies showed that all blackleg resistance genes are
found on the A genome (Rouxel et al., 2003b, Ananga et al., 2006, Leflon et al., 2007). In addition,
the homology search of flanking, or linked markers for the blackleg Rlm QTL revealed that the
flanking markers showed good correspondence between the A genome of B. napus and B. rapa.
However, the flanking markers did not show sequence and collinear similarity between the A and C
genome of B. napus and some markers even failed to be located in the C genome. As a result, the
flanking marker analysis in the C genome of B. napus was not considered in this study.
Hence, three QTL intervals involved in blackleg resistance were identified in the A genome of B.
napus (Table 4.3 and Figure 4.1). These three QTL intervals were small QTL intervals on
chromosome A2 for resistance loci, LepR1, major QTL on chromosome A7 for resistance genes:
Rlm1, Rlm3, Rlm4, Rlm7, and Rlm9 and major QTL on chromosome A10 for resistance genes:
LepR3, BLMR1 and BLMR2. The Rlm2 and LepR2 genes could not be mapped in this study because
there was no available markers sequence. The LepR2, LepR3, BLMR1 and BLMR2 genes were
identified in B. rapa. However, the B. napus genome might harbour orthologous genes for LepR2,
LepR3, BLMR1 and BLMR2 located in the same position in B. rapa.
The overlapping QTL intervals were identified as the QTL flanking markers were found to overlap
by their physical position and order on the genome. For example, clubroot primary and
homeologous QTL intervals for resistance loci CRa and CRb were overlapping in the A and C
genome of B. napus. Furthermore, clubroot QTL intervals for resistance loci Crr3 and CRk were
overlapping in the A genome but only the Crr3 locus showed homeologous QTL intervals in the C
genome.

91
The QTL intervals for downy mildew BrRHP1 had primary QTL intervals in the A genome of B.
napus and two adjacent homeologous QTL intervals separated by a region in the C genome.
Similarly, QTL intervals for downy mildew for Pp523 had two adjacent primary QTL intervals in
the C genome of B. napus and two adjacent homeologous QTL intervals separated by a region in
the A genome.
The co-mapping of the flanking markers of QTL intervals were performed to compare the syntenic
relationship between B. napus and its progenitor species. The physical distance of flanking markers
and location of the QTL intervals between B. napus and B. rapa and B. oleracea were mostly
consistent. Almost all QTL intervals identified in B. napus were co-mapped and contributed by the
progenitor species. However, there were several QTL intervals only co-mapped to either the A or C
sub-genome B. napus and its corresponding genome in the related species. For example, the
clubroot loci, Crr1 and Crr2 had only primary QTL intervals in the A genome of B. napus and they
co-mapped to the A genome of B. rapa.

92
Table 4.1: Marker homology search of clubroot resistance QTL flanking or linked markers for identification of QTL intervals in B. napus
Origin species
Gene or locus
Flanking marker
Marker homology search, Chromosome and QTL interval region (Mbp)
References B. napus v6
primary B. napus v6
Homeologous B. rapa v3 B. oleracea v1
B. rapa
Crr1
BRMS-088 BRMS-297 BRMS-173
chrA8 (9,157,719 -12,043,127)
No XA8 (9,066,423 -11,186,261)
No (Suwabe et al., 2003, Suwabe et al., 2006, Suwabe et al., 2012)
Crr2
BRMS-096 BRMS-056 BRMS-100 BSA3
chrA1 (4,791,456 -6,335,486 )
No XA1 (4,934,358 -6,345,669)
No (Suwabe et al., 2003, Suwabe et al., 2006, Nagaoka et al., 2010)
Crr3*
BRMS058 BrSTS-54 BrSTS-20 BrSTS-44 BrSTS-41 BrSTS-33 OPC11-2S BrSTS-61 BrSTS-78 BrSTS-26 BN308CAPS BN142CAPS OPC11-1S BRMS206
chrA3 (14,411,852 -18,264,109)
chrC3 (22,088,816 -24,102,086)
XA3 (14,571,901 -18,141,486)
C3 (21,404,891 -23,862,433)
(Hirai et al., 2004, Saito et al., 2006, Nagaoka et al., 2010)
Crr4 BRMS-125 BRMS-101 BRMS-027
chrA6 (100,821 - 2,122,156)
chrC6 (9,621,029 -3,923,239)
XA6 (322,565 -1,915,926 )
C6 (31,002,743 -35,909,761)
(Suwabe et al., 2006, Sakamoto et al., 2008)
CRa**
HC352b-SCAR GC2360 SC2930
chrA3 (24,281,973 -25,363,967)
chrC7 (43,472,000 -44,774,737)
XA3 (8,639,804 -7,449,703)
C7 (41,356,755-42,582,200)
(Sakamoto et al., 2008, Matsumoto et al., 2012)

93
HC181
CRb**
TCR05 KBrH059N21F KB59N07 B1210 B1005 KBrH129J18R TCR09 KBrB091M11R TCR02-F
chrA3 (24,657,890 – 26,478,686)
chrC7 (43,811,909 – 45,640,146)
XA3 ( 6,596,824- 8,359,700)
C7 (41,700,554 – 43,396,450)
(Piao et al., 2004, Kato et al., 2012, Kato et al., 2013)
CRc
PW155
BRMS-082
m6R
BRAS011
B50
chrA2 (12,021,130 – 23,656,219)
No XA2 (11,817,414-21,197,733)
No (Sakamoto et al., 2008, Matsumoto et al., 2012)
CRk* HC688
BRMS-158
chrA3 (16,540,113 -19,198,438)
No XA3 (17,852,750 -15,564,520)
No (Sakamoto et al., 2008, Matsumoto et al., 2012)
B. oleracea pbBo(Anju)1
pW176
KBrH059L13R
BRMS-228
chrC2 (51,280,390-54,799,276)
chrA02 (26,445,222-28,289,273)
XA2 (24,048,282-25,751,675)
C2 (47,638,250-50,630,426)
(Nagaoka et al., 2010)
PbBo(Anju)3
BRMS-330
KBrH008J04R
BRMS-008
chrC3 (2,031,456 -3,680,316)
No XA3 (30,530,122 -32,176,756)
C3 (2,048,895 -3,655,161)
(Nagaoka et al., 2010)
(*)The primary Crr3 QTL is overlapping with the primary CRk QTL, so they are considered as one primary QTL for both the Crr3 and CRk locus.
(**) The primary and homeologous CRa QTL are overlapping with the primary and homeologous CRb QTL, so they are considered as one
primary QTL and one homeologous QTL for both the CRa and CRb locus.

94
Table 4.2: Marker homology search of downy mildew resistance QTL flanking or linked markers for identification of QTL intervals in B. napus
Origin species
Gene or locus
Flanking marker
Marker homology search, Chromosome and QTL interval region (Mbp)
References
B. napus v6 primary
B. napus v6 Homeologous
B. rapa v3 B. oleracea
v1
B. rapa BraDM SCAR SCK14-825 K14-1030 kbrb058m10-1 Brh019-SNP137 Brb062-Indel230
Brb094-DraⅠ787 kbrb006c05-2 Ol12G04
Brb043-BglⅡ715
Brb094-AatⅡ666
chrA8 (17,655,647 – 18,527,339)
No XA8 (3,003,191 – 3,715,750 )
No (Yu et al., 2009, Li et al., 2011, Yu et al., 2011b)
RPP13MK RPP13MK marker chrA9 3,964,312
chrC9 5,472,171
XA9 35,017,366
C9 6,297,979
(Yu et al., 2010)
BrRHP1* A03 SCAR N18 SCAR M05 SCAR BrPERK15A SCAR BrPERK15B SCAR J11 SCAR G17 SCAR M22 SCAR]
chrA1 (11,636,716 -28,936,570)
chrC1 (18,207,518 – 23,807,810) and chrC01 (37,139,336 -46,454,126)
XA1 (9,119,600 – 24,979,656)
C1 (17,054,176–17,059,862) and (32,805,430- 42,695,072)
(Kim et al., 2011)
B. oleracea Pp523** CB10139 159G23_R 33N5_R 24H17_R
chrC8 (23,172,112) and chrC08
chrA9 (30,451,080 ) and chrA09 (42,648,154 –
XA9 (149,523- 1,595,774)
C8 (38,878,775 – 41,519,284)
(Farinhó et al., 2004, Farinhó et al., 2007, Carlier et al., 2011, Carlier et al., 2012)

95
AGC.CAT_300(SCAFB1) AAG.CTA_113 CB10028 OPR15_920 (SCR15) OPJ19_550 (SCJ19) OPK17_980 SCAR AT.CTA 133/134
(42,851,417 – 44,412,664)
43,351,988)
PpALG1 OPU20_1307 ScJ18_530 ScK04_434 OPK04 667 OPU20_970y OPT08_1112y ScAN12
chrC4 (14,179,370 – 37,643,262)
No No C4 (13,684,813- 24,945,714)
(Alabaça, 2009)
Downy mildew resistance locus Dm
UBC359620
OPM16750 chrC2 (54,044,677 -54278743)
No No C2 (50,021,049-50,193,751)
(Giovannelli et al., 2002)
(*) The BrRHP1 locus had two homeologous QTL intervals separated by a region of ~14 Mbp, so, they are considered as two separate QTL intervals.
(**) The Pp523 locus had two primary QTL intervals and two homeologous QTL intervals separated by a 19 Mbp region, so they are considered as
two separate QTL intervals.

96
Table 4.3: Marker homology search of blackleg resistance QTL flanking or linked markers for identification of QTL intervals in B. napus
Origin species
Gene or locus
Flanking marker
Marker homology search Chromosome and QTL interval region (Mbp)
References B. napus v6 A genome
B. rapa v3
B. rapa
LepR1 BnGMS254 BRMS-215
chrA2 (808,646 -2,314,919)
XA2 (3,976,187-3,052,782)
(Yu et al., 2005, Yu et al., 2008)
LepR3 Ind10-04 Ind10-17 Ind10-12 Ind10-13 Ind10-08 Ind10-07 Ind10-03
chrA10 (16,001,480 -16,265,343)
XA10 (3,096,287 -3,422,354)
(Larkan et al., 2013)
BLMR1 1128BG275 87B10a 9B23c 9B23a 9B23b 80A08a 80E24
chrA10 (13,961,320 – 16,241,031)
XA10 (2,600,133- 4,586,316)
(Long et al., 2011)
BLMR2 G278 10B23a 12D09a 1J13a 1J13b R278
chrA10 (10,781,132 – 13,515,501)
XA10 (6,989,137- 9,650,582)
(Long et al., 2011)
B. napus
Rlm gene cluster Rlm9, Rlm4, Rlm7 and Rlm1
chrA7 (10,985,714 – 25,262,138)
XA7 (6,721,636 – 22,178,571)
(Delourme et al., 2004, Leflon et al., 2007, Raman et al., 2012b)
Rlm9 BnGMS665 CB10450
chrA7 (12,963,123– 14,389,391)
XA7 (8,889,906 – 9,867,760)

97
BRAS023
Rlm4 BRMS075 Na12-E11b BRMS040 BRMS005b
chrA7 (14,214,108 -15,000,000)
XA7 (9,728,451 – 10,819,936)
Rlm7 na14B03 chrA7 15,894,933
XA7 13,033,236
Rlm1 kbrh143h15 bn204 na12-a02 ra2-a05
chrA7 (22,005,183- 25,262,138)
XA7 (16,180,246 – 19,196,267)

98
Figure 4.1: The location of disease resistance loci QTL in the chromosomal map of B. napus. The
disease resistance loci QTL indicated clubroot (red), downy mildew (black) and blackleg (green).
The number within brackets shows the QTL interval size in Mbp. The “h” means that the QTL
intervals are homeologous. Brackets are not to scale the distance but to indicate the relative location
of genes within QTL interval.

99
4.4.2 Co-localization and association of NBS-LRR genes and QTL intervals
The co-localization of the disease resistance NBS-LRR genes and the QTL intervals on each
chromosome were examined and correlated with the NBS-LRR genes clusters and duplications.
Based on the findings by (Kang et al., 2012) that QTL and NBS-LRR genes tended to be co-
localized and NBS-LRR genes are often positioned in the 2 Mbp flanking regions of a QTL, all the
NBS-LRR genes located in the QTL, including the 2 Mbp flanking regions were considered
associated NBS-LRR genes and included in the analysis.
The number of NBS-LRR genes associated with the QTL intervals ranged from 1 to 19, from a total
number of 232 genes in all the QTL intervals (Table 4.4). Approximately 40% of the associated
NBS-LRR genes are involved in a gene cluster, 58% are duplicates and 62% are conserved between
B. napus and its related species (Table 4.4). The number of associated NBS-LRR genes was
variable between primary and homeologous QTL intervals. For instance, downy mildew BrRHP1
contained 19 NBS-LRR genes in the primary QTL intervals and 12 NBS-LRR genes in the
homeologous QTL intervals.
Regression analysis showed that there are significant correlations between the number of NBS-LRR
genes within the QTL intervals and the number of genes involved in gene clusters or duplication
(Figure 4.2 and 4.3). The R2
value of 0.84 and 0.80 for the correlation of number of genes involved
in gene clusters or duplications was observed, respectively.

100
Table 4.4: Correlation between the number of NBS-LRR resistance genes and disease resistance QTL intervals in chromosomes of B. napus
Chromosome
Total No. of NBS LRR
genes
Number of QTL
QTL Disease resistance loci
in B. napus
Physical interval, Size and location (Mbp)
No. of NBS LRR
within 2 Mbp
flanking region of QTL
Gene cluster
No. of genes in cluster
No. of duplicate
genes
No. of conserved
genes
chrA1 28 2 clubroot Crr2
1 Mbp (4,791,456 -6,335,486)
3 0 0 3 3
downy mildew BrRHP1
17 Mbp (11,636,480 -28,936,570)
19 1 4 11 9
chrA2 44 3
blackleg lepR1 1.5 Mbp
(808,646 -2,314,919) 10 1 7 5 7
clubroot Crc 11.5 Mbp
(12,021,130 -23,656,219) 19 2 14 11 12
homeologous clubroot
pbBo(Anju)1
1.8 Mbp (26445222 -28289273)
14 1 7 6 6
chrA3 24 2
clubroot Crr3 and CRk
4.7 Mbp (14411852 -19198438)
8 1 4 5 4
clubroot CRa and CRb
2 Mbp (24281973 -26478686)
7 0 0 5 4
chrA6 21 1 clubroot Crr4 2 Mbp
(100,821 -2,122,156) 8 0 0 7 4
chrA7 19 4
Blackleg gene cluster Rlm3 Rlm9 Rlm4 Rlm7 Rlm1
14 Mbp (10,985,714 -25,262,138)
12 1 4 7 8
chrA8 24 2 clubroot Crr1 2.8 Mbp
(9,157,719- 12,043,127) 5 0 0 4 3

101
downy mildew BraDM
809 kbp (17,718,157- 18,527,908)
9 1 3 5 4
chrA9 58 2
downy midlew RPP13MK
3,964,312 3 1 3 3 2
homeologous downy mildew
Pp523
30,451,080 And
703kbp (42,648,154- 43,351,988)
15 2 10 13 10
chrA10 11 1 blackleg BLMR2
, BLMR1 and lepR 3
6 Mbp (10,781,132- 16,770,124)
10 0 0 5 5
chrC1 37 2 homeologous downy mildew
BrRHP1
5 Mbp (18,781,127- 23,808,081)
and 9 Mbp
(37,139,336 – 46,454,793)
12 1 4 6 8
chrC2 51 2
Clubroot pbBo(Anju)1
51,280,390 1 0 0 1 1
Downy mildew resistance locus Dm
54,278,743 1 0 0 1 1
chrC3 56 2
clubroot PbBo(Anju)3
1.6 Mbp (2,031,456- 3,680,316)
9 1 5 4 6
homeologous region to Crr3
2 Mbp (22,088,816- 24,102,086)
1 0 0 1 1
chrC4 18 1 downy mildew
PpALG1 23 Mbp
(14,179,370- 37,643,262) 10 0 0 2 7
chrC6 44 1 homeologous region to Crr4
5 Mbp (3,923,239- 9,621,029)
12 1 7 10 7
chrC7 38 1 homeologous region to CRa
and CRb
1.3 Mbp (43,472,000- 44,774,737)
13 1 6 6 12
chrC8 39 2 downy mildew
Pp523 23,172,112
and 27 3 16 12 17

102
837 kbp (42,851,417- 44,412,664)
chrC9 79 1 homeologous
RPP13MK 5,472,171 4 0 0 3 3
Total 591 29 -------- ----------------- 232 18 94 (40%) 136(58%) 144(62%)

103
Figure 4.2: The correlation between the number of NBS-LRR genes within the 2Mbp flanking
regions of QTL and the number of NBS-LRR genes involved in gene clusters

104
Figure 4.3: The correlation between the number of NBS-LRR genes within the 2Mbp flanking
regions of QTL and the number of duplicated NBS-LRR genes.

105
4.5 Discussion
4.5.1 Identification and localization of QTL intervals in B. napus
Several mapping studies have previously identified QTL for diseases such as blackleg, clubroot and
downy mildew in B. napus, B. rapa and B. oleracea. The availability of linked or flanking markers
and QTL genetic maps, together with the genome sequence and disease resistance NBS-LRR genes,
provide an efficient strategy to examine the characteristics of QTL intervals. This allows
identification and determination of the physical locations of these QTL intervals, based on the
physical location of marker information against the B. napus genome. Ultimately, this results in a
comprehensive co-localization of disease resistance QTL intervals and their association with NBS-
LRR genes in B. napus.
A total of 27 QTL intervals for major resistance genes for clubroot, downy mildew and blackleg
disease resistance traits were identified in B. napus. These QTL intervals are distributed throughout
the genomes. The number of identified QTL intervals in B. napus was 12, 12 and three for
resistance for clubroot, downy mildew and blackleg, respectively.
The QTL intervals identified in B. napus were classified into primary QTL intervals and
homeologous QTL intervals. The primary QTL intervals correspond to similar locations on the
respective genetic maps whereas homeologous QTL intervals are due to the polyploid genome in B.
napus and genome duplication (Li et al., 2013). Given that B. napus originated from two highly
conserved diploid genomes of B. rapa and B. oleracea, the relationships between homologous
regions of QTL or major resistance genes can support the inheritance pattern of the resistance traits.
Therefore, it could be hypothesized that B. napus has retained the homeologous QTL intervals
inherited from the ancestral species: B. rapa and B. oleracea. This is also seen by (Lestari et al.,
2013) showing that the major QTL for soybean seed protein and oil in Chr20 had duplicated
homeologous regions in Chr10 that occurred due to duplication event. Therefore, the primary and
homeologous QTL intervals on different chromosomes might result from genome duplication and
then undergo rapid divergence and reorganization. The primary and homeologous QTL in B. napus
could also correspond to a homeologous region in either B. rapa or B. oleracea. For this reason, the
present study assumed that these two QTL are produced by polyploidization.
Interestingly, there were differences in the number of associated NBS-LRR genes and the QTL
interval sizes between primary and homeologous QTL intervals. This emphasizes that the
polyploidy and genome rearrangements might have a major impact on the structure of QTL interval
and the contribution to disease resistance.

106
Overlapping QTL intervals for several resistance loci were found. For instance, four overlapping
QTL intervals for blackleg resistance genes Rlm9, Rlm7, Rlm4 and Rlm1 were on chromosome A7
of B. napus (Delourme et al., 2004). In addition, these QTL are located within an extensive intra-
chromosomal tandem duplication region (Raman et al., 2012b, Tollenaere et al., 2012). If a QTL
overlapped with other QTL identified from different research, this region could contain a potential
cluster of genes or allelic variants with resistance to different pathogen races.
Co-mapping of QTL intervals identified in B. napus to its related species, B. rapa and B. oleracea
were performed for identifying genomic syntenic relationships. I found that most QTL intervals co-
mapped between B. napus and the corresponding species. This is an indication that the QTL
intervals in B. napus were originally contributed by the parental species. Synteny and conservation
between the B. napus, B. rapa and B. oleracea genome has been previously established (Parkin et
al., 2003, Rana et al., 2004, Jiang et al., 2011, Chalhoub et al., 2014). The comparative QTL
intervals between B. napus, B. rapa and B. oleracea revealed the majority of NBS-LRR genes in
associated QTL intervals are conserved suggesting that the QTL underlying these resistance traits
might show some structural and functional conservation. A study by Jiang et al. (2011) also found
that the QTL region for seed oil, total seed glucosinolates, and seed protein content were conserved
between the A sub-genome of B. rapa and B. napus.
The primary and homeologous QTL intervals in B. napus which existed in syntenic region between
the sub-genomes were originally derived from the genomic region of the ancestral genome and
distributed into two different genomic regions following genome hybridization. Werner et al. (2008)
has suggested that a resistance locus controlled by a major gene in the progenitor genome might
have been duplicated to give rise to two functionally different genes. Alternatively, a resistance
locus containing a cluster of genes within the progenitor genome may have separated into two
different genomic regions due to major chromosomal rearrangements. This further supports our
finding that the primary and homeologous QTL intervals on different chromosomes of B. napus
might result from genome rearrangement and duplication.
I also observed several QTL intervals in the B. napus sub-genome that had no counterpart QTL
intervals in the corresponding sub-genome of either A or C genome. However, they were
corresponding to either the A genome of B. rapa or C genome of B. oleracea. This indicates that the
two ancestral species are not likely to share disease resistance QTL. These could be species-specific
QTL.

107
Taken together, it is interesting to observe how the syntenic QTL intervals regions between B.
napus and its related species B. rapa and B. oleracea show similar gene content, sequence and
structural similarities of NBS-LRR genes. This would further assist in understanding their
conservation and evolution on the diversity of NBS-LRR genes.
4.5.2 Co-localization and association of NBS-LRR genes and QTL intervals
After the identification of QTL intervals, the association and co-localization between the QTL
intervals for disease resistance loci and NBS-LRR genes was analyzed. In this study, I found that
the identified QTL intervals for the three resistance traits appeared to co-localize with NBS-LRR
genes. The total number of NBS-LRR genes associated with the QTL intervals was 239 genes
representing approximately 37% of the total NBS-LRR genes in B. napus. This suggests that, as
expected, localization of QTL intervals for major resistance genes are correlated with the presence
of disease resistance genes. A similar co-localization between disease resistance QTL and NBS-
LRR resistance genes has been found in other plants (Kang et al., 2012, Wei et al., 2013). For
example, QTL resistance loci were found to be co-localized with NBS-LRR resistance genes and
resistance gene analogues (RGAs) in common bean (Geffroy et al., 2000), apple (Calenge et al.,
2005), Barley (Madsen et al., 2003) and potato (Bakker et al., 2011). Therefore, the association and
co-localization between NBS-LRRs and QTL disease resistance loci is a common feature of plant
genomes.
Furthermore, the correlation between NBS-LRR gene cluster and duplication within the 2 Mbp
flanking region of QTL intervals was studied. The majority of QTL intervals harbor NBS-LRR
gene clusters. There was a significant correlation and co-localization between the number of NBS
LRR genes within the QTL intervals and the number of genes involved in gene clusters or
duplication. This is consistent with previous studies which found QTL located in a resistance gene-
rich region harbouring NBS-LRR gene clusters which, confer resistance to a number of different
pathogens (Jeong et al., 2001, Wang et al., 2010).
A clustered region of NBS-LRR genes were found to be co-located with different QTL conferring
fungal resistance in soybeans (Kang et al., 2012). Moreover, synteny analysis between B. rapa and
Arabidopsis revealed that two clubroot resistance loci: Crr1 and Crr2, overlap and align to a region
in chromosome 4 of Arabidopsis (Suwabe et al., 2006). This region in Arabidopsis was previously
identified as containing clusters of disease resistance genes (Speulman et al., 1998). For example,
RPP5 for resistance to downy mildew pathogen Peronospora parasitica and RPS2 for resistance to
Pseudomonas syringae (Bevan et al., 1998, Suwabe et al., 2012).

108
The correlation and association of NBS-LRR genes in the B. napus genome were apparent between
gene clusters and QTL intervals to a particular disease resistance. The duplicated NBS-LRR genes
are also retained in disease resistance QTL suggesting that genes involved in tandem duplication
raise the likelihood of creating redundant NBS-LRR genes underlying QTL resistance between
recently duplicated regions. This explains why the presence of gene clusters and duplications in a
major disease resistance QTL can play a role in the resistance evolution. In addition, this suggests
that the NBS-LRR genes are clustered and associated with particular QTL resistance loci in a
manner that reflects their functional relevance to disease resistance.
In this study, there was a correlation between the number of NBS-LRR genes within the QTL
intervals and the number of genes involved in gene clusters or duplication. Complex structures of
QTL can be as a result of resistance gene clustering and duplication leading to closely linked genes
which differ in their pathogen race specificity (Michelmore and Meyers, 1998). Thus, the clustering
of resistance genes in QTL intervals is advantageous by maintaining resistance while allowing
novel specificities to evolve. The results here provide evidence that NBS-LRR are distributed and
clustered throughout the genome and tend to be linked and associated with QTL intervals. These
QTL intervals containing gene clusters are likely to be major components of the resistance.
In order to validate whether the associated NBS-LRR genes with the identified QTL intervals are
related to any disease resistance genes that have been identified and sequenced in Brassica species.
I confirmed that B. rapa Cra clubroot resistance gene (Ueno et al., 2012) was orthologous and
conserved with a TIR-NBS-LRR gene in the reported CRa primary QTL intervals on chromosome
A3 in B. napus. Similarly, another B. rapa clubroot resistance gene Crr1a (Hatakeyama et al.,
2013) was also orthologous and conserved with a TIR-NBS-LRR in the primary Crr1a QTL
intervals on chromosome A8 in B. napus. Moreover, the blackleg LepR3 resistance gene (Larkan et
al., 2013) and Rlm2 candidate gene (Larkan et al., 2014) were found to be located within identified
LepR3 QTL intervals on chromosome A10 in B. napus. In addition, a Rlm4 blackleg candidate gene
was identified within the Rlm4 QTL intervals (Tollenaere et al., 2012).

109
Chapter 5
Comparative analysis enabled the
identification of candidate Rlm9
blackleg resistance genes in Brassica
napus

110
Chapter 5 : Comparative analysis enabled the identification of candidate Rlm9
blackleg resistance genes in Brassica napus
5.1 Abstract
The availability of genome sequences of Brassica species have made it possible to study and
understand the structure of disease resistance genes in Brassica napus. This provides an invaluable
resource for the identification and comparative analysis of disease resistance genes. A total of 58
disease resistance genes on chromosome A7 of B. napus: 19 NBS-LRRs, 15 LRR-RLPs and 24
LRR-RLKs were identified. The gene content and order between B. napus and B. rapa was
consistent and further confirmed the chromosome microsynteny and conservation.
Twelve NBS-LRR and 18 LRR-containing genes on B. napus chromosome A7 were located within
a Rlm (Resistance to Leptosphaeria maculans) QTL region of interest. Through previous genetic
mapping studies, this region is known to harbour a cluster of genes: Rlm9, Rlm4, Rlm7, Rlm3 and
Rlm1 that confer resistance to blackleg disease (Leptosphaeria maculans), the most devastating
fungal pathogen of B. napus. The comparative analysis of resistance genes in the Rlm QTL revealed
that there was higher functional conservation of resistance genes in chromosome A7 of B. napus
and B. rapa than in chromosome C6 of B. napus and B. oleracea.
In this study, a candidate gene approach combined with comparative analysis was exploited for
identification of Rlm9 candidate genes in B. napus. Six NBS-LRR and eight LRR-containing genes
were associated with the Rlm9 QTL region. The NBS-LRR genes were selected for further analysis
as the highest priority candidate genes. It was possible to amplify and sequence these genes in B.
napus cultivars that differ in Rlm9-based resistance. This confirmed that three genes can be
excluded as no polymorphism was observed while another three genes became strong candidates for
further investigation. This chapter provides a detailed analysis of the identification of candidate
blackleg resistance genes and further understating of the structural conservation.

111
5.2 Introduction
Genetic mapping studies showed that all Leptosphaeria maculans resistance genes in B. napus, the
most devastating fungal pathogen of B. napus, are found on the A genome of B. napus (Ananga et
al., 2006, Leflon et al., 2007) and are organised in clusters in two genomic regions: the Rlm2 and
LepR3 resistance genes on chromosome A10 (Pilet et al., 2001, Larkan et al., 2013, Larkan et al.,
2014) and five specific resistance genes: Rlm1, Rlm3, Rlm4, Rlm7, and Rlm9 are on chromosome
A7 (Delourme et al., 2004). A cluster of NBS-LRR genes on B. napus chromosome A7
corresponding to the mapped genetic resistance genes to L. maculans were identified based on a
marker homology based approach and genome wide NBS-LRR gene identification (described in
chapters 2 and 3). At present, none of these Rlm genes on chromosome A7 have been sequenced
and validated in B. napus.
A QTL for the Rlm9 resistance gene has been identified from a mapping population derived from B.
napus cultivars Darmor and Yudal (Delourme et al., 2004). This QTL is located on chromosome A7
of B. napus, which also contains other resistance genes: Rlm1, Rlm3, Rlm4 and Rlm7 (Delourme et
al., 2004). The identification of candidate blackleg resistance genes in B. napus has proven difficult
by map-based cloning approaches due to the complex genomic structure of this polyploid species
(Mayerhofer et al., 2005, Tollenaere et al., 2012).
An alternative approach called the candidate genes approach can be used to solve the problems
faced by map based cloning, in which QTL length intervals may be in mega base pairs (Mbp) and
include hundreds of genes. This approach is used to eliminate the need for fine mapping and
narrowing down the genomic regions by searching to discover the genes of interest all at once using
gene annotation and prediction. The rationale of the candidate gene approach is based on the
hypothesis that candidate genes should correspond to the loci controlling traits of interest if a
relationship between candidate gene and disease phenotype exist then significant polymorphism
between contrasting species or cultivars should be observed. Thus, comparison of disease resistance
genes between related species may provide insight into the conservation of these genes. Also,
comparison of syntenic loci known to harbour resistance genes may indicate candidate genes
governing the trait of interest that is yet to be identified. In a previous study, the collinearity
between B. napus and B. rapa was exploited to identify a number of candidate genes associated
with the Rlm4 blackleg resistance gene (Raman et al., 2012b, Tollenaere et al., 2012). In addition,
LepR3 gene identification and cloning was facilitated by the comparative collinearity of genetic
markers between B. napus and Arabidopsis (Larkan et al., 2013).

112
A common feature of plant resistance genes is the presence of leucine rich repeats (LRR). The LRR
domain plays a major role in recognition of pathogen effectors by facilitating protein–protein
interactions (McDowell and Woffenden, 2003). The LRR domain is found in NBS-LRR, as well as
LRR-containing proteins. The NBS-LRR genes are the largest class of plant resistance genes and
function predominantly as disease resistance proteins. They are located intracellularly and may
interact directly or indirectly with the effector proteins encoded by Avr genes. In contrast, the LRR-
containing proteins, classified into LRR-receptor-like proteins (LRR-RLPs) and LRR-receptor-like
kinases (LRR-RLKs) have an extracellular LRR domain and are anchored to the plasma membrane
(Kruijt et al., 2005, Yang et al., 2012). The LRR-RLPs differ from LRR-RLKs in that they lack the
cytoplasmic kinase domain. LRR-RLPs and LRR-RLKs are involved in both defence and
developmental pathways and play a role in perceiving extracellular signals to initiate an
intracellular response (Fritz-Laylin et al., 2005, Kemmerling et al., 2011)
The availability of sequenced Brassicas genomes makes candidate genes discovery more effective
by offering genomics resources. These genomics resources can be combined together with
information from QTL mapping to enable disease resistance gene identification (NBS-LRR and
LRR containing genes) and in this study for comparative analysis to investigate the Rlm9 QTL
region for candidate genes that can have potential for future sequencing and validation.
In this chapter, identification and characterization of Rlm9 candidate genes was attempted using
genomics approaches. Firstly, the localization of disease resistance genes such as NBS-LRR and
LRR-containing genes in chromosome A7 of B. napus cv. Darmor were identified and association
with Rlm9 resistance performed (chapter 4). Secondly, SNP genotyping (Illumina Infinium assay)
was used to genotype a number of B. napus cultivars carrying different complements of Rlm genes,
including Rlm9-positive and Rlm9-negative B. napus cultivars for genome wide association studies
(GWAS) with the Rlm9 QTL. Then, the comparative analysis of disease resistance genes between
B. napus and other Brassica species can be performed to help to identify any functional sequence
variations.

113
5.3 Methods
5.3.1 Brassica genome and gene prediction
The genome sequence and annotation of B. napus cv. Darmor v6 was used as the reference genome
(Chalhoub et al., 2014). The genome sequence of B. rapa v3.0 (Wang et al., 2011) and B. oleracea
cv. To1000 v1.0 (Parkin et al., 2014) were also used for comparative analysis. The NBS-LRR gene
annotation and identification was described previously chapters 2 and 3.
5.3.2 Identification of NBS-LRR and LRR- containing genes in B. napus
NBS-LRR candidate genes in B. napus were identified as described in chapter 2.
The identification of LRR containing proteins identification on A7 and C6 were based on
MAST/MEME output (chapter 2). All B. napus predicted genes were sorted by the MAST E-value.
Predicted genes containing more than 10 LRR motifs to be considered as LRR containing genes
with an E-value between -24 to 10 were selected. Then, they were further verified by BLASTp with
a threshold of E < -10 against the NCBI non-redundant (nr) protein database to check if they were
LRR-RLP or LRR-RLK.
5.3.3 Comparative analysis of NBS-LRR and LRR-containing gene on the A7 and C6
chromosome of B. napus
A reciprocal best BLAST (RBB) analysis of genes in B. napus was used to identify orthologous
genes in the B. rapa and B. oleracea genomes (chapter 3). The identification of homeologous or
paralogous genes were confirmed by the BLASTp comparison between genes between B. napus A7
and C6. In addition, the gene sequences were used to determine the syntenic positions between
chromosome A7 in B. napus and B. rapa, as well as chromosome C6 in B. napus and B. oleracea.
The genes showing homology and collinearity were regarded as syntenic genes. Then, the gene
sequences were aligned using CLUSTAL W in Geneious Pro v6.1.2 (Kearse et al., 2012).
5.3.4 Genetic mapping of the Rlm9 QTL
The genetic map position for Rlm9 was determined in a B. napus Darmor x Yudal mapping
population, segregating for blackleg resistance (Delourme et al., 2004). The markers underlying the
QTL on chromosome A7 were physically assigned to the B. napus Darmor A genome using
BLAST (Altschul et al., 1990) in Geneious Pro v6.1.2 (Kearse et al., 2012). The gene prediction
and genome wide identification of NBS LRR disease resistance across B. napus cv. Darmor
genome, particularly on chromosome A7, was used to identify the putative NBS-LRR or LRR-

114
containing genes to be selected as potential candidate genes for further analysis. Furthermore, all
Rlm9 candidate genes were subject to comparative sequence analysis between B. napus cv. Darmor,
B. napus cv. Tapidor and B. rapa.
Illumina short-sequence reads for B. napus cv. Skipton and cv. Ag-Spectrum, generated on the
Illumina Genome Analyser IIx (GAIIx) system, by the Batley lab, in collaboration with Prof
Edwards’ bioinformatics group, UQ, were mapped to the B. napus cv. Darmor genome by Prof
Edwards’ group. Given that Skipton is known to contain Rlm4 and Rlm9 genes, while Ag-Spectrum
contains Rlm9 (Raman et al., 2012), they were selected in this analysis. It is expected that there
would be no sequence variation in candidate Rlm9 genes when compared to cv. Darmor (Rlm9), but
they should show sequence variations if the candidate gene is Rlm4. The reads mapping in the
Rlm9 candidate genes underlying the Rlm9 QTL were visualized using Geneious Pro v6.1.2 (Kearse
et al., 2012) to assess sequence coverage and variation between the cultivars: Skipton and Ag-
Spectrum when compared to Darmor. Consensus sequences from short-sequence reads were
obtained for B. napus cultivars Skipton and Ag-Spectrum for each individual gene.
5.3.5 SNP genotyping of B. napus cultivars
Total genomic DNA was extracted from different B. napus cultivars and genotyped using a B.
napus custom array Infinium HD 60K assay with 52,157 SNPs throughout the B. napus genome as
implemented in the Illumina Infinium assay (Illumina Inc., San Diego, CA). The Infinium assay
was performed as described in the Illumina manual protocol.
SNP data processing, clustering and genotype calling were performed using the genotyping module
in the GenomeStudio software (Illumina, San Diego, CA) with default parameters. The software
assigns three clusters on a graph based on the fluorescence obtained. The clusters were reviewed
and manually edited when necessary. Limiting the analysis in this study to SNPs present on
chromosome A7, genotype calls for all SNPs loci were imported into Microsoft Excel 2013
(Microsoft) for further analysis.
For genotyping analysis, 26 B. napus cultivars including Darmor and Yudal were classified as Rlm9
resistant and susceptible cultivars based on the Rlm gene composition obtained from published
literature (Marcroft et al., 2012a) (Table 5.1). The cultivar Darmor (Rlm9 resistant) was selected as
a reference for the resistant individuals and Yudal (Rlm9 susceptible) for the susceptible
individuals. To aid in the comparison, all Darmor genotype calls were renamed as ‘AA’ and all

115
Yudal calls as ‘BB’, while the calls in the other lines varied depending on whether they carried the
Darmor or Yudal genotype at that position.
Table 5.1: List of B. napus cultivars genotyped with the SNP genotyping assay
B. napus cultivars
Rlm gene composition
Darmor Resistant reference Rlm9
Yudal Susceptible reference rlm9
Skipton
Positive Rlm9 cultivars
Rlm4 & Rlm9
Bravo-TT Rlm4 & Rlm9
Tornado-TT Rlm4 & Rlm9
AV-Sapphire Rlm4 & Rlm9
ATR-Stingray Rlm3 & Rlm9
ATR_Cobbler Rlm4(H) & Rlm9(H)
Ag-Spectrum Rlm9(H)
ATR-Stingray Rlm3 & Rlm9
Dunkeld
Negative Rlm9 cultivars
Rlm4
Nurendra Rlm4
Telfer Rlm4
Thunder-TT Rlm4
ATR-Summit Rlm4
Monty_028DH Rlm4
Taparoo Rlm3
Carousel Rlm1 & Rlm2
Surpass400 Rlm1 & RlmS
Argyle Rlm1 & RlmS
B2 B. napus "Lynx_037DH"
Unknown
C2 B. napus "Ningyou7"
RSO
Trilogy
Trigold
Boomer
“H” Indicates partial resistance.

116
5.3.6 Extraction of genomic DNA
Seeds for B. napus cultivars used in this study were obtained from a seed collection at the Batley
lab at the University of Queensland. They were germinated and planted in small polyvinyl pot filled
with potting mix in a temperature controlled glasshouse under 28o
C with natural lighting. Young
leaf tissue was collected for DNA extraction.
Genomic DNA was extracted from the different B. napus cultivars, according to a DNeasy Plant
Mini Kit (QIAGEN). Approximately 200 mg of leaf tissue was ground (dry) with a pestle and
mortar, sitting in liquid nitrogen, into a fine powder, then, transferred into a 1.5 mL microcentrifuge
tube. Then DNA was extracted following the manufacturer’s instructions. DNA concentration and
purity were measured using the NanoDrop (ND-1000 Spectrophotometer, Thermo Scientific). DNA
was also electrophoresed on a 1% TAE agarose gel containing ethidum bromide at 100 V for 30
min to check the DNA quality.
5.3.7 PCR amplification and sequencing of Rlm9 candidate genes
The selected Rlm9 candidate genes were amplified from genomic DNA of B. napus cv. Darmor and
B. napus cv. Yudal as well as other B. napus cultivars (Table 5.2) using PCR with the primers
listed in Table 5.3.
The primers pairs were designed based on the B. napus Darmor reference genome (Chalhoub et al.,
2014). The primer pair specificity was checked by BLAST analysis against the whole genome to
avoid non-specific binding as a result of duplications.
Long range PCR was carried out using the Expand Long Template PCR kit (Roche) following the
manufacturer’s instructions. A 50 ng aliquot of genomic DNA was amplified in a reaction mix
containing 1x PCR buffer, 1 U DNA polymerase mix, 500 μM dNTPs, and 400 nM forward and
reverse primers. The thermal cycling conditions were: 92 °C for 2 min; followed by 10 cycles of 92
°C for 10 sec, Tm °C for 15 sec, 68 °C for 60 sec/1Kbp; followed by 25 cycles of 92 °C for 10 sec,
Tm °C for 15 sec, 68 °C for 60sec/1Kbp +20 sec increment each cycle; then 68 °C for 7 min. PCR
products were resolved by electrophoresis in a 1 % agarose gel stained with ethidium bromide.

117
Table 5.2: List of the B. napus cultivars and their Rlm complement used for the PCR amplification
B. napus cultivar Rlm composition Remarks
Darmor Rlm9 Resistant Rlm9 reference. It is the reference genome for B. napus.
Yudal rlm9 Susceptible Rlm9 reference
Tapidor Rlm2 The genome sequence was available in-house.
Skipton Rlm4 and Rlm9 They have short sequence reads available. They both
contain the Rlm9 gene, but differ in Rlm4 Ag-Spectrum Rlm9
Jet Neuf Rlm4 and Rlm1
Westar No Rlm Used as negative control because it has no Rlm gene
Table 5.3: List of primer pairs used for long range PCR amplification of Rlm9 candidate genes
Target gene
sequence 5' --------> 3' Product size bp
PCR and sequencing
Results
BnDRG 13 and 14
F. TCCACGCTTACAACGGATAATTCTAGCC 14,900 Successful
R. ACAGCAGATGGATTACACGTACAACACC
BnDRG 17
F. GTTCTAAGGCTCTGACCAGTGT 3,000
Not Successful
R. CGGTGGCAGTGTTTCGAAACAT
F. TTACGGTTAGTACTTAGTAGCGGTGG
4,200 Not
Successful R. GCTTGTGCAGTTGAAGAATGGATAAC
F. ACTGCTATATTGTTATAGGTCGGCCG 2,000
Not Successful
R. TTGATGTTCTAAGGCTCTGACCAGTG
BnDRG 19
F. CGGTTCGTAAGCCACCTAATCTAAGACC 17,500
Not Successful
R. GAATCGGAATTGAGGAGAGGCTTAGAGG
F. GTAGCTATGTTCTCTCCGAGTATCCAC 11,800
Not Successful
R. GAAGGAAGTAGTAGAGCCAAGCATGAC
F. ATGCCAAATTTCTGCGTTTCG 1,740
Successful but not
sequenced R. TCAGGTCGAAATGTTGGAGGA
F. TTGGCCATATTATTCGGAACCG 6,400
Successful for all
cultivars except Ag-
R. GTAGTCACCTATGTACATCCGC

118
Spectrum
BnDRG 20
F.CTAAGCCTCTCCTCAATTCCGATTCAGC 18,000
Not Successful
R. GTCTACAGGTTGAAGTACACGATCTGGC
F. TGAAGACATTACGGTCGACTATGC 18,900
Not Successful
R. GAGAAGATCGTCGGTGCATTAACG
F. AGTATAGGATACGGTGTTGTAGTGCC 18,900
Not Successful
R. CTTGAGAAGATCGTCGGTGCATTAAC
F. TTACAGTGATGACTAGTTCATGGCCG
6,400
Successful for all
cultivars except Ag-Spectrum
R. TTGCTAGCTCATTACTGATCTCGGAG
F. ATGGCTTCTTCTTCTCACCGG ATA AGG
4,000
Successful for all
cultivars except Ag-Spectrum
R. CTAATCCATTGCGCTGCTACTACT CTC
BnDRG 23 F. CTTCAGGGTTGGTCCATTGGCACATGTC
16,000 Successful R. GTCATCTTCCTCACAGTCATCGTCAAGG
5.3.8 DNA Sequencing and Sequence Analysis
Purified PCR products were sequenced using the Sanger sequencing method via the Australian
Genome Research Facility (AGRF, http://www.agrf.org.au). Sequencing samples were prepared and
submitted according to AGRF guidelines to be sequenced in both forward and reverse directions.
Raw sequences (ABI sequence chromatograms), obtained from AGRF, were analyzed using
Geneious Pro v6.1.2 (Kearse et al., 2012). The sequence analysis included mapping to reference
genome or de novo assemblies and sequenced candidate gene from cultivars, nucleotide and protein
alignments. Then, full gene sequence and sequence variation were confirmed.
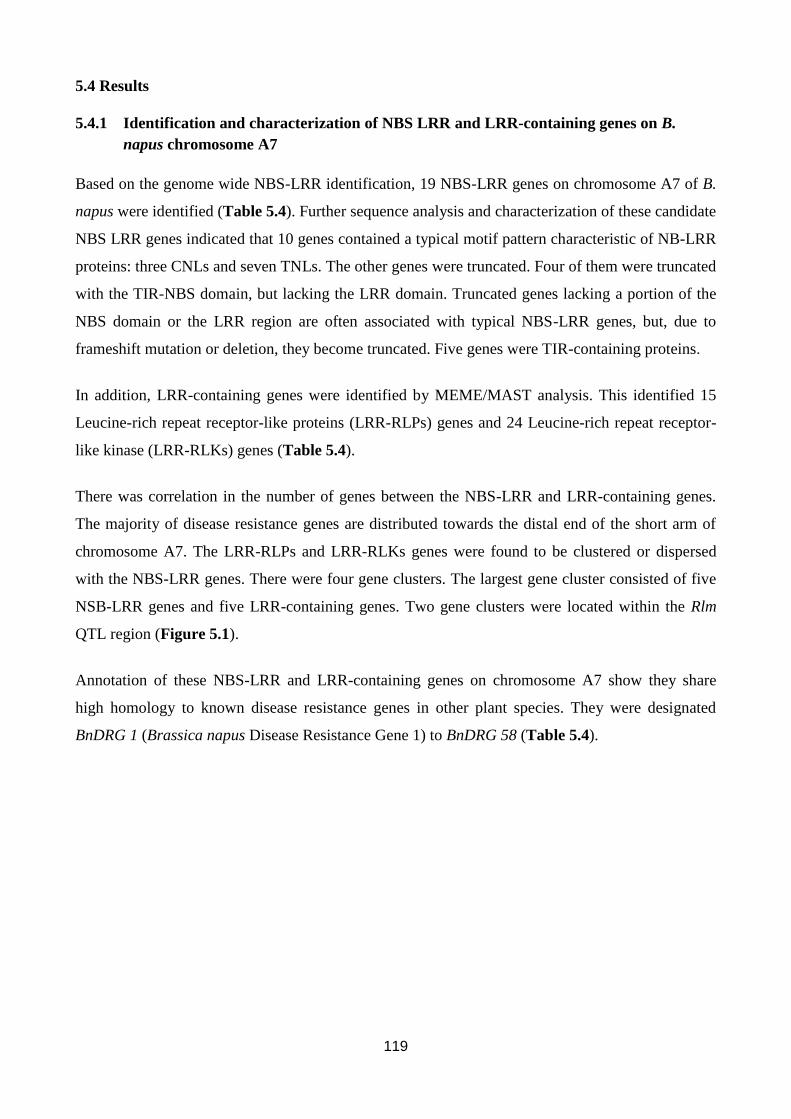
119
5.4 Results
5.4.1 Identification and characterization of NBS LRR and LRR-containing genes on B.
napus chromosome A7
Based on the genome wide NBS-LRR identification, 19 NBS-LRR genes on chromosome A7 of B.
napus were identified (Table 5.4). Further sequence analysis and characterization of these candidate
NBS LRR genes indicated that 10 genes contained a typical motif pattern characteristic of NB-LRR
proteins: three CNLs and seven TNLs. The other genes were truncated. Four of them were truncated
with the TIR-NBS domain, but lacking the LRR domain. Truncated genes lacking a portion of the
NBS domain or the LRR region are often associated with typical NBS-LRR genes, but, due to
frameshift mutation or deletion, they become truncated. Five genes were TIR-containing proteins.
In addition, LRR-containing genes were identified by MEME/MAST analysis. This identified 15
Leucine-rich repeat receptor-like proteins (LRR-RLPs) genes and 24 Leucine-rich repeat receptor-
like kinase (LRR-RLKs) genes (Table 5.4).
There was correlation in the number of genes between the NBS-LRR and LRR-containing genes.
The majority of disease resistance genes are distributed towards the distal end of the short arm of
chromosome A7. The LRR-RLPs and LRR-RLKs genes were found to be clustered or dispersed
with the NBS-LRR genes. There were four gene clusters. The largest gene cluster consisted of five
NSB-LRR genes and five LRR-containing genes. Two gene clusters were located within the Rlm
QTL region (Figure 5.1).
Annotation of these NBS-LRR and LRR-containing genes on chromosome A7 show they share
high homology to known disease resistance genes in other plant species. They were designated
BnDRG 1 (Brassica napus Disease Resistance Gene 1) to BnDRG 58 (Table 5.4).

120
Table 5.4: List of characterized NBS-LRR and LRR-containing genes on chromosome A7 of B.
napus cv. Darmor. Candidate Rlm9 genes located within the Rlm9 QTL are highlighted
Given name GenBank AC Gene Position on B. napus
Darmor V6 Gene class
BnDRG 1 CDY31987 GSBRNA2G00050797001 412,213 LRR-RLP
BnDRG 2 NA GSBRNA2G00067320001 1,179,872 LRR-RLP
BnDRG 3 CDY31412 GSBRNA2T00047634001 3,824,209 LRR-RLP
BnDRG 4 CDY32057 GSBRNA2T00051369001 4,843,786 LRR-RLP
BnDRG 5 CDX77472 GSBRNA2T00128337001 8,533,320 LRR-RLP
BnDRG 6 CDY43181 GSBRNA2G00076179001 10,010,633 LRR-RLK
BnDRG 7 CDY43183 GSBRNA2G00076181001 10,028,308 LRR-RLK
BnDRG 8 CDY43185 GSBRNA2G00076183001 10,039,885 LRR-RLK
BnDRG 9 CDY43187 GSBRNA2G00076186001 10,054,452 LRR-RLK
BnDRG 10 CDY44292 GSBRNA2G00079920001 10,354,023 LRR-RLK
BnDRG 11 CDY15668 GSBRNA2T00089880001 11,054,163 LRR-RLK
BnDRG 12 CDY01430 GSBRNA2T00112430001 13,928,484 LRR-RLK
BnDRG 13 CDY01454 GSBRNA2T00112460001 14,052,790 NBS-LRR (CNL)
BnDRG 14 CDY01455 GSBRNA2T00112461001 14,057,850 NBS-LRR (CNL)
BnDRG 15 CDY04476 GSBRNA2G00118634001 14,670,288 LRR-RLK
BnDRG 16 CDY57686 GSBRNA2T00022534001 15,944,110 LRR-RLP
BnDRG 17 CDY67955 GSBRNA2T00068325001 16,055,043 NBS-LRR (TNL)
BnDRG 18 CDX67490 GSBRNA2G00098602001 16,703,378 LRR-RLK
BnDRG 19 NA chrA07-snap.4041 16,765,735 NBS-LRR (TNL)
BnDRG 20 CDX67500 GSBRNA2T00098616001 16,783,435 NBS-LRR (TNL)
BnDRG 21 CDX67564 GSBRNA2G00098700001 17,128,516 LRR-RLP
BnDRG 22 CDX67632 GSBRNA2G00098789001 17,581,237 LRR-RLK
BnDRG 23 CDX67660 GSBRNA2T00098829001 17,769,448 NBS-LRR (CNL)
BnDRG 24 CDX67736 GSBRNA2T00098923001 18,186,595 LRR-RLK
BnDRG 25 CDX98379 GSBRNA2T00098994001 18,459,810 LRR-RLP
BnDRG 26 CDX68199 GSBRNA2G00099459001 20,542,818 LRR-RLP
BnDRG 27 CDX68246 GSBRNA2T00099523001 20,755,045 LRR-RLK
BnDRG 28 CDX68251 GSBRNA2T00099529001 20,789,302 NBS-LRR (TNL)
BnDRG 29 CDX68253 GSBRNA2T00099532001 20,800,824 NBS-LRR (TNL)
BnDRG 30 CDX68254 GSBRNA2T00099533001 20,801,471 NBS-LRR (TNL)
BnDRG 31 CDX68276 GSBRNA2T00099557001 20,914,840 LRR-RLK
BnDRG 32 CDX68299 GSBRNA2G00099588001 21,048,465 LRR-RLK
BnDRG 33 CDX68312 GSBRNA2T00099607001 21,137,684 LRR-RLP
BnDRG 34 CDX68313 GSBRNA2T00099609001 21,141,755 LRR-RLP
BnDRG 35 CDY07346 GSBRNA2T00124303001 21,937,031 NBS-LRR (TNL)
BnDRG 36 CDY07347 GSBRNA2T00124305001 21,947,475 NBS-LRR (TNL)
BnDRG 37 CDY56524 GSBRNA2T00019706001 22,890,711 LRR-RLP
BnDRG 38 CDX95990 GSBRNA2G00102016001 23,418,593 LRR-RLP
BnDRG 39 CDX96066 GSBRNA2G00102107001 23,822,389 LRR-RLK
BnDRG 40 CDX96121 GSBRNA2T00102173001 24,103,221 NBS-LRR (TNL)

121
BnDRG 41 CDY38804 GSBRNA2G00066610001 24,695,717 LRR-RLP
BnDRG 42 CDX96320 GSBRNA2T00102468001 25,026,741 LRR-RLP
BnDRG 43 NA GSBRNA2G00102501001 25,150,024 LRR-RLK
BnDRG 44 CDX96381 GSBRNA2T00102534001 25,311,436 LRR-RLK
BnDRG 45 CDX96394 GSBRNA2T00102550001 25,376,215 LRR-RLK
BnDRG 46 CDX96437 GSBRNA2T00102605001 25,584,103 NBS-LRR (TNL)
BnDRG 47 CDX96438 GSBRNA2T00102606001 25,588,007 NBS-LRR (TNL)
BnDRG 48 CDX96439 GSBRNA2T00102607001 25,594,415 NBS-LRR (TNL)
BnDRG 49 NA GSBRNA2T00102609001 25,598,597 NBS-LRR (TNL)
BnDRG 50 CDX96441 GSBRNA2T00102611001 25,603,196 NBS-LRR (TNL)
BnDRG 51 CDX96448 GSBRNA2T00102618001 25,628,804 LRR-RLK
BnDRG 52 CDX96522 GSBRNA2T00102705001 25,942,706 LRR-RLK
BnDRG 53 CDX96537 GSBRNA2T00102721001 25,990,167 LRR-RLK
BnDRG 54 CDY47508 GSBRNA2G00087566001 26,443,758 LRR-RLK
BnDRG 55 CDX87373 GSBRNA2T00146342001 27,009,762 NBS-LRR (TNL)
BnDRG 56 CDX87396 GSBRNA2T00146370001 27,122,969 NBS-LRR (TNL)
BnDRG 57 CDX87418 GSBRNA2G00146395001 27,231,134 LRR-RLK
BnDRG 58 CDX87661 GSBRNA2T00146668001 28,378,921 LRR-RLK
Figure 5.1: Distribution of NBS-LRR and LRR-containing genes on chromosome A7 of B. napus.
Different colours represent different gene types: blue (TNL), red (CNL), green (LRR-RLKs) and
yellow (LRR-RLPs). Genes inside the black rectangles are in a gene cluster. The Genes inside the
red rectangle are within the Rlm QTL.

122
5.4.2 Comparative analysis of NBS-LRR and LRR-containing genes on chromosome A7 of
B. napus
In order to study the gene conservation between chromosome A7 and its homeologous chromosome
C6 in the Brassica species: B. napus, B. rapa and B. oleracea, the protein sequences and gene
collinearity were compared. The total numbers of NBS-LRR and LRR-containing genes were
consistent (Table 5.5). Genes in B. napus showed good orthology and collinearity relationships
with genes in B. rapa and B. oleracea (Figures 5.2 and 5.3). The B. napus chromosome A7 is
collinear and syntenic around gene clusters to the same chromosome of B. rapa which includes non-
collinear genes. Likewise, the B. napus chromosome C6 also exhibited the same gene pattern to B.
oleracea. The majority of the NBS-LRR and LRR-containing genes of B. napus chromosomes A7
and C6 have orthologs in B. rapa and B. oleracea, although a number of genes showed presence
and absence between species.
Table 5.5: Comparative analysis of the number of NBS-LRR and LRR-containing genes on
chromosomes A7 and C6 of the three Brassica species: B. napus, B. rapa and B. oleracea
Species
Gene
The whole chromosome Within Rlm QTL
B. n
ap
us
A0
7
B. n
ap
us
C0
6
B. r
ap
a
A0
7
B. o
lera
cea
C
06
B. n
ap
us
A0
7
B. n
ap
us
C0
6
B. r
ap
a
A0
7
B. o
lera
cea
C
06
NBS-LRR 19 44 18 45 12 18 9 18
LRR-RLP 15 10 14 9 9 6 9 6
LRR-RLK 24 25 23 25 9 8 8 7
Total 58 79 55 79 30 32 26 31
The comparison revealed that 14/19 (73%) and 34/39 (87%) genes of NBS-LRR and LRR-
containing genes, respectively, between A7 B. napus and B. rapa were highly conserved with high
protein sequence similarity. Six and 12 genes of NBS-LRR and LRR-containing genes,
respectively, were not collinear. Four and three genes of NBS-LRR and LRR-containing genes,
respectively, showed substantial protein sequence differences. Three NBS-LRR genes showed
presence and absence between the species (Figures 5.2 and 5.3).
The comparison also revealed that 27/44 (61%) and 33/35 (68%) genes of NBS-LRR and LRR-
containing genes, respectively, between chromosome C6 of B. napus and B. oleracea were highly
conserved with high protein sequence similarity and collinearity. Two and 10 genes of NBS-LRR

123
and LRR-containing genes, respectively, were not collinear. Six NBS-LRR genes showed
substantial protein sequence differences. No NBS-LRR and LRR-containing genes showed
presence and absence variation between species (Figures 5.2 and 5.3).
Furthermore, the resistance genes between A7 and C6 B. napus are considered homeologous
(duplicates). The comparison between chromosomes A7 and C6 B. napus revealed that 14 of each
NBS-LRR and LRR-containing genes between A7 B. napus and B. rapa were homeologous
between chromosomes A7 and C6 of B. napus. There were 6/14 (42%) and 14/14 (100%) genes of
NBS-LRR and LRR-containing genes, respectively, highly conserved with high protein sequence
similarity. One and five genes of NBS-LRR and LRR-containing genes, respectively, were not
collinear. Six NBS-LRR genes showed substantial protein sequence differences (Figures 5.2 and
5.3).
Taken together, the comparison revealed that the LRR-containing genes showed higher sequence
conservation than the NBS-LRR genes. The NBS-LRR genes show protein sequence divergence
and presence and absence while, the LRR-containing genes show non-collinearity.
In order to be more specific, the NBS-LRR and LRR-containing genes within the Rlm QTL were
the great of interest for the comparison. Twelve NBS-LRR and 18 LRR-containing genes were
identified to be located within the Rlm QTL. There were slight differences in the gene number
between the chromosomes A7 of B. napus and B.rapa as well as chromosomes A7 and C6 of B.
napus (Table 5.5). These identified resistance genes could be Rlm9, Rlm4, Rlm, Rlm3 or Rlm1
candidates for blackleg disease resistance. However, because B. napus cv. Darmor is carrying Rlm9
gene, it is expected that the comparison should be informative within the Rlm9 QTL rather than
other Rlm QTL.
The comparison of NBS-LRR and LRR-containing genes within the Rlm QTL between
chromosome A7 in B. napus and B. rapa showed that 10 and 17 genes of NBS-LRR and LRR-
containing genes in B. napus were orthologous and conserved with B. rapa. Three NBS-LRR genes
showed substantial differences with 85, 84 and 87% amino acid identity, but one LRR-containing
genes showed substantial differences with 98% amino acid identity and 50% sequence aligned
coverage. Two NBS-LRR genes were absent from the A7 B. rapa (Figure 5.2 and 5.3).
To find the homeologous relationship between genes on chromosomes A7 and C6, the NBS-LRR
and LRR-containing genes within the Rlm QTL between the two homeologous chromosomes: A7
and C6 in B. napus were compared. Seven NBS-LRR genes were homeologous. Four NBS-LRR

124
gene were conserved with 96, 95, 93, 95% amino acid identity. Three genes showed substantial
differences with 88, 84 and 80% amino acid identity. There were five genes on chromosome A7
that were not homeologous. Only one gene was not collinear (Figure 5.2). Likewise, Seven LRR-
containing genes were homeologous with two genes on chromosome A7 that were corresponding to
two duplicates copies on chromosome C6. These genes showed high conservation with >94%
amino acid identity and 90% amino acid identity. Two genes were not collinear (Figure 5.3). There
were 11 genes on chromosome A7 that were not homeologous.
Above all, there were considerable variations, collinearity, presence/absence or substantial
differences in the protein sequence of several NBS-LRR and LRR-containing genes within the Rlm
QTL region, particularly in the Rlm9 QTL of interest. This comparison confirmed that the genes in
the Rlm9 QTL did not show good conservation and chromosome collinearity. For example, the
observed differences within the Rlm QTL between chromosome A7 of B. rapa and B. napus
indicated that there were three NBS-LRR genes and five LRR-containing genes, located in the Rlm9
QTL of interest that showed non-collinearity. There was also one NBS-LRR gene that was absent
from B. rapa and three NBS-LRR genes that showed substantial protein sequence differences.
Similarly, within the Rlm QTL between chromosome A7 and C6 in B. napus, there was one NBS-
LRR gene and three LRR-containing genes showing non-collinearity. Three and four NBS-LRR
LRR-containing genes, respectively, were not homeologous.
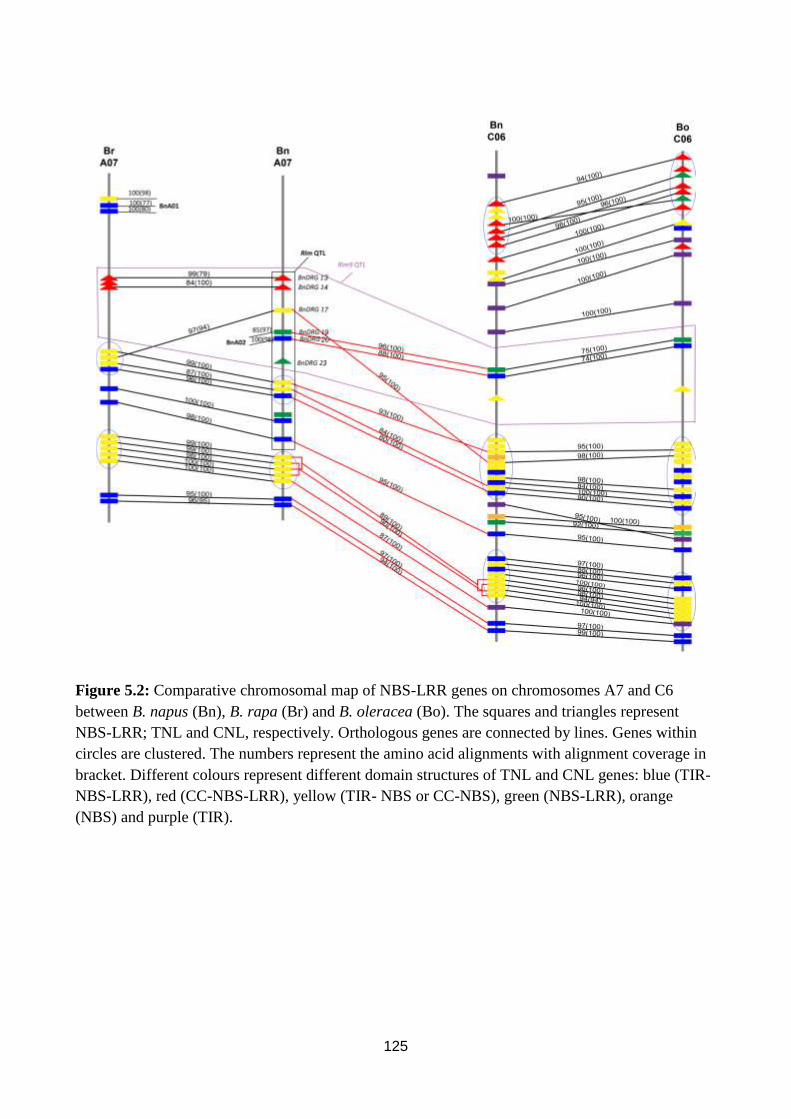
125
Figure 5.2: Comparative chromosomal map of NBS-LRR genes on chromosomes A7 and C6
between B. napus (Bn), B. rapa (Br) and B. oleracea (Bo). The squares and triangles represent
NBS-LRR; TNL and CNL, respectively. Orthologous genes are connected by lines. Genes within
circles are clustered. The numbers represent the amino acid alignments with alignment coverage in
bracket. Different colours represent different domain structures of TNL and CNL genes: blue (TIR-
NBS-LRR), red (CC-NBS-LRR), yellow (TIR- NBS or CC-NBS), green (NBS-LRR), orange
(NBS) and purple (TIR).

126
Figure 5.3: Comparative chromosomal map of LRR-containing genes on chromosomes A7 and C6
between B. napus (Bn), B. rapa (Br) and B. oleracea (Bo). The yellow and green semicircles
represent LRR-RLP and LRR-RLK genes, respectively. Orthologous genes are connected by lines.
Genes within circles are clustered. The numbers represent the alignment coverage with amino acid
alignments in brackets

127
5.4.3 Haplotype analysis of Rlm9 and mapping potential SNPs in B. napus
A 60 K Illumina Infinium SNP genotyping assay was performed for GWAS analysis to determine
the SNP association between the B. napus Darmor (Rlm9 resistant) genotype and B. napus Yudal
(Rlm9 susceptible) for blackleg resistance. This allows identification of any haplotypes associated
with Rlm9 resistance genes located in the QTL region on chromosome A7. A total of 26 B. napus
cultivars with different Rlm gene composition were also included in the assay, phenotypic data for
all cultivars was based on resistance and susceptibility to the blackleg disease reported in the
literature (Marcroft et al., 2012a).
The haplotype analysis of the 60K SNPs genotyping data was analysed based on the Rlm9 resistant
and susceptible B. napus cultivars, Darmor and Yudal, respectively. A total of 813 out of 2467
SNPs on chromosome A7 were polymorphic between the cultivars Darmor and Yudal. The majority
of SNPs on chromosome A7 did not show significant correlation with the resistance genotype
between different B. napus cultivars with different Rlm genes. However, a set of 10 SNPs with good
correlation patterns were observed to distinguish the resistance and susceptible phenotype within a
region on chromosome A7 (Table 5.6).
These SNPs showed 100% association to the Rlm9 resistant phenotype in all cultivars predicted to
carry the Rlm9 gene, except for the cultivar Ag-Spectrum. Ag-Spectrum, one of cultivars predicted
to be carrying Rlm9, showed association with the Rlm9 susceptible phenotype (Table 5.6). In
contrast, these ten SNPs did not show 100% association to the Rlm9 susceptible phenotype between
all cultivars predicted not to be carrying the Rlm9 gene. For example, Dunkeld, Argyle, Narendra,
ATR-Summit, and Taparoo showed the SNP genotype associated with the Rlm9 resistant
phenotype, even though they are classified as susceptible cultivars (Table 5.6).
Physical location and annotation of the SNP positions on the B. napus Darmor revealed that these
SNPs were located on chromosome A7 within the region between 12,606,759 bp to 14,533,279 bp
(Table 5.7). This region contained 85 SNPs being assayed, but only these ten SNPs identified in
this study were showing a good association to Rlm9 resistant phenotype. Two of them, SNPs (Bn-
A07-p9079474 and Bn-A07-p9791002), were located in predicted genes on A7. These were
annotated as zinc finger protein transcription factors and receptor protein kinase-like protein (LRR-
RLK), respectively.

128
Table 5.6: The potential SNPs on chromosome A7 with a good correlation to the Rlm9 gene and association with disease and susceptibility in B. napus
cultivars. AA allele refers to Darmor resistant allele and BB allele refers to Yudal susceptible allele. NA indicates a no genotype call
Resistance ( Rlm9 positive)
Susceptibale ( Rlm9 negative)
Unknown
SNP ID
Dar
mo
r
Skip
ton
Bra
vo-T
T
Torn
ado
-TT
ATR
-Sti
ngr
ay
ATR
_Co
bb
ler
Ag-
Spe
ctru
m
Y
ud
al
Du
nke
ld
Nu
ren
dra
Telf
er
Thu
nd
er-
TT
ATR
-Su
mm
it
Mo
nty
_02
8D
H
Tap
aro
o
Car
ou
sel
Surp
ass4
00
_0
24
DH
Arg
yle
B
2 B
. nap
us
"Lyn
x_0
37
DH
"
C2
B. n
apu
s "N
ingy
ou
7"
RSO
Trilo
gy
Trig
old
Bo
om
er
Bn-A07-p8531068 AA AA AA AA AA AA BB BB AA AA BB BB AA AA AA BB AA AA BB AA AA BB BB BB
Bn-A07-p8854569 AA AA AA AA AA AA BB BB AA AA BB BB AA BB AA BB BB AA AA AA AA BB BB BB
Bn-A07-p8745024 AA AA AA AA AA AA BB BB AA AA BB BB AA AA AA BB BB AA BB BB AA BB BB BB
Bn-A07-p8775069 AA AA AA AA AA AA BB BB AA AA BB BB AA BB AA BB BB AA BB NC AA BB BB BB
Bn-A07-p8941260 AA AA AA AA AA AA BB BB AA AA BB BB AA BB AA BB BB AA AA AA AA BB BB BB
Bn-A07-p9020570 AA AA AA AA AA AA BB BB AA AA NA NA AA BB AA NA NA AA AA AA AA BB BB NA
Bn-A07-p9079474 AA AA AA AA AA AA BB BB AA AA BB BB AA AA AA BB BB AA AA AA AA BB BB BB
Bn-A07-p9791002 AA AA AA AA AA AA BB BB AA AA BB BB AA BB AA BB BB AA AA AA BB BB BB BB
Bn-A07-p9831545 AA AA AA AA AA AA BB BB AA AA BB BB AA BB AA BB BB AA AA BB BB BB BB BB
Bn-A07-p10347794 AA AA AA AA AA AA BB BB AA AA BB BB AA AA BB BB AA AA BB AA BB BB BB BB

129
Table 5.7: Mapping and annotation of the potential SNPs identified in B. napus cv. Darmor
SNP ID SNP B. napus Darmor v6
origin SNP
SNP in Darmor
location of SNP Predicted gene Blast hit chro
position top hit
Bn-A07-p8531068 [A/C] chrA07 12,606,759 A A Intergenic region GSBRNA2G00085931001 and GSBRNA2G00085930001
No hit
Bn-A07-p8854569 [T/C] chrA07 12,855,583 T C Intergenic region GSBRNA2G00030498001 and GSBRNA2G00030500001
No hit
Bn-A07-p8745024 [A/C] chrA07 13,039,112 A C Intron GSBRNA2G00112258001 or chrA07-snap.3025 and 3026
nodulin family protein
Bn-A07-p8775069 [T/C] chrA07 13,075,780 T T Intron GSBRNA2G00112264001 or chrA07-snap.3045
protein disulfide isomerase
Bn-A07-p8941260 [A/C] chrA07 13,262,125 A A 3’ UTR chrA07-snap.3091 putative pol polyprotein
Bn-A07-p9020570 [T/C] chrA07 13,325,277 T C 5’ UTR GSBRNA2G00112311001 or chrA07-snap.3110
small nuclear ribonucleoprotein helicase-like
Bn-A07-p9079474 [A/G] chrA07 13,391,183 A A Exon GSBRNA2G00112326001 or chrA07-snap.3130
zinc finger protein transcription factors
Bn-A07-p9791002 [T/C] chrA07 13,925,780 T T 5’ UTR chrA07-snap.3302 and 3303 receptor protein kinase-like protein
Bn-A07-p9831545 [T/C] chrA07 13,956,273 T T Intergenic region GSBRNA2G00112433001 and GSBRNA2G00112434001 or chrA07-snap.3307 and 3308
No hit
Bn-A07-p10347794 [A/G] chrA07 14,533,279 A G 5’ UTR chrA07-snap.3457 No hit

130
5.4.4 The identification of candidate Rlm9 blackleg resistance genes in B. napus
An Rlm9 QTL was identified on chromosome A7 through a marker based approach where linked
markers were physically mapped to the reference B. napus genome. The Rlm9 QTL was roughly
spanning 5 Mbp in the B. napus Darmor chromosome A7 from 13,488,533 Mbp to 19,031,520
Mbp. In addition, the potential ten SNPs, identified from haplotype analysis, were physically
mapped to B. napus Darmor chromosome A7 located near or within the Rlm9 QTL region (Figure
5.4). The genome wide identification of disease resistance genes enabled the identification of six
NBS-LRR and eight LRR-containing genes co-localized with the Rlm9 QTL region.

131
Figure 5.4: Mapping based identification of the Rlm9 candidate gene using marker physical mapping, NBS LRR genome wide identification and SNP
haplotypes. Different colours represent different gene types: blue (TNL), red (CNL), green (LRR-RLKs) and yellow (LRR-RLPs). The orange triangles
represent the identified SNPs associated with Rlm9 resistance. Genes inside the black rectangles are in a gene cluster. The genes inside red rectangle
are within the Rlm QTL.

132
The following results describe the comparative analysis of six NBS-LRR candidate genes (Table
5.8).
5.4.4.1 Candidate gene BnDRG 13
The BnDRG 13 gene has a coding region consisting of seven exons of 2613 bp in length encoding a
870 aa protein This gene is a typical CC-NBS-LRR (CNL) consisting of the three domains: CC,
NBS and LRR. It has no homeologous copy in the C genome of B. napus cv. Darmor. The gene is
orthologous and in a collinear position in B. rapa chromosome A7 and showed 99% amino acid
identity (Table 5.8 and Figure 5.5). The corresponding gene in B. rapa is lacking the CC domain.
The gene is also present and in a collinear position in B. napus cv. Tapidor and showed 99% amino
acid identity. The gene in B. napus cv. Tapidor lacks half of the CC domain (about the first 60 aa)
(Table 5.8 and Figure 5.5). The gene had high coverage of Ag-Spectrum sequence reads of 80%
with 98% DNA sequence identity, whereas Skipton showed low read coverage of about 5% (Table
5.9 and Figure 5.11).
5.4.4.2 Candidate gene BnDRG 14
The BnDRG 14 gene has a coding region consisting of five exons of 2244 bp in length encoding a
754 aa protein. This gene is a typical CNL. It has no homeologous copy in the C genome of B.
napus cv. Darmor. The gene is orthologous and in a collinear position in B. rapa chromosome A7
and showed 99% amino acid identity in the NBS and LRR domain but showed substantial sequence
variation at the CC domain (Table 5.8 and Figure 5.6). The gene is also present in a collinear
position in A7 B. napus cv. Tapidor. Most of the gene shared 100% amino acid identity except a
region of about 60 aa where there was substantial difference in the CC domain (Table 5.8 and
Figure 5.6). The gene had high coverage of Skipton sequence reads (78%) with 98% DNA
sequence identity, whereas Ag-Spectrum showed low read coverage of about 5% (Table 5.9 and
Figure 5.11).
5.4.4.3 Candidate gene BnDRG 17
The gene BnDRG 17 has a coding region consisting of two exons of 1296 bp in length encoding a
431 aa protein. This gene is a truncated TNL consisting of two domains TIR and NBS and lacking
the LRR domain. It has a homeologous copy as a duplicate on chromosome C6 of B. napus cv.
Darmor. This duplicate copy is also truncated and not in a collinear position with 95% amino acid
identity (Table 5.8 and Figure 5.8). The gene is orthologous and not in a collinear position on
chromosome A7 in B. rapa with 97% amino acid identity (Table 5.8 and Figure 5.7). It is missing
the first 23 aa of the TIR domain in B. napus Darmor compared to B. rapa. The gene seems to be

133
present in an unplaced chromosome of B. napus cv. Tapidor, but, it was not possible to compare the
entire sequence similarity because of presence of N-gapped sequence in B. napus Tapidor. There
were no Skipton or Ag-Spectrum sequence reads for this gene.
5.4.4.4 Candidate gene BnDRG19
The gene BnDRG19 has a coding region consisting of three exons of 2763 bp in length encoding a
920 aa protein. This gene is a truncated TNL lacking the TIR domain and contains the NBS and
LRR domains. It has a homeologous copy as duplicate on chromosome C6 of B. napus cv. Darmor.
This duplicate copy is also truncated and not in collinear position with 96% amino acid identity
(Table 5.8 and Figure 5.8). The gene is orthologous and not in a collinear position in B. rapa on
chromosome A2 with 97% amino acid identity (Table 5.8 and Figure 5.8). The corresponding
gene in B. rapa is a typical TNL. The gene is also present on chromosome A7 B. napus cv. Tapidor
and showed 95% amino acid identity with a deletion of 30 aa in the NBS domain (Table 5.8 and
Figure 5.8). There was high coverage of Skipton and Ag-Spectrum sequence reads of about 99%
and 86% of the gene with 100% and 98% DNA sequence identity, respectively (Table 5.9 and
Figure 5.11).
5.4.4.5 Candidate gene BnDRG20
The gene BnDRG20 has a coding region consisting of four exons of 2979 bp in length encoding a
992 aa protein. This gene is a typical TNL containing all three domains: TIR, NBS and LRR. It has
a homeologous copy as a duplicate on chromosome C6 of B. napus cv. Darmor. This duplicate copy
is also a typical TNL and not in a collinear position and showed 88% amino acid identity (Table 5.8
and Figure 5.9). The gene is orthologous and not in a collinear position on chromosome A2 in B.
rapa and showed 98% amino acid identity (Table 5.8 and Figure 5.9). This gene is not present in
B. napus cv. Tapidor. There was high coverage of Skipton sequence reads covering 96% with 100%
DNA sequence identity, whereas, the Ag-Spectrum sequence reads coverage was about 55% of the
gene with 99% DNA sequence identity (Table 5.9 and Figure 5.11).
5.4.4.6 Candidate gene BnDRG 23
The gene BnDRG23 has a coding region consisting of six exons of 2346 bp in length encoding a
781 aa protein. This gene is a truncated CNL lacking the CC domain and consisting of the NBS and
LRR domains. It has no homeologous copy in the C genome of B. napus cv. Darmor. This gene is
not present in B. rapa. The gene is present on chromosome A7 of B. napus cv. Tapidor and showed
81% amino acid identity (Table 5.8 and Figure 5.10). There was high coverage of Skipton and Ag-

134
Spectrum sequence reads of about 90% and 98% of the gene with 100% DNA sequence identity,
respectively (Table 5.9).
5.4.5 Amplification and sequencing of Rlm9 candidate genes
The comparative analysis of NBS-LRR genes gave an initial indication that these genes could be
candidate Rlm9 genes because of their conservation or sequence variation between B. napus Darmor
(Rlm9 resistant) and B. rapa.
In order to validate these candidate genes, individual genes were amplified and sequenced using
primer pairs designed based on B. napus cv. Darmor sequence as a reference. In this study,
sequencing of six Rlm9 candidate genes is being attempted in B. napus Darmor and Yudal, resistant
and susceptible cultivars, respectively. It was very difficult to develop gene specific primers
because the B. napus genome is polyploid, highly duplicated and sequence similarity between the A
and C genome exists extensively between homeologous chromosomes.
BnDRG 13, BnDRG 14 and BnDRG 23 were successfully amplified and completely sequenced the
gene from B. napus cv. Darmor and c.v Yudal and no polymorphism was observed. I did not test
these on other B. napus cultivars because no polymorphism was observed. The two potential genes:
BnDRG 19 and BnDRG 20 were successfully amplified and sequenced complete gene sequence
from different B. napus cultivars: Darmor, Yudal, Skipton, Tapidor, Jet Neuf and, but no
polymorphism was observed. These two genes: BnDRG 19 and BnDRG 20 failed to amplify from
B. napus Ag-Spectrum and Westar. The presence of the BnDRG 20 gene in B. napus cv. Tapidor
was confirmed and showed 100% identity even though the comparative analysis of BnDRG 20
showed that was not present in B. napus Tapidor genome (Table 5.8). The amplification of the
candidate BnDRG 17 gene was not successful with any of B. napus cultivars.
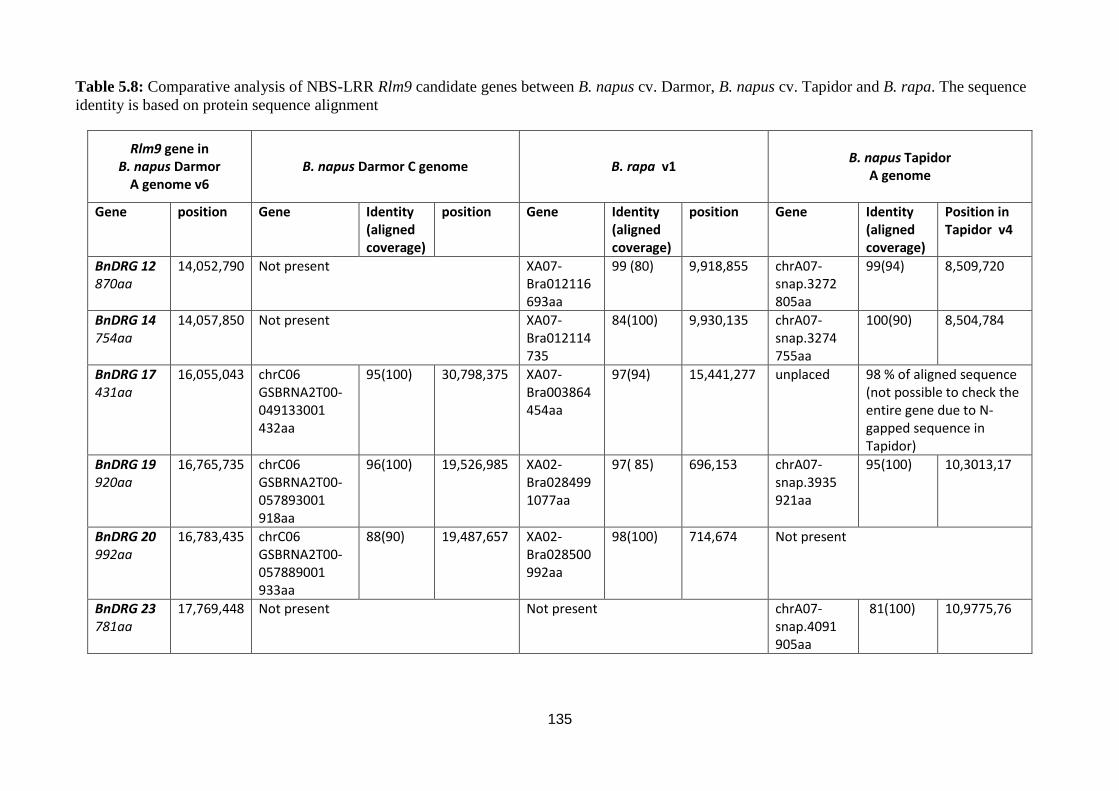
135
Table 5.8: Comparative analysis of NBS-LRR Rlm9 candidate genes between B. napus cv. Darmor, B. napus cv. Tapidor and B. rapa. The sequence
identity is based on protein sequence alignment
Rlm9 gene in B. napus Darmor
A genome v6 B. napus Darmor C genome B. rapa v1
B. napus Tapidor A genome
Gene position Gene Identity (aligned coverage)
position Gene Identity (aligned coverage)
position Gene Identity (aligned coverage)
Position in Tapidor v4
BnDRG 12 870aa
14,052,790 Not present XA07-Bra012116 693aa
99 (80)
9,918,855 chrA07-snap.3272 805aa
99(94)
8,509,720
BnDRG 14 754aa
14,057,850 Not present XA07-Bra012114 735
84(100) 9,930,135 chrA07- snap.3274 755aa
100(90)
8,504,784
BnDRG 17 431aa
16,055,043 chrC06 GSBRNA2T00-049133001 432aa
95(100)
30,798,375 XA07-Bra003864 454aa
97(94)
15,441,277 unplaced
98 % of aligned sequence (not possible to check the entire gene due to N-gapped sequence in Tapidor)
BnDRG 19 920aa
16,765,735 chrC06 GSBRNA2T00-057893001 918aa
96(100)
19,526,985 XA02-Bra028499 1077aa
97( 85)
696,153 chrA07- snap.3935 921aa
95(100)
10,3013,17
BnDRG 20 992aa
16,783,435 chrC06 GSBRNA2T00-057889001 933aa
88(90)
19,487,657 XA02-Bra028500 992aa
98(100)
714,674 Not present
BnDRG 23 781aa
17,769,448 Not present Not present chrA07- snap.4091 905aa
81(100)
10,9775,76

136
Table 5.9: The coverage of Skipton and Ag-Spectrum sequence short reads of candidate Rlm9 genes on B. napus. The identity is based on gene
sequence alignment
Rlm9 gene in
B. napus Darmor
Sequence Reads B. napus Skipton
Sequence Reads B. napus Ag-Spectrum
Gene Coverage % Identity% Coverage % Identity%
BnDRG 13 3635bp
Very low coverage 5% 80% 98
BnDRG 14 2942bp
78% 98 Very low coverage 5%
BnDRG 17 1296 bp
No reads mapped to this gene
BnDRG 19 3183bp
99% 100 86% 99%
BnDRG 20 4029bp
96% 100 55% 99
BnDRG 23 2655bp
90 100 98 100

137
Figure 5.5: Comparison of deduced amino acid sequences of BnDRG 13 in B. napus Darmor A7 to its homologous genes in B. napus Tapidor and B.
rapa.

138
Figure 5.6: Comparison of deduced amino acid sequences of BnDRG 14 in B. napus Darmor A7 to its homologous genes in B. napus Tapidor A7 and
B. rapa.

139
Figure 5.7: Comparison of deduced amino acid sequences of BnDRG 17 in B. napus Darmor A7 to its homologous genes in B. napus Darmor C6 and
B. rapa.

140
Figure 5.8: Comparison of deduced amino acid sequences of BnDRG 19 in B. napus Darmor A7 to its homologous genes in B. napus Darmor C6, B.
napus Tapidor A7 and B. rapa.

141
Figure5.8:continued….

142
Figure 5.9: Comparison of deduced amino acid sequences of BnDRG 20 in B. napus Darmor A7 to its homologous genes in B. napus Darmor C6 and
B. rapa.

143
Figure 5.10: Comparison of deduced amino acid sequences of BnDRG 23 in B. napus Darmor A7 to its homologous genes in B. napus Tapidor A7.

144
Figure 5.11: Assembly of B. napus Skipton and Ag-Spectrum sequence short reads to B. napus
Darmor reference genome within the Rlm9 candidate resistance genes: BnDRG 12, BnDRG 13 ,
BnDRG 18 and BnDRG 19.

145
5.5 Discussion
5.5.1 Identification and characterization of NBS-LRR and LRR-containing genes on B.
napus chromosome A07
The fully sequenced B. napus genome has provided an invaluable resource in the identification and
comparative analysis of disease resistance genes. In total, 58 disease resistance genes were
identified on chromosome A7 of B. napus: 19 NBS-LRRs, 15 LRR-RLPs and 24 LRR-RLKs. The
NBS-LRR and LRR-containing genes have been demonstrated to play a major role in resistance to a
wide range of plant pathogens (Hulbert et al., 2001). In addition, the association and correlation
between disease resistance genes and QTL regions has been widely noted (Gebhardt and Valkonen,
2001, Quint et al., 2003, Wisser et al., 2005). This is suggesting that candidate resistance genes, co-
localized within QTL, are probably major genes contributing to qualitative resistance. In this study,
30 out of 58 genes in chromosome A7 were located with Rlm QTL. This region is of interest
harbouring five race specific blackleg resistance genes, Rlm1, Rlm3, Rlm4, Rlm7 and Rlm9.
It has been shown that blackleg resistance genes in B. napus such as Rlm1, Rlm3, Rlm4, Rlm7 and
Rlm9 are mapped to a genomic loci that correspond to the chromosome segment on Arabidopsis
harbouring AtRlm1 (Mayerhofer et al., 2005). AtRlm1 and another two genes, AtRlm2 and AtRlm3
have been identified as Arabidopsis thaliana Resistance to Leptosphaeria maculans gene. These
genes encode NBS-LRR proteins (Staal et al., 2006, Staal et al., 2008). Therefore, it could be
hypothesized that L. maculans resistance genes are related to the NBS-LRR protein family.
5.5.2 Comparative analysis of NBS-LRR and LRR-containing genes on chromosome A7
The identification of NBS-LRR and LRR-containing genes enabled the study of synteny,
collinearity and conservation between genes on chromosomes A7 and C6 with their homologous
counterparts in B. rapa and B. oleracea. The number of NBS-LRR and LRR-containing genes
between the three species were consistent suggesting that they might have been maintained and not
affected much during the formation of B. napus.
This comparison showed that the majority of genes were conserved and collinear between the
chromosomes A7 and its homeologous chromosome C6 in Brassica species: B. napus, B. rapa and
B. oleracea. However, there were considerable variations, collinearity, presence/absence or
substantial differences in the protein sequence of several NBS-LRR and LRR-containing genes.
This might be due to genome mis-assembly or genomic rearrangements. The genomic
rearrangements may imply genome structural changes such as translocations.

146
The LRR-RLP and LRR-RLK genes were more highly conserved than the NBS-LRR genes. This is
because NBS-LRR genes are often under diversifying selection, producing highly divergent
sequences and structural variants with distinct recognition capacities (Bai et al., 2002, Meyers et al.,
2003). By contrast, LRR-containing genes are under evolutionary pressure to maintain a specific
function (Fritz-Laylin et al., 2005). It has been hypothesized that LRR containing genes can play a
role in plant defence, as well as other biological processes. This makes them less likely to be
undergo diversifying selection than NBS-LRR genes (Leister, 2004, Guo et al., 2011). However,
such high sequence conservation in the LRR-containing genes does not rule out that LRR-
containing genes could be a potential candidate resistance gene. There are several examples
involving the LRR containing proteins in the plant resistance defence. For example, Cf genes in
tomato confer resistance against leaf mould disease caused by Cladosporium fulvum (Wulff et al.,
2009). LepR3 in B. rapa confers resistance to blackleg disease caused by L. maculans carrying
AvrLm1 (Larkan et al., 2013)
Furthermore, comparative analysis of NBS-LRR and LRR-containing genes between chromosome
A7 of B. napus and B. rapa as well as chromosomes A7 and C6 of B. napus were utilized to find
out how the structural diversity of resistance genes are associated with blackleg disease resistance.
A total of 12 NBS-LRR and 18 LRR-containing genes on B. napus chromosome A7 were identified
and located within the Rlm QTL region of interest.
The comparative analysis of resistance genes in the Rlm QTL region between B. napus and B. rapa
chromosome A7, as well as between B. napus chromosomes A7 and C6 confirmed the nature of
gene conservation with regards to gene order, content and sequence similarity. Even though there
were considerable variations; either gene presence/absence or substantial differences in the protein
sequence, there was significant structural conservation in the majority of resistance genes between
chromosome A7 of B. napus and B. rapa. In contrast, there was not high structural conservation
between chromosomes A7 and C6 of B. napus. For instance, more than 90 % of the resistance genes
have been retained in chromosome A7, whereas, about 50% of the resistance genes were found to
be duplicated between chromosomes A7 and C6. A previous studies (Fopa Fomeju et al., 2014)
found that the genomic region involved in resistance to blackleg in B. napus is expected to be linked
to the significant structural conservation between B. napus and B. rapa, but not between B. napus
and B. oleracea, because the source of blackleg resistance is only contributed by the A genome and
none has been found on the C genome (Rouxel et al., 2003b, Ananga et al., 2006, Leflon et al.,
2007). Therefore, it can be hypothesized that the resistance gene involved in blackleg resistance is
supposed to be retained in B. napus and B. rapa, however, some genome rearrangements or

147
sequence variation might have occurred during the formation of B. napus. Several candidate
resistance genes were identified underlying the Rlm QTL region of blackleg resistance on B. napus
chromosomeA7. These genes were orthologous and conserved with chromosome A7 of B. rapa,
but, they were not homeologous or showed substantial protein differences on B. napus chromosome
C6.
This study revealed that there is high functional conservation of resistance genes on chromosome
A7 of B. napus and B. rapa compared to chromosomes A7 and C6 of B. napus by Rlm QTL
comparison. This information provides an invaluable resource to identify a number of candidate
genes associated with blackleg disease resistance and further characterisation of the Rlm QTL
region is likely to resolve whether the various Rlm genes are distinct or different allelic versions of
the same blackleg resistance genes.
5.5.3 Haplotype analysis of Rlm9 and mapping potential SNPs on B. napus
The Illumina Infinium SNP data was used to study the association between the SNP alleles and
blackleg resistance. This allows identification of or narrowing down the list of candidate genes
underlying the blackleg resistance QTL region. In this study, the haplotype analysis revealed that
the SNPs showed a random pattern of polymorphism and was not perfectly showing association
between SNPs and the Rlm9 resistance and susceptibility. However a set of ten SNPs with a good
correlation towards Rlm9 resistance were identified. Five of the six cultivars predicted to be Rlm9
resistance were shown to carry SNP alleles that strongly correlated to Rlm9 resistance allele of cv.
Darmor at the SNPs assayed. Ag-Spectrum, one of the predicted resistant lines, had no Darmor
resistant allele in any of the selected SNP. But, it revealed an allele that was consistent with the
susceptible lines. This is probably because Ag-Spectrum is heterozygous for resistance towards the
Rlm9 gene (Raman et al., 2012b). In contrast, five of the ten cultivars predicted to be Rlm9
susceptible were shown to carry alleles that associated with the Rlm9 susceptible allele in Yudal at
the SNP assayed. However, there were five cultivars showed a good correlation to the resistant line
by having a Darmor resistant allele even though they are predicted to be Rlm9 susceptible.
It is could be assumed that there was misinterpretation of the phenotypic data for these cultivars due
to subjectivity or errors during the phenotyping process. It is often difficult to determine how much
of phenotypic variation is explained in the literature. In addition, the Rlm9-mediated response is
heat-sensitive. Therefore, the phenotypic analysis is particularly difficult to analyse and often
conflicting results are found in the literature (J. Batley, personal communication). Thus, it is highly
recommended to re-phenotype these cultivars to determine the true results in the future.

148
A number of the identified SNPs were located in the 3’ UTR and 5’ UTR of predicted genes. This
might suggest the involvement of transcription factors or regulatory factors in Rlm9 resistance.
Furthermore, sequence analysis of the predicted genes with these potential SNPs is required to
reveal whether there are any predicted genes that could be involved or work together with the
candidate Rlm9 genes.
5.5.4 The physical location and identification of candidate Rlm9 blackleg resistance gene in
B. napus
An Rlm9 QTL has been identified on chromosome A7 through a marker based approach where
linked markers were physically mapped to the reference B. napus genome (Delourme et al., 2004).
Based on the 60K SNP haplotype analysis, the potential ten SNPs, identified were mapped and
positioned along the Rlm9 QTL region on the chromosome A7. This result further strengthens the
hypothesis that Rlm9 lies somewhere within the targeted QTL region.
The Rlm QTL region on chromosome A7 co-localized with 12 NBS-LRR and 18 LRR-containing
genes in B. napus. These resistance genes could be candidates for blackleg disease resistance.
However, The A7 chromosome harbours several Rlm QTL regions underlying blackleg disease
resistance, where a cluster of blackleg resistance genes reside such as Rlm9, Rlm4, Rlm7, Rlm3 and
Rlm1 as identified previously (Delourme et al., 2004). In this study, this comparative analysis
confirmed that there were genes within the Rlm QTL region, particularly in Rlm9 QTL of interest
showed considerable variations, collinearity, presence/absence or substantial differences in the
protein sequence.
Based on these results, therefore, six NBS-LRR and eight LRR-containing genes were identified
and associated with the Rlm9 QTL region. The NBS-LRR genes were selected for further analysis.
The genes are referred to as BnDRG 13 BnDRG 14, BnDRG 17, BnDRG 19, BnDRG 20 and
BnDRG 23. Comparative analysis has made it possible to further investigate the structural diversity
in terms of protein sequence conservation or presence/absence between B. napus cv. Darmor and
other related species such as B. napus cv.Tapidor and B. rapa. This allowed initial prediction and
prioritization for targeting these candidate genes. The BnDRG 13 and BnDRG 14 genes were
considered as possible candidate genes because they were highly conserved and showed structural
difference in the CC domain between B. rapa and B. napus. They are presents as singleton gene in
B. napus without a homeologous (duplicate copy) in the B. napus C genome.

149
Since blackleg resistance was found to be contributed by the A genome of B. napus and B. rapa,
this implies that the resistance gene might be present with sequence variation in both species. The
BnDRG 23 was not considered as strong candidate gene because it is not present in the A genome of
B. rapa. The genes BnDRG 17, BnDRG 19 and BnDRG 20 were prioritized as the most promising
candidate genes. The genes BnDRG 19, BnDRG 20 were not syntenic and non-collinear between B.
napus Darmor and B. rapa. The gene BnDRG 19 was highly conserved and showed structural
difference as the TIR domain is present in the B. rapa but not in the B. napus gene. The gene
BnDRG 19 was highly conserved in B. rapa and showed substantial sequence variations in the B.
napus C genome duplicate. This gene was initially not found in B. napus cv. Tapidor. The genes
BnDRG 19 and BnDRG 20 had high sequence read coverage in Skipton and low sequence reads
coverage in Ag-Spectrum. The low sequence reads coverage in Ag-Spectrum may be due to
significant sequence variation or loss. It may also be explained by the fact that Ag-Spectrum is
heterozygous for resistance towards Rlm9 gene.
The gene BnDRG 17 was highly conserved between B. napus Darmor and B. rapa but not collinear.
This gene was found in B. napus cv. Tapidor but due to genome assembly issue of presence of N-
gapped sequence, it was not possible to compare the gene sequence between the cultivars Darmor
and Tapidor. In addition, this gene had no sequence read coverage for both Skipton and Ag-
Spectrum. Preliminary analysis of the genomic region where BnDRG 17 resides is believed to be a
complex region in Darmor as the assembly is not accurate. However, since sequencing of the
BnDRG 17 gene is yet to be obtained, it is still as a strong candidate Rlm9 gene possible and efforts
to fully sequence the gene should be continued.
In conclusion, the comparison of NBS-LRR and LRR-containing genes between the four
chromosomes for the three species: B. napus, B. napus and B. oleracea not only confirmed genomic
microsynteny and conservation between Brassica species but, also provided an invaluable resource
in the identification and prioritization of candidate resistance genes
5.5.5 Amplification and sequencing Rlm9 candidate genes
In this study, sequencing of four Rlm9 candidate genes was attempted to identify polymorphisms in
the identified Rlm9 candidate genes between the resistant and the susceptible cultivars. The
complexity of the QTL region of interest due to genome duplication and rearrangement events has
complicated the PCR amplification. It may be worthwhile in future to use different PCR approaches
in amplification and sequencing the Rlm candidate genes such as RACE-PCR or even advanced

150
approaches such as targeted sequence capture (Salmon et al., 2012, Winfield et al., 2012) or
resistance gene enrichment sequencing (Jupe et al., 2013).
Despite that, BnDRG 13, BnDRG 14 and BnDRG 23 candidate genes were successfully amplified
which revealed that there was no sequence polymorphism between two contrasting Rlm9 cultivars,
Darmor and Yudal. This clearly indicates that these genes are not a candidate Rlm9 gene.
The sequence for BnDRG 19 and BnDRG 20 genes between two contrasting Rlm9 cultivars,
Darmor and Yudal and other B. napus cultivars such as Skipton, was successful and showed 100%
identity without any polymorphism observed. However, BnDRG 19 and BnDRG 20 failed to
amplify from B napus Ag-Spectrum. This is supported by the low sequence reads coverage
(presence gapped sequence) which might have caused failure of amplification of Ag-Spectrum. I
believe that it is too early to make a deduction either to eliminate or to strongly nominate these
genes BnDRG 19 and BnDRG 20 from the blackleg candidate gene list. These two genes might be
of interest to be further investigated between other Rlm cultivars such as Rlm4. The Rlm9 QTL
region is believed to overlap or be adjacent to the Rlm4 QTL. These results confirmed the findings
of Delourme et al., (2004) stating that the QTLs for Rlm4 and Rlm9 are located next to each other.
The BnDRG 20 gene was not initially present in B. napus cv. Tapidor but that may be due to an
assembly problem, making the mapping and sequence comparison impossible. However, it was
confirmed by PCR and sequencing that this gene is present in B. napus cv. Tapidor with 100%
DNA sequence identity to B. napus cv. Darmor. This indicates that there is missing sequence
information resulting from the genome mis-assembly.
There is still one candidate gene BnDRG 17 that amplification has been attempted for, but has been
unsuccessful. This may be due to the assembly issue. This gene is still strong candidate gene to be
considered for future sequencing.
While sequencing and validation of these candidates must still occur, this study has proven that
candidate gene comparative analysis is quick and is becoming more affordable due to the generation
sequencing getting faster and cheaper. This method should occur in the future discovery of genes of
interest in Brassicas and can be followed in other crop species. In conclusion, none of the Rlm9
NBS-LRR candidate genes, that have been sequenced, showed a significant polymorphism
associated with Rlm9. However, it appears that one of LRR-containing genes located on
chromosome A7 is likely to be a candidate. There are eight LRR containing genes identified within
the Rlm9 QTL region that could become a strong prospect for further analysis.

151
The list of disease resistance genes in B. napus chromosome A07 is certainly not complete. The B.
napus cv. Darmor genome sequence still contains unmapped contigs and the presence of N-gapped
sequences. This means that valuable sequence information is missing. I believe that one sequenced
genome does not sufficiently facilitate identification of the total number of disease resistance genes.
This is probably because the resistance genes are often located within unannotated regions of the
genome or they may be interrupted by gapped sequence leading to separation the gene into different
partial genes. There are artefacts from genome assembly and annotation that could potentially cause
identification of gene loss. For instance, the gene BnDRG 20 in the B. napus cv. Darmor genome
assembly was not present in the B. napus cv. Tapidor genome assembly in the comparative analysis.
However, the presence of the gene was confirmed in B. napus cv. Tapidor by PCR in this study.
Moreover, some resistance genes may be present in one genotype or cultivars but absent in another
exhibiting presence/absence variation (PAV). This causes differences in the NBS-LRR genes
number between cultivars. Therefore, the improved and revised genome assembly and re-
sequencing of other B. napus cultivars will definitely result in identification of additional resistance
genes.

152
Chapter 6
General discussion and future
directions

153
Chapter 6 : General discussion and future directions
This thesis aims to provide the foundation for study of the conservation and evolution of disease
resistance genes in Brassica napus. The availability of genome sequences and comparative analysis
together with disease resistance QTL mapping is an invaluable resource to study functional and
structural variations of NBS-LRR resistance genes between Brassica species. Hence, the
comparative analysis between Brassica species is likely to identify number of resistance genes that
affect important disease traits in Brassica. This study provides a good starting point in the effort to
identify and sequence candidate blackleg resistance (Rlm) genes in B. napus.
6.1 Genome wide identification of NBS-LRR resistance genes in Brassica
For the discovery of candidate genes involved in traits of interest, the genome wide identification of
NBS-LRR resistance genes has become an essential component for better understanding of the
genomics and evolution of resistance genes. Thus, the main focus was to characterize the NBS-LRR
genes with regards to their structural diversity, conservation, domain structure, chromosomal
locations, gene cluster and duplications. More importantly, it aimed to identify more genes with
NBS-LRR characteristics that could be potential candidates for disease resistance in Brassica.
In this study, a total of 641 NBS-LRR genes in the B. napus cv. Darmor were identified. This is
compared to 249 and 443 genes identified in B. rapa and B. oleracea, respectively. The
comparative analysis provided evidence that NBS-LRR genes in B. napus genome exhibited similar
distribution, structure and syntenic relationships to its progenitor species. The gene contents and
order on B. napus chromosomes are generally very similar to those on the corresponding
chromosomes of the diploid progenitors. Overall, these comparisons did not show massive
differences of NBS-LRR in B. napus as compared to its parental species.
To address the question as to what extent resistance genes are structurally conserved between
Brassica species, the NBS-LRR genes with their genomic structure was compared. There was
evidence that the 50% of NBS-LRR genes showed high synteny and collinearity between the A
genome of B. napus and B. rapa and the C genome of B. napus and B. oleracea. They were
positionally well conserved in size and orientation particularly regions containing major gene
clusters. Thus, it appears that these NBS-LRR genes in B. rapa and B .oleracea species may have
undergone similar selection pressure and they might have not been largely affected during the
formation of B. napus. In other words, B. napus might have been subjected to less evolutionary
selection or pressure leading to maintaining NBS-LRR properties with its diploid progenitors.

154
The majority of B. napus NBS-LRR genes have orthologues in the progenitor species providing
evidence of evolution and genome duplication. More than 60% of NBS-LRR genes from the
progenitor species were conserved and maintained in B. napus. The differences in NBS-LRR gene
conservation could be attributed to gene losses or selection pressure to offer species-specific
resistance gene. After hybridisation of B. rapa and B. oleracea to form B. napus, NBS-LRR genes
in Brassica species experienced species-specific gene deletion resulting in gene losses. Similar
phenomenon of redundant NBS-LRR gene loss have also been reported in other plant genomes,
presumably because the duplicates would have had redundant functions (Bancroft, 2001, Rana et
al., 2004). At the same time, the gene duplication and recombination have also created novel NBS-
LRR resistance genes specific to B. napus and have resulted in substitutes the gene number to
compensate the gene losses during formation of B. napus.
It has been shown that the level of gene duplication in the B. napus genome is significant and
increases the genomic complexity (Parkin et al., 2003, Rana et al., 2004, Parkin et al., 2005). This is
also seen by the finding that 50% of B. napus NBS-LRR genes were identified as duplicates. The
NBS-LRR duplications exhibited the similar patterns and homeologous collinear between the two
sub-genomes of B .napus.
Previous genetic and genomics studies demonstrated that the majority of NBS-LRR genes are
present in gene clusters in plant genomes (Hulbert et al., 2001). The clustered arrangement of these
genes may be a critical attribute of the generation of novel resistance specificities via gene
duplication or recombination (Meyers et al., 2003). Indeed, previous studies revealed that NBS-
LRR genes are often present as tightly linked genes with high homology and are prone to gene
duplication and recombination, and thus evolve more rapidly than the rest of the genome (Grant et
al., 1998, Wei et al., 2013). Thus, the clustering of NBS-LRR genes provides a reservoir of genetic
variation by which new specificities to pathogens can evolve and allows for rapid evolutionary
response to pathogen effectors. This study found that 59% of the NBS-LRR genes in Brassica
species were found to be physically clustered and individual genes involved in clusters were more
polymorphic and subject to evolutionary selection pressure. This was further supported by the
observation that there was high conservation in genes involved in gene cluster than singleton genes.
The relative contributions of gene clustering and duplication in generating diversity in resistance
gene specificities remain to be further determined. However, duplication and divergent selection
may apparently play a major role in the evolution of resistance to major pathogens. A complex
pattern of tandem duplications was identified in the B. napus genome particularly within a gene
cluster suggesting that gene clusters could be chromosomal hot spots in which the NBS-LRR genes

155
get duplicated and expanded by tandem duplication followed by selection pressure. In addition,
there was a significant correlation and co-localization between the number of NBS-LRR genes
within the QTL intervals and the number of genes involved in gene clusters or duplication. The
results provide evidence that NBS-LRR are distributed and clustered throughout the genome and
tend to be linked and associated with disease resistance QTL. However, because the genomic
duplication reported in this study based on NBS-LRR genes tend to be insufficient to provide a
better resolution about the genomic structure around the NBS-LRR. Therefore, it may be
worthwhile to conduct large-scale NBS-LRR duplication analysis by including predicted genes
flanking the NBS-LRR genes.
To conclude, evidence for resistance gene clustering and duplication within Brassica species should
now be further used to study the sequence and structural variation within disease resistance QTL. It
is possible that clustered and duplicated resistance genes underlying the QTL of interest are likely
to be major components of the resistance and cause resistance gene specificities.
6.2 Identification of candidate blackleg resistance genes in B. napus
Genetic studies have identified the gene for gene interactions between Avr genes in L. maculans and
their corresponding Rlm (Resistance to Leptosphaeria maculans) genes in B. napus. In addition,
genetic mapping studies have shown that in B. napus there are five specific major blackleg
resistance genes: Rlm1, Rlm3, Rlm4, Rlm7, and Rlm9 on chromosome A7 (Delourme et al., 2004,
Mayerhofer et al., 2005, Ananga et al., 2006). It remains unclear whether these genes are a cluster
of tightly linked genes, or a single gene with different alleles, or a combination of both. Even
though QTL mapping of quantitative resistance to L. maculans has been pursued in B. napus, none
of the genetically mapped Rlm genes in chromosome A7 have been sequenced and validated in B.
napus.
The chromosomal region of Rlm QTL for blackleg resistance shows genome complexity. The
physical location of disease resistance QTL or even a major resistance gene in complex genome
such as B. napus is highly challenging. This is complicated by genome duplications and tandem
intra-chromosomal duplication between homeologous chromosomes which make characterization
of genes underlying QTL of interest extremely difficult. For example, several overlapping QTL
intervals for blackleg resistance genes Rlm9, Rlm7, Rlm4, Rlm3 and Rlm1 were genetically
identified on chromosome A7 of B. napus (Delourme et al., 2004). In addition, these QTL are
located within an extensive intra-chromosomal tandem duplication region (Raman et al., 2012b,
Tollenaere et al., 2012). Thus, the identification of candidate blackleg resistance gene(s) in B. napus
156
might also identify other blackleg resistance genes and elucidate their conservation and evolution in
Brassica species.
The resistance gene mediated blackleg resistance is inherited qualitatively. In addition, the source of
blackleg resistance is only contributed by the A genome and none found on the C genome. This is
due to significant structural conservation between B. napus and B. rapa and absence of blackleg
resistance sources in B. oleracea. However, paralogous genes in B. napus should have specific
recognition created by selective pressure to maintain the resistance source origin in the A genome.
Therefore, it can be hypothesized that the resistance genes involved in blackleg resistance should be
retained and conserved in the A genome of B. napus and B. rapa, whereas the resistance gene is
probably absent or highly divergent in the C genome of B. napus and B. oleracea.
In this study, co-mapping of QTL intervals identified in B. napus to its related species, B. rapa and
B. oleracea indicates that the QTL intervals in B. napus were originally contributed by the parental
species. The comparative QTL between B. napus, B. rapa and B. oleracea revealed the majority of
NBS-LRR genes in associated QTL intervals are syntenic and conserved. However, there were
differences in the number of associated NBS-LRR genes and the disease QTL interval sizes
between QTL regions in B. napus compared to its parental species. This suggests that the QTL
underlying resistance traits might show more structural and functional conservation towards one of
the B. napus progenitor species. There was a significant correlation and co-localization between the
number of NBS-LRR genes within the QTL intervals and the number of genes involved in gene
clusters or duplication. This is consistent with previous studies (Jeong et al., 2001, Wang et al.,
2010). The complex structure of QTL can be as a result of resistance gene cluster and duplication
leading to closely linked genes which differ in their pathogen race specificity (Michelmore and
Meyers, 1998). This implies that gene clusters are a good starting point for studying functional
molecular mechanisms and evolution of NBS-LRR resistance genes underlying resistance traits.
The identification of candidate blackleg resistance genes in B. napus by map-based cloning
approaches is a laborious and time consuming effort. Therefore, another approach which can be
undertaken is direct identification of candidate genes through next generation sequencing and whole
genome NBS-LRR analysis. This approach, combined with genome comparative analysis, allows
studying the genomic region for the disease resistance QTL with respect to the NBS-LRR genes
conservation and syntenic relationships between related species. This could facilitate the rapid
selection of putative candidate NBS-LRR genes involving in the blackleg resistance in Brassica.

157
Since chromosome A7 in B. napus was the major of interest in this study carrying major sources of
blackleg resistance genes in Brassica, The comparative analysis enabled me to study the synteny,
collinearity and conservation between NBS-LRR and LRR-containing genes on A7 and C6 with
their homologous counterparts in B. rapa and B. oleracea. In general, there was significant
structural conservation in the majority resistance genes between chromosome A7 of the B. napus
and B. rapa. However, there were considerable variations either as gene presence/absence or
substantial sequence differences for several resistance genes.
Interestingly, of the total NBS-LRR and LRR-containing genes identified on the chromosome A7 of
B. napus, there were 12 NBS-LRR and 18 LRR-containing genes underlying blackleg resistance
Rlm QTL. These resistance genes could be Rlm9, Rlm4, Rlm7, Rlm3 or Rlm1 candidates for
blackleg disease resistance. The Rlm QTL comparison analysis revealed that these genes were
orthologous and conserved in A7 B. rapa, but, they were not homeologous or showed substantial
protein differences in B. napus C6. Furthermore, the comparative analysis confirmed that there were
genes within the Rlm QTL region, particularly in Rlm9 QTL of interest showed considerable
variations, collinearity, presence/absence or substantial differences in the protein sequence
In this study, identification and characterization of Rlm9 candidate genes was attempted. A QTL for
the Rlm9 gene has been identified from a mapping population derived from crossing B. napus cv.
Darmor to cv. Yudal (Delourme et al., 2004). This QTL is located on chromosome A7 of B. napus,
which also contains other resistance genes: Rlm1, Rlm3, Rlm4 and Rlm7. In this study, six NBS-
LRR and eight LRR-containing genes were associated with Rlm9 QTL region. The NBS-LRR genes
were selected for further analysis. These genes are referred to as BnDRG 13 BnDRG 14, BnDRG
17, BnDRG 19, BnDRG 20 and BnDRG 23. The comparative analysis between Brassica species and
cultivars has made it possible to make initial prediction and prioritization for targeting these
identified genes. PCR amplification and sequencing confirmed that five of these candidate genes
showed no polymorphisms associated with Rlm9 resistance/susceptibility. However, there is still
one candidate BnDRG 17 gene considered a potential candidate gene for future sequencing. In
addition, it appears that LRR-containing genes identified within the Rlm9 QTL region could
become a strong prospect for further analysis.
The results of this study have also been used to identify and sequence other blackleg resistance
genes on chromosome A7 in B. napus such as Rlm4 and Rlm1. The sequencing and validation of
these candidate genes is still underway in our laboratory.

158
Although there has been relatively little research on the isolation and sequencing of blackleg
resistance genes in Brassica, this work has significantly increased our understanding of the
resistance genes organization and association in Brassica where several members of NBS-LRR
resistance genes on A7 that could confer resistance to blackleg resistance have been identified.
Furthermore, the comparative analyses yield valuable insight into the understanding of the structure,
evolution and organization of NBS-LRR genes in Brassica genomes.
6.3 Future directions
The identification of blackleg resistance genes in B. napus remains a key objective. To date, the
complete genome sequence of only one B. napus cv. Darmor (carrying Rlm9 resistance gene) is
available and used as reference genome in this study. This is why progress has been steady in
detailed genetic analysis of blackleg resistance even though considerable progress has been made in
genomics analysis of resistance genes between B. napus and its progenitor species. Therefore, it
would be even more useful to sequence B. napus cultivars with different Rlm gene composition in
the near future. However, caution is required to overcome the sequencing and assembly problems
that cause complications in the analysis. I would recommend that future work should be carried out
which will increase the quality and quantity of genomic sequence information within Brassica
species or cultivars providing the opportunity to conduct extensive comparative studies. This
includes:
Chromosome-based sequencing
It has been shown that genomic sequencing approaches can result in an error during the sequencing
or assembly and mis-mapping contigs associated with the nature of B. napus polyploidy. Thus,
alongside application of the genome sequence and NGS, another approach is to be undertaken to
overcome the Brassica genome complexity and mis-assembly problems, such as chromosome-
based sequencing. The analysis of sequence at the single chromosome level is a convenient means
of verifying genome sequence assemblies and increases the quantity of genomic information to
conduct more comparative studies within or between related species (Ruperao et al., 2014) . The
chromosome genomics approach has been successfully adapted in the wheat genome sequencing
(The International Wheat Genome Sequencing Consortium, 2014). Thus, chromosome sequence
comparisons and functional analysis will allow analysing candidate genes organization and
evolution and dissection of the molecular basis of specificity and allelic variations.

159
Copy number variation
Copy number variation (CNV) refers to differences in the number of gene loci between different
genotypes either species or cultivars. This structural variation (SV) is often observed as large
deletions or duplications and occurs from single genes to multi-genic regions. It is likely that
structural variation may play a role in the resistance. There is evidence that structural variation such
as copy number variations is associated with disease resistance and this variation is co-localized
with QTL and resistance genes (Cook et al., 2012, Jamann et al., 2014). Thus, it is possible that
structural variation, such as copy number variation and tandem repeats, rather than the sequence
variation between Brassicas species could play an important role in blackleg
resistance/susceptibility. Therefore, I would suggest future efforts should be devoted to identify any
CNVs associated with resistance genes using re-sequencing approach where sequence reads from
individual B. napus cultivars are assembled to the reference genome. The reference B. napus
Darmor genome could now be used as a template for re-sequencing of NBS-LRR profile from
diverse B. napus cultivars. This, indeed, will provide further motivation to study the effect of gene
duplication or sequence tandem repeats on the disease resistance genes.

160
Bibliography
Alabaça, C. S. 2009. Identification of molecular markers linked to downy mildew resistance gene,
PpALG1 in Brassica oleracea var tronchuda ,. PhD Thesis, University of Algarve, Portugal.
Alcázar, R. & Parker, J. E. 2011. The impact of temperature on balancing immune responsiveness
and growth in Arabidopsis. Trends in Plant Science, 16, 666-675.
Altschul, S. F., Madden, T. L., Schäffer, A. A., Zhang, J., Zhang, Z., Miller, W. & Lipman, D. J.
1997. Gapped BLAST and PSI-BLAST: a new generation of protein database search
programs. Nucleic Acids Research, 25, 3389-3402.
Ameline-Torregrosa, C., Wang, B.-B., O'Bleness, M. S., Deshpande, S., Zhu, H., Roe, B., Young,
N. D. & Cannon, S. B. 2008. Identification and Characterization of Nucleotide-Binding
Site-Leucine-Rich Repeat Genes in the Model Plant Medicago truncatula. Plant Physiology,
146, 5-21.
Ananga, A. O., Cebert, E., Soliman, K., Kantety, R., Pacumbaba, R. P. & Konan, K. 2006. RAPD
markers associated with resistance to blackleg disease in Brassica species. African Journal
of Biotechnology, 5, 2041-2048.
Ansan-Melayah, D., Balesdent, M. H., Delourme, R., Pilet, M. L., Tanguy, X., Renard, M. &
Rouxel, T. 1998. Genes for race-specific resistance against blackleg disease in Brassica
napus L. Plant Breeding, 117, 373-378.
AOF 2014. Australian Oilseeds Federation, Crop Reports. available at
http://www.australianoilseeds.com/oilseeds_industry/crop_report_assets. Australian
Oilseeds Federation.
Appleby, N., Edwards, D. & Batley, J. 2009. New Technologies for Ultra-High Throughput
Genotyping in Plants. In: GUSTAFSON, J. P., LANGRIDGE, P. & SOMERS, D. J. (eds.)
Plant Genomics. Humana Press.
Ashfield, T., Egan, A. N., Pfeil, B. E., Chen, N. W. G., Podicheti, R., Ratnaparkhe, M. B., Ameline-
Torregrosa, C., Denny, R., Cannon, S., Doyle, J. J., Geffroy, V., Roe, B. A., Saghai Maroof,
M. A., Young, N. D. & Innes, R. W. 2012. Evolution of a Complex Disease Resistance
Gene Cluster in Diploid Phaseolus and Tetraploid Glycine. Plant Physiology, 159, 336-354.
Bai, J., Pennill, L. A., Ning, J., Lee, S. W., Ramalingam, J., Webb, C. A., Zhao, B., Sun, Q.,
Nelson, J. C., Leach, J. E. & Hulbert, S. H. 2002. Diversity in Nucleotide Binding Site–
Leucine-Rich Repeat Genes in Cereals. Genome Research, 12, 1871-1884.
Bailey, T. L., Boden, M., Buske, F. A., Frith, M., Grant, C. E., Clementi, L., Ren, J., Li, W. W. &
Noble, W. S. 2009. MEME Suite: tools for motif discovery and searching. Nucleic Acids
Research, 37, W202-W208.
Bakker, E., Borm, T., Prins, P., van der Vossen, E., Uenk, G., Arens, M., de Boer, J., van Eck, H.,
Muskens, M., Vossen, J., van der Linden, G., van Ham, R., Klein-Lankhorst, R., Visser, R.,
Smant, G., Bakker, J. & Goverse, A. 2011. A genome-wide genetic map of NB-LRR disease
resistance loci in potato. Theoretical and Applied Genetics, 123, 493-508.
Balesdent, M.-H., Fudal, I., Ollivier, B., Bally, P., Grandaubert, J., Eber, F., Chèvre, A.-M., Leflon,
M. & Rouxel, T. 2013. The dispensable chromosome of Leptosphaeria maculans shelters an
effector gene conferring avirulence towards Brassica rapa. New Phytologist, 198, 887-898.
Balesdent, M. H., Attard, A., Ansan-Melayah, D., Delourme, R., Renard, M. & Rouxel, T. 2001.
Genetic Control and Host Range of Avirulence Toward Brassica napus Cultivars Quinta and
Jet Neuf in Leptosphaeria maculans. Phytopathology, 91, 70-76.
Balesdent, M. H., Attard, A., Kühn, M. L. & Rouxel, T. 2002. New Avirulence Genes in the
Phytopathogenic Fungus Leptosphaeria maculans. Phytopathology, 92, 1122-1133.
Bancroft, I. 2001. Duplicate and diverge: the evolution of plant genome microstructure. Trends in
Genetics, 17, 89-93.
Batley, J. & Edwards, D. 2009. Genome sequence data: management, storage, and visualization.
BioTechniques, 46, 333–336.

161
Baumgarten, A., Cannon, S., Spangler, R. & May, G. 2003. Genome-Level Evolution of Resistance
Genes in Arabidopsis thaliana. Genetics, 165, 309-319.
Bendahmane, A., Querci, M., Kanyuka, K. & Baulcombe, D. C. 2000. Agrobacterium transient
expression system as a tool for the isolation of disease resistance genes: application to the
Rx2 locus in potato. The Plant Journal, 21, 73-81.
Bent, A. F. 1996. Plant Disease Resistance Genes: Function Meets Structure. The Plant Cell Online,
8, 1757-1771.
Bevan, M., Bancroft, I., Bent, E., Love, K., Goodman, H., Dean, C., Bergkamp, R., Dirkse, W., Van
Staveren, M., Stiekema, W., Drost, L., Ridley, P., Hudson, S. A., Patel, K., Murphy, G.,
Piffanelli, P., Wedler, H., Wedler, E., Wambutt, R., Weitzenegger, T., Pohl, T. M., Terryn,
N., Gielen, J., Villarroel, R., De Clerck, R., Van Montagu, M., Lecharny, A., Auborg, S.,
Gy, I., Kreis, M., Lao, N., Kavanagh, T., Hempel, S., Kotter, P., Entian, K. D., Rieger, M.,
Schaeffer, M., Funk, B., Mueller-Auer, S., Silvey, M., James, R., Montfort, A., Pons, A.,
Puigdomenech, P., Douka, A., Voukelatou, E., Milioni, D., Hatzopoulos, P., Piravandi, E.,
Obermaier, B., Hilbert, H., Dusterhoft, A., Moores, T., Jones, J. D. G., Eneva, T., Palme, K.,
Benes, V., Rechman, S., Ansorge, W., Cooke, R., Berger, C., Delseny, M., Voet, M.,
Volckaert, G., Mewes, H. W., Klosterman, S., Schueller, C. & Chalwatzis, N. 1998.
Analysis of 1.9 Mb of contiguous sequence from chromosome 4 of Arabidopsis thaliana.
Nature, 391, 485-488.
Blanc, G. & Wolfe, K. H. 2004. Functional Divergence of Duplicated Genes Formed by Polyploidy
during Arabidopsis Evolution. The Plant Cell, 16, 1679-1691.
Brun, H., Chèvre, A. M., Fitt, B. D., Powers, S., Besnard, A. L., Ermel, M., Huteau, V., Marquer,
B., Eber, F., Renard, M. & Andrivon, D. 2010. Quantitative resistance increases the
durability of qualitative resistance to Leptosphaeria maculans in Brassica napus. New
Phytologist, 185, 285-299.
Cai, G., Yang, Q., Yang, Q., Zhao, Z., Chen, H., Wu, J., Fan, C. & Zhou, Y. 2012. Identification of
candidate genes of QTLs for seed weight in Brassica napus through comparative mapping
among Arabidopsis and Brassica species. Bmc Genetics, 13, 105.
Calenge, F., Van der Linden, C., Van de Weg, E., Schouten, H., Van Arkel, G., Denance, C. &
Durel, C. 2005. Resistance gene analogues identified through the NBS-profiling method
map close to major genes and QTL for disease resistance in apple. Theoretical and Applied
Genetics, 110, 660 - 668.
Cannon, S., Mitra, A., Baumgarten, A., Young, N. & May, G. 2004. The roles of segmental and
tandem gene duplication in the evolution of large gene families in Arabidopsis thaliana.
BMC Plant Biology, 4, 10.
Cannon, S. B., Zhu, H. Y., Baumgarten, A. M., Spangler, R., May, G., Cook, D. R. & Young, N. D.
2002. Diversity, distribution, and ancient taxonomic relationships within the TIR and non-
TIR NBS-LRR resistance gene subfamilies. Journal of Molecular Evolution, 54, 548-562.
Carlier, J. D., Alabaça, C. S., Sousa, N. H., Coelho, P. S., Monteiro, A. A., Paterson, A. H. &
Leitão, J. M. 2011. Physical Mapping in a Triplicated Genome: Mapping the Downy
Mildew Resistance Locus Pp523 in Brassica oleracea L. G3: Genes, Genomes, Genetics, 1,
593-601.
Carlier, J. D., Alabaça, C. A., Coelho, P. S., Monteiro, A. A. & Leitão, J. M. 2012. The downy
mildew resistance locus Pp523 is located on chromosome C8 of Brassica oleracea L. Plant
Breeding, 131, 170-175.
Carretero-Paulet, L. & Fares, M. A. 2012. Evolutionary Dynamics and Functional Specialization of
Plant Paralogs Formed by Whole and Small-Scale Genome Duplications. Molecular Biology
and Evolution, 29, 3541-3551.
Chagné, D., Batley, J., Edwards, D. & Forster, J. 2007. Single Nucleotide Polymorphism
Genotyping in Plants. In: ORAGUZIE, N., RIKKERINK, E. A., GARDINER, S. & SILVA,
H. N. (eds.) Association Mapping in Plants. Springer New York.

162
Chalhoub, B., Denoeud, F., Liu, S., Parkin, I. A. P., Tang, H., Wang, X., Chiquet, J., Belcram, H.,
Tong, C., Samans, B., Corréa, M., Da Silva, C., Just, J., Falentin, C., Koh, C. S., Le
Clainche, I., Bernard, M., Bento, P., Noel, B., Labadie, K., Alberti, A., Charles, M., Arnaud,
D., Guo, H., Daviaud, C., Alamery, S., Jabbari, K., Zhao, M., Edger, P. P., Chelaifa, H.,
Tack, D., Lassalle, G., Mestiri, I., Schnel, N., Le Paslier, M.-C., Fan, G., Renault, V., Bayer,
P. E., Golicz, A. A., Manoli, S., Lee, T.-H., Thi, V. H. D., Chalabi, S., Hu, Q., Fan, C.,
Tollenaere, R., Lu, Y., Battail, C., Shen, J., Sidebottom, C. H. D., Wang, X., Canaguier, A.,
Chauveau, A., Bérard, A., Deniot, G., Guan, M., Liu, Z., Sun, F., Lim, Y. P., Lyons, E.,
Town, C. D., Bancroft, I., Wang, X., Meng, J., Ma, J., Pires, J. C., King, G. J., Brunel, D.,
Delourme, R., Renard, M., Aury, J.-M., Adams, K. L., Batley, J., Snowdon, R. J., Tost, J.,
Edwards, D., Zhou, Y., Hua, W., Sharpe, A. G., Paterson, A. H., Guan, C. & Wincker, P.
2014. Early allopolyploid evolution in the post-Neolithic Brassica napus oilseed genome.
Science, 345, 950-953.
Cheng, F., Wu, J., Fang, L. & Wang, X. 2012a. Syntenic gene analysis between Brassica rapa and
other Brassicaceae species. Frontiers in Plant Science, 3.
Cheng, Y., Li, X., Jiang, H., Ma, W., Miao, W., Yamada, T. & Zhang, M. 2012b. Systematic
analysis and comparison of nucleotide-binding site disease resistance genes in maize. FEBS
Journal, 279, 2431-2443.
Cheung, F., Trick, M., Drou, N., Lim, Y. P., Park, J.-Y., Kwon, S.-J., Kim, J.-A., Scott, R., Pires, J.
C., Paterson, A. H., Town, C. & Bancroft, I. 2009. Comparative Analysis between
Homoeologous Genome Segments of Brassica napus and Its Progenitor Species Reveals
Extensive Sequence-Level Divergence. The Plant Cell, 21, 1912-1928.
Chèvre, A. M., Eber, F., This, P., Barret, P., Tanguy, X., Brun, H., Delseny, M. & Renard, M. 1996.
Characterization of Brassica nigra chromosomes and of blackleg resistance in B. napus-B.
nigra addition lines. Plant Breeding, 115, 113-118.
Chèvre, A. M., Barret, P., Eber, F., Dupuy, P., Brun, H., Tanguy, X. & Renard, M. 1997. Selection
of stable Brassica napus-B. juncea recombinant lines resistant to blackleg (Leptosphaeria
maculans). 1. Identification of molecular markers, chromosomal and genomic origin of the
introgression. Theoretical and Applied Genetics, 95, 1104-1111.
Chèvre, A. M., Brun, H., Eber, F., Letanneur, J. C., Vallee, P., Ermel, M., Glais, I., Li, H.,
Sivasithamparam, K. & Barbetti, M. J. 2008. Stabilization of resistance to Leptosphaeria
maculans in Brassica napus-B. juncea recombinant lines and its introgression into spring-
type Brassica napus. Plant Disease, 92, 1208-1214.
Cho, K., O’Neill, C. M., Kwon, S.-J., Yang, T.-J., Smooker, A. M., Fraser, F. & Bancroft, I. 2010.
Sequence-level comparative analysis of the Brassica napus genome around two stearoyl-
ACP desaturase loci. The Plant Journal, 61, 591-599.
Collier, S. M. & Moffett, P. 2009. NB-LRRs work a “bait and switch” on pathogens. Trends in
Plant Science, 14, 521-529.
Cook, D. E., Lee, T. G., Guo, X., Melito, S., Wang, K., Bayless, A. M., Wang, J., Hughes, T. J.,
Willis, D. K., Clemente, T. E., Diers, B. W., Jiang, J., Hudson, M. E. & Bent, A. F. 2012.
Copy Number Variation of Multiple Genes at Rhg1 Mediates Nematode Resistance in
Soybean. Science, 338, 1206-1209.
Crouch, J. H., Lewis, B. G. & Mithen, R. F. 1994. The Effect of A Genome Substitution on the
Resistance of Brassica napus to Infection by Leptosphaeria maculans. Plant Breeding, 112,
265-278.
Dalton-Morgan, J., Hayward, A., Alamery, S., Tollenaere, R., Mason, A., Campbell, E., Patel, D.,
Lorenc, M., Yi, B., Long, Y., Meng, J., Raman, R., Raman, H., Lawley, C., Edwards, D. &
Batley, J. 2014. A high-throughput SNP array in the amphidiploid species Brassica napus
shows diversity in resistance genes. Functional & Integrative Genomics, 1-13.
Dangl, J. L. & Jones, J. D. G. 2001. Plant pathogens and integrated defence responses to infection.
Nature, 411, 826-833.

163
Delourme, R., Pilet-Nayel, M. L., Archipiano, M., Horvais, R., Tanguy, X., Rouxel, T., Brun, H.,
Renard, M. & Balesdent, M. H. 2004. A cluster of major specific resistance genes to
Leptosphaeria maculans in Brassica napus. Phytopathology, 94, 578-583.
Delourme, R., Chèvre, A. M., Brun, H., Rouxel, T., Balesdent, M. H., Dias, J. S., Salisbury, P.,
Renard, M. & Rimmer, S. R. 2006. Major gene and polygenic resistance to Leptosphaeria
maculans in oilseed rape (Brassica napus). European Journal of Plant Pathology, 114, 41-
52.
Delourme, R., Brun, H., Ermel, M., Lucas, M. O., Vallee, P., Domin, C., Walton, G., Li, H.,
Sivasithamparam, K. & Barbetti, M. J. 2008. Expression of resistance to Leptosphaeria
maculans in Brassica napus double haploid lines in France and Australia is influenced by
location. Annals of Applied Biology, 153, 259-269.
Delourme, R., Barbetti, M. J., Snowdon, R., Zhao, J. & Manzanares-Dauleux, M. J. 2011. Genetics
and Genomics of Disease Resistance. In: KOLE, C. (ed.) Genetics, Genomics and Breeding
of Oilseed Brassicas. USA: Science Publishers
Diederichsen, E., Frauen, M., Linders, E. A., Hatakeyama, K. & Hirai, M. 2009. Status and
Perspectives of Clubroot Resistance Breeding in Crucifer Crops. Journal of Plant Growth
Regulation, 28, 265-281.
Dixelius, C. 1999. Inheritance of the resistance to Leptosphaeria maculans of Brassica nigra and B.
juncea in near-isogenic lines of B. napus. Plant Breeding, 118, 151-156.
Dodds, P. N., Lawrence, G. J., Catanzariti, A.-M., Teh, T., Wang, C.-I. A., Ayliffe, M. A., Kobe, B.
& Ellis, J. G. 2006. Direct protein interaction underlies gene-for-gene specificity and
coevolution of the flax resistance genes and flax rust avirulence genes. Proceedings of the
National Academy of Sciences, 103, 8888-8893.
Dodds, P. N. & Rathjen, J. P. 2010. Plant immunity: towards an integrated view of plant–pathogen
interactions. Nature Reviews Genetics, 11, 539-548.
Duran, C., Eales, D., Marshall, D., Imelfort, M., Stiller, J., Berkman, P. J., Clark, T., McKenzie, M.,
Appleby, N., Batley, J., Basford, K. & Edwards, D. 2010. Future tools for association
mapping in crop plants. Genome, 53, 1017-1023.
Durstewitz, G., Polley, A., Plieske, J., Luerssen, H., Graner, E. M., Wieseke, R. & Ganal, M. W.
2010. SNP discovery by amplicon sequencing and multiplex SNP genotyping in the
allopolyploid species Brassica napus. Genome, 53, 948-956.
Edwards, D. & Batley, J. 2010. Plant genome sequencing: applications for crop improvement. Plant
Biotechnology Journal, 8, 2-9.
Ellis, J., Dodds, P. & Pryor, T. 2000a. The generation of plant disease resistance gene specificities.
Trends in Plant Science, 5, 373-379.
Ellis, J., Dodds, P. & Pryor, T. 2000b. Structure, function and evolution of plant disease resistance
genes. Current Opinion in Plant Biology, 3, 278-284.
Ellis, J. G., Lawrence, G. J., Luck, J. E. & Dodds, P. N. 1999. Identification of regions in alleles of
the flax rust resistance gene L that determine differences in gene-for-gene specificity. The
Plant Cell, 11, 495-506.
Farinhó, M., Coelho, P., Carlier, J., Svetleva, D., Monteiro, A. & Leitão, J. 2004. Mapping of a
locus for adult plant resistance to downy mildew in broccoli (Brassica oleracea convar.
italica). Theoretical and Applied Genetics, 109, 1392-1398.
Farinhó, M., Coelho, P., Monteiro, A. & Leitão, J. 2007. SCAR and CAPS markers flanking the
Brassica oleracea L. Pp523 downy mildew resistance locus demarcate a genomic region
syntenic to the top arm end of Arabidopsis thaliana L. chromosome 1. Euphytica, 157, 215-
221.
Fernando, W. G. D., Chen, Y. & Ghanbarnia, K. 2007. Breeding for Blackleg Resistance: The
Biology and Epidemiology. In: SURINDER KUMAR GUPTA, M. D. & KADER, J. C.
(eds.) Advances in Botanical Research. Academic Press.

164
Ferreira, M. E., Rimmer, S. R., Williams, P. H. & Osborn, T. C. 1995a. Mapping loci controlling
Brassica napus resistance to Leptosphaeria maculans under different screening conditions.
Phytopathology, 85, 213-217.
Ferreira, M. E., Williams, P. H. & Osborn, T. C. 1995b. Mapping of a locus controlling resistance
to Albugo candida in Brassica napus using molecular markers. Phytopathology, 85, 218-
220.
Figdore, S. S., Ferreira, M. E., Slocum, M. K. & Williams, P. H. 1993. Association of RFLP
markers with trait loci affecting clubroot resistance and morphological characters in
Brassica oleracea L. Euphytica, 69, 33-44.
Fitt, B., Brun, H., Barbetti, M. & Rimmer, S. 2006. World-Wide Importance of Phoma Stem
Canker ( Leptosphaeria maculans and L. biglobosa ) on Oilseed Rape (Brassica napus).
European Journal of Plant Pathology, 114, 3-15.
Fopa Fomeju, B., Falentin, C., Lassalle, G., Manzanares-Dauleux, M. & Delourme, R. 2014.
Homoeologous duplicated regions are involved in quantitative resistance of Brassica napus
to stem canker. BMC Genomics, 15, 498.
Fourmann, M., Charlot, F., Froger, N., Delourme, R. & Brunel, D. 2001. Expression, mapping, and
genetic variability of Brassica napus disease resistance gene analogues. Genome, 44, 1083-
1099.
Friedman, A. & Baker, B. 2007. The evolution of resistance genes in multi-protein plant resistance
systems. Current Opinion in Genetics & Development, 17, 493 - 499.
Fritz-Laylin, L. K., Krishnamurthy, N., Tör, M., Sjölander, K. V. & Jones, J. D. 2005.
Phylogenomic analysis of the receptor-like proteins of rice and Arabidopsis. Plant
Physiology, 138, 611-623.
Fudal, I., Ross, S., Gout, L., Blaise, F., Kuhn, M. L., Eckert, M. R., Cattolico, L., Bernard-Samain,
S., Balesdent, M. H. & Rouxel, T. 2007. Heterochromatin-Like Regions as Ecological
Niches for Avirulence Genes in the Leptosphaeria maculans Genome: Map-Based Cloning
of AvrLm6. Molecular Plant-Microbe Interactions, 20, 459-470.
Ge, X. T., Li, H., Han, S., Sivasithamparam, K. & Barbetti, M. J. 2008. Evaluation of Australian
Brassica napus genotypes for resistance to the downy mildew pathogen, Hyaloperonospora
parasitica. Australian Journal of Agricultural Research, 59, 1030-1034.
Gebhardt, C. & Valkonen, J. P. 2001. Organization of genes controlling disease resistance in the
potato genome. Annual review of phytopathology, 39, 79-102.
Geffroy, V., Sévignac, M., De Oliveira, J. C. F., Fouilloux, G., Skroch, P., Thoquet, P., Gepts, P.,
Langin, T. & Dron, M. 2000. Inheritance of Partial Resistance Against Colletotrichum
lindemuthianum in Phaseolus vulgaris and Co-localization of Quantitative Trait Loci with
Genes Involved in Specific Resistance. Molecular Plant-Microbe Interactions, 13, 287-296.
Ghanbarnia, K., Fudal, I., Larkan, N. J., Links, M. G., Balesdent, M.-H., Profotova, B., Fernando,
W. G. D., Rouxel, T. & Borhan, M. H. 2015. Rapid identification of the Leptosphaeria
maculans avirulence gene AvrLm2 using an intraspecific comparative genomics approach.
Molecular Plant Pathology.
Giovannelli, J. L., Farnham, M. W., Wang, M. & Strand, A. E. 2002. Development of Sequence
Characterized Amplified Region Markers Linked to Downy Mildew Resistance in Broccoli.
Journal of the American Society for Horticultural Science, 127, 597-601.
Goff, S. A., Ricke, D., Lan, T.-H., Presting, G., Wang, R., Dunn, M., Glazebrook, J., Sessions, A.,
Oeller, P., Varma, H., Hadley, D., Hutchison, D., Martin, C., Katagiri, F., Lange, B. M.,
Moughamer, T., Xia, Y., Budworth, P., Zhong, J., Miguel, T., Paszkowski, U., Zhang, S.,
Colbert, M., Sun, W.-l., Chen, L., Cooper, B., Park, S., Wood, T. C., Mao, L., Quail, P.,
Wing, R., Dean, R., Yu, Y., Zharkikh, A., Shen, R., Sahasrabudhe, S., Thomas, A.,
Cannings, R., Gutin, A., Pruss, D., Reid, J., Tavtigian, S., Mitchell, J., Eldredge, G., Scholl,
T., Miller, R. M., Bhatnagar, S., Adey, N., Rubano, T., Tusneem, N., Robinson, R.,
Feldhaus, J., Macalma, T., Oliphant, A. & Briggs, S. 2002. A Draft Sequence of the Rice
Genome (Oryza sativa L. ssp. japonica). Science, 296, 92-100.

165
Gout, L., Fudal, I., Kuhn, M.-L., Blaise, F., Eckert, M., Cattolico, L., Balesdent, M.-H. & Rouxel,
T. 2006. Lost in the middle of nowhere: the AvrLm1 avirulence gene of the Dothideomycete
Leptosphaeria maculans. Molecular Microbiology, 60, 67-80.
Graham, M. A., Marek, L. F., Lohnes, D., Cregan, P. & Shoemaker, R. C. 2000. Expression and
genome organization of resistance gene analogs in soybean. Genome, 43, 86-93.
Grandclément, C. & Thomas, G. 1996. Detection and analysis of QTLs based on RAPD markers for
polygenic resistance to Plasmodiophora brassicae Woron in Brassica oleracea L. Theoretical
and Applied Genetics, 93, 86-90.
Grant, D., Cregan, P. & Shoemaker, R. C. 2000. Genome organization in dicots: Genome
duplication in Arabidopsis and synteny between soybean and Arabidopsis. Proceedings of
the National Academy of Sciences, 97, 4168-4173.
Grant, M. R., McDowell, J. M., Sharpe, A. G., De Torres Zabala, M., Lydiate, D. J. & Dangl, J. L.
1998. Independent deletions of a pathogen-resistance gene in Brassica and Arabidopsis.
Proceedings of the National Academy of Sciences of the United States of America, 95,
15843-15848.
Gu, L., Si, W., Zhao, L., Yang, S. & Zhang, X. 2014. Dynamic evolution of NBS–LRR genes in
bread wheat and its progenitors. Molecular Genetics and Genomics, 1-12.
Gunderson, K., Kuhn, K., Steemers, F., Ng, P., Murray, S. & Shen, R. 2006. Whole-genome
genotyping of haplotype tag single nucleotide polymorphisms. Pharmacogenomics, 7, 641 -
648.
Guo, X. W. & Fernando, W. G. D. 2005. Seasonal and diurnal patterns of spore dispersal by
Leptosphaeria maculans from canola stubble in relation to environmental conditions. Plant
Disease, 89, 97-104.
Guo, Y., Fitz, J., Schneeberger, K., Ossowski, S., Cao, J. & Weigel, D. 2011. Genome-wide
comparison of nucleotide-binding site-leucine-rich repeat-encoding genes in Arabidopsis.
Plant Physiology, 157, 757 - 769.
Hanada, K., Kuromori, T., Myouga, F., Toyoda, T. & Shinozaki, K. 2009. Increased Expression and
Protein Divergence in Duplicate Genes Is Associated with Morphological Diversification.
PLoS Genetics, 5, e1000781.
Hatakeyama, K., Suwabe, K., Tomita, R. N., Kato, T., Nunome, T., Fukuoka, H. & Matsumoto, S.
2013. Identification and Characterization of Crr1a, a Gene for Resistance to Clubroot
Disease (Plasmodiophora brassicae Woronin) in Brassica rapa. PLoS ONE, 8, e54745.
Hayashida, N., Takabatake, Y., Nakazawa, N., Aruga, D., Nakanishi, H., Taguchi, G., Sakamoto, K.
& Matsumoto, E. 2008. Construction of a Practical SCAR Marker Linked to Clubroot
Resistance in Chinese Cabbage, with Intensive Analysis of HC352b Genes. Journal of the
Japanese Society for Horticultural Science, 77, 150-154.
Hayward, A., McLanders, J., Campbell, E., Edwards, D. & Batley, J. 2011. Genomic advances will
herald new insights into the Brassica: Leptosphaeria maculans pathosystem. Plant Biology,
14, 1-10.
Heffner, E. L., Sorrells, M. E. & Jannink, J.-L. 2009. Genomic Selection for Crop Improvement.
Crop Science, 49, 1-12.
Hirai, M., Harada, T., Kubo, N., Tsukada, M., Suwabe, K. & Matsumoto, S. 2004. A novel locus
for clubroot resistance in Brassica rapa and its linkage markers. Theoretical and Applied
Genetics, 108, 639-643.
Hirai, M. 2006. Genetic analysis of clubroot resistance in Brassica crops. Breeding science, 56, 223-
229.
Holub, E. B. 2001. The arms race is ancient history in Arabidopsis, the wildflower. Nature Reviews
Genetics, 2, 516-527.
Hong, C. P., Kwon, S. J., Kim, J. S., Yang, T. J., Park, B. S. & Lim, Y. P. 2008. Progress in
understanding and sequencing the genome of brassica rapa. International Journal of Plant
Genomics, 2008.

166
Howlett, B. J. 2004. Current knowledge of the interaction between Brassica napus and
Leptosphaeria maculans. Canadian Journal of Plant Pathology, 26, 245-252.
Hu, Z., Huang, S., Sun, M., Wang, H. & Hua, W. 2012. Development and application of single
nucleotide polymorphism markers in the polyploid Brassica napus by 454 sequencing of
expressed sequence tags. Plant Breeding, 131, 293-299.
Hulbert, S., Webb, C., Smith, S. & Sun, Q. 2001. Resistance gene complexes: evolution and
utilization. Annual review of phytopathology, 39, 285 - 312.
Imelfort, M., Duran, C., Batley, J. & Edwards, D. 2009. Discovering genetic polymorphisms in
next-generation sequencing data. Plant Biotechnology Journal, 7, 312-317.
Imelfort, M. & Edwards, D. 2009. De novo sequencing of plant genomes using second-generation
technologies. Briefings in Bioinformatics, 10, 609-618.
Jamann, T. M., Poland, J. A., Kolkman, J. M., Smith, L. G. & Nelson, R. J. 2014. Unraveling
Genomic Complexity at a Quantitative Disease Resistance Locus in Maize. Genetics, 198,
333-344.
Jander, G., Norris, S. R., Rounsley, S. D., Bush, D. F., Levin, I. M. & Last, R. L. 2002. Arabidopsis
Map-Based Cloning in the Post-Genome Era. Plant Physiology, 129, 440-450.
Jeong, S. C., Hayes, A. J., Biyashev, R. M. & Maroof, M. A. S. 2001. Diversity and evolution of a
non-TIR-NBS sequence family that clusters to a chromosomal ’’hotspot” for disease
resistance genes in soybean. Theoretical and Applied Genetics, 103, 406-414.
Jiang, C., Ramchiary, N., Ma, Y., Jin, M., Feng, J., Li, R., Wang, H., Long, Y., Choi, S., Zhang, C.,
Cowling, W., Park, B., Lim, Y. & Meng, J. 2011. Structural and functional comparative
mapping between the Brassica A genomes in allotetraploid Brassica napus and diploid
Brassica rapa. Theoretical and Applied Genetics, 123, 927-941.
Johnson, R. D. & Lewis, B. G. 1994. Variation in host range, systemic infection and epidemiology
of Leptosphaeria maculans. Plant Pathology, 43, 269-277.
Joshi, R. & Nayak, S. 2011. Functional characterization and signal transduction ability of
nucleotide-binding site-leucine-rich repeat resistance genes in plants. Genetics and
Molecular Research, 10, 2637-2652.
Jupe, F., Pritchard, L., Etherington, G., MacKenzie, K., Cock, P., Wright, F., Sharma, S. K., Bolser,
D., Bryan, G., Jones, J. & Hein, I. 2012. Identification and localisation of the NB-LRR gene
family within the potato genome. BMC Genomics, 13, 75.
Jupe, F., Witek, K., Verweij, W., Śliwka, J., Pritchard, L., Etherington, G. J., Maclean, D., Cock, P.
J., Leggett, R. M. & Bryan, G. J. 2013. Resistance gene enrichment sequencing (RenSeq)
enables reannotation of the NB‐LRR gene family from sequenced plant genomes and rapid
mapping of resistance loci in segregating populations. The Plant Journal, 76, 530-544.
Kale, S. M., Pardeshi, V. C., Barvkar, V. T., Gupta, V. S. & Kadoo, N. Y. 2012. Genome-wide
identification and characterization of nucleotide binding site leucine-rich repeat genes in
linseed reveal distinct patterns of gene structure. Genome, 56, 91-99.
Kang, Y., Kim, K., Shim, S., Yoon, M., Sun, S., Kim, M., Van, K. & Lee, S.-H. 2012. Genome-
wide mapping of NBS-LRR genes and their association with disease resistance in soybean.
BMC Plant Biology, 12, 139.
Kato, T., Hatakeyama, K., Fukino, N. & Matsumoto, S. 2012. Identificaiton of a clubroot resistance
locus conferring resistance to a Plasmodiophora brassicae classified into pathotype group 3
in Chinese cabbage (Brassica rapa L.). Breeding science, 62, 282-287.
Kato, T., Hatakeyama, K., Fukino, N. & Matsumoto, S. 2013. Fine mapping of the clubroot
resistance gene CRb and development of a useful selectable marker in Brassica rapa.
Breeding science, 63, 116-124.
Kaur, S., Cogan, N. O. I., Ye, G., Baillie, R. C., Hand, M. L., Ling, A. E., McGearey, A. K., Kaur,
J., Hopkins, C. J., Todorovic, M., Mountford, H., Edwards, D., Batley, J., Burton, W.,
Salisbury, P., Gororo, N., Marcroft, S., Kearney, G., Smith, K. F., Forster, J. W. &
Spangenberg, G. C. 2009. Genetic map construction and QTL mapping of resistance to

167
blackleg (Leptosphaeria maculans) disease in Australian canola (Brassica napus L.)
cultivars. Theoretical and Applied Genetics, 120, 71-83.
Kaur, S., Francki, M. G. & Forster, J. W. 2012. Identification, characterization and interpretation of
single-nucleotide sequence variation in allopolyploid crop species. Plant Biotechnology
Journal, 10, 125-138.
Kearse, M., Moir, R., Wilson, A., Stones-Havas, S., Cheung, M., Sturrock, S., Buxton, S., Cooper,
A., Markowitz, S., Duran, C., Thierer, T., Ashton, B., Meintjes, P. & Drummond, A. 2012.
Geneious Basic: An integrated and extendable desktop software platform for the
organization and analysis of sequence data. Bioinformatics, 28, 1647-1649.
Kemmerling, B., Halter, T., Mazzotta, S., Mosher, S. & Nürnberger, T. 2011. A genome-wide
survey for Arabidopsis leucine-rich repeat receptor kinases implicated in plant immunity.
Frontiers in Plant Science, 2.
Keri, M., Van Den Berg, C. G. J., McVetty, P. B. E. & Rimmer, S. R. 1997. Inheritance of
resistance to Leptosphaeria maculans in Brassica juncea. Phytopathology, 87, 594-598.
Kim, K.-S., Hill, C., Hartman, G., Hyten, D., Hudson, M. & Diers, B. 2010. Fine mapping of the
soybean aphid-resistance gene Rag2 in soybean PI 200538. Theoretical and Applied
Genetics, 121, 599-610.
Kim, S., Song, Y., Lee, J.-Y., Choi, S., Dhandapani, V., Jang, C., Lim, Y. & Han, T. 2011.
Identification of the BrRHP1 locus that confers resistance to downy mildew in Chinese
cabbage (Brassica rapa ssp. pekinensis) and development of linked molecular markers.
Theoretical and Applied Genetics, 123, 1183-1192.
Kohler, A., Rinaldi, C., Duplessis, S., Baucher, M., Geelen, D., Duchaussoy, F., Meyers, B.,
Boerjan, W. & Martin, F. 2008. Genome-wide identification of NBS resistance genes in
Populus trichocarpa. Plant Molecular Biology, 66, 619-636.
Kruijt, M., De Kock, M. J. D. & De Wit, P. J. G. M. 2005. Receptor-like proteins involved in plant
disease resistance. Molecular Plant Pathology, 6, 85-97.
Lagercrantz, U. 1998. Comparative mapping between Arabidopsis thaliana and Brassica nigra
indicates that Brassica genomes have evolved through extensive genome replication
accompanied by chromosome fusions and frequent rearrangements. Genetics, 150, 1217-
1228.
Landry, B. S., Hubert, N., Crete, R., Chang, M. S., Lincoln, S. E. & Etoh, T. 1992. A genetic map
for Brassica oleracea based on RFLP markers detected with expressed DNA sequences and
mapping of resistance genes to race 2 of Plasmodiophora brassicae (Woronin). Genome, 35,
409-420.
Larkan, N. J., Lydiate, D. J., Parkin, I. A. P., Nelson, M. N., Epp, D. J., Cowling, W. A., Rimmer,
S. R. & Borhan, M. H. 2013. The Brassica napus blackleg resistance gene LepR3 encodes a
receptor-like protein triggered by the Leptosphaeria maculans effector AVRLM1. New
Phytologist, 197, 595-605.
Larkan, N. J., Lydiate, D. J., Yu, F., Rimmer, S. R. & Borhan, M. H. 2014. Co-localisation of the
blackleg resistance genes Rlm2 and LepR3 on Brassica napus chromosome A10. BMC Plant
Biology, 14.
Lawton-Rauh, A. 2003. Evolutionary dynamics of duplicated genes in plants. Molecular
Phylogenetics and Evolution, 29, 396-409.
Leflon, M., Brun, H., Eber, F., Delourme, R., Lucas, M. O., Vallée, P., Ermel, M., Balesdent, M. H.
& Chèvre, A. M. 2007. Detection, introgression and localization of genes conferring specific
resistance to Leptosphaeria maculans from Brassica rapa into B. napus. Theoretical and
Applied Genetics, 115, 897-906.
Leister, D. 2004. Tandem and segmental gene duplication and recombination in the evolution of
plant disease resistance genes. Trends in Genetics, 20, 116-122.
Lestari, P., Van, K., Lee, J. E., Kang, Y. J. & Lee, S.-H. 2013. Gene divergence of homeologous
regions associated with a major seed protein content QTL in soybean. Frontiers in Plant
Science, 4.

168
Li, C. X. & Cowling, W. A. 2003. Identification of a single dominant allele for resistance to
blackleg in Brassica napus 'Surpass 400'. Plant Breeding, 122, 485-488.
Li, F., Kitashiba, H., Inaba, K. & Nishio, T. 2009. A Brassica rapa Linkage Map of EST-based SNP
Markers for Identification of Candidate Genes Controlling Flowering Time and Leaf
Morphological Traits. DNA Research, 16, 311-323.
Li, H., Yu, S.-C., ZHANG, F.-L., Yu, Y.-J., ZHAO, X.-Y., ZHANG, D.-S. & ZHAO, X. 2011.
Development of molecular markers linked to the resistant QTL for downy mildew in
Brassica rapa L. ssp. pekinensis [ in Chinese]. Hereditas, 33, 1271-1278
Li, J., Ding, J., Zhang, W., Zhang, Y., Tang, P., Chen, J.-Q., Tian, D. & Yang, S. 2010. Unique
evolutionary pattern of numbers of gramineous NBS–LRR genes. Molecular Genetics and
Genomics, 283, 427-438.
Li, X., Ramchiary, N., Dhandapani, V., Choi, S. R., Hur, Y., Nou, I.-S., Yoon, M. K. & Lim, Y. P.
2013. Quantitative Trait Loci Mapping in Brassica rapa Revealed the Structural and
Functional Conservation of Genetic Loci Governing Morphological and Yield Component
Traits in the A, B, and C Subgenomes of Brassica Species. DNA Research, 20, 1-16.
Liu, J., Liu, X., Dai, L. & Wang, G. 2007. Recent Progress in Elucidating the Structure, Function
and Evolution of Disease Resistance Genes in Plants. Journal of Genetics and Genomics,
34, 765-776.
Liu, S., Liu, Y., Yang, X., Tong, C., Edwards, D., Parkin, I. A. P., Zhao, M., Ma, J., Yu, J., Huang,
S., Wang, X., Wang, J., Lu, K., Fang, Z., Bancroft, I., Yang, T.-J., Hu, Q., Wang, X., Yue,
Z., Li, H., Yang, L., Wu, J., Zhou, Q., Wang, W., King, G. J., Pires, J. C., Lu, C., Wu, Z.,
Sampath, P., Wang, Z., Guo, H., Pan, S., Yang, L., Min, J., Zhang, D., Jin, D., Li, W.,
Belcram, H., Tu, J., Guan, M., Qi, C., Du, D., Li, J., Jiang, L., Batley, J., Sharpe, A. G.,
Park, B.-S., Ruperao, P., Cheng, F., Waminal, N. E., Huang, Y., Dong, C., Wang, L., Li, J.,
Hu, Z., Zhuang, M., Huang, Y., Huang, J., Shi, J., Mei, D., Liu, J., Lee, T.-H., Wang, J., Jin,
H., Li, Z., Li, X., Zhang, J., Xiao, L., Zhou, Y., Liu, Z., Liu, X., Qin, R., Tang, X., Liu, W.,
Wang, Y., Zhang, Y., Lee, J., Kim, H. H., Denoeud, F., Xu, X., Liang, X., Hua, W., Wang,
X., Wang, J., Chalhoub, B. & Paterson, A. H. 2014. The Brassica oleracea genome reveals
the asymmetrical evolution of polyploid genomes. Nature Communications, 5.
Long, Y., Wang, Z., Sun, Z., Fernando, D. W. G., McVetty, P. B. E. & Li, G. 2011. Identification
of two blackleg resistance genes and fine mapping of one of these two genes in a Brassica
napus canola cultivar 'Surpass 400'. Theoretical and Applied Genetics, 122, 1223-1231.
Lozano, R., Ponce, O., Ramirez, M., Mostajo, N. & Orjeda, G. 2012. Genome-Wide Identification
and Mapping of NBS-Encoding Resistance Genes in Solanum tuberosum Group Phureja.
PLoS ONE, 7, e34775.
Lyons, E., Pedersen, B., Kane, J., Alam, M., Ming, R., Tang, H., Wang, X., Bowers, J., Paterson,
A., Lisch, D. & Freeling, M. 2008. Finding and Comparing Syntenic Regions among
Arabidopsis and the Outgroups Papaya, Poplar, and Grape: CoGe with Rosids. Plant
Physiology, 148, 1772-1781.
Ma, L., Lukasik, E., Gawehns, F. & Takken, F. W. 2012. The Use of Agroinfiltration for Transient
Expression of Plant Resistance and Fungal Effector Proteins in Nicotiana benthamiana
Leaves. In: BOLTON, M. D. & THOMMA, B. P. H. J. (eds.) Plant Fungal Pathogens.
Humana Press.
Madsen, L. H., Collins, N. C., Rakwalska, M., Backes, G., Sandal, N., Krusell, L., Jensen, J.,
Waterman, E. H., Jahoor, A., Ayliffe, M., Pryor, A. J., Langridge, P., Schulze-Lefert, P. &
Stougaard, J. 2003. Barley disease resistance gene analogs of the NBS-LRR class:
identification and mapping. Molecular Genetics and Genomics, 269, 150-161.
Malory, S., Shapter, F. M., Elphinstone, M. S., Chivers, I. H. & Henry, R. J. 2011. Characterizing
homologues of crop domestication genes in poorly described wild relatives by high-
throughput sequencing of whole genomes. Plant Biotechnology Journal, 9, 1131-1140.
Marcroft, S. & Bluett, C. 2008. Blackleg of canola. Agriculture notes. State of Victoria, Department
of Primary Industries.

169
Marcroft, S. J., Sprague, S. J., Pymer, S. J., Salisbury, P. A. & Howlett, B. J. 2004. Crop isolation,
not extended rotation length, reduces blackleg Leptosphaeria maculans severity of canola
Brassica napus in south-eastern Australia. Australian Journal of Experimental Agriculture,
44, 601-606.
Marcroft, S. J., Elliott, V. L., Cozijnsen, A. J., Salisbury, P. A., Howlett, B. J. & Van de Wouw, A.
P. 2012a. Identifying resistance genes to Leptosphaeria maculans in Australian Brassica
napus cultivars based on reactions to isolates with known avirulence genotypes. Crop and
Pasture Science, 63, 338-350.
Marcroft, S. J., Van de Wouw, A. P., Salisbury, P. A., Potter, T. D. & Howlett, B. J. 2012b. Effect
of rotation of canola (Brassica napus) cultivars with different complements of blackleg
resistance genes on disease severity. Plant Pathology, 61, 934-944.
Matsumoto, E., Ueno, H. & Aruga, D. 2012. Accumulation of Three Clubroot Resistance Genes
through Marker-assisted Selection in Chinese Cabbage (Brassica rapa ssp. pekinensis).
Journal of the Japanese Society for Horticultural Science, 81, 184-190.
Mayerhofer, R., Bansal, V. K., Thiagarajah, M. R., Stringam, G. R. & Good, A. G. 1997. Molecular
mapping of resistance to Leptosphaeria maculans in Australian cultivars of Brassica napus.
Genome, 40, 294-301.
Mayerhofer, R., Wilde, K., Mayerhofer, M., Lydiate, D., Bansal, V. K., Good, A. G. & Parkin, I. A.
P. 2005. Complexities of chromosome landing in a highly duplicated genome: Toward map-
based cloning of a gene controlling blackleg resistance in Brassica napus. Genetics, 171,
1977-1988.
McCarthy, M., Abecasis, G., Cardon, L., Goldstein, D., Little, J., Ioannidis, J. & Hirschhorn, J.
2008. Genome-wide association studies for complex traits: consensus, uncertainty and
challenges. Nature Reviews Genetics, 9, 356-369.
McCouch, S. R. 2001. Genomics and Synteny. Plant Physiology, 125, 152-155.
McDowell, J. M., Dhandaydham, M., Long, T. A., Aarts, M. G. M., Goff, S., Holub, E. B. & Dangl,
J. L. 1998. Intragenic Recombination and Diversifying Selection Contribute to the Evolution
of Downy Mildew Resistance at the RPP8 Locus of Arabidopsis. The Plant Cell, 10, 1861-
1874.
McDowell, J. M. & Woffenden, B. J. 2003. Plant disease resistance genes: recent insights and
potential applications. Trends in biotechnology, 21, 178-183.
McDowell, J. M. & Simon, S. A. 2006. Recent insights into R gene evolution. Molecular Plant
Pathology, 7, 437-448.
McHale, L., Tan, X., Koehl, P. & Michelmore, R. 2006. Plant NBS-LRR proteins: adaptable
guards. Genome Biology, 7, 212.
Meyers, B., Dickerman, A., Michelmore, R., Sivaramakrishnan, S., Sobral, B. & Young, N. 1999.
Plant disease resistance genes encode members of an ancient and diverse protein family
within the nucleotide-binding superfamily. The Plant Journal, 20, 317 - 332.
Meyers, B., Kozik, A., Griego, A., Kuang, H. & Michelmore, R. 2003. Genome-wide analysis of
NBS-LRR-encoding genes in Arabidopsis. The Plant Cell, 15, 809 - 834.
Meyers, B. C., Morgante, M. & Michelmore, R. W. 2002. TIR-X and TIR-NBS proteins: two new
families related to disease resistance TIR-NBS-LRR proteins encoded in Arabidopsis and
other plant genomes. The Plant Journal, 32, 77-92.
Meyers, B. C., Kaushik, S. & Nandety, R. S. 2005. Evolving disease resistance genes. Current
Opinion in Plant Biology, 8, 129-134.
Michelmore, R. & Meyers, B. 1998. Clusters of resistance genes in plants evolve by divergent
selection and a birth-and-death process. Genome Research, 8, 1113 - 1130.
Monosi, B., Wisser, R. J., Pennill, L. & Hulbert, S. H. 2004. Full-genome analysis of resistance
gene homologues in rice. Theoretical and Applied Genetics, 109, 1434-1447.
Moriguchi, K., Kimizuka-Takagi, C., Ishii, K. & Nomura, K. 1999. A genetic map based on RAPD,
RFLP, isozyme, morphological markers and QTL analysis for clubroot resistance in
Brassica oleracea. Breeding science, 49, 257-265.

170
Mun, J., Yu, H., Park, S. & Park, B. 2009. Genome-wide identification of NBS-encoding resistance
genes in Brassica rapa. Molecular Genetics and Genomics, 282, 617 - 631.
Nagaoka, T., Doullah, M. A. U., Matsumoto, S., Kawasaki, S., Ishikawa, T., Hori, H. & Okazaki,
K. 2010. Identification of QTLs that control clubroot resistance in Brassica oleracea and
comparative analysis of clubroot resistance genes between B. rapa and B. oleracea.
Theoretical and Applied Genetics, 120, 1335-1346.
Nandety, R. S., Caplan, J. L., Cavanaugh, K., Perroud, B., Wroblewski, T., Michelmore, R. W. &
Meyers, B. C. 2013. The Role of TIR-NBS and TIR-X Proteins in Plant Basal Defense
Responses. Plant Physiology, 162, 1459-1472.
Nashaat, N. I., Heran, A., Mitchell, S. E. & Awasthi, R. P. 1997. New genes for resistance to downy
mildew (Peronospora parasitica) in oilseed rape (Brassica napus ssp. oleifera). Plant
Pathology, 46, 964-968.
Nobuta, K., Ashfield, T., Kim, S. & Innes, R. W. 2005. Diversification of Non-TIR Class NB-LRR
Genes in Relation to Whole-Genome Duplication Events in Arabidopsis. Molecular Plant-
Microbe Interactions, 18, 103-109.
Nomura, K., Minegishi, Y., Kimizuka-Takagi, C., Fujioka, T., Moriguchi, K., Shishido, R. &
Ikehashi, H. 2005. Evaluation of F2 and F3 plants introgressed with QTLs for clubroot
resistance in cabbage developed by using SCAR markers. Plant Breeding, 124, 371-375.
Osterberg, M. K., Shavorskaya, O., Lascoux, M. & Lagercrantz, U. 2002. Naturally Occurring Indel
Variation in the Brassica nigra COL1 Gene Is Associated With Variation in Flowering
Time. Genetics, 161, 299-306.
Pan, Q., Liu, Y.-S., Budai-Hadrian, O., Sela, M., Carmel-Goren, L., Zamir, D. & Fluhr, R. 2000.
Comparative Genetics of Nucleotide Binding Site-Leucine Rich Repeat Resistance Gene
Homologues in the Genomes of Two Dicotyledons: Tomato and Arabidopsis. Genetics, 155,
309-322.
Parkin, I., Koh, C., Tang, H., Robinson, S., Kagale, S., Clarke, W., Town, C., Nixon, J.,
Krishnakumar, V., Bidwell, S., Denoeud, F., Belcram, H., Links, M., Just, J., Clarke, C.,
Bender, T., Huebert, T., Mason, A., Pires, C., Barker, G., Moore, J., Walley, P., Manoli, S.,
Batley, J., Edwards, D., Nelson, M., Wang, X., Paterson, A., King, G., Bancroft, I.,
Chalhoub, B. & Sharpe, A. 2014. Transcriptome and methylome profiling reveals relics of
genome dominance in the mesopolyploid Brassica oleracea. Genome Biology, 15, R77.
Parkin, I. A. P., Sharpe, A. G. & Lydiate, D. J. 2003. Patterns of genome duplication within the
Brassica napus genome. Genome, 46, 291-303.
Parkin, I. A. P., Gulden, S. M., Sharpe, A. G., Lukens, L., Trick, M., Osborn, T. C. & Lydiate, D. J.
2005. Segmental structure of the Brassica napus genome based on comparative analysis with
Arabidopsis thaliana. Genetics, 171, 765-781.
Parlange, F., Daverdin, G., Fudal, I., Kuhn, M. L., Balesdent, M. H., Blaise, F., Grezes-Besset, B. &
Rouxel, T. 2009. Leptosphaeria maculans avirulence gene AvrLm4-7 confers a dual
recognition specificity by the Rlm4 and Rlm7 resistance genes of oilseed rape, and
circumvents Rlm4-mediated recognition through a single amino acid change. Molecular
Microbiology, 71, 851-863.
Parniske, M. & Jones, J. D. G. 1999. Recombination between diverged clusters of the tomato Cf-9
plant disease resistance gene family. Proceedings of the National Academy of Sciences, 96,
5850-5855.
Paterson, A. H., Bowers, J. E., Burow, M. D., Draye, X., Elsik, C. G., Jiang, C.-X., Katsar, C. S.,
Lan, T.-H., Lin, Y.-R., Ming, R. & Wright, R. J. 2000. Comparative Genomics of Plant
Chromosomes. The Plant Cell Online, 12, 1523-1539.
Paterson, A. H., Lan, T. H., Amasino, R., Osborn, T. C. & Quiros, C. 2001. Brassica genomics: A
complement to, and early beneficiary of, the Arabidopsis sequence. Genome Biology, 2.
Paterson, A. H., Bowers, J. E., Bruggmann, R., Dubchak, I., Grimwood, J., Gundlach, H., Haberer,
G., Hellsten, U., Mitros, T., Poliakov, A., Schmutz, J., Spannagl, M., Tang, H., Wang, X.,
Wicker, T., Bharti, A. K., Chapman, J., Feltus, F. A., Gowik, U., Grigoriev, I. V., Lyons, E.,

171
Maher, C. A., Martis, M., Narechania, A., Otillar, R. P., Penning, B. W., Salamov, A. A.,
Wang, Y., Zhang, L., Carpita, N. C., Freeling, M., Gingle, A. R., Hash, C. T., Keller, B.,
Klein, P., Kresovich, S., McCann, M. C., Ming, R., Peterson, D. G., Mehboob Ur, R., Ware,
D., Westhoff, P., Mayer, K. F. X., Messing, J. & Rokhsar, D. S. 2009. The Sorghum bicolor
genome and the diversification of grasses. Nature, 457, 551-556.
Piao, Z., Ramchiary, N. & Lim, Y. 2009. Genetics of Clubroot Resistance in Brassica Species.
Journal of Plant Growth Regulation, 28, 252-264.
Piao, Z. Y., Deng, Y. Q., Choi, S. R., Park, Y. J. & Lim, Y. P. 2004. SCAR and CAPS mapping of
CRb, a gene conferring resistance to Plasmodiophora brassicae in Chinese cabbage
(Brassica rapa ssp. pekinensis). Theoretical and Applied Genetics, 108, 1458-1465.
Pilet, M. L., Delourme, R., Foisset, N. & Renard, M. 1998. Identification of QTL involved in field
resistance to light leaf spot (Pyrenopeziza brassicae) and blackleg resistance (Leptosphaeria
maculans) in winter rapeseed (Brassica napus L.). Theoretical and Applied Genetics, 97,
398-406.
Pilet, M. L., Duplan, G., Archipiano, M., Barret, P., Baron, C., Horvais, R., Tanguy, X., Lucas, M.
O., Renard, M. & Delourme, R. 2001. Stability of QTL for field resistance to blackleg
across two genetic backgrounds in oilseed rape. Crop Science, 41, 197-205.
Plocik, A., Layden, J. & Kesseli, R. 2004. Comparative analysis of NBS domain sequences of NBS-
LRR disease resistance genes from sunflower, lettuce, and chicory. Molecular Phylogenetics
and Evolution, 31, 153-163.
Porter, B. W., Paidi, M., Ming, R., Alam, M., Nishijima, W. T. & Zhu, Y. J. 2009. Genome-wide
analysis of Carica papaya reveals a small NBS resistance gene family. Molecular Genetics
and Genomics, 281, 609-626.
Quint, M., Dussle, C., Melchinger, A. & Lübberstedt, T. 2003. Identification of genetically linked
RGAs by BAC screening in maize and implications for gene cloning, mapping and MAS.
Theoretical and Applied Genetics, 106, 1171-1177.
Rafalski, A. 2002. Applications of single nucleotide polymorphisms in crop genetics. Current
Opinion in Plant Biology, 5, 94 - 100.
Ramalingam, J., Vera Cruz, C. M., Kukreja, K., Chittoor, J. M., Wu, J. L., Lee, S. W., Baraoidan,
M., George, M. L., Cohen, M. B., Hulbert, S. H., Leach, J. E. & Leung, H. 2003. Candidate
Defense Genes from Rice, Barley, and Maize and Their Association with Qualitative and
Quantitative Resistance in Rice. Molecular Plant-Microbe Interactions, 16, 14-24.
Raman, H., Dalton-Morgan, J., Diffey, S., Raman, R., Alamery, S., Edwards, D. & Batley, J. 2014.
SNP markers-based map construction and genome-wide linkage analysis in Brassica napus.
Plant Biotechnology Journal, n/a-n/a.
Raman, R., Taylor, B., Lindbeck, K., Coombes, N., Barbulescu, D., Salisbury, P. & Raman, H.
2012a. Molecular mapping and validation of Rlm1 gene for resistance to Leptosphaeria
maculans in canola (Brassica napus L.). Crop and Pasture Science, 63, 1007-1017.
Raman, R., Taylor, B., Marcroft, S., Stiller, J., Eckermann, P., Coombes, N., Rehman, A.,
Lindbeck, K., Luckett, D., Wratten, N., Batley, J., Edwards, D., Wang, X. & Raman, H.
2012b. Molecular mapping of qualitative and quantitative loci for resistance to
Leptosphaeria maculans causing blackleg disease in canola (Brassica napus L.). Theoretical
and Applied Genetics, 125, 405-418.
Rana, D., van den Boogaart, T., O'Neill, C. M., Hynes, L., Bent, E., Macpherson, L., Park, J. Y.,
Lim, Y. P. & Bancroft, I. 2004. Conservation of the microstructure of genome segments in
Brassica napus and its diploid relatives. The Plant Journal, 40, 725-733.
Ratnaparkhe, M., Wang, X., Li, J., Compton, R., Rainville, L., Lemke, C., Kim, C., Tang, H. &
Paterson, A. 2011. Comparative analysis of peanut NBS-LRR gene clusters suggests
evolutionary innovation among duplicated domains and erosion of gene microsynteny. New
Phytologist, 192, 164 - 178.

172
Richly, E., Kurth, J. & Leister, D. 2002. Mode of Amplification and Reorganization of Resistance
Genes During Recent Arabidopsis thaliana Evolution. Molecular Biology and Evolution, 19,
76-84.
Rimmer, S. & van den Berg, C. 1992. Resistance of oilseed Brassica spp. to blackleg caused by
Lptosphaeria maculans Canadian Journal of Plant Pathology, 14, 56-66.
Rimmer, S. R. 2006. Resistance genes to Leptosphaeria maculans in Brassica napus. Canadian
Journal of Plant Pathology, 28, S288-S297.
Rocherieux, J., Glory, P., Giboulot, A., Boury, S., Barbeyron, G., Thomas, G. & Manzanares-
Dauleux, M. J. 2004. Isolate-specific and broad-spectrum QTLs are involved in the control
of clubroot in Brassica oleracea. Theoretical and Applied Genetics, 108, 1555-1563.
Rouxel, T., Penaud, A., Pinochet, X., Brun, H., Gout, L., Delourme, R., Schmit, J. & Balesdent, M.-
H. 2003a. A 10-year Survey of Populations of Leptosphaeria maculans in France Indicates a
Rapid Adaptation Towards the Rlm1 Resistance Gene of Oilseed Rape. European Journal
of Plant Pathology, 109, 871-881.
Rouxel, T., Willner, E., Coudard, L. & Balesdent, M. H. 2003b. Screening and identification of
resistance to Leptosphaeria maculans (stem canker) in Brassica napus accessions. Euphytica,
133, 219-231.
Rouxel, T. & Balesdent, M. H. 2005. The stem canker (blackleg) fungus, Leptosphaeria maculans,
enters the genomic era. Molecular Plant Pathology, 6, 225-241.
Rouxel, T., Grandaubert, J., Hane, J. K., Hoede, C., van de Wouw, A. P., Couloux, A., Dominguez,
V., Anthouard, V., Bally, P., Bourras, S., Cozijnsen, A. J., Ciuffetti, L. M., Degrave, A.,
Dilmaghani, A., Duret, L., Fudal, I., Goodwin, S. B., Gout, L., Glaser, N., Linglin, J., Kema,
G. H. J., Lapalu, N., Lawrence, C. B., May, K., Meyer, M., Ollivier, B., Poulain, J., Schoch,
C. L., Simon, A., Spatafora, J. W., Stachowiak, A., Turgeon, B. G., Tyler, B. M., Vincent,
D., Weissenbach, J., Amselem, J., Quesneville, H., Oliver, R. P., Wincker, P., Balesdent,
M.-H. & Howlett, B. J. 2011. Effector diversification within compartments of the
Leptosphaeria maculans genome affected by Repeat-Induced Point mutations. Nature
Communications, 2, 202.
Ruperao, P., Chan, C.-K. K., Azam, S., Karafiátová, M., Hayashi, S., Čížková, J., Saxena, R. K.,
Šimková, H., Song, C., Vrána, J., Chitikineni, A., Visendi, P., Gaur, P. M., Millán, T.,
Singh, K. B., Taran, B., Wang, J., Batley, J., Doležel, J., Varshney, R. K. & Edwards, D.
2014. A chromosomal genomics approach to assess and validate the desi and kabuli draft
chickpea genome assemblies. Plant Biotechnology Journal, 12, 778-786.
Saal, B., Brun, H., Glais, I. & Struss, D. 2004. Identification of a Brassica juncea-derived recessive
gene conferring resistance to Leptosphaeria maculans in oilseed rape. Plant Breeding, 123,
505-511.
Saal, B. & Struss, D. 2005. RGA- and RAPD-derived SCAR markers for a Brassica B-genome
introgression conferring resistance to blackleg in oilseed rape. Theoretical and Applied
Genetics, 111, 281-290.
Saito, M., Kubo, N., Matsumoto, S., Suwabe, K., Tsukada, M. & Hirai, M. 2006. Fine mapping of
the clubroot resistance gene, Crr3, in Brassica rapa. Theoretical and Applied Genetics, 114,
81-91.
Saitou, N. & Nei, M. 1987. The neighbor-joining method: a new method for reconstructing
phylogenetic trees. Molecular Biology and Evolution, 4, 406-425.
Sakamoto, K., Saito, A., Hayashida, N., Taguchi, G. & Matsumoto, E. 2008. Mapping of isolate-
specific QTLs for clubroot resistance in Chinese cabbage (Brassica rapa L. ssp. pekinensis).
Theoretical and Applied Genetics, 117, 759-767.
Salisbury, P. A., Ballinger, D. J., Wratten, N., Plummer, K. M. & Howlett, B. J. 1995. Blackleg
disease on oilseed Brassica in Australia: A review. Australian Journal of Experimental
Agriculture, 35, 665-672.

173
Salmon, A., Udall, J. A., Jeddeloh, J. A. & Wendel, J. 2012. Targeted Capture of Homoeologous
Coding and Noncoding Sequence in Polyploid Cotton. G3: Genes, Genomes, Genetics, 2,
921-930.
Singh, S., Sharma, S., Kalia, P., Deshmukh, R., Kumar, V., Sharma, P. & Sharma, T. 2012.
Molecular mapping of the downy mildew resistance gene Ppa3 in cauliflower (Brassica
oleracea var. botrytis L.). JOURNAL OF HORTICULTURAL SCIENCE &
BIOTECHNOLOGY, 87, 137-143.
Snowdon, R., Lühs, W. & Friedt, W. 2007. Oilseed Rape. In: KOLE, C. (ed.) Genome Mapping
and Molecular Breeding in Plants (Oilseeds). Springer Berlin Heidelberg.
Speulman, E., Bouchez, D., Holub, E. B. & Beynon, J. L. 1998. Disease resistance gene homologs
correlate with disease resistance loci of Arabidopsis thaliana. The Plant Journal, 14, 467-
474.
Sprague, S. J., Balesdent, M. H., Brun, H., Hayden, H. L., Marcroft, S. J., Pinochet, X., Rouxel, T.
& Howlett, B. J. 2006. Major gene resistance in Brassica napus (oilseed rape) is overcome
by changes in virulence of populations of Leptosphaeria maculans in France and Australia.
European Journal of Plant Pathology, 114, 33-40.
Staal, J., Kaliff, M., Bohman, S. & Dixelius, C. 2006. Transgressive segregation reveals two
Arabidopsis TIR-NB-LRR resistance genes effective against Leptosphaeria maculans,
causal agent of blackleg disease. The Plant Journal, 46, 218-230.
Staal, J. & Dixelius, C. 2008. RLM3, a potential adapter between specific TIR-NB-LRR receptors
and DZC proteins. communicative and intergrative biology, 1, 59-61.
Staal, J., Kaliff, M., Dewaele, E., Persson, M. & Dixelius, C. 2008. RLM3, a TIR domain encoding
gene involved in broad-range immunity of Arabidopsis to necrotrophic fungal pathogens.
The Plant Journal, 55, 188-200.
Staskawicz, B. J., Ausubel, F. M., Baker, B. J., Ellis, J. G. & Jones, J. D. G. 1995. Molecular
genetics of plant disease resistance. Science, 268, 661-667.
Suwabe, K., Tsukazaki, H., Iketani, H., Hatakeyama, K., Fujimura, M., Nunome, T., Fukuoka, H.,
Matsumoto, S. & Hirai, M. 2003. Identification of two loci for resistance to clubroot
(Plasmodiophora brassicae Woronin) in Brassica rapa L. Theoretical and Applied Genetics,
107, 997-1002.
Suwabe, K., Tsukazaki, H., Iketani, H., Hatakeyama, K., Kondo, M., Fujimura, M., Nunome, T.,
Fukuoka, H., Hirai, M. & Matsumoto, S. 2006. Simple Sequence Repeat-Based
Comparative Genomics Between Brassica rapa and Arabidopsis thaliana: The Genetic
Origin of Clubroot Resistance. Genetics, 173, 309-319.
Suwabe, K., Suzuki, G., Nunome, T., Hatakeyama, K., Mukai, Y., Fukuoka, H. & Matsumoto, S.
2012. Microstructure of a Brassica rapa genome segment homoeologous to the resistance
gene cluster on Arabidopsis chromosome 4. Breeding science, 62, 170.
Syvanen, A.-C. 2005. Toward genome-wide SNP genotyping. NATURE GENETICS, 378.
Tamura, K., Stecher, G., Peterson, D., Filipski, A. & Kumar, S. 2013. MEGA6: Molecular
Evolutionary Genetics Analysis Version 6.0. Molecular Biology and Evolution, 30, 2725-
2729.
Tan, X., Meyers, B. C., Kozik, A., West, M. A., Morgante, M., St Clair, D. A., Bent, A. F. &
Michelmore, R. W. 2007. Global expression analysis of nucleotide binding site-leucine rich
repeat-encoding and related genes in Arabidopsis. BMC Plant Biology, 7.
Tang, H., Bowers, J. E., Wang, X., Ming, R., Alam, M. & Paterson, A. H. 2008. Synteny and
Collinearity in Plant Genomes. Science, 320, 486-488.
Tarr, D. & Alexander, H. 2009. TIR-NBS-LRR genes are rare in monocots: evidence from diverse
monocot orders. BMC Research Notes, 2, 197.
The International Wheat Genome Sequencing Consortium 2014. A chromosome-based draft
sequence of the hexaploid bread wheat (Triticum aestivum) genome. Science, 345.

174
Thompson, J. D., Higgins, D. G. & Gibson, T. J. 1994. CLUSTAL W: improving the sensitivity of
progressive multiple sequence alignment through sequence weighting, position-specific gap
penalties and weight matrix choice. Nucleic Acids Research, 22, 4673-4680.
Tollenaere, R., Hayward, A., Dalton-Morgan, J., Campbell, E., Lee, J. R. M., Lorenc, M. T.,
Manoli, S., Stiller, J., Raman, R., Raman, H., Edwards, D. & Batley, J. 2012. Identification
and characterization of candidate Rlm4 blackleg resistance genes in Brassica napus using
next-generation sequencing. Plant Biotechnology Journal, 10, 709-715.
Trick, M., Kwon, S.-J., Choi, S., Fraser, F., Soumpourou, E., Drou, N., Wang, Z., Lee, S., Yang, T.-
J., Mun, J.-H., Paterson, A., Town, C., Pires, J. C., Pyo Lim, Y., Park, B.-S. & Bancroft, I.
2009. Complexity of genome evolution by segmental rearrangement in Brassica rapa
revealed by sequence-level analysis. BMC Genomics, 10, 539.
Tsuda, K. & Katagiri, F. 2010. Comparing signaling mechanisms engaged in pattern-triggered and
effector-triggered immunity. Current Opinion in Plant Biology, 13, 459-465.
U, N. 1935. Genome analysis in Brassica with special reference to the experimental formation of
B.napus and peculiar mode of fertilization Japanese journal of botany, 7, 389-452.
Ueno, H., Matsumoto, E., Aruga, D., Kitagawa, S., Matsumura, H. & Hayashida, N. 2012.
Molecular characterization of the CRa gene conferring clubroot resistance in Brassica rapa.
Plant Molecular Biology, 80, 621-629.
USDA 2014. Oilseeds: World markets and trade. available at
http://www.fas.usda.gov/data/oilseeds-world-markets-and-trade. United States Department
of Agriculture
Vaghchhipawala, Z., Rojas, C., Senthil-Kumar, M. & Mysore, K. 2011. Agroinoculation and
Agroinfiltration: Simple Tools for Complex Gene Function Analyses. In: PEREIRA, A.
(ed.) Plant Reverse Genetics. Humana Press.
Van De Wouw, A. P., Marcroft, S. J., Barbetti, M. J., Hua, L., Salisbury, P. A., Gout, L., Rouxel,
T., Howlett, B. J. & Balesdent, M. H. 2009. Dual control of avirulence in Leptosphaeria
maculans towards a Brassica napus cultivar with 'sylvestris-derived' resistance suggests
involvement of two resistance genes. Plant Pathology, 58, 305-313.
Van de Wouw, A. P., Lowe, R. G. T., Elliott, C. E., Dubois, D. J. & Howlett, B. J. 2014. An
avirulence gene, AvrLmJ1, from the blackleg fungus, Leptosphaeria maculans, confers
avirulence to Brassica juncea cultivars. Molecular Plant Pathology, 15, 523-530.
Verma, S. S., Rahman, M. H., Deyholos, M. K., Basu, U. & Kav, N. N. V. 2014. Differential
Expression of miRNAs in Brassica napus Root following Infection with Plasmodiophora
brassicae. PLoS ONE, 9, e86648.
Vicente, J. G. & King, G. J. 2001. Characterisation of disease resistance gene-like sequences in
Brassica oleracea L. Theoretical and Applied Genetics, 102, 555-563.
Voorrips, R. E., Jongerius, M. C. & Kanne, H. J. 1997. Mapping of two genes for resistance to
clubroot (Plasmodiophora brassicae) in a population of doubled haploid lines of Brassica
oleracea by means of RFLP and AFLP markers. Theoretical and Applied Genetics, 94, 75-
82.
Wan, H., Yuan, W., Ye, Q., Wang, R., Ruan, M., Li, Z., Zhou, G., Yao, Z., Zhao, J., Liu, S. &
Yang, Y. 2012. Analysis of TIR- and non-TIR-NBS-LRR disease resistance gene analogous
in pepper: characterization, genetic variation, functional divergence and expression patterns.
BMC Genomics, 13, 502.
Wan, H., Yuan, W., Bo, K., Shen, J., Pang, X. & Chen, J. 2013. Genome-wide analysis of NBS-
encoding disease resistance genes in Cucumis sativus and phylogenetic study of NBS-
encoding genes in Cucurbitaceae crops. BMC Genomics, 14, 109.
Wang, H., Waller, L., Tripathy, S., St. Martin, S. K., Zhou, L., Krampis, K., Tucker, D. M., Mao,
Y., Hoeschele, I., Saghai Maroof, M. A., Tyler, B. M. & Dorrance, A. E. 2010. Analysis of
Genes Underlying Soybean Quantitative Trait Loci Conferring Partial Resistance to
Phytophthora sojae. The Plant Genome, 3, 23-40.

175
Wang, J., Kaur, S., Cogan, N. O. I., Dobrowolski, M. P., Salisbury, P. A., Burton, W. A., Baillie,
R., Hand, M., Hopkins, C., Forster, J. W., Smith, K. F. & Spangenberg, G. 2009.
Assessment of genetic diversity in Australian canola (Brassica napus L.) cultivars using SSR
markers. Crop and Pasture Science, 60, 1193-1201.
Wang, X., Wang, H., Wang, J., Sun, R., Wu, J., Liu, S., Bai, Y., Mun, J.-H., Bancroft, I., Cheng, F.,
Huang, S., Li, X., Hua, W., Wang, J., Wang, X., Freeling, M., Pires, J. C., Paterson, A. H.,
Chalhoub, B., Wang, B., Hayward, A., Sharpe, A. G., Park, B.-S., Weisshaar, B., Liu, B., Li,
B., Liu, B., Tong, C., Song, C., Duran, C., Peng, C., Geng, C., Koh, C., Lin, C., Edwards,
D., Mu, D., Shen, D., Soumpourou, E., Li, F., Fraser, F., Conant, G., Lassalle, G., King, G.
J., Bonnema, G., Tang, H., Wang, H., Belcram, H., Zhou, H., Hirakawa, H., Abe, H., Guo,
H., Wang, H., Jin, H., Parkin, I. A. P., Batley, J., Kim, J.-S., Just, J., Li, J., Xu, J., Deng, J.,
Kim, J. A., Li, J., Yu, J., Meng, J., Wang, J., Min, J., Poulain, J., Wang, J., Hatakeyama, K.,
Wu, K., Wang, L., Fang, L., Trick, M., Links, M. G., Zhao, M., Jin, M., Ramchiary, N.,
Drou, N., Berkman, P. J., Cai, Q., Huang, Q., Li, R., Tabata, S., Cheng, S., Zhang, S.,
Zhang, S., Huang, S., Sato, S., Sun, S., Kwon, S.-J., Choi, S.-R., Lee, T.-H., Fan, W., Zhao,
X., Tan, X., Xu, X., Wang, Y., Qiu, Y., Yin, Y., Li, Y., et al. 2011. The genome of the
mesopolyploid crop species Brassica rapa. NATURE GENETICS, 43, 1035-1039.
Wang, Y., Wang, X. & Paterson, A. H. 2012. Genome and gene duplications and gene expression
divergence: a view from plants. Annals of the New York Academy of Sciences, 1256, 1-14.
Wei, H., Li, W., Sun, X., Zhu, S. & Zhu, J. 2013. Systematic Analysis and Comparison of
Nucleotide-Binding Site Disease Resistance Genes in a Diploid Cotton Gossypium
raimondii. PLoS ONE, 8, e68435.
Werner, S., Diederichsen, E., Frauen, M., Schondelmaier, J. & Jung, C. 2008. Genetic mapping of
clubroot resistance genes in oilseed rape. Theoretical and Applied Genetics, 116, 363-372.
West, J. S., Kharbanda, P. D., Barbetti, M. J. & Fitt, B. D. L. 2001. Epidemiology and management
of Leptosphaeria maculans (phoma stem canker) on oilseed rape in Australia, Canada and
Europe. Plant Pathology, 50, 10-27.
Westermeier, P., Wenzel, G. & Mohler, V. 2009. Development and evaluation of single-nucleotide
polymorphism markers in allotetraploid rapeseed (Brassica napus L.). Theoretical and
Applied Genetics, 119, 1301-1311.
Williams & Fitt 1999. Differentiating A and B groups of Leptosphaeria maculans, causal agent of
stem canker (blackleg) of oilseed rape. Plant Pathology, 48, 161-175.
Williams, P. & Delwiche, P. 1979. screening for resistance to blackleg of crucifers in the seedling
stage. Proceedings of Cruciferous Crops, 164-170.
Winfield, M. O., Wilkinson, P. A., Allen, A. M., Barker, G. L., Coghill, J. A., Burridge, A., Hall,
A., Brenchley, R. C., D’Amore, R. & Hall, N. 2012. Targeted re‐sequencing of the
allohexaploid wheat exome. Plant Biotechnology Journal, 10, 733-742.
Wisser, R. J., Sun, Q., Hulbert, S. H., Kresovich, S. & Nelson, R. J. 2005. Identification and
Characterization of Regions of the Rice Genome Associated With Broad-Spectrum,
Quantitative Disease Resistance. Genetics, 169, 2277-2293.
Wretblad, S., Bohman, S. & Dixelius, C. 2003. Overexpression of a Brassica nigra cDNA gives
enhanced resistance to Leptosphaeria maculans in B. napus. Molecular Plant-Microbe
Interactions, 16, 477-484.
Wroblewski, T., Tomczak, A. & Michelmore, R. 2005. Optimization of Agrobacterium-mediated
transient assays of gene expression in lettuce, tomato and Arabidopsis. Plant Biotechnology
Journal, 3, 259-273.
Wulff, B. B., Heese, A., Tomlinson-Buhot, L., Jones, D. A., de la Peña, M. & Jones, J. D. 2009.
The major specificity-determining amino acids of the tomato Cf-9 disease resistance protein
are at hypervariable solvent-exposed positions in the central leucine-rich repeats. Molecular
Plant-Microbe Interactions, 22, 1203-1213.

176
Yang, S., Zhang, X., Yue, J.-X., Tian, D. & Chen, J.-Q. 2008. Recent duplications dominate NBS-
encoding gene expansion in two woody species. Molecular Genetics and Genomics, 280,
187-198.
Yang, X., Deng, F. & Ramonell, K. 2012. Receptor-like kinases and receptor-like proteins: keys to
pathogen recognition and defense signaling in plant innate immunity. Frontiers in Biology,
7, 155-166.
Yu, F., Lydiate, D. J. & Rimmer, S. R. 2005. Identification of two novel genes for blackleg
resistance in Brassica napus. Theoretical and Applied Genetics, 110, 969-979.
Yu, F., Lydiate, D. J. & Rimmer, S. R. 2008. Identification and mapping of a third blackleg
resistance locus in Brassica napus derived from B. rapa subsp. sylvestris. Genome, 51, 64-
72.
Yu, F., Gugel, R., Kutcher, H., Peng, G. & Rimmer, S. 2012. Identification and mapping of a novel
blackleg resistance locus LepR4 in the progenies from Brassica napus × B. rapa subsp.
sylvestris. Theoretical and Applied Genetics, 1-9.
Yu, H., Zhong, X., Li, B. & Gu, H. 2010. A Molecular Marker Linked to Downy Mildew Resistant
Gene in Heading Chinese Cabbage (Brassica rapa L.ssp .pekinensis (Lour) Olsson) ( in
chinese). CHINESE AGRICULTURAL SCIENCE, 26, 66-70
Yu, H., Xie, W., Wang, J., Xing, Y., Xu, C., Li, X., Xiao, J. & Zhang, Q. 2011a. Gains in QTL
Detection Using an Ultra-High Density SNP Map Based on Population Sequencing Relative
to Traditional RFLP/SSR Markers. PLoS ONE, 6, e17595.
Yu, J., Tehrim, S., Zhang, F., Tong, C., Huang, J., Cheng, X., Dong, C., Zhou, Y., Qin, R., Hua, W.
& Liu, S. 2014. Genome-wide comparative analysis of NBS-encoding genes between
Brassica species and Arabidopsis thaliana. BMC Genomics, 15, 3.
Yu, S., Zhang, F., Yu, R., Zou, Y., Qi, J., Zhao, X., Yu, Y., Zhang, D. & Li, L. 2009. Genetic
mapping and localization of a major QTL for seedling resistance to downy mildew in
Chinese cabbage (Brassica rapa ssp. pekinensis). Molecular Breeding, 23, 573-590.
Yu, S., Zhang, F., Zhao, X., Yu, Y. & Zhang, D. 2011b. Sequence-characterized amplified region
and simple sequence repeat markers for identifying the major quantitative trait locus
responsible for seedling resistance to downy mildew in Chinese cabbage (Brassica rapa ssp.
pekinensis). Plant Breeding, 130, 580-583.
Yue, J., Meyers, B., Chen, J., Tian, D. & Yang, S. 2012. Tracing the origin and evolutionary history
of plant nucleotide-binding site-leucine-rich repeat (NBS-LRR) genes. New Phytologist 193,
1049 - 1063.
Zhang, X., Feng, Y., Cheng, H., Tian, D., Yang, S. & Chen, J.-Q. 2011. Relative evolutionary rates
of NBS-encoding genes revealed by soybean segmental duplication. Molecular Genetics
and Genomics, 285, 79-90.
Zhou, T., Wang, Y., Chen, J. Q., Araki, H., Jing, Z., Jiang, K., Shen, J. & Tian, D. 2004. Genome-
wide identification of NBS genes in japonica rice reveals significant expansion of divergent
non-TIR NBS-LRR genes. Molecular Genetics and Genomics, 271, 402-415.
Zhu, J. S., Struss, D. & Robbelen, G. 1993. Studies on resistance to Phoma lingam in Brassica
napus-Brassica nigra addition lines. Plant Breeding, 111, 192-197.