Embed Size (px)
Citation preview
on February 2, 2018http://rspb.royalsocietypublishing.org/Downloaded from
rspb.royalsocietypublishing.org
ResearchCite this article: Tassi F et al. 2017
Genome diversity in the Neolithic Globular
Amphorae culture and the spread of Indo-
European languages. Proc. R. Soc. B 284:
20171540.
http://dx.doi.org/10.1098/rspb.2017.1540
Received: 12 July 2017
Accepted: 23 October 2017
Subject Category:Evolution
Subject Areas:evolution, genomics
Keywords:population genomics, ancient DNA,
migration, Neolithic, Indo-European,
approximate Bayesian computation
Authors for correspondence:David Caramelli
e-mail: [email protected]
Guido Barbujani
e-mail: [email protected]
†These authors contributed equally to this
study.
Electronic supplementary material is available
online at https://dx.doi.org/10.6084/m9.
figshare.c.3928333.
& 2017 The Authors. Published by the Royal Society under the terms of the Creative Commons AttributionLicense http://creativecommons.org/licenses/by/4.0/, which permits unrestricted use, provided the originalauthor and source are credited.Genome diversity in the NeolithicGlobular Amphorae culture and thespread of Indo-European languages
Francesca Tassi1,†, Stefania Vai2,†, Silvia Ghirotto1, Martina Lari2,Alessandra Modi2, Elena Pilli2, Andrea Brunelli1, Roberta Rosa Susca1,Alicja Budnik3, Damian Labuda4, Federica Alberti5, Carles Lalueza-Fox6,David Reich7,8, David Caramelli2 and Guido Barbujani1
1Department of Life Sciences and Biotechnology, and 2Department of Biology, University of Firenze,Firenze, Italy3Department of Human Biology, Cardinal Stefan Wyszynski University, Warsaw, Poland4CHU Sainte-Justine Research Center, Department of Pediatrics, Universite de Montreal, Montreal, PQ,Canada H3T 1C55Department of Evolutionary Biology, Institute for Biochemistry and Biology, Potsdam University,Potsdam, Germany6Institute of Evolutionary Biology, University Pompeu Fabra, Barcelona, Spain7Department of Genetics, and 8Howard Hughes Medical Institute, Harvard Medical School, Boston, MA, USA
GB, 0000-0001-7854-6669
It is unclear whether Indo-European languages in Europe spread from the
Pontic steppes in the late Neolithic, or from Anatolia in the Early Neolithic.
Under the former hypothesis, people of the Globular Amphorae culture
(GAC) would be descended from Eastern ancestors, likely representing the
Yamnaya culture. However, nuclear (six individuals typed for 597 573 SNPs)
and mitochondrial (11 complete sequences) DNA from the GAC appear
closer to those of earlier Neolithic groups than to the DNA of all other popu-
lations related to the Pontic steppe migration. Explicit comparisons of
alternative demographic models via approximate Bayesian computation con-
firmed this pattern. These results are not in contrast to Late Neolithic gene flow
from the Pontic steppes into Central Europe. However, they add nuance to this
model, showing that the eastern affinities of the GAC in the archaeological
record reflect cultural influences from other groups from the East, rather
than the movement of people.
1. IntroductionAlmost all Europeans speak Indo-European (IE) languages, and certainly not by
chance. However, the place of origin of the first IE speakers has not been ident-
ified, nor has any consensus emerged about the time and the mechanisms by
which IE languages spread over Western Eurasia. Based on the linguistic and
archaeological evidence, the earliest speakers of a proto-IE language have often
been identified with people living in the Pontic steppes about 6000 years ago
[1], with their subsequent westward diffusion occurring in parallel with that of
the Kurgan [2], or the Yamna [3] pastoral cultures. Conversely, genetic evidence
of demic diffusion from the Near East into Europe [4] led Renfrew [5,6] to propose
an earlier spread of Indo-European from Anatolia (9500–8000 years ago), through
a single expansion carrying Neolithic technologies, genes and languages into
much of Europe. In principle, language change does not need to be accompanied
by migration, because cultural contacts, or a combination of cultural and demo-
graphic changes, may also lead to changes at the linguistic level. A common
feature of the Kurgan and Anatolian models is that both postulate a migration
rspb.royalsocietypublishing.orgProc.R.Soc.B
284:20171540
2
on February 2, 2018http://rspb.royalsocietypublishing.org/Downloaded from
fuelled by cultural innovations, horse riding or farming,
respectively, which in turn facilitated language spread. This
means that the spread of cultural novelty, documented by
archaeological and linguistic evidence, has entailed demo-
graphic changes, which in principle have left their signature
at the genomic level.
The majority of linguists currently support the hypothesis
of a late, Pontic spread, here referred to as the Kurgan hypoth-
esis [7], although Bayesian analyses of linguistic variation [8,9]
seem to be easier to reconcile with an early diffusion of IE
languages from Anatolia. However this inference is highly
sensitive to prior assumptions, and when a different set of
plausible prior assumptions is used, the same methods support
the chronology suggested by the Kurgan hypothesis [10].
Recently, genetic data have provided strong new evidence
relevant to this debate. There is ample genetic evidence that
extensive migration accompanied the European spread of
Neolithic technologies from the Near East [11–14]. Neolithic
farmers came to occupy territories once inhabited by Meso-
lithic hunters and gatherers [15–20] which, for the sake of
simplicity, we shall jointly consider here as hunter-gatherers.
However, the hunter-gatherers did not go extinct, as data
from Central Europe and Spain suggest a resurgence of a geno-
mic component associated with them, during the Middle and
late Neolithic [17,18,20]. There is now genetic evidence of
population movements from the Russian steppes into Central
Europe in the Bronze Age [20,21] and Iron Age [22]. These pro-
cesses may or may not have had large-scale consequences at
the demographic and linguistic level, but the later expansion
would be consistent with a spread of languages associated
with the Kurgan hypothesis [18,21].
In the great majority of ancient DNA studies, migration and
admixture processes were not explicitly modelled, but instead
inferred from levels of genetic resemblance among samples, as
shown by principal component analysis (PCA) plots, cluster-
ing, and fitting of admixture graphs and clade tests based on
f3- and f4-statistics (e.g. [18,20,21]). While giving a general over-
view of the data, these exploratory methods do not allow for
formal comparison of alternative models, nor do they estimate
parameters such as migration rates and population sizes. For
that purpose, and to obtain insight into the origins of genomic
variation in Middle Neolithic Central Europe, we collected and
typed samples of 17 individuals from the Megalithic barrow of
Kierzkowo (Poland), which is archaeologically assigned to the
Globular Amphorae culture (GAC). The GAC is documented
in Central and Eastern Europe, from the Elbe to the middle
Dnieper, around 5400–4800 BP. It plays a crucial role in this
debate because it has been argued to be associated with the
first Indo-European migrations based on its burial rituals,
including burial of livestock, usage of domestic horse, and
presence of amber sun-disks [1]. Gimbutas [23] argued that
when the Kurgan culture expanded from its homeland in the
steppe and forest-steppe of Ukraine and South Russia, it did
so in three waves, thus leading to the diffusion of the IE
languages (see electronic supplementary material, figure S1).
The GAC people are regarded by Gimbutas as part of the
first wave, associated with the spread of the Yamna culture
from the Pontic region to the Danube basin and the Balkans,
between 5100 and 4900 BP [1]. If Gimbutas’ theory is correct,
the people of the GAC should have Yamna related admixture,
as well as genetic affinity to the populations associated with the
later, Bell Beaker culture, documented in many areas of Europe
4800 to 3800 BP.
2. Material and methods(a) Newly characterized ancient samplesThe samples analysed in this study come from a Megalithic barrow,
an elongated oval of almost 22 m in length and up to 6 m in breadth,
in Kierzkowo, Znin district, northwestern Poland [24], a typical
example of the GAC burial rituals. The barrow was situated on
top of a hill and contained in its western part a chamber about
10 m long, 1.5 m wide, made of stone slabs with a height of about
1 m, and divided in two unequal parts by a boulder. Inside the
chamber, Neolithic human bones were gathered into two large
clusters and a smaller one, mixed with animal bones, the latter bear-
ing signs of dismemberment. Most of the skeletal material was
fragmented and mixed, but human bones belonging to at least 23
different individuals were recovered. From 17 initial samples for
which we had bone material, three were excluded because they
were probably buried there much later as their position outside
the burial chamber could have indicated; this was confirmed by
radiocarbon dating (electronic supplementary material, table S1;
see ‘Sample selection for population genetic analysis’ in the elec-
tronic supplementary material). After discarding samples with
low DNA content, or which turned out to represent the same indi-
vidual, we characterized 14 new mitochondrial genomes, 11 of
them from the Neolithic period (see below). The nuclear genome
data presented in this study are whole genome single nucleotide
polymorphism (SNP) data on six individuals reported as part of a
parallel broad-range study of ancient genetic variation of Eastern
and Southeastern Europe [25].
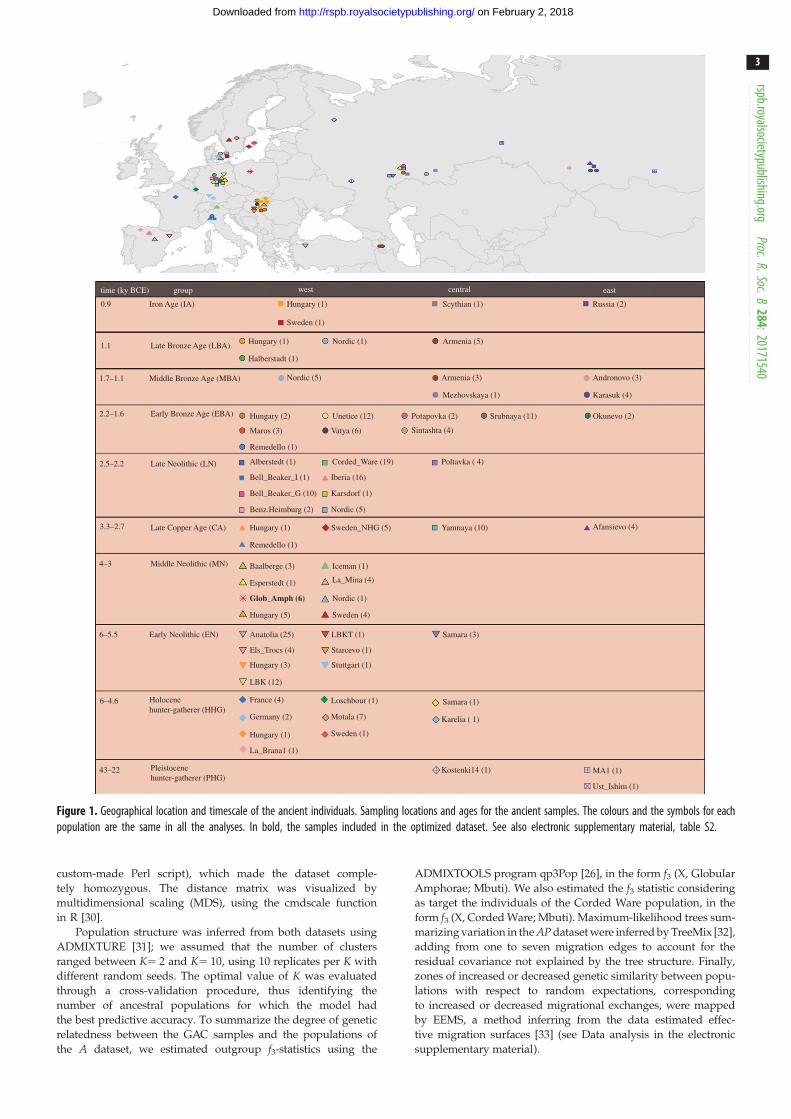
(b) Genomic data(i) Population genetic reference dataTo analyse the GAC individuals in the context of ancient
and present-day genetic diversity, we merged them with 249
ancient individuals (grouped by archaeological culture and
chronology, figure 1 and electronic supplementary material,
table S2) and 777 west Eurasian individuals (electronic sup-
plementary material, figure S2 and table S3). All samples were
genotyped at 597 573 sites targeted both by the Affymetrix
Human Origins array and on the in-solution enrichment reagent
used in several ancient DNA studies [26]. We then created an opti-
mized dataset, selecting in each ancient population only SNPs
covered in at least one GA individual, which brought the
number of SNPs to 350 680. For each ancient population, we
then filtered out from this subset the SNPs showing missing gen-
otype in all individuals. We ordered the ancient populations
based on the number of SNPs selected by the filtering process,
and adding the populations one by one we identified a common
subset of SNPs, namely 101 979 SNPs in 39 populations, for a
total of 199 ancient individuals spanning from the Pleistocene to
the Iron Age (electronic supplementary material, figure S3).
Using PLINK [27], we extracted these positions from 777
modern individuals. This way, we assembled two datasets: AP,
including both ancient and present-day individuals and A,
including only ancient individuals.
(ii) Data analysisWe ran PCA on the AP dataset using the snpgdsPCA function in
the SNPRelate package [28]. For details on this and other
methods, see Data analysis in the electronic supplementary
material. To avoid possible confounding effects caused by post-
mortem deamination, only transversions were considered, for a
total of 18 198 SNPs. Next, we calculated a matrix of genetic
distances between pairs of individuals in the dataset AP, using
the software 4P [29], considering only the SNPs for which both
individuals had non-missing genotypes. To account for the
non-diploid data of ancient individuals, a random allele was
selected for each heterozygous modern individual (using a
time (ky BCE) group
Iron Age (IA) Hungary (1)
Hungary (1)
Scythian (1) Russia (2)
Sweden (1)
Halberstadt (1)
Nordic (1) Armenia (5)
0.9
1.1
1.7–1.1
2.2–1.6
2.5–2.2
3.3–2.7
4–3
6–5.5
6–4.6
43–22
Late Bronze Age (LBA)
Middle Bronze Age (MBA)
Early Bronze Age (EBA)
Late Neolithic (LN) Alberstedt (1)
Bell_Beaker_I (1) Iberia (16)
Karsdorf (1)
Benz.Heimburg (2)
Late Copper Age (CA)
Middle Neolithic (MN)
Early Neolithic (EN) Anatolia (25)
Els_Trocs (4)
Hungary (3)
LBK (12)
France (4) Loschbour (1) Samara (1)
Karelia ( 1)
Kostenki14 (1) MA1 (1)
Ust_Ishim (1)
Germany (2)
Hungary (1)
La_Brana1 (1)
Motala (7)
Sweden (1)
Holocenehunter-gatherer (HHG)
Pleistocenehunter-gatherer (PHG)
LBKT (1)
Starcevo (1)
Stuttgart (1)
Samara (3)
Nordic (5)
Bell_Beaker_G (10)
Corded_Ware (19) Poltavka ( 4)
Hungary (2) Unetice (12) Potapovka (2)
Sintashta (4)
Srubnaya (11) Okunevo (2)
Vatya (6)Maros (3)
Remedello (1)
Nordic (5) Armenia (3) Andronovo (3)
Mezhovskaya (1) Karasuk (4)
west central east
Hungary (1)
Remedello (1)
Baalberge (3) Iceman (1)
Esperstedt (1) La_Mina (4)
Nordic (1)
Hungary (5) Sweden (4)
Glob_Amph (6)
Sweden_NHG (5) Yamnaya (10) Afansievo (4)
Figure 1. Geographical location and timescale of the ancient individuals. Sampling locations and ages for the ancient samples. The colours and the symbols for eachpopulation are the same in all the analyses. In bold, the samples included in the optimized dataset. See also electronic supplementary material, table S2.
rspb.royalsocietypublishing.orgProc.R.Soc.B
284:20171540
3
on February 2, 2018http://rspb.royalsocietypublishing.org/Downloaded from
custom-made Perl script), which made the dataset comple-
tely homozygous. The distance matrix was visualized by
multidimensional scaling (MDS), using the cmdscale function
in R [30].
Population structure was inferred from both datasets using
ADMIXTURE [31]; we assumed that the number of clusters
ranged between K¼ 2 and K¼ 10, using 10 replicates per K with
different random seeds. The optimal value of K was evaluated
through a cross-validation procedure, thus identifying the
number of ancestral populations for which the model had
the best predictive accuracy. To summarize the degree of genetic
relatedness between the GAC samples and the populations of
the A dataset, we estimated outgroup f3-statistics using the
ADMIXTOOLS program qp3Pop [26], in the form f3 (X, Globular
Amphorae; Mbuti). We also estimated the f3 statistic considering
as target the individuals of the Corded Ware population, in the
form f3 (X, Corded Ware; Mbuti). Maximum-likelihood trees sum-
marizing variation in the AP dataset were inferred by TreeMix [32],
adding from one to seven migration edges to account for the
residual covariance not explained by the tree structure. Finally,
zones of increased or decreased genetic similarity between popu-
lations with respect to random expectations, corresponding
to increased or decreased migrational exchanges, were mapped
by EEMS, a method inferring from the data estimated effec-
tive migration surfaces [33] (see Data analysis in the electronic
supplementary material).
CentralEurope
current CentralEurope
current Near East current EasternEurope
hunter-gatherers farmers
1
2
3
hunter-gatherers
EasternEurope
Near East
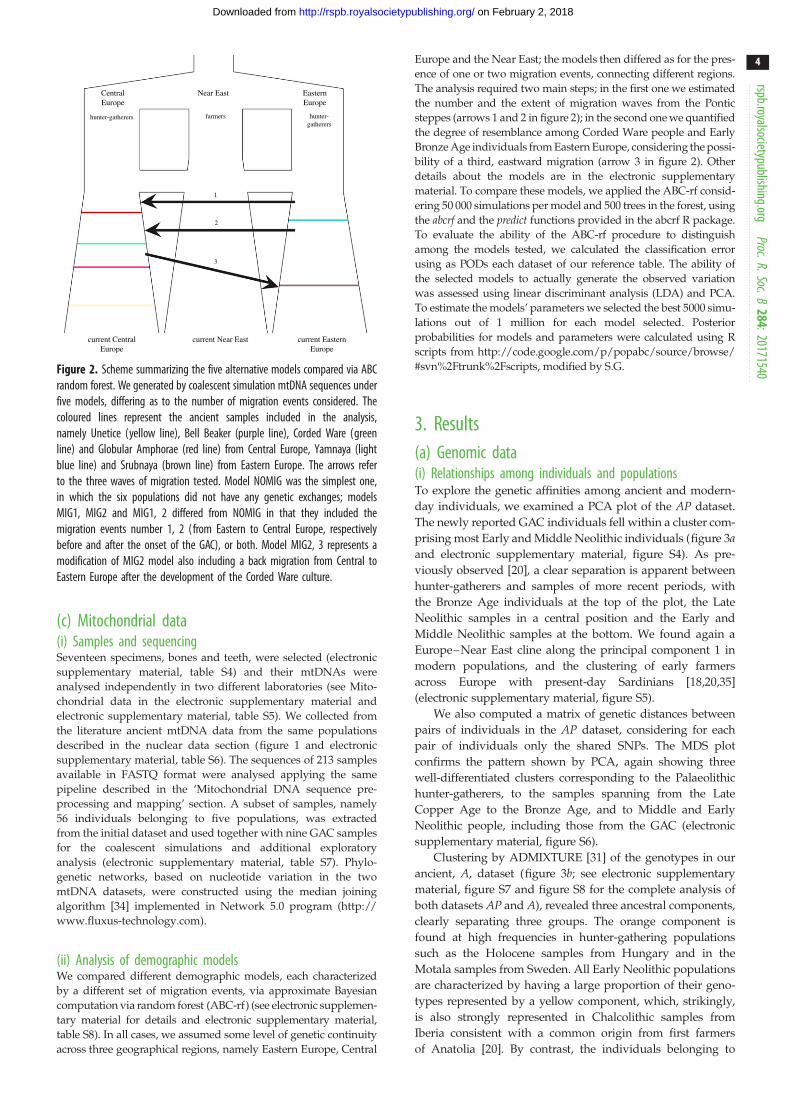
Figure 2. Scheme summarizing the five alternative models compared via ABCrandom forest. We generated by coalescent simulation mtDNA sequences underfive models, differing as to the number of migration events considered. Thecoloured lines represent the ancient samples included in the analysis,namely Unetice (yellow line), Bell Beaker (purple line), Corded Ware (greenline) and Globular Amphorae (red line) from Central Europe, Yamnaya (lightblue line) and Srubnaya (brown line) from Eastern Europe. The arrows referto the three waves of migration tested. Model NOMIG was the simplest one,in which the six populations did not have any genetic exchanges; modelsMIG1, MIG2 and MIG1, 2 differed from NOMIG in that they included themigration events number 1, 2 (from Eastern to Central Europe, respectivelybefore and after the onset of the GAC), or both. Model MIG2, 3 represents amodification of MIG2 model also including a back migration from Central toEastern Europe after the development of the Corded Ware culture.
rspb.royalsocietypublishing.orgProc.R.Soc.B
284:20171540
4
on February 2, 2018http://rspb.royalsocietypublishing.org/Downloaded from
(c) Mitochondrial data(i) Samples and sequencingSeventeen specimens, bones and teeth, were selected (electronic
supplementary material, table S4) and their mtDNAs were
analysed independently in two different laboratories (see Mito-
chondrial data in the electronic supplementary material and
electronic supplementary material, table S5). We collected from
the literature ancient mtDNA data from the same populations
described in the nuclear data section (figure 1 and electronic
supplementary material, table S6). The sequences of 213 samples
available in FASTQ format were analysed applying the same
pipeline described in the ‘Mitochondrial DNA sequence pre-
processing and mapping’ section. A subset of samples, namely
56 individuals belonging to five populations, was extracted
from the initial dataset and used together with nine GAC samples
for the coalescent simulations and additional exploratory
analysis (electronic supplementary material, table S7). Phylo-
genetic networks, based on nucleotide variation in the two
mtDNA datasets, were constructed using the median joining
algorithm [34] implemented in Network 5.0 program (http://
www.fluxus-technology.com).
(ii) Analysis of demographic modelsWe compared different demographic models, each characterized
by a different set of migration events, via approximate Bayesian
computation via random forest (ABC-rf) (see electronic supplemen-
tary material for details and electronic supplementary material,
table S8). In all cases, we assumed some level of genetic continuity
across three geographical regions, namely Eastern Europe, Central
Europe and the Near East; the models then differed as for the pres-
ence of one or two migration events, connecting different regions.
The analysis required two main steps; in the first one we estimated
the number and the extent of migration waves from the Pontic
steppes (arrows 1 and 2 in figure 2); in the second one we quantified
the degree of resemblance among Corded Ware people and Early
Bronze Age individuals from Eastern Europe, considering the possi-
bility of a third, eastward migration (arrow 3 in figure 2). Other
details about the models are in the electronic supplementary
material. To compare these models, we applied the ABC-rf consid-
ering 50 000 simulations per model and 500 trees in the forest, using
the abcrf and the predict functions provided in the abcrf R package.
To evaluate the ability of the ABC-rf procedure to distinguish
among the models tested, we calculated the classification error
using as PODs each dataset of our reference table. The ability of
the selected models to actually generate the observed variation
was assessed using linear discriminant analysis (LDA) and PCA.
To estimate the models’ parameters we selected the best 5000 simu-
lations out of 1 million for each model selected. Posterior
probabilities for models and parameters were calculated using R
scripts from http://code.google.com/p/popabc/source/browse/
#svn%2Ftrunk%2Fscripts, modified by S.G.
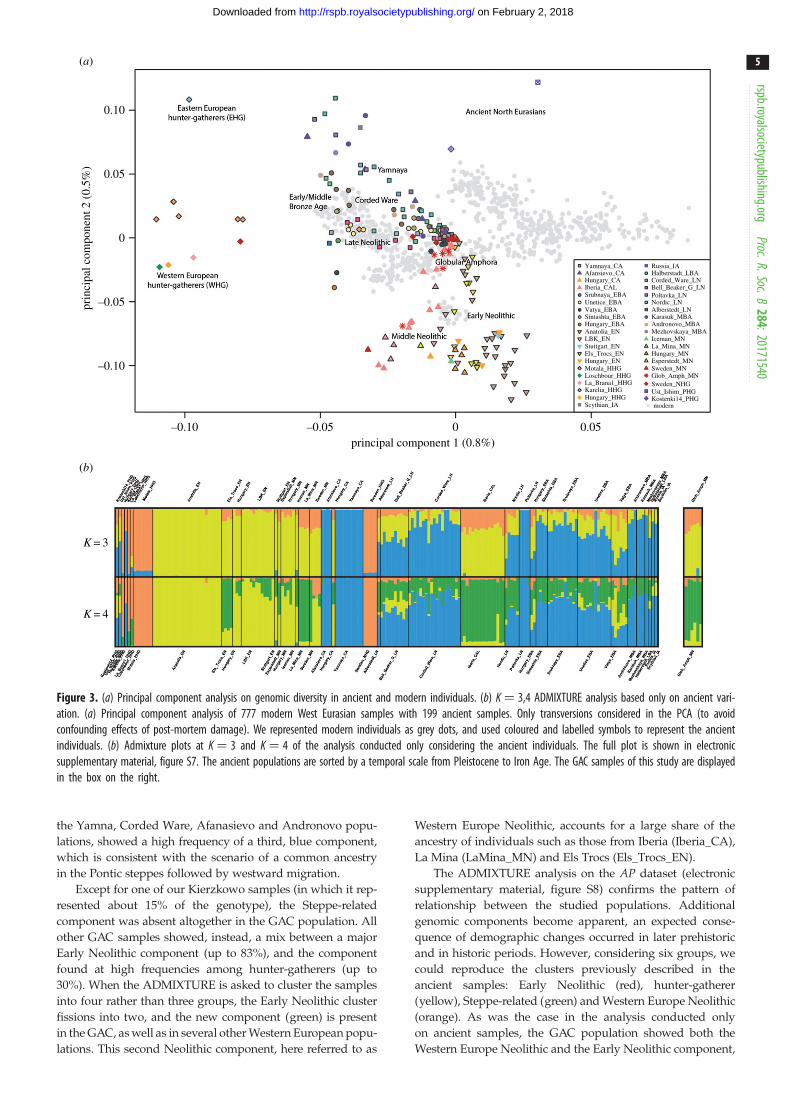
3. Results(a) Genomic data(i) Relationships among individuals and populationsTo explore the genetic affinities among ancient and modern-
day individuals, we examined a PCA plot of the AP dataset.
The newly reported GAC individuals fell within a cluster com-
prising most Early and Middle Neolithic individuals (figure 3aand electronic supplementary material, figure S4). As pre-
viously observed [20], a clear separation is apparent between
hunter-gatherers and samples of more recent periods, with
the Bronze Age individuals at the top of the plot, the Late
Neolithic samples in a central position and the Early and
Middle Neolithic samples at the bottom. We found again a
Europe–Near East cline along the principal component 1 in
modern populations, and the clustering of early farmers
across Europe with present-day Sardinians [18,20,35]
(electronic supplementary material, figure S5).
We also computed a matrix of genetic distances between
pairs of individuals in the AP dataset, considering for each
pair of individuals only the shared SNPs. The MDS plot
confirms the pattern shown by PCA, again showing three
well-differentiated clusters corresponding to the Palaeolithic
hunter-gatherers, to the samples spanning from the Late
Copper Age to the Bronze Age, and to Middle and Early
Neolithic people, including those from the GAC (electronic
supplementary material, figure S6).
Clustering by ADMIXTURE [31] of the genotypes in our
ancient, A, dataset (figure 3b; see electronic supplementary
material, figure S7 and figure S8 for the complete analysis of
both datasets AP and A), revealed three ancestral components,
clearly separating three groups. The orange component is
found at high frequencies in hunter-gathering populations
such as the Holocene samples from Hungary and in the
Motala samples from Sweden. All Early Neolithic populations
are characterized by having a large proportion of their geno-
types represented by a yellow component, which, strikingly,
is also strongly represented in Chalcolithic samples from
Iberia consistent with a common origin from first farmers
of Anatolia [20]. By contrast, the individuals belonging to
0.10
–0.10
–0.10
K = 3
K = 4
0.05
Yamnaya_CA Russia_IAHalberstadt_LBACorded_Ware_LNBell_Beaker_G_LNPoltavka_LNNordic_LNAlberstedt_LNKarasuk_MBAAndronovo_MBAMezhovskaya_MBAIceman_MNLa_Mina_MNHungary_MNEsperstedt_MNSweden_MNGlob_Amph_MNSweden_NHGUst_Ishim_PHGKostenki14_PHGmodern
Afansievo_CAHungary_CAIberia_CALSrubnaya_EBAUnetice_EBAVatya_EBASintashta_EBAHungary_EBAAnatolia_ENLBK_ENStuttgart_ENEls_Trocs_ENHungary_ENMotala_HHGLoschbour_HHGLa_Brana1_HHGKarelia_HHGHungary_HHGScythian_IA
0–0.05
–0.05
0
0.05
prin
cipa
l com
pone
nt 2
(0.
5%)
principal component 1 (0.8%)
(a)
(b)
Figure 3. (a) Principal component analysis on genomic diversity in ancient and modern individuals. (b) K ¼ 3,4 ADMIXTURE analysis based only on ancient vari-ation. (a) Principal component analysis of 777 modern West Eurasian samples with 199 ancient samples. Only transversions considered in the PCA (to avoidconfounding effects of post-mortem damage). We represented modern individuals as grey dots, and used coloured and labelled symbols to represent the ancientindividuals. (b) Admixture plots at K ¼ 3 and K ¼ 4 of the analysis conducted only considering the ancient individuals. The full plot is shown in electronicsupplementary material, figure S7. The ancient populations are sorted by a temporal scale from Pleistocene to Iron Age. The GAC samples of this study are displayedin the box on the right.
rspb.royalsocietypublishing.orgProc.R.Soc.B
284:20171540
5
on February 2, 2018http://rspb.royalsocietypublishing.org/Downloaded from
the Yamna, Corded Ware, Afanasievo and Andronovo popu-
lations, showed a high frequency of a third, blue component,
which is consistent with the scenario of a common ancestry
in the Pontic steppes followed by westward migration.
Except for one of our Kierzkowo samples (in which it rep-
resented about 15% of the genotype), the Steppe-related
component was absent altogether in the GAC population. All
other GAC samples showed, instead, a mix between a major
Early Neolithic component (up to 83%), and the component
found at high frequencies among hunter-gatherers (up to
30%). When the ADMIXTURE is asked to cluster the samples
into four rather than three groups, the Early Neolithic cluster
fissions into two, and the new component (green) is present
in the GAC, as well as in several other Western European popu-
lations. This second Neolithic component, here referred to as
Western Europe Neolithic, accounts for a large share of the
ancestry of individuals such as those from Iberia (Iberia_CA),
La Mina (LaMina_MN) and Els Trocs (Els_Trocs_EN).
The ADMIXTURE analysis on the AP dataset (electronic
supplementary material, figure S8) confirms the pattern of
relationship between the studied populations. Additional
genomic components become apparent, an expected conse-
quence of demographic changes occurred in later prehistoric
and in historic periods. However, considering six groups, we
could reproduce the clusters previously described in the
ancient samples: Early Neolithic (red), hunter-gatherer
(yellow), Steppe-related (green) and Western Europe Neolithic
(orange). As was the case in the analysis conducted only
on ancient samples, the GAC population showed both the
Western Europe Neolithic and the Early Neolithic component,
Hun
gary
_MN
Yam
naya
_CA
Hal
bers
tadt
_LB
A
Cor
ded_
War
e_L
N
Bel
l_B
eake
r_G
_LN
Polta
vka_
LN
Nor
dic_
LN
Alb
erst
edt_
LN
Kar
asuk
_MB
A
And
rono
vo_M
BA
Mez
hovs
kaya
_MB
A
Icem
an_M
N
Hun
gary
_MB
A
Esp
erst
edt_
MN
Swed
en_M
N
Glo
bula
r_A
mph
ora_
MN
Swed
en_N
HG
Kos
tenk
i_H
HG
Rus
sia_
IAU
st_I
shim
_HH
G
Afa
nasi
evo.
SG
Hun
gary
_CA
Iber
ia_C
AL
Iber
ia_E
N
Iber
ia_M
N
Srub
naya
_EB
A
Une
tice_
EB
AV
atya
_EB
A
Sint
asht
a_M
BA
Ana
tolia
_EN
LB
K_E
N
LB
K_E
NSt
uttg
art_
EN
Hun
gary
_EN
Mot
ala_
HH
G
Los
chbo
ur_H
HG
LaB
rana
1_H
HG
Kar
elia
_HH
G
Scyt
hian
_IA
Hun
gary
_MN
Yam
naya
_CA
Hal
bers
tadt
_LB
A
Bel
l_B
eake
r_G
_LN
Polta
vka_
LN
Nor
dic_
LN
Alb
erst
edt_
LN
Kar
asuk
_MB
A
And
rono
vo_M
BA
Mez
hovs
kaya
_MB
A
Icem
an_M
NH
unga
ry_M
BA
Esp
erst
edt_
MN
Swed
en_M
N
Swed
en_N
HG
Kos
tenk
i14_
HH
GR
ussi
a_IA
Ust
_Ish
im_H
HG
Afa
nasi
evo_
CA
Hun
gary
_CA
Iber
ia_C
AL
Iber
ia_M
N
Iber
ia_E
N
Srub
naya
_EB
A
Une
tice_
EB
A
Vat
ya_E
BA
Sint
asht
a_M
BA
Ana
tolia
_EN
LB
K_E
N
LB
K_E
NSt
uttg
art_
EN
Hun
gary
_EN
Mot
ala_
HH
G
Los
chbo
ur_H
HG
LaB
rana
1_H
HG
Kar
elia
_HH
G
Scyt
hian
_IA
f3
f3
0.27
0.21
0.22
0.23
0.24
0.25
0.26
(a)
(b)
0.27
0.21
0.22
0.23
0.24
0.25
0.26
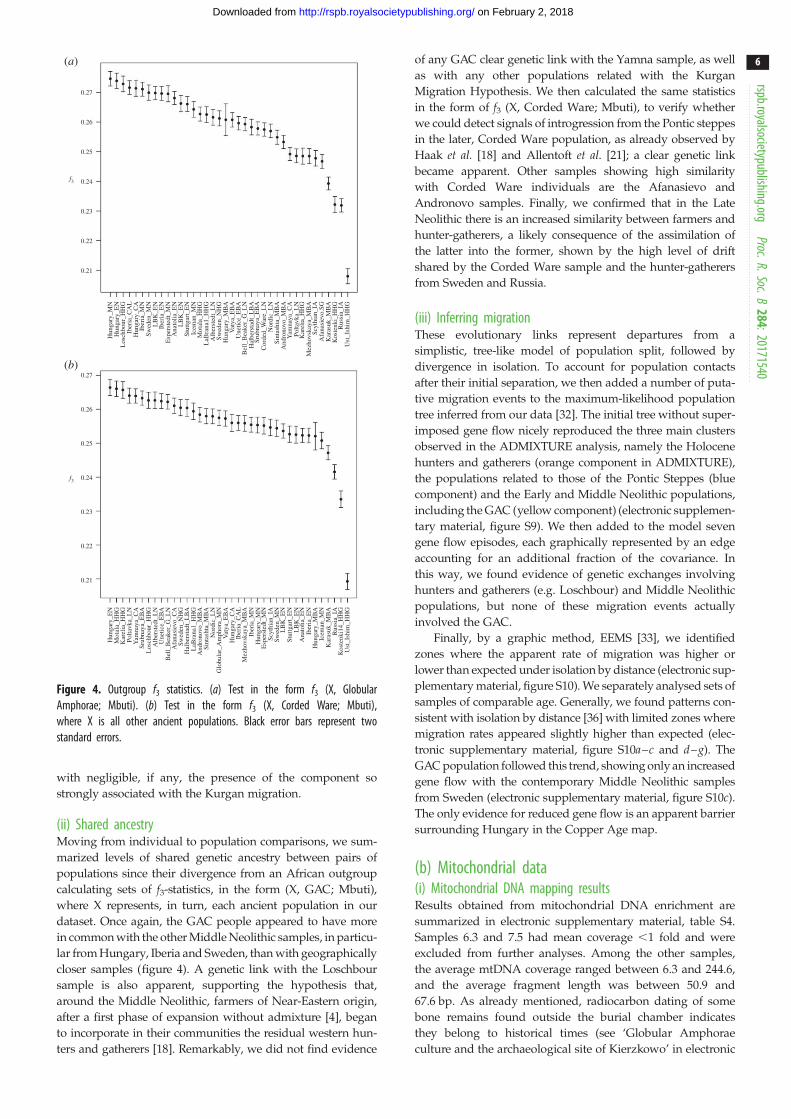
Figure 4. Outgroup f3 statistics. (a) Test in the form f3 (X, GlobularAmphorae; Mbuti). (b) Test in the form f3 (X, Corded Ware; Mbuti),where X is all other ancient populations. Black error bars represent twostandard errors.
rspb.royalsocietypublishing.orgProc.R.Soc.B
284:20171540
6
on February 2, 2018http://rspb.royalsocietypublishing.org/Downloaded from
with negligible, if any, the presence of the component so
strongly associated with the Kurgan migration.
(ii) Shared ancestryMoving from individual to population comparisons, we sum-
marized levels of shared genetic ancestry between pairs of
populations since their divergence from an African outgroup
calculating sets of f3-statistics, in the form (X, GAC; Mbuti),
where X represents, in turn, each ancient population in our
dataset. Once again, the GAC people appeared to have more
in common with the other Middle Neolithic samples, in particu-
lar from Hungary, Iberia and Sweden, than with geographically
closer samples (figure 4). A genetic link with the Loschbour
sample is also apparent, supporting the hypothesis that,
around the Middle Neolithic, farmers of Near-Eastern origin,
after a first phase of expansion without admixture [4], began
to incorporate in their communities the residual western hun-
ters and gatherers [18]. Remarkably, we did not find evidence
of any GAC clear genetic link with the Yamna sample, as well
as with any other populations related with the Kurgan
Migration Hypothesis. We then calculated the same statistics
in the form of f3 (X, Corded Ware; Mbuti), to verify whether
we could detect signals of introgression from the Pontic steppes
in the later, Corded Ware population, as already observed by
Haak et al. [18] and Allentoft et al. [21]; a clear genetic link
became apparent. Other samples showing high similarity
with Corded Ware individuals are the Afanasievo and
Andronovo samples. Finally, we confirmed that in the Late
Neolithic there is an increased similarity between farmers and
hunter-gatherers, a likely consequence of the assimilation of
the latter into the former, shown by the high level of drift
shared by the Corded Ware sample and the hunter-gatherers
from Sweden and Russia.
(iii) Inferring migrationThese evolutionary links represent departures from a
simplistic, tree-like model of population split, followed by
divergence in isolation. To account for population contacts
after their initial separation, we then added a number of puta-
tive migration events to the maximum-likelihood population
tree inferred from our data [32]. The initial tree without super-
imposed gene flow nicely reproduced the three main clusters
observed in the ADMIXTURE analysis, namely the Holocene
hunters and gatherers (orange component in ADMIXTURE),
the populations related to those of the Pontic Steppes (blue
component) and the Early and Middle Neolithic populations,
including the GAC (yellow component) (electronic supplemen-
tary material, figure S9). We then added to the model seven
gene flow episodes, each graphically represented by an edge
accounting for an additional fraction of the covariance. In
this way, we found evidence of genetic exchanges involving
hunters and gatherers (e.g. Loschbour) and Middle Neolithic
populations, but none of these migration events actually
involved the GAC.
Finally, by a graphic method, EEMS [33], we identified
zones where the apparent rate of migration was higher or
lower than expected under isolation by distance (electronic sup-
plementary material, figure S10). We separately analysed sets of
samples of comparable age. Generally, we found patterns con-
sistent with isolation by distance [36] with limited zones where
migration rates appeared slightly higher than expected (elec-
tronic supplementary material, figure S10a–c and d–g). The
GAC population followed this trend, showing only an increased
gene flow with the contemporary Middle Neolithic samples
from Sweden (electronic supplementary material, figure S10c).
The only evidence for reduced gene flow is an apparent barrier
surrounding Hungary in the Copper Age map.
(b) Mitochondrial data(i) Mitochondrial DNA mapping resultsResults obtained from mitochondrial DNA enrichment are
summarized in electronic supplementary material, table S4.
Samples 6.3 and 7.5 had mean coverage ,1 fold and were
excluded from further analyses. Among the other samples,
the average mtDNA coverage ranged between 6.3 and 244.6,
and the average fragment length was between 50.9 and
67.6 bp. As already mentioned, radiocarbon dating of some
bone remains found outside the burial chamber indicates
they belong to historical times (see ‘Globular Amphorae
culture and the archaeological site of Kierzkowo’ in electronic
rspb.royalsocietypublishing.orgProc.R.Soc.B
284:20171540
7
on February 2, 2018http://rspb.royalsocietypublishing.org/Downloaded from
supplementary material). Average fragment lengths were
the same for the samples found inside (Neolithic period) and
outside (historical period) the burial chamber. By contrast,
the two groups of samples differed for the deamination rate
at read termini: the proportion of C to T misincorporations
is between 30% and 40% in the Neolithic individuals, and
only 11% and 12%, respectively, in historical samples 8.8
and 8.9, possibly correlated with their different ages [37].
Sample 6.2, not directly dated but found outside the chamber
as well, shows 11% misincorporation, much like the historical
samples. No extensive contamination by modern DNA was
detected and nine mitochondrial genomes were selected as
described in electronic supplementary material for population
genetic analysis.
(ii) mtDNA data analysisFor 11 out of 17 GAC individuals, mitochondrial DNA was
typed by a capture NGS run. The samples were analysed
with the NGS pipeline described in Modi et al. [38]. Three indi-
viduals appeared genealogically related according to whole
genome analysis (I2433, mother of I2407 and I2435). Thus, in
successive analyses we only considered sample I2433, the
one with the highest coverage, bringing the GAC sample size
to 9 (electronic supplementary material, table S5).
To formally test the Steppe migration hypothesis, we
selected a subset of the mtDNA data including the nine GAC
individuals and 56 samples from five populations (see elec-
tronic supplementary material, table S7; the complete dataset
is in electronic supplementary material, table S6, and the
correspondence median network in electronic supplementary
material, figure S11), and we ran some preliminary analyses
on it. In the neighbour joining (NJ) tree inferred from the fST
pairwise distances estimated for this subset, the Early Bronze
Age people, represented by the Srubnaya culture, appear con-
nected with the eastern Corded Ware peoples, and also close
to the Yamna. The GAC samples are clearly separated from
those populations, and show instead a closer relationship
with the western, Late Neolithic, Bell Beaker population
(electronic supplementary material, figure S12).
The median-joining network [34] (electronic supplemen-
tary material, figure S13) shows GAC sequences falling in
haplogroups H, J, K, U and W. The relationships between the
GAC and other populations of the same time period are evi-
dent (electronic supplementary material, figure S14, inset d),
especially with the population from Sweden and, although
less so, with the Baalberge population from Germany.
(iii) Demographic history reconstructionABC-rf ([39]; see prior distributions in electronic supplemen-
tary material, table S8) gave the strongest support to the
MIG2 model (posterior probability ¼ 0.40; the number of
votes associated with each model are reported in electronic
supplementary material, table S9), involving a single
migration from the Pontic steppes into Central Europe, just
before the onset of the Corded Ware culture, but after the
moment at which our GAC samples are dated. Given the
low discrimination power resulting from this four-model
comparison (electronic supplementary material, table S10),
and to better investigate the relationship between the two
models receiving the highest number of votes (i.e. MIG2
and MIG1,2), we also performed a direct comparison
between MIG2 and MIG1,2. The classification error was
lower (electronic supplementary material, table S11), and
the probability associated with the selected model, MIG2,
was 0.62 (electronic supplementary material, table S12). The
proportion of Corded Ware lineages actually derived from
Yamna people was estimated to be 0.33 (median value)
or 0.43 (modal value) (electronic supplementary material,
table S13).
As a second step, we compared the MIG2 model with a
model also including a back migration to Eastern Europe
(MIG2,3, figure 2), thus exploring the possibility that the Sin-
tashta are derived directly from an Eastward migration of
Corded Ware people, as proposed by Allentoft et al. [21].
Because we had no high-quality mitochondrial data for the
Sintashta, we chose as a proxy the Srubnaya, which appeared
very similar in previous analyses of nuclear variation. The com-
parison of these two models via ABC-rf marginally favoured
MIG2,3, but only with a posterior probability of 0.53 (electronic
supplementary material, tables S14 and S15). The estimated
median proportions of Yamna related lineages contributing
to Corded Ware lineages, and of Corded Ware related lineages
contributing to the Srubnaya lineages, were respectively 0.31
and 0.27 (electronic supplementary material, table S16). Note
that the value estimated for the proportion of Corded Ware
lineages coming from Yamna is consistent between the two
models, whereas the estimate obtained for the admixture
with Yamna in the Srubnaya mitochondrial genome has low
R2 value, indicating that we might not have enough power to
quantify its extent. Both the MIG2 and the MIG2,3 models
provided a good ability to reproduce the observed data, as it
is shown by the LDA and the PCA plots in electronic
supplementary material, figure S15.
4. DiscussionIn its classical formulation, the Kurgan hypothesis, i.e. a late
Neolithic spread of proto-Indo-European languages from the
Pontic steppes, regards the GAC people as largely descended
from Late Neolithic ancestors from the East, most likely repre-
senting the Yamna culture; these populations then continued
their Westward movement, giving rise to the later Corded
Ware and Bell Beaker cultures. Gimbutas [23] suggested that
the spread of Indo-European languages involved conflict,
with eastern populations spreading their languages and cus-
toms to previously established European groups, which
implies some degree of demographic change in the areas
affected by the process. The genomic variation observed in
GAC individuals from Kierzkowo, Poland, does not seem to
agree with this view. Indeed, at the nuclear level, the GAC
people show minor genetic affinities with the other popu-
lations related with the Kurgan Hypothesis, including the
Yamna. On the contrary, they are similar to Early-Middle
Neolithic populations, even geographically distant ones, from
Iberia or Sweden. As already found for other Late Neolithic
populations [18], in the GAC people’s genome there is a com-
ponent related to those of much earlier hunting-gathering
communities, probably a sign of admixture with them. At the
nuclear level, there is a recognizable genealogical continuity
from Yamna to Corded Ware. However, the view that the
GAC people represented an intermediate phase in this large-
scale migration finds no support in bi-dimensional represen-
tations of genome diversity (PCA and MDS), ADMIXTURE
graphs, or in the set of estimated f3-statistics.
rspb.royalsocietypublishing.orgProc.R.Soc.B
284:20171540
8
on February 2, 2018http://rspb.royalsocietypublishing.org/Downloaded from
For a formal test of these findings, mtDNA data, with its
absence of recombination, have valuable properties and
allow explicit modelling. Analysis of mitochondrial DNA
also benefits from the extensive mathematical methodology
that has been developed for studying population history
based on such data. Population relationships inferred from
mitochondrial data closely resembled those inferred from
nuclear data, and so it seemed unlikely that the two datasets
may reflect very different demographic events. The models
including no migration (NOMIG), or a migration from the
Pontic steppes before the onset of the GAC (MIG1) found
very limited support in the ABC analysis. The best fit in the
first round of simulations was obtained including only a later
migration from Yamna, i.e. one not affecting the GAC individ-
uals for which we have information (MIG2), followed by the
model in which two subsequent migrations are considered
(MIG1,2). Adding, in a second round of simulations, a further
episode of gene flow, this time eastwards (MIG2,3), improved
the fit, but not dramatically so. The proportion of mtDNA
lineages possibly derived from those of the Yamna people is
less than 50%.
In short, simulation-based tests on mtDNA variation do
not suggest that the GAC people of this study have special
links with migrants from the Pontic steppes, but show a
direct connection between the Yamna and later Central
Europe cultures (Corded Ware and Bell beaker), who derived
almost half of their mitochondrial variation from them. The
emerging picture is thus one in which migrations from the
Pontic steppes into Central Europe left a trace in the genomes
of the Corded Ware culture, but not in those of the GAC.
At this stage, it is hard to say whether and to what extent
the finding that migrations from the Pontic steppes had little
or no demographic impact on the GAC also has implications
for the Kurgan hypothesis. There is little doubt that in the
Late Neolithic there were indeed migration processes from
the Pontic steppes into Central Europe, documented by the
archaeological and genetic links between the Yamna and
Corded Ware cultures. However, depending on the number
of people involved, migrations may or may not leave a recog-
nizable trace in the genetic makeup of a population. The data
we provide show that such a trace is not apparent in the gen-
omes of the GAC people. Rather, evolutionary connections
are evident between the GAC and other European groups,
both at the nuclear and mitochondrial level. In short not all
population relationships in the Central European late Neo-
lithic correspond to those proposed in the original Kurgan
model. Of course, there is also the possibility that GAC
sites other than those investigated in this study might show
different genomic features, but at this stage, this is only a
matter of speculation. Therefore, either the GAC people pre-
existed and were extraneous to the Pontic Steppe migration
process envisaged by Gimbutas, or the Pontic steppes
migrants’ contribution was represented by few individuals,
too few indeed to leave a trace in the genetic makeup of the
GAC population.
To get a deeper insight into the linguistic changes
prompted by Neolithic migration, one should have an idea of
the languages spoken in that period, which is currently out
of reach. Therefore, our work leaves open the possibility that
the GAC was in contact with Yamna, but in this case, the inter-
action was mostly at the cultural level, entailing very limited
migration, if any, contrary to the predictions of Gimbutas’
Kurgan hypothesis. One alternative is that that the Pontic
steppe migration did not profoundly affect mitochondrial vari-
ation, as implied by several studies showing an excess of
migrating males in expanding pastoral economies (see Saag
et al. unpublished data [40] and Kristiansen et al. [41], and
references therein). However, in this case, the substantial con-
tribution of males should at least result in some degree of
similarity between GAC and Yamnaya at the nuclear level,
which did not emerge in this study. In both cases, a trans-
mission of cultural traits from the Pontic steppes to the GAC,
and later further West, is conceivable and not ruled out by
our data; further archaeological work, including studies of
other GAC sites, may shed additional light on this.
Data accessibility. Samples information and GenBank accession numbersof the 14 mtDNA genome sequences reported in this study are sum-marized in electronic supplementary material, table S4. The nucleargenome data analysed in this study are reported as part of a parallelstudy that includes the GAC samples among many other groupsfrom eastern and southeastern Europe [25]. All the fastsimcoalinput files for the demographic models can be found in the Appendixof electronic supplementary material.
Authors’ contributions. Conceptualization: D.L., D.C. and G.B.; method-ology: F.T. and S.G.; software: F.T., S.G., A.Br. and R.R.S.; formalanalysis: F.T., S.V., S.G., A.Br. and R.R.S.; investigation: S.V., M.L.,A.M., E.P., F.A. and C.L.-F.; resources: A.Bu. and D.L.; writing—originaldraft: F.T., S.V., S.G. and G.B.; writing—review and editing: D.L., D.R.,D.C. and G.B.; funding acquisition: D.C. and G.B.
Competing interests. We declare we have no competing interests.
Funding. This work was supported by the European Research CouncilERC-2011-AdG_295733 grant (LanGeLin), by the grant ‘Fondo diAteneo per la Ricerca - FAR’ from University of Ferrara, by a grant ofthe Italian Ministry for Research and Universities (MIUR) PRIN2010–2011 to D.C. and G.B., and by a grant from FEDER and Ministryof Economy and Competitiveness (BFU2015-64699-P) of Spain to C.L.-F.
Acknowledgements. We are indebted to Gloria Gonzalez Fortes, InigoOlalde, Nadin Rohland and Federico Sanchez-Quinto for technicalhelp, and Iain Mathieson for his comments on a previous versionof this manuscript.
References
1. Mallory J, Adams D. 1997 Encyclopedia of Indo-European culture. London and Chicago: FitzroyDearborn Publishers.
2. Gimbutas M. 1979 The three waves ofthe Kurgan people into old Europe.Archives Suisses d’Anthropologie Generale 43,113 – 117.
3. Anthony DW. 2007 The horse, the wheel, andlanguage: how Bronze-Age riders from the Eurasian
steppes shaped the modern world. Princeton, NJ:Princeton University Press.
4. Menozzi P, Piazza A, Cavalli-Sforza L. 1978 Syntheticmaps of human gene frequencies in Europeans.Science 201, 786 – 792. (doi:10.1126/science.356262)
5. Renfrew C. 1992 Archaeology, genetics andlinguistic change. Man 27, 445 – 478. (doi:10.2307/2803924)
6. Renfrew C. 1987 Archaeology and language. Thepuzzle of Indo-European origins. London, UK:Jonathan Cape.
7. Strazny P. 2000 Dictionary of historical andcomparative linguistics, 1st edn. London, UK:Routledge.
8. Bouckaert R, Lemey P, Dunn M, Greenhill SJ,Alekseyenko AV, Drummond AJ, Gray RD, SuchardMA, Atkinson QD. 2012 Mapping the origins and
rspb.royalsocietypublishing.orgProc.R.Soc.B
284:20171540
9
on February 2, 2018http://rspb.royalsocietypublishing.org/Downloaded from
expansion of the Indo-European language family.Science 337, 957 – 960. (doi:10.1126/science.1219669)
9. Gray RD, Atkinson QD. 2003 Language-treedivergence times support the Anatolian theory ofIndo-European origin. Nature 426, 435 – 439.(doi:10.1038/nature02029)
10. Chang W, Cathcart C, Hall D, Garrett A. 2015Ancestry-constrained phylogenetic analysis supportsthe Indo-European steppe hypothesis. Language 91,194 – 244. (doi:10.1353/lan.2015.0005)
11. Barbujani G, Sokal RR, Oden NL. 1995 Indo-European origins: a computer-simulation test of fivehypotheses. Am. J. Phys. Anthropol. 96, 109 – 132.(doi:10.1002/ajpa.1330960202)
12. Chikhi L, Nichols RA, Barbujani G, Beaumont MA.2002 Y genetic data support the Neolithicdemic diffusion model. Proc. Natl Acad. Sci.USA 99, 11 008 – 11 013. (doi:10.1073/pnas.162158799)
13. Dupanloup I, Bertorelle G, Chikhi L, Barbujani G.2004 Estimating the impact of prehistoric admixtureon the genome of Europeans. Mol. Biol. Evol. 21,1361 – 1372. (doi:10.1093/molbev/msh135)
14. Sokal RR, Oden NL, Wilson C. 1991 Genetic evidencefor the spread of agriculture in Europe by demicdiffusion. Nature 351, 143 – 145. (doi:10.1038/351143a0)
15. Bramanti B et al. 2009 Genetic discontinuitybetween local hunter-gatherers and central Europe’sfirst farmers. Science 326, 137 – 140. (doi:10.1126/science.1176869)
16. Brandt G et al. 2013 Ancient DNA reveals key stagesin the formation of central European mitochondrialgenetic diversity. Science 342, 257 – 261. (doi:10.1126/science.1241844)
17. Haak W et al. 2010 Ancient DNA from Europeanearly Neolithic farmers reveals their near easternaffinities. PLoS Biol. 8, e1000536. (doi:10.1371/journal.pbio.1000536)
18. Haak W et al. 2015 Massive migration from thesteppe was a source for Indo-European languages inEurope. Nature 522, 207 – 211. (doi:10.1038/nature14317)
19. Lacan M, Keyser C, Ricaut FX, Brucato N, DuranthonF, Guilaine J, Crubezy E, Ludes B. 2011 Ancient DNAreveals male diffusion through the NeolithicMediterranean route. Proc. Natl Acad. Sci USA 108,9788 – 9791. (doi:10.1073/pnas.1100723108)
20. Mathieson I et al. 2015 Genome-wide patterns ofselection in 230 ancient Eurasians. Nature 528,499 – 503. (doi:10.1038/nature16152)
21. Allentoft ME et al. 2015 Population genomics ofBronze Age Eurasia. Nature 522, 167 – 172. (doi:10.1038/nature14507)
22. Gamba C et al. 2014 Genome flux and stasis in afive millennium transect of European prehistory.Nat. Commun. 5, 5257. (doi:10.1038/ncomms6257)
23. Gimbutas M. 1993 The Indo-Europeanization ofEurope: the intrusion of steppe pastoralists fromsouth Russia and the transformation of Old Europe.Word 44, 205 – 222. (doi:10.1080/00437956.1993.11435900)
24. Budnik A, Wrzesinski J. 2002 Kierzkowo - miedzyinhumacja a ciałopaleniem. In Wrzesinski J (edsPopioł i Kosc. Sobotka W.M.S.i.S.D.w.S., AKMEZdzisław Wisniewsk), pp. 125 – 145.
25. Mathieson I et al. 2017 The genomic history ofsoutheastern Europe. Preprint at bioRxiv. (doi:10.1101/135616)
26. Patterson N, Moorjani P, Luo Y, Mallick S,Rohland N, Zhan Y, Genschoreck T, Webster T, ReichD. 2012 Ancient admixture in human history.Genetics 192, 1065 – 1093. (doi:10.1534/genetics.112.145037)
27. Purcell S et al. 2007 PLINK: a tool set for whole-genome association and population-based linkageanalyses. Am. J. Hum. Genet. 81, 559 – 575. (doi:10.1086/519795)
28. Zheng X, Levine D, Shen J, Gogarten SM, Laurie C,Weir BS. 2012 A high-performance computingtoolset for relatedness and principal componentanalysis of SNP data. Bioinformatics 28, 3326 –3328. (doi:10.1093/bioinformatics/bts606)
29. Benazzo A, Panziera A, Bertorelle G. 2015 4P: fastcomputing of population genetics statistics fromlarge DNA polymorphism panels. Ecol. Evol. 5,172 – 175. (doi:10.1002/ece3.1261)
30. R Development Core Team. 2011 R: a language andenvironment for statistical computing. Vienna,Austria: the R Foundation for Statistical Computing.See http://wwwR-projectorg/.
31. Alexander DH, Novembre J, Lange K. 2009 Fastmodel-based estimation of ancestry in unrelatedindividuals. Genome. Res. 19, 1655 – 1664. (doi:10.1101/gr.094052.109)
32. Pickrell JK, Pritchard JK. 2012 Inference ofpopulation splits and mixtures from genome-wideallele frequency data. PLoS Genet. 8, e1002967.(doi:10.1371/journal.pgen.1002967)
33. Petkova D, Novembre J, Stephens M. 2016Visualizing spatial population structure withestimated effective migration surfaces. Nat. Genet.48, 94 – 100. (doi:10.1038/ng.3464)
34. Bandelt HJ, Forster P, Sykes BC, Richards MB. 1995Mitochondrial portraits of human populations usingmedian networks. Genetics 141, 743 – 753.
35. Lazaridis I et al. 2014 Ancient human genomessuggest three ancestral populations for present-dayEuropeans. Nature 513, 409 – 413. (doi:10.1038/nature13673)
36. Wright S. 1943 Isolation by distance. Genetics 28,114 – 138.
37. Sawyer S, Krause J, Guschanski K, Savolainen V,Paabo S. 2012 Temporal patterns of nucleotidemisincorporations and DNA fragmentation in ancientDNA. PLoS ONE 7, e34131. (doi:10.1371/journal.pone.0034131)
38. Modi A et al. 2017 Complete mitochondrialsequences from Mesolithic Sardinia. Sci. Rep. 7,42869. (doi:10.1038/srep42869)
39. Pudlo P, Marin JM, Estoup A, Cornuet JM, GautierM, Robert CP. 2016 Reliable ABC model choicevia random forests. Bioinformatics 32, 859 – 866.(doi:10.1093/bioinformatics/btv684)
40. Saag L et al. 2017 Extensive farming in Estoniastarted through a sex-biased migration from theSteppe. Preprint at bioRxiv. (doi:10.1101/112714)
41. Kristiansen K et al. 2017 Re-theorising mobilityand the formation of culture and language amongthe Corded Ware Culture in Europe. Antiquity 91,334 – 347. (doi:10.15184/aqy.2017.17)