Embed Size (px)
DESCRIPTION
Genome Analysis to Select Targets which Probe Fold and Function Space. How many protein superfamilies and families can we identify in the proteomes How many structures needed to cover a high fraction of prokaryotic, eukaryotic families - PowerPoint PPT Presentation
Citation preview

MCSG Site Visit, Argonne, January 30, 2003
Genome Analysis to Select Targets Genome Analysis to Select Targets which Probe Fold and Function Spacewhich Probe Fold and Function Space
How many protein superfamilies and families can we identify in the proteomes
How many structures needed to cover a high fraction of prokaryotic, eukaryotic families
Targeting Universal Recurrent Superfamilies (SCOP/CATH/Pfam) to optimise coverage of fold and function space
Russell Marsden, Alastair Grant, David Lee, Annabel ToddJanet Thornton, Andrzej Joachim
Midwest ConsortiumMidwest Consortium
Protein Families in Complete Protein Families in Complete Genomes with Genomes with Structural/Functional AnnotationsStructural/Functional Annotations
800,000 protein 800,000 protein sequences from 120 sequences from 120 completed genomescompleted genomes
14 eukaryotic genomes including human, mouse, 14 eukaryotic genomes including human, mouse, rat, rat, plant,fly, worm, fuguplant,fly, worm, fugu92 bacterial genomes92 bacterial genomes14 archael genomes14 archael genomes
Gene3DGene3D
Buchan, Thornton, OrengoBuchan, Thornton, Orengo,, Genome Research (2002)Genome Research (2002)

BLAST all the sequences from 120 completed BLAST all the sequences from 120 completed genomes against each and cluster into protein genomes against each and cluster into protein familiesfamilies
For each sequence identify CATH and Pfam For each sequence identify CATH and Pfam domainsdomains
Clustering Sequences into Protein Clustering Sequences into Protein Superfamilies of Known Domain Superfamilies of Known Domain
CompositionCompositionPFscape - Protein Family LandscapePFscape - Protein Family Landscape
SAM-T99 - sequence mapping of CATH & Pfam SAM-T99 - sequence mapping of CATH & Pfam Karplus et al., NAR, 2000
TRIBE-MCL - Markov Clustering TRIBE-MCL - Markov Clustering Enright & Ouzounis, Genome Research, 2002

Clustering ~800,000 genes from Clustering ~800,000 genes from 120 complete genomes120 complete genomes
PFscapePFscape
Gene Superfamily 1
Gene Superfamily 2
Gene Superfamily 3
Gene Superfamily 4
~50,000 gene superfamilies of 2 or more sequences, ~50,000 gene superfamilies of 2 or more sequences, 150,000 singletons150,000 singletons

Library of HMMs built for representative sequences Library of HMMs built for representative sequences from each CATH and Pfam domain superfamilyfrom each CATH and Pfam domain superfamily
Mapping CATH and Pfam Mapping CATH and Pfam Domains onto Genome Domains onto Genome
SequencesSequences
Scanagainst CATH &
PfamSAM-T99
HMM library
protein sequencesfrom genomes assign domains
toCATH and Pfam superfamilies

Performance of Sequence Mapping MethodPerformance of Sequence Mapping Method
1D-HMM 1D-HMM (SAM-T99)(SAM-T99)
Coverage vs Error rate (OHPS)
0.0%
10.0%
20.0%
30.0%
40.0%
50.0%
60.0%
70.0%
80.0%
90.0%
100.0%
0 0.01 0.02 0.03 0.04 0.05 0.06 0.07 0.08 0.09 0.1
Error rate (%)
Co
vera
ge
Sreps.v2.5_Sreps.v2.5
Sreps.v2.4_Sreps.v2.5
Percentage of remote, structurally validated CATH Percentage of remote, structurally validated CATH homologues (<35% sequence identity) identified by homologues (<35% sequence identity) identified by
SAM-T99SAM-T99
(%)
of
hom
olo
gues
fou
nd
(%)
of
hom
olo
gu
es
fou
nd
Error rate
Library of 1D-HMM models detects ~80% of remote Library of 1D-HMM models detects ~80% of remote homologueshomologues

Use HMMs to annotate Gene Superfamilies with CATH and Pfam
domains
Gene Superfamily 1
Gene Superfamily 3
Gene Superfamily 4Gene Superfamily 2
50,000 Gene Superfamilies50,000 Gene Superfamilies
CATHPfam
NewFam
Gene Superfamily 1
Gene Superfamily 3
Gene Superfamily 2
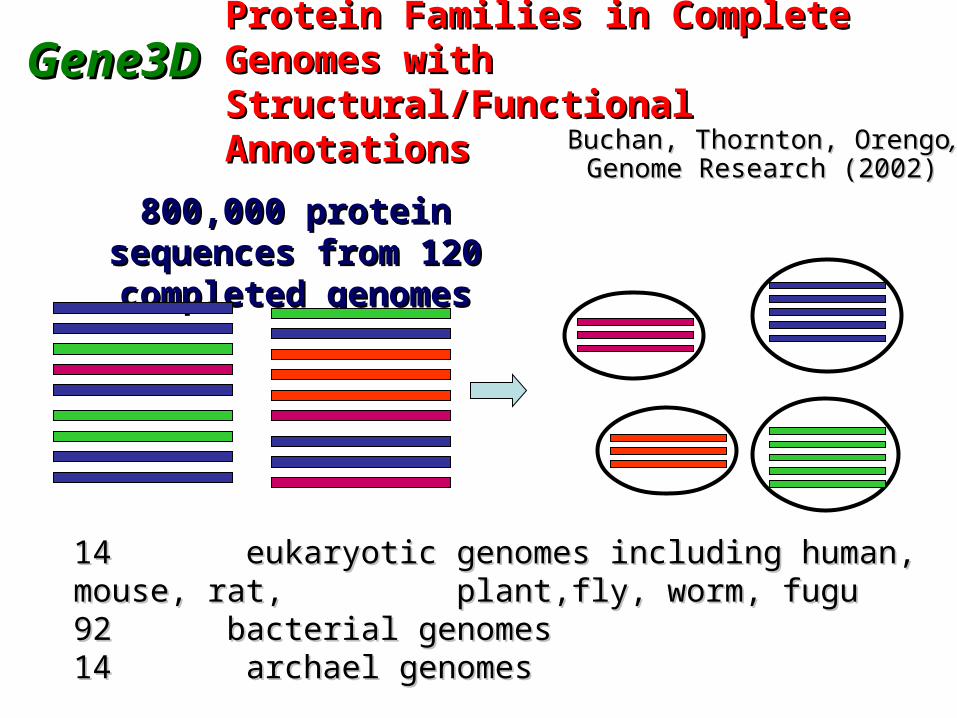
Merge superfamilies with the same domain combinations
Gene3D: 50,000 -> 36,000 SuperfamiliesGene3D: 50,000 -> 36,000 Superfamilies
Superfamily Families (35%ID)
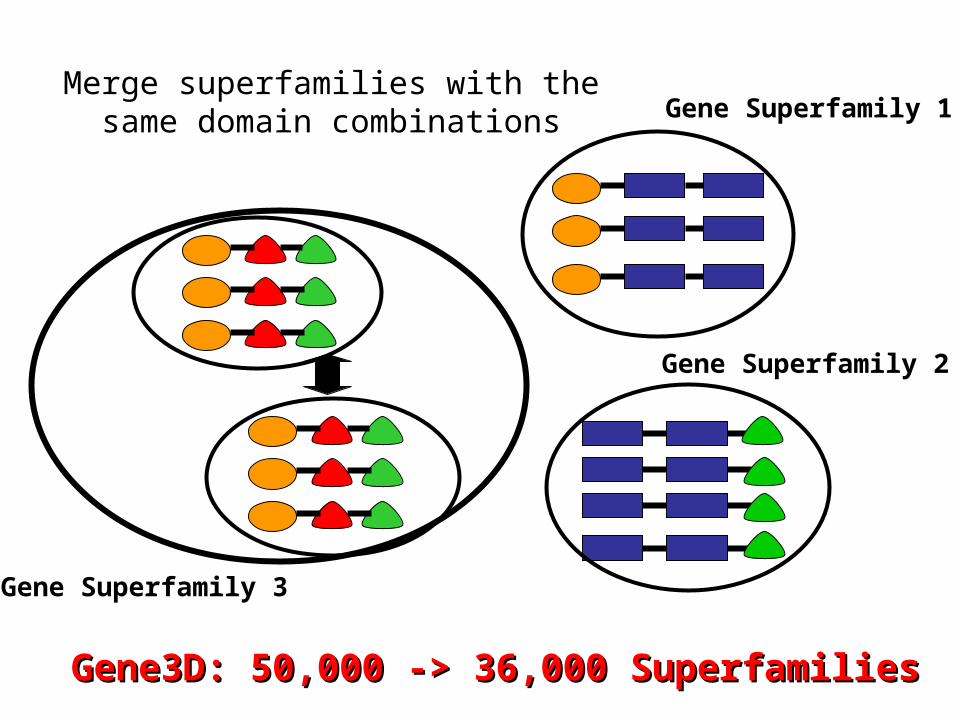
Superfamilies Further Classified into FamiliesSuperfamilies Further Classified into Families
Multi-linkage clusteringMulti-linkage clustering relatives in each sequence family have relatives in each sequence family have
35% or more sequence identity35% or more sequence identity
For good homology models one structure is needed for For good homology models one structure is needed for each family within a superfamilyeach family within a superfamily

Percent of Family with No Structure (close PDB match)
0%
10%
20%
30%
40%
50%
60%
70%
80%
90%
100%
Unassigned CATH Pfam
Family
% s
35
pdb no pdb
Perc
en
tag
e o
f Fam
ilie
sP
erc
en
tag
e o
f Fam
ilie
s
CATH (60,360)+Pfam(53,907)+Newfam(56,973) = CATH (60,360)+Pfam(53,907)+Newfam(56,973) = 171,240 171,240 Families Families
Number of domain superfamilies and families with no close Number of domain superfamilies and families with no close structural homologue structural homologue
CATH (1400)+Pfam(4100)+Newfam(46,384) = CATH (1400)+Pfam(4100)+Newfam(46,384) = 51,844 51,844 SuperfamiliesSuperfamilies
100
50
NewFam CATH Pfam
Percentage of Sequence Families with and without Percentage of Sequence Families with and without Close Structural Homologues (>35% identity)Close Structural Homologues (>35% identity)
No close PDB homologue

CATH
Number of Non-identical Relatives
Pfam
Fitted power-laws (with gradients)
CATH (-0.4)
Pfam (-1.0)Newfam (-1.9)
Newfam
Number of Non-identical Relatives
Number of Non-identical RelativesNumber of Non-identical Relatives
Nu
mb
er
of
Su
perf
am
ilie
s c
on
tain
ing
g
iven
nu
mb
er
of
Non
-id
en
tical re
lati
ves
as p
erc
en
tag
e o
f th
e t
ota
lPreferentially Target Largest Superfamilies Preferentially Target Largest Superfamilies
CATH, Pfam, Unassigned Hlevels vs s100
0
10
20
30
40
50
60
70
80
90
100
0 5000 10000 15000 20000 25000 30000 35000
#Hlevel targets
% T
ota
l s10
0
50
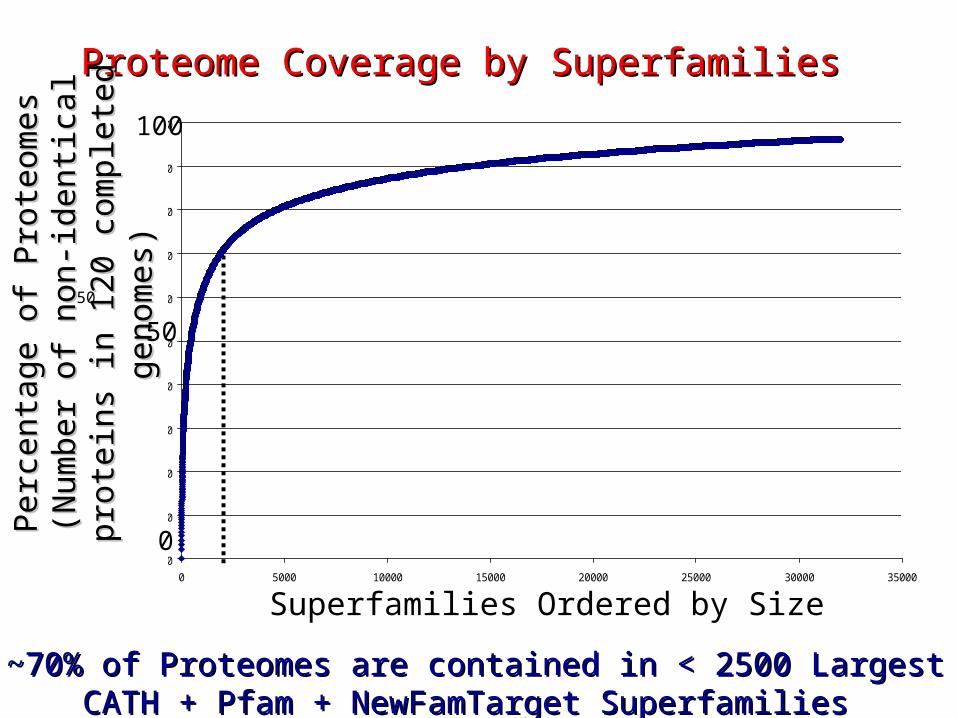
~70% of Proteomes are contained in < 2500 Largest CATH ~70% of Proteomes are contained in < 2500 Largest CATH + Pfam + NewFamTarget Superfamilies + Pfam + NewFamTarget Superfamilies
Proteome Coverage by Superfamilies Proteome Coverage by Superfamilies
Superfamilies Ordered by Size
Perc
en
tag
e o
f Pro
teom
es
Perc
en
tag
e o
f Pro
teom
es
(Nu
mb
er
of
non
-id
en
tica
l pro
tein
s in
(N
um
ber
of
non-i
den
tica
l pro
tein
s in
1
20
com
ple
ted g
enom
es)
120
com
ple
ted g
en
om
es)
0
50
100

Superfamilies Ordered by Size
Perc
en
tag
e o
f Pro
teom
es
Perc
en
tag
e o
f Pro
teom
es
(120
com
ple
ted
gen
om
es)
(120
com
ple
ted
gen
om
es)
50
Proteome Coverage by Superfamilies Proteome Coverage by Superfamilies
CATH (superfamilies of known fold)
Pfam
NewFam
CATH, Pfam, Unassigned Hlevel vs s100 Comparison
0
5
10
15
20
25
30
35
40
45
0 1000 2000 3000 4000 5000 6000 7000 8000 9000 10000
#Hlevel targets
% T
ota
l s1
00
cath pfam unassigned
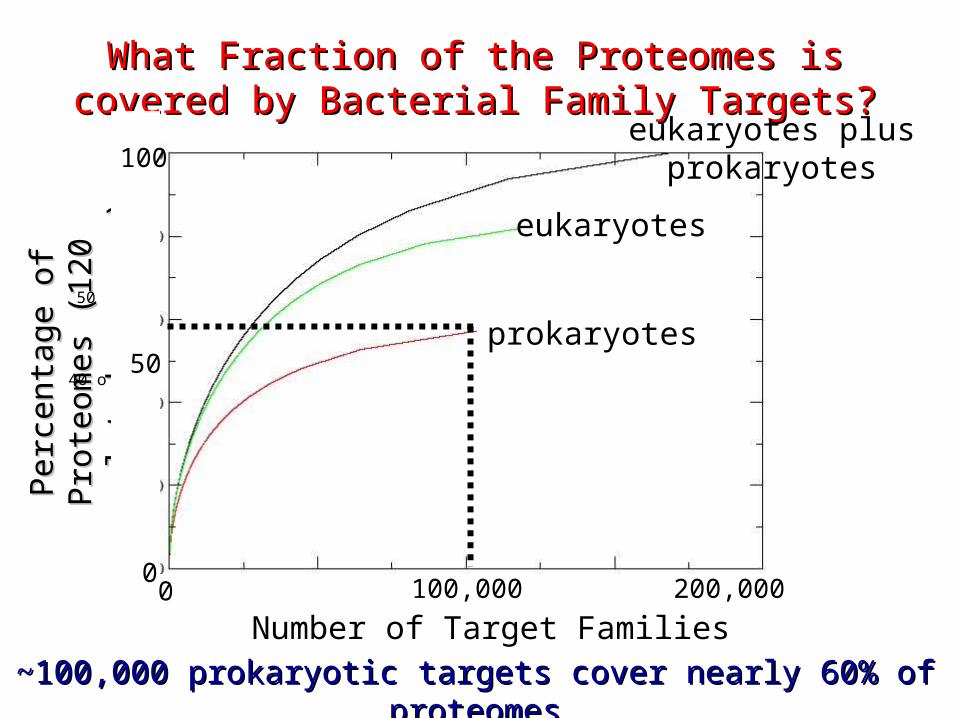
What Fraction of the Proteomes is covered by What Fraction of the Proteomes is covered by Bacterial Family Targets?Bacterial Family Targets?
Number of Target Families
Perc
en
tag
e o
f Pro
teom
es
Perc
en
tag
e o
f Pro
teom
es
(12
0 c
om
ple
ted
gen
om
es)
(120
com
ple
ted
gen
om
es)
40 o
50
~100,000 prokaryotic targets cover nearly 60% of ~100,000 prokaryotic targets cover nearly 60% of proteomesproteomes
100,000 200,00000
50
100
prokaryotes
eukaryotes
eukaryotes plusprokaryotes
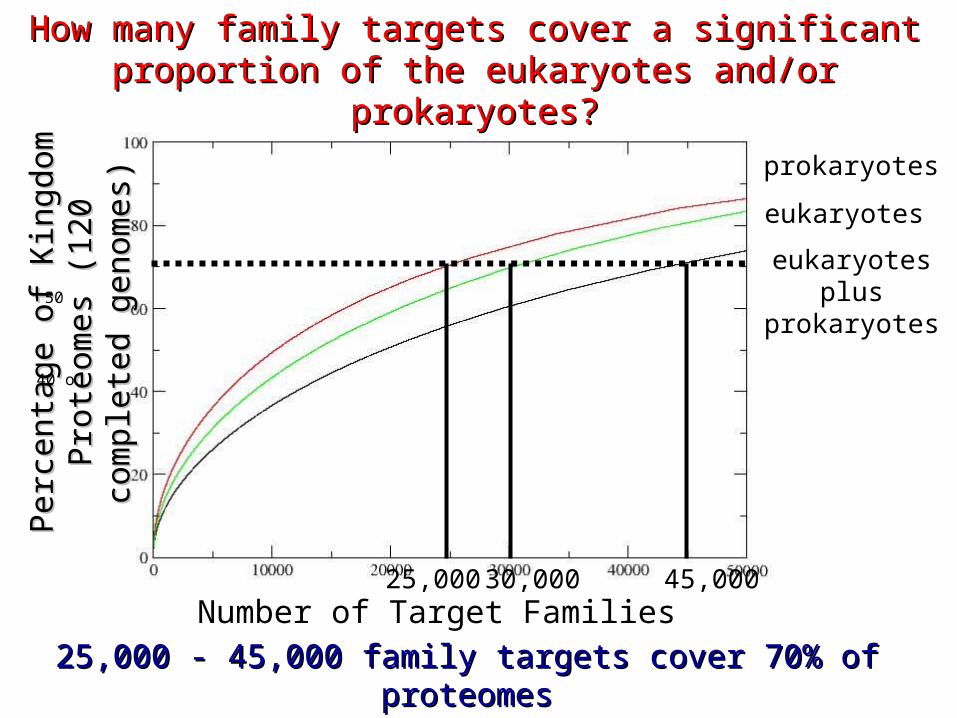
How many family targets cover a significant How many family targets cover a significant proportion of the eukaryotes and/or prokaryotes?proportion of the eukaryotes and/or prokaryotes?
Number of Target Families
Perc
en
tag
e o
f K
ing
dom
Perc
en
tag
e o
f K
ing
dom
Pro
teom
es
(12
0 c
om
ple
ted
Pro
teom
es
(12
0 c
om
ple
ted
g
en
om
es)
gen
om
es)
40 o
50
25,000 - 45,000 family targets cover 70% of proteomes25,000 - 45,000 family targets cover 70% of proteomes(< 2500 largest superfamily targets)(< 2500 largest superfamily targets)
prokaryotes
eukaryotes
eukaryotes plusprokaryotes
25,000 45,000 30,000

MCSG Site Visit, Argonne, January 30, 2003
Target Selection StrategyTarget Selection Strategy
the largest < 2500 superfamily targets give 70% of proteomes
this corresponds to 25,000 - 45,000 family targets
accurate homology models are not needed for all families
target families of biological interest or containing human homologues with disease association
targets families from functionally diverse superfamilies to understand how changes
in the structure can modify function
For example, Universal, Highly Recurrent Superfamilies are an interesting biological subset with diverse functions

0%
20%
40%
60%
80%
100%
Ap
e
Aae
Afu
Bsu
Bb
u
Cel
Cje
Cp
n
Ctr
Ec
o
Hin
Hp
y
Mth
Mja
Mtu
Mg
e
Mp
n
Nm
e
Pa
b
Rp
r
Sc
e
Ss
p
Tm
a
Uu
r
Vc
h
Xfa
Organism
Per
cen
t o
f A
ssig
ned
Do
ma
ins
Unique to Genome
Present in One KingdomPresent in Two Kingdoms
Present in Three Kingdoms
Universal CATH Domain SuperfamiliesUniversal CATH Domain Superfamilies
30 representative eukaryotic and prokaryotic organisms
Pro
port
ion
of
CA
TH
P
rop
ort
ion
of
CA
TH
d
om
ain
an
nota
tion
sd
om
ain
an
nota
tion
s
0
50
100
~60-70% of CATH domain annotations within each organism are from < 200 CATH universal
superfamilies common to all kingdoms of life some of which are very extensively duplicated

Domain Recurrences in the GenomesDomain Recurrences in the Genomes
0
10
20
30
40
50
60
70
80
90
1001 3 5 7 9 11 13 15 49 59 67 79 96 102
219
Occurrences
No
. Of
Fa
mili
es
E.coli
M.jannaschii
S.cerevisiae
nu
mb
er
of
su
perf
am
ilie
sn
um
ber
of
su
perf
am
ilie
s
occurrencesoccurrences
730730 570570
Highly Recurrent, Extensively Duplicated
Superfamilies
0
500
1000
1500
2000
S R Y VZ WOU
T N M D A JL B PQK I HEFG
C
Poorlycharac.
Cellular processesand signalling
Information stor.
& proce.Metabolism
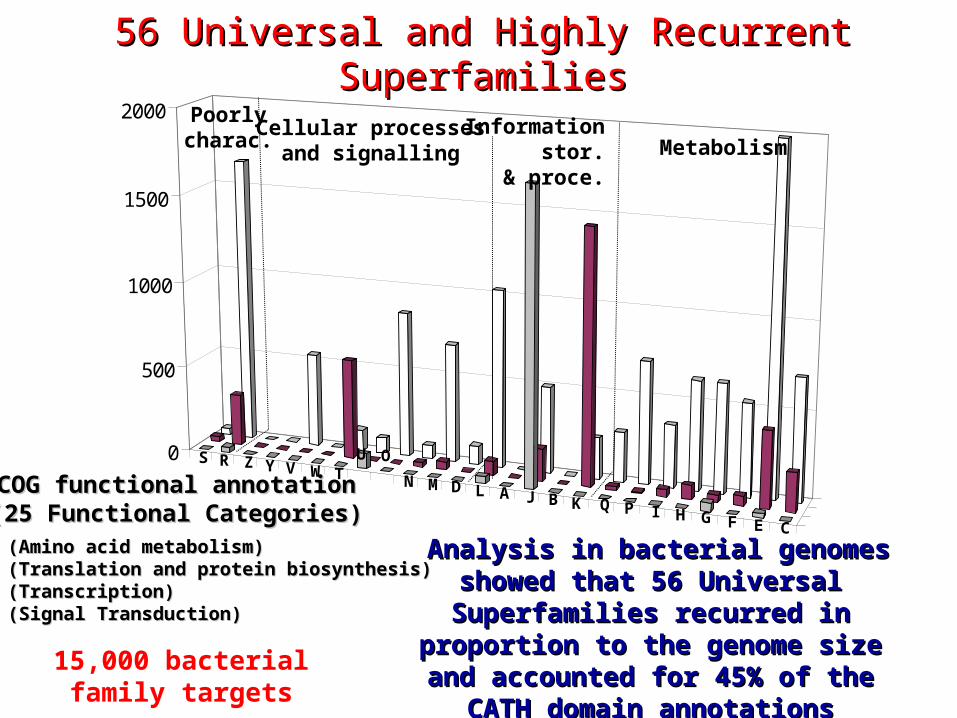
Analysis in bacterial genomes Analysis in bacterial genomes showed that 56 Universal showed that 56 Universal Superfamilies recurred in Superfamilies recurred in
proportion to the genome size proportion to the genome size and accounted for 45% of the and accounted for 45% of the
CATH domain annotationsCATH domain annotations
COG functional annotationCOG functional annotation(25 Functional Categories)(25 Functional Categories)E (Amino acid metabolism)E (Amino acid metabolism)J (Translation and protein biosynthesis)J (Translation and protein biosynthesis)K (Transcription)K (Transcription)T (Signal Transduction)T (Signal Transduction)
56 Universal and Highly Recurrent 56 Universal and Highly Recurrent SuperfamiliesSuperfamilies
15,000 bacterial family targets

0
20
40
60
80
100
120
0 10 20 30 40 50 60 70 80 90 100 110 120
protein no (1-130)
num
ber
of h
om
olo
gu
es a
bo
ve
seq
uen
ce id
en
tity
thre
shol
d
35%
60%
Relative with most neighbours for which homology model can be built or function assigned
For >95% confidence when inheriting functional For >95% confidence when inheriting functional properties, homologues should have at least 60% properties, homologues should have at least 60%
identity (Todd, Valencia, Rost) identity (Todd, Valencia, Rost)
In Functionally Diverse Superfamilies Select In Functionally Diverse Superfamilies Select More TargetsMore Targets

functional clusters identified by sequence conservationfunctional clusters identified by sequence conservation
annotations (GO, Kegg, Pfam, EC, COGS, SWISS-PROT)annotations (GO, Kegg, Pfam, EC, COGS, SWISS-PROT)
stored in Gene3Dstored in Gene3D
functional clustersfunctional clustersS60_1S60_1
SuperfamilySuperfamily
S60_2S60_2
S60_3S60_3
S60_4S60_4
S60_5S60_5
Representative Structures for Superfamilies Representative Structures for Superfamilies will help identify Functional Familieswill help identify Functional Families

MCSG Site Visit, Argonne, January 30, 2003
Target Selection StrategyTarget Selection Strategy
Targeting the 2500 largest superfamilies will cover a significant proportion (70%) of the
proteomes
For good homology models between 25,000 - 45,000 family targets are needed
Preferentially select targets from medically important and/or structurally and functionally diverse superfamilies
For example, targeting Universal and Recurrent superfamilies which exhibit significant
structural and functional divergence will help to improve function prediction methods


![Probe IDSymbolDescription and accession Fold ChangeP value A_23_P252306ID1 inhibitor of DNA binding 1, dominant negative helix-loop- helix protein [NM_002165]4.072.76E-03](https://img.pdfslide.us/doc/110x75/56649f585503460f94c7e4aa/probe-idsymboldescription-and-accession-fold-changep-value-a23p252306id1.jpg)