Embed Size (px)
Citation preview

Genomatix Pathway SystemTutorial
© 2013 Genomatix Software GmbHBayerstr. 85a
80335 MunichGermany
Faster results,better answers,more biology.

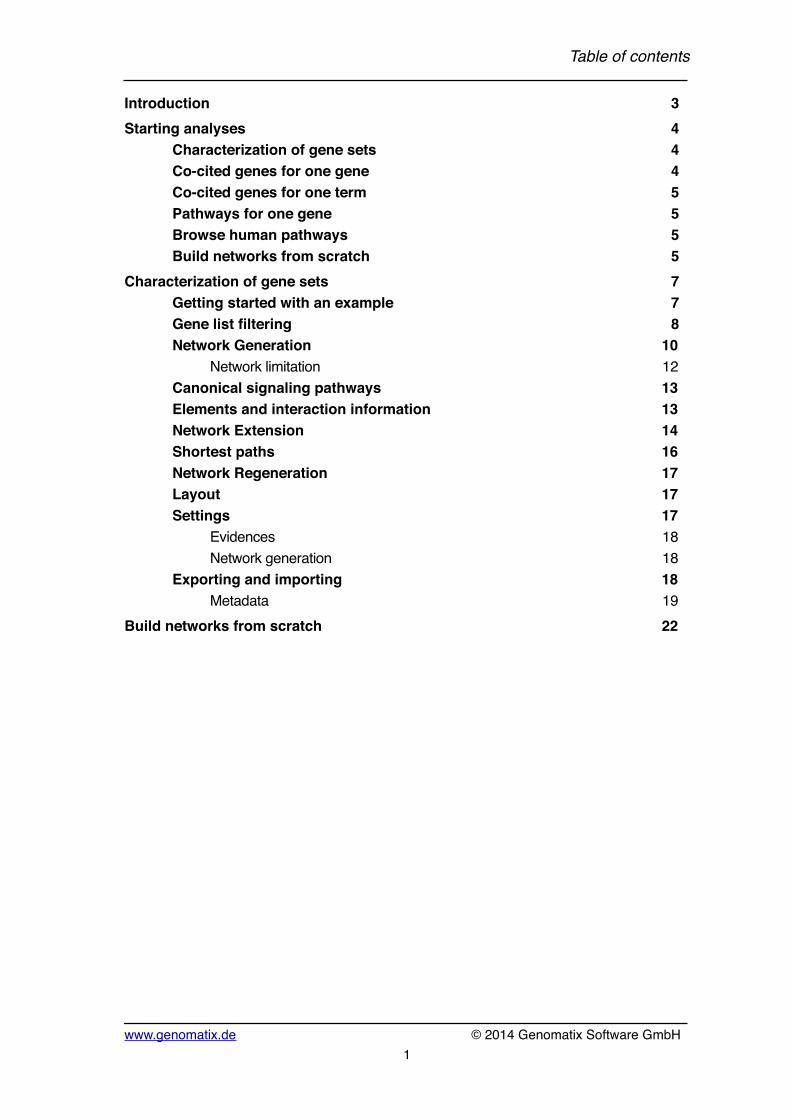
Introduction! 3Starting analyses! 4
Characterization of gene sets! 4Co-cited genes for one gene ! 4Co-cited genes for one term! 5Pathways for one gene ! 5Browse human pathways! 5Build networks from scratch! 5
Characterization of gene sets! 7Getting started with an example! 7Gene list filtering! 8Network Generation! 10
Network limitation! 12Canonical signaling pathways! 13Elements and interaction information! 13Network Extension! 14Shortest paths! 16Network Regeneration! 17Layout ! 17Settings! 17
Evidences! 18Network generation! 18
Exporting and importing! 18Metadata! 19
Build networks from scratch! 22
Table of contents!!
www.genomatix.de! © 2014 Genomatix Software GmbH1

Table of contents
© 2014 Genomatix Software GmbH ! www.genomatix.de2

The Genomatix Pathway System (GePS)
IntroductionThe Genomatix Pathway System (GePS) uses information extracted from public and proprietary databases to display canonical pathways or create networks from sets of genes and extend them with information literature.More than 400 human pathways can be displayed based on data from the NCI-Nature Pathway Interaction Database, BioCarta and various other sources (please see Data Sources below for details). They are supplemented with proprietary database content from NetPro and Genomatix in-house curated annotation like:• interaction annotation• gene information• sequence derived information• transcription factor information• small molecule informationGePS allows to create networks from an arbitrary input gene list where connections are based on literature i.e. co-citations. This gene list can be filtered by overrepresentation results, literature mining results and expression data. The resulting gene sets can be combined to new gene sets and serve as filters.Furthermore networks can be created from scratch. Genes, complexes and interactions can be simply created by clicking and dragging with the mouse.This guide will introduce the main features of the software for a quick and efficient start with the Genomatix Pathway System. We hope it will help you get the most from our software. You can also find information in the online help.If any questions remain or if you run into any problems you are always welcome to con-tact us at:[email protected] (via email)+49 89 599766 0 (via phone)+49 89 599766 55 (via fax)
Tutorial
www.genomatix.de! © 2014 Genomatix Software GmbH3
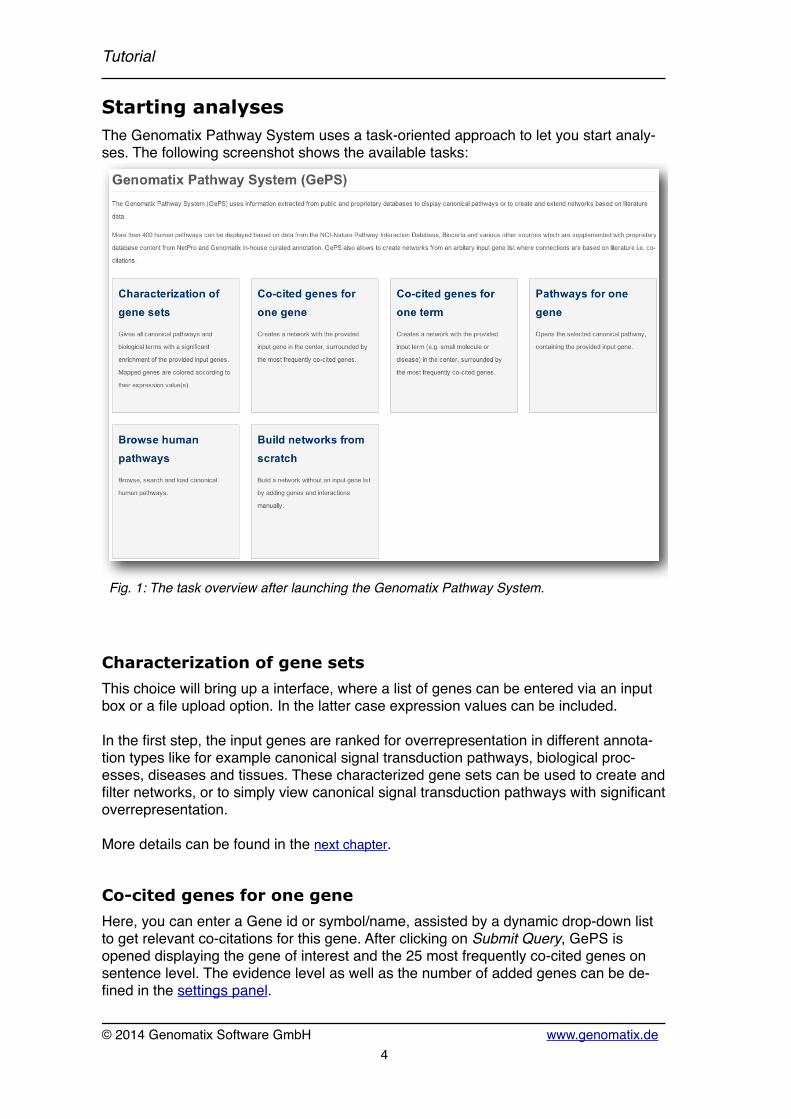
Starting analyses The Genomatix Pathway System uses a task-oriented approach to let you start analy-ses. The following screenshot shows the available tasks:
Fig. 1: The task overview after launching the Genomatix Pathway System.
Characterization of gene setsThis choice will bring up a interface, where a list of genes can be entered via an input box or a file upload option. In the latter case expression values can be included.
In the first step, the input genes are ranked for overrepresentation in different annota-tion types like for example canonical signal transduction pathways, biological proc-esses, diseases and tissues. These characterized gene sets can be used to create and filter networks, or to simply view canonical signal transduction pathways with significant overrepresentation.
More details can be found in the next chapter.
Co-cited genes for one geneHere, you can enter a Gene id or symbol/name, assisted by a dynamic drop-down list to get relevant co-citations for this gene. After clicking on Submit Query, GePS is opened displaying the gene of interest and the 25 most frequently co-cited genes on sentence level. The evidence level as well as the number of added genes can be de-fined in the settings panel.
Tutorial
© 2014 Genomatix Software GmbH! www.genomatix.de4
You may be interested to read the chapter about the task Characterization of gene sets as many described features are also available for this task.
Co-cited genes for one termHere, the user can enter a term e.g. a small molecule or disease name, assisted by a dynamic drop-down list to get relevant co-citations for this gene. After clicking on Sub-mit Query, GePS is opened displaying the gene of interest and the 25 most frequently co-cited genes on sentence level. The evidence level as well as the number of added genes can be defined in the settings panel.
You may be interested to read the chapter about the task Characterization of gene sets as many described features are also available for this task.
Pathways for one geneHere, you can enter a Gene id or symbol/name, assisted by a dynamic drop-down list to get all canonical pathways where the gene is involved.
If the gene is part of more than one pathway, all pathways are shown in a list. After se-lecting the pathway of interest and clicking on “Submit Query”, GePS is opened dis-playing the selected pathway. The input gene is colored yellow by default.
If a gene is entered from an organism which is not Homo sapiens, it is mapped via orthology to its corresponding gene in Homo sapiens, if possible, using the Compara-tive Genomics data from ElDorado.
You may be interested to read the chapter about the task Characterization of gene sets as many described features are also available for this task.
Browse human pathwaysGePS is opened displaying a list of all available canonical pathways ordered by path-way name and source. A search field assists in finding the pathway of interest. After selecting the pathway of interest, it is displayed graphically.
You may be interested to read the chapter about the task Characterization of gene sets as many features are also available for this task.
Build networks from scratchHere, the user only needs to select an organism. Then GePS is opened displaying a blank canvas, in which user-defined network can be created from scratch. This is done by adding genes and interactions manually or extending the created networks by the most frequently co-cited genes.
More details can be found in the last chapter.
You may be interested to read the chapter about the task Characterization of gene sets as many described features are also available for this task.
Tutorial
www.genomatix.de! © 2014 Genomatix Software GmbH5

Tutorial
© 2014 Genomatix Software GmbH! www.genomatix.de6
Characterization of gene setsTo characterize gene sets, GePS allows input of gene lists optionally together with ex-pression values for various states (e.g. different time points or cell types).
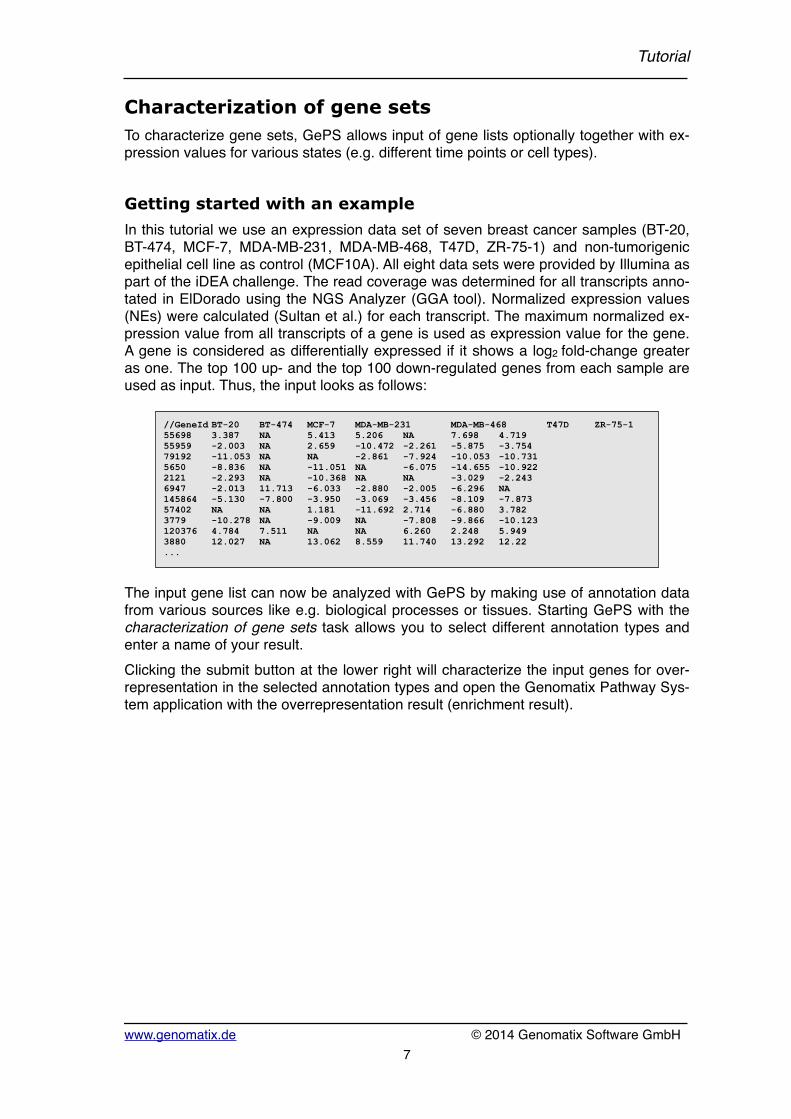
Getting started with an exampleIn this tutorial we use an expression data set of seven breast cancer samples (BT-20, BT-474, MCF-7, MDA-MB-231, MDA-MB-468, T47D, ZR-75-1) and non-tumorigenic epithelial cell line as control (MCF10A). All eight data sets were provided by Illumina as part of the iDEA challenge. The read coverage was determined for all transcripts anno-tated in ElDorado using the NGS Analyzer (GGA tool). Normalized expression values (NEs) were calculated (Sultan et al.) for each transcript. The maximum normalized ex-pression value from all transcripts of a gene is used as expression value for the gene. A gene is considered as differentially expressed if it shows a log2 fold-change greater as one. The top 100 up- and the top 100 down-regulated genes from each sample are used as input. Thus, the input looks as follows:
The input gene list can now be analyzed with GePS by making use of annotation data from various sources like e.g. biological processes or tissues. Starting GePS with the characterization of gene sets task allows you to select different annotation types and enter a name of your result.Clicking the submit button at the lower right will characterize the input genes for over-representation in the selected annotation types and open the Genomatix Pathway Sys-tem application with the overrepresentation result (enrichment result).
//GeneId BT-20 BT-474 MCF-7 MDA-MB-231 MDA-MB-468 T47D ZR-75-155698 3.387 NA 5.413 5.206 NA 7.698 4.71955959 -2.003 NA 2.659 -10.472 -2.261 -5.875 -3.75479192 -11.053 NA NA -2.861 -7.924 -10.053 -10.7315650 -8.836 NA -11.051 NA -6.075 -14.655 -10.9222121 -2.293 NA -10.368 NA NA -3.029 -2.2436947 -2.013 11.713 -6.033 -2.880 -2.005 -6.296 NA145864 -5.130 -7.800 -3.950 -3.069 -3.456 -8.109 -7.87357402 NA NA 1.181 -11.692 2.714 -6.880 3.7823779 -10.278 NA -9.009 NA -7.808 -9.866 -10.123120376 4.784 7.511 NA NA 6.260 2.248 5.9493880 12.027 NA 13.062 8.559 11.740 13.292 12.22...
Tutorial
www.genomatix.de! © 2014 Genomatix Software GmbH7
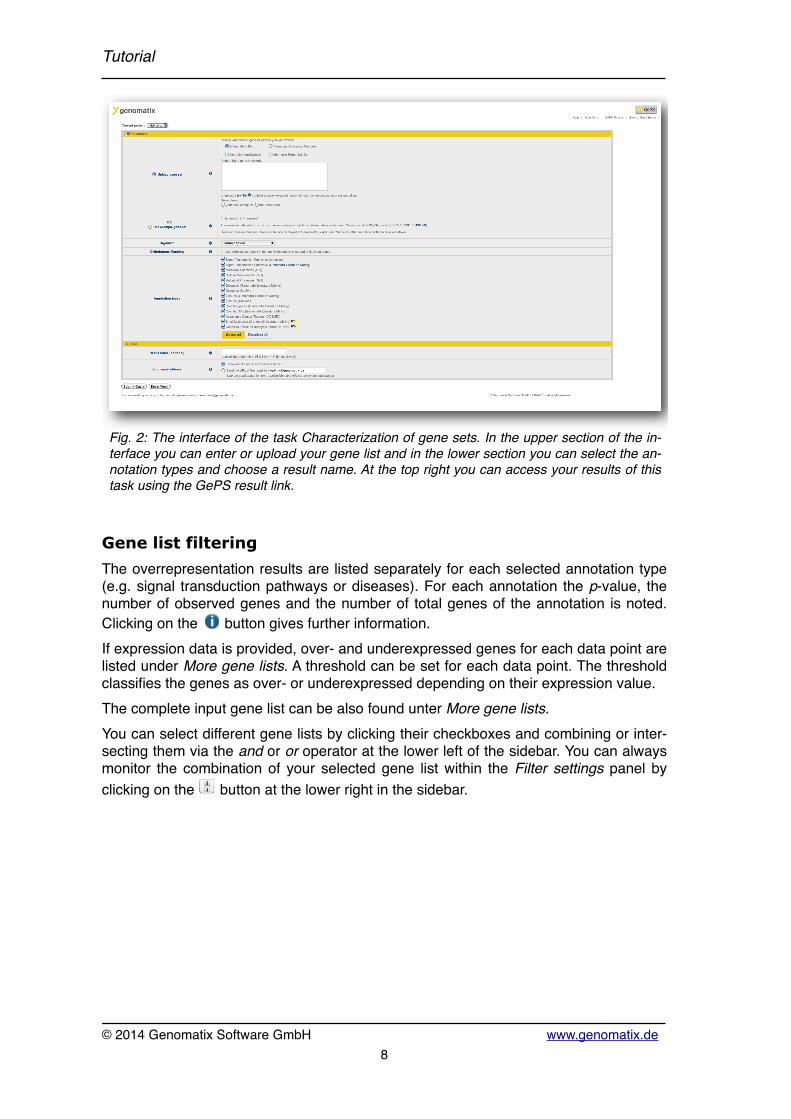
Fig. 2: The interface of the task Characterization of gene sets. In the upper section of the in-terface you can enter or upload your gene list and in the lower section you can select the an-notation types and choose a result name. At the top right you can access your results of this task using the GePS result link.
Gene list filteringThe overrepresentation results are listed separately for each selected annotation type (e.g. signal transduction pathways or diseases). For each annotation the p-value, the number of observed genes and the number of total genes of the annotation is noted. Clicking on the button gives further information. If expression data is provided, over- and underexpressed genes for each data point are listed under More gene lists. A threshold can be set for each data point. The threshold classifies the genes as over- or underexpressed depending on their expression value.The complete input gene list can be also found unter More gene lists. You can select different gene lists by clicking their checkboxes and combining or inter-secting them via the and or or operator at the lower left of the sidebar. You can always monitor the combination of your selected gene list within the Filter settings panel by clicking on the button at the lower right in the sidebar.
Tutorial
© 2014 Genomatix Software GmbH! www.genomatix.de8
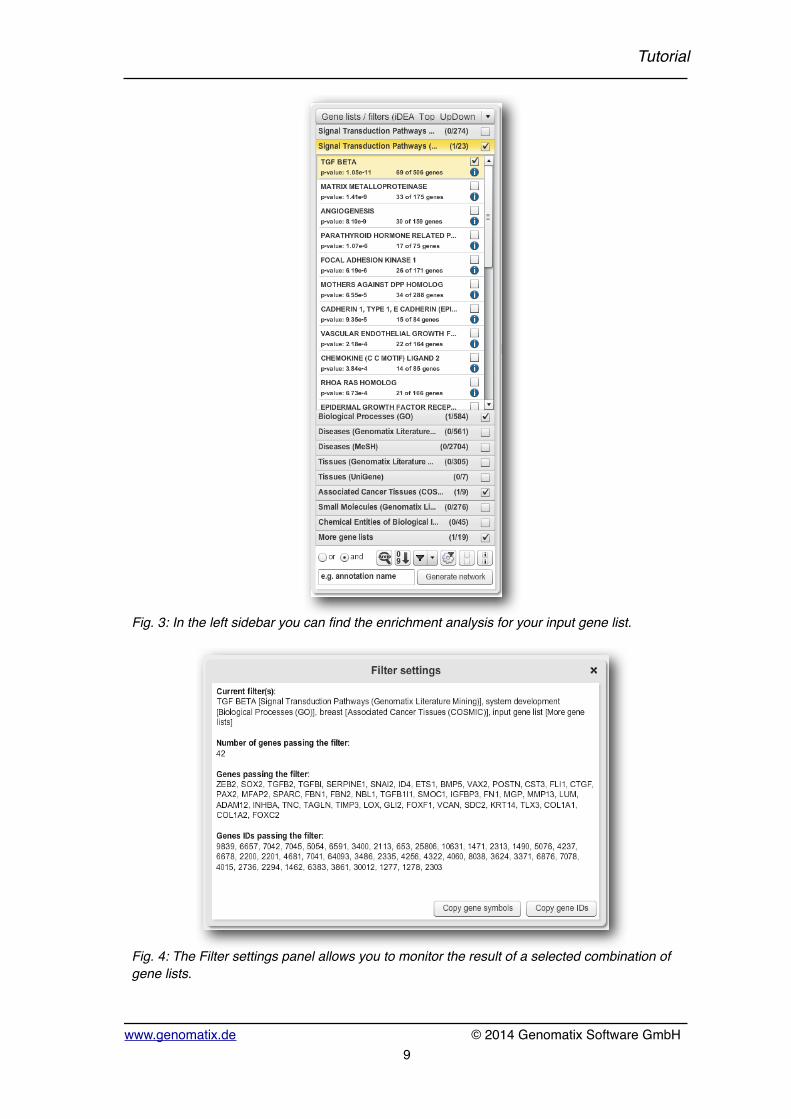
Fig. 3: In the left sidebar you can find the enrichment analysis for your input gene list.
Fig. 4: The Filter settings panel allows you to monitor the result of a selected combination of gene lists.
Tutorial
www.genomatix.de! © 2014 Genomatix Software GmbH9
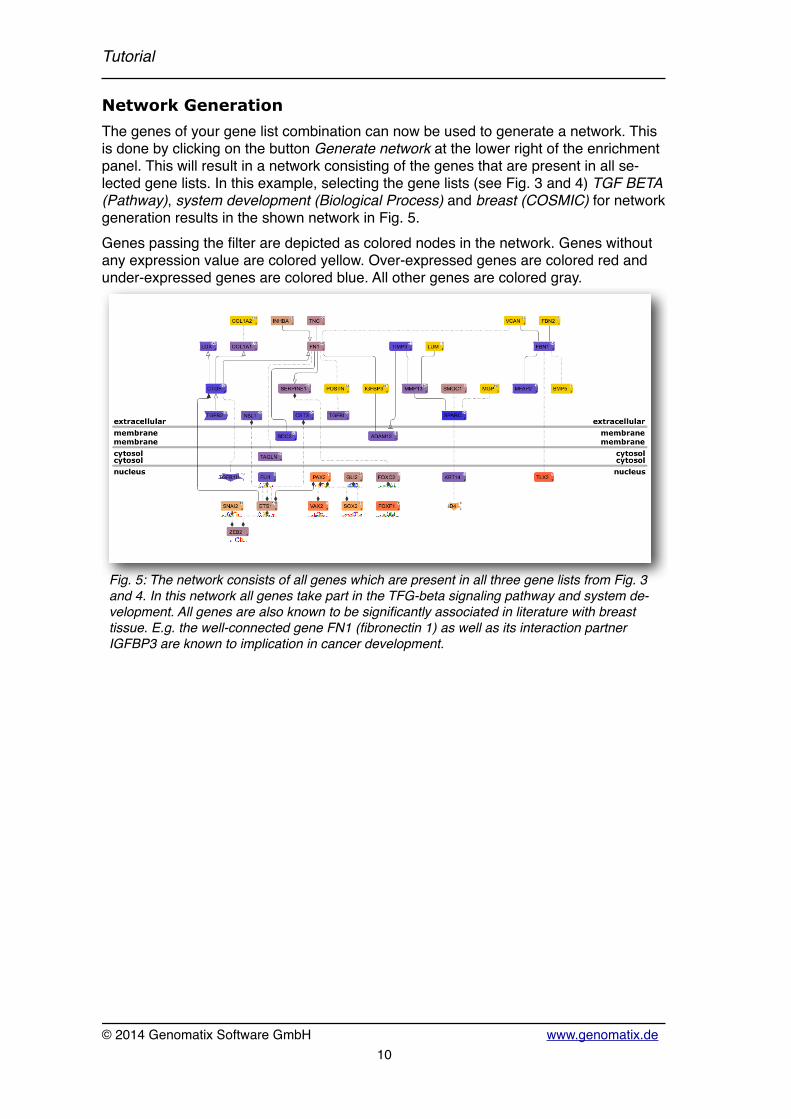
Network GenerationThe genes of your gene list combination can now be used to generate a network. This is done by clicking on the button Generate network at the lower right of the enrichment panel. This will result in a network consisting of the genes that are present in all se-lected gene lists. In this example, selecting the gene lists (see Fig. 3 and 4) TGF BETA (Pathway), system development (Biological Process) and breast (COSMIC) for network generation results in the shown network in Fig. 5.Genes passing the filter are depicted as colored nodes in the network. Genes without any expression value are colored yellow. Over-expressed genes are colored red and under-expressed genes are colored blue. All other genes are colored gray.
Fig. 5: The network consists of all genes which are present in all three gene lists from Fig. 3 and 4. In this network all genes take part in the TFG-beta signaling pathway and system de-velopment. All genes are also known to be significantly associated in literature with breast tissue. E.g. the well-connected gene FN1 (fibronectin 1) as well as its interaction partner IGFBP3 are known to implication in cancer development.
Tutorial
© 2014 Genomatix Software GmbH! www.genomatix.de10
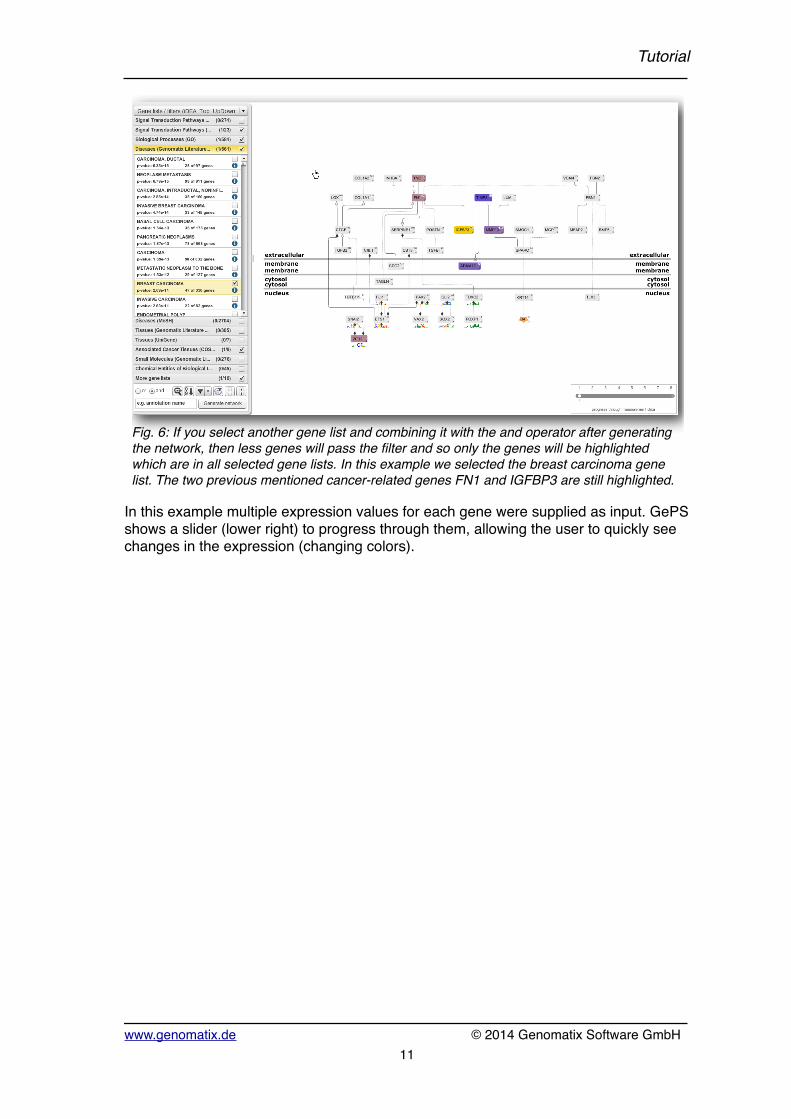
Fig. 6: If you select another gene list and combining it with the and operator after generating the network, then less genes will pass the filter and so only the genes will be highlighted which are in all selected gene lists. In this example we selected the breast carcinoma gene list. The two previous mentioned cancer-related genes FN1 and IGFBP3 are still highlighted.
In this example multiple expression values for each gene were supplied as input. GePS shows a slider (lower right) to progress through them, allowing the user to quickly see changes in the expression (changing colors).
Tutorial
www.genomatix.de! © 2014 Genomatix Software GmbH11
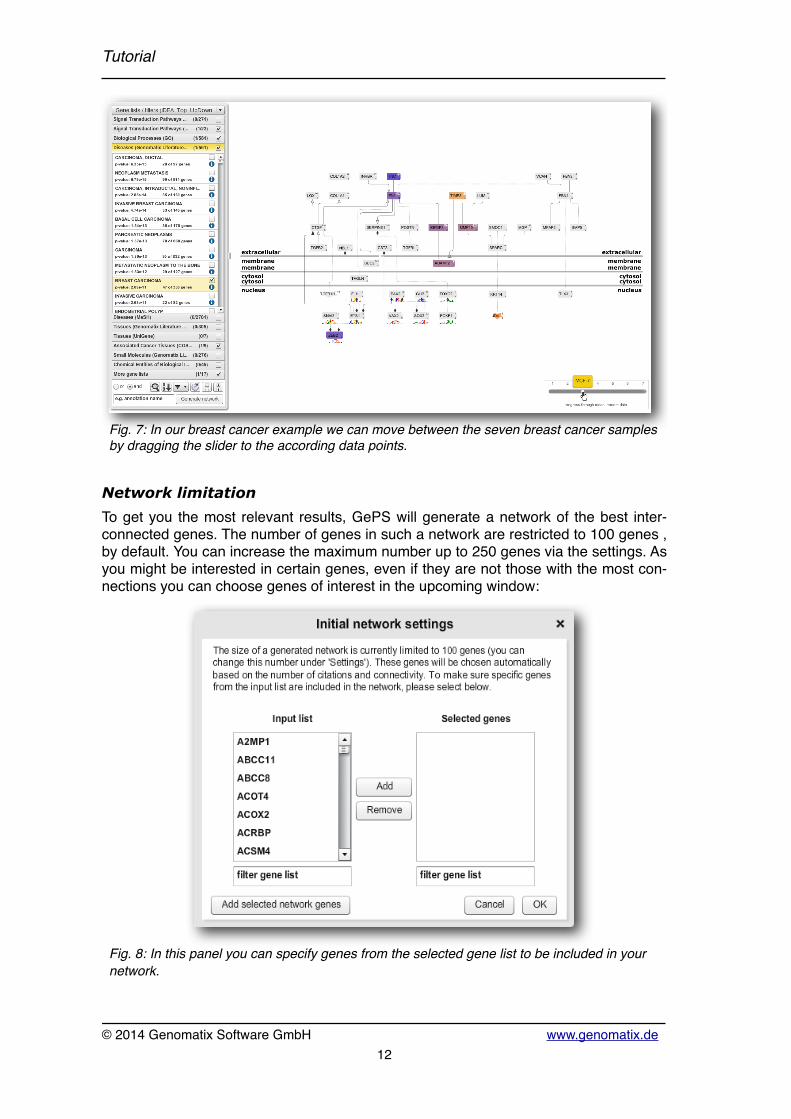
Fig. 7: In our breast cancer example we can move between the seven breast cancer samples by dragging the slider to the according data points.
Network limitationTo get you the most relevant results, GePS will generate a network of the best inter-connected genes. The number of genes in such a network are restricted to 100 genes , by default. You can increase the maximum number up to 250 genes via the settings. As you might be interested in certain genes, even if they are not those with the most con-nections you can choose genes of interest in the upcoming window:
Fig. 8: In this panel you can specify genes from the selected gene list to be included in your network.
Tutorial
© 2014 Genomatix Software GmbH! www.genomatix.de12
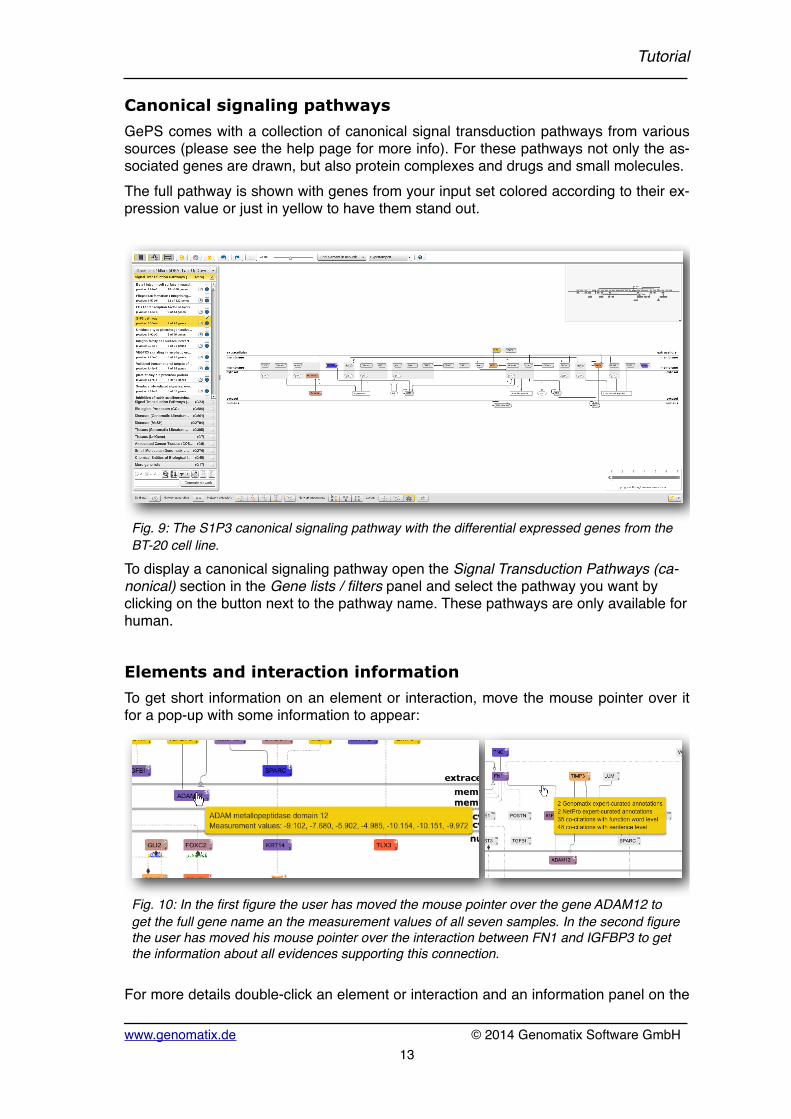
Canonical signaling pathwaysGePS comes with a collection of canonical signal transduction pathways from various sources (please see the help page for more info). For these pathways not only the as-sociated genes are drawn, but also protein complexes and drugs and small molecules.The full pathway is shown with genes from your input set colored according to their ex-pression value or just in yellow to have them stand out.
Fig. 9: The S1P3 canonical signaling pathway with the differential expressed genes from the BT-20 cell line.
To display a canonical signaling pathway open the Signal Transduction Pathways (ca-nonical) section in the Gene lists / filters panel and select the pathway you want by clicking on the button next to the pathway name. These pathways are only available for human.
Elements and interaction informationTo get short information on an element or interaction, move the mouse pointer over it for a pop-up with some information to appear:
Fig. 10: In the first figure the user has moved the mouse pointer over the gene ADAM12 to get the full gene name an the measurement values of all seven samples. In the second figure the user has moved his mouse pointer over the interaction between FN1 and IGFBP3 to get the information about all evidences supporting this connection.
For more details double-click an element or interaction and an information panel on the
Tutorial
www.genomatix.de! © 2014 Genomatix Software GmbH13
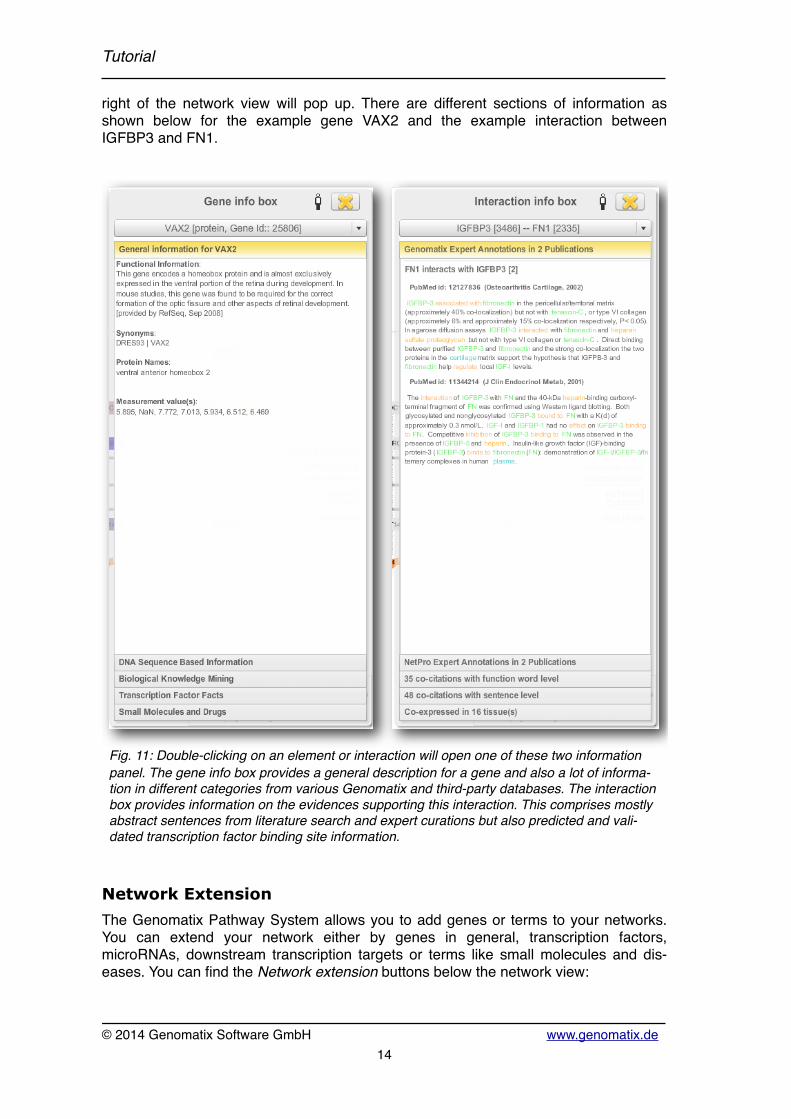
right of the network view will pop up. There are different sections of information as shown below for the example gene VAX2 and the example interaction between IGFBP3 and FN1.
Fig. 11: Double-clicking on an element or interaction will open one of these two information panel. The gene info box provides a general description for a gene and also a lot of informa-tion in different categories from various Genomatix and third-party databases. The interaction box provides information on the evidences supporting this interaction. This comprises mostly abstract sentences from literature search and expert curations but also predicted and vali-dated transcription factor binding site information.
Network ExtensionThe Genomatix Pathway System allows you to add genes or terms to your networks. You can extend your network either by genes in general, transcription factors, microRNAs, downstream transcription targets or terms like small molecules and dis-eases. You can find the Network extension buttons below the network view:
Tutorial
© 2014 Genomatix Software GmbH! www.genomatix.de14
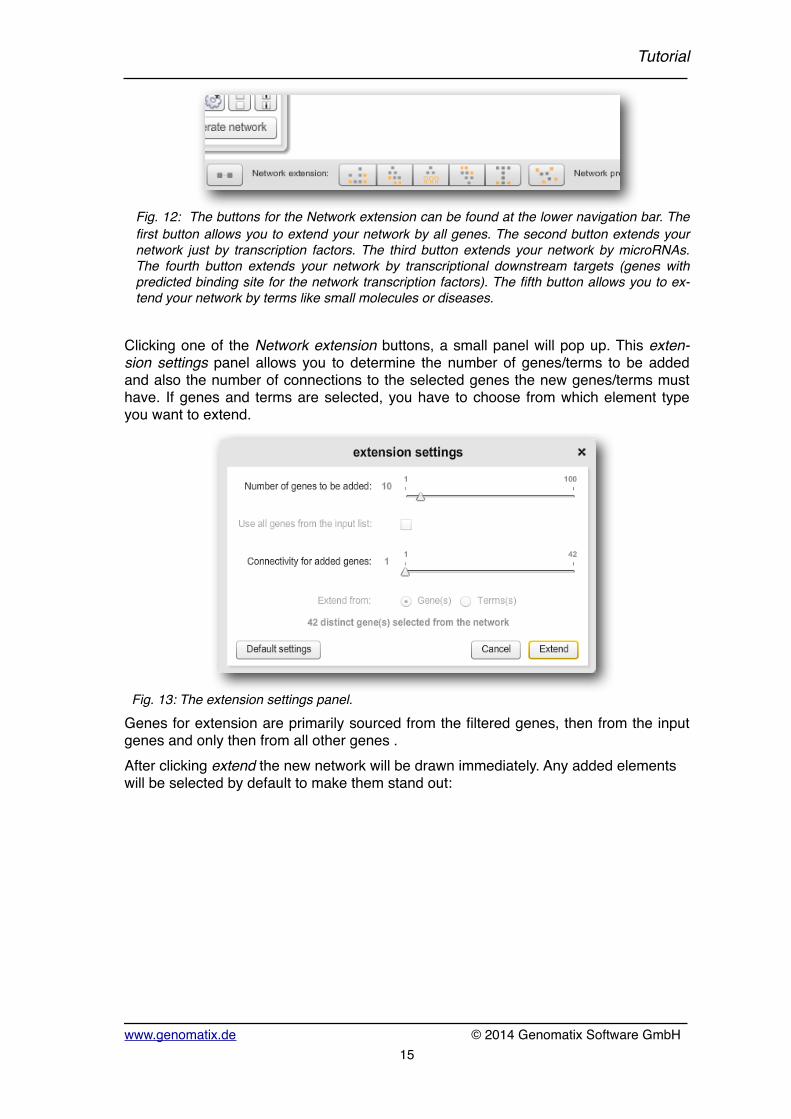
Fig. 12: The buttons for the Network extension can be found at the lower navigation bar. The first button allows you to extend your network by all genes. The second button extends your network just by transcription factors. The third button extends your network by microRNAs. The fourth button extends your network by transcriptional downstream targets (genes with predicted binding site for the network transcription factors). The fifth button allows you to ex-tend your network by terms like small molecules or diseases.
Clicking one of the Network extension buttons, a small panel will pop up. This exten-sion settings panel allows you to determine the number of genes/terms to be added and also the number of connections to the selected genes the new genes/terms must have. If genes and terms are selected, you have to choose from which element type you want to extend.
Fig. 13: The extension settings panel.Genes for extension are primarily sourced from the filtered genes, then from the input genes and only then from all other genes .After clicking extend the new network will be drawn immediately. Any added elements will be selected by default to make them stand out:
Tutorial
www.genomatix.de! © 2014 Genomatix Software GmbH15
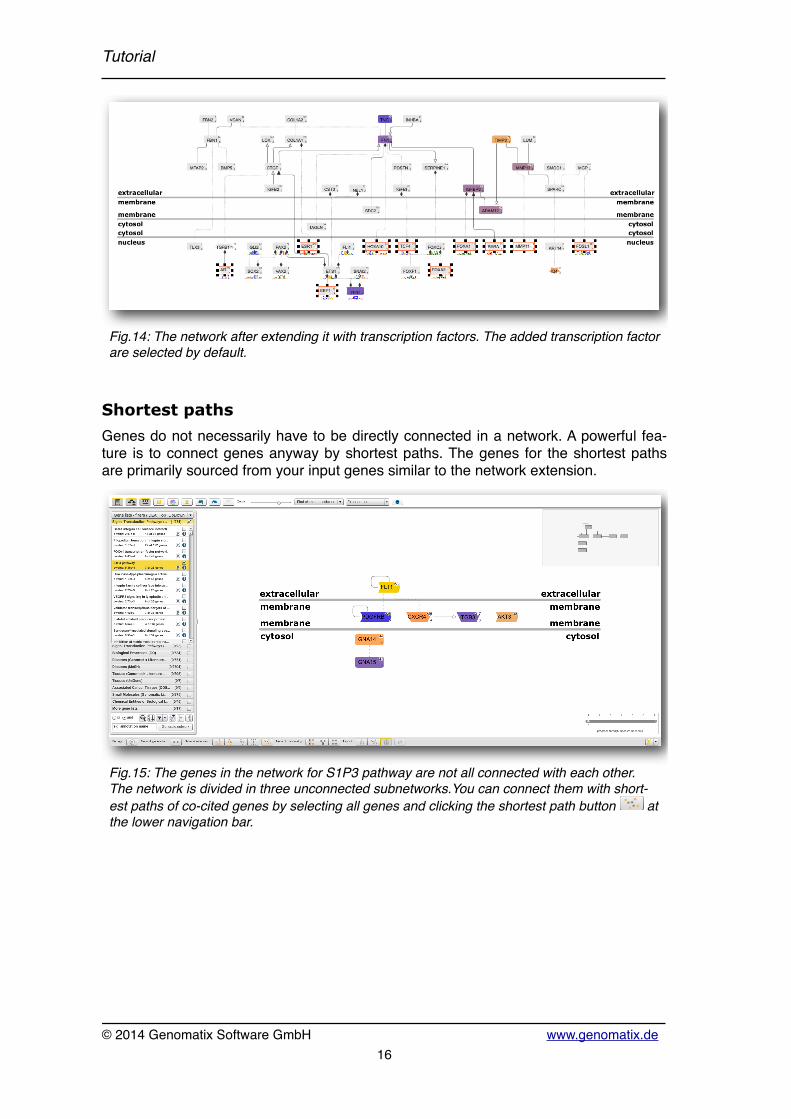
Fig.14: The network after extending it with transcription factors. The added transcription factor are selected by default.
Shortest pathsGenes do not necessarily have to be directly connected in a network. A powerful fea-ture is to connect genes anyway by shortest paths. The genes for the shortest paths are primarily sourced from your input genes similar to the network extension.
Fig.15: The genes in the network for S1P3 pathway are not all connected with each other. The network is divided in three unconnected subnetworks.You can connect them with short-est paths of co-cited genes by selecting all genes and clicking the shortest path button at the lower navigation bar.
Tutorial
© 2014 Genomatix Software GmbH! www.genomatix.de16
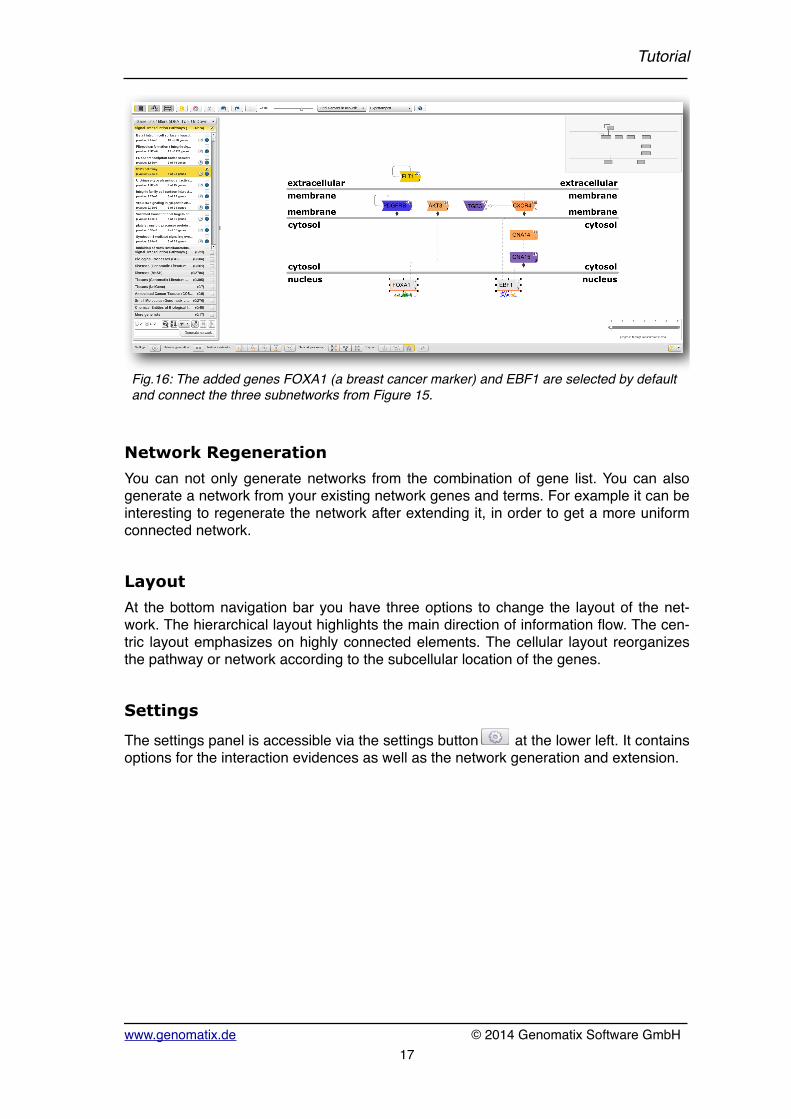
Fig.16: The added genes FOXA1 (a breast cancer marker) and EBF1 are selected by default and connect the three subnetworks from Figure 15.
Network RegenerationYou can not only generate networks from the combination of gene list. You can also generate a network from your existing network genes and terms. For example it can be interesting to regenerate the network after extending it, in order to get a more uniform connected network.
LayoutAt the bottom navigation bar you have three options to change the layout of the net-work. The hierarchical layout highlights the main direction of information flow. The cen-tric layout emphasizes on highly connected elements. The cellular layout reorganizes the pathway or network according to the subcellular location of the genes.
Settings
The settings panel is accessible via the settings button at the lower left. It contains options for the interaction evidences as well as the network generation and extension.
Tutorial
www.genomatix.de! © 2014 Genomatix Software GmbH17
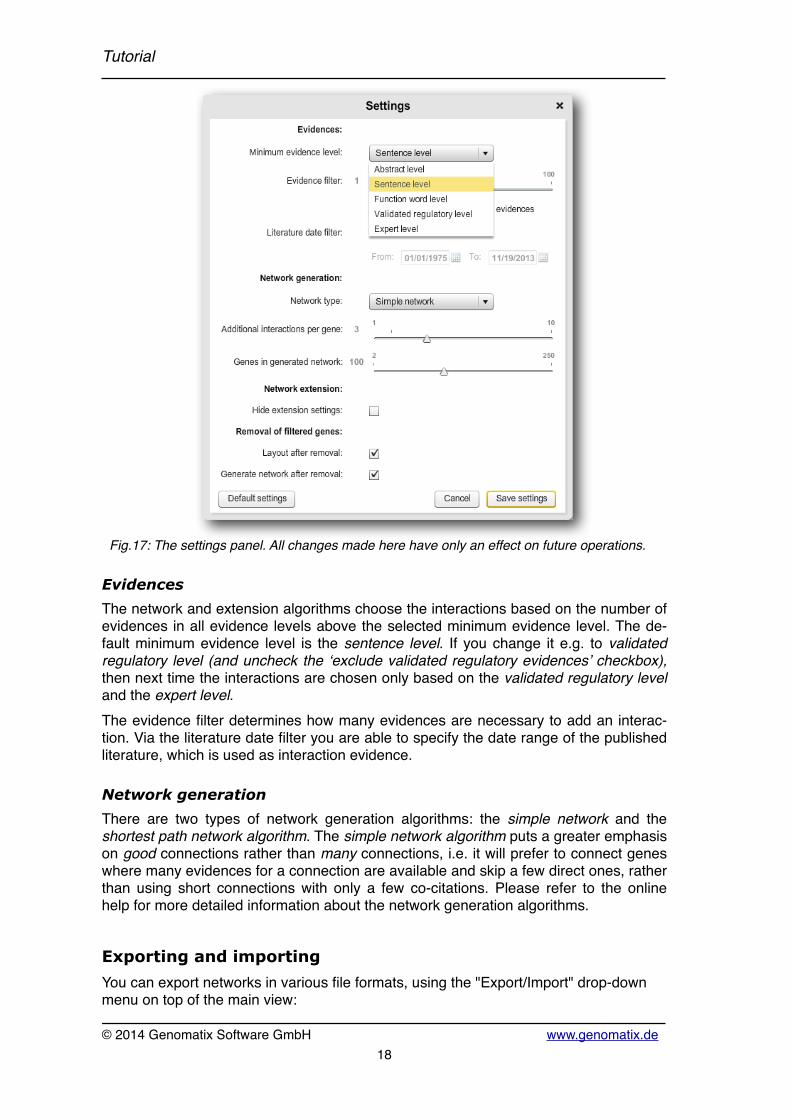
Fig.17: The settings panel. All changes made here have only an effect on future operations.
EvidencesThe network and extension algorithms choose the interactions based on the number of evidences in all evidence levels above the selected minimum evidence level. The de-fault minimum evidence level is the sentence level. If you change it e.g. to validated regulatory level (and uncheck the ‘exclude validated regulatory evidences’ checkbox), then next time the interactions are chosen only based on the validated regulatory level and the expert level.The evidence filter determines how many evidences are necessary to add an interac-tion. Via the literature date filter you are able to specify the date range of the published literature, which is used as interaction evidence.
Network generationThere are two types of network generation algorithms: the simple network and the shortest path network algorithm. The simple network algorithm puts a greater emphasis on good connections rather than many connections, i.e. it will prefer to connect genes where many evidences for a connection are available and skip a few direct ones, rather than using short connections with only a few co-citations. Please refer to the online help for more detailed information about the network generation algorithms.
Exporting and importingYou can export networks in various file formats, using the "Export/Import" drop-down menu on top of the main view:
Tutorial
© 2014 Genomatix Software GmbH! www.genomatix.de18
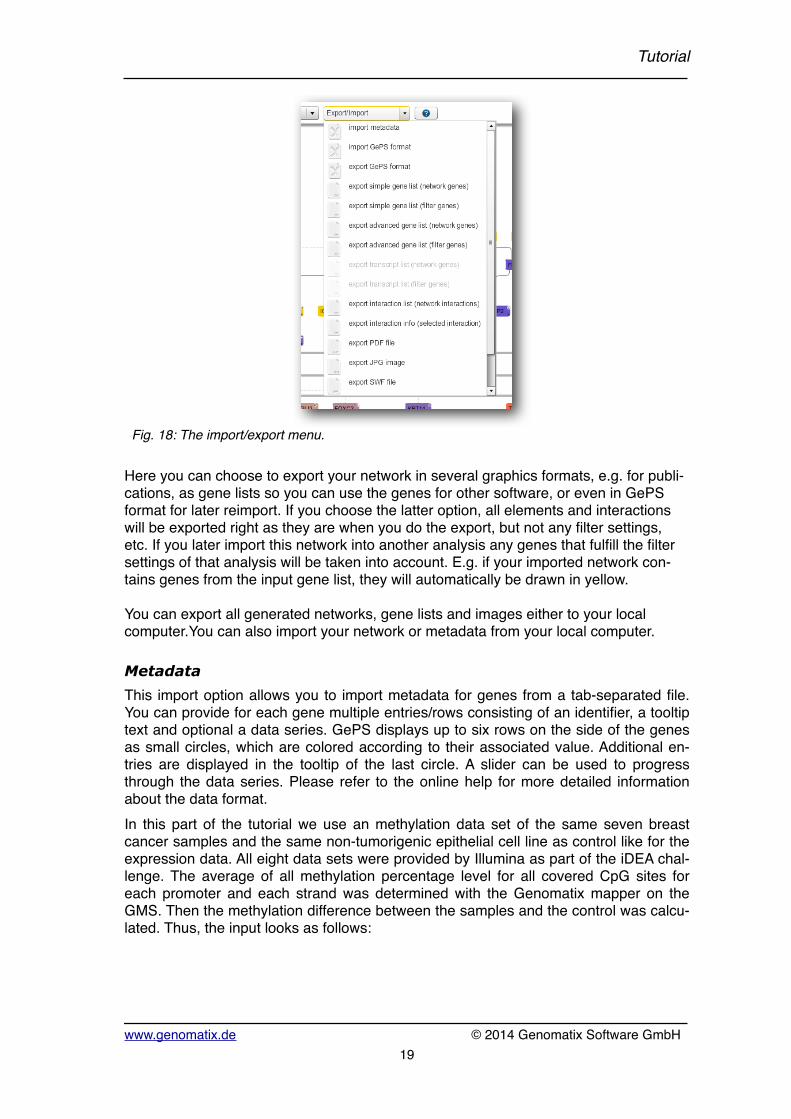
Fig. 18: The import/export menu.
Here you can choose to export your network in several graphics formats, e.g. for publi- cations, as gene lists so you can use the genes for other software, or even in GePS format for later reimport. If you choose the latter option, all elements and interactions will be exported right as they are when you do the export, but not any filter settings, etc. If you later import this network into another analysis any genes that fulfill the filter settings of that analysis will be taken into account. E.g. if your imported network con-tains genes from the input gene list, they will automatically be drawn in yellow.
You can export all generated networks, gene lists and images either to your local computer.You can also import your network or metadata from your local computer.
MetadataThis import option allows you to import metadata for genes from a tab-separated file. You can provide for each gene multiple entries/rows consisting of an identifier, a tooltip text and optional a data series. GePS displays up to six rows on the side of the genes as small circles, which are colored according to their associated value. Additional en-tries are displayed in the tooltip of the last circle. A slider can be used to progress through the data series. Please refer to the online help for more detailed information about the data format.In this part of the tutorial we use an methylation data set of the same seven breast cancer samples and the same non-tumorigenic epithelial cell line as control like for the expression data. All eight data sets were provided by Illumina as part of the iDEA chal-lenge. The average of all methylation percentage level for all covered CpG sites for each promoter and each strand was determined with the Genomatix mapper on the GMS. Then the methylation difference between the samples and the control was calcu-lated. Thus, the input looks as follows:
Tutorial
www.genomatix.de! © 2014 Genomatix Software GmbH19
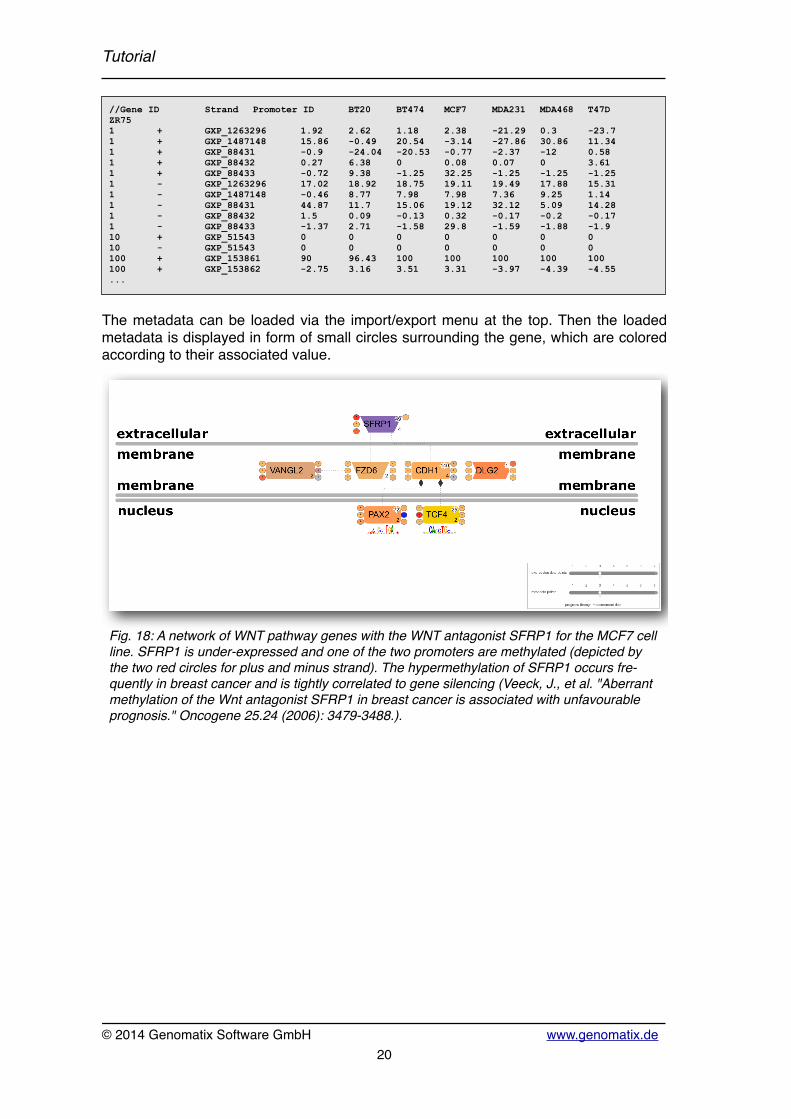
The metadata can be loaded via the import/export menu at the top. Then the loaded metadata is displayed in form of small circles surrounding the gene, which are colored according to their associated value.
Fig. 18: A network of WNT pathway genes with the WNT antagonist SFRP1 for the MCF7 cell line. SFRP1 is under-expressed and one of the two promoters are methylated (depicted by the two red circles for plus and minus strand). The hypermethylation of SFRP1 occurs fre-quently in breast cancer and is tightly correlated to gene silencing (Veeck, J., et al. "Aberrant methylation of the Wnt antagonist SFRP1 in breast cancer is associated with unfavourable prognosis." Oncogene 25.24 (2006): 3479-3488.).
//Gene ID Strand Promoter ID BT20 BT474 MCF7 MDA231 MDA468 T47D ZR751 + GXP_1263296 1.92 2.62 1.18 2.38 -21.29 0.3 -23.71 + GXP_1487148 15.86 -0.49 20.54 -3.14 -27.86 30.86 11.341 + GXP_88431 -0.9 -24.04 -20.53 -0.77 -2.37 -12 0.581 + GXP_88432 0.27 6.38 0 0.08 0.07 0 3.611 + GXP_88433 -0.72 9.38 -1.25 32.25 -1.25 -1.25 -1.251 - GXP_1263296 17.02 18.92 18.75 19.11 19.49 17.88 15.311 - GXP_1487148 -0.46 8.77 7.98 7.98 7.36 9.25 1.141 - GXP_88431 44.87 11.7 15.06 19.12 32.12 5.09 14.281 - GXP_88432 1.5 0.09 -0.13 0.32 -0.17 -0.2 -0.171 - GXP_88433 -1.37 2.71 -1.58 29.8 -1.59 -1.88 -1.910 + GXP_51543 0 0 0 0 0 0 010 - GXP_51543 0 0 0 0 0 0 0100 + GXP_153861 90 96.43 100 100 100 100 100100 + GXP_153862 -2.75 3.16 3.51 3.31 -3.97 -4.39 -4.55...
Tutorial
© 2014 Genomatix Software GmbH! www.genomatix.de20

Tutorial
www.genomatix.de! © 2014 Genomatix Software GmbH21
Build networks from scratchGePS allows you to create your own network from scratch. You can add and remove genes, terms and interactions manually. This is not only within the task Build networks from scratch possible, but also from within every other task.
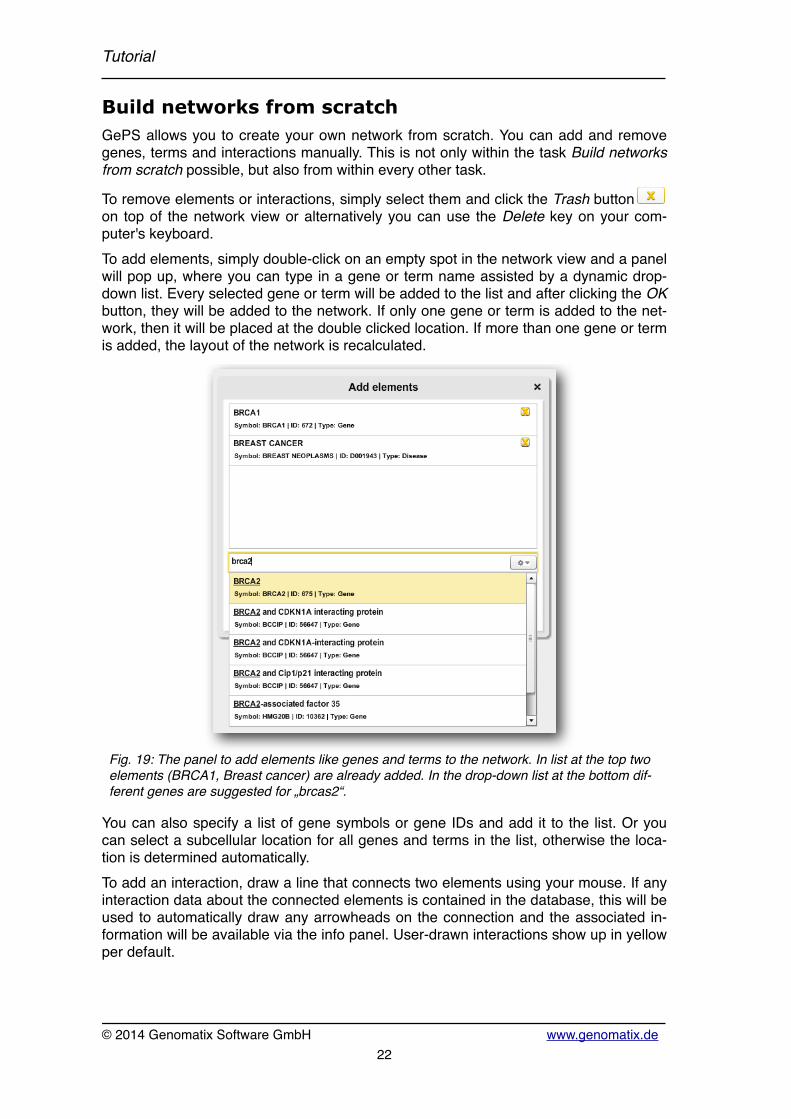
To remove elements or interactions, simply select them and click the Trash button on top of the network view or alternatively you can use the Delete key on your com-puter's keyboard.To add elements, simply double-click on an empty spot in the network view and a panel will pop up, where you can type in a gene or term name assisted by a dynamic drop-down list. Every selected gene or term will be added to the list and after clicking the OK button, they will be added to the network. If only one gene or term is added to the net-work, then it will be placed at the double clicked location. If more than one gene or term is added, the layout of the network is recalculated.
Fig. 19: The panel to add elements like genes and terms to the network. In list at the top two elements (BRCA1, Breast cancer) are already added. In the drop-down list at the bottom dif-ferent genes are suggested for „brcas2“.
You can also specify a list of gene symbols or gene IDs and add it to the list. Or you can select a subcellular location for all genes and terms in the list, otherwise the loca-tion is determined automatically.To add an interaction, draw a line that connects two elements using your mouse. If any interaction data about the connected elements is contained in the database, this will be used to automatically draw any arrowheads on the connection and the associated in- formation will be available via the info panel. User-drawn interactions show up in yellow per default.
Tutorial
© 2014 Genomatix Software GmbH! www.genomatix.de22
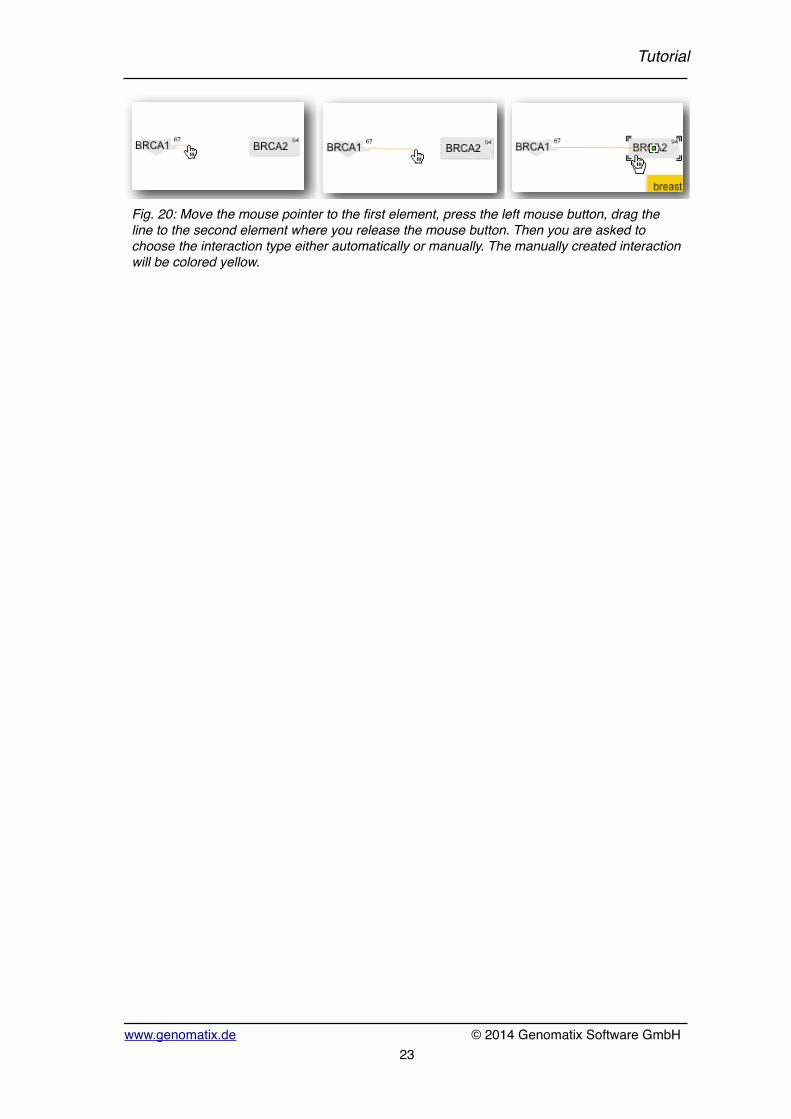
Fig. 20: Move the mouse pointer to the first element, press the left mouse button, drag the line to the second element where you release the mouse button. Then you are asked to choose the interaction type either automatically or manually. The manually created interaction will be colored yellow.
Fig. 20: Move the mouse pointer to the first element, press the left mouse button, drag the line to the second element where you release the mouse button. Then you are asked to choose the interaction type either automatically or manually. The manually created interaction will be colored yellow.
Fig. 20: Move the mouse pointer to the first element, press the left mouse button, drag the line to the second element where you release the mouse button. Then you are asked to choose the interaction type either automatically or manually. The manually created interaction will be colored yellow.
Tutorial
www.genomatix.de! © 2014 Genomatix Software GmbH23