Embed Size (px)
Citation preview
Article
Gene-specific correlation of RNA and protein levelsin human cells and tissuesFredrik Edfors1, Frida Danielsson1, Björn M Hallström1, Lukas Käll1, Emma Lundberg1, Fredrik Pontén2,
Björn Forsström1 & Mathias Uhlén1,3,*
Abstract
An important issue for molecular biology is to establish whethertranscript levels of a given gene can be used as proxies for thecorresponding protein levels. Here, we have developed a targetedproteomics approach for a set of human non-secreted proteinsbased on parallel reaction monitoring to measure, at steady-stateconditions, absolute protein copy numbers across human tissuesand cell lines and compared these levels with the correspondingmRNA levels using transcriptomics. The study shows that the tran-script and protein levels do not correlate well unless a gene-specificRNA-to-protein (RTP) conversion factor independent of the tissuetype is introduced, thus significantly enhancing the predictabilityof protein copy numbers from RNA levels. The results show that theRTP ratio varies significantly with a few hundred copies per mRNAmolecule for some genes to several hundred thousands of proteincopies per mRNA molecule for others. In conclusion, our datasuggest that transcriptome analysis can be used as a tool to predictthe protein copy numbers per cell, thus forming an attractive linkbetween the field of genomics and proteomics.
Keywords gene expression; protein quantification; targeted proteomics;
transcriptomics
Subject Categories Genome-Scale & Integrative Biology; Post-translational
Modifications, Proteolysis & Proteomics; Transcription
DOI 10.15252/msb.20167144 | Received 5 July 2016 | Revised 5 September
2016 | Accepted 15 September 2016
Mol Syst Biol. (2016) 12: 883
See also: GM Silva and C Vogel (October 2016)
Introduction
Fundamental biological processes govern the flow of information
from genome to gene product to cellular phenotype (Payne, 2015).
The correlation between mRNA levels and the corresponding
protein levels is in this context an important issue, and the presence
or absence of such correlation on an individual gene/protein level
has been debated in literature for many years (Anderson &
Seilhamer, 1997; Gry et al, 2009; Maier et al, 2009, 2011; Lundberg
& Uhlen, 2010; Schwanhausser et al, 2011; Lawless et al, 2016).
Resolving these conflicting reports is of fundamental interest for
both genome and proteome research, since massive efforts to char-
acterize the steady-state transcriptome in various human cells and
tissues are ongoing, including the HPA (Uhlen et al, 2015), GTEx
consortium (Mele et al, 2015), and ENCODE (ENCODE Project
Consortium et al, 2012) efforts. If RNA levels could be used to
predict protein levels, the value of these extensive expression
resources would substantially increase, thereby allowing protein
level prediction studies based on genomewide transcriptomics data
tremendously benefit systems biology efforts of human biology and
disease. However, numerous reports have concluded (Nagaraj et al,
2011; Vogel & Marcotte, 2012; Payne, 2015) that proteome and
transcriptome abundances are not sufficiently correlated to act as
proxies for each other. In contrast, several recent reports based on
genome-scale data have suggested a correlation between the steady-
state levels of mRNA indicating a constant protein–mRNA ratio in
human cell lines (Lundberg et al, 2010) and tissues (Wilhelm et al,
2014). This led to the hypothesis that protein abundance in any
given tissue might be predicted from mRNA abundance (Wilhelm
et al, 2014). These conflicting results thus call for more in-depth
studies to clarify this issue.
Here, we decided to investigate the correlation using a targeted
proteomics approach with internal standards to allow the determina-
tion of the absolute copy number of molecules across human cell
lines and tissues, in contrast to previous studies based on label-free
absolute quantification of proteins that have been shown to underes-
timate proteins over large dynamic ranges (Ahrne et al, 2013). The
targeted proteomics method rely on spike-in of known amounts of
stable isotope-labeled protein fragments (Zeiler et al, 2012) followed
by trypsin digestion and parallel reaction monitoring (PRM) analysis
(Gallien et al, 2012) to determine relative amounts of peptides from
sample and internal standard, thereby creating precise anchoring
points for all quantitative measurements between all replicates and
thus minimizing technical artifacts. Absolute protein copy numbers
in the sample can subsequently be calculated from the ratio
measured between sample and standard peptides. In contrast to
1 Science for Life Laboratory, KTH – Royal Institute of Technology, Stockholm, Sweden2 Department of Immunology, Genetics and Pathology, Rudbeck Laboratory, Uppsala University, Uppsala, Sweden3 Novo Nordisk Foundation Center for Biosustainability, Technical University of Denmark, Hørsholm, Denmark
*Corresponding author. Tel: +46 70 5132101; E-mail: [email protected]
ª 2016 The Authors. Published under the terms of the CC BY 4.0 license Molecular Systems Biology 12: 883 | 2016 1
Published online: October 20, 2016
similar methods using labeled peptides as standards, such as AQUA
peptides (Gerber et al, 2003), the protein fragments are digested
simultaneously together with the target protein, which minimizes
errors arising during sample preparation, such as the effect of incom-
plete trypsin digestion or sample loss prior addition of standard.
The protein copy numbers of selected genes were determined
across tissues and cell lines representing cells of different origin,
and the transcript levels corresponding to the protein-coding genes
were established by genomewide transcriptome analysis. This
allowed us, for the first time, to compare absolute protein copy
numbers per cell with transcript levels measured as TPM (tran-
scripts per million) (Bray et al, 2016). An important part of the
study was to develop a precise cell count method based on a
histone-based normalization procedure to allow the absolute
number of cells be established also for complex tissue samples
containing mixtures of cell types. Based on this normalization and
the precise determination of protein copy numbers, we demonstrate
that the predictability of the protein copy numbers from RNA levels
can be significantly enhanced if a gene-specific, cell independent
RNA-to-protein (RTP) conversion factor is introduced.
Results
Selection of genes and development of PRM assays
The RNA and protein levels were studied in samples from nine
human cell lines (Table EV1) and 11 human tissues representing
diverse functional units, such as liver, lung, kidney, and tonsil
(Table EV2). The transcriptome of these samples was determined
using digital counting of the transcript using RNA-Seq (Mortazavi
et al, 2008). The number of transcripts per gene was determined as
transcript per million (TPM), thus calculating the number of
estimated mRNA molecules for a given gene per million of total
mRNA molecules in the cell, allowing for a straightforward compar-
ison of transcription levels between samples of different sequencing
depths and cell counts. Based on transcript analysis, genes for
targeted proteomics analysis were selected based according to the
following criteria: (i) intracellular or membrane bound protein
product (i.e., non-secreted), (ii) present across most of the analyzed
tissues and cells, and (iii) having a relatively high degree of variabil-
ity in the analyzed tissues and cells. This resulted in 55 genes suit-
able for PRM analysis with available protein standards.
Transcriptomics data across the cell lines and tissues for these genes
are shown in Table EV3.
To allow for a precise determination of copy number of the corre-
sponding proteins, PRM assays were developed (Table EV4) repre-
senting each of the 55 genes with stable isotope-labeled
recombinant protein fragments (QPrESTs) produced in a bacterial
host and quantified as described before (Zeiler et al, 2012). PRM
assays, in most cases based on at least two independent peptides,
were developed (Table EV5), and the sample-specific concentration
of isotope-labeled standard to be spiked-in to reach approximately
one-to-one ratio between standard and endogenous target protein
were determined using lysates from a selection of cell lines (U2OS
and HEK293). This allowed us to assemble a multiplex mixture of
69 isotope-labeled QPrEST standards, some genes covered by
multiple standards, with the concentration of each standard
A
B
C D
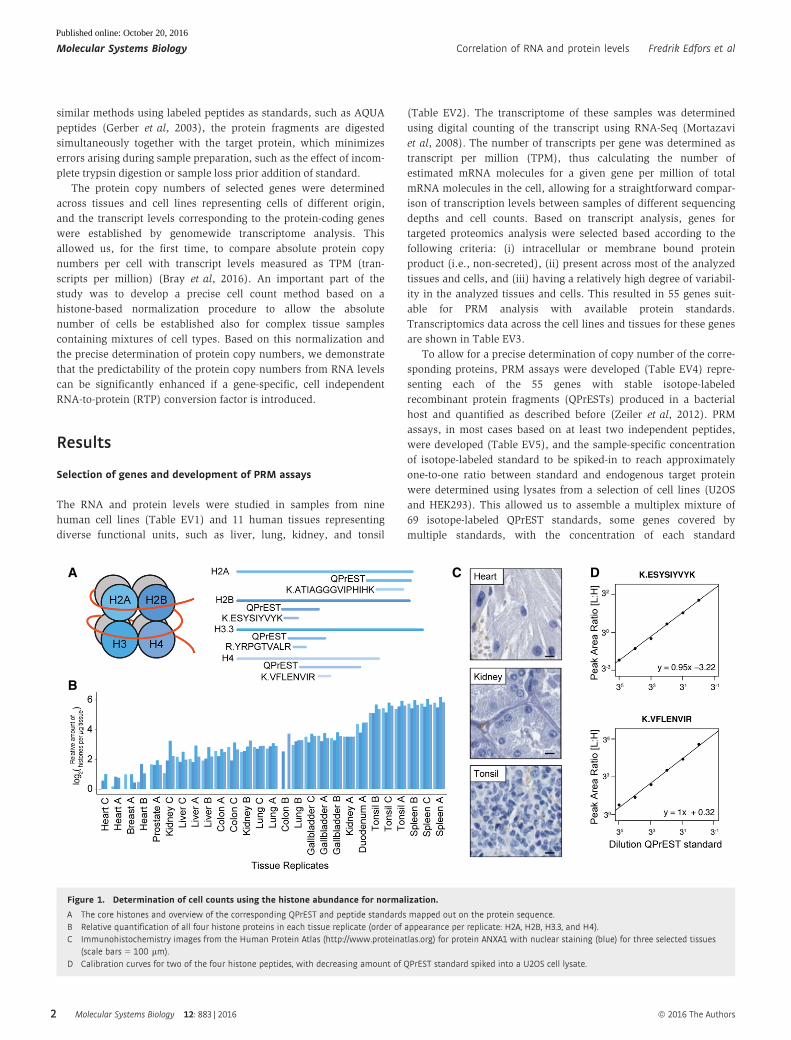
Figure 1. Determination of cell counts using the histone abundance for normalization.
A The core histones and overview of the corresponding QPrEST and peptide standards mapped out on the protein sequence.B Relative quantification of all four histone proteins in each tissue replicate (order of appearance per replicate: H2A, H2B, H3.3, and H4).C Immunohistochemistry images from the Human Protein Atlas (http://www.proteinatlas.org) for protein ANXA1 with nuclear staining (blue) for three selected tissues
(scale bars = 100 lm).D Calibration curves for two of the four histone peptides, with decreasing amount of QPrEST standard spiked into a U2OS cell lysate.
Molecular Systems Biology 12: 883 | 2016 ª 2016 The Authors
Molecular Systems Biology Correlation of RNA and protein levels Fredrik Edfors et al
2
Published online: October 20, 2016
reflecting the abundance of the corresponding protein targets in the
cell lines. The assembly of this QPrEST mixture allowed us to
perform multiplex analysis of all the 55 protein targets using
targeted mass spectrometry.
Normalization of tissue samples using PRM-basedhistone quantification
To analyze the number of cells in the tissue samples, we took
advantage of the QPrEST approach to develop a quantitative assay
based on the four core histone subunits (H2A, H2B, H3, and H4)
(Fig 1A). Histones have previously been shown to give a good esti-
mate of DNA content in various samples using label-free
approaches (Wi�sniewski et al, 2014), and here, we introduce
isotope-labeled recombinant QPrEST standards in all our assays
representing the four major histones. An analysis of cell numbers
present in the different tissue samples (Fig 1B) showed that there
are many more cells per mg tissue from spleen and tonsil as
compared to heart. This observation is supported by immunohisto-
chemistry (Fig 1C) showing many more cells with nuclear staining
in tonsil as compared to heart muscle. The number of proteins
quantified in each tissue sample was therefore normalized based
on the histones and subsequently used to calculate cell counts for
each tissue in this study, as shown in Table EV6. Dilution series of
these standards demonstrated a good linearity (Fig 1D) based on
an assay using the heavy standard spiked into a serial dilution of
a U2OS cell lysate.
The protein copy number of the target genes in tissues andcell lines
Using the multiplex QPrEST mixture, the protein copy number for
the 55 target proteins was determined in all the samples. The results
for all cell lines and tissues are summarized in Table EV8, and
examples of the results are summarized in Fig 2A. The protein
levels for the various target proteins ranged from thousands to
A
B
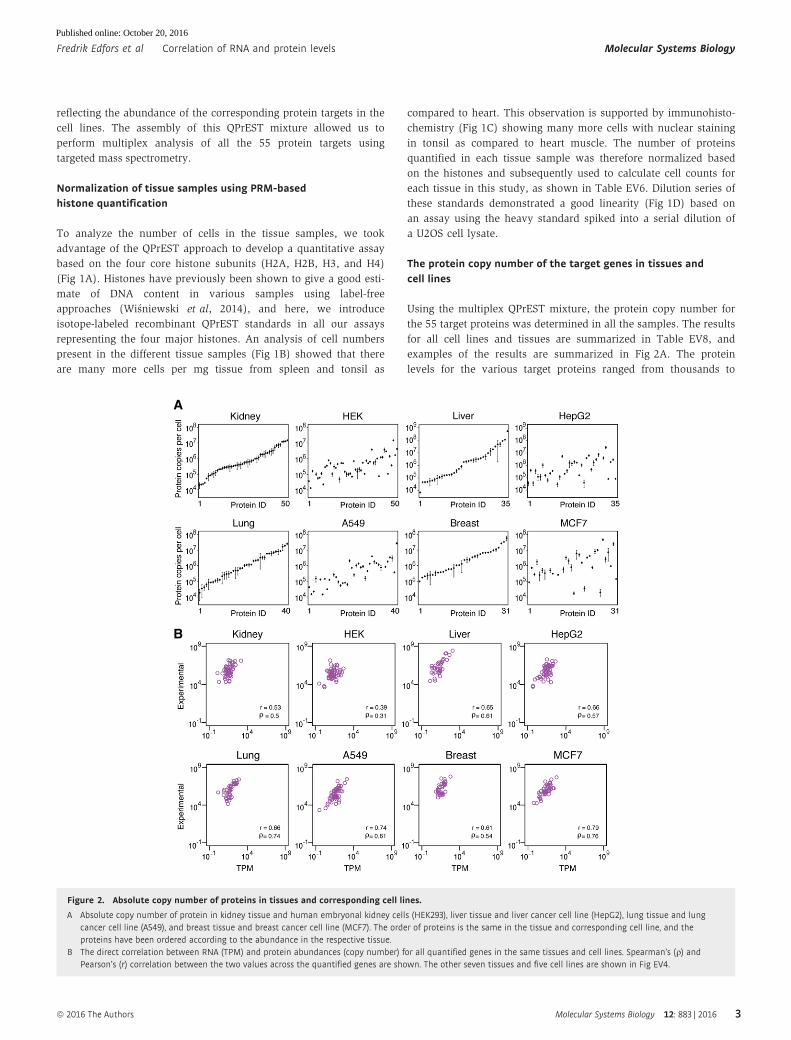
Figure 2. Absolute copy number of proteins in tissues and corresponding cell lines.
A Absolute copy number of protein in kidney tissue and human embryonal kidney cells (HEK293), liver tissue and liver cancer cell line (HepG2), lung tissue and lungcancer cell line (A549), and breast tissue and breast cancer cell line (MCF7). The order of proteins is the same in the tissue and corresponding cell line, and theproteins have been ordered according to the abundance in the respective tissue.
B The direct correlation between RNA (TPM) and protein abundances (copy number) for all quantified genes in the same tissues and cell lines. Spearman’s (q) andPearson’s (r) correlation between the two values across the quantified genes are shown. The other seven tissues and five cell lines are shown in Fig EV4.
ª 2016 The Authors Molecular Systems Biology 12: 883 | 2016
Fredrik Edfors et al Correlation of RNA and protein levels Molecular Systems Biology
3
Published online: October 20, 2016
hundreds of millions of copies per cell. As an example, the absolute
copy number per average cell in the kidney ranged from 20,500
protein molecules for a nucleotidase (CANT1) to 15 million for a
leukocyte elastase inhibitor (SERPINB1). Interestingly, the absolute
copy numbers per cell of many of the target proteins are signifi-
cantly different in the kidney-derived cell line HEK293 demonstrat-
ing, as noted earlier (Uhlen et al, 2015), that caution should be
taken to use cell lines as models for normal tissue. This observation
is supported also when comparing the absolute copy number of
proteins in liver and the liver-derived cell line HepG2, the lung and
the lung-derived cell line A549, and the breast and the breast-
derived cell line MCF7.
The direct correlation between RNA and protein levels in tissuesand cell lines
We then decided to compare directly the RNA and protein levels of
the target genes in the different tissues and cell lines. In Fig 2B, the
RNA levels and protein copy number for the analyzed genes are plot-
ted for some of the cell lines and tissues. A moderate correlation can
be observed, and this is reflected in calculation of the Pearson’s corre-
lations across the genes. The Pearson’s correlation range from 0.39 in
the kidney-derived HEK293 to 0.79 in the breast-derived cell line
MCF7 with a correlation around 0.6 for all the tissues. These results
are in line with earlier results (Schwanhausser et al, 2013) showing a
moderate correlation when RNA and protein levels are compared
directly without taking gene-specific differences into account.
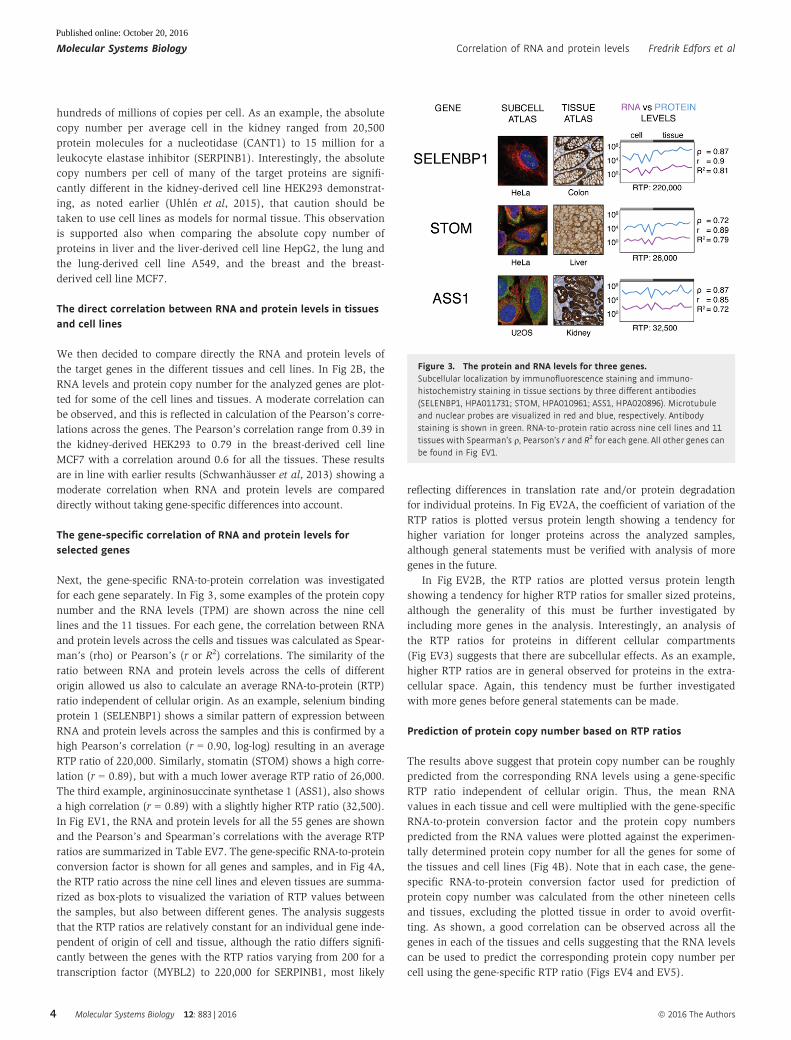
The gene-specific correlation of RNA and protein levels forselected genes
Next, the gene-specific RNA-to-protein correlation was investigated
for each gene separately. In Fig 3, some examples of the protein copy
number and the RNA levels (TPM) are shown across the nine cell
lines and the 11 tissues. For each gene, the correlation between RNA
and protein levels across the cells and tissues was calculated as Spear-
man’s (rho) or Pearson’s (r or R2) correlations. The similarity of the
ratio between RNA and protein levels across the cells of different
origin allowed us also to calculate an average RNA-to-protein (RTP)
ratio independent of cellular origin. As an example, selenium binding
protein 1 (SELENBP1) shows a similar pattern of expression between
RNA and protein levels across the samples and this is confirmed by a
high Pearson’s correlation (r = 0.90, log-log) resulting in an average
RTP ratio of 220,000. Similarly, stomatin (STOM) shows a high corre-
lation (r = 0.89), but with a much lower average RTP ratio of 26,000.
The third example, argininosuccinate synthetase 1 (ASS1), also shows
a high correlation (r = 0.89) with a slightly higher RTP ratio (32,500).
In Fig EV1, the RNA and protein levels for all the 55 genes are shown
and the Pearson’s and Spearman’s correlations with the average RTP
ratios are summarized in Table EV7. The gene-specific RNA-to-protein
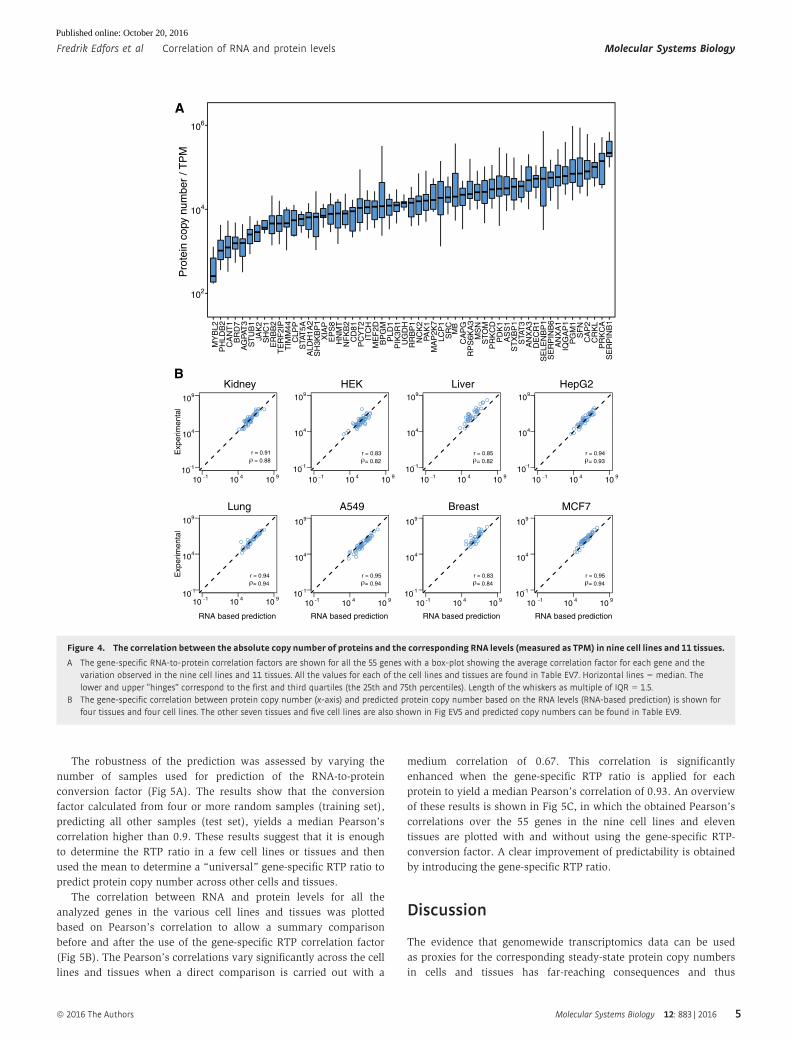
conversion factor is shown for all genes and samples, and in Fig 4A,
the RTP ratio across the nine cell lines and eleven tissues are summa-
rized as box-plots to visualized the variation of RTP values between
the samples, but also between different genes. The analysis suggests
that the RTP ratios are relatively constant for an individual gene inde-
pendent of origin of cell and tissue, although the ratio differs signifi-
cantly between the genes with the RTP ratios varying from 200 for a
transcription factor (MYBL2) to 220,000 for SERPINB1, most likely
reflecting differences in translation rate and/or protein degradation
for individual proteins. In Fig EV2A, the coefficient of variation of the
RTP ratios is plotted versus protein length showing a tendency for
higher variation for longer proteins across the analyzed samples,
although general statements must be verified with analysis of more
genes in the future.
In Fig EV2B, the RTP ratios are plotted versus protein length
showing a tendency for higher RTP ratios for smaller sized proteins,
although the generality of this must be further investigated by
including more genes in the analysis. Interestingly, an analysis of
the RTP ratios for proteins in different cellular compartments
(Fig EV3) suggests that there are subcellular effects. As an example,
higher RTP ratios are in general observed for proteins in the extra-
cellular space. Again, this tendency must be further investigated
with more genes before general statements can be made.
Prediction of protein copy number based on RTP ratios
The results above suggest that protein copy number can be roughly
predicted from the corresponding RNA levels using a gene-specific
RTP ratio independent of cellular origin. Thus, the mean RNA
values in each tissue and cell were multiplied with the gene-specific
RNA-to-protein conversion factor and the protein copy numbers
predicted from the RNA values were plotted against the experimen-
tally determined protein copy number for all the genes for some of
the tissues and cell lines (Fig 4B). Note that in each case, the gene-
specific RNA-to-protein conversion factor used for prediction of
protein copy number was calculated from the other nineteen cells
and tissues, excluding the plotted tissue in order to avoid overfit-
ting. As shown, a good correlation can be observed across all the
genes in each of the tissues and cells suggesting that the RNA levels
can be used to predict the corresponding protein copy number per
cell using the gene-specific RTP ratio (Figs EV4 and EV5).
Figure 3. The protein and RNA levels for three genes.Subcellular localization by immunofluorescence staining and immuno-histochemistry staining in tissue sections by three different antibodies(SELENBP1, HPA011731; STOM, HPA010961; ASS1, HPA020896). Microtubuleand nuclear probes are visualized in red and blue, respectively. Antibodystaining is shown in green. RNA-to-protein ratio across nine cell lines and 11tissues with Spearman’s q, Pearson’s r and R2 for each gene. All other genes canbe found in Fig EV1.
Molecular Systems Biology 12: 883 | 2016 ª 2016 The Authors
Molecular Systems Biology Correlation of RNA and protein levels Fredrik Edfors et al
4
Published online: October 20, 2016
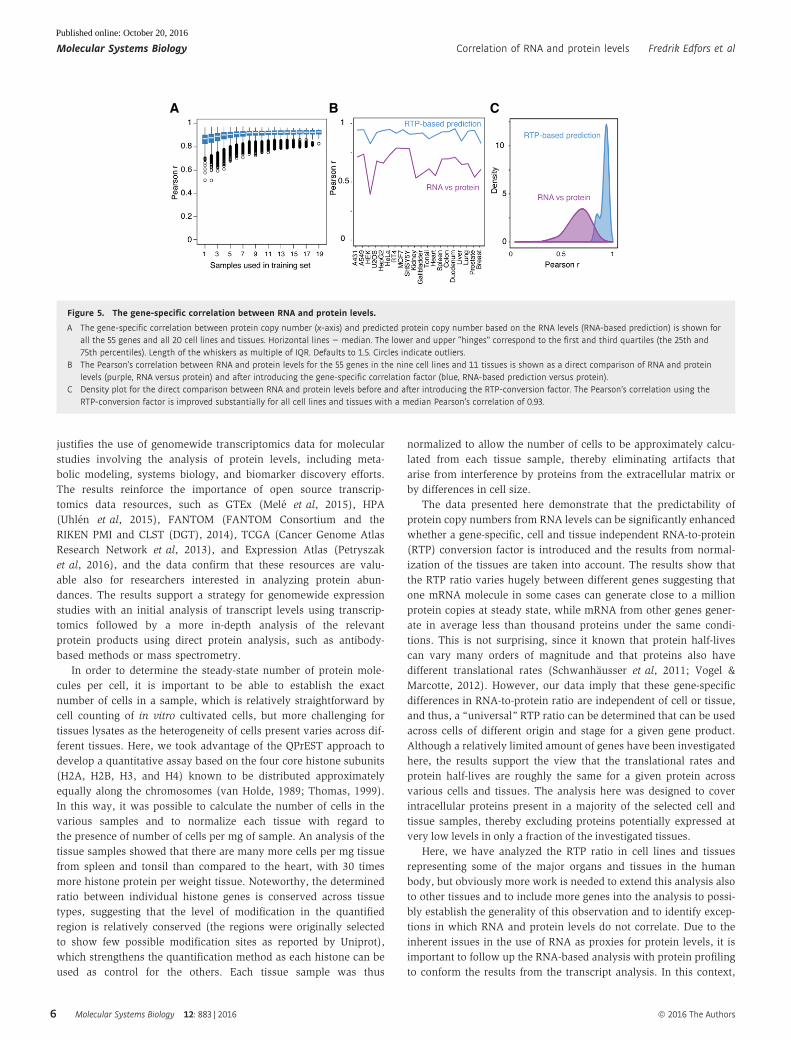
The robustness of the prediction was assessed by varying the
number of samples used for prediction of the RNA-to-protein
conversion factor (Fig 5A). The results show that the conversion
factor calculated from four or more random samples (training set),
predicting all other samples (test set), yields a median Pearson’s
correlation higher than 0.9. These results suggest that it is enough
to determine the RTP ratio in a few cell lines or tissues and then
used the mean to determine a “universal” gene-specific RTP ratio to
predict protein copy number across other cells and tissues.
The correlation between RNA and protein levels for all the
analyzed genes in the various cell lines and tissues was plotted
based on Pearson’s correlation to allow a summary comparison
before and after the use of the gene-specific RTP correlation factor
(Fig 5B). The Pearson’s correlations vary significantly across the cell
lines and tissues when a direct comparison is carried out with a
medium correlation of 0.67. This correlation is significantly
enhanced when the gene-specific RTP ratio is applied for each
protein to yield a median Pearson’s correlation of 0.93. An overview
of these results is shown in Fig 5C, in which the obtained Pearson’s
correlations over the 55 genes in the nine cell lines and eleven
tissues are plotted with and without using the gene-specific RTP-
conversion factor. A clear improvement of predictability is obtained
by introducing the gene-specific RTP ratio.
Discussion
The evidence that genomewide transcriptomics data can be used
as proxies for the corresponding steady-state protein copy numbers
in cells and tissues has far-reaching consequences and thus
A
BHEK
= 0.82r = 0.83
HepG2
= 0.93r = 0.94
A549
= 0.94r = 0.95
Kidney
10 1 10 4 10 910 1
104
109
10 1 10 4 10 9
104
109
MCF7
= 0.94r = 0.95
Liver
= 0.82r = 0.85
Lung
= 0.94r = 0.94
Breast
= 0.84r = 0.83
RNA based predictionRNA based predictionRNA based predictionRNA based prediction
Exp
erim
enta
lE
xper
imen
tal
10 1 10 4 10 9 10 1 10 4 10 9 10 1 10 4 10 9
10 1
10 -1 10 4 10 910 1
104
109
10 -1 10 4 10 910 1
104
109
10 -1 10 4 10 910 1
104
109
MY
BL2
PH
LDB
2C
AN
T1
BR
D7
AG
PAT
3S
TU
B1
JAK
2S
HC
1E
RB
B2
TE
RF
2IP
TIM
M44
CLP
PS
TAT
5AA
LDH
1A2
SH
3KB
P1
XIA
PE
PS
8H
NM
TN
FK
B2
CD
81P
CY
T2
ITC
HM
EF
2DB
PG
MP
LD1
PIK
3R1
UG
DH
RR
BP
1N
CK
2P A
K1
MA
P2K
7LC
P1
SR
CM
BC
AP
GR
PS
6KA
3M
SN
STO
MP
RK
CD
PD
K1
AS
S1
ST
XB
P1
STA
T3
AN
XA
3D
EC
R1
SE
LEN
BP
1S
ER
PIN
B6
AN
XA
1IQ
GA
P1
PG
M1
SF
NC
AP
2C
RK
LP
RK
CA
SE
RP
INB
1
10 1
104
109
10 1
104
109
10 1
104
109
= 0.88r = 0.91
Figure 4. The correlation between the absolute copy number of proteins and the corresponding RNA levels (measured as TPM) in nine cell lines and 11 tissues.
A The gene-specific RNA-to-protein correlation factors are shown for all the 55 genes with a box-plot showing the average correlation factor for each gene and thevariation observed in the nine cell lines and 11 tissues. All the values for each of the cell lines and tissues are found in Table EV7. Horizontal lines = median. Thelower and upper “hinges” correspond to the first and third quartiles (the 25th and 75th percentiles). Length of the whiskers as multiple of IQR = 1.5.
B The gene-specific correlation between protein copy number (x-axis) and predicted protein copy number based on the RNA levels (RNA-based prediction) is shown forfour tissues and four cell lines. The other seven tissues and five cell lines are also shown in Fig EV5 and predicted copy numbers can be found in Table EV9.
ª 2016 The Authors Molecular Systems Biology 12: 883 | 2016
Fredrik Edfors et al Correlation of RNA and protein levels Molecular Systems Biology
5
Published online: October 20, 2016
justifies the use of genomewide transcriptomics data for molecular
studies involving the analysis of protein levels, including meta-
bolic modeling, systems biology, and biomarker discovery efforts.
The results reinforce the importance of open source transcrip-
tomics data resources, such as GTEx (Mele et al, 2015), HPA
(Uhlen et al, 2015), FANTOM (FANTOM Consortium and the
RIKEN PMI and CLST (DGT), 2014), TCGA (Cancer Genome Atlas
Research Network et al, 2013), and Expression Atlas (Petryszak
et al, 2016), and the data confirm that these resources are valu-
able also for researchers interested in analyzing protein abun-
dances. The results support a strategy for genomewide expression
studies with an initial analysis of transcript levels using transcrip-
tomics followed by a more in-depth analysis of the relevant
protein products using direct protein analysis, such as antibody-
based methods or mass spectrometry.
In order to determine the steady-state number of protein mole-
cules per cell, it is important to be able to establish the exact
number of cells in a sample, which is relatively straightforward by
cell counting of in vitro cultivated cells, but more challenging for
tissues lysates as the heterogeneity of cells present varies across dif-
ferent tissues. Here, we took advantage of the QPrEST approach to
develop a quantitative assay based on the four core histone subunits
(H2A, H2B, H3, and H4) known to be distributed approximately
equally along the chromosomes (van Holde, 1989; Thomas, 1999).
In this way, it was possible to calculate the number of cells in the
various samples and to normalize each tissue with regard to
the presence of number of cells per mg of sample. An analysis of the
tissue samples showed that there are many more cells per mg tissue
from spleen and tonsil than compared to the heart, with 30 times
more histone protein per weight tissue. Noteworthy, the determined
ratio between individual histone genes is conserved across tissue
types, suggesting that the level of modification in the quantified
region is relatively conserved (the regions were originally selected
to show few possible modification sites as reported by Uniprot),
which strengthens the quantification method as each histone can be
used as control for the others. Each tissue sample was thus
normalized to allow the number of cells to be approximately calcu-
lated from each tissue sample, thereby eliminating artifacts that
arise from interference by proteins from the extracellular matrix or
by differences in cell size.
The data presented here demonstrate that the predictability of
protein copy numbers from RNA levels can be significantly enhanced
whether a gene-specific, cell and tissue independent RNA-to-protein
(RTP) conversion factor is introduced and the results from normal-
ization of the tissues are taken into account. The results show that
the RTP ratio varies hugely between different genes suggesting that
one mRNA molecule in some cases can generate close to a million
protein copies at steady state, while mRNA from other genes gener-
ate in average less than thousand proteins under the same condi-
tions. This is not surprising, since it known that protein half-lives
can vary many orders of magnitude and that proteins also have
different translational rates (Schwanhausser et al, 2011; Vogel &
Marcotte, 2012). However, our data imply that these gene-specific
differences in RNA-to-protein ratio are independent of cell or tissue,
and thus, a “universal” RTP ratio can be determined that can be used
across cells of different origin and stage for a given gene product.
Although a relatively limited amount of genes have been investigated
here, the results support the view that the translational rates and
protein half-lives are roughly the same for a given protein across
various cells and tissues. The analysis here was designed to cover
intracellular proteins present in a majority of the selected cell and
tissue samples, thereby excluding proteins potentially expressed at
very low levels in only a fraction of the investigated tissues.
Here, we have analyzed the RTP ratio in cell lines and tissues
representing some of the major organs and tissues in the human
body, but obviously more work is needed to extend this analysis also
to other tissues and to include more genes into the analysis to possi-
bly establish the generality of this observation and to identify excep-
tions in which RNA and protein levels do not correlate. Due to the
inherent issues in the use of RNA as proxies for protein levels, it is
important to follow up the RNA-based analysis with protein profiling
to conform the results from the transcript analysis. In this context,
A B C
Figure 5. The gene-specific correlation between RNA and protein levels.
A The gene-specific correlation between protein copy number (x-axis) and predicted protein copy number based on the RNA levels (RNA-based prediction) is shown forall the 55 genes and all 20 cell lines and tissues. Horizontal lines = median. The lower and upper “hinges” correspond to the first and third quartiles (the 25th and75th percentiles). Length of the whiskers as multiple of IQR. Defaults to 1.5. Circles indicate outliers.
B The Pearson’s correlation between RNA and protein levels for the 55 genes in the nine cell lines and 11 tissues is shown as a direct comparison of RNA and proteinlevels (purple, RNA versus protein) and after introducing the gene-specific correlation factor (blue, RNA-based prediction versus protein).
C Density plot for the direct comparison between RNA and protein levels before and after introducing the RTP-conversion factor. The Pearson’s correlation using theRTP-conversion factor is improved substantially for all cell lines and tissues with a median Pearson’s correlation of 0.93.
Molecular Systems Biology 12: 883 | 2016 ª 2016 The Authors
Molecular Systems Biology Correlation of RNA and protein levels Fredrik Edfors et al
6
Published online: October 20, 2016
more in-depth analysis of factors that might give miss-leading ratios
are encouraged, such as the presence of protein modifications on the
target protein that will affect the protein copy number determina-
tions and the presence of non-coding RNAs that might affect the tran-
scriptomics analysis. It is also important to point out that the tissues
analyzed here consist of mixtures of cell types of different origin and
thus only yields the average mRNA and protein levels at steady-state
conditions across all the different cell types in the tissue samples.
In summary, our results suggest that the predictability of protein
copy numbers from RNA levels can be significantly enhanced if a
gene-specific, cell independent RNA-to-protein (RTP) conversion
factor is used. Thus, transcriptome analysis can be used as a power-
ful tool to predict the corresponding protein copy numbers, forming
an attractive link between the field of genomics and proteomics. We
suggest that the gene-specific RNA-to-protein protein conversion
factor should be determined across all protein-coding genes to
provide a basic resource for the medical and life science community.
Materials and Methods
Ethical statement
Human tissue samples used for protein and mRNA expression anal-
yses were collected and handled in accordance with Swedish laws
and regulation and obtained from the Department of Pathology,
Uppsala University Hospital, Uppsala, Sweden, as part of the sample
collection governed by the Uppsala Biobank (http://www.uppsala
biobank.uu.se/en/). All human tissue samples used in the present
study were anonymized in accordance with approval and advisory
report from the Uppsala Ethical Review Board [Reference # 2002-
577, 2005-338 and 2007-159 (protein) and # 2011-473 (RNA)], and
consequently, the need for informed consent was waived by the
ethics committee.
Selection of genes
A selection of 60 genes was initially chosen for the study. Firstly,
genes coding for predicted secreted proteins were excluded based
on a majority decision-based method for secreted proteins (MDSEC)
used for protein classification within the Protein Atlas (http://
www.proteinatlas.org/humanproteome/secretome#prediction).
Secondly, the gene had to be differentially expressed on transcript
level across nine cell lines (A431, HepG2, A549, HeLa, HEK293,
A549, RT4, MCF7, and SH-SY5Y) subjected for the study. Finally,
QPrEST standard had to be available, yielding at least one proteo-
typic peptide as the protein was degraded into peptides by trypsin.
Production and quantification of protein standards forabsolute quantification
An Escherichia coli strain auxotrophic for the amino acids arginine
and lysine (Matic et al, 2011) was used for recombinant production
of heavy isotope-labeled QPrEST standards. DNA fragments were
initially cloned into the expression pAff8c (Larsson, 2000) and were
thereafter transformed into an E. coli strain for recombinant protein
production. Cells containing expression vectors were cultivated in
10 ml minimal media using 100-ml shake flasks as previously
described (Studier, 2005; Tegel et al, 2009). Heavy isotope-labeled
(13C and 15N) versions of lysine and arginine (Cambridge Isotope
Laboratories, Tewksbury, MA, USA) were provided to the cells at
200 lg/ml to generate fully incorporated heavy protein standards.
Cell cultures were harvested, and the QPrESTs were purified using
the N-terminal quantification tag (QTag) that included a hexahistidine
tag used for immobilize metal ion affinity chromatography (IMAC).
After purification, all isotopic QPrEST fragments were absolutely
quantified by mass spectrometry against a non-labeled ultra purified
QTag-standard, which previously had been quantified by amino acid
analysis. The QTag-standard, also including a C-terminal a OneStrep
tag, was purified using IMAC chromatography, and the IMAC elution
buffer was exchanged for 1× PBS (10 mM NaP, 150 mM NaCl, pH
7.3) using a PD-10 desalting column (GE Healthcare, Uppsala,
Sweden). The sample was purified on a StrepTrap HP column (GE
Healthcare) on an Akta explorer system (GE Healthcare) according to
the manufactures protocol. All QPrESTs were quantified by mixing
1:1 with QTag-standard and thereafter digested using an in-solution
trypsin digestion protocol. Proteins were first reduced with 10 mM
dithiothreitol (DTT) for 30 min at 56°C and thereafter followed by
addition of 50 mM iodoacetamide (IAA) and incubated in dark for
20 min. Proteomics grade porcine trypsin (Sigma) was added in a
1:50 enzyme to substrate (E:S) ratio and incubated in a thermomixer
at 37°C. After 16 h, the reaction was quenched by addition of FA and
the sample was desalted using in-house prepared StageTips packed
with Empore C18 Bonded Silica matrix (3M, Saint Paul, MN) (Rappsilber
et al, 2007). Briefly, three layers of octadecyl membrane were placed
in 200-ll pipette tips. The membrane was activated by addition of
100% ACN, followed by centrifugation for 1 min at 840 g. The
membrane was equilibrated by addition of 0.1% FA, MQ followed by
centrifugation for 1 min at 840 g. The sample was acidified prior
addition onto the membrane, followed by centrifugation for 1 min at
840 g. The membrane was washed twice with 0.1% FA, MQ, and the
peptides were eluted in two steps using 60% ACN, MQ. Desalted
peptides were vacuum-dried before subjected for LC-MS analysis.
Preparation of cell pellets
Nine different cell lines (A431, HepG2, A549, HeLa, HEK 293, U2OS,
RT4, MCF7, and SH-SY5Y) were cultivated at 37°C in a humidified
atmosphere containing 5% CO2. HEK-293, MCF7, HeLa, and HepG2
were cultivated in Minimum Essential Medium Eagle (Sigma-
Aldrich, St Louis, MO, USA). A549 and SH-SY5Y were cultivated in
Dulbecco’s modified Eagle’s medium (Sigma-Aldrich). U2OS and
RT4 were cultivated in McCoy’s medium (Sigma-Aldrich), and A431
was cultivated in RPMI-1640 (Sigma-Aldrich). All media were
supplemented with 10% fetal bovine serum (Sigma-Aldrich). Media
for HEK 293, MCF7, HeLa, and HepG2 were supplemented with 1%
MEM non-essential amino acid solution (Sigma-Aldrich), and media
for MCF7 and HepG2 were also supplemented with 1% L-glutamine
(Sigma-Aldrich). The cells were cultivated up to 80% confluence and
counted with a Scepter 2.0 Cell Counter (Merck Millipore, Billerica,
MA, USA) before pellets were collected and stored at �80°C.
RNAseq analysis
For the cell lines, RNA was extracted from the cells using the
RNEasy� kit (Qiagen), generating high-quality total RNA (i.e.,
ª 2016 The Authors Molecular Systems Biology 12: 883 | 2016
Fredrik Edfors et al Correlation of RNA and protein levels Molecular Systems Biology
7
Published online: October 20, 2016
RIN > 8) that was used as input material for library construction
with Illumina TruSeq Stranded mRNA reagents. The samples were
sequenced on the Illumina HiSeq2500 platform to a depth of ~20
million reads. Raw sequences were mapped to the human reference
genome GrCh38 and further quantified using the Kallisto software
(Bray et al, 2016). TPM values for genes were generated by
summing up TPM values for the corresponding transcripts generated
by Kallisto. All cell line data are available at http://www.ncbi.
nlm.nih.gov/bioproject/PRJNA183192.
Procedures for extraction of RNA from tissues, library prepara-
tion, and sequencing have been described elsewhere (Uhlen et al,
2015). Briefly, reads were mapped to the human reference
genome assembly GRCh38 and quantified using Kallisto version
0.42.4. Normalized expression levels (TPM values) on gene level
were obtained by summing the estimated values from the consti-
tuent transcripts of each gene, respectively. All tissue data are
available at http://www.ebi.ac.uk/arrayexpress/experiments/E-
MTAB-1733/.
Cell lysis
Cells were dissolved in lysis buffer (100 mM Tris–HCl, 4% SDS,
10 mM DTT, pH 7.6) and incubated at 95°C in a thermomixer for
5 min at 30 g and thereafter sonicated at 50% amp (1 s pulse, 1 s
hold) for 1 min.
Tissue lysis
Twenty consecutive sections from 11 different fresh-frozen human
tissues (Table EV2) were subjected for analysis. Tissue sections
were disrupted directly from their frozen state by 3-mm tungsten
carbide beads using a Tissue Lyser LT (Qiagen, Hilden, Germany)
set to maximum speed for 2 min. After complete tissue disruption,
250 ll lysis buffer (100 mM Tris–HCl, 4% SDS, 10 mM DTT, pH
7.6) was added and samples were immediately incubated in a
thermomixer for 5 min at 95°C and mixed at 30 g. All samples were
sonicated for 1 min at 50% amplitude (1 s pulse + 1 s hold) and all
clarified by centrifugation at 13,570 g for 10 min.
Filter-aided Sample preparation
One QPrEST mastermix was prepared to represent a 1:1 (L:H)
peptide ratio to the endogenous levels in U2OS and HEK293, and
the same amount of the mastermix was spiked-in also to all other
samples, either to 1 million cells or 600 lg of clarified tissue lysate.
The lysate was diluted with denaturing buffer (8 M urea, 100 mM
Tris–HCl pH 8.5) and centrifuged through a 0.22-lm spin filter
(Corning, Corning, NY, USA). Trypsin digestion was performed
using the previously described filter-aided sample preparation
(FASP) method (Wi�sniewski et al, 2009) After overnight digestion
using porcine trypsin (Sigma) in a 1:50 E:S ratio, all peptides were
extracted from cell line digests and desalted using the same in-house
prepared C18 StageTip protocol as described above. Peptides from
tissue digests (excluding kidney) were all extracted using strong
cation exchange material due to polymers present in the cryopreser-
vative surrounding the fresh-frozen tissue. Briefly, three layers of
strong cation matrix (3M, Saint Paul, MN) were placed in 200-llpipette tips. The membrane was activated by addition of 100%
MeOH, followed by centrifugation for 1 min at 840 g. The
membrane was equilibrated by addition of wash buffer (30%
MeOH, 0.1% FA, MQ) followed by centrifugation for 1 min at
840 g. The sample was acidified prior being added onto the
membrane, followed by centrifugation for 1 min at 840 g. The
membranes were washed twice with wash buffer, and peptides were
then eluted in two steps using elution buffer (33% NH4OH, 30%
MeOH, MQ). Desalted peptides were vacuum-dried before LC-MS
analysis.
Liquid chromatography
Liquid chromatography was performed using an UltiMate 3000
binary RS nano system (Thermo Scientific) with an EASY-Spray
ion source. All samples were stored in their lyophilized state and
resuspended by the autosampler prior injection as 1 lg sample
material was loaded onto a Acclaim PepMap 100 trap column
(75 lm × 2 cm, C18, 3 lm, 100 A), washed 5 min at 0.250 ll/min
with solvent A (95% H2O, 5% DMSO, 0.1% FA), and thereafter
separated using a PepMap 800 C18 column (15 cm × 75 lm, 3 lm).
The gradient went from solvent A to solvent B (90% ACN, 5% H2O,
5% DMSO, 0.1% FA) at a constant flow of 0.250 ll/min, up to 43%
solvent B in 40 min, followed by an increase up to 55% in 10 min
and thereafter a steep increase to 100% B in 2 min. Online LC–MS
was performed using a Q-Exactive HF mass spectrometer (Thermo
Scientific).
Spectral library generation
A pool of 71 QPrESTs representing 60 genes were pooled in equimo-
lar amounts and digested by trypsin according to the in-solution
protocol described above. QPrEST peptides were resuspended in 3%
ACN, 0.1% FA, MQ prior LC-MS analysis, and 50 fmol per QPrEST-
ID was injected onto column. A Top5 MS-method with master scans
performed at 60,000 resolution (mass range 300–1,600 m/z, AGC
3e6) was followed by five consecutive MS2 at 30,000 resolution
(AGC 1e5, underfill ratio 0.1%) with normalized collision energy set
to 25. Raw files were searched using MaxQuant (Cox & Mann,
2008), using the search engine Andromeda against QPrEST
sequences (Table EV4) with an E. coli (BL21 Uniprot-ID:
#UP000002032) background, which was used for recombinant
protein production in order to limit false-positive hits against
QPrEST peptides. Identified peptides were further processed by only
allowing proteotypic peptides mapping to one single human gene
(defined by SwissProt), also excluding peptides with miscleavages
and peptides including methionines.
Data-independent MS acquisition
Full MS master scans at 60,000 resolution (mass range 300–
1,600 m/z, AGC 1e6) were followed by 20 data-independent acquisi-
tions MS/MS at 60,000 resolution (AGC 1e6) defined by a scheduled
parallel reaction monitoring (PRM) method (Table EV5). Precursors
were isolated with a 1.2 m/z isolation window, and maximum injec-
tion time was set to 105 ms for both MS1 and MS2, which resulted
in a duty cycle of 2.7 s. The isolation list was split into two consecu-
tive LC runs, targeting 120 paired light and heavy peptides per
injection.
Molecular Systems Biology 12: 883 | 2016 ª 2016 The Authors
Molecular Systems Biology Correlation of RNA and protein levels Fredrik Edfors et al
8
Published online: October 20, 2016
MS-data evaluation and protein quantification
Raw MS-files (available at: http://www.proteinatlas.org/down
load/prm_cells_tissues.zip) from the data-independent method
were processed using Skyline Proteomics Environment (MacLean
et al, 2010). The ratio between endogenous and heavy peptide
standard was calculated from the summed area intensity over the
retention time for each peptide fragment separately. Here, five
genes were excluded from the analysis as endogenous peptides
could not be successfully quantified. All peptide ratios, in each
replicate separately, were normalized against the amount of
histones quantified in the replicate (Table EV6; Fig EV6) in order
account for quantification errors that arise from differences in
number of cells subjected for analysis, extracellular matrix in
tissue samples, and pipetting errors when spiking in standards.
Median peptide ratios between replicates were used to calculate
the absolute amount of peptide concentration after normalizing for
the absolute and known amount of protein standard that was
spiked to each sample. If more than one peptide assay per protein
was available (13 genes with two peptides, 11 genes with three
peptides, five genes with four peptides, two genes with five
peptides), the median peptide value was used for calculation of
protein concentration for each replicate.
RNA-to-protein conversion factor
Protein values were used to calculate a gene-specific RNA-to-
protein conversion factor by dividing the amount of protein in
each sample by the TPM value for that gene in the corresponding
sample. The gene-specific median of all ratios was used to predict
theoretical protein levels from the RNA level (TPM), that is, RNA-
based prediction, excluding the sample being predicted when
calculating the RNA-to-protein conversion factor from all other 19
samples. In order to assess the predictive power of the conserved
RNA-to-protein conversion factor across all investigated sample
types, different sizes of test and validation sets were used in a
k-fold cross-validation as 5,000 protein predictions were made for
each test set, ranging from 1 to 19 randomly assigned sample
combinations in the training set, predicting all other samples in the
test set.
Equations
Protein amount is dependent on cell size. This calls for a
method that controls the number of cells present in an analyzed
sample, especially when tissue samples as cell counter cannot be
used:
Cellular protein number¼ Total protein concentration
�cell volume(1)
Protein copies per cells is given by:
Protein number per cell ¼ Total protein number
Number of cells(2)
DNA amount is a proxy for number of cells (Milo, 2013) as the
amount of DNA per 2N human cell equals approximately 3.6 pg:
Number of cells � Total DNA mass
3.59 pg DNA per cell(3)
Also, DNA and histones are good proxies for each other as the
number of histones per cell is proportional toward amount of
DNA per cell, that is, same for all 2N human cells (Wi�sniewski
et al, 2014) (note: not applicable for cell lines with different
karyotypes):
Number of histones / DNA length (4)
Number of cells ¼ Number of histones
Number of histones per cell(5)
This is applicable for all 2N human cells and also intra-cell lines
with the same karyotype (i.e., technical replicates):
Protein number per cell / Total protein amount
Number of histones(6)
Expanded View for this article is available online.
AcknowledgementsWe acknowledge the entire staff of the Human Protein Atlas program and the
Science for Life Laboratory for valuable contributions. We thank Jens Nielsen,
Per-Åke Nygren, and Adil Mardinoglu for valuable comments and advice. We
thank the Department of Pathology at the Uppsala Akademiska hospital,
Uppsala, Sweden, and Uppsala Biobank for providing tissue specimens used in
this study. Funding was provided by the Knut and Alice Wallenberg Founda-
tion and Erling Persson Foundation to MU Correspondence and requests for
materials should be addressed to MU.
Author contributionsMU designed the study. FE and BF performed the laboratory work. FE, FD MU,
LK, and BMH did the bioinformatics and statistical analysis. MU, FE, and BF
wrote the manuscript with contributions from EL and FP.
Conflict of interestThe authors declare that they have no conflict of interest.
References
Ahrné E, Molzahn L, Glatter T, Schmidt A (2013) Critical assessment of
proteome-wide label-free absolute abundance estimation strategies.
Proteomics 13: 2567 – 2578
Anderson L, Seilhamer J (1997) A comparison of selected mRNA and protein
abundances in human liver. Electrophoresis 18: 533 – 537
Bray NL, Pimentel H, Melsted P, Pachter L (2016) Near-optimal probabilistic
RNA-seq quantification. Nat Biotechnol 34: 525 – 527
Cancer Genome Atlas Research Network, Weinstein JN, Collisson EA, Mills GB,
Mills Shaw KR, Ozenberger BA, Ellrott K, Shmulevich I, Sander C, Stuart JM
(2013) The Cancer Genome Atlas Pan-Cancer analysis project. Nat Genetics
45: 1113 – 1120
Cox J, Mann M (2008) MaxQuant enables high peptide identification rates,
individualized p.p.b.-range mass accuracies and proteome-wide protein
quantification. Nat Biotechnol 26: 1367 – 1372
ª 2016 The Authors Molecular Systems Biology 12: 883 | 2016
Fredrik Edfors et al Correlation of RNA and protein levels Molecular Systems Biology
9
Published online: October 20, 2016
ENCODE Project Consortium, Kundaje A, Aldred SF, Collins PJ, Doyle F, Epstein
CB, Frietze S, Kaul R, Lajoie BR, Landt SG, Lee B-K, Pauli F, Rosenbloom KR,
Sabo P, Safi A, Sanyal A, Shoresh N, Simon JM, Song L, Trinklein ND et al
(2012) An integrated encyclopedia of DNA elements in the human
genome. Nature 489: 57 – 74
FANTOM Consortium and the RIKEN PMI and CLST (DGT) (2014) A promoter-
level mammalian expression atlas. Nature 507: 462 – 470
Gallien S, Gallien S, Duriez E, Duriez E, Crone C, Crone C, Kellmann M,
Kellmann M, Moehring T, Moehring T, Domon B, Domon B (2012) Targeted
proteomic quantification on quadrupole-orbitrap mass spectrometer. Mol
Cell Proteomics 11: 1709 – 1723
Gerber SA, Gerber SA, Rush J, Rush J, Stemman O, Stemman O, Kirschner MW,
Kirschner MW, Gygi SP, Gygi SP (2003) Absolute quantification of proteins
and phosphoproteins from cell lysates by tandem MS. Proc Natl Acad Sci
USA 100: 6940 – 6945
Gry M, Rimini R, Strömberg S, Asplund A, Pontén F, Uhlén M, Nilsson P (2009)
Correlations between RNA and protein expression profiles in 23 human
cell lines. BMC Genom 10: 365 .
van Holde KE (1989) Chromatin. New York, NY: Springer New York
Larsson M (2000) High-throughput protein expression of cDNA products as a
tool in functional genomics. J Biotechnol 80: 143 – 157
Lawless C, Holman SW, Brownridge P, Lanthaler K, Harman VM, Watkins R,
Hammond DE, Miller RL, Sims PFG, Grant CM, Eyers CE, Beynon RJ, Hubbard
SJ (2016) Direct and absolute quantification of over 1800 yeast proteins via
selected reaction monitoring. Mol Cell Proteomics 15: 1309 – 1322
Lundberg E, Fagerberg L, Klevebring D, Matic I, Geiger T, Cox J, Älgenäs C,
Lundeberg J, MannM, Uhlén M (2010) Defining the transcriptome and
proteome in three functionally different human cell lines.Mol Syst Biol 6: 450
Lundberg E, Uhlén M (2010) Creation of an antibody-based subcellular
protein atlas. Proteomics 10: 3984 – 3996
MacLean B, Tomazela DM, Shulman N, Chambers M, Finney GL, Frewen B,
Kern R, Tabb DL, Liebler DC, MacCoss MJ (2010) Skyline: an open source
document editor for creating and analyzing targeted proteomics
experiments. Bioinformatics 26: 966 – 968
Maier T, Güell M, Serrano L (2009) Correlation of mRNA and protein in
complex biological samples. FEBS Lett 583: 3966 – 3973
Maier T, Schmidt A, Guell M, Kuhner S, Gavin AC, Aebersold R, Serrano L
(2011) Quantification of mRNA and protein and integration with protein
turnover in a bacterium. Mol Syst Biol 7: 511
Matic I, Jaffray EG, Oxenham SK, Groves MJ, Barratt CLR, Tauro S, Stanley-
Wall NR, Hay RT (2011) Absolute SILAC-compatible expression strain
allows Sumo-2 copy number determination in clinical samples. J Proteome
Res 10: 4869 – 4875
Melé M, Ferreira PG, Reverter F, DeLuca DS, Monlong J, Sammeth M, Young
TR, Goldmann JM, Pervouchine DD, Pervouchine DD, Sullivan TJ, Johnson
R, Segrè AV, Djebali S, Niarchou A, GTEx Consortium, Wright FA,
Lappalainen T, Calvo M, Getz G, Dermitzakis ET et al (2015) The human
transcriptome across tissues and individuals. Science 348: 660 – 665
Milo R (2013) What is the total number of protein molecules per cell
volume? A call to rethink some published values. BioEssays 35: 1050 – 1055
Mortazavi A, Williams BA, McCue K, Schaeffer L, Wold B (2008) Mapping and
quantifying mammalian transcriptomes by RNA-Seq. Nat Methods 5: 621– 628
Nagaraj N, Wi�sniewski JR, Geiger T, Cox J, Kircher M, Kelso J, Pääbo S, Mann
M (2011) Deep proteome and transcriptome mapping of a human cancer
cell line. Mol Syst Biol 7: 548
Payne SH (2015) The utility of protein and mRNA correlation. Trends Biochem
Sci 40: 1 – 3
Petryszak R, Keays M, Tang YA, Fonseca NA, Barrera E, Burdett T, Füllgrabe A,
Fuentes AM-P, Jupp S, Koskinen S, Mannion O, Huerta L, Megy K, Snow C,
Williams E, Barzine M, Hastings E, Weisser H, Wright J, Jaiswal P et al
(2016) Expression Atlas update—an integrated database of gene and
protein expression in humans, animals and plants. Nucleic Acids Res 44:
D746 –D752
Rappsilber J, Mann M, Ishihama Y (2007) Protocol for micro-purification,
enrichment, pre-fractionation and storage of peptides for proteomics
using StageTips. Nat Protoc 2: 1896 – 1906
Schwanhäusser B, Busse D, Li N, Dittmar G, Schuchhardt J, Wolf J, Chen W,
Selbach M (2011) Global quantification of mammalian gene expression
control. Nature 473: 337 – 342
Schwanhäusser B, Busse D, Li N, Dittmar G, Schuchhardt J, Wolf J, Chen W,
Selbach M (2013) Corrigendum: global quantification of mammalian gene
expression control. Nature 495: 126 – 127
Studier FW (2005) Protein production by auto-induction in high density
shaking cultures. Protein Expr Purif 41: 207 – 234
Tegel H, Steen J, Konrad A, Nikdin H, Pettersson K, Stenvall M, Tourle S,
Wrethagen U, Xu L, Yderland L, Uhlén M, Hober S, Ottosson J (2009) High-
throughput protein production – Lessons from scaling up from 10 to 288
recombinant proteins per week. Biotechnol J 4: 51 – 57
Thomas JO (1999) Histone H1: location and role. Curr Opin Cell Biol 11:
312 – 331
Uhlén M, Fagerberg L, Hallström BM, Lindskog C, Oksvold P, Mardinoglu A,
Sivertsson Å, Kampf C, Sjöstedt E, Asplund A, Olsson I, Edlund K, Lundberg
E, Navani S, Szigyarto CA-K, Odeberg J, Djureinovic D, Takanen JO, Hober S,
Alm T et al (2015) Proteomics. Tissue-based map of the human proteome.
Science 347: 1260419
Vogel C, Marcotte EM (2012) Insights into the regulation of protein
abundance from proteomic and transcriptomic analyses. Nat Rev Genet
13: 227 – 232
Wilhelm M, Schlegl J, Hahne H, Moghaddas Gholami A, Lieberenz M,
Savitski MM, Ziegler E, Butzmann L, Gessulat S, Marx H, Mathieson T,
Lemeer S, Schnatbaum K, Reimer U, Wenschuh H, Mollenhauer M,
Slotta-Huspenina J, Boese J-H, Bantscheff M, Gerstmair A et al (2014)
Mass-spectrometry-based draft of the human proteome. Nature 509:
582 – 587
Wi�sniewski JR, Zougman A, Nagaraj N, Mann M (2009) Universal
sample preparation method for proteome analysis. Nat Methods 6:
359 – 362
Wi�sniewski JR, Hein MY, Cox J, Mann M (2014) A ‘proteomic ruler’ for protein
copy number and concentration estimation without spike-in standards.
Mol Cell Proteomics 13: 3497 – 3506
Zeiler M, Straube WL, Lundberg E, Uhlén M, Mann M (2012) A Protein
Epitope Signature Tag (PrEST) library allows SILAC-based absolute
quantification and multiplexed determination of protein copy numbers in
cell lines. Mol Cell Proteomics 11: O111.009613
License: This is an open access article under the
terms of the Creative Commons Attribution 4.0
License, which permits use, distribution and reproduc-
tion in any medium, provided the original work is
properly cited.
Molecular Systems Biology 12: 883 | 2016 ª 2016 The Authors
Molecular Systems Biology Correlation of RNA and protein levels Fredrik Edfors et al
10
Published online: October 20, 2016