Embed Size (px)
Citation preview
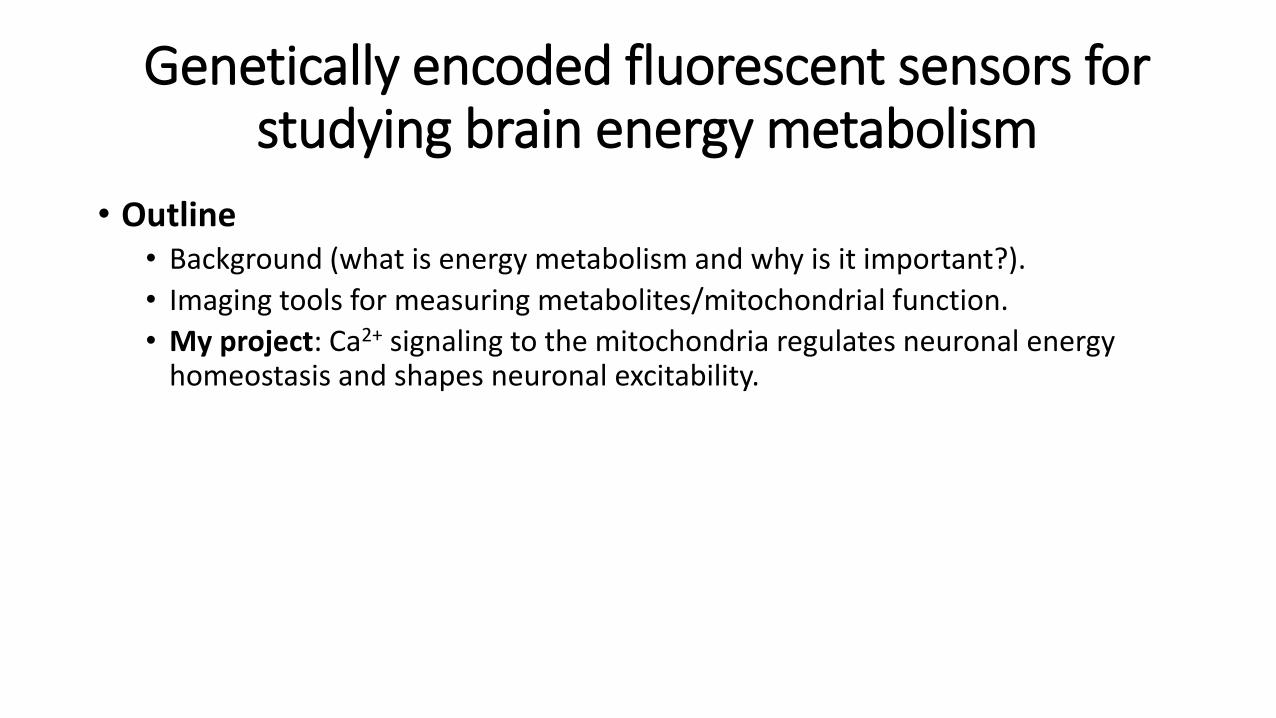
• Outline• Background (what is energy metabolism and why is it important?).
• Imaging tools for measuring metabolites/mitochondrial function.
• My project: Ca2+ signaling to the mitochondria regulates neuronal energy homeostasis and shapes neuronal excitability.
Genetically encoded fluorescent sensors for studying brain energy metabolism
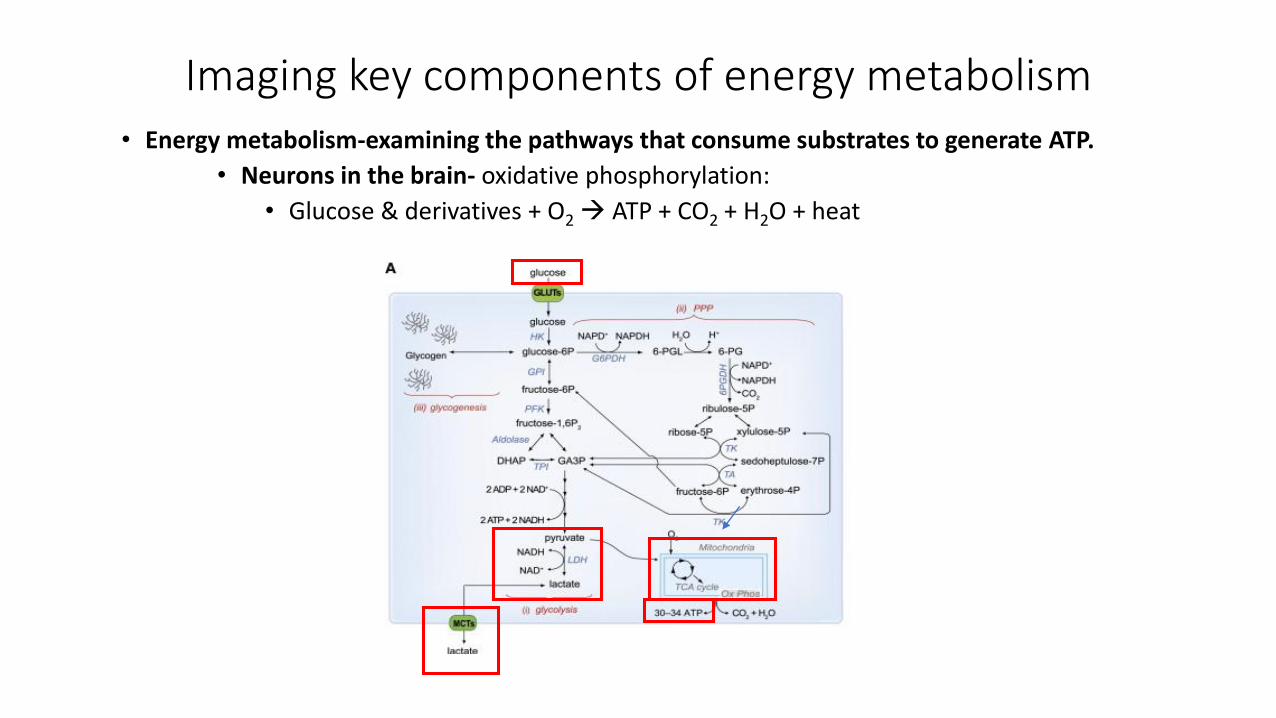
Imaging key components of energy metabolism• Energy metabolism-examining the pathways that consume substrates to generate ATP.
• Neurons in the brain- oxidative phosphorylation:
• Glucose & derivatives + O2 ATP + CO2 + H2O + heat
Brain energy metabolism
• The brain is energy demanding • e.g. brain only comprises 2% of body weight but contributes 20% of whole
body O2 consumption in the resting conscious state (Belanger et al 2011).
• Brain energy consumption is largely driven by information processesing:• ‘Signalling’ and ‘Housekeeping’
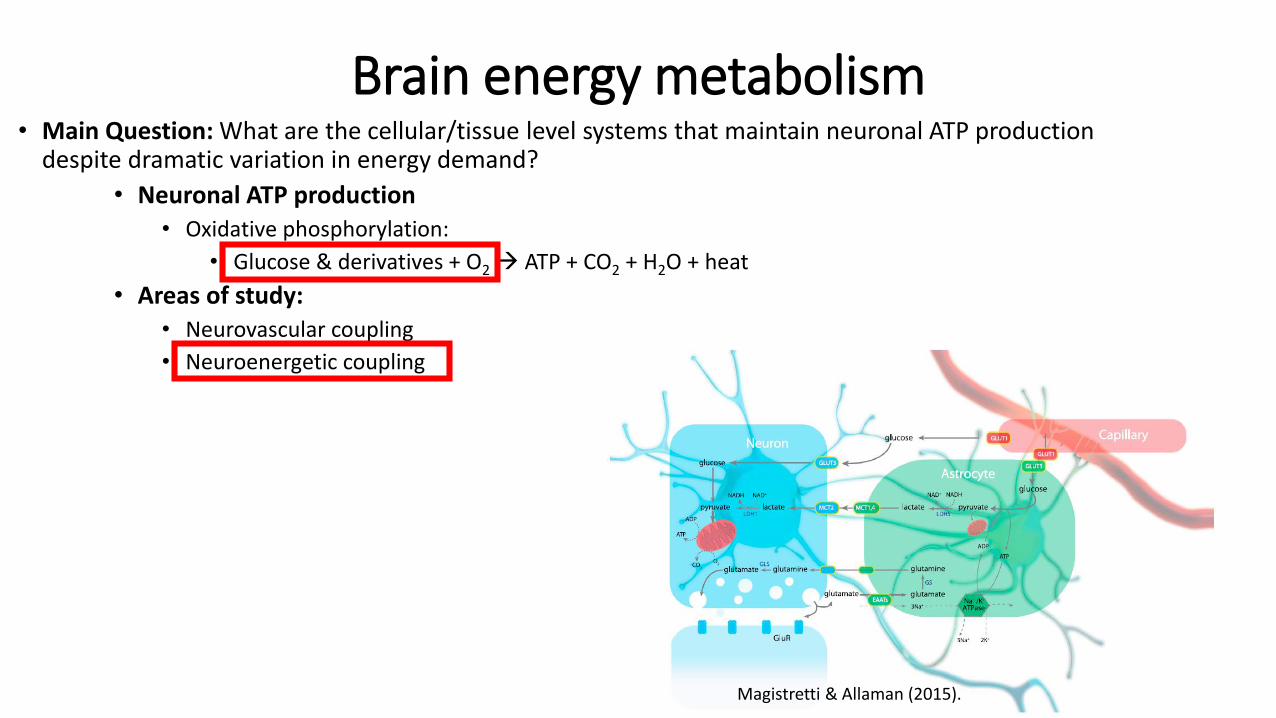
Brain energy metabolism• Main Question: What are the cellular/tissue level systems that maintain neuronal ATP production
despite dramatic variation in energy demand?
• Neuronal ATP production• Oxidative phosphorylation:
• Glucose & derivatives + O2 ATP + CO2 + H2O + heat
• Areas of study:• Neurovascular coupling
• Neuroenergetic coupling
Magistretti & Allaman (2015).
Brain energy metabolism
• Why should we care?
• Energy metabolism is critical for maintaining brain function.• Normal brain function is critically dependent on a stable/adaptable energy supply.
• Disruption of metabolism is implicated in acute/chronic brain disorders.
• Stroke, Parkinson's, Alzheimer’s, etc.
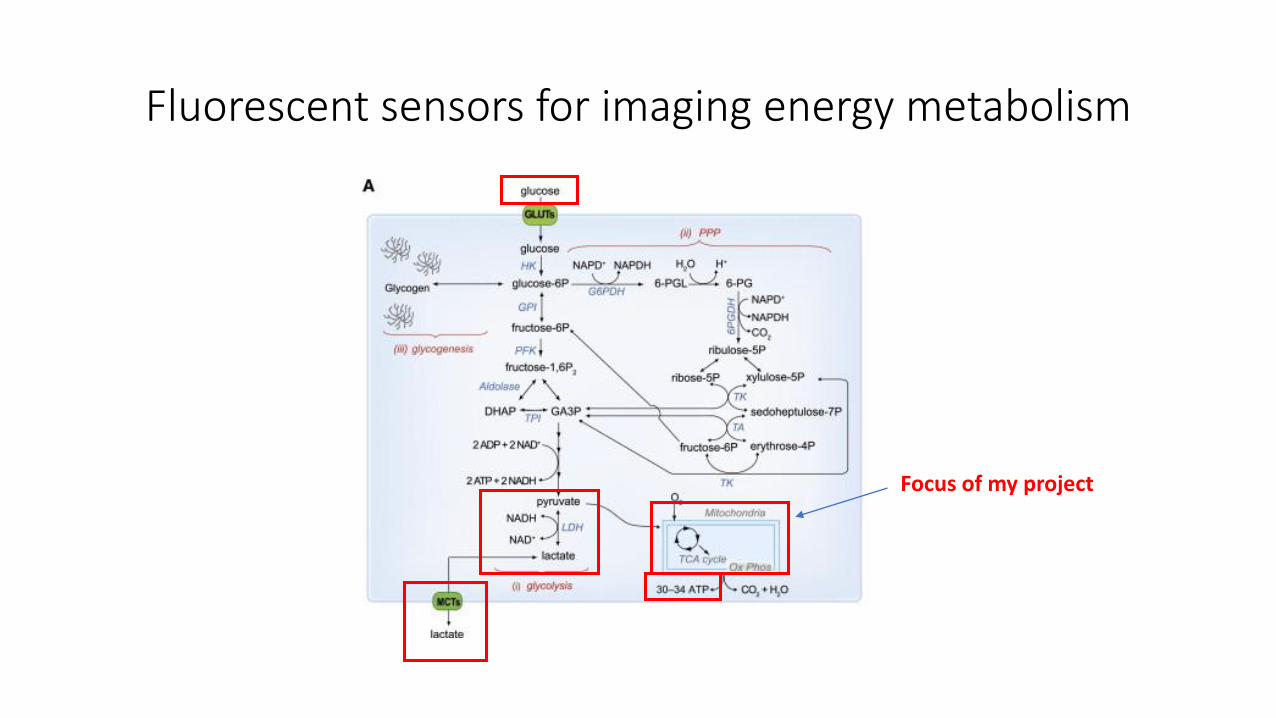
Fluorescent sensors for imaging energy metabolism
Focus of my project
Imaging Glucose
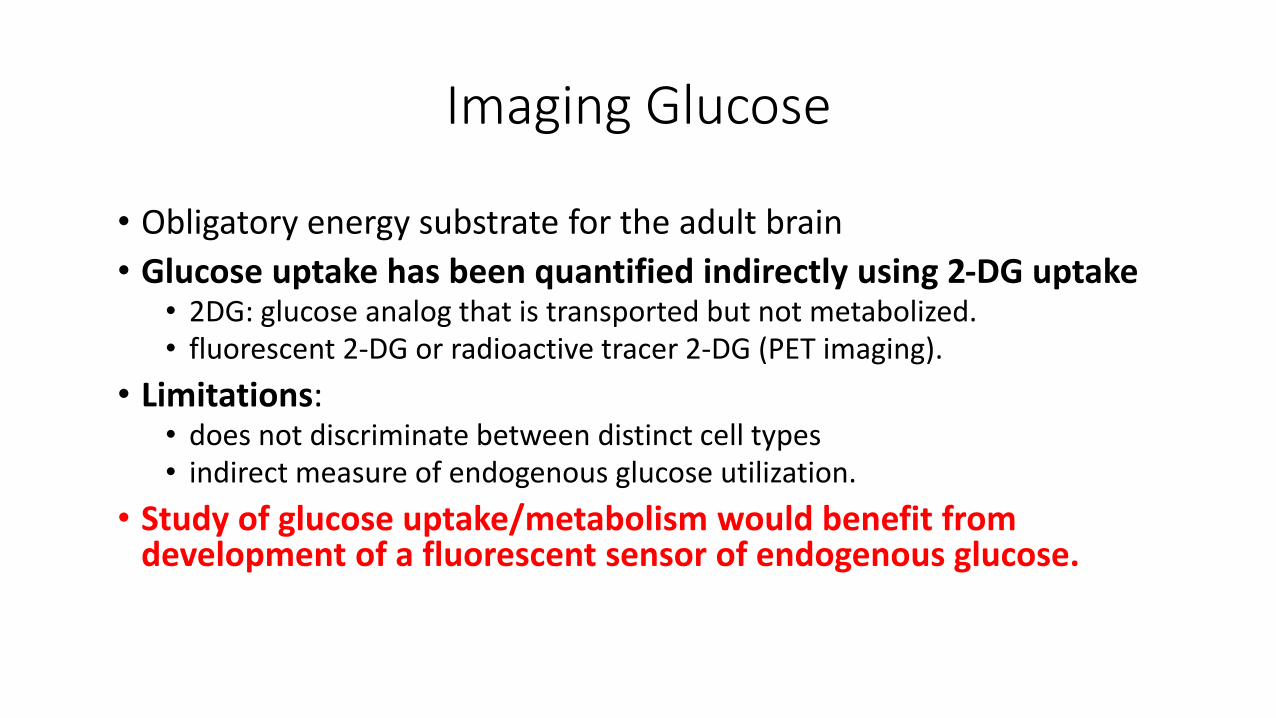
• Obligatory energy substrate for the adult brain
• Glucose uptake has been quantified indirectly using 2-DG uptake• 2DG: glucose analog that is transported but not metabolized.• fluorescent 2-DG or radioactive tracer 2-DG (PET imaging).
• Limitations: • does not discriminate between distinct cell types • indirect measure of endogenous glucose utilization.
• Study of glucose uptake/metabolism would benefit from development of a fluorescent sensor of endogenous glucose.
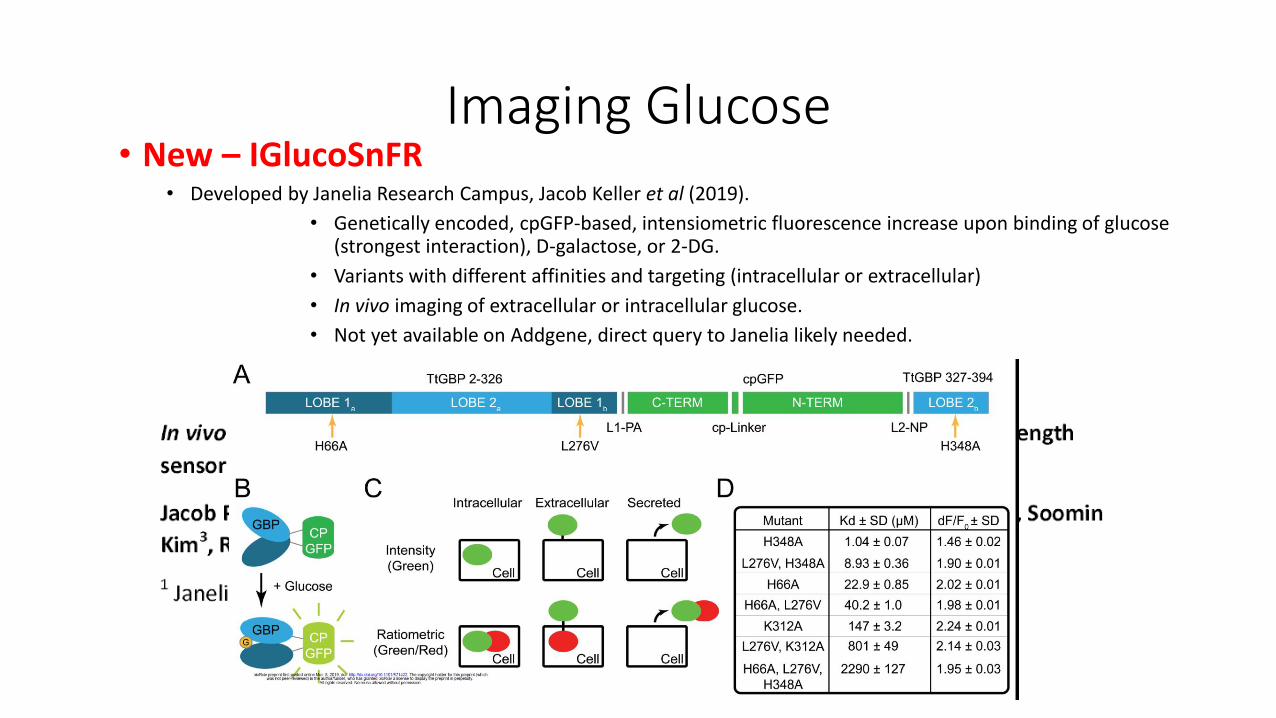
Imaging Glucose• New – IGlucoSnFR
• Developed by Janelia Research Campus, Jacob Keller et al (2019).
• Genetically encoded, cpGFP-based, intensiometric fluorescence increase upon binding of glucose (strongest interaction), D-galactose, or 2-DG.
• Variants with different affinities and targeting (intracellular or extracellular)
• In vivo imaging of extracellular or intracellular glucose.
• Not yet available on Addgene, direct query to Janelia likely needed.
BioRxiv (2019)
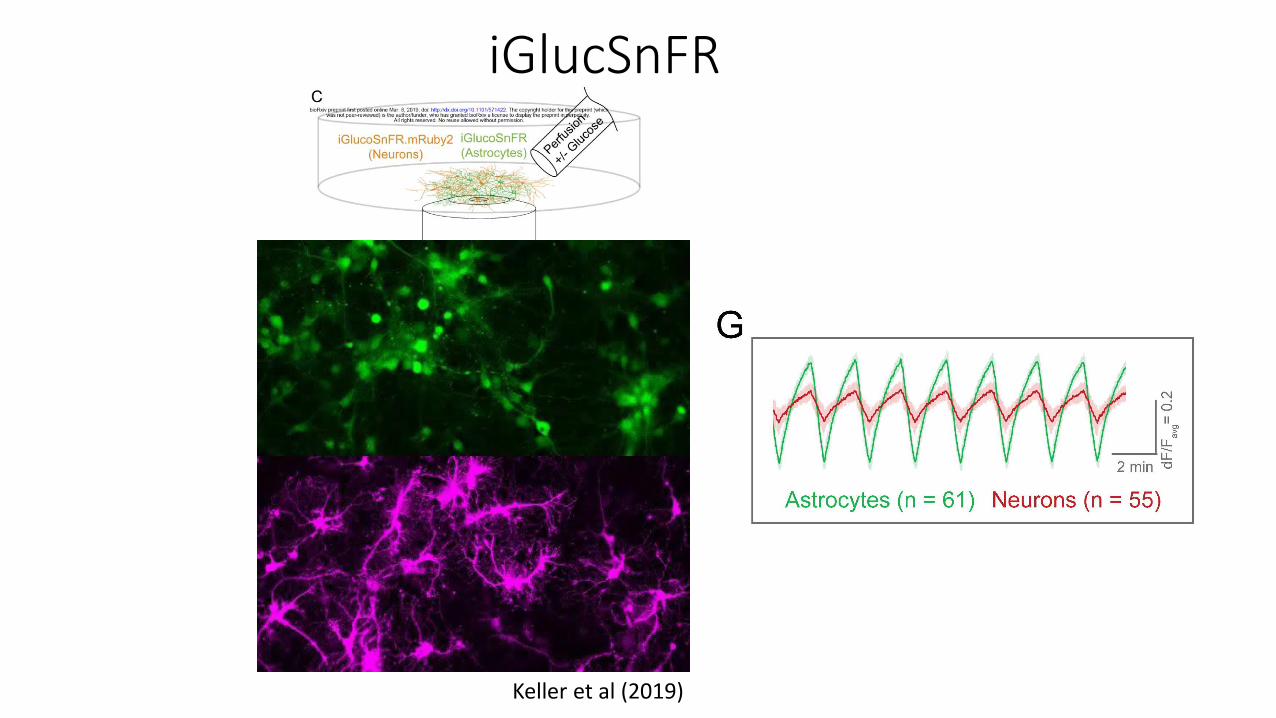
iGlucSnFR
Keller et al (2019)
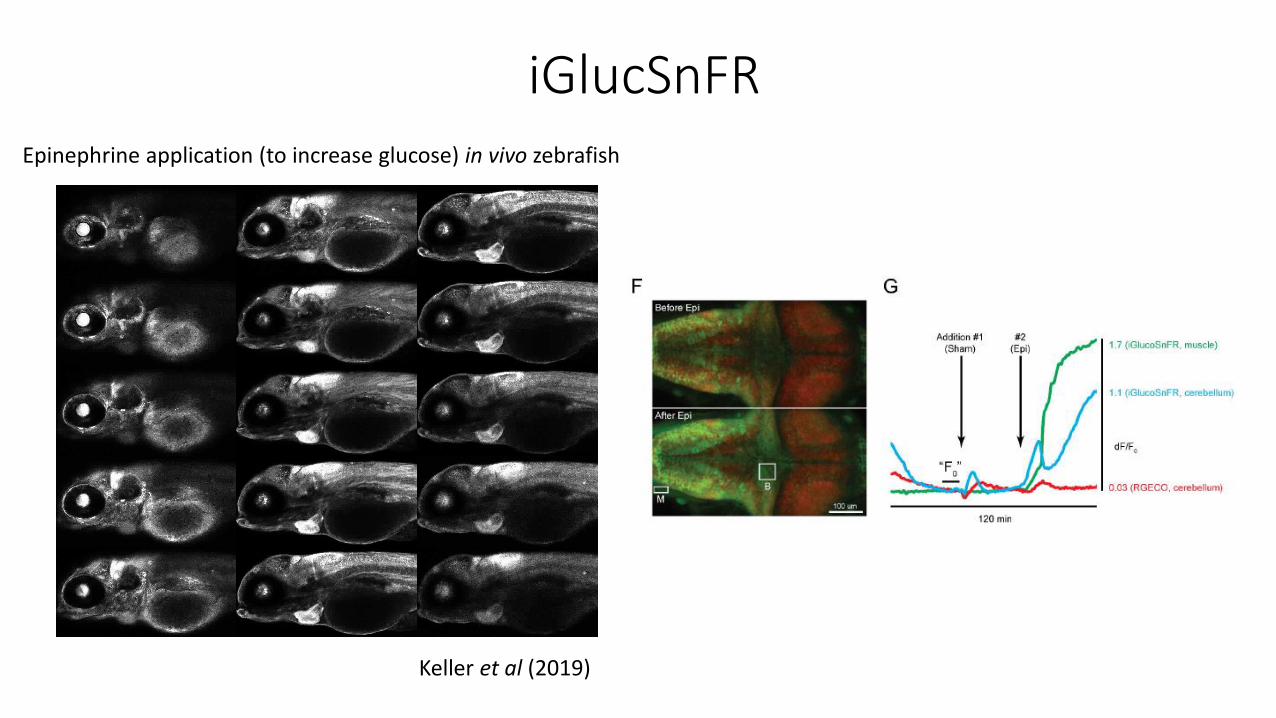
iGlucSnFREpinephrine application (to increase glucose) in vivo zebrafish
Keller et al (2019)
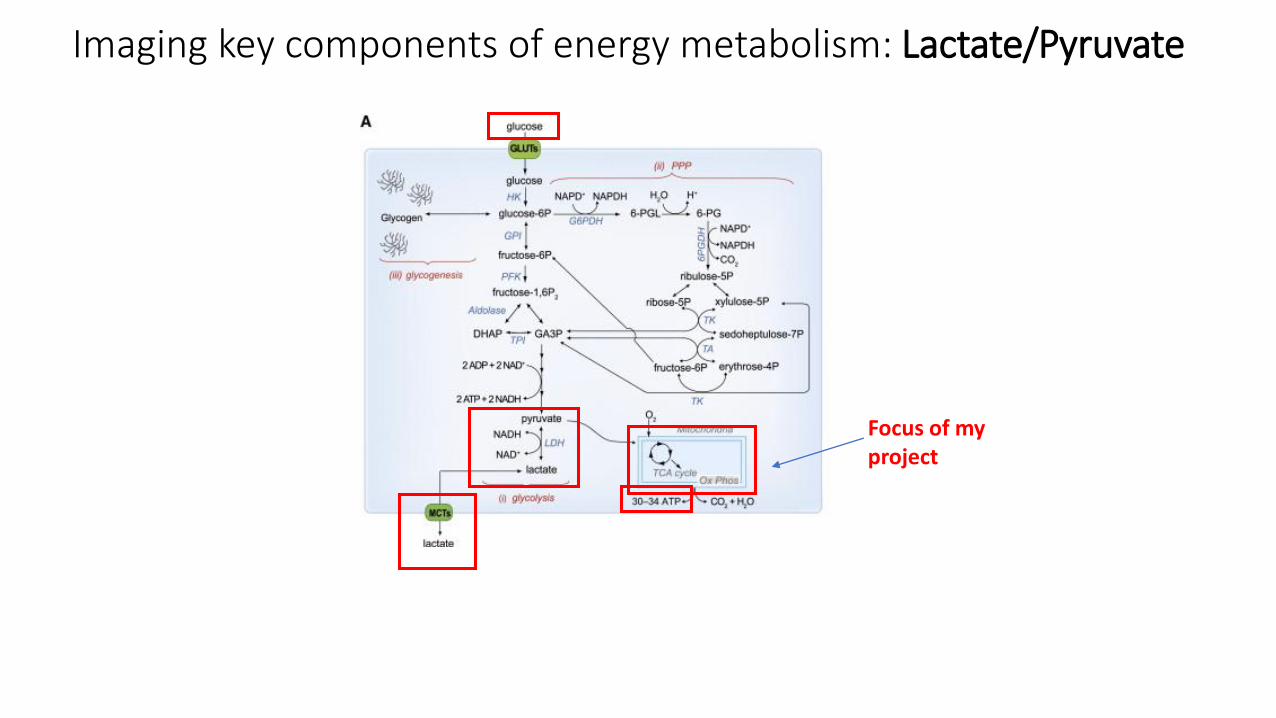
Imaging key components of energy metabolism: Lactate/Pyruvate
Focus of my project
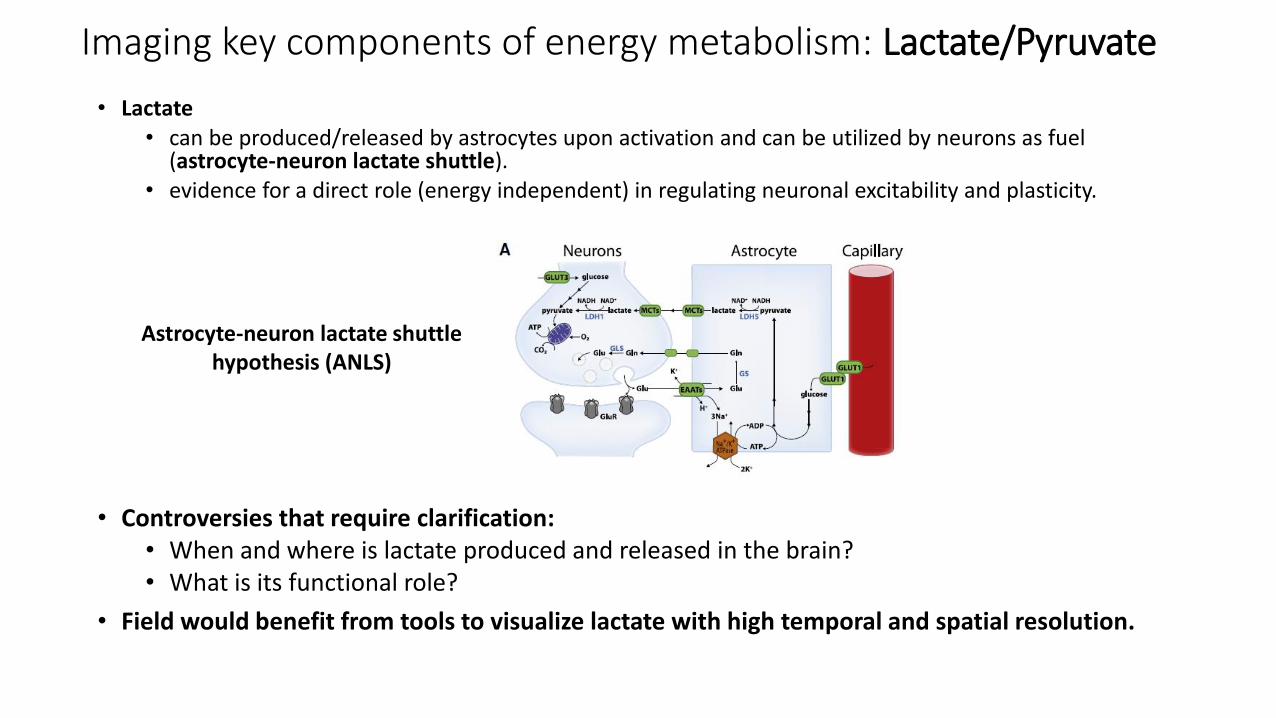
• Lactate• can be produced/released by astrocytes upon activation and can be utilized by neurons as fuel
(astrocyte-neuron lactate shuttle).• evidence for a direct role (energy independent) in regulating neuronal excitability and plasticity.
• Controversies that require clarification: • When and where is lactate produced and released in the brain?• What is its functional role?
• Field would benefit from tools to visualize lactate with high temporal and spatial resolution.
Imaging key components of energy metabolism: Lactate/Pyruvate
Astrocyte-neuron lactate shuttle hypothesis (ANLS)
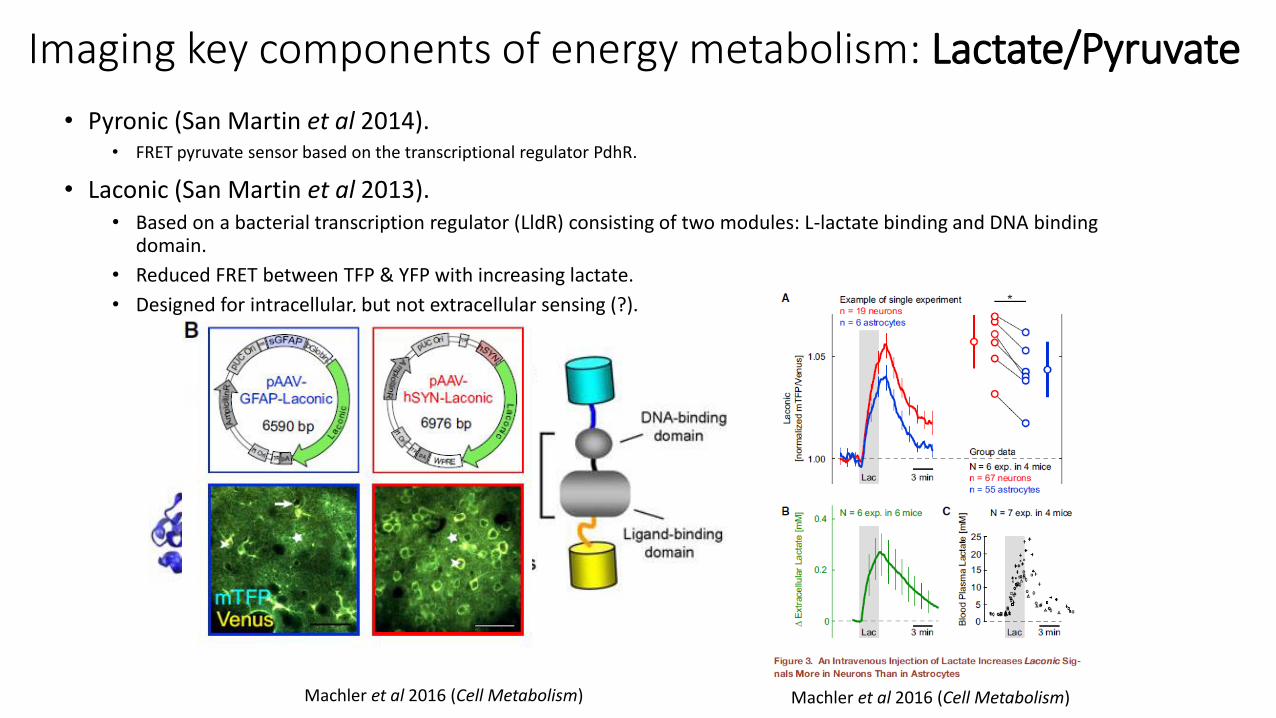
• Pyronic (San Martin et al 2014).• FRET pyruvate sensor based on the transcriptional regulator PdhR.
• Laconic (San Martin et al 2013).• Based on a bacterial transcription regulator (LldR) consisting of two modules: L-lactate binding and DNA binding
domain.
• Reduced FRET between TFP & YFP with increasing lactate.
• Designed for intracellular, but not extracellular sensing (?).
Imaging key components of energy metabolism: Lactate/Pyruvate
San Martin et al (2013)
Machler et al 2016 (Cell Metabolism) Machler et al 2016 (Cell Metabolism)
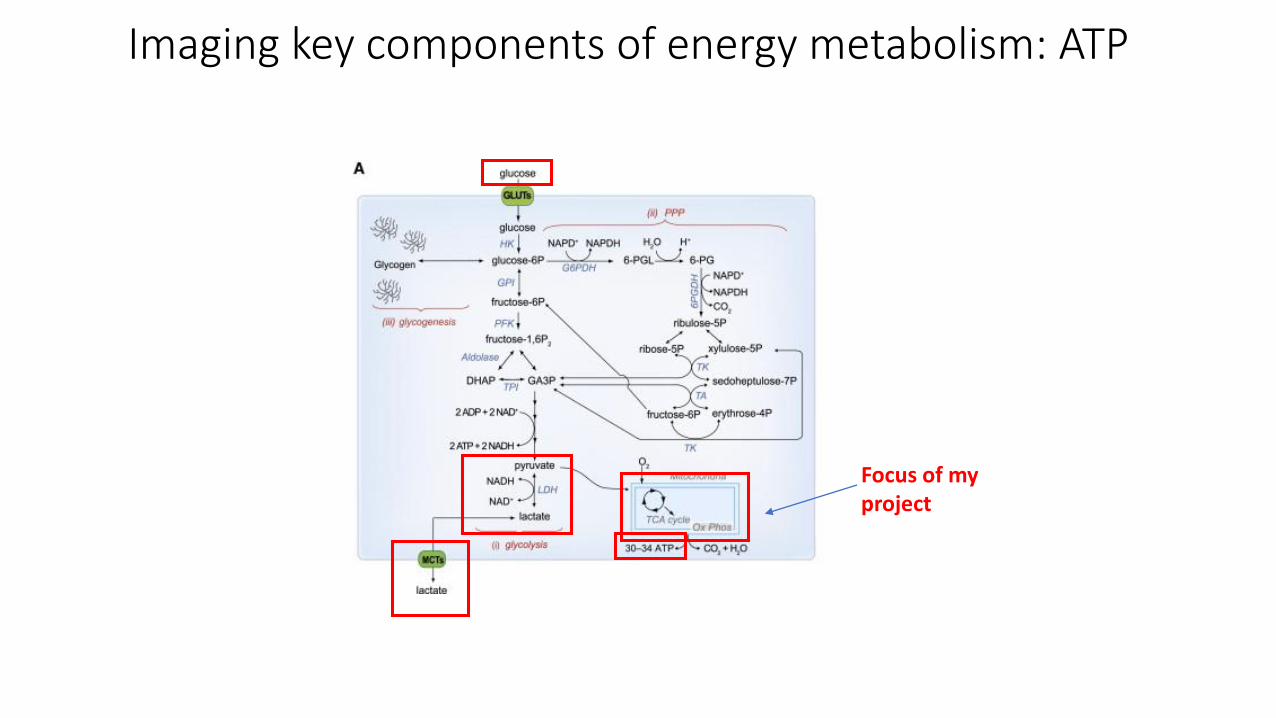
Imaging key components of energy metabolism: ATP
Focus of my project
ATP sensors
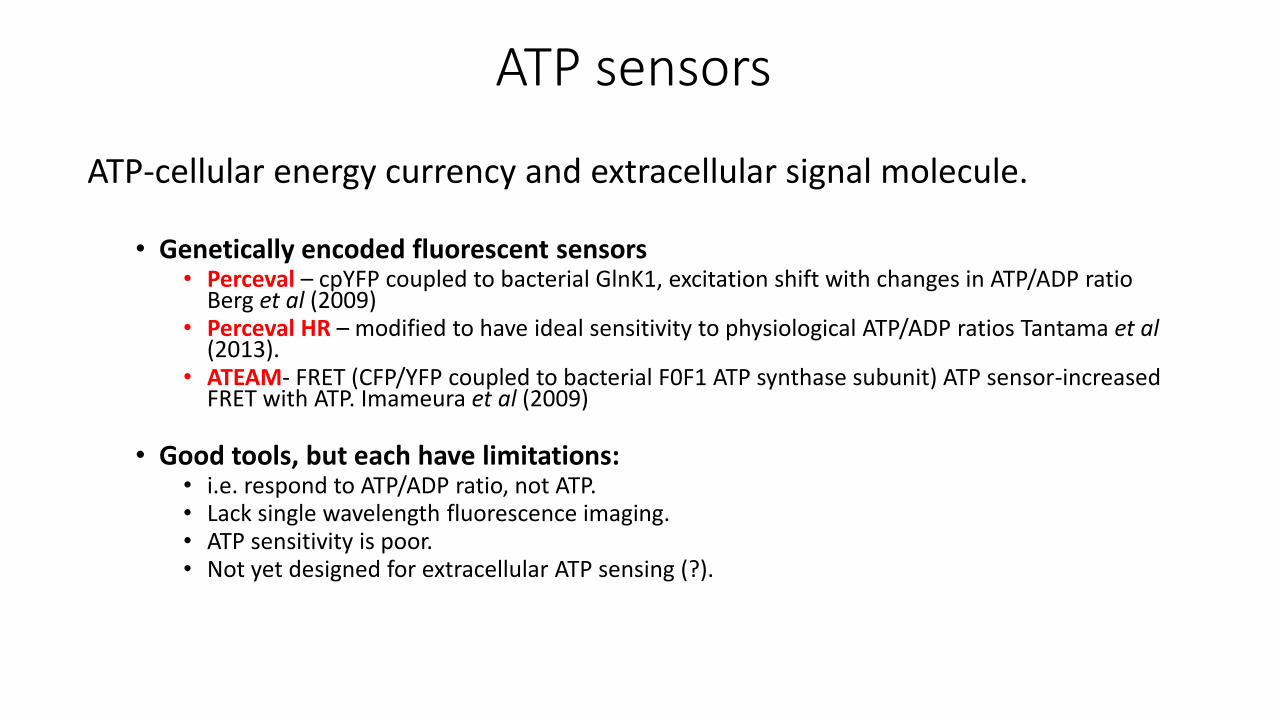
ATP-cellular energy currency and extracellular signal molecule.
• Genetically encoded fluorescent sensors• Perceval – cpYFP coupled to bacterial GlnK1, excitation shift with changes in ATP/ADP ratio
Berg et al (2009)• Perceval HR – modified to have ideal sensitivity to physiological ATP/ADP ratios Tantama et al
(2013).• ATEAM- FRET (CFP/YFP coupled to bacterial F0F1 ATP synthase subunit) ATP sensor-increased
FRET with ATP. Imameura et al (2009)
• Good tools, but each have limitations: • i.e. respond to ATP/ADP ratio, not ATP. • Lack single wavelength fluorescence imaging.• ATP sensitivity is poor.• Not yet designed for extracellular ATP sensing (?).
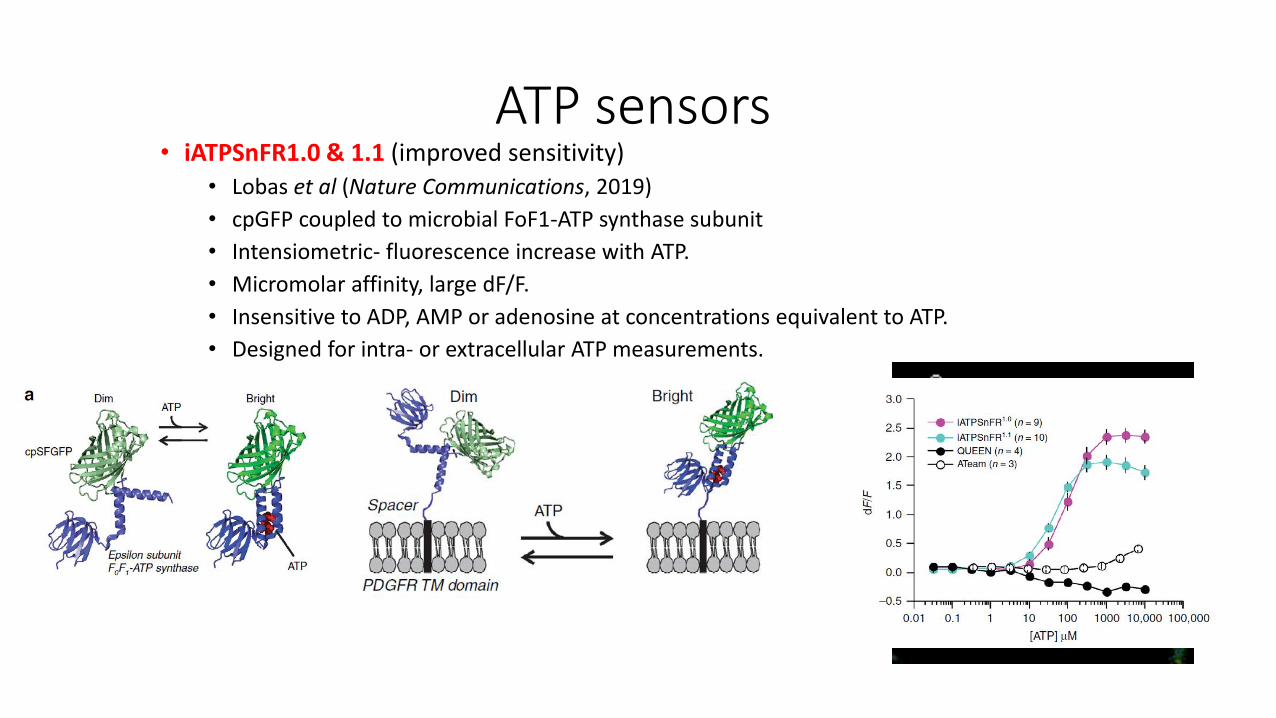
ATP sensors• iATPSnFR1.0 & 1.1 (improved sensitivity)
• Lobas et al (Nature Communications, 2019)
• cpGFP coupled to microbial FoF1-ATP synthase subunit
• Intensiometric- fluorescence increase with ATP.
• Micromolar affinity, large dF/F.
• Insensitive to ADP, AMP or adenosine at concentrations equivalent to ATP.
• Designed for intra- or extracellular ATP measurements.
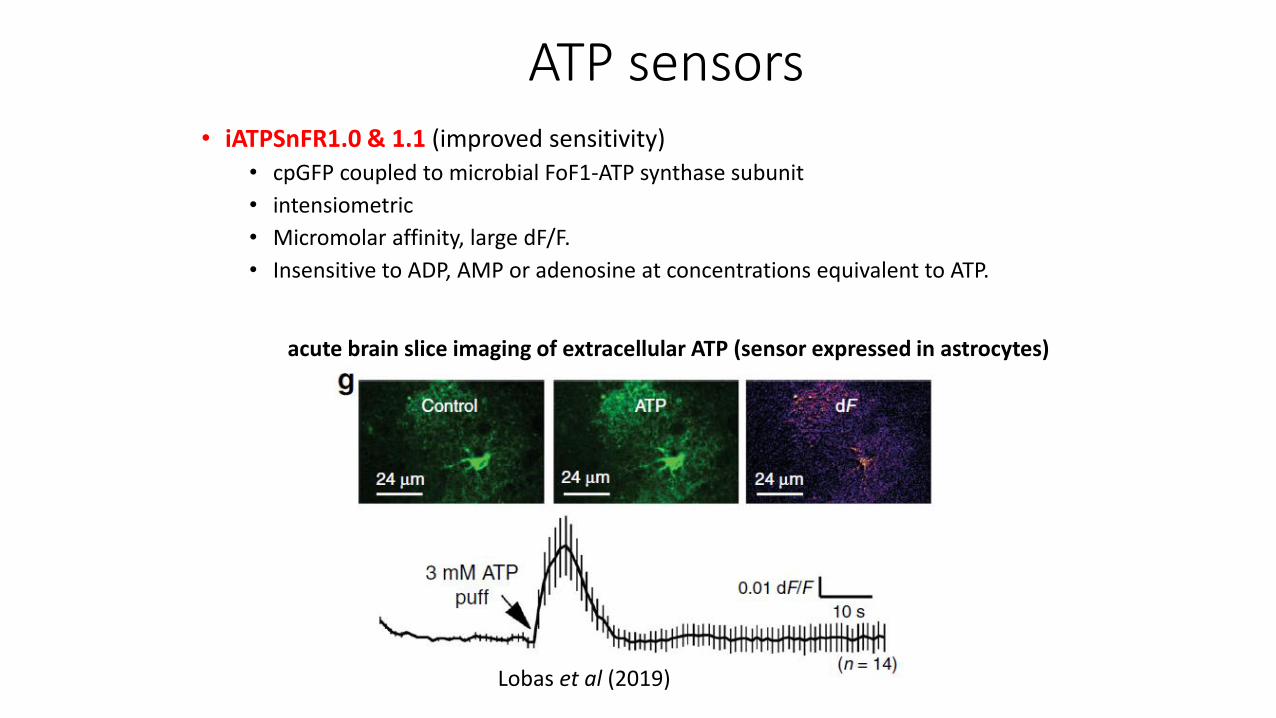
ATP sensors• iATPSnFR1.0 & 1.1 (improved sensitivity)
• cpGFP coupled to microbial FoF1-ATP synthase subunit
• intensiometric
• Micromolar affinity, large dF/F.
• Insensitive to ADP, AMP or adenosine at concentrations equivalent to ATP.
Lobas et al (2019)
acute brain slice imaging of extracellular ATP (sensor expressed in astrocytes)
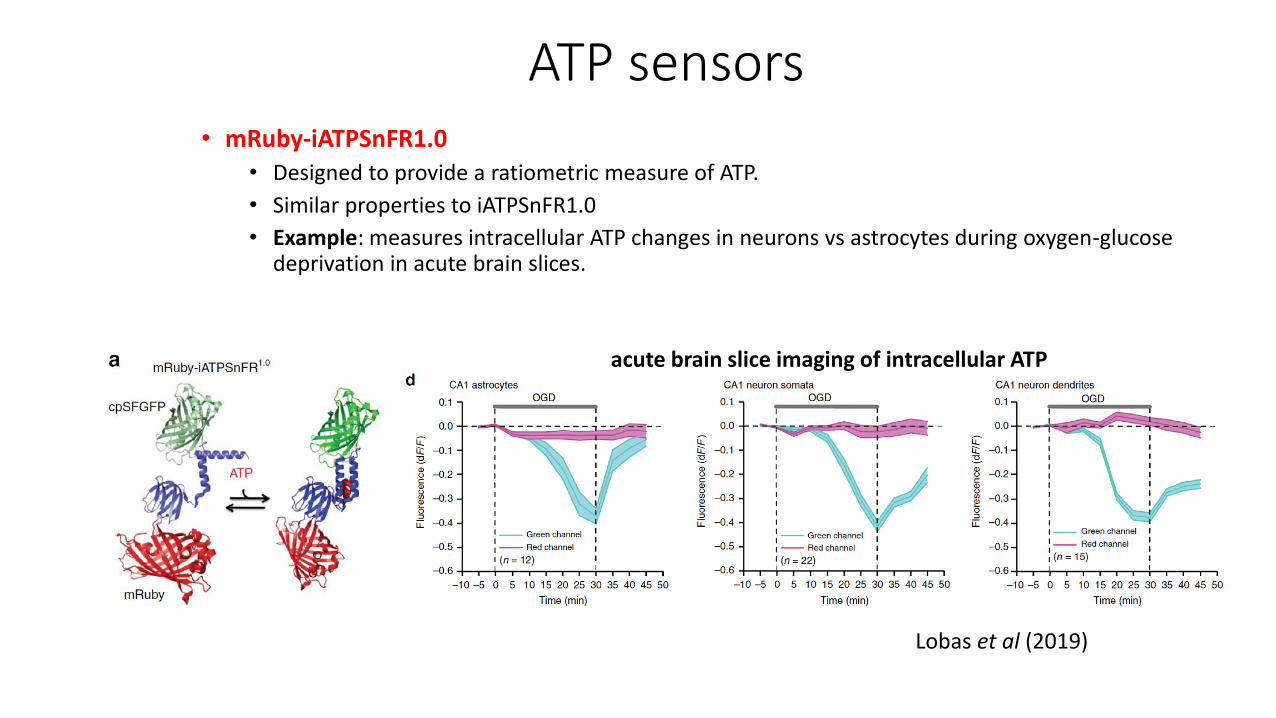
ATP sensors• mRuby-iATPSnFR1.0
• Designed to provide a ratiometric measure of ATP.
• Similar properties to iATPSnFR1.0
• Example: measures intracellular ATP changes in neurons vs astrocytes during oxygen-glucose deprivation in acute brain slices.
Lobas et al (2019)
acute brain slice imaging of intracellular ATP
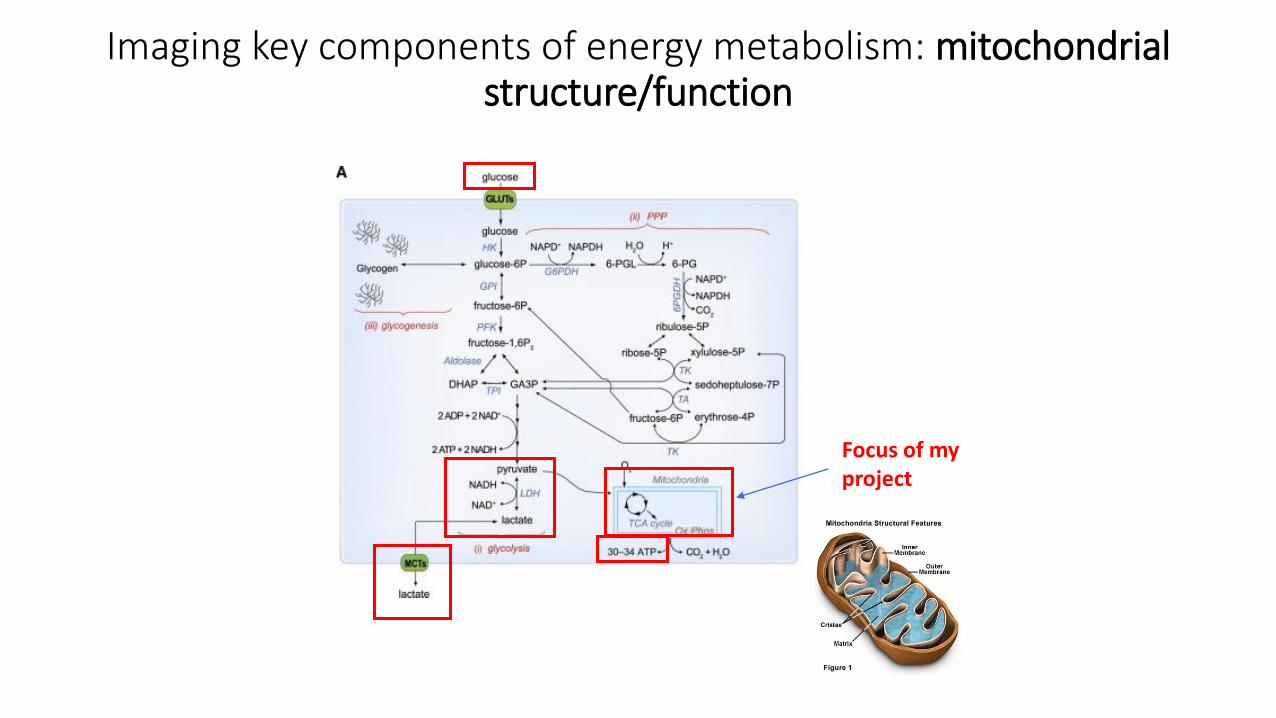
Imaging key components of energy metabolism: mitochondrial structure/function
Focus of my project
Imaging mitochondrial structure/function
• ATP production in neurons is critically dependent on mitochondrial OxPhos. • Other interesting functions:
• ROS, apoptosis, Ca2+ signalling.
• Research questions:• How is mitochondrial function regulated?
• How does mitochondrial function influence and contribute to brain function in health and disease?
• Questions can be addressed by examining mitochondrial properties with imaging.
Imaging mitochondrial structure/function
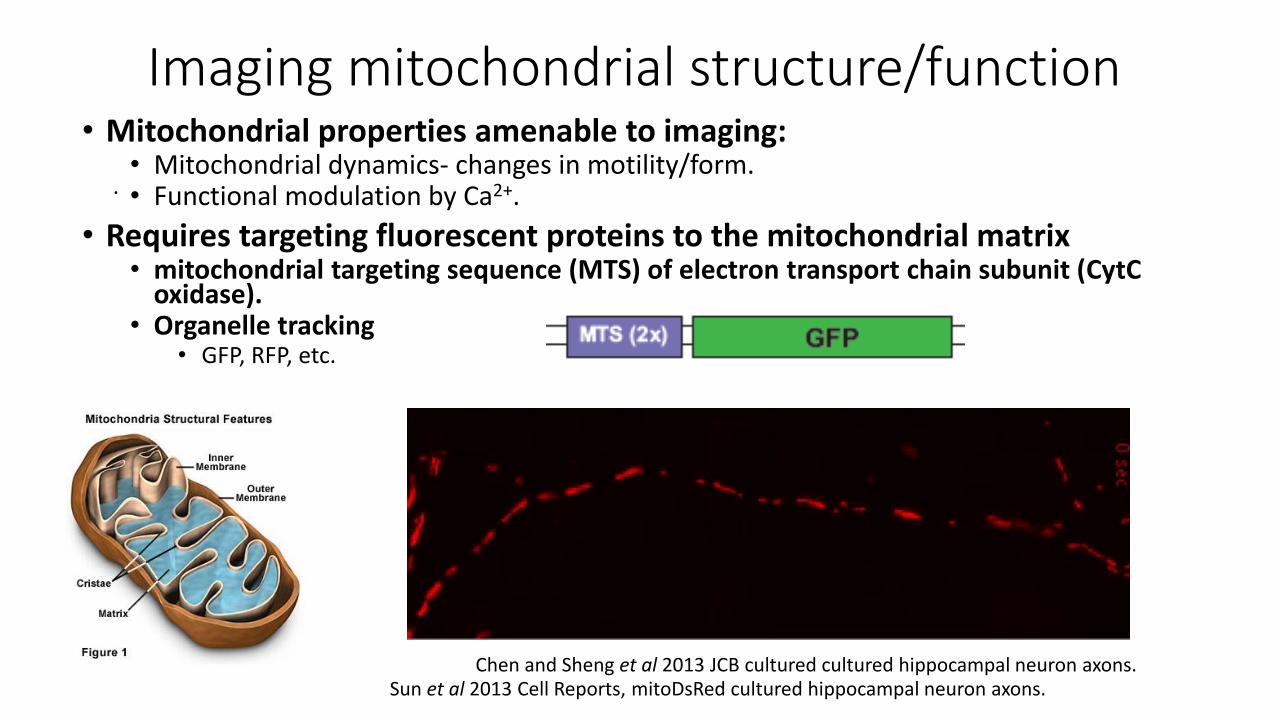
Sun et al 2013 Cell Reports, mitoDsRed cultured hippocampal neuron axons.
.
• Mitochondrial properties amenable to imaging:• Mitochondrial dynamics- changes in motility/form. • Functional modulation by Ca2+.
• Requires targeting fluorescent proteins to the mitochondrial matrix • mitochondrial targeting sequence (MTS) of electron transport chain subunit (CytC
oxidase).• Organelle tracking
• GFP, RFP, etc.
Chen and Sheng et al 2013 JCB cultured cultured hippocampal neuron axons.
Imaging mitochondrial structure/function
.
• Measuring mitochondrial fusion/fission dynamics• Mito dynamics implicated in maintaining mitochondrial quality control
• Mitochondrial photoactivatable GFP (mitoPAGFP)• Photoactivable GFP enables detection and quantification of organelle fusion in living cells.
Archer et al 2013 NEJM, mitochondrial fusion dynamics in vitro.
Imaging mitochondrial structure/function
.
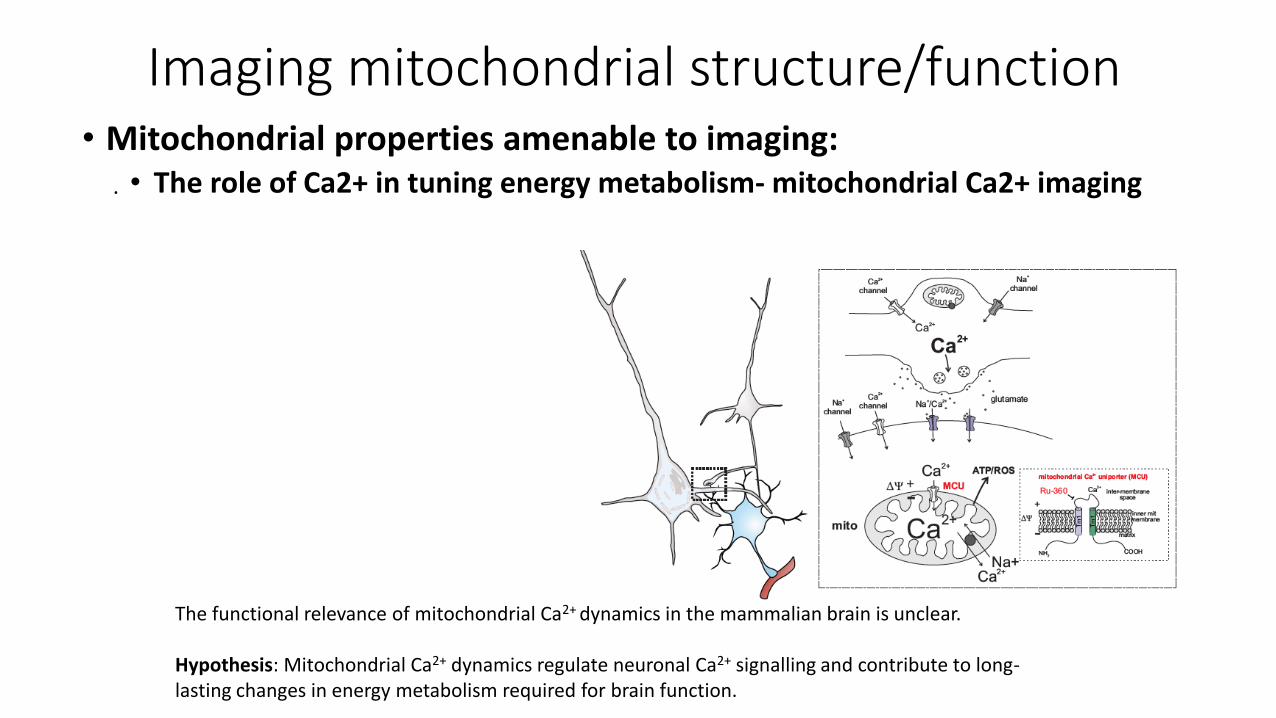
• Mitochondrial properties amenable to imaging:• The role of Ca2+ in tuning energy metabolism- mitochondrial Ca2+ imaging
The functional relevance of mitochondrial Ca2+ dynamics in the mammalian brain is unclear.
Hypothesis: Mitochondrial Ca2+ dynamics regulate neuronal Ca2+ signalling and contribute to long-lasting changes in energy metabolism required for brain function.
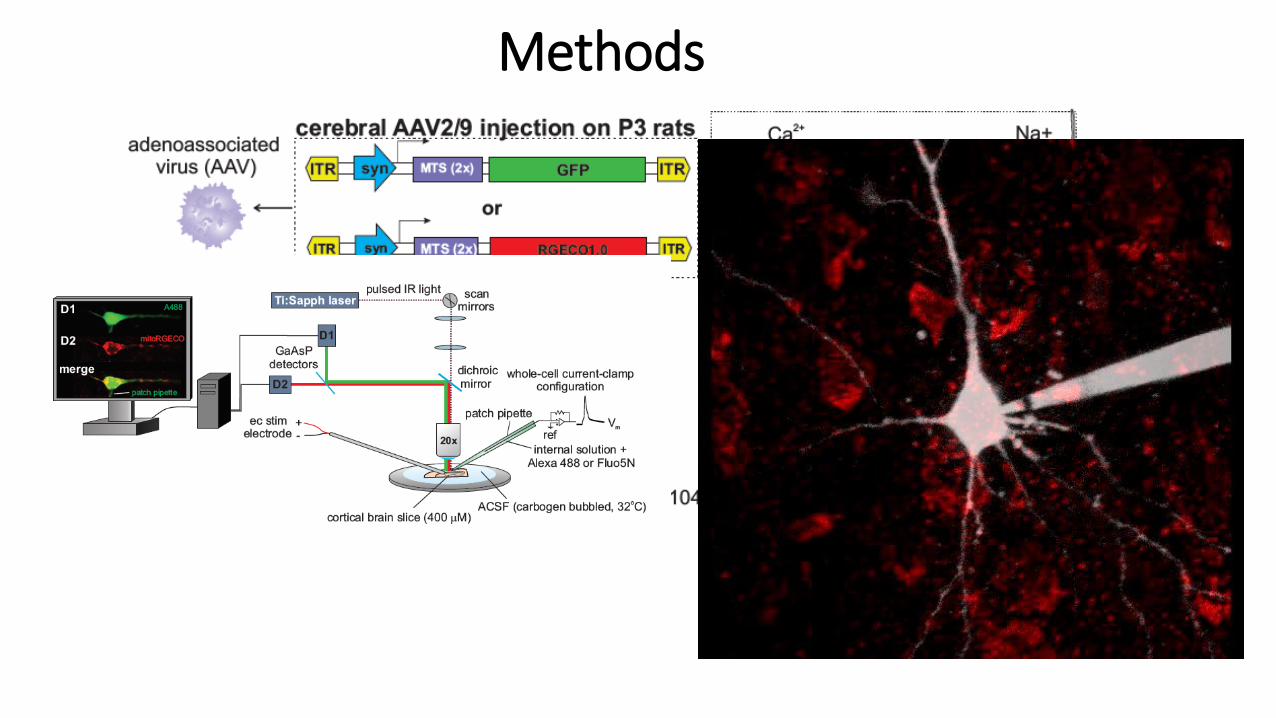
Methods
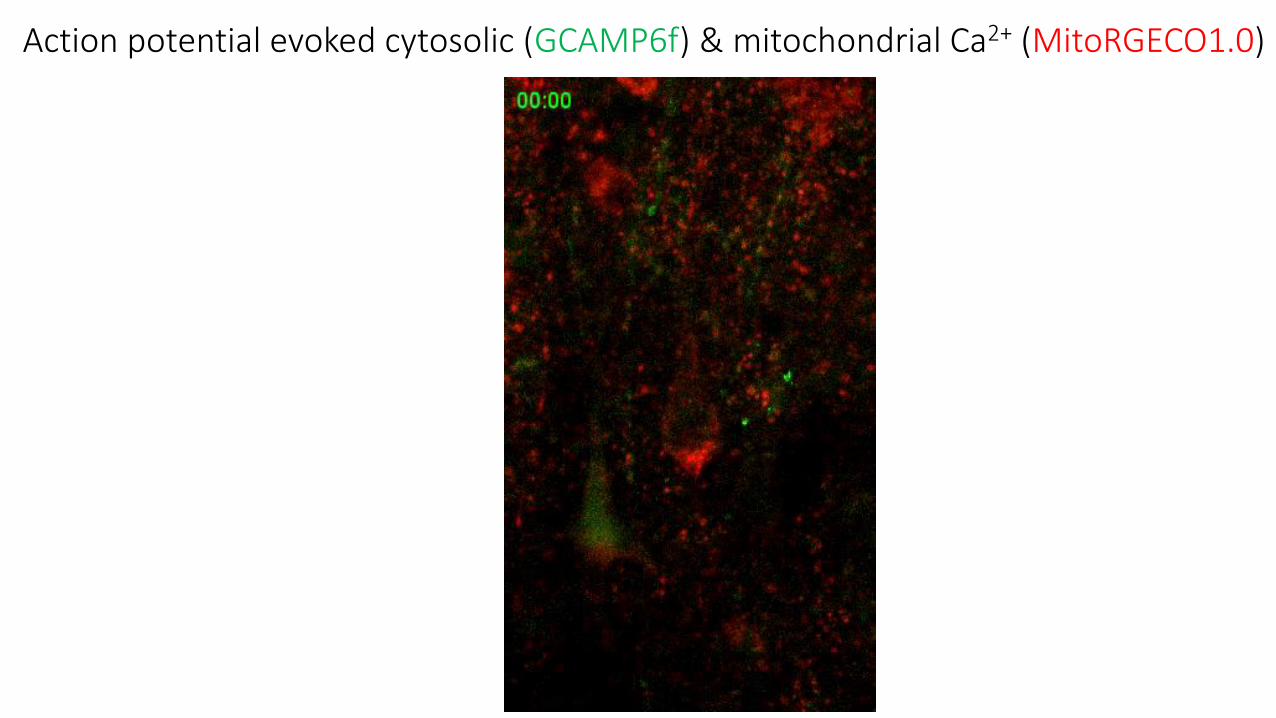
Action potential evoked cytosolic (GCAMP6f) & mitochondrial Ca2+ (MitoRGECO1.0)
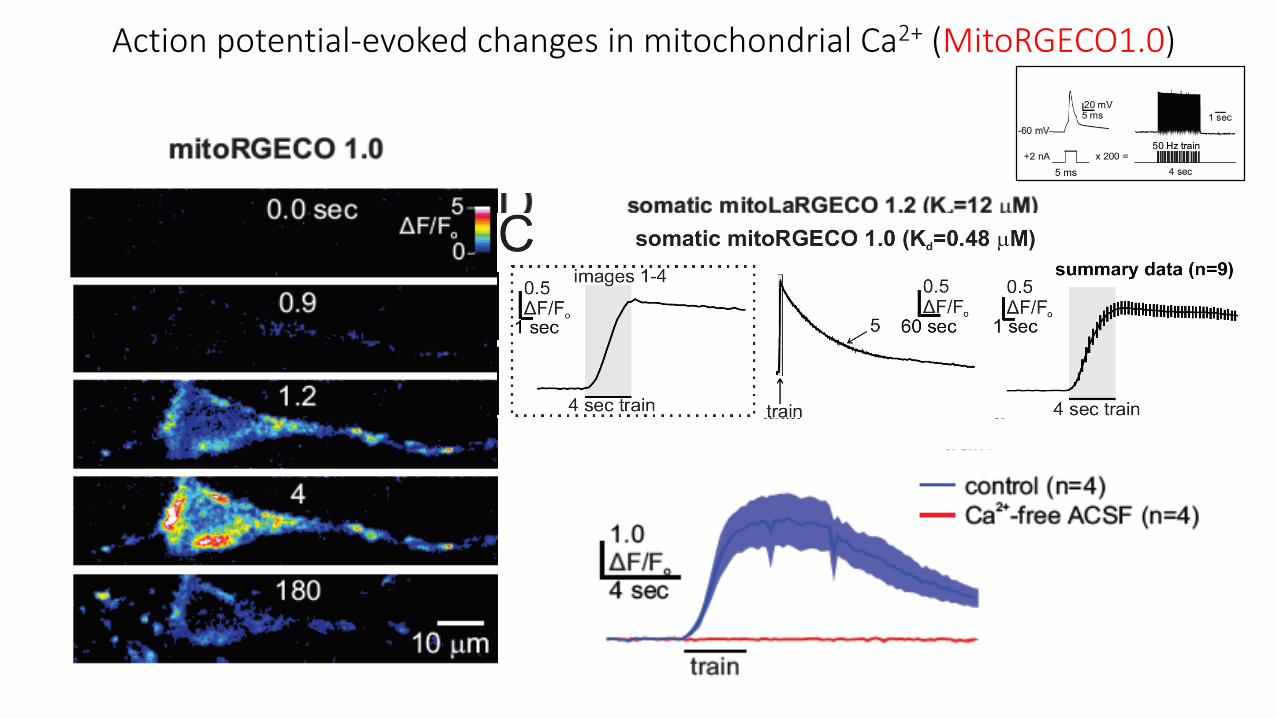
Action potential-evoked changes in mitochondrial Ca2+ (MitoRGECO1.0)