Embed Size (px)
Citation preview
JOURNAL OF VIROLOGY, Apr. 1977, p. 9-15Copyright ©) 1977 American Society for Microbiology
Vol. 22, No. 1Printed in U.S.A.
Genetic Studies of the Ploidy of Moloney MurineLeukemia Virus
J. A. McCARTERCancer Research Laboratory, University of Western Ontario, N6A 5C1, London, Ontario, Canada
Received for publication 16 August 1976
An assay for Moloney murine leukemia virus was developed that made use ofthe production of morphologically altered foci in nonproducer mouse cells (15F)carrying murine sarcoma virus. Wild-type (wt) virus gave a ratio of titers at390C/340C = 1.05 + 0.45 (standard deviation; n = 20). A spontaneous, thermosen-sitive ts) mutant of Moloney murine leukemia virus, ts3, defective in a lateviral function, gave 390C/340C = 0. A murine cell line (TB) was mixedly infectedwith ts3 and wt (multiplicities of infection, 7.8:4.3), cloned after infection, andshown to be infected by both viruses. At 340C it produced wt, ts, and particles ofmixed parentage. The heterozygotes (hz) had ratios of assays 390C/340C = 0.06 to0.84 (mean, 0.36). To eliminate possible interference by multiploid particles withdetermination of the proportions of the three types of particles, the virusproduced by the mixedly infected, cloned cell line at 340C was distributed byvelocity sedimentation in a sucrose gradient, and virus was picked from thelightest part of the gradient. The proportions of ts, wt, and hz were 0.27, 0.26,and 0.47. Those particles identified as hz segregated ts, wt, and hz in theproportions 0.24, 0.27, and 0.49, respectively. These values were not significantlydifferent from those predicted from a diploid model of the genome..
In a recent study (15) the weight-averagemolecular weight for native and subunit RNAspecies of Moloney murine leukemia virus (M-MLV) was measured by using sedimentationequilibrium ultracentrifugation. This method,which yields molecular weights independent ofconformation of the macromolecules, gave amolecular weight of 7.2 x 10⁶ for the nativeRNA and 3.4 x 10⁶ for the subunit species.These data led to the conclusion that the RNAof M-MLV consists of two subunits.
Electron microscopic studies have shown thatthe RNA of several different type C particleviruses consists ofdimers linked at their 5' endsby a secondary structure. Published reports arefor RD-114 (11), an endogenous xenotropic ba-boon virus, woolly monkey virus (12), andFriend virus (6). Although M-MLV has notbeen included, it is unlikely to be different.Measurements of the genetic complexity of
the RNA of M-MLV, based on an analysis ofunique RNase-T,-resistant oligonucleotides,gave a value of 3.5 x 10⁶ daltons, which is inclose agreement with the size of the subunitmeasured by physical means (3). These studiesthus indicated that the genome is diploid. Onthe other hand, earlier data on the complexityof the RNA of M-MLV obtained by hybridizingviral RNA with complementary DNA and
measuring the kinetics of hybridization, ascompared with the rate of hybridization ofpoliovirus RNA with poliovirus-specific DNA(7), gave a value of 9 x 10⁶. This value wouldindicate that the genome is haploid.Because of the nature of the assumptions
made in these molecular biological studies andthe fact that they are ofviral stocks that alwayscontain a minority of viral particles having bio-logical activity, it is important to provide con-firmatory genetic evidence for diploidy. A ge-netic test for diploidy might be made bymixedly infecting a cell with wild-type (wt) M-MLV and a thermosensitive (ts) mutant of thesame virus. Random reassortment of genomicsubunits should yield ts, heterozygotes (hz),and wt in proportions given by the terms of theexpansion of (x + y)2, respectively (9, 19). Ahaploid model would yield ts and wt only, and atriploid model should give ts, hz, and wt inproportion to the terms ofthe expansion of (x +Y)3.
Possible complications would be expected toinclude inefficiency of genetic mixing or selec-tion of one sort of progeny during growth of thevirus. More probably, the production of multi-ploid viral particles might obscure the results.Particles having two cores have been observedoccasionally by electron microscopy and were
9
on May 27, 2018 by guest
http://jvi.asm.org/
Dow
nloaded from
10 McCARTER
much larger than unit particles (14). Particleshaving two cores and twice the volume of a unitparticle together with larger particles withmultiple cores have been estimated by electronmicroscopy to occur in M-MLV, with a fre-quency of approximately 8% (P. H. Yuen andP. K. Y. Wong, personal communication). Weattempted to separate such particles from con-sideration by subjecting the virus to velocitysedimentation, taking only the lightest virusfor analysis, as suggested by Simon (16).We developed a new, direct focus assay for
MLV. The assay is based on the use of cellsdescribed by Ball et al. (1, Table 8) as M15. M15and several clones like it were isolated from amouse cell line infected with a preparation ofMoloney murine sarcoma virus (MSV). Thesecloned cell lines did not appear to be trans-formed, but formed flat monolayers. M15 cellswere subcloned, and one subclone, 15F, hasbeen used for the work reported here. These15F cells do not produce any viral particlesdetectable by [3H]uridine labeling (J. K. Ball,personal communication) or any detectable byreverse transcriptase assays (McCarter, unpub-lished data) and do not express any more gp7l(AKR) than do uninfected TB cells (D. P. Bol-ognesi, personal communication). When 15Fcells are superinfected with MLV, both MSVand MLV are produced and the cells becomemorphologically transformed. It is this propertythat has been made the basis for the directfocus assay. These cells differ from the S+L-cells of Bassin et al. (2) in that 15F cells produceno particles, and they differ from the cell linereported by Hackett and Sylvester (8) in that15F cells contain MSV. These 15F cells havebeen carried over a period of more than 2 yearsand 90 serial passages without losing their flatmorphology or the ability to respond, quantita-tively, in the same way to superinfection withMLV. The properties of 15F cells are currentlyunder investigation.
MATERIALS AND METHODSCells. The origins of TB and 15F cells have been
described (1). Cells were grown in Eagle minimumessential medium supplemented with 10% heat-in-activated fetal calf serum (Grand Island BiologicalCo.), 50 U of penicillin per ml, and 50 gg of strepto-mycin per ml. In some instances, as noted below, 50,ug of gentamicin per ml was used as well (ScheringCorp.). Other conditions of culture are given below.XC cells were obtained from J. Hartley and carriedas described by Klement et al. (10).
Viruses. The origin of the parental wt M-MLVand the isolation of ts mutants ofM-MLV, called tsland ts3, have been described (23). M-MLV tsl is ts inan early function, and ts3 is involved in a very latefunction associated with budding from the cell mem-
brane (21, 22). Stocks of the ts mutants and the wtvirus were grown as described (23) or as given be-low.
Assays for MLV. The XC infectious centers assaywas performed as described by Wong et al. (23).The direct focus assay was performed as follows.
15F cells were grown in T75 flasks (Falcon Plastics)at an initial density of 1 x 10⁶ cells/bottle in 20 ml ofcomplete medium at 37°C in an incubator containing5% CO2 in humidified air. When they approachedconfluence (3 to 4 days), the cells were removed fromthe flasks with trypsin (0.25% in isotonic salinecitrate), centrifuged, and resuspended in completemedium to a concentration of 1 x 10⁶ cells/ml.
Virus was diluted in medium lacking serum andcontaining 25 ,ug of DEAE-dextran (Pharmacia) perml (17). Diluted virus (1.0 ml) was mixed with 1.0 mlof cell suspension (1 x 10⁶ cells) in sterile, disposableplastic tubes (12 by 75 mm; Falcon Plastics) andshaken at 37°C for 20 min. The suspension was thendiluted with complete medium, and 3 ml containing1 x 105 cells was transferred to 35-mm dishes (LuxScientific Corp., Thousand Oaks, Calif.). Culturesinfected with ts mutants were placed at 34°C, thepermissive temperature for focus formation, or at39°C, the nonpermissive temperature for these tsmutants. Maximal focus formation required 5 daysat 34°C and 3 days at 39°C. If the medium was to bereplaced with complete medium containing 0.7%agar, this was done after the cells had attached.Focus formation under agar then took 6 days at 34°Cand 4 days at 39°C. The foci consisted of plaques, 0.5to 1 mm in diameter, formed by the rounding up ofcells within the plaque. For a quantitative assay,the foci were counted alive, using an inverted micro-scope, or cells were fixed with 10% Formol-salineand stained with 0.1% aqueous methylene blue.
Foci were picked by marking all the foci andselecting only those that were far enough from theothers to ensure only a minimal chance of cross-contamination. Cells from the focus were placed in 3ml of complete medium in a 35-mm dish. The dishwas then incubated at 34°C, and the medium wascollected for assay.
Reverse transcriptase assay. Reaction mixturescontained 0.05 M Tris-hydrochloride (pH 8.0), 0.06 MKCl, 2 x 10⁻⁴ M manganese acetate, 0.002 M dithio-threitol, 0.01 absorbance at 260 nm unit ofpoly(rA):oligo(dT),2.18, 2 x 10⁻⁵ M [3H]TTP (5,000cpm/pmol; New England Nuclear Corp.), plus thevirus in 0.1% Triton X-100 in 0.05 M Tris-hydrochlo-ride (pH 8.0) to a final volume of 0.1 ml. The mixturewas incubated at 37°C for 60 min, and then 0.5 ml ofice water and 0.3 ml of 33% trichloroacetic acidsaturated with sodium pyrophosphate was added.The precipitated material was collected on a mem-brane filter (0.45 ,um; Millipore Corp.), washed with5% trichloroacetic acid-50% ethanol, and dried. Theradioactivity was measured by using a liquid scintil-lation spectrometer.
Electron microscopy. Virus preparations wereexamined by a negative-staining technique (4).
Centrifugation. Sterile, linear 10 to 30% sucrosegradients were prepared in complete medium, usingan ISCO model 570 gradient former (Instrument
J. VIROL.
on May 27, 2018 by guest
http://jvi.asm.org/
Dow
nloaded from
GENETIC REASSORTMENT IN MLV 11
Specialties Co., Lincoln, Neb.). The two solutionsused to prepare the gradient were sterilized by fil-tration, and the syringes and tubing of the gradientformer were washed first with 70% ethanol and thenwith sterile distilled water. A 12-ml amount of gra-dient was placed on top of a cushion of 0.3 ml of 65%sucrose in a cellulose nitrate centrifuge tube (0.56 by3.75 inches [ca. 1.4 by 9.5 cm]; Beckman). Afterformation of the gradient, 1 ml of medium in whichthe infected cells had grown was placed on top of thegradient, and the tube was centrifuged at 20,000rpm for 2 h at 4VC in a Spinco SW40 rotor in an L2-65B ultracentrifuge (Beckman). At the end of thattime, the tube was removed from the rotor and 0.2-ml portions were withdrawn from the top of thetube, using an ISCO density gradient fractionatormodel 640 (Instruments Specialties Co., Lincoln,Nebr.). Fractions were assayed for reverse tran-scriptase activity directly by taking 20-.ul portionsfrom the tubes containing the fractions. Assays forinfectious virus were performed by diluting the frac-tions with sterile medium containing 25 ,ug ofDEAE-dextran per ml and lacking serum (17). Thediluted fractions were assayed by using 15F cells inthe direct focus assay. In these assays the mediumalways contained 50 Ag of gentamicin (ScheringCorp.) per ml in addition to penicillin and strepto-mycin.
RESULTSCharacteristics of the direct focus assay.
Table 1 shows that the direct focus assay was
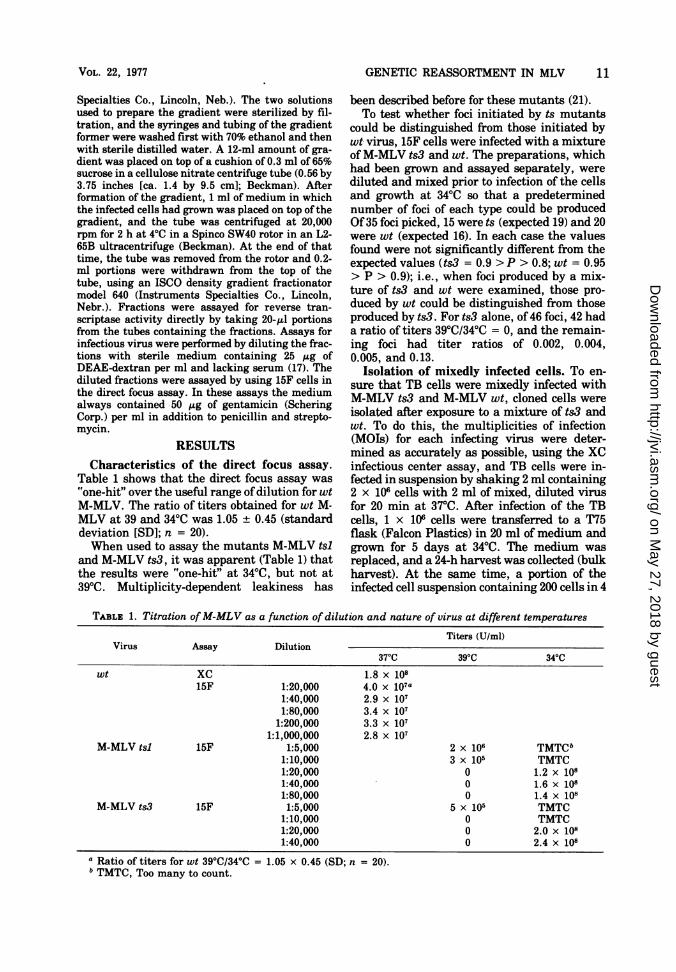
"one-hit" over the useful range ofdilution for wtM-MLV. The ratio of titers obtained for wt M-MLV at 39 and 34WC was 1.05 ± 0.45 (standarddeviation [SD]; n = 20).When used to assay the mutants M-MLV tsl
and M-MLV ts3, it was apparent (Table 1) thatthe results were "one-hit" at 34°C, but not at39°C. Multiplicity-dependent leakiness has
been described before for these mutants (21).To test whether foci initiated by ts mutants
could be distinguished from those initiated bywt virus, 15F cells were infected with a mixtureofM-MLV ts3 and wt. The preparations, whichhad been grown and assayed separately, werediluted and mixed prior to infection of the cellsand growth at 34°C so that a predeterminednumber of foci of each type could be producedOf35 foci picked, 15 were ts (expected 19) and 20were wt (expected 16). In each case the valuesfound were not significantly different from theexpected values (ts3 = 0.9 > P > 0.8; wt = 0.95> P > 0.9); i.e., when foci produced by a mix-ture of ts3 and wt were examined, those pro-duced by wt could be distinguished from thoseproduced by ts3. For ts3 alone, of 46 foci, 42 hada ratio of titers 39°C/34°C = 0, and the remain-ing foci had titer ratios of 0.002, 0.004,0.005, and 0.13.
Isolation of mixedly infected cells. To en-sure that TB cells were mixedly infected withM-MLV ts3 and M-MLV wt, cloned cells wereisolated after exposure to a mixture of ts3 andwt. To do this, the multiplicities of infection(MOIs) for each infecting virus were deter-mined as accurately as possible, using the XCinfectious center assay, and TB cells were in-fected in suspension by shaking 2 ml containing2 x 106 cells with 2 ml of mixed, diluted virusfor 20 min at 37°C. After infection of the TBcells, 1 x 10c cells were transferred to a T75flask (Falcon Plastics) in 20 ml of medium andgrown for 5 days at 34°C. The medium wasreplaced, and a 24-h harvest was collected (bulkharvest). At the same time, a portion of theinfected cell suspension containing 200 cells in 4
TABLE 1. Titration ofM-MLV as a function of dilution and nature of virus at different temperatures
Titers (U/mi)Virus Assay Dilution
370C 390C 340Cwt XC 1.8 x 10⁸
15F 1:20,000 4.0 x 10⁷a1:40,000 2.9 x 1071:80,000 3.4 x 10⁷
1:200,000 3.3 x 1071:1,000,000 2.8 x 10⁷
M-MLV tsl 15F 1:5,000 2 x 10⁶ TMTCb1:10,000 3 x 10⁵ TMTC1:20,000 0 1.2 x 1081:40,000 0 1.6 x 1081:80,000 0 1.4 x 10⁸
M-MLV ts3 15F 1:5,000 5 x 10⁵ TMTC1:10,000 0 TMTC1:20,000 0 2.0 x 1081:40,000 0 2.4 x 10⁸
a Ratio of titers for wt 390C/340C = 1.05 x 0.45 (SD; n = 20).b TMTC, Too many to count.
VOL. 22, 1977
on May 27, 2018 by guest
http://jvi.asm.org/
Dow
nloaded from
12 McCARTER
ml ofmedium was transferred to 60-mm dishes.After the cells had attached, the medium wasremoved and replaced with medium containing0.7% agar. The dishes were incubated at 34WCfor 7 days and then, from 10 individual, well-spaced colonies for each set of MOIs, cells weretransferred to 35-mm dishes containing 3 ml ofmedium and incubated at 340C. These cellswere cultured, transferred, and grown to con-fluence in T25 flasks (Falcon Plastics) at 340C.The medium in which the cells had grown wascollected for assay. The cells were transferredas they reached confluence to new T25 flasks,and the medium in which they had grown wasassayed each time they had grown to conflu-ence. Table 2 shows the results obtained byassay of the so-called "bulk harvest" derivedfrom the growth of 1 x 10⁶ cells infected at eachset of ratios of MOIs of ts3 and wt and thoseaveraged for 10 colonies examined at passage 4for the same sets of MOIs.
First, it was found (Table 2) that, for each setof MOIs, all 10 colonies tested were infected.Second, the ratio of titers 390C/340C averagedfor the 10 colonies of a set was not significantlydifferent from the value for the correspondingbulk harvest. Third, the value of the ratio oftiters 390C/340C appeared to be correlated withthe ratio of MOIs used to establish the infec-tion.
In a preliminary experiment, one of thecloned cell cultures was selected for the setwt:ts3 = 4.3:31 at passage 4. The virus producedby this clone had a ratio of titers 390C/340C =0.17. It was diluted, filtered through a mem-brane filter (0.45 aum; Millipore Corp.), andused to infect 15F cells for the production of fociat 340C under agar, as described above.Twenty-one foci were picked and grown up, andthe virus was assayed at 34 and 390C. The virusgrown up from each focus was then used to
TABLE 2. Mixed infection of TB cells with M-MLVts3 and M-MLV wt at different MOIsa
Bulk harvestMOI of Clones (390C/wt/ts3 Titer (FFUb/ 39°/34°C ratio 34WC ratio)
ml)
4.3:31 6.6 x 10⁷ 0.22 ± 0.09c 0.21 + 0.084.3:7.8 5.6 x 10⁷ 0.54 ± 0.06 0.43 ± 0.13
17.1:7.8 6 x 10⁷ 0.50 ± 0.04 0.77 ± 0.12
n = 4 each n = 10 eacha Titer at 34°C and ratio of titers 39°C/34°C as a
function of MOI for bulk harvest and the ratio 390C/34WC for cloned, mixedly infected cells.
b FFU, Focus-forming unit.e Mean + SD.
infect 15F cells so that new foci would result,and, for each ofthe 21 foci, 10 new foci producedat 340C were picked, grown up, and assayed. Ofthe 21 foci picked, 4 had 390C/340C ratios = 0,and subfoci were also ts. These four foci were,therefore, unambiguously ts. For a ratio 390C/340C = 0.17, a haploid model predicts the pro-portion ts = 0.83; i.e., there should have been17 or 18 foci that were ts. The observed value issignificantly different (P = 0.01) (13) from thevalue expected of a haploid genome. Of the re-maining 17 foci, 10 appeared to be wt on thebasis of the ratio of titers 390C/340C and subfoci,and 7, on the basis of what we learned later(see Table 4) and from the recovery of ts virusamong the subfoci of 2 of them, were hz. Ac-cording to Hardy-Weinberg equilibrium (9, 19),a value of 4/21 = ts predicts 7/21 for wt and10/21 for hz. The numbers found are not sig-nificantly different from these predicted values:according to Mainland et al. (13), significanceat the 5% level would require 7/21 to be con-trasted with a minimum of 14/21. The observedvalues are within that range.In a more extensive experiment, we decided
to follow the suggestion of Simon (16) to employvelocity sedimentation of the virus in a sucrosegradient (5) as a way to get rid of possibleaggregates and multiploid particles. Details ofthe procedure have been described above.
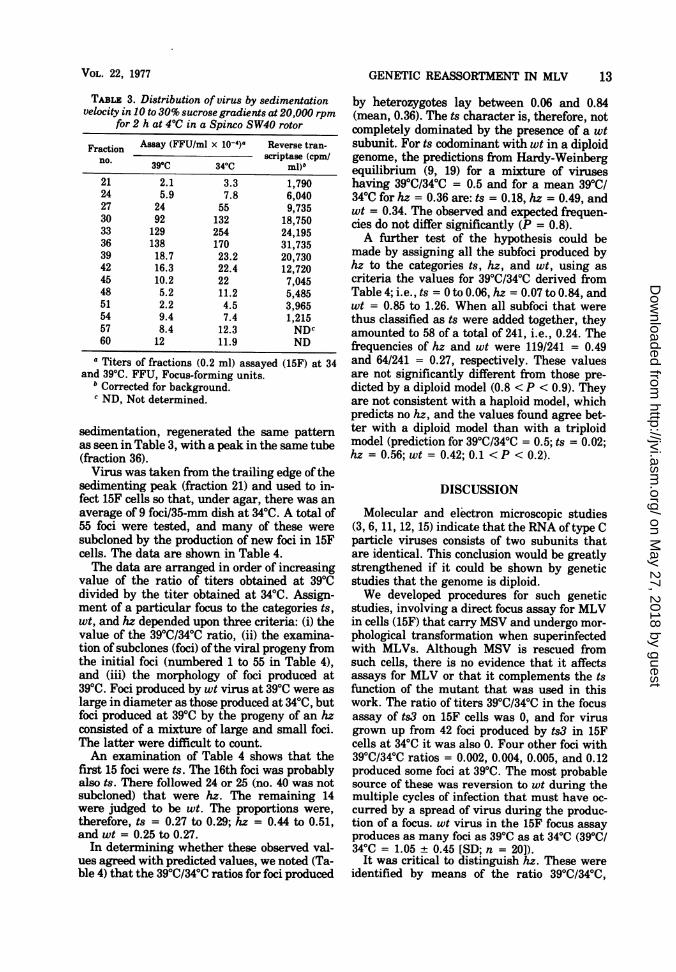
For this experiment, we used a fresh, 24-hviral harvest taken on day 6 from TB cellsinfected with virus from one of the cloned cellcultures of the set wt: ts3 = 4.3:7.8 at passage 4.The ratio of titers 390C/340C for this stock was0.5. The medium in which the infected cells hadbeen grown was centrifuged to remove any cellsand diluted 1:2 with complete medium. Thispreparation was not filtered or frozen prior toplacing 1 ml on the top of the gradient. Theresults ofthe experiment that provided the dataof Table 4 are given in Table 3. Infectious virusand reverse transcriptase activities were foundin the same peak. The peak represented virusthat was sedimenting rather than virus at anequilibrium position in the gradient because,by centrifuging for a longer time at the samespeed, the peak was found farther down thetube (data not shown). Electron microscopy ofthe fractions revealed no clumped particlesthroughout the peak. Only single, type C parti-cles were seen. There were single particles ofslightly larger diameter at the bottom of thegradient than at the top, but quantitation wasnot attempted because the presence of sucrosemade the measurements uncertain. Virustaken from fraction 60, near the bottom of thetube, when regrown and assayed by velocity
J. VIROL.
on May 27, 2018 by guest
http://jvi.asm.org/
Dow
nloaded from
VOL. 22, 1977
TABLE 3. Distribution of virus by sedimentationvelocity in 10 to 30% sucrose gradients at 20,000 rpm
for 2 h at 4C in a Spinco SW40 rotor
Fraction Assay (FFU/ml x 10-4)a Reverse tran-scriptase (cpm/no. 390C 340C ml)b21 2.1 3.3 1,79024 5.9 7.8 6,04027 24 55 9,73530 92 132 18,75033 129 254 24,19536 138 170 31,73539 18.7 23.2 20,73042 16.3 22.4 12,72045 10.2 22 7,04548 5.2 11.2 5,48551 2.2 4.5 3,96554 9.4 7.4 1,21557 8.4 12.3 NDc60 12 11.9 ND
a Titers of fractions (0.2 ml) assayed (15F) at 34and 390C. FFU, Focus-forming units.
b Corrected for background.e ND, Not determined.
sedimentation, regenerated the same patternas seen in Table 3, with a peak in the same tube(fraction 36).Virus was taken from the trailing edge of the
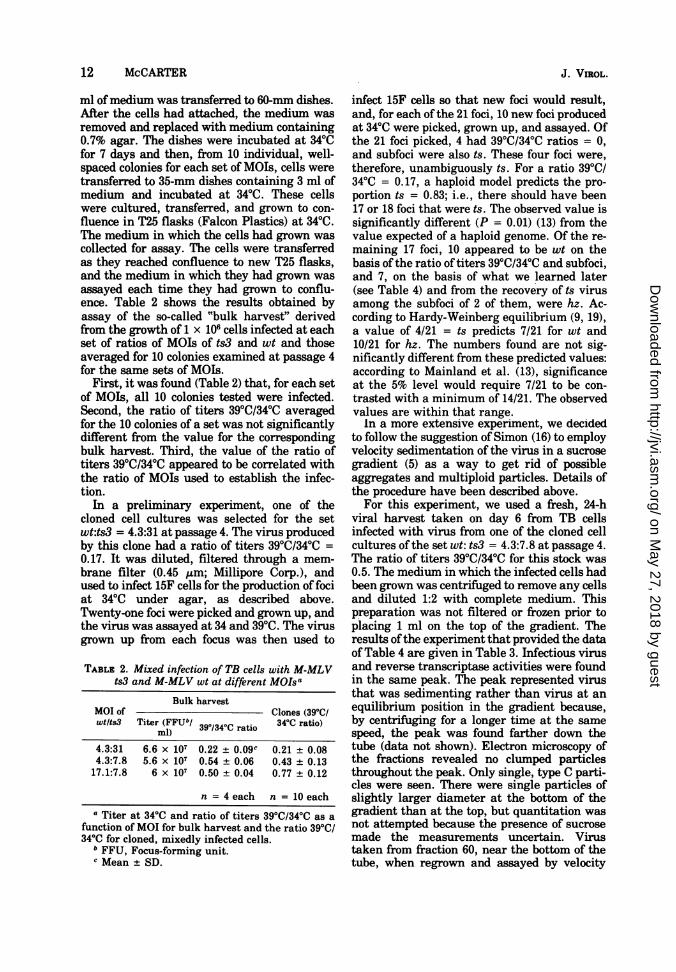
sedimenting peak (fraction 21) and used to in-fect 15F cells so that, under agar, there was anaverage of 9 foci/35-mm dish at 340C. A total of55 foci were tested, and many of these weresubcloned by the production of new foci in 15Fcells. The data are shown in Table 4.The data are arranged in order of increasing
value of the ratio of titers obtained at 390Cdivided by the titer obtained at 340C. Assign-ment of a particular focus to the categories ts,wt, and hz depended upon three criteria: (i) thevalue of the 390C/340C ratio, (ii) the examina-tion of subclones (foci) ofthe viral progeny fromthe initial foci (numbered 1 to 55 in Table 4),and (iii) the morphology of foci produced at390C. Foci produced by wt virus at 390C were aslarge in diameter as those produced at 340C, butfoci produced at 390C by the progeny of an hzconsisted of a mixture of large and small foci.The latter were difficult to count.An examination of Table 4 shows that the
first 15 foci were ts. The 16th foci was probablyalso ts. There followed 24 or 25 (no. 40 was notsubcloned) that were hz. The remaining 14were judged to be wt. The proportions were,therefore, ts = 0.27 to 0.29; hz = 0.44 to 0.51,and wt = 0.25 to 0.27.
In determining whether these observed val-ues agreed with predicted values, we noted (Ta-ble 4) that the 390C/340C ratios for foci produced
GENETIC REASSORTMENT IN MLV 13
by heterozygotes lay between 0.06 and 0.84(mean, 0.36). The ts character is, therefore, notcompletely dominated by the presence of a wtsubunit. For ts codominant with wt in a diploidgenome, the predictions from Hardy-Weinbergequilibrium (9, 19) for a mixture of viruseshaving 390C/340C = 0.5 and for a mean 390C/340C for hz = 0.36 are: ts = 0.18, hz = 0.49, andwt = 0.34. The observed and expected frequen-cies do not differ significantly (P = 0.8).A further test of the hypothesis could be
made by assigning all the subfoci produced byhz to the categories ts, hz, and wt, using ascriteria the values for 390C/340C derived fromTable 4; i.e., ts = 0 to 0.06, hz = 0.07 to 0.84, andwt = 0.85 to 1.26. When all subfoci that werethus classified as ts were added together, theyamounted to 58 of a total of 241, i.e., 0.24. Thefrequencies of hz and wt were 119/241 = 0.49and 64/241 = 0.27, respectively. These valuesare not significantly different from those pre-dicted by a diploid model (0.8 < P < 0.9). Theyare not consistent with a haploid model, whichpredicts no hz, and the values found agree bet-ter with a diploid model than with a triploidmodel (prediction for 390C/340C = 0.5; ts = 0.02;hz = 0.56; wt = 0.42; 0.1 < P < 0.2).
DISCUSSION
Molecular and electron microscopic studies(3, 6, 11, 12, 15) indicate that the RNA of type Cparticle viruses consists of two subunits thatare identical. This conclusion would be greatlystrengthened if it could be shown by geneticstudies that the genome is diploid.We developed procedures for such genetic
studies, involving a direct focus assay for MLVin cells (15F) that carry MSV and undergo mor-phological transformation when superinfectedwith MLVs. Although MSV is rescued fromsuch cells, there is no evidence that it affectsassays for MLV or that it complements the tsfunction of the mutant that was used in thiswork. The ratio of titers 390C/340C in the focusassay of ts3 on 15F cells was 0, and for virusgrown up from 42 foci produced by ts3 in 15Fcells at 340C it was also 0. Four other foci with39°C/34°C ratios = 0.002, 0.004, 0.005, and 0.12produced some foci at 390C. The most probablesource of these was reversion to wt during themultiple cycles of infection that must have oc-curred by a spread of virus during the produc-tion of a focus. wt virus in the 15F focus assayproduces as many foci as 390C as at 340C (390C/340C = 1.05 ± 0.45 [SD; n = 20]).
It was critical to distinguish hz. These wereidentified by means of the ratio 39°C/34°C,
on May 27, 2018 by guest
http://jvi.asm.org/
Dow
nloaded from
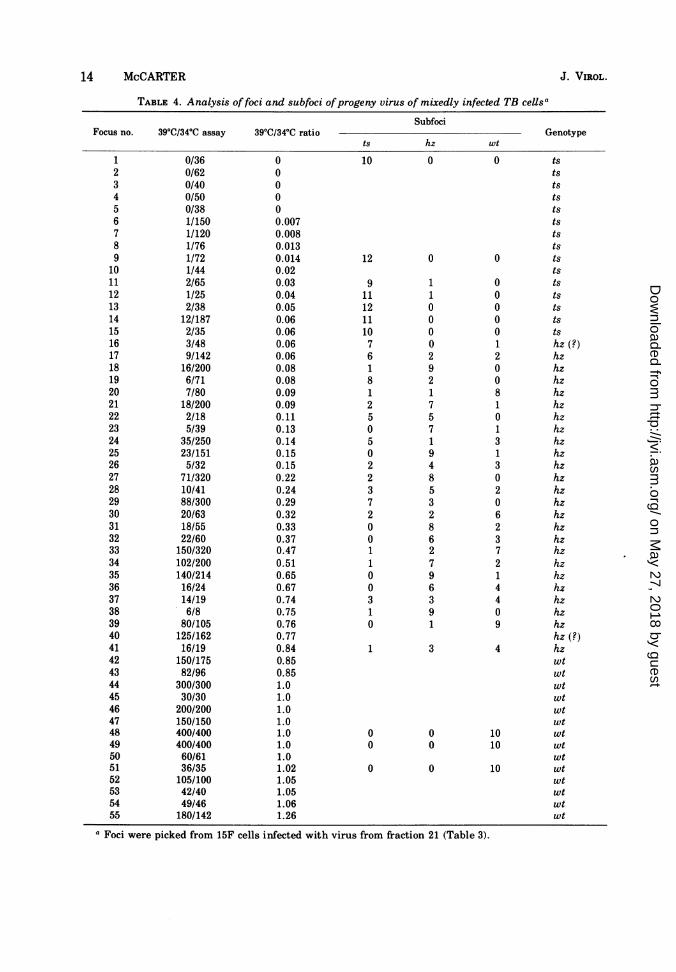
TABLE 4. Analysis offoci and subfoci ofprogeny virus of mixedly infected TB cellsa
SubfociFocus no. 39°C/34°C assay 39°C/34°C ratio Genotype
ts hz wt1 0/36 0 10 0 0 ts2 0/62 0 ts3 0/40 0 ts4 0/50 0 ts5 0/38 0 ts6 1/150 0.007 ts7 1/120 0.008 ts8 1/76 0.013 ts9 1/72 0.014 12 0 0 ts
10 1/44 0.02 ts11 2/65 0.03 9 1 0 ts12 1/25 0.04 11 1 0 ts13 2/38 0.05 12 0 0 ts14 12/187 0.06 11 0 0 ts15 2/35 0.06 10 0 0 ts16 3/48 0.06 7 0 1 hz17 9/142 0.06 6 2 2 hz18 16/200 0.08 1 9 0 hz19 6/71 0.08 8 2 0 hz20 7/80 0.09 1 1 8 hz21 18/200 0.09 2 7 1 hz22 2/18 0.11 5 5 0 hz23 5/39 0.13 0 7 1 hz24 35/250 0.14 5 1 3 hz25 23/151 0.15 0 9 1 hz26 5/32 0.15 2 4 3 hz27 71/320 0.22 2 8 0 hz28 10/41 0.24 3 5 2 hz29 88/300 0.29 7 3 0 hz30 20/63 0.32 2 2 6 hz31 18/55 0.33 0 8 2 hz32 22/60 0.37 0 6 3 hz33 150/320 0.47 1 2 7 hz34 102/200 0.51 1 7 2 hz35 140/214 0.65 0 9 1 hz36 16/24 0.67 0 6 4 hz37 14/19 0.74 3 3 4 hz38 6/8 0.75 1 9 0 hz39 80/105 0.76 0 1 9 hz40 125/162 0.77 hz41 16/19 0.84 1 3 4 hz42 150/175 0.85 wt43 82/96 0.85 wt44 300/300 1.0 wt45 30/30 1.0 wt46 200/200 1.0 wt47 150/150 1.0 wt48 400/400 1.0 0 0 10 wt49 400/400 1.0 0 0 10 wt50 60/61 1.0 wt51 36/35 1.02 0 0 10 wt52 105/100 1.05 wt53 42/40 1.05 wt54 49/46 1.06 wt55 180/142 1.26 wt
a Foci were picked from 15F cells infected with virus from fraction 21 (Table 3).
14 McCARTER J. VIROL.
on May 27, 2018 by guest
http://jvi.asm.org/
Dow
nloaded from
GENETIC REASSORTMENT IN MLV 15
which for those identified as hz lay between0.06 and 0.84, and by the segregation of ts, wt,and hz virus by subcloning. For the classifica-tion of subfoci in Table 4, the only criterion wasthe 390C/340C ratio. Had the range of valuesused been 0.08 to 0.85, the numbers obtainedwould have been substantially the same.The results presented here are consistent
with those predicted from a diploid model ofthegenome of M-MLV and provide biological con-firmation of results obtained by physical andmolecular approaches (3, 6, 11, 12, 15); i.e., thesubunits contain the same genetic information,and there are probably two of them.The efficiency with which subunits of ts3 and
wt were mixed under permissive conditions andthe persistence of hz into the subfoci (Table 4)agree with predictions made by Vogt (18) that,for a simple polyploid genome, hz would beexpected to persist indefinitely unless condi-tions should select for only one genome.One of the consequences of the present find-
ings is that mixed infection would be expectedby complementing ts mutants to produce hzthat might mimic wt recombinants. It is nownecessary to reexamine the evidence that genu-ine wt recombinants are produced, at least inthe murine system (20). A further consequenceis that there cannot be sufficient assurance thatone has isolated a homozygous leukemia virusby isolating the progeny from a single plaque orby a single limiting dilution, or even by isolat-ing several consecutive plaques oflimiting dilu-tions.
ACKNOWLEDGMENTSI am grateful to Ingrid Beauchamp, Charles W. Moore,
and M. M. Hall for excellent technical assistance and to theNational Cancer Institute of Canada for funds.
LITERATURE CITED1. Ball, J. K., J. A. McCarter, and S. M. Sunderland. 1973.
Evidence for helper independent murine sarcoma vi-rus. 1. Segregation of replication-defective and trans-formation-defective viruses. Virology 56:268-284.
2. Bassin, R. H., N. Tuttle, and P. J. Fishinger. 1970.Isolation ofmurine sarcoma virus transformed mousecells which are negative for leukemia virus from agarsuspension cultures. Int. J. Cancer 6:95-107.
3. Beemon, K. L., A. J. Faras, A. T. Haase, P. H. Dues-berg, and J. E. Maisel. 1976. Genomic complexities ofmurine leukemia and sarcoma, reticuloendotheliosis,and visna viruses. J. Virol. 17:525-537.
4. Brenner, S., and R. W. Home. 1959. A negative stain-ing method for high resolution electron microscopy ofviruses. Biochim. Biophys. Acta 34:103-110.
5. Dahlberg, J. E., and E. H. Simon. 1969. Physical andgenetic studies of Newcastle disease virus. Evidence
for multiploid particles. Virology 38:666-678.6. Dube, S., H. J. Kung, W. Bender, N. Davidson, and W.
Ostertag. 1976. Size, subunit composition, and sec-ondary structure of the Friend virus genome. J. Vi-rol. 20:264-272.
7. Fan, H., and M. Paskind. 1974. Measurement of thesequence complexity ofcloned Moloney murine leuke-mia virus 60 to 70S RNA: evidence for a haploidgenome. J. Virol. 14:421-429.
8. Hackett, A. J., and S. S. Sylvester. 1972. Cell linederived from Balb/3T3 that is transformed by murineleukemia virus: a focus assay for leukemia virus.Nature (London) New Biol. 239:164-166.
9. Hardy, G. H. 1908. Mendelian proportions in a mixedpopulation. Science 28:49-50.
10. Klement, V., W. P. Rowe, J. W. Hartley, and W. E.Pugh. 1969. Mixed culture cytopathogenicity: a newtest for growth of murine leukemia viruses in tissueculture. Proc. Natl. Acad. Sci. U.S.A. 63:753-758.
11. Kung, H. J., J. M. Bailey, N. Davidson, M. 0. Nicolson,and R. M. McAllister. 1975. Structure subunit compo-sition, and molecular weight of RD-114 RNA. J. Vi-rol. 16:397-411.
12. Kung, H. J., S. Hu, W. Bender, J. M. Bailey, N. David-son, M. 0. Nicolson, and R. M. McAllister. 1976.RD114, baboon and woolly monkey viral RNA's com-pared in size and structure. Cell 7:609-620.
13. Mainland, D., L. Herrera, and M. I. Sutcliffe. 1956.Statistical tables for use with binomial samples-contingency tests, confidence limits and sample sizeestimates. Department of Medical Statistics, Collegeof Medicine, New York University, New York.
14. Nermut, M. V., H. Frank, and W. Schafer. 1972. Prop-erties ofmouse leukemia viruses. IlI. Electron micro-scopic appearance as revealed after conventionalpreparation techniques as well as freeze-drying andfreeze-etching. Virology 49:345-358.
15. Riggin, C. H., M. Bondurant, and W. M. Mitchell.1975. Physical properties of Moloney murine leuke-mia virus high-molecular-weight RNA: a two subunitstructure. J. Virol. 16:1528-1535.
16. Simon, E. H. 1972. The distribution and significance ofmultiploid virus particles. Prog. Med. Virol. 14:36-67.
17. Vogt, P. K. 1967. DEAE-dextran: enhancement ofcellu-lar transformation induced by avian sarcoma viruses.Virology 33:175-177.
18. Vogt, P. K. 1973. The genome of avian RNA tumorviruses: a discussion of four models, p. 35. In L. E.Silvestri (ed.), Possible espisomes in eukaryotes.North-Holland, Amsterdam.
19. Weinberg, W. 1908. Uber den Nachweiss der Vererbungbeim Menschen. Jahresh. Ver. Vaterl. Naturkd.Wuerttemb. 64:369-382.
20. Wong, P. K. Y., and J. A. McCarter. 1973. Geneticstudies of temperature-sensitive mutants ofMoloney-murine leukemia virus. Virology 53:319-326.
21. Wong, P. K. Y., and J. A. McCarter. 1974. Studies oftwo temperature-sensitive mutants of Moloney mu-rine leukemia virus. Virology 58:396 408.
22. Wong, P. K. Y., and R. Macleod. 1975. Studies on thebudding process of a temperature-sensitive mutant ofmurine leukemia virus with a scanning electron mi-croscope. J. Virol. 16:434-442.
23. Wong, P. K. Y., L. J. Russ, and 3. A. McCarter. 1973.Rapid, selective procedure for isolation of sponta-neous temperature-sensitive mutants ofMoloney leu-kemia virus. Virology 51:424-431.
VOL. 22, 1977
on May 27, 2018 by guest
http://jvi.asm.org/
Dow
nloaded from