Embed Size (px)
Citation preview

Genetic Selection as a Tool for Battling the Decline in
Reproductive Performance: A Dairy Perspective
Kent A. Weigel, Ph.D.
Department of Dairy Science
University of Wisconsin

Background

Reproduction of Lactating Cows vs. Yearling Heifers
Cows Heifers
Duration of estrus (hr) 7-8 11-14
Multiple ovulation rate (%) 20-25 1-3
Pregnancy loss (%) 20-30 3-5
Anovulation (%) 20-30 1-2
Diameter of the ovulatory follicle (mm) 16-18 14-16
Estrous cycle length (d) 20-29 20-23
Lopez et al., 2004
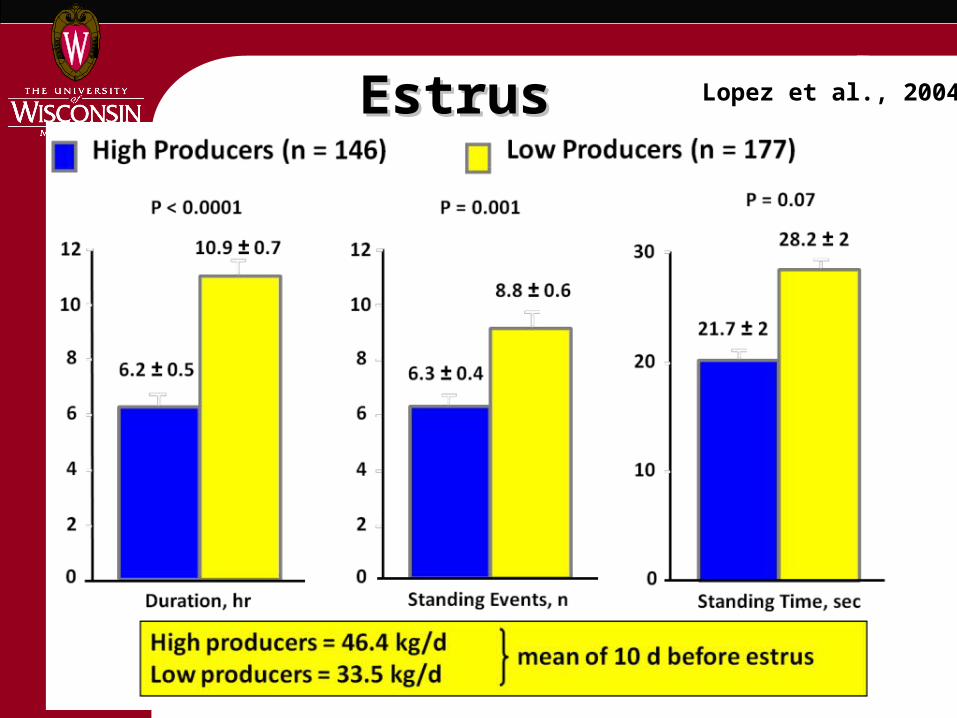
Estrus CharacteristicsEstrus Characteristics Lopez et al., 2004

Duration of Estrus Lopez et al., 2004

Multiple Ovulation Lopez et al., 2004

Twinning Rate in Holsteins
0
1
2
3
4
5
1983
1984
1985
1986
1987
1988
1989
1990
1991
1992
1993
1994
1995
1996
1997
1998
1999
2000
2001
2002
2003
Kinsel et al., 1998
Silva del Rio et al., 2006
Year of Conception
Twin
ning
(%)

Importance of Body Condition Score

Anovulatory Condition Lopez et al. 2004

Anovulatory ConditionAnovulatory Condition Lopez et al. 2004

Santos et al., 2004
Low milk = 36 kg/dHigh milk = 52 kg/d
Milk Yield vs. Embryonic Loss between 31 to 45 d of Pregnancy
0
2
4
6
8
10
12
14
Low High
Pre
gn
ancy
Lo
ss, %
P = 0.81

N=250
Body Condition vs. Embryonic Loss
Silke et al., 2004
N=103N=147
0
2
4
6
8
10
12
14
La
te E
mb
ryo
nic
Lo
ss
, %
Lost Maintained Gained
P < 0.05

Selection for Female Fertility

Indirect Selection for Fertility Length of Productive Life (available since 1994)
Total months in milk by 7 years of age
Limit of 10 months per lactation
Rewards a short calving interval
Dairy Form (received negative economic weight in 2005)
Poor body condition = poor fertility Can measure milk production directly
Shouldn’t reward angularity

Evaluation of Female Fertility
USDA Animal Improvement Programs Laboratory introduced national genetic evaluations for female fertility in 2003
Dairy sires from all breeds are evaluated based on the fertility of their daughters
The animal model system for fertility is the same as for production traits
Evaluations are released 3 times per year

Evaluation of Female Fertility Input data are days open measurements
from the DHI milk recording system
Days open (calculated from the last reported insemination) is confirmed with subsequent calving dates, if possible
Animals with no subsequent calving are assigned an arbitrary value of 250 days
Days open data are transformed to 21-day pregnancy rates

Today’s Fertility Data Introduced in February 2003
> 40 million records > 16 million cows
Based on days open data, including: Breeding date confirmed by calving (57%) Breeding date without next calving (19%) Breeding date conflicts with next calving (5%) Next calving, but no reported breeding (6%) Culled due to infertility (5%) No fertility information (8%)
Published “daughter pregnancy rate”

Example Bulls for DPR
1H6360 WizardDPR +3.7%
1% DPR ≈ 4 days open
200H3101 FreelanceDPR -3.8%
The 21-day pregnancy rate of Wizard daughters will be 7.5% higher, on average than for Freelance daughters, and Wizard daughters will have
30 fewer days open per lactation

Genetic Trend in Milk Yield
Genetic Trend in Daughter
Pregnancy Rate
Genetic Correlation = 0.31
Introduction ofProductive Life

Selection forMale Fertility

Evaluation of Male Fertility Regional evaluations of male fertility have
been carried out by dairy records processing centers for many years
USDA-AIPL recently began computing “phenotypic” evaluations for service sire conception rate (i.e., direct effect)
Evaluations are published as the expected percentage change in conception rate, including both genetic and environmental factors

Example Bulls for SCR
29H10483 JammerSCR + 4
9,731 inseminations
14H4099 BillionSCR - 3
4,422 inseminations
Expect a 7% difference between these bulls in conception rate, under equivalent management conditions

Additional Fertility Traits As a by-product of evaluations for service
sire conception rate, two new female fertility traits were introduced in 2009
Cow conception rate measures the expected difference in conception rate due to the female (i.e., maternal effect) in lactating animals
Heifer conception rate measures the expected difference in conception rate in non-lactating animals

Reproductive Events (up to 20 segments)Type of reproductive event codeDate of reproductive event (YYYYMMDD)
National Fertility Database
H Observed in estrus (heat) but not inseminatedS Synchronized estrus event (injection or other methods)A Artificial inseminationN Natural service breedingE Embryo donationI Embryo implantation (reporting sire of embryo)J Embryo implantation (reporting dam of embryo)P Confirmed pregnantO Confirmed not pregnant (open)X Cow given a "do not breed" designationG AI breeding with gender selected semen
USDA Format 5

Selection for Animal Health

Pregnancy Risk by Calving Disorder
Calving Disorder
Risk
of P
regn
ancy
0.72
0.79
0.86
0.93
1
1.07
1.14
1.21
Normal Twins Pulled Calf Dead Calf

Stillbirths and Female FertilityBicalho et al. (2007)

Pregnancy Risk by Repro. Disorder
Reproductive Disorder(in 1st 75 d Postpartum)
Risk
of P
regn
ancy
0.72
0.79
0.86
0.93
1
1.07
1.14
1.21
None RetainedPlacenta
Metritis

Pregnancy Risk by Mastitis Infection
Mastitis Infection (in 1st 75 d Postpartum)
Risk
of P
regn
ancy
0.72
0.79
0.86
0.93
1
1.07
1.14
1.21
No Yes

Pregnancy Risk by Metabolic Disorder
Metabolic Disorder(in 1st 75 d Postpartum)
Risk
of P
regn
ancy
0.72
0.79
0.86
0.93
1
1.07
1.14
1.21
None DisplacedAbomasum
Ketosis

Pregnancy Risk by Mobility Disorder
Mobility Disorder(in 1st 75 d Postpartum)
Risk
of P
regn
ancy
0.72
0.79
0.86
0.93
1
1.07
1.14
1.21
None Lameness

Dairy Comp 305 Valley Ag Software, Tulare, CA ~ 4,000 large herds
PCDART DRMS, Raleigh, NC ~ 3,000 medium-sized herds
DHI-Plus® DHI-Provo, Provo, UT ~ 300 very large herds
Management Software

Displaced Abomasum Ketosis Mastitis Lameness Cystic Ovaries Metritis
DA KETOSIS MAST ABCS CYST MET/RPD.A. KETOTIC RF ABSS CYSTG METLDA KET LF HROT CYSTO METRRDA KETO RR HFROT CYSTIC RPL-DA KETOS LR LAMINIT RCYST RETAINPR-DA KET1 MLFQ LAME LCYST RETPDAS KET2 MLRQ WRAP CYSTRO INFUDALF KET3 MRRQ LAMI CYSTLO INFDART KETI MRFQ LIMP MTRIDAR KETR MLF SOREFT RETNDAL KETS MLR ABCSRR RPL
KETH MRR ABCSLR RPINKETD MRF FOOT RPREKETP RFMT FEET UCNDMETB LFMT RTPL
LRMT UINFRRMT PYOMM2TIT UTCN
MASTALL RE-PLAMAST2QMAST3Q
Disease Codes

Summary of the Data(Alta Advantage herds and selected DRMS herds)
Zwald et al., 2004
Displaced Abomasum Ketosis Mastitis Lameness
Cystic Ovaries Metritis
Herds 313 250 429 212 340 418
Cows 75,252 52,898 105,029 50,611 65,080 97,316
Sires 2172 1205 4983 1109 3071 2163
Lactation Incidence Rate
3% 10% 20% 10% 8% 21%

Heritability Estimates
Zwald et al., 2004
Displaced Abomasum 14%
Ketosis 6%
Mastitis 9%
Lameness 4%
Cystic Ovaries 4%
Metritis / Retained Placenta 6%

Predicted Transmitting Abilitiesfor Daughter Health
Zwald et al., 2004
Displaced Abomasum Ketosis Mastitis Lameness Cystic
Ovaries Metritis
Disease Probability per Lactation (Best 10 Sires)
0.017 0.063 0.129 0.077 0.052 0.151
Disease Probability per Lactation (Worst 10 Sires)
0.061 0.132 0.259 0.131 0.091 0.271

• Differences in exposure• e.g., mastitis pathogens
• Inconclusive test results• e.g., Johne’s disease
• Incomplete reporting• incorrect diagnosis• underestimated severity• selective treatment• temporary recording
• Restrictions on access to the data
Challenges with Health Traits

Health Events (up to 20 segments)Type of health event codeDate of health event (YYYYMMDD)
National Health Database
Health Traits Cystic Ovary CYST Diarrhea/Scours DIAR Digestive Problem/Off Feed DIGE Displaced Abomasum DA-- Downer Cow DOWN Dystocia DYST Johne's Disease (clinical) JOHN Ketosis/Acetonemia KETO Lameness LAME Mastitis (clinical) MAST Metritis METR Milk Fever/Hypocalcemia MILK Nervous System Problem NERV
Reproductive problem other than CYST, DYST, METR, RETP REPR
Respiratory Problem RESP Retained Placenta RETP Stillbirth/Perinatal Survival STIL Teat Injury TEAT Udder Edema EDEM
Management Traits
Body Condition Score BCS-
Milking Speed SPEE
Temperament TEMP
USDA Format 6

Lifetime Net Merit (NM$)23% Fat
23% Protein17% Productive Life
-9% Somatic Cell Score6% Udder Composite
3% Feet & Legs Composite-4% Body Size Composite
9% Daughter Pregnancy Rate6% Calving Ability

Impact of Crossbreeding
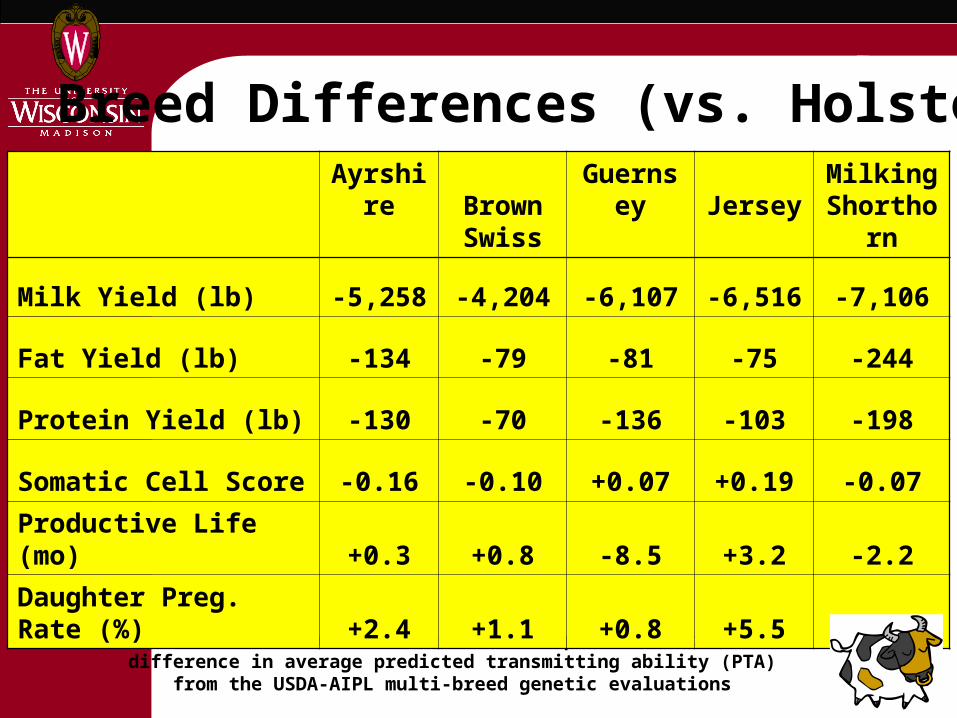
Breed Differences (vs. Holstein)
Genetic differences between breeds represent twice thedifference in average predicted transmitting ability (PTA)
from the USDA-AIPL multi-breed genetic evaluations
Ayrshire Brown Swiss
Guernsey Jersey Milking Shorthorn
Milk Yield (lb) -5,258 -4,204 -6,107 -6,516 -7,106
Fat Yield (lb) -134 -79 -81 -75 -244
Protein Yield (lb) -130 -70 -136 -103 -198
Somatic Cell Score -0.16 -0.10 +0.07 +0.19 -0.07
Productive Life (mo) +0.3 +0.8 -8.5 +3.2 -2.2
Daughter Preg. Rate (%) +2.4 +1.1 +0.8 +5.5 +4.5

fertilityduring1st
lactation
Different from pure Holsteins: † P<0.10, * P<0.05, ** P<0.01
Fertility of Crossbred Cows(Heins et al., 2006)
Pure Holstein
Normande x Holstein
Montbeliarde x Holstein
Scandinavian Red x Holstein
No. Cows 677 421 805 529
Days Open 156 133** 137** 142**

Fertility and Udder Health of Crossbred Cows
(Dechow et al., 2007)
Holstein ½ Swiss ½ Holstein
¾ Swiss ¼ Holstein Brown Swiss
Number of Cows 2125 256 105 926
Age at Calving (mo) 25.9a 25.7a 26.6b 26.6b
Days Open 156b 144a 153ab 156b
Somatic Cell Score 2.73ab 2.54a 2.66ab 2.78b
Different superscripts within a row indicate Statistical significance at the P<0.05 level

survivalduring1st
lactation
Different from pure Holsteins: † P<0.10, * P<0.05, ** P<0.01
Longevity of Crossbred Cows(Heins et al., 2006)
survivaluntil 2nd
calving
Pure Holstein
Normande x Holstein
Montbeliarde x Holstein
Scandinavian Red x Holstein
No. Cows 724 437 806 549
until 30 d 96% 98% 99% 98%
until 150 d 93% 97%* 97%* 96%
until 305 d 86% 94%* 96%* 93%*
No. Cows 565 392 561 389
within 14 mo 44% 62%** 64%** 60%**
within 17 mo 61% 76%** 78%** 73%**
within 20 mo 67% 79%** 83%** 77%**

UW-Madison Dairy Science…Committed to Excellence in Research, Extension and Instruction
http://www.wisc.edu/dyscihttp://www.wisc.edu/dysci
AnyQuestions?