Embed Size (px)
Citation preview
rate phylogenetic trees were compared by using a likelihood ratio test.Estimates and confidence intervals of the SFV divergence times were determined on the
maximum-likelihood tree topology with the nonparametric rate smoothing algorithmimplemented in the r8s program21. The branch lengths of the COII tree were re-estimatedby enforcing a molecular clock with the PAUP* program. Confidence intervals for theCOII divergence times were estimated with the r8s program by using the penalizedlikelihood algorithm29 and 95% confidence intervals are given by 1.96j. The split of theCercopithecoidea from the Hominoidea 25–30Myr ago was used as a calibration point forthe molecular dating of both SFV and COII sequences18,19. The number of synonymous(dS) and non-synonymous (dN) substitutions per site were estimated with the programDiverge in the Genetic Computer Group Wisconsin Package (http://www.accelrys.com/products/gcg_wisconsin_package).
Reconciliation analysis and comparison of branch lengths of the SFV and COII treeswere performed with the TreeMap (v1.0) program in accordance with the author’sinstructions (http://taxonomy.zoology.gla.ac.uk/rod/treemap.html)30. A single optimalreconstruction was found with the heuristic search option. The significance of theobserved fit between the SFV and primate trees and branch lengths was determined bycomparison with the distribution of the same measure of fit for 10,000 randomlygenerated trees or branch lengths by using the proportional-to-distinguishable model ofthe randomization test incorporated in TreeMap.
Received 7 September; accepted 22 December 2004; doi:10.1038/nature03341.
1. Hafner, M. S. et al. Disparate rates of molecular evolution in cospeciating hosts and parasites. Science
265, 1087–1090 (1994).
2. Page, R. D. M. Temporal congruence and cladistic analysis of biogeography and cospeciation. Syst.
Zool. 39, 205–226 (1990).
3. Brooks, D. R. Analysis of host-parasite coevolution. Int. J. Parasitol. 17, 291–297 (1987).
4. Charrel, R. N., DeMicco, P. & de Lamballerie, X. Phylogenetic analysis of GB viruses A andC: evidence
for cospeciation between virus isolates and their primate hosts. J. Gen. Virol. 80, 2329–2335 (1999).
5. McGeoch, D. J., Dolan, A. & Ralph, A. C. Toward a comprehensive phylogeny for mammalian and
avian herpesviruses. J. Virol. 74, 10401–10406 (2000).
6. Charleston, M. A. & Robertson, D. L. Preferential host switching by primate lentiviruses can account
for phylogenetic similarity with the primate phylogeny. Syst. Biol. 51, 528–535 (2002).
7. Salemi, M. et al. Mosaic genomes of the six major primate lentivirus lineages revealed by phylogenetic
analyses. J. Virol. 77, 7202–7213 (2003).
8. Jackson, A. P. & Charleston, M. A. A cophylogenetic perspective of RNA-virus evolution. Mol. Biol.
Evol. 21, 45–57 (2004).
9. Holmes, E. C. Molecular clocks and the puzzle of RNA virus origins. J. Virol. 77, 3893–3897 (2003).
10. Meiering, C. D. & Linial, M. L. Historical perspective of foamy virus epidemiology and infection. Clin.
Microbiol. Rev. 14, 165–176 (2001).
11. Hussain, A. I. et al. Screening for simian foamy virus infection by using a combined antigen Western
blot assay: evidence for a wide distribution among OldWorld primates and identification of four new
divergent viruses. Virology 309, 248–257 (2003).
12. Disotell, T. R., Honeycutt, R. L. & Ruvolo, M. Mitochondrial DNA phylogeny of the Old-World
monkey tribe Papionini. Mol. Biol. Evol. 9, 1–13 (1992).
13. Ruvolo, M., Disotell, T. R., Allard, M. W., Brown, W. M. & Honeycutt, R. L. Resolution of the African
hominoid trichotomy by use of a mitochondrial gene sequence. Proc. Natl Acad. Sci. USA 88,
1570–1574 (1991).
14. Adkins, R. M. & Honeycutt, R. L. Evolution of the primate cytochrome C oxidase subunit II gene.
J. Mol. Evol. 38, 215–231 (1994).
15. van der Kuyl, A. C., Kuiken, C. L., Dekker, J. T. & Goudsmit, J. Phylogeny of African monkeys based
upon mitochondrial 12S rRNA sequences. J. Mol. Evol. 40, 173–180 (1995).
16. Page, S. L., Chiu, C. H. & Goodman, M. Molecular phylogeny of Old World monkeys
(Cercopithecidae) as inferred from gamma-globin DNA sequences. Mol. Phylogenet. Evol. 13, 348–359
(1999).
17. Harris, E. E. & Disotell, T. R. Nuclear gene trees and the phylogenetic relationships of the mangabeys
(Primates: Papionini). Mol. Biol. Evol. 15, 892–900 (1998).
18. Goodman, M. et al. Toward a phylogenetic classification of Primates based on DNA evidence
complemented by fossil evidence. Mol. Phylogenet. Evol. 9, 585–598 (1998).
19. Page, S. L. & Goodman, M. Catarrhine phylogeny: noncoding DNA evidence for a diphyletic origin of
the mangabeys and for a human-chimpanzee clade. Mol. Phylogenet. Evol. 18, 14–25 (2001).
20. Murphy, W. J. et al. Resolution of the early placental mammal radiation using Bayesian phylogenetics.
Science 294, 2348–2351 (2001).
21. Sanderson, M. J. r8s: inferring absolute rates of molecular evolution and divergence times in the
absence of a molecular clock. Bioinformatics 19, 301–302 (2003).
22. Ruvolo, M. et al. Mitochondrial COII sequences and modern human origins. Mol. Biol. Evol. 10,
1115–1135 (1993).
23. Shadan, F. F. & Villarreal, L. P. Coevolution of persistently infecting small DNAviruses and their hosts
linked to host-interactive regulatory domains. Proc. Natl Acad. Sci. USA 90, 4117–4121 (1993).
24. Johnson, W. E. & Coffin, J. M. Constructing primate phylogenies from ancient retrovirus sequences.
Proc. Natl Acad. Sci. USA 96, 10254–10260 (1999).
25. Suzuki, Y., Yamaguchi-Kabata, Y. & Gojobori, T. Nucleotide substitution rates of HIV-1. AIDS Rev. 2,
39–47 (2000).
26. Lochelt, M. Foamy virus transactivation and gene expression. Curr. Top. Microbiol. Immunol. 277,
27–61 (2003).
27. Woelk, C. H. & Holmes, E. C. Reduced positive selection in vector-borne RNAviruses. Mol. Biol. Evol.
19, 2333–2336 (2002).
28. Groves, C. Primate Taxonomy (Smithsonian Institution Press, Washington DC, 2001).
29. Sanderson, M. J. Estimate absolute rates of molecular evolution and divergence times: a penalized
likelihood approach. Mol. Biol. Evol. 19, 101–109 (2002).
30. Page, R. D. M. Parallel phylogenies: reconstructing the history of host-parasite assemblages. Cladistics
10, 155–173 (1994).
Supplementary Information accompanies the paper on www.nature.com/nature.
Acknowledgements We thank the veterinary staff at all zoological gardens and primate centres
who kindly provided blood specimens from the primates living at their institutions; R. Heberle
and P. Johnston for the SFV-infected baboon and orangutan isolates; A. Hussain and A. Wright
for expert technical assistance; and A. Vandamme, C. Coulibaly, M. Peeters, F. Bibollet-Ruche,
V. Hirsch, J. Allan, T. Butler and H. McClure for providing additional primate samples for this
study.
Competing interests statement The authors declare that they have no competing financial
interests.
Correspondence and requests for materials should be addressed to W.M.S. ([email protected]). The
GenBank accession numbers for the 32 new SFV pol and 50 new primate mtDNACOII sequences
are AY686124–AY686148 and AY686150–AY686206.
..............................................................
Genetic relatedness predictsSouth African migrant workers’remittances to their familiesS. Bowles1 & D. Posel2
1Santa Fe Institute, 1399 Hyde Park Rd, Santa Fe, New Mexico 87501, USA; andUniversita degli Studi di Siena, Piazza San Francesco, Siena 53100, Italy2University of KwaZulu-Natal, King George V Avenue, Durban 4001, South Africa.............................................................................................................................................................................
Inclusive fitness models1,2 predict many commonly observedbehaviours: among humans, studies of within-household vio-lence3, the allocation of food4,5 and child care6 find that peoplefavour those towhom they aremore closely related. In some caseshowever, kin-altruism effects appear to be modest7–9. Do indi-viduals favour kin to the extent that kin-altruismmodels predict?Data on remittances sent by South African migrant workers totheir rural households of origin allow an explicit test, to ourknowledge the first of its kind for humans. Using estimates ofthe fitness benefits and costs associated with the remittance, thegenetic relatedness of the migrant to the beneficiaries of thetransfer, and their age- and sex-specific reproductive values, weestimate the level of remittance that maximizes the migrantworker’s inclusive fitness. This is a much better predictor ofobserved remittances than is average relatedness, even when wetake account (by means of a multiple regression) of covaryinginfluences on the level of remittance. But the effect is modest: lessthan a third of the observed level of remittances can be explainedby our kin-altruism model.
Migrants’ remittances provide a rare window into the allocationof resources within a household, as intra-household transfers aretypically not measured in surveys. The large and genetically het-erogeneous nature of rural African households makes migrants andtheir households of origin an ideal database. The data for ourstudy come from a nationally representative survey in 1993 ofapproximately 9,000 households10.
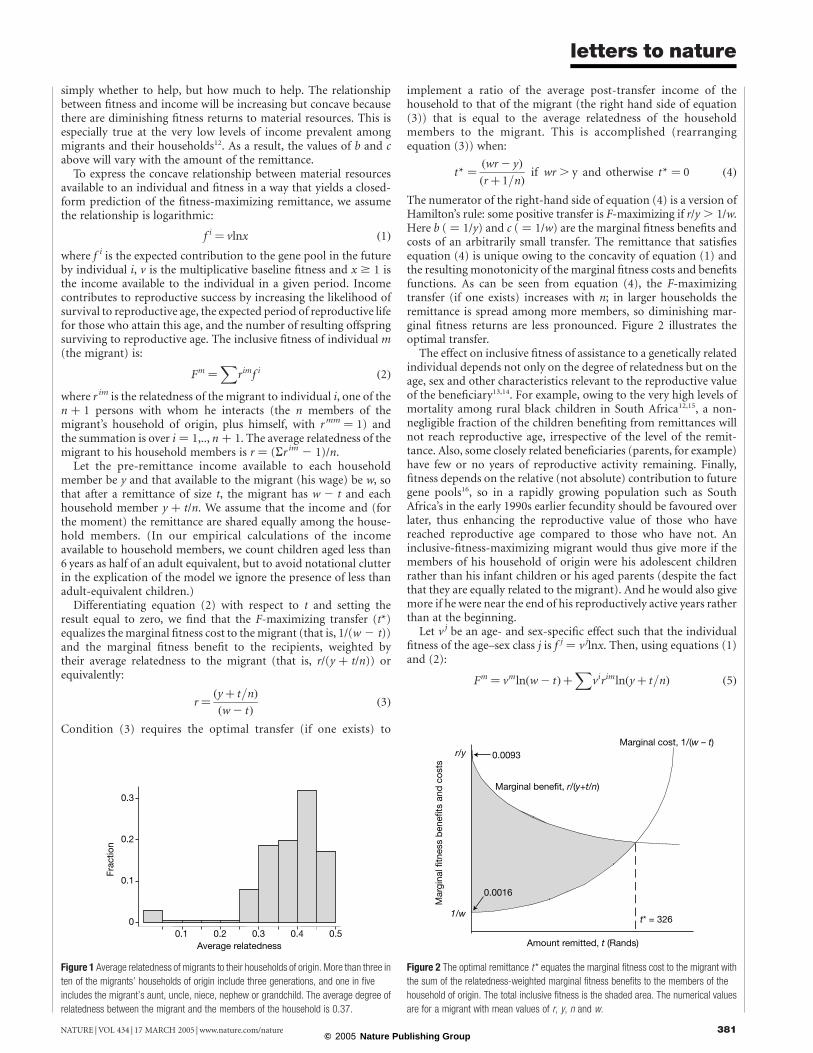
We have complete data on the income, remittances received, landownership and composition of the household of origin, and on eachmigrant worker’s age and schooling for 539 black male migrants.Virtually all migrants in the sample sent remittances in the yearpreceding the survey in 1993, and on average they sent almost halfof their urban wage. Figure 1 shows the distribution ofaverage relatedness of the migrant to the household of origin.(Consanguineousmarriages are exceptionally rare in South Africa11,so we assume that the migrant and his wife are unrelated.)
Hamilton’s rule states that conferring a fitness benefit (b) byhelping another at a cost of (c) to oneself will be selected for ifrb . c, where r is the genetic relatedness of the donor to thebeneficiary. Here we consider a case in which the choice is not
letters to nature
NATURE | VOL 434 | 17 MARCH 2005 | www.nature.com/nature380© 2005 Nature Publishing Group
simply whether to help, but how much to help. The relationshipbetween fitness and income will be increasing but concave becausethere are diminishing fitness returns to material resources. This isespecially true at the very low levels of income prevalent amongmigrants and their households12. As a result, the values of b and cabove will vary with the amount of the remittance.
To express the concave relationship between material resourcesavailable to an individual and fitness in a way that yields a closed-form prediction of the fitness-maximizing remittance, we assumethe relationship is logarithmic:
f i ¼ vlnx ð1Þ
where f i is the expected contribution to the gene pool in the futureby individual i, v is the multiplicative baseline fitness and x $ 1 isthe income available to the individual in a given period. Incomecontributes to reproductive success by increasing the likelihood ofsurvival to reproductive age, the expected period of reproductive lifefor those who attain this age, and the number of resulting offspringsurviving to reproductive age. The inclusive fitness of individual m(the migrant) is:
Fm ¼X
rimf i ð2Þ
where r im is the relatedness of the migrant to individual i, one of then þ 1 persons with whom he interacts (the n members of themigrant’s household of origin, plus himself, with r mm ¼ 1) andthe summation is over i ¼ 1,.., n þ 1. The average relatedness of themigrant to his household members is r ¼ (Sr im 2 1)/n.
Let the pre-remittance income available to each householdmember be y and that available to the migrant (his wage) be w, sothat after a remittance of size t, the migrant has w 2 t and eachhousehold member y þ t/n. We assume that the income and (forthe moment) the remittance are shared equally among the house-hold members. (In our empirical calculations of the incomeavailable to household members, we count children aged less than6 years as half of an adult equivalent, but to avoid notational clutterin the explication of the model we ignore the presence of less thanadult-equivalent children.)
Differentiating equation (2) with respect to t and setting theresult equal to zero, we find that the F-maximizing transfer (t*)equalizes themarginal fitness cost to themigrant (that is, 1/(w 2 t))and the marginal fitness benefit to the recipients, weighted bytheir average relatedness to the migrant (that is, r/(y þ t/n)) orequivalently:
r ¼ðy þ t=nÞ
ðw 2 tÞð3Þ
Condition (3) requires the optimal transfer (if one exists) to
implement a ratio of the average post-transfer income of thehousehold to that of the migrant (the right hand side of equation(3)) that is equal to the average relatedness of the householdmembers to the migrant. This is accomplished (rearrangingequation (3)) when:
t* ¼ðwr 2 yÞ
ðr þ 1=nÞif wr . y and otherwise t* ¼ 0 ð4Þ
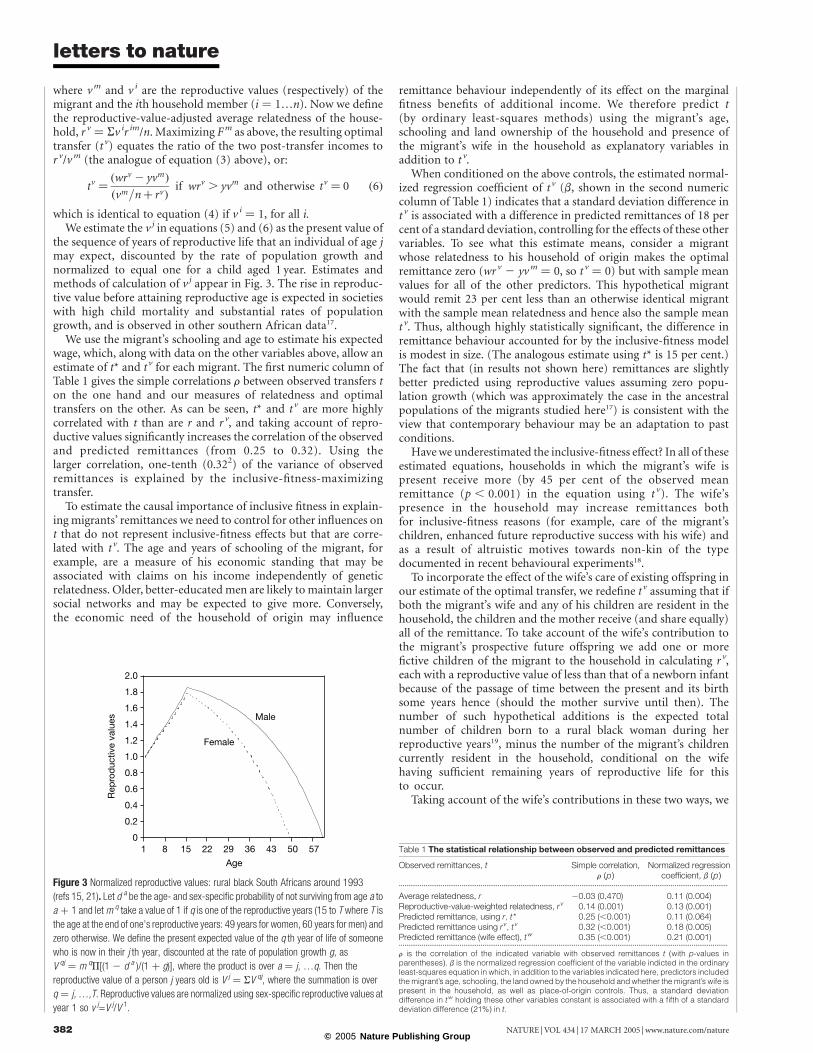
The numerator of the right-hand side of equation (4) is a version ofHamilton’s rule: some positive transfer is F-maximizing if r/y . 1/w.Here b ( ¼ 1/y) and c ( ¼ 1/w) are the marginal fitness benefits andcosts of an arbitrarily small transfer. The remittance that satisfiesequation (4) is unique owing to the concavity of equation (1) andthe resulting monotonicity of the marginal fitness costs and benefitsfunctions. As can be seen from equation (4), the F-maximizingtransfer (if one exists) increases with n; in larger households theremittance is spread among more members, so diminishing mar-ginal fitness returns are less pronounced. Figure 2 illustrates theoptimal transfer.The effect on inclusive fitness of assistance to a genetically related
individual depends not only on the degree of relatedness but on theage, sex and other characteristics relevant to the reproductive valueof the beneficiary13,14. For example, owing to the very high levels ofmortality among rural black children in South Africa12,15, a non-negligible fraction of the children benefiting from remittances willnot reach reproductive age, irrespective of the level of the remit-tance. Also, some closely related beneficiaries (parents, for example)have few or no years of reproductive activity remaining. Finally,fitness depends on the relative (not absolute) contribution to futuregene pools16, so in a rapidly growing population such as SouthAfrica’s in the early 1990s earlier fecundity should be favoured overlater, thus enhancing the reproductive value of those who havereached reproductive age compared to those who have not. Aninclusive-fitness-maximizing migrant would thus give more if themembers of his household of origin were his adolescent childrenrather than his infant children or his aged parents (despite the factthat they are equally related to the migrant). And he would also givemore if he were near the end of his reproductively active years ratherthan at the beginning.Let v j be an age- and sex-specific effect such that the individual
fitness of the age–sex class j is f j ¼ v jlnx. Then, using equations (1)and (2):
Fm ¼ vmlnðw 2 tÞþX
virimlnðy þ t=nÞ ð5Þ
Figure 1 Average relatedness of migrants to their households of origin. More than three in
ten of the migrants’ households of origin include three generations, and one in five
includes the migrant’s aunt, uncle, niece, nephew or grandchild. The average degree of
relatedness between the migrant and the members of the household is 0.37.
Figure 2 The optimal remittance t * equates the marginal fitness cost to the migrant with
the sum of the relatedness-weighted marginal fitness benefits to the members of the
household of origin. The total inclusive fitness is the shaded area. The numerical values
are for a migrant with mean values of r, y, n and w.
letters to nature
NATURE |VOL 434 | 17 MARCH 2005 | www.nature.com/nature 381© 2005 Nature Publishing Group
where vm and v i are the reproductive values (respectively) of themigrant and the ith household member (i ¼ 1…n). Now we definethe reproductive-value-adjusted average relatedness of the house-hold, r v ¼ Sv ir im/n. Maximizing F m as above, the resulting optimaltransfer (t v) equates the ratio of the two post-transfer incomes tor v/v m (the analogue of equation (3) above), or:
tv ¼ðwrv 2 yvmÞ
ðvm=nþ rvÞif wrv . yvm and otherwise tv ¼ 0 ð6Þ
which is identical to equation (4) if v i ¼ 1, for all i.We estimate the v j in equations (5) and (6) as the present value of
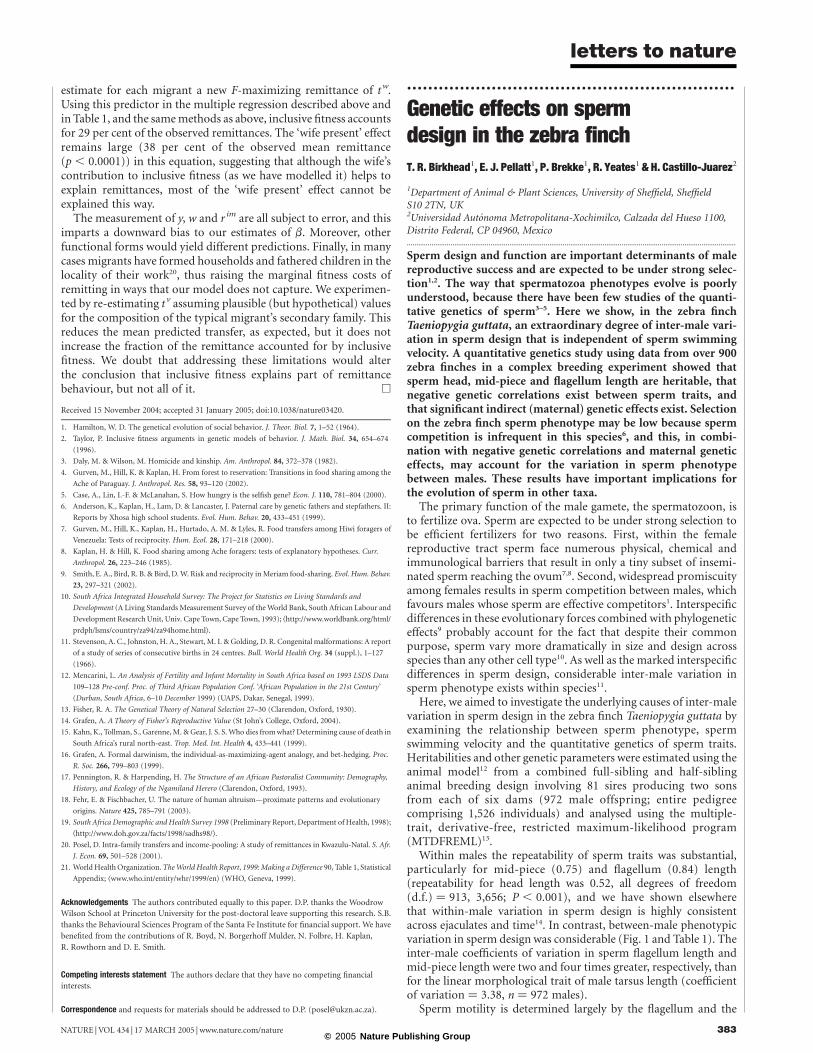
the sequence of years of reproductive life that an individual of age jmay expect, discounted by the rate of population growth andnormalized to equal one for a child aged 1 year. Estimates andmethods of calculation of v j appear in Fig. 3. The rise in reproduc-tive value before attaining reproductive age is expected in societieswith high child mortality and substantial rates of populationgrowth, and is observed in other southern African data17.We use the migrant’s schooling and age to estimate his expected
wage, which, along with data on the other variables above, allow anestimate of t* and t v for each migrant. The first numeric column ofTable 1 gives the simple correlations r between observed transfers ton the one hand and our measures of relatedness and optimaltransfers on the other. As can be seen, t* and t v are more highlycorrelated with t than are r and r v, and taking account of repro-ductive values significantly increases the correlation of the observedand predicted remittances (from 0.25 to 0.32). Using thelarger correlation, one-tenth (0.322) of the variance of observedremittances is explained by the inclusive-fitness-maximizingtransfer.To estimate the causal importance of inclusive fitness in explain-
ing migrants’ remittances we need to control for other influences ont that do not represent inclusive-fitness effects but that are corre-lated with t v. The age and years of schooling of the migrant, forexample, are a measure of his economic standing that may beassociated with claims on his income independently of geneticrelatedness. Older, better-educated men are likely tomaintain largersocial networks and may be expected to give more. Conversely,the economic need of the household of origin may influence
remittance behaviour independently of its effect on the marginalfitness benefits of additional income. We therefore predict t(by ordinary least-squares methods) using the migrant’s age,schooling and land ownership of the household and presence ofthe migrant’s wife in the household as explanatory variables inaddition to t v.
When conditioned on the above controls, the estimated normal-ized regression coefficient of t v (b, shown in the second numericcolumn of Table 1) indicates that a standard deviation difference int v is associated with a difference in predicted remittances of 18 percent of a standard deviation, controlling for the effects of these othervariables. To see what this estimate means, consider a migrantwhose relatedness to his household of origin makes the optimalremittance zero (wr v 2 yv m ¼ 0, so t v ¼ 0) but with sample meanvalues for all of the other predictors. This hypothetical migrantwould remit 23 per cent less than an otherwise identical migrantwith the sample mean relatedness and hence also the sample meant v. Thus, although highly statistically significant, the difference inremittance behaviour accounted for by the inclusive-fitness modelis modest in size. (The analogous estimate using t* is 15 per cent.)The fact that (in results not shown here) remittances are slightlybetter predicted using reproductive values assuming zero popu-lation growth (which was approximately the case in the ancestralpopulations of the migrants studied here17) is consistent with theview that contemporary behaviour may be an adaptation to pastconditions.
Havewe underestimated the inclusive-fitness effect? In all of theseestimated equations, households in which the migrant’s wife ispresent receive more (by 45 per cent of the observed meanremittance (p , 0.001) in the equation using t v). The wife’spresence in the household may increase remittances bothfor inclusive-fitness reasons (for example, care of the migrant’schildren, enhanced future reproductive success with his wife) andas a result of altruistic motives towards non-kin of the typedocumented in recent behavioural experiments18.
To incorporate the effect of the wife’s care of existing offspring inour estimate of the optimal transfer, we redefine t v assuming that ifboth the migrant’s wife and any of his children are resident in thehousehold, the children and the mother receive (and share equally)all of the remittance. To take account of the wife’s contribution tothe migrant’s prospective future offspring we add one or morefictive children of the migrant to the household in calculating r v,each with a reproductive value of less than that of a newborn infantbecause of the passage of time between the present and its birthsome years hence (should the mother survive until then). Thenumber of such hypothetical additions is the expected totalnumber of children born to a rural black woman during herreproductive years19, minus the number of the migrant’s childrencurrently resident in the household, conditional on the wifehaving sufficient remaining years of reproductive life for thisto occur.
Taking account of the wife’s contributions in these two ways, we
Figure 3 Normalized reproductive values: rural black South Africans around 1993
(refs 15, 21). Let d a be the age- and sex-specific probability of not surviving from age a to
a þ 1 and let m q take a value of 1 if q is one of the reproductive years (15 to T where T is
the age at the end of one’s reproductive years: 49 years for women, 60 years for men) and
zero otherwise. We define the present expected value of the q th year of life of someone
who is now in their j th year, discounted at the rate of population growth g, as
V qj ¼ m qP[(1 2 d a )/(1 þ g)], where the product is over a ¼ j, …q. Then the
reproductive value of a person j years old is V j ¼ SV qj, where the summation is over
q ¼ j,…,T. Reproductive values are normalized using sex-specific reproductive values at
year 1 so v j=V j/V 1.
Table 1 The statistical relationship between observed and predicted remittances
Observed remittances, t Simple correlation,r (p)
Normalized regressioncoefficient, b (p)
.............................................................................................................................................................................
Average relatedness, r 20.03 (0.470) 0.11 (0.004)Reproductive-value-weighted relatedness, r v 0.14 (0.001) 0.13 (0.001)Predicted remittance, using r, t* 0.25 (,0.001) 0.11 (0.064)Predicted remittance using r v, tv 0.32 (,0.001) 0.18 (0.005)Predicted remittance (wife effect), tw 0.35 (,0.001) 0.21 (0.001).............................................................................................................................................................................
r is the correlation of the indicated variable with observed remittances t (with p-values inparentheses). b is the normalized regression coefficient of the variable indicted in the ordinaryleast-squares equation in which, in addition to the variables indicated here, predictors includedthe migrant’s age, schooling, the land owned by the household and whether the migrant’s wife ispresent in the household, as well as place-of-origin controls. Thus, a standard deviationdifference in tw holding these other variables constant is associated with a fifth of a standarddeviation difference (21%) in t.
letters to nature
NATURE | VOL 434 | 17 MARCH 2005 | www.nature.com/nature382© 2005 Nature Publishing Group
estimate for each migrant a new F-maximizing remittance of t w.Using this predictor in the multiple regression described above andin Table 1, and the samemethods as above, inclusive fitness accountsfor 29 per cent of the observed remittances. The ‘wife present’ effectremains large (38 per cent of the observed mean remittance(p , 0.0001)) in this equation, suggesting that although the wife’scontribution to inclusive fitness (as we have modelled it) helps toexplain remittances, most of the ‘wife present’ effect cannot beexplained this way.
The measurement of y, w and r im are all subject to error, and thisimparts a downward bias to our estimates of b. Moreover, otherfunctional forms would yield different predictions. Finally, in manycases migrants have formed households and fathered children in thelocality of their work20, thus raising the marginal fitness costs ofremitting in ways that our model does not capture. We experimen-ted by re-estimating t v assuming plausible (but hypothetical) valuesfor the composition of the typical migrant’s secondary family. Thisreduces the mean predicted transfer, as expected, but it does notincrease the fraction of the remittance accounted for by inclusivefitness. We doubt that addressing these limitations would alterthe conclusion that inclusive fitness explains part of remittancebehaviour, but not all of it. A
Received 15 November 2004; accepted 31 January 2005; doi:10.1038/nature03420.
1. Hamilton, W. D. The genetical evolution of social behavior. J. Theor. Biol. 7, 1–52 (1964).
2. Taylor, P. Inclusive fitness arguments in genetic models of behavior. J. Math. Biol. 34, 654–674
(1996).
3. Daly, M. & Wilson, M. Homicide and kinship. Am. Anthropol. 84, 372–378 (1982).
4. Gurven, M., Hill, K. & Kaplan, H. From forest to reservation: Transitions in food sharing among the
Ache of Paraguay. J. Anthropol. Res. 58, 93–120 (2002).
5. Case, A., Lin, I.-F. & McLanahan, S. How hungry is the selfish gene? Econ. J. 110, 781–804 (2000).
6. Anderson, K., Kaplan, H., Lam, D. & Lancaster, J. Paternal care by genetic fathers and stepfathers. II:
Reports by Xhosa high school students. Evol. Hum. Behav. 20, 433–451 (1999).
7. Gurven, M., Hill, K., Kaplan, H., Hurtado, A. M. & Lyles, R. Food transfers among Hiwi foragers of
Venezuela: Tests of reciprocity. Hum. Ecol. 28, 171–218 (2000).
8. Kaplan, H. & Hill, K. Food sharing among Ache foragers: tests of explanatory hypotheses. Curr.
Anthropol. 26, 223–246 (1985).
9. Smith, E. A., Bird, R. B. & Bird, D.W. Risk and reciprocity inMeriam food-sharing. Evol. Hum. Behav.
23, 297–321 (2002).
10. South Africa Integrated Household Survey: The Project for Statistics on Living Standards and
Development (A Living StandardsMeasurement Survey of theWorld Bank, South African Labour and
Development ResearchUnit, Univ. Cape Town, Cape Town, 1993); khttp://www.worldbank.org/html/
prdph/lsms/country/za94/za94home.htmll.11. Stevenson, A. C., Johnston, H. A., Stewart, M. I. & Golding, D. R. Congenital malformations: A report
of a study of series of consecutive births in 24 centres. Bull. World Health Org. 34 (suppl.), 1–127
(1966).
12. Mencarini, L. An Analysis of Fertility and Infant Mortality in South Africa based on 1993 LSDS Data
109–128 Pre-conf. Proc. of Third African Population Conf. ‘African Population in the 21st Century’
(Durban, South Africa, 6–10 December 1999) (UAPS, Dakar, Senegal, 1999).
13. Fisher, R. A. The Genetical Theory of Natural Selection 27–30 (Clarendon, Oxford, 1930).
14. Grafen, A. A Theory of Fisher’s Reproductive Value (St John’s College, Oxford, 2004).
15. Kahn, K., Tollman, S., Garenne,M. &Gear, J. S. S.Who dies fromwhat? Determining cause of death in
South Africa’s rural north-east. Trop. Med. Int. Health 4, 433–441 (1999).
16. Grafen, A. Formal darwinism, the individual-as-maximizing-agent analogy, and bet-hedging. Proc.
R. Soc. 266, 799–803 (1999).
17. Pennington, R. & Harpending, H. The Structure of an African Pastoralist Community: Demography,
History, and Ecology of the Ngamiland Herero (Clarendon, Oxford, 1993).
18. Fehr, E. & Fischbacher, U. The nature of human altruism—proximate patterns and evolutionary
origins. Nature 425, 785–791 (2003).
19. South Africa Demographic and Health Survey 1998 (Preliminary Report, Department of Health, 1998);
khttp://www.doh.gov.za/facts/1998/sadhs98/l.20. Posel, D. Intra-family transfers and income-pooling: A study of remittances in Kwazulu-Natal. S. Afr.
J. Econ. 69, 501–528 (2001).
21. World HealthOrganization. The World Health Report, 1999: Making a Difference 90, Table 1, Statistical
Appendix; kwww.who.int/entity/whr/1999/enl (WHO, Geneva, 1999).
Acknowledgements The authors contributed equally to this paper. D.P. thanks the Woodrow
Wilson School at Princeton University for the post-doctoral leave supporting this research. S.B.
thanks the Behavioural Sciences Program of the Santa Fe Institute for financial support. We have
benefited from the contributions of R. Boyd, N. Borgerhoff Mulder, N. Folbre, H. Kaplan,
R. Rowthorn and D. E. Smith.
Competing interests statement The authors declare that they have no competing financial
interests.
Correspondence and requests for materials should be addressed to D.P. ([email protected]).
..............................................................
Genetic effects on spermdesign in the zebra finchT. R. Birkhead1, E. J. Pellatt1, P. Brekke1, R. Yeates1 & H. Castillo-Juarez2
1Department of Animal & Plant Sciences, University of Sheffield, SheffieldS10 2TN, UK2Universidad Autonoma Metropolitana-Xochimilco, Calzada del Hueso 1100,Distrito Federal, CP 04960, Mexico.............................................................................................................................................................................
Sperm design and function are important determinants of malereproductive success and are expected to be under strong selec-tion1,2. The way that spermatozoa phenotypes evolve is poorlyunderstood, because there have been few studies of the quanti-tative genetics of sperm3–5. Here we show, in the zebra finchTaeniopygia guttata, an extraordinary degree of inter-male vari-ation in sperm design that is independent of sperm swimmingvelocity. A quantitative genetics study using data from over 900zebra finches in a complex breeding experiment showed thatsperm head, mid-piece and flagellum length are heritable, thatnegative genetic correlations exist between sperm traits, andthat significant indirect (maternal) genetic effects exist. Selectionon the zebra finch sperm phenotype may be low because spermcompetition is infrequent in this species6, and this, in combi-nation with negative genetic correlations and maternal geneticeffects, may account for the variation in sperm phenotypebetween males. These results have important implications forthe evolution of sperm in other taxa.The primary function of the male gamete, the spermatozoon, is
to fertilize ova. Sperm are expected to be under strong selection tobe efficient fertilizers for two reasons. First, within the femalereproductive tract sperm face numerous physical, chemical andimmunological barriers that result in only a tiny subset of insemi-nated sperm reaching the ovum7,8. Second, widespread promiscuityamong females results in sperm competition between males, whichfavours males whose sperm are effective competitors1. Interspecificdifferences in these evolutionary forces combined with phylogeneticeffects9 probably account for the fact that despite their commonpurpose, sperm vary more dramatically in size and design acrossspecies than any other cell type10. As well as the marked interspecificdifferences in sperm design, considerable inter-male variation insperm phenotype exists within species11.Here, we aimed to investigate the underlying causes of inter-male
variation in sperm design in the zebra finch Taeniopygia guttata byexamining the relationship between sperm phenotype, spermswimming velocity and the quantitative genetics of sperm traits.Heritabilities and other genetic parameters were estimated using theanimal model12 from a combined full-sibling and half-siblinganimal breeding design involving 81 sires producing two sonsfrom each of six dams (972 male offspring; entire pedigreecomprising 1,526 individuals) and analysed using the multiple-trait, derivative-free, restricted maximum-likelihood program(MTDFREML)13.Within males the repeatability of sperm traits was substantial,
particularly for mid-piece (0.75) and flagellum (0.84) length(repeatability for head length was 0.52, all degrees of freedom(d.f.) ¼ 913, 3,656; P , 0.001), and we have shown elsewherethat within-male variation in sperm design is highly consistentacross ejaculates and time14. In contrast, between-male phenotypicvariation in sperm design was considerable (Fig. 1 and Table 1). Theinter-male coefficients of variation in sperm flagellum length andmid-piece length were two and four times greater, respectively, thanfor the linear morphological trait of male tarsus length (coefficientof variation ¼ 3.38, n ¼ 972 males).Sperm motility is determined largely by the flagellum and the
letters to nature
NATURE |VOL 434 | 17 MARCH 2005 | www.nature.com/nature 383© 2005 Nature Publishing Group