Embed Size (px)
Citation preview
Gfi
IHTa
b
c
d
e
f
g
C
a
ARRAA
KMGAGM
1
c(fi
h0
Fisheries Research 174 (2016) 234–244
Contents lists available at ScienceDirect
Fisheries Research
j ourna l ho me pa ge: www.elsev ier .com/ locate / f i shres
enetic mixed stock analysis of an interceptory Atlantic salmonshery in the Northwest Atlantic
an R. Bradburya,∗, Lorraine C. Hamiltonb, Gerald Chaputc, Martha J. Robertsona,erlé Goraguerd, Arthur Walsha, Vicki Morrisa, David Reddina, J. Brian Dempsona,imothy F. Sheehane, Timothy Kingf, Louis Bernatchezg
Science Branch, Fisheries and Oceans Canada, 80 East White Hills Road, St. John’s NL. A1C 5X1, CanadaBedford Institute of Oceanography, Fisheries and Oceans Canada, Dartmouth, Halifax, Nova Scotia B2Y 4A2, CanadaCentre for Science Advice, Gulf Region, Fisheries and Oceans Canada, Moncton, New Brunswick E1C 9B6, CanadaIfremer, Saint Pierre et Miquelon, FranceNOAA Fisheries Service, Northeast Fisheries Science Center, 166 Water Street, Woods Hole, MA 02543, USAUnited States Geological Survey, Leetown Science Center, 11649 Leetown Road, Kearneysville, WV 25430, USADépartement de Biologie, Institut de Biologie Intégrative et des Systèmes (IBIS), Université Laval, 1030 avenue de la Médecine, Québec, Québec G1 V 0A6,anada
r t i c l e i n f o
rticle history:eceived 28 July 2015eceived in revised form 6 October 2015ccepted 9 October 2015vailable online 27 October 2015
eywords:ixed-stock analysisenetic assignmenttlantic salmonenetic structureicrosatellites
a b s t r a c t
Interceptory fisheries represent an ongoing threat to migratory fish stocks particularly when managed inthe absence of stock specific catch and exploitation information. Atlantic salmon from the southern por-tion of the North American range may be subject to exploitation in the commercial and recreationalsalmon fisheries occurring in the French territorial waters surrounding St. Pierre and Miquelon offsouthern Newfoundland. We evaluated stock composition of Atlantic salmon harvested in the St. Pierreand Miquelon Atlantic salmon fishery using genetic mixture analysis and individual assignment with amicrosatellite baseline (15 loci, 12,409 individuals, 12 regional groups) encompassing the species west-ern Atlantic range. Individual salmon were sampled from the St. Pierre and Miquelon fishery over fouryears (2004, 2011, 2013, and 2014). Biological characteristics indicate significant variation among yearsin the size and age distribution. Nonetheless, estimates of stock composition of the samples showedconsistent dominance of three regions (i.e., Southern Gulf of St. Lawrence, Gaspe Peninsula, and New-foundland). Together salmon from these regions accounted for more than 70% of annual harvest over thedecade examined. Comparison of individual assignments and biological characteristics revealed a trendof declining fresh water age with latitude of assigned region. Moreover, locally harvested Newfoundlandsalmon were ten times more likely to be small or one sea winter individuals whereas Quebec and Gaspe
Peninsula salmon were two-three times more likely to be harvested as large or two sea winter salmon.Estimates of region specific catch were highest for salmon from the southern Gulf of St. Lawrence regionranging from 242 to 887 individuals annually. This work illustrates how genetic analysis of interceptorymarine fisheries can directly inform assessment and management efforts in highly migratory marinespecies.© 2015 Elsevier B.V. All rights reserved.
. Introduction
Mixed stock fisheries target admixtures of populations and are
ommon for many migratory anadromous or marine fish speciesChase, 2003; Schindler et al., 2010; Utter and Ryman, 1993). Thesesheries risk a reduction of biodiversity and the over exploitation∗ Corresponding author.E-mail address: [email protected] (I.R. Bradbury).
ttp://dx.doi.org/10.1016/j.fishres.2015.10.009165-7836/© 2015 Elsevier B.V. All rights reserved.
of rare constituents as the stock composition of mixed harvestsare often unknown (Crozier et al., 2004; Saunders, 1981). A vari-ety of approaches have been used to disentangle the compositionof mixed stock fisheries including the application of physical tags(Candy and Beacham, 2000; Reddin et al., 2012; Weitkamp andNeely, 2002), morphometric analysis (e.g., Reddin and Friedland,
1999; Shepard et al., 2010), geochemistry (Campana et al., 1999;Fraile et al., 2015; Jónsdóttir et al., 2007), and molecular geneticapproaches (Araujo et al., 2014; Ensing et al., 2013; Ruzzante et al.,2000). Despite obvious risks, dramatic reductions in catch variation
es Res
hiSars
ms(bSeamtrst1smTaFghctofiieMa
agupiatpcfitaa2pqD
iipwfiprlrar
I.R. Bradbury et al. / Fisheri
ave been observed in mixed stock fisheries over time as productiv-ty can be buffered by intraspecific diversity (Hilborn et al., 2003;chindler et al., 2010). Given the complexity and potential risksnd benefits, understanding contributions to mixed stock fisheriesemain an ongoing challenge for fisheries management and con-ervation.
Mixed stock fisheries have been extensively studied in anadro-ous salmonids, particularly Pacific salmon species, where genetic
tock identification has been used to manage coastal fisheriesBeacham et al., 2004; Shaklee et al., 1998). However, as geneticaselines are established in more species, such as Atlantic salmon,almo salar (e.g., Bradbury et al., 2015; Ensing et al., 2013; Griffithst al., 2010; Moore et al., 2014), new opportunities exist for broaderpplication. Atlantic salmon, have traditionally been subject toixed stock harvests during the marine phase of their life his-
ory, commonly associated with marine feeding areas or migratoryoutes (e.g., Chase, 2003; Saunders, 1981). In the western Atlantic,almon migrate to the Labrador Sea or the waters west of Greenlando feed (Pippy, 1982; Reddin, 1988; Reddin and Short, 1991; Ritter,989) and although, most commercial marine fisheries for Atlanticalmon have ceased, three remaining marine fisheries may exploitixed stocks of wild Atlantic salmon in the Northwest Atlantic.
hese include the Labrador subsistence food fisheries, the fisheryt West Greenland, and a fishery in the waters surrounding therench islands of St. Pierre and Miquelon (ICES, 2015). Previousenetic based mixture analysis of the Labrador and West Greenlandarvests have revealed contrasting patterns in stock compositiononsistent with their location on migratory routes of salmon at sea;he Labrador salmon fisheries harvesting predominantly Labradorrigin salmon (96%, Bradbury et al., 2015) and the west Greenlandshery harvesting a mixture of stocks from eastern North Amer-
ca as well as from Europe (Gauthier-Ouellet et al., 2009; Sheehant al., 2010). However, the stock composition of the St. Pierre andiquelon Atlantic salmon fishery has to date not been determined
nd remains of concern to management and conservation efforts.The Atlantic salmon fishery in the French territorial waters
round St. Pierre and Miquelon is a commercial and recreationalillnet fishery reported to harvest as much as 5 ton or 2300 individ-als annually in recent years (ICES, 2015). In the absence of salmonroducing rivers in St. Pierre and Miquelon, the fishery is entirely
nterceptory in nature, likely targeting southern stocks migratinground southeastern Newfoundland. As many of these regions tohe south have experienced dramatic declines and record lows inroductivity (COSEWIC, 2011; DFO, 2013a,b; Fay et al., 2006), con-erns persist regarding possible inception and exploitation in thisshery. Atlantic salmon stocks in the southern Newfoundland por-ion have declined by as much as 70% and were recently assesseds threatened, whereas stocks in the New Brunswick and the USAre at risk of extinction (COSEWIC, 2011; DFO, 2013b; Fay et al.,006; Robertson et al., 2013). The threat this fishery may pose toersistence and recovery of these stocks ultimately remains to beuantified and continues to be an issue of concern (COSEWIC, 2011;FO, 2013a,b).
The goal of this work was to determine the origin of the salmonntercepted in this mixed stock gill net fishery for Atlantic salmonn the waters surrounding St. Pierre and Miquelon and to quantifyotential impacts on those salmon populations. The main objectiveas to estimate the stock composition of salmon harvested in thisshery using genetic stock identification and to examine the tem-oral stability of the catch composition. The work builds directly onecent initiatives to develop a North American microsatellite base-ine for Atlantic salmon, including samples from two additional
ivers of the eastern USA. Using this baseline, accurate mixturenalysis and individual assignment to 12 regional North Americaneporting groups is possible. In conjunction with catch logs, theseearch 174 (2016) 234–244 235
estimates of stock composition will allow the magnitude of fisheryharvest for the various contributing stocks to be estimated.
2. Methods
2.1. Baseline samples
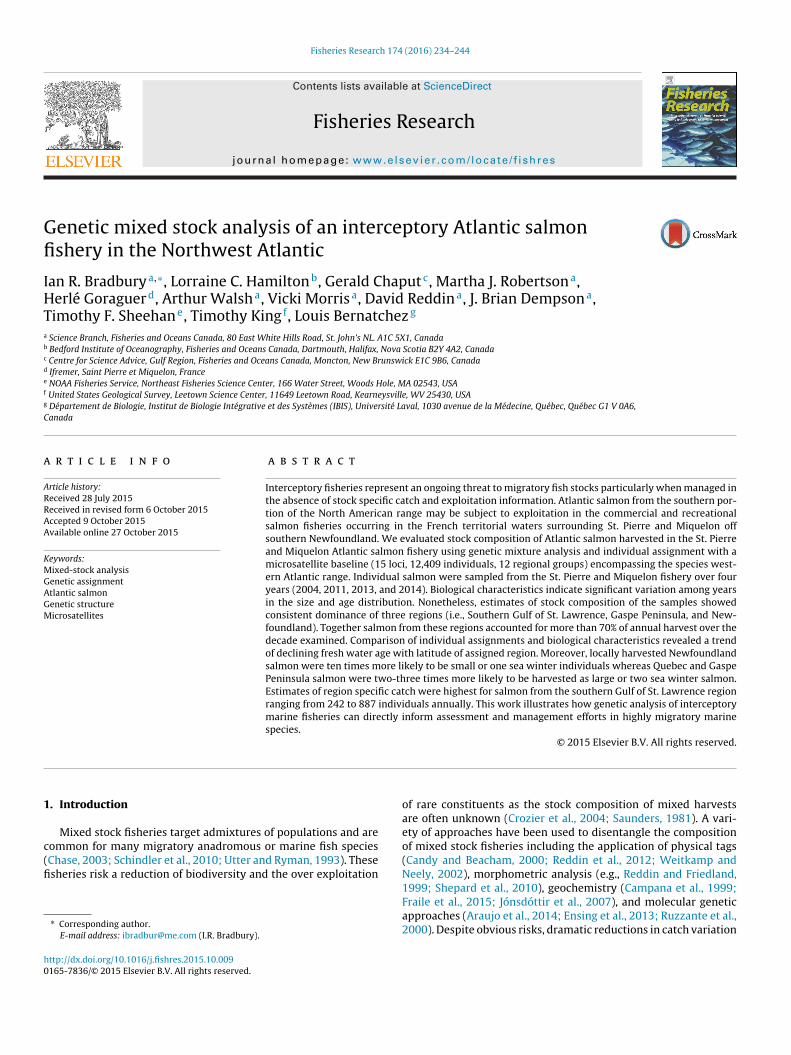
Baseline samples encompassed 12067 individuals spanning 194individual rivers ranging from Ungava Bay in the north to theSheepscot River in Maine to the south (Fig. 1, Table 1). Data includedin the baseline represented a combination of previously analyzeddatasets (see Bradbury et al., 2014; Dionne et al., 2008 for regionalanalyses and further details) and new data (see Bradbury et al.,2015; Moore et al. 2014 for methods and database details). Thebaseline differs from previous analyses in that two additional riverswere included to better represent US salmon populations. Thesewere the Sheepscot River and the Narraguagus River, both locatedin the state of Maine (Fig. 1). Baseline accuracy for mixture analysisand individual assignment have been extensively explored previ-ously (see Bradbury et al., 2015; Moore et al., 2014), but limitedre-analysis has been conducted here to assess the impact of theinclusion of the two additional populations.
2.2. Fishery samples
The St. Pierre and Miquelon (SPM) Atlantic salmon fisheryis comprised of commercial and recreational gill net harvestsoccurring in the French coastal waters surrounding St. Pierre andMiquelon. The fishery generally occurs from May 1st to July 31stannually (Goraguer, 2011). The dominant gear type consists of5 inch gill nets of 360 m length for commercial fishers and 180 mlength for recreational fishers. Although fishing may occur aroundthe islands, the majority of fishing occurs close to the southeastportion of St. Pierre (Goraguer, 2011). Sampling of the Atlanticsalmon fishery at St. Pierre and Miquelon was conducted by Ifre-mer (i.e., French Research Institute for the Exploration of the Sea)in 2004, 2011, 2013, and 2014 as early as 24 May in 2013 to 7 Julyin 2011. Adipose fin clips for 3–11% of the harvest were collected in2011, 2013 and 2014 for genetic stock identification whereas scalesamples were used in 2004. Biological characteristics informationcollected included length (cm), weight (gutted, kg), and scale sam-ples were used for interpretation of river age, sea age, and spawninghistory.
2.3. DNA extraction and genotyping fishery samples
DNA extraction and microsatellite genotyping of all fisherysamples were carried out at the Aquatic Biotechnology Labora-tory (Fisheries and Oceans Canada). DNA was extracted usingthe Qiagen DNeasy 96 Blood and Tissue extraction kit (Qiagen)following the guidelines of the manufacturer. DNA was quanti-fied using QuantIT PicoGreen (Life Technologies) and diluted toa final concentration of 10 ng/�L in 10 mM Tris (Buffer EB, Qia-gen). Microsatellite polymorphisms were scored at the following15 loci: Ssa85, Ssa202, Ssa197 (O’Reilly et al., 1996), SSOSL417(Slettan et al., 1995), SsaD85 (King, unpublished), SsaD58, SsaD71,SsaD144, SsaD486 (King et al., 2005), MST-3 (hereafter referred toas U3) (Presa and Guyomard, 1996), SSsp2201, SSsp2210, SSsp2215,SSsp2216 and SSspG7 (Paterson et al., 2004). Genotyping of fisherysamples followed the methods outlined in Bradbury et al. (2015)and Bradbury et al. (2014). In short, loci were multiplexed intothree panels either by combining loci amplified individually prior
to electrophoresis, or by multiplexing at the PCR stage. The PCRreactions for single locus amplification were set up in a 10 �L vol-ume containing 20 ng DNA, 1X PCR buffer (KCl buffer or (NH4)2SO4(Fermentas) (Table S4)), 1.5–2.5 mM MgCl2 (Fermentas), 0.2 mM
236 I.R. Bradbury et al. / Fisheries Research 174 (2016) 234–244
Fig. 1. Map of sample locations used in microsatellite baseline for Atlantic salmon in North America. See Bradbury et al. (2015) for details and Table 1 for location abbreviations.Location of St. Pierre and Miquelon, the Cabot Strait, and the Strait of Belle Isle indicated by black arrows. Modified from Bradbury et al. (2015) and Moore et al. (2014).
Table 1Reporting groups in the North American Atlantic salmon microsatellite baseline. See Fig. 1 for locations and Bradbury et al. (2014, 2015) for sample details.
Region Code Individual Samples Rivers
Ungava Bay and Northern Labrador UNG 191 4Central Labrador LAB 1501 25Quebec Lower North Shore and Southern Labrador QLS 579 10Newfoundland NFL 3531 48Avalon Peninsula, NL AVA 1302 14Quebec Higher North Shore and Quebec City QUE 710 15Gaspe Peninsula GAS 1055 21Anticosti Island ANT 140 3Southern Gulf/Cape Breton GUL 1580 30Nova Scotia NOS 734 13
N
A
tals
dpcTPnaT
Inner Bay of Fundy FUUnited States of America US
To
NTP’s, 0.1 �M of each primer and 0.5 U Taq (Fermentas). For multi-lex amplification, the PCR reactions were set up in a 10 �L volumeontaining 10 ng DNA, 1X Type-it Multiplex PCR Master Mix (fromype-it Microsatellite PCR kit (Qiagen)) and primer mix (Table S4).CR products were size separated on an AB 3130xl (Life Tech-
ologies) capillary electrophoresis system using Gene Scan 500s the internal size standard (labelled in LIZ (Life Technologies)).he resulting electropherograms were analyzed using Gene Map-406 8338 312067 194
per 4.0 (Life Technologies) (see Bradbury et al. (2014) for furtherdetails).
2.4. Baseline and mixture analysis
Reporting groups were previously identified and evaluated foruse in mixture analysis elsewhere (Bradbury et al., 2015; Mooreet al., 2014). In total, 12 reporting groups were used for individ-ual assignment and mixture analysis (Fig. 1, Table 1). However
es Res
atruWloiraumte
tli(ttuieeu5lyK
2
Pb2wlnPanatsms
3
sn29rlr
3
M2s
I.R. Bradbury et al. / Fisheri
s the previously published baseline had been slightly modifiedhrough the addition of samples from two additional US rivers, wee-evaluated the accuracy of both mixture analysis and individ-al assignment using similar approaches (Bradbury et al., 2015).e used the approach of Anderson et al. (2008) which yields
argely unbiased assessments of GSI accuracy and uses leave-one-ut cross validation to simulate mixtures and estimate accuracy asmplemented in ONCOR. 100% simulations were conducted whereandom samples of each of baseline population were simulatednd analyzed. This was repeated 1000 times for each populationsing simulated fishery samples constructed using the resamplingethod outlined in Anderson et al. (2008). Results were compared
o previous estimates of accuracy (see Bradbury et al., 2015; Mooret al., 2014).
Two general approaches for individual assignment and mix-ure analyses were utilized. First, we used a conditional maximumikelihood method to estimate mixture proportions and assignndividuals (Millar, 1987) as implemented in the program ONCORKalinowski et al., 2007). Mixture proportions are estimated usinghe EM algorithm, and genotype probabilities are calculated usinghe method of Rannala and Mountain (1997). The second approachses the Bayesian mixture model (Pella and Masuda, 2001) as
mplemented in cBAYES (Neaves et al., 2005). In this analysisight 100 000 iteration Monte Carlo Markov chains were produced,ach with starting values set at 0.90. Convergence was assessedsing a shrink factor (<1.2 indicating convergence) and the last000 iterations of each chain were combined and used to calcu-
ate stock composition. Comparisons of stock composition betweenears, age groups, or size classes were made using two-sampleomolgorov–Smirnov (K–S) tests (Sokal and Rohlf, 1995).
.5. Region specific harvests
The reported harvested weights of Atlantic salmon in the St.ierre and Miquelon fishery for 2004–2014 were converted to num-ers of salmon based on limited sampling from the 2004, 2011,013, and 2014 fisheries. An average weight of 2.254 kg per fishas used and the proportion of small salmon (less than 63 cm fork
ength) was assumed to be 0.75 of the total number harvested. Theumbers of salmon from each regional group in the fishery at St.ierre & Miquelon in 2004–2014 were estimated using the mixturenalysis estimates of regional contributions from above. A multi-omial distribution was used to model the mixture proportionsnd these were raised to the total catch (number of salmon) inhe fisheries. A total of 1000 simulations were conducted. In eachimulation, the proportion contribution of each regional group wasodelled with a beta distribution parameterized by the mean and
tandard errors from the mixture analysis outputs.
. Results
Performance of the updated baseline was evaluated using 100%imulations to ensure that the addition of two new samples didot alter accuracy from levels previously reported (Bradbury et al.,015; Moore et al., 2014). Overall accuracy of mixture analysis was7.6% across the 12 reporting groups. Mixture analysis accuracyemained high for the US reporting group (∼99%, Fig. S1). Simi-arly correct individual assignment to the US reporting group alsoemained high (∼94%) with the increase in baseline samples.
.1. Fishery samples
A total of 353 individuals was sampled from the St. Pierre andiquelon fisheries during 2004 (138), 2011 (73), 2013(71), and
014(71) with an average of 88 individuals per year. There wasignificant annual variation in the biological characteristics of the
earch 174 (2016) 234–244 237
sampled fish with 81% of the samples from 2004 being salmon<63 cm, 39% and 42% of samples from 2013 and 2014 were smallsalmon, and 12% of samples from 2011 being small salmon (Fig. 2).For the 2011 samples, only size data were available and individualbiological data could not be matched to the tissue samples. Overyears with available information, the sampled catch was dominatedby salmon with freshwater ages of 2 and 3 years (Fig. 3). Consistentwith the differences in size of salmon sampled, the samples from2004 were dominated by one sea winter salmon compared to 2013and 2014 which were predominately two sea winter salmon (Fig. 3).Based on size frequency, the 2011 sampled salmon would also havebeen two sea winter salmon.
3.2. Mixture analysis
Bayesian and maximum likelihood estimates were similar(Fig. 4, Fig. S2) and as such only Bayesian estimates are consideredhere. Estimates of stock composition show consistent dominanceof three regions, Southern Gulf of St. Lawrence/Cape Breton, GaspePeninsula, and Newfoundland which together account for >70% ofthe samples over all years (Fig. 4, Table 2). The dominance of thesestocks was stable over the years sampled (K–S-test, p-value > 0.5).Small (<5%) but significant contributions were present from Que-bec Higher North Shore, Nova Scotia, Avalon Peninsula, QuebecSouthern Labrador, and Central Labrador. Individual region assign-ments showed a positive association between freshwater river ageand latitude of the region and average sea age was lowest for theindividuals assigned to the both Newfoundland and the AvalonPeninsula (Fig. 5).
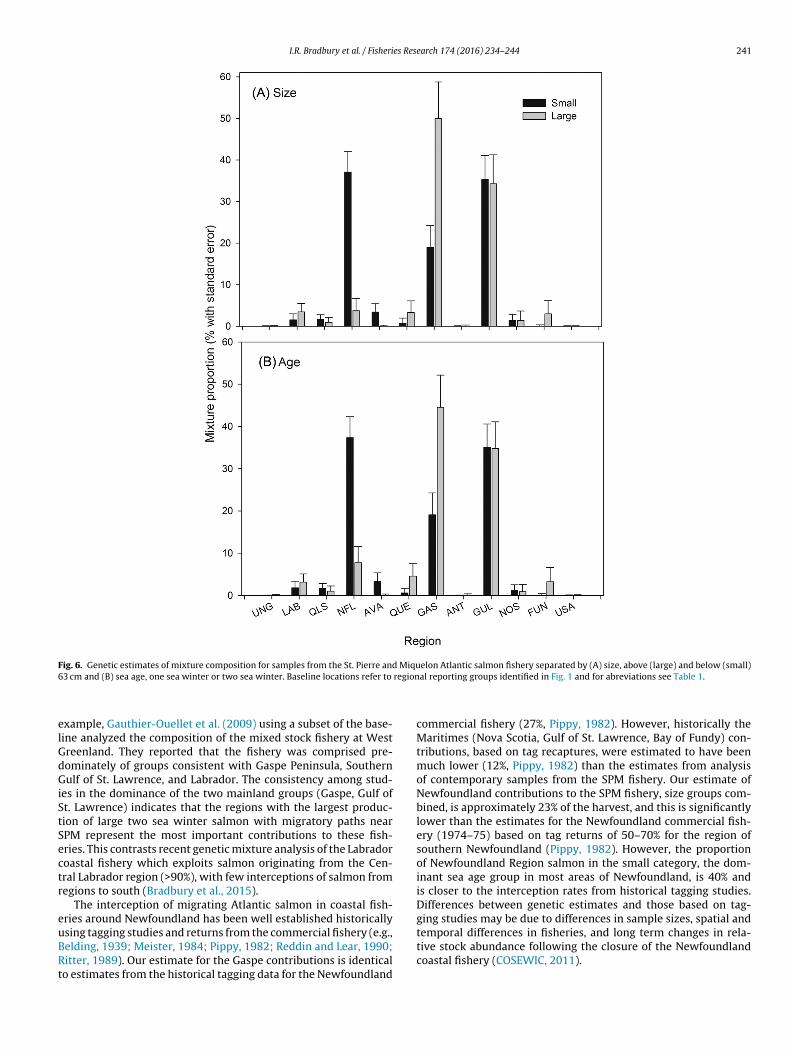
Although partitioning the samples by size or age did not result instatistically significant differences in the stock composition overall(size, K–S-test, D = 0.25, p = 0.869; age, d = 0.167, p = 0.233), therewere notable differences in two regional contributions by size orage. Small salmon (<63 cm) samples were most frequently assignedto the Newfoundland region (∼40% of individuals) followed by Gulfof St. Lawrence/Cape Breton (∼35% individuals) and Gaspe (∼20%individuals, Fig. 6). This contrasts large salmon samples which wereassigned primarily to Gaspe Region (∼50%) followed by Gulf of St.Lawrence/Cape Breton (∼35%) and minor contributions (<5%) forall other regional groups (Fig. 6).
3.3. Region specific harvests
Region specific annual catches by regional group were estimatedfor the time period over which samples were analyzed (2004–2014)using the aggregated overall estimates of stock composition. Esti-mated annual harvests ranged from approximately 643 salmon in2012 to 2351 in 2013 (Table 3, Fig. 7). The highest regional specificcatch was associated with the Southern Gulf/Cape Breton regionat 887 salmon in 2013 (Table 3, Fig. 7). The range in catch peryear allocated to dominant contributors was 170–627 individualsfor Gaspe Peninsula, 151–550 individuals for Newfoundland, and242–887 individuals for Southern Gulf of St. Lawrence/Cape Bre-ton (Fig. 7, Table 3). Fundy, USA, Ungava, and Anticosti were largelyabsent from the mixtures and hence made little if any estimatedcontribution to the fishery.
4. Discussion
Interceptory fisheries represent an ongoing challenge to fish-eries management as stock specific composition and exploitationinformation are often lacking (Chase, 2003; Crozier et al., 2004;
Saunders, 1981; Utter and Ryman, 1993). In the short term, thesefisheries can threaten the persistence of depressed or endangeredstocks and ultimately can erode intraspecific diversity (Hilbornet al., 2003; Schindler et al., 2010). In this study we used genetic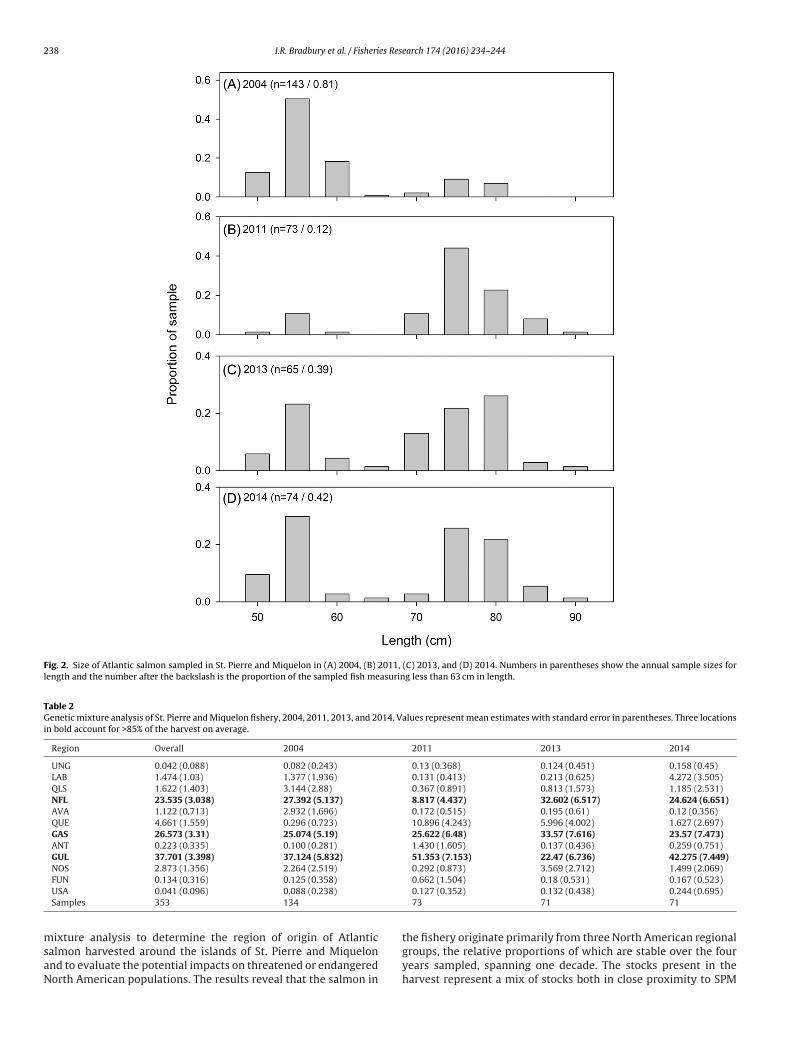
238 I.R. Bradbury et al. / Fisheries Research 174 (2016) 234–244
Fig. 2. Size of Atlantic salmon sampled in St. Pierre and Miquelon in (A) 2004, (B) 2011, (C) 2013, and (D) 2014. Numbers in parentheses show the annual sample sizes forlength and the number after the backslash is the proportion of the sampled fish measuring less than 63 cm in length.
Table 2Genetic mixture analysis of St. Pierre and Miquelon fishery, 2004, 2011, 2013, and 2014. Values represent mean estimates with standard error in parentheses. Three locationsin bold account for >85% of the harvest on average.
Region Overall 2004 2011 2013 2014
UNG 0.042 (0.088) 0.082 (0.243) 0.13 (0.368) 0.124 (0.451) 0.158 (0.45)LAB 1.474 (1.03) 1.377 (1.936) 0.131 (0.413) 0.213 (0.625) 4.272 (3.505)QLS 1.622 (1.403) 3.144 (2.88) 0.367 (0.891) 0.813 (1.573) 1.185 (2.531)NFL 23.535 (3.038) 27.392 (5.137) 8.817 (4.437) 32.602 (6.517) 24.624 (6.651)AVA 1.122 (0.713) 2.932 (1.696) 0.172 (0.515) 0.195 (0.61) 0.12 (0.356)QUE 4.661 (1.559) 0.296 (0.723) 10.896 (4.243) 5.996 (4.002) 1.627 (2.697)GAS 26.573 (3.31) 25.074 (5.19) 25.622 (6.48) 33.57 (7.616) 23.57 (7.473)ANT 0.223 (0.335) 0.100 (0.281) 1.430 (1.605) 0.137 (0.436) 0.259 (0.751)GUL 37.701 (3.398) 37.124 (5.832) 51.353 (7.153) 22.47 (6.736) 42.275 (7.449)NOS 2.873 (1.356) 2.264 (2.519) 0.292 (0.873) 3.569 (2.712) 1.499 (2.069)
msaN
FUN 0.134 (0.316) 0.125 (0.358)
USA 0.041 (0.096) 0.088 (0.238)
Samples 353 134
ixture analysis to determine the region of origin of Atlanticalmon harvested around the islands of St. Pierre and Miquelonnd to evaluate the potential impacts on threatened or endangeredorth American populations. The results reveal that the salmon in
0.662 (1.504) 0.18 (0.531) 0.167 (0.523)0.127 (0.352) 0.132 (0.438) 0.244 (0.695)73 71 71
the fishery originate primarily from three North American regionalgroups, the relative proportions of which are stable over the fouryears sampled, spanning one decade. The stocks present in theharvest represent a mix of stocks both in close proximity to SPM

I.R. Bradbury et al. / Fisheries Research 174 (2016) 234–244 239
Fig. 3. River age and virgin sea age of Atlantic salmon sampled in St. Pierre and Miquelon in (A) 2004, (B) 2013, and (C) 2014. Age data not available for 2011 genetic samples.
Table 3Region specific catch estimates for the St. Pierre and Miquelon Atlantic Salmon fishery 2004–2014 (mean estimate with 10th and 90th percentiles). Estimates based on overallaverage genetic estimate of stock composition in the harvest and annual reported catches (Table 2). Baseline locations refer to regional reporting groups identified in Fig. 1and for abreviations see Table 1.
Year Catch UNG LAB QLS NFL AVA QUE GAS ANT GUL NOS FUN USA
2004 1235 0(0–2) 16(4–36) 15(3–41) 292(246–339) 12(4–25) 54(33–82) 326(276–377) 1(0–8) 467(418–523) 32(15–58) 0(0–6) 0(0–2)2005 1458 0(0–2) 18(5–41) 18(3–52) 340(288–396) 14(4–32) 65(39–97) 385(332–442) 1(0–10) 550(490–620) 38(18–70) 0(0–6) 0(0–2)2006 1577 0(0–2) 19(6–46) 19(3–52) 371(310–433) 15(5–33) 71(41–108) 417(358–480) 1(0–9) 597(531–661) 42(20–74) 0(0–7) 0(0–2)2007 863 0(0–1) 11(3–26) 11(2–30) 204(169–239) 8(2–18) 38(23–59) 229(196–268) 1(0–6) 324(289–361) 23(10–42) 0(0–4) 0(0–1)2008 1570 0(0–2) 20(6–46) 19(3–53) 371(313–429) 15(5–34) 71(43–105) 418(357–479) 1(0–11) 591(529–656) 41(20–75) 0(0–7) 0(0–2)2009 1535 0(0–2) 18(5–42) 17(4–50) 360(305–414) 16(4–33) 70(42–105) 408(345–467) 1(0–10) 581(520–643) 41(20–75) 0(0–6) 0(0–2)2010 1233 0(0–2) 15(4–34) 16(3–42) 289(245–336) 12(4–27) 56(34–83) 327(278–377) 1(0–8) 464(415–517) 33(15–58) 0(0–6) 0(0–2)2011 1666 0(0–2) 22(5–46) 20(4–62) 392(332–452) 16(5–35) 76(48–114) 441(377–509) 1(0–11) 630(561–695) 43(20–78) 0(0–7) 0(0–2)
17–44(65–146–11
(Sbhfrfisrts
2012 643 0(0–1) 8(2–18) 7(1–23) 151(127–179) 6(1–14) 28(2013 2351 0(0–3) 29(9–67) 28(6–79) 550(471–632) 23(7–48) 1072014 1690 0(0–2) 20(6–48) 20(3–58) 400(339–458) 16(5–35) 75(
i.e., Newfoundland) and stocks originating from within the Gulf oft. Lawrence and other southern areas migrating past SPM. Scaledy annual harvest amounts, regional harvests represented severalundred fish (∼200–900). This study indicates that Atlantic salmon
rom several regions of the southern portion of North Americanange are subject to exploitation in the commercial and recreationalsheries of the French territorial waters surrounding SPM. Genetic
tock identification of catch composition in this instance allowsegion specific harvests to be calculated and levels of exploita-ion examined directly informing the conservation of Atlanticalmon.) 170(144–198) 0(0–5) 242(213–272) 18(8–32) 0(0–2) 0(0–1)59) 627(537–720) 2(0–14) 887(796–980) 63(31–111) 0(0–9) 0(0–3)5) 449(384–513) 2(0–10) 641(573–704) 44(21–79) 0(0–6) 0(0–2)
4.1. Stock proportions
Mixed stock fisheries commonly exploit fish populations eitherin feeding areas or along migratory routes (e.g., Bekkevold et al.,2011; Ruzzante et al., 2000; Shepard et al., 2010). The results ofthis study indicate that the catch composition of the SPM Atlanticsalmon fishery is dominated by three regions including (1) Gaspe
Peninsula, (2) the Southern Gulf of St. Lawrence/Cape Breton, and(3) Newfoundland. The estimates of stock composition are largelyconsistent with expectations based on region specific productiv-ity and other genetic mixed stock studies in North America. For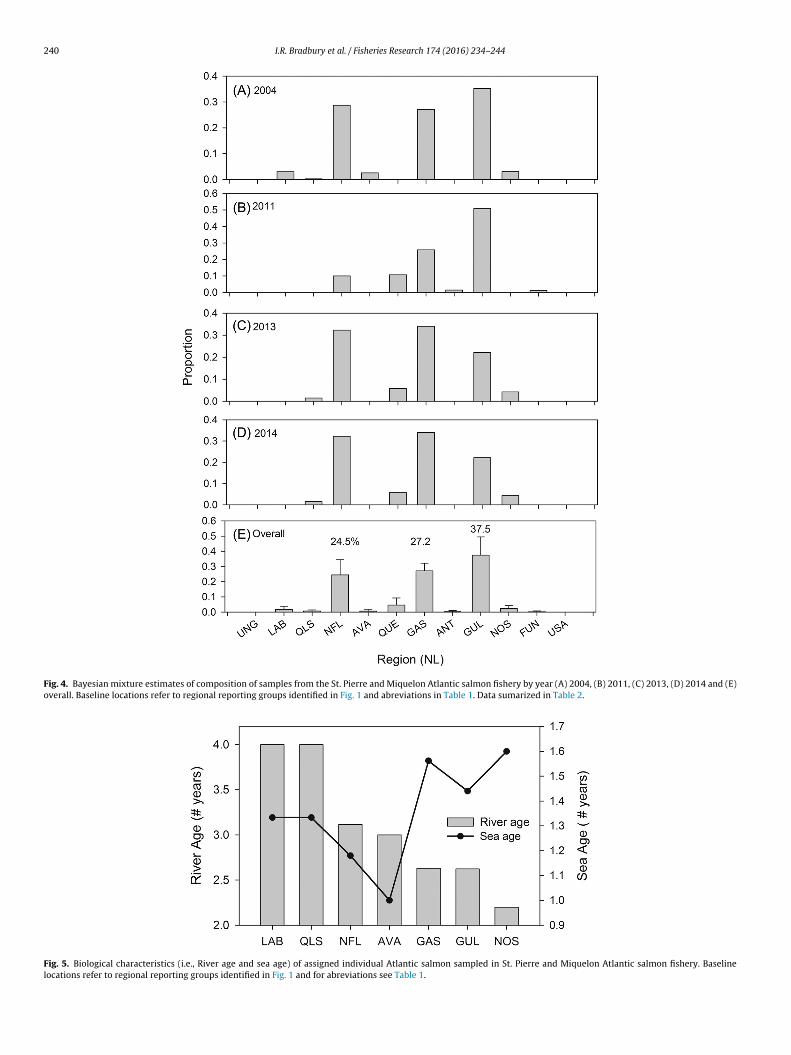
240 I.R. Bradbury et al. / Fisheries Research 174 (2016) 234–244
Fig. 4. Bayesian mixture estimates of composition of samples from the St. Pierre and Miquelon Atlantic salmon fishery by year (A) 2004, (B) 2011, (C) 2013, (D) 2014 and (E)overall. Baseline locations refer to regional reporting groups identified in Fig. 1 and abreviations in Table 1. Data sumarized in Table 2.
Fig. 5. Biological characteristics (i.e., River age and sea age) of assigned individual Atlantic salmon sampled in St. Pierre and Miquelon Atlantic salmon fishery. Baselinelocations refer to regional reporting groups identified in Fig. 1 and for abreviations see Table 1.
I.R. Bradbury et al. / Fisheries Research 174 (2016) 234–244 241
Fig. 6. Genetic estimates of mixture composition for samples from the St. Pierre and Miquelon Atlantic salmon fishery separated by (A) size, above (large) and below (small)6 region
elGdGiStSectr
euBRt
3 cm and (B) sea age, one sea winter or two sea winter. Baseline locations refer to
xample, Gauthier-Ouellet et al. (2009) using a subset of the base-ine analyzed the composition of the mixed stock fishery at Westreenland. They reported that the fishery was comprised pre-ominately of groups consistent with Gaspe Peninsula, Southernulf of St. Lawrence, and Labrador. The consistency among stud-
es in the dominance of the two mainland groups (Gaspe, Gulf oft. Lawrence) indicates that the regions with the largest produc-ion of large two sea winter salmon with migratory paths nearPM represent the most important contributions to these fish-ries. This contrasts recent genetic mixture analysis of the Labradoroastal fishery which exploits salmon originating from the Cen-ral Labrador region (>90%), with few interceptions of salmon fromegions to south (Bradbury et al., 2015).
The interception of migrating Atlantic salmon in coastal fish-ries around Newfoundland has been well established historically
sing tagging studies and returns from the commercial fishery (e.g.,elding, 1939; Meister, 1984; Pippy, 1982; Reddin and Lear, 1990;itter, 1989). Our estimate for the Gaspe contributions is identicalo estimates from the historical tagging data for the Newfoundlandal reporting groups identified in Fig. 1 and for abreviations see Table 1.
commercial fishery (27%, Pippy, 1982). However, historically theMaritimes (Nova Scotia, Gulf of St. Lawrence, Bay of Fundy) con-tributions, based on tag recaptures, were estimated to have beenmuch lower (12%, Pippy, 1982) than the estimates from analysisof contemporary samples from the SPM fishery. Our estimate ofNewfoundland contributions to the SPM fishery, size groups com-bined, is approximately 23% of the harvest, and this is significantlylower than the estimates for the Newfoundland commercial fish-ery (1974–75) based on tag returns of 50–70% for the region ofsouthern Newfoundland (Pippy, 1982). However, the proportionof Newfoundland Region salmon in the small category, the dom-inant sea age group in most areas of Newfoundland, is 40% andis closer to the interception rates from historical tagging studies.Differences between genetic estimates and those based on tag-ging studies may be due to differences in sample sizes, spatial and
temporal differences in fisheries, and long term changes in rela-tive stock abundance following the closure of the Newfoundlandcoastal fishery (COSEWIC, 2011).
242 I.R. Bradbury et al. / Fisheries Research 174 (2016) 234–244
F lmon
c region
4
bgevfsorpptaisTaimti(oafas
4
set
ig. 7. Region specific catch estimates for the St. Pierre and Miquelon Atlantic Saomposition in the harvest and annual reported catches. Baseline locations refer to
.2. Biological characteristics
Our estimates of mixture composition are further supported byiological characteristics of assigned individuals and known geo-raphic variation of life history traits in the wild (e.g., O’Connellt al., 2006; Power, 1981). Atlantic salmon populations exhibitarious life histories, with southern populations displaying fasterreshwater development, younger river ages and on average olderea ages at maturity (Hutchings and Jones, 1998). Our observationf average sea age being highest in individuals assigned to southerneporting groups and lowest in Newfoundland is consistent withrevious observations that Newfoundland salmon populations areredominately small salmon and large salmon are more common tohe south of the North American range (COSEWIC, 2011; Hutchingsnd Jones, 1998; O’Connell et al., 2006). Also, average river age ofndividuals assigned to regions declined with latitude which is con-istent with expected spatial trends in life history (Power, 1981).here are also notable differences in stock origin based on size or seage. Salmon originating from the Newfoundland region are mostmportant (∼40%) in the small (or 1SW) category and much less
ost important (∼5%) in the large (or 2SW) category. In contrast,he Gaspe reporting group is the most important (∼50%) contribut-ng region in the large salmon category but the third most important∼18%) in the small salmon category. The contributions of the Gulff St. Lawrence/Cape Breton regional group are equally importantt ∼35% in both the small and large salmon categories. These dif-erences in contributions based on size or sea age group of salmonre entirely consistent with the sea age structure and abundance ofalmon in these regions (O’Connell et al., 2006).
.3. Implications for understanding migratory routes
Existing evidence suggests that migration routes of Atlanticalmon in the Northwest Atlantic terminate in the feeding areasast of Newfoundland, in the Labrador Sea, for 1SW salmon andhe waters around Greenland for large two sea winter individuals
fishery 2004–2014. Estimates based on overall average genetic estimate of stockal reporting groups identified in Fig. 1 and for abreviations see Table 1.
(Meister, 1984; Miller et al., 2012; Pippy, 1982; Reddin et al., 2012;Ritter, 1989). Tag returns suggest two possible return routes backto home waters to spawn. For salmon returning to the Gulf of St.Lawrence rivers (most of Quebec and the entire southern Gulf ofSt. Lawrence), adult salmon may return via the Strait of Belle Isleor via Cabot Strait. For the most important contributing regionsto the SPM fishery, Gaspe and southern Gulf of St. Lawrence/CapeBreton, this indicates that for at least a component of the Gulf ofSt. Lawrence stocks, adult salmon return by migrating around theeastern tip of Newfoundland and along the south coast and eventu-ally through Cabot Strait. This return migration route exposes thesesalmon to the coastal fishery at SPM. In contrast, very few salmonfrom the Quebec lower north shore and higher north shore (QUE,QLS in Table 2) were identified in the SPM fishery suggesting thatthese salmon may preferentially return via Strait of Belle Isle. Thepresence of salmon from the southern regional groupings of NovaScotia suggest these fish are also returning along the south coastbefore turning south. These migration routes are consistent withhistorical tag returns and migration routes described in previousstudies (Belding, 1939; May, 1973; Reddin, 1984). Return migrationroutes around the eastern point of Newfoundland would explainthe high proportion of Newfoundland Region salmon in the smallsize category, the size/sea age group which dominates the southcoast stocks of Newfoundland. It is not surprising that few salmonin the SPM fishery were identified as originating from the AvalonPeninsula region of Newfoundland as most of these stocks are tothe east of the SPM fishery and salmon could return to these riverswithout passing near SPM.
4.4. Fishery catches
The extrapolated numbers of salmon harvested for each of the
regional reporting groups indicate that catches are likely severalhundreds of individuals per year for the three dominant regionalgroups. The direct conversion to exploitation rates is difficult aspopulation size estimates for North American salmon are currently
es Res
ottmeNtstAhLicscasuroee
4
idptuemupic(ugvbt
4
mmsfihatactsMfsweh
I.R. Bradbury et al. / Fisheri
nly estimated for five large geographic areas which differ fromhe reporting groups used here (ICES, 2015). That said, exploita-ion rates for most groups in the SPM fishery are likely very low, at
ost 1%. For the Newfoundland reporting group, tagging data basedstimates of migration route support a hypothesis that south coastewfoundland salmon are predominantly the stock intercepted in
he SPM fishery. Population size estimates are available for theouth coast (COSEWIC, 2011) and suggest an exploitation rate inhe range of 2–3% in the SPM fishery. Exploitation rates in the othertlantic salmon mixed stock fisheries in the Northwest Atlanticave been estimated at ∼10% for Central Labrador salmon in theabrador fishery (Bradbury et al., 2015) and ∼8% for large salmonn the West Greenland harvest (Gauthier-Ouellet et al., 2009). Byomparison here, estimates of exploitation in the SPM fishery areubstantially smaller. Nonetheless, even low overall rates of inter-eption and exploitation could be problematic if the fish harvestsre from river stocks with small population sizes. As such, finercale resolution for the reporting groups would allow better eval-ation of the impact of this and other interceptory harvests onegions or rivers of conservation concern. The recent developmentf a SNP (single nucleotide polymorphism) based baseline (Mooret al., 2014) and its application may allow further examinations ofxploitation rates at fine spatial scales.
.5. Limitations of analysis
Despite high levels of accuracy in our mixture analysis, our abil-ty to identify regional contributions and assign individuals directlyepends on baseline and fishery sample characteristics (i.e., sam-le size, spatial coverage, level of differentiation). The accuracy ofhis microsatellite baseline to resolve mixtures and assign individ-als has been analyzed and reported elsewhere. Both Bradburyt al. (2015) and Moore et al. (2014) report >90% accuracy inixture analysis using earlier versions of this baseline through sim-
lated mixtures and known origin samples. Unsampled or ghostopulations or poorly resolved reporting groups could potentially
nfluence our results. As the reporting groups represent regionallusters of rivers often supported by environmental associationsBourret et al., 2013; Bradbury et al. 2014, 2015; Dionne et al., 2008),nsampled populations should likely be represented by regionalroupings. Also as almost 200 local rivers have been sampled andirtually all of the largest producing rivers in North America haveeen included in the baseline, it is likely highly representative ofhe genetic variation present.
.6. Summary
Mixed stock fisheries continually challenge fisheries manage-ent and conservation initiatives. The successful management ofixed stock harvests is premised on knowledge of the stock con-
tituents being exploited. Here we show that the interceptoryshery for Atlantic salmon in the waters off St. Pierre and Miquelonarvests salmon both from adjacent Newfoundland populationss well as regions to the south and west, and the proportions inhe catch samples varies by age and size. Continued analysis ofdditional years and larger sample sizes will be informative of theharacteristics of the salmon, age and size structure and origin ofhe fish, and the variation in the stock specific characteristics, andtock contributions particularly rare contributions to the catches.oreover, ongoing work to compile a similar SNP baseline may
urther refine the spatial resolution and power for mixture analy-
is and individual assignment in future (Moore et al., 2014). Thisork illustrates how genetic analysis of interceptory marine fish-ries can directly inform assessment and management efforts inighly migratory marine species promoting actions to ensure popu-
earch 174 (2016) 234–244 243
lation persistence and stability (Hilborn et al., 2003; Schindler et al.,2010).
Acknowledgements
All fishery samples were collected with the assistance of IFreMR.Funding for fishery sample analysis was provided by the GenomicsResearch and Development Initiative and the International Gov-ernance Strategy of Fisheries and Oceans Canada. The baselineused here was partially funded by a Strategic Project Grant fromthe Natural Sciences and Engineering Research Council of Canada(NSERC) led by L. Bernatchez, Genomics Research and Fisheries andOceans Canada Development Initiative, and International Gover-nance Strategy funding to I. Bradbury.
Appendix A. Supplementary data
Supplementary data associated with this article can be found,in the online version, at http://dx.doi.org/10.1016/j.fishres.2015.10.009.
References
Anderson, E.C., Waples, R.S., Kalinowski, S.T., 2008. An improved method forpredicting the accuracy of genetic stock identification. Can. J. Fish. Aquat. Sci.65, 1475–1486.
Araujo, H.A., Candy, J.R., Beacham, T.D., White, B., Wallace, C., 2014. Advantagesand challenges of genetic stock identification in fish stocks with low geneticresolution. Trans. Am. Fish. Soc. 143, 479–488.
Beacham, T., Lapointe, M., Candy, J., Miller, K., Withler, R., 2004. DNA in action:rapid application of DNA variation to sockeye salmon fisheries management.Conserv. Genet. 5, 411–416.
Bekkevold, D., Clausen, L.A.W., Mariani, S., Andre, C., Hatfield, E.M.C., Torstensen, E.,Ryman, N., Carvalho, G.R., Ruzzante, D.E., 2011. Genetic mixed-stock analysis ofAtlantic herring populations in a mixed feeding area. Mar. Ecol. Prog. Ser. 442,187–199.
Belding, D.L., 1939. Migration of the Atlantic salmon (Salmo salar) in the Gulf of St.Lawrence as determined by tagging experiments. Trans. Am. Fish. Soc. 69,290–295.
Bourret, V., Dionne, M., Kent, M.P., Lien, S., Bernatchez, L., 2013. Landscapegenomics in Atlantic salmon (Salmo salar): searching for gene-environmentinteractions driving local adaptation. Evolution 67, 3469–3487.
Bradbury, I.R., Hamilton, L.C., Rafferty, S., Meerburg, D., Poole, R., Dempson, J.B.,Robertson, M.J., Reddin, D.G., Bourret, V., Dionne, M., Chaput, G., Sheehan, T.F.,King, T.L., Candy, J.R., Bernatchez, L., 2015. Genetic evidence of localexploitation of Atlantic salmon in a coastal subsistence fishery in theNorthwest Atlantic. Can. J. Fish. Aquat. Sci. 72, 83–95.
Bradbury, I.R., Hamilton, L.C., Robertson, M.J., Bourgeois, C.E., Mansour, A.,Dempson, J.B., 2014. Landscape structure and climatic variation determineAtlantic salmon genetic connectivity in the northwest Atlantic. Can. J. Fish.Aquat. Sci. 71, 246–258.
Campana, S.E., Chouinard, G.A., Hanson, J.M., Frechet, A., 1999. Mixing andmigration of overwintering Atlantic cod (Gadus morhus) stocks near the mouthof the Gulf of St. Lawrence. Can. J. Fish. Aquat. Sci. 56, 1873–1881.
Candy, J.R., Beacham, T.D., 2000. Patterns of homing and straying in southernBritish Columbia coded-wire tagged chinook salmon (Oncorhynchustshawytscha) populations. Fish. Res. 47, 41.
Chase, S., 2003. Closing the North American mixed-stock commercial fishery forwild Atlantic salmon. In: Mills, D. (Ed.), Salmon at the Edge. Blackwell ScienceLtd., Oxford, UK.
COSEWIC, 2011. COSEWIC assessment and status report on the Atlantic salmonSalmo salar in Canada. Ottawa Committee on the Status of Endangered Wildlifein Canada.
Crozier, W.W., Schön, P.-J., Chaput, G., Potter, E.C.E., Maoiléidigh Ó, N., MacLean,J.C., 2004. Managing Atlantic salmon (Salmo salar L.) in the mixed stockenvironment: challenges and considerations. ICES J. Mar. Sci. 61, 1344–1358.
DFO, 2013a. Recovery potential assessment for Southern Upland Atlantic salmon.DFO Canadian Science Advisory Secretariat Science Advisory Report, 2013/009.DFO.
DFO, 2013b. Recovery potential assessment for the South Newfoundland Atlanticsalmon (Salmo salar) designatable unit. In: DFO Canadian Science AdvisorySecretariat Science Advisory Report. DFO.
Dionne, M., Caron, F., Dodson, J.J., Bernatchez, L., 2008. Landscape genetics andhierarchical genetic structure in Atlantic salmon: the interaction of gene flow
and local adaptation. Mol. Ecol. 17, 2382–2396.Ensing, D., Crozier, W.W., Boylan, P., O’Maoiléidigh, N., McGinnity, P., 2013. Ananalysis of genetic stock identification on a small geographical scale usingmicrosatellite markers, and its application in the management of a mixed-stockfishery for Atlantic salmon Salmo salar in Ireland. J. Fish Biol. 82, 2080–2094.

2 es Res
F
F
G
G
G
H
H
I
J
K
K
M
M
M
M
M
N
O
O
P
Utter, F.M., Ryman, N., 1993. Genetic markers and mixed stock fisheries. Fisheries
44 I.R. Bradbury et al. / Fisheri
ay, C., Bartron, M., Craig, S., Hecht, A., Pruden, J., Saunders, R., Sheehan, T., Trial, J.,2006. Status review for Anadromous Atlantic salmon (Salmo salar) in theUnited States. In: Report to the National Marine Fisheries Service and US Fishand Wildlife Service. National Marine Fisheries Service and US Fish andWildlife Service.
raile, I., Arrizabalaga, H., Rooker, J.R., 2015. Origin of Atlantic bluefin tuna(Thunnus thynnus) in the Bay of Biscay. ICES J. Mar. Sci. 72, 625–634.
authier-Ouellet, M., Dionne, M., Caron, F., King, T.L., Bernatchez, L., 2009.Spatiotemporal dynamics of the Atlantic salmon (Salmo salar) Greenlandfishery inferred from mixed-stock analysis. Can. J. Fish. Aquat. Sci. 66,2040–2051.
oraguer, H., Report on the biological observations made on the Atlantic salmon(Salmo salar) catch during the 2010 fishery at St Pierre & Miquelon. IfremerDeı́leı́gation Report. Saint-Pierre and Miquelon; 2011.
riffiths, A.M., Machado-Schiaffino, G., Dillane, E., Coughlan, J., Horreo, J.L.,Bowkett, A.E., Minting, P., Toms, S., Roche, W., Gargan, P., McGinnity, P., Cross,T., Bright, D., Garcia-Vazquez, E., Stevens, J.R., 2010. Genetic stockidentification of Atlantic salmon (Salmo salar) populations in the southern partof the European range. BMC Genet. 11, 1–27.
ilborn, R., Quinn, T.P., Schindler, D.E., Rogers, D.E., 2003. Biocomplexity andfisheries sustainability. Proc. Natl. Acad. Sci. U. S. A. 100, 6564–6568.
utchings, J.A., Jones, M.E.B., 1998. Life history variation and growth ratethresholds for maturity in Atlantic salmon, Salmo salar. Can. J. Fish. Aquat. Sci.55, 22–47.
CES, 2015. Report of the Working Group on North Atlantic Salmon (WGNAS),17–26 March Moncton, Canada. ICES CM.
ónsdóttir, I.G., Marteinsdottir, G., Campana, S.E., 2007. Contribution of differentspawning components to the mixed stock fishery for cod in Icelandic waters.ICES J. Mar. Sci. 64, 1749–1759.
alinowski, S.T., Manlove, K.R., Taper, M.L., 2007. ONCOR Software for GeneticStock Identification. Montana State University, Bozeman.
ing, T.L., Eackles, M.S., Letcher, B.H., 2005. Microsatellite DNA markers for thestudy of Atlantic salmon (Salmo salar) kinship, population structure, andmixed-fishery analyses. Mol. Ecol. Notes 5, 130–132.
ay, A.W., 1973. Distributions and migrations of salmon in in the NorthwestAtlantic. Spec. Publ. Ser. Int. At/Sa/m Found 4, 373–382.
eister, A.L., 1984. The marine migrations of tagged Atlantic salmon of USA origin.ICES CM 27, 28.
illar, R.M., 1987. Maximum likelihood estimation of mixed stock fisherycomposition. Can. J. Fish. Aquat. Sci. 44, 583–590.
iller, A.S., Sheehan, T.F., Renkawitz, M.D., Meister, A.L., Miller, T.J., 2012.Revisiting the marine migrations of US Atlantic salmon using historical Carlintag data. ICES J. Mar. Sci. 69, 1609–1615.
oore, J.-S., Bourret, V., Dionne, M., Bradbury, I., O’Reilly, P., Kent, M., Chaput, G.,Bernatchez, L., 2014. Conservation genomics of anadromous Atlantic salmonacross its North American range: outlier loci identify the same patterns ofpopulation structure as neutral loci. Mol. Ecol. 23, 5680–5697.
eaves, P.I., Wallace, C.G., Candy, J.R., Beacham, T.D., CBayes computer program formixed stock analysis of allelic data. pac.dfo-mpo.gc.ca/sci/mgl/Cbayes e.htm2005.
’Reilly, P.T., Hamilton, L.C., McConnell, S.K., Wright, J.M., 1996. Rapid analysis ofgenetic variation in Atlantic salmon (Salmo salar) by PCR multiplexing ofdinucleotide and tetranucleotide microsatellites. Can. J. Fish. Aquat. Sci. 53,2292.
’Connell, M.F., Dempson, J.B., Chaput, G., 2006. Aspects of the life history, biology,and population dynamics of Atlantic salmon (Salmo salar L.) in eastern Canada.
In: Fisheries and Oceans Canada Canadian Science Advisory SecretariatResearch Document. Canadian Science Advisory Secretariat.aterson, S., Piertney, S.B., Knox, D., Gilbey, J., Verspoor Characterization and, E.,2004. PCR multiplexing of novel highly variable tetranucleotide Atlanticsalmon (Salmo salar L.) microsatellites. Mol. Ecol. Notes 4, 160–162.
earch 174 (2016) 234–244
Pella, J., Masuda, M., 2001. Bayesian methods for analysis of stock mixtures fromgenetic characters. Fish. Bull. (Seattle) 99, 151–160.
Pippy, J., 1982. Report of the working group on the interception of mainlandsalmon in Newfoundland. Can. Manuscript Rep. Fish. Aquat. Sci. St. John’s, Nfld.
Power, G., 1981. Stock characteristics and catches of Atlantic salmon (Salmo salar)in Quebec, and Newfoundland and labrador in relation to environmentalvariables. Can. J. Fish. Aquat. Sci. 38, 1601–1611.
Presa, P., Guyomard, R., 1996. Conservation of microsatellites in three species ofsalmonids. J. Fish Biol. 49, 1326–1329.
Rannala, B., Mountain, J.L., 1997. Detecting immigration by using multilocusgenotypes. Proc. Natl. Acad. Sci. U. S. A. 94, 9197–9201.
Reddin, D.G., 1984. Results of Atlantic salmon tagging study in Miramichi Bay, NewBrunswick. Can. Tech. Rep. Fish. Aquat. Sci. 1301, 22.
Reddin, D.G., 1988. Ocean life of Atlantic salmon (Salmo salar L.) in the NorthwestAtlantic. In: Mills, D. (Ed.), Atlantic Salmon: Planning for the Future. CroomHelm, Kent, UK.
Reddin, D.G., Friedland, K.D., 1999. A history of identification to continent of originof Atlantic salmon (Salmo salar L.) at west Greenland. Fish. Res. (Amst.) 43(1–3), 221–235.
Reddin, D.G., Hansen, L.P., Bakkestuen, V., Russell, I., White, J., Potter, E.C.E.,Dempson, J.B., Sheehan, T.F., Maoiléidigh, O., Smith, G.W., Isaksson, A.,Jacobsen, J.A., Fowler, M., Mork, K.A., Amiro, P., 2012. Distribution andbiological characteristics of Atlantic salmon (Salmo salar) at Greenland basedon the analysis of historical tag recoveries. ICES J. Mar. Sci. 69, 1589–1597.
Reddin, D.G., Lear, W.H., 1990. Summary of marine tagging studies of Atlanticsalmon (Salmo salar L.) in the Northwest Atlantic. Can. Tech. Rep. Fish. Aquat.Sci. 1737, 115.
Reddin, D.G., Short, P.B., 1991. Postmolt Atlantic salmon (Salmo salar) in theLabrador Sea. Can. J. Fish. Aquat. Sci. 48, 2–6.
Ritter, J.A., 1989. Marine migration and natural mortality of North AmericanAtlantic salmon (Salmo Salar L.). Can. Manuscript Rep. Fish. Aquat. Sci. 136.
Robertson, M.J., Weir, L.K., Dempson, J.B., 2013. Population viability analysis for theSouth Newfoundland Atlantic salmon (Salmo salar) designatable unit. DFO Can.Sci. Advis. Sec. Res. Doc.
Ruzzante, D.E., Taggart, C.T., Lang, S., Cook, D., 2000. Mixed-stock analysis ofAtlantic cod near the Gulf of St. Lawrence based on microsatellite. DNA 10(1090).
Saunders, R.L., 1981. Atlantic salmon (Salmo salar) stocks and managementimplications in the Canadian Atlantic Provinces and New England, USA. Can. J.Fish. Aquat. Sci. 38, 1612–1625.
Schindler, D.E., Hilborn, R., Chasco, B., Boatright, C.P., Quinn, T.P., Rogers, L.A.,Webster, M.S., 2010. Population diversity and the portfolio effect in anexploited species. Nat. (Lond.) 465, 609–612.
Shaklee, J.B., Beacham, T.D., Seeb, L., White, B.A., 1998. Managing fisheries usinggenetic data: Case studies from four species of Pacific salmon. Fish. Res. (Amst.)43, 45–78.
Sheehan, T.F., Legault, C.M., King, T.L., Spidle, A.P., 2010. Probabilistic-based geneticassignment model: assignments to subcontinent of origin of the WestGreenland Atlantic salmon harvest. ICES J. Mar. Sci. 67, 537–550.
Shepard, K.E., Patterson, W.F., DeVries, D.A., 2010. Trends in atlantic contributionto mixed-stock king mackerel landings in South Florida inferred from otolithshape analysis. Mar. Coastal Fish., 195–204.
Slettan, A., Olsaker, I., Lie, O., 1995. Atlantic salmon, Salmo salar, microsatellites atthe SSOSL25, SSOSL85, SSOSL311, SSOSL417 loci. Animal Genet. 26, 281–282.
Sokal, R.R., Rohlf, F.J., 1995. Biometry. W.H. Freeman & Co., San Francisco.
18, 11–21.Weitkamp, L., Neely, K., 2002. Coho salmon (Oncorhynchus kisutch) ocean
migration patterns: insight from marine coded-wire tag recoveries. Can. J. Fish.Aquat. Sci. 59, 1100–1115.