Embed Size (px)
Citation preview
Chapter 9
Genetic Markers in the Prognosis ofChildhood Acute Lymphoblastic Leukemia
M.R. Juárez-Velázquez, C. Salas-Labadía,A. Reyes-León, M.P. Navarrete-Meneses,E.M. Fuentes-Pananá and P. Pérez-Vera
Additional information is available at the end of the chapter
http://dx.doi.org/10.5772/54288
1. Introduction
Acute leukemia is a broad term used to identify several malignancies of immature hemato‐poietic cells. Although, variable incidences have been reported between countries, rangingfrom 46 to 57 cases by million children, it is considered the most common childhood cancerworldwide [1]. Acute lymphoblastic leukemia (ALL) is the most frequent subtype (75%-80%of cases; with the remaining 20-25% being of myeloid origin, AML). In ALL, B cell origin isthe most frequently diagnosed (B cell ALL) representing 83%, and T cell ALL comprises 15%[2]. The total of ALL cases represents 30-40% of all types of pediatric cancer[3].
One of the major achievements in cancer therapy has been the increased cure rates for ALL,from 10% in the 60s to 76-86% today, although these favorable numbers are mainly valid fordeveloped countries[4,5]. The improvement in ALL cure rates can be in part attributed tothe assessment of conventional prognostic factors and identification of molecular markersassociated with a better response to therapy. Suitable risk stratification has permitted a morepersonalized treatment, selecting patients for receiving standard or intensified therapy,alone or in combination with drugs against ALL specific targets, and together with an en‐hanced supportive care have contributed to the increase in the event-free survival (EFS)rates[4]. Conventional childhood ALL stratification is based on prognostic factors related tocharacteristics of the patient (age at diagnosis) and the disease itself white blood cell (WBC)count at diagnosis, immunophenotype of the leukemic cells, presence of known genetic fu‐sions, numerical abnormalities or abnormal gene expression, and early response to therapy(evaluated by morphological methods or using a more accurate measurement such as mini‐mal residual disease (MRD) analysis) [4–6].
© 2013 Juárez-Velázquez et al.; licensee InTech. This is an open access article distributed under the terms ofthe Creative Commons Attribution License (http://creativecommons.org/licenses/by/3.0), which permitsunrestricted use, distribution, and reproduction in any medium, provided the original work is properly cited.
From a genetic point of view, ALL is one of the best characterized malignancies. Numericaland structural chromosomal abnormalities have been described by cytogenetic methods, flu‐orescence in situ hybridization (FISH), polymerase chain reaction (PCR), and more recently,by next generation sequencing. Chromosomal abnormalities are clonal markers of the ALLblast, since the cytogenetic and molecular analyses have revealed that approximately 75% ofALL-children present these genetic lesions [7,8]. To date, more than 200 genes have beenfound participating downstream of common ALL translocations [9]; interestingly, a handfulof these genes are consistently affected in many subtypes of the disease paving the way tobetter understand homeostatic lymphopoiesis and the leukemogenic process [10].
2. Signaling and transcription factors important in lymphopoiesis andleukemogenesis
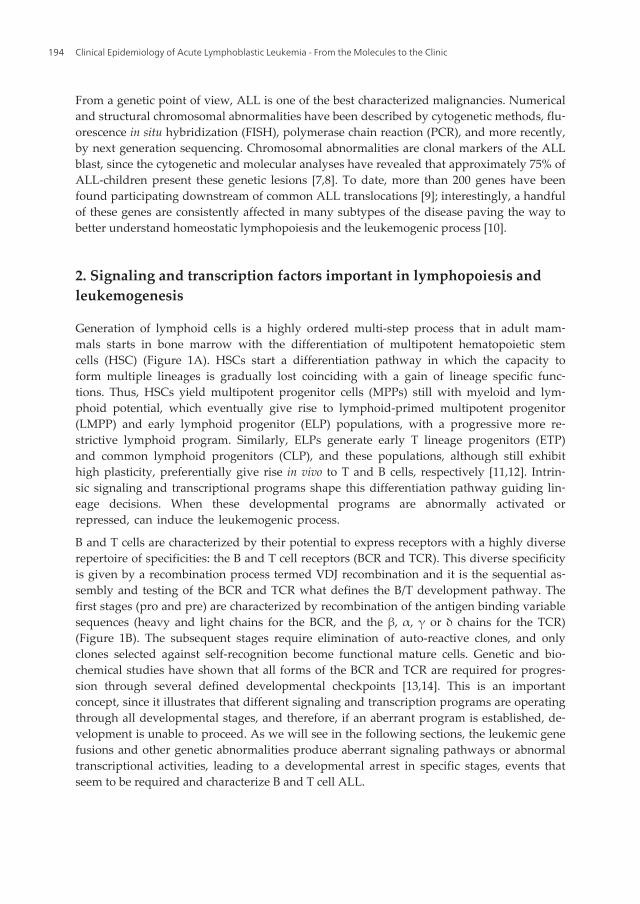
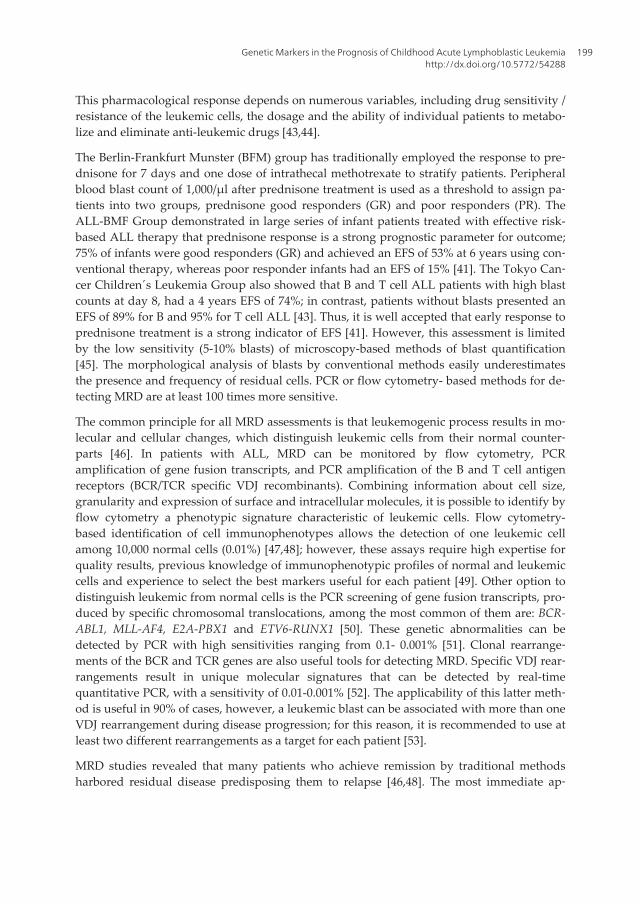
Generation of lymphoid cells is a highly ordered multi-step process that in adult mam‐mals starts in bone marrow with the differentiation of multipotent hematopoietic stemcells (HSC) (Figure 1A). HSCs start a differentiation pathway in which the capacity toform multiple lineages is gradually lost coinciding with a gain of lineage specific func‐tions. Thus, HSCs yield multipotent progenitor cells (MPPs) still with myeloid and lym‐phoid potential, which eventually give rise to lymphoid-primed multipotent progenitor(LMPP) and early lymphoid progenitor (ELP) populations, with a progressive more re‐strictive lymphoid program. Similarly, ELPs generate early T lineage progenitors (ETP)and common lymphoid progenitors (CLP), and these populations, although still exhibithigh plasticity, preferentially give rise in vivo to T and B cells, respectively [11,12]. Intrin‐sic signaling and transcriptional programs shape this differentiation pathway guiding lin‐eage decisions. When these developmental programs are abnormally activated orrepressed, can induce the leukemogenic process.
B and T cells are characterized by their potential to express receptors with a highly diverserepertoire of specificities: the B and T cell receptors (BCR and TCR). This diverse specificityis given by a recombination process termed VDJ recombination and it is the sequential as‐sembly and testing of the BCR and TCR what defines the B/T development pathway. Thefirst stages (pro and pre) are characterized by recombination of the antigen binding variablesequences (heavy and light chains for the BCR, and the β, α, γ or δ chains for the TCR)(Figure 1B). The subsequent stages require elimination of auto-reactive clones, and onlyclones selected against self-recognition become functional mature cells. Genetic and bio‐chemical studies have shown that all forms of the BCR and TCR are required for progres‐sion through several defined developmental checkpoints [13,14]. This is an importantconcept, since it illustrates that different signaling and transcription programs are operatingthrough all developmental stages, and therefore, if an aberrant program is established, de‐velopment is unable to proceed. As we will see in the following sections, the leukemic genefusions and other genetic abnormalities produce aberrant signaling pathways or abnormaltranscriptional activities, leading to a developmental arrest in specific stages, events thatseem to be required and characterize B and T cell ALL.
Clinical Epidemiology of Acute Lymphoblastic Leukemia - From the Molecules to the Clinic194
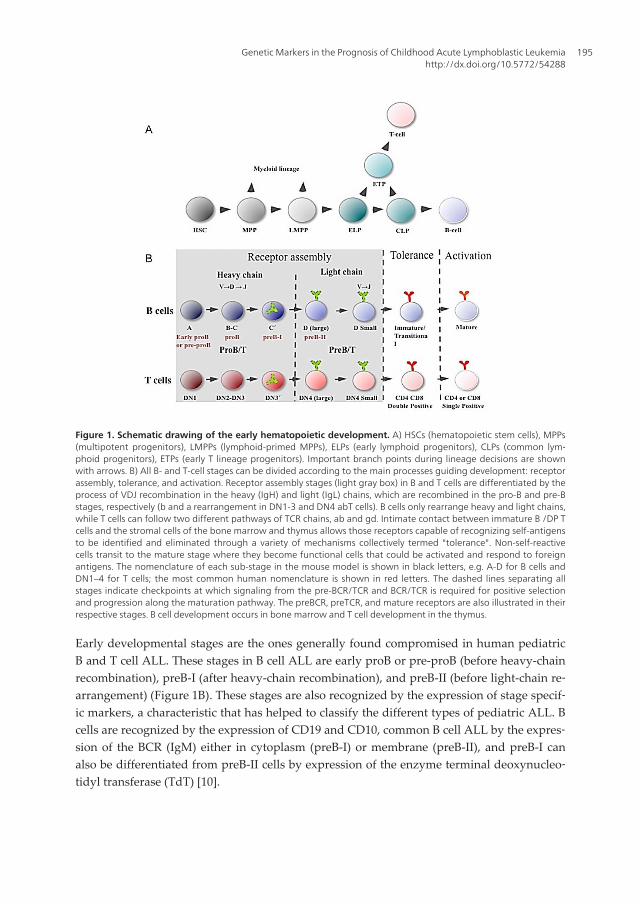
Figure 1. Schematic drawing of the early hematopoietic development. A) HSCs (hematopoietic stem cells), MPPs(multipotent progenitors), LMPPs (lymphoid-primed MPPs), ELPs (early lymphoid progenitors), CLPs (common lym‐phoid progenitors), ETPs (early T lineage progenitors). Important branch points during lineage decisions are shownwith arrows. B) All B- and T-cell stages can be divided according to the main processes guiding development: receptorassembly, tolerance, and activation. Receptor assembly stages (light gray box) in B and T cells are differentiated by theprocess of VDJ recombination in the heavy (IgH) and light (IgL) chains, which are recombined in the pro-B and pre-Bstages, respectively (b and a rearrangement in DN1-3 and DN4 abT cells). B cells only rearrange heavy and light chains,while T cells can follow two different pathways of TCR chains, ab and gd. Intimate contact between immature B /DP Tcells and the stromal cells of the bone marrow and thymus allows those receptors capable of recognizing self-antigensto be identified and eliminated through a variety of mechanisms collectively termed "tolerance". Non-self-reactivecells transit to the mature stage where they become functional cells that could be activated and respond to foreignantigens. The nomenclature of each sub-stage in the mouse model is shown in black letters, e.g. A-D for B cells andDN1–4 for T cells; the most common human nomenclature is shown in red letters. The dashed lines separating allstages indicate checkpoints at which signaling from the pre-BCR/TCR and BCR/TCR is required for positive selectionand progression along the maturation pathway. The preBCR, preTCR, and mature receptors are also illustrated in theirrespective stages. B cell development occurs in bone marrow and T cell development in the thymus.
Early developmental stages are the ones generally found compromised in human pediatricB and T cell ALL. These stages in B cell ALL are early proB or pre-proB (before heavy-chainrecombination), preB-I (after heavy-chain recombination), and preB-II (before light-chain re‐arrangement) (Figure 1B). These stages are also recognized by the expression of stage specif‐ic markers, a characteristic that has helped to classify the different types of pediatric ALL. Bcells are recognized by the expression of CD19 and CD10, common B cell ALL by the expres‐sion of the BCR (IgM) either in cytoplasm (preB-I) or membrane (preB-II), and preB-I canalso be differentiated from preB-II cells by expression of the enzyme terminal deoxynucleo‐tidyl transferase (TdT) [10].
Genetic Markers in the Prognosis of Childhood Acute Lymphoblastic Leukemiahttp://dx.doi.org/10.5772/54288
195
T cells are recognized by the expression of CD3, CD5 and CD7. Early T cells lack expressionof CD4 and CD8 (double negative or DN stages). Contrary to B cell ALL, T cell ALL clonesoften express markers of more advanced stages of development (for instance double posi‐tive stages). However, these clones also show a lack of expression or cytoplasmic TCRβ, in‐dicating that transformation happened before rearrangement of this TCR component or justafter, and thus arguing that transformation targeted ETP/DN1 or DN3´cells [15]. The acquis‐ition of markers of more mature cells is probably due to marker aberrant expression or leu‐kemia-induced developmental progression in absence of the TCR signal. Although,postnatal B cell early maturation only happens in bone marrow, T cells mature in thymus.LMPP, ELP, CLP and ETP cells are all able to leave bone marrow in response to environ‐mental signals and complete the T cell maturation program in thymus. Therefore, ETP/DN1cells are normal residents of bone marrow, while double positive T cells are only found inthymus. T cell transformation of very early populations also agrees with the predominantpresence of the T cell leukemic clone in bone marrow [15].
Limitation of lineage choice during development is regulated by a combination of signalingpathways and transcription factors. The main receptor controlling the proB stage is theIL-7R, which is composed of an α chain (IL-7Rα) and the common cytokine receptor G chain(GC) [16,17]. Deletion of IL-7Rα or GC leads to developmental arrest at the early proB stage[18–21]. IL-7 activates three major signaling pathways: 1) JAK–STAT, 2) phosphatidylinosi‐tol 3-kinase (PI3K)–Akt and 3) Ras-Raf-Erk [22]. STAT5 (signal transducer and activator oftranscription 5) is the predominant STAT protein activated by IL-7 [22,23] and STAT5 lossalso arrest B cells at the early proB stage. Once the preBCR is expressed, it can take overmany of the functions performed by the IL-7 receptor, since the preBCR also activates thePI3K-Akt and Ras-Raf-Erk pathways [24,25].
Downstream of IL-7 two transcription factors have been documented as the most importantfor cell entry into the B cell lineage: E2A/TCF3 (immunoglobulin enhancer binding factorsE12/E47/transcription factor 3) and EBF1 (Early B cell Factor 1) [26–28]. On the other hand,PAX5 (Paired box 5) is the more important transcription factor for B cell commitment. Lossof E2A and EBF1 blocks entry into the B cell lineage, and loss of PAX5 redirects B cells intoother lineages [28–30]. One of the main molecular functions of PAX5 (acting together withE2A, EBF1 and STAT5) is to allow VDJ recombination [31,32]. Ectopic expression of PAX5and E2A allows VDJ recombination in non-B cells [45, 46]. Also, E2A, PAX5, IKZF1 andRUNX1, among other transcription factors, are responsible for expression of the VDJ recom‐binase (RAG) [33,34].
The most important cells that give rise to T cells are ELPs and CLPs. Although, both B and Tcells are mainly originated from them, an important genetic difference between cells proneto the B lineage is the expression of EBF1 and PAX5, while for T cells is NOTCH1 signaling.NOTCH1 directs progenitors into the thymus and it is the master orchestrator of T cell line‐age entry and development [35,36]. NOTCH contains multiple epidermal growth factor(EGF)-like repeats through which it binds its ligands DLL-1, -2, -4 (Delta-like ligand), andJagged-1 and -2 expressed by bone marrow and thymus stromal cells. Upon ligand bindingNOTCH1 initiates a series of proteolytic cleavage events, the first one catalyzed by the
Clinical Epidemiology of Acute Lymphoblastic Leukemia - From the Molecules to the Clinic196
ADAM family of metalloproteinases and the second by the γ−secretase complex. This cleav‐age activates NOTCH1 removing the extracellular portion and translocating to the nucleusits intracellular region (ICN), where it becomes part of a large transcriptional activationcomplex together with CSL and histone acetylase p300. Also, ICN has a C-terminal PEST do‐main involved in regulation of NOTCH1 ubiquitylation and proteasome-mediated degrada‐tion, therefore controlling protein turnover [35–38].
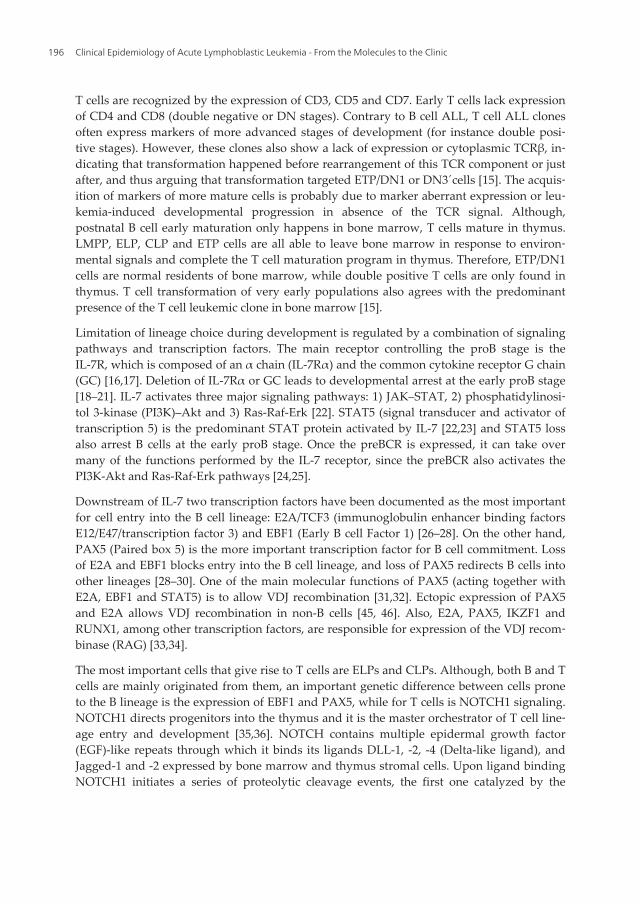
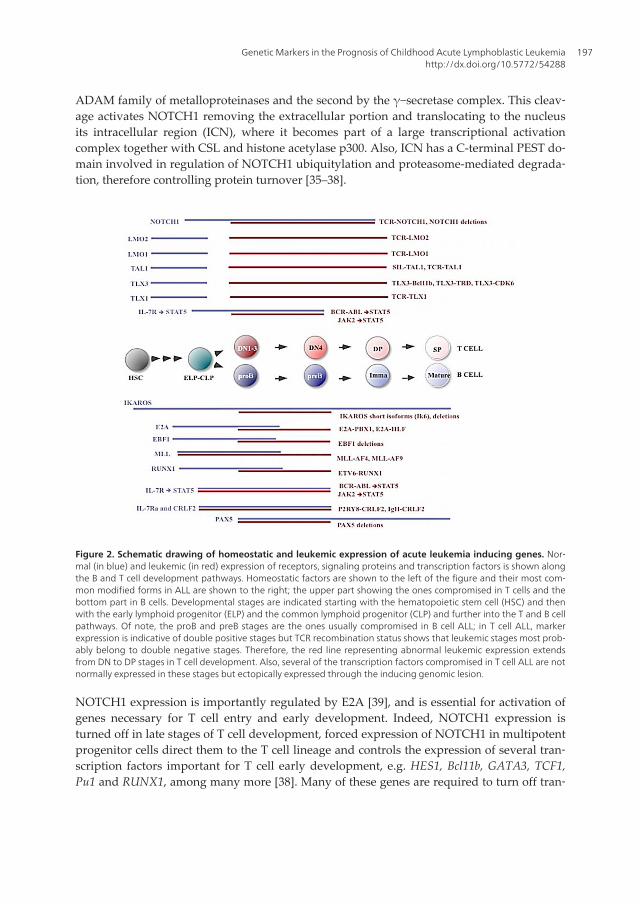
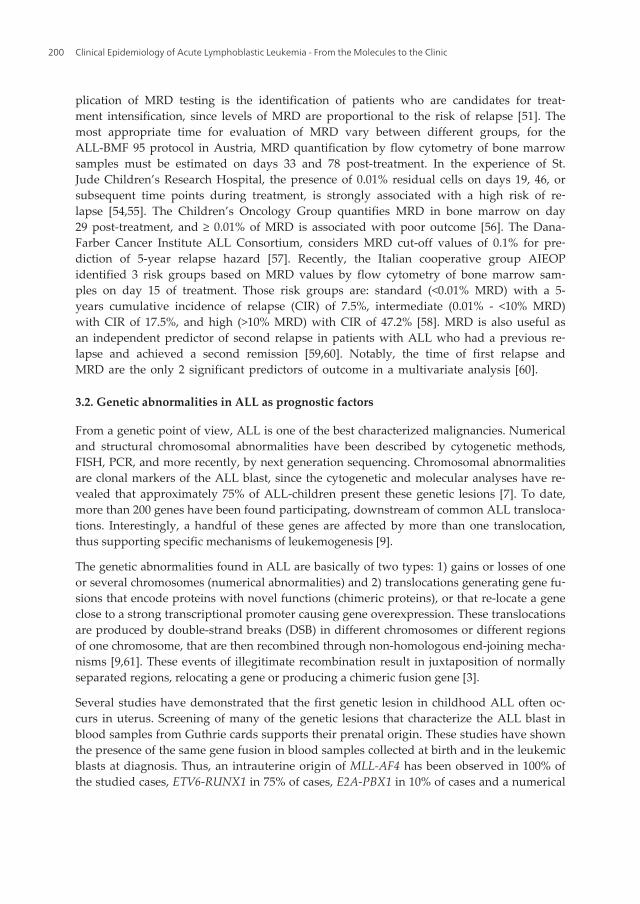
Figure 2. Schematic drawing of homeostatic and leukemic expression of acute leukemia inducing genes. Nor‐mal (in blue) and leukemic (in red) expression of receptors, signaling proteins and transcription factors is shown alongthe B and T cell development pathways. Homeostatic factors are shown to the left of the figure and their most com‐mon modified forms in ALL are shown to the right; the upper part showing the ones compromised in T cells and thebottom part in B cells. Developmental stages are indicated starting with the hematopoietic stem cell (HSC) and thenwith the early lymphoid progenitor (ELP) and the common lymphoid progenitor (CLP) and further into the T and B cellpathways. Of note, the proB and preB stages are the ones usually compromised in B cell ALL; in T cell ALL, markerexpression is indicative of double positive stages but TCR recombination status shows that leukemic stages most prob‐ably belong to double negative stages. Therefore, the red line representing abnormal leukemic expression extendsfrom DN to DP stages in T cell development. Also, several of the transcription factors compromised in T cell ALL are notnormally expressed in these stages but ectopically expressed through the inducing genomic lesion.
NOTCH1 expression is importantly regulated by E2A [39], and is essential for activation ofgenes necessary for T cell entry and early development. Indeed, NOTCH1 expression isturned off in late stages of T cell development, forced expression of NOTCH1 in multipotentprogenitor cells direct them to the T cell lineage and controls the expression of several tran‐scription factors important for T cell early development, e.g. HES1, Bcl11b, GATA3, TCF1,Pu1 and RUNX1, among many more [38]. Many of these genes are required to turn off tran‐
Genetic Markers in the Prognosis of Childhood Acute Lymphoblastic Leukemiahttp://dx.doi.org/10.5772/54288
197
scriptional programs of multipotent progenitor cells or other hematopoietic lineages, or forT cell specific functions such as recombinase expression or TCR recombination.
Some of the transcription factors drivers of T cell ALL are normally expressed in non-malig‐nant thymocytes since they are essential regulators of T-cell ontogeny, while others are notexpressed in normal ones, but they are rather ectopically expressed by transformed cells(Figure 2). This is contrary to B cells, in which most of the transcription factors associatedwith transformation fulfill an important regulatory function (Figure 2). This observationsupports different mechanisms for the origin of B and T cell ALL. In agreement, TLX1,TLX3, TAL1, LMO1 and LMO2 gene loci remain open during TCR recombination, increasingthe probability of aberrant rearrangements [39,40]. The identification of the signaling pro‐teins and transcription factors compromised in B and T cell ALL has helped us to under‐stand normal B and T cell development and its oncogenic counterpart, and as we willemphasize in the following sections, they have also provided an important tool to classifypatients with specific genetic characteristics into risk groups matching disease prognosis.
3. Criteria for ALL risk stratification
The clinical and laboratory criteria supporting risk stratification vary among institutions,with most groups considering as high risk the following characteristics: age ≥ 10 or <1 yearsat presentation, WBC ≥ 50,000/µl, presence of extramedullary disease, T cell immunopheno‐type, presence of adverse genetic abnormalities such as t(9;22) (BCR-ABL1), MLL gene rear‐rangements, hypodiploidy <44 chromosomes and near haploidy. Finally, a poor response totherapy resulting in ≥ 5% bone marrow blasts at days 15, 19, 29, 35 or 43 post-treatment isalso considered of bad prognosis [6].
All the above-mentioned prognostic factors are used to classify patients into two riskgroups, high and standard risk. For instance, it is known that increased WBC count conferspoor prognosis for B cell ALL patients and in T cell ALL, a leukocyte count greater than100,000/µl is associated with high risk of relapse in the central nervous system. Also, pa‐tients with hyperleukocytosis, greater than 400,000/µl, are at high risk of central nervoussystem hemorrhage and pulmonary and neurological events due to leukostasis. However,most of these risk criteria are better understood for B cell and they are not as clear for T cellALL patients [3]. Recently, evaluation of early response to therapy has been demonstratedbeing an important parameter for treatment efficacy and disease prognosis. Based on the lat‐ter criteria, it is possible to identify the group of patients that require augmented therapy toimprove their outcome.
3.1. Prognostic significance of treatment response
The frequency of bone marrow or circulating lymphoblasts after one week of chemotherapyis associated with risk for relapse [41] and nowadays, this constitutes one of the most usefulprognostic factors in childhood ALL. An efficient early response to treatment is determinedby evaluating clearance rates of leukemic cells after the induction phase of treatment [42].
Clinical Epidemiology of Acute Lymphoblastic Leukemia - From the Molecules to the Clinic198
This pharmacological response depends on numerous variables, including drug sensitivity /resistance of the leukemic cells, the dosage and the ability of individual patients to metabo‐lize and eliminate anti-leukemic drugs [43,44].
The Berlin-Frankfurt Munster (BFM) group has traditionally employed the response to pre‐dnisone for 7 days and one dose of intrathecal methotrexate to stratify patients. Peripheralblood blast count of 1,000/µl after prednisone treatment is used as a threshold to assign pa‐tients into two groups, prednisone good responders (GR) and poor responders (PR). TheALL-BMF Group demonstrated in large series of infant patients treated with effective risk-based ALL therapy that prednisone response is a strong prognostic parameter for outcome;75% of infants were good responders (GR) and achieved an EFS of 53% at 6 years using con‐ventional therapy, whereas poor responder infants had an EFS of 15% [41]. The Tokyo Can‐cer Children´s Leukemia Group also showed that B and T cell ALL patients with high blastcounts at day 8, had a 4 years EFS of 74%; in contrast, patients without blasts presented anEFS of 89% for B and 95% for T cell ALL [43]. Thus, it is well accepted that early response toprednisone treatment is a strong indicator of EFS [41]. However, this assessment is limitedby the low sensitivity (5-10% blasts) of microscopy-based methods of blast quantification[45]. The morphological analysis of blasts by conventional methods easily underestimatesthe presence and frequency of residual cells. PCR or flow cytometry- based methods for de‐tecting MRD are at least 100 times more sensitive.
The common principle for all MRD assessments is that leukemogenic process results in mo‐lecular and cellular changes, which distinguish leukemic cells from their normal counter‐parts [46]. In patients with ALL, MRD can be monitored by flow cytometry, PCRamplification of gene fusion transcripts, and PCR amplification of the B and T cell antigenreceptors (BCR/TCR specific VDJ recombinants). Combining information about cell size,granularity and expression of surface and intracellular molecules, it is possible to identify byflow cytometry a phenotypic signature characteristic of leukemic cells. Flow cytometry-based identification of cell immunophenotypes allows the detection of one leukemic cellamong 10,000 normal cells (0.01%) [47,48]; however, these assays require high expertise forquality results, previous knowledge of immunophenotypic profiles of normal and leukemiccells and experience to select the best markers useful for each patient [49]. Other option todistinguish leukemic from normal cells is the PCR screening of gene fusion transcripts, pro‐duced by specific chromosomal translocations, among the most common of them are: BCR-ABL1, MLL-AF4, E2A-PBX1 and ETV6-RUNX1 [50]. These genetic abnormalities can bedetected by PCR with high sensitivities ranging from 0.1- 0.001% [51]. Clonal rearrange‐ments of the BCR and TCR genes are also useful tools for detecting MRD. Specific VDJ rear‐rangements result in unique molecular signatures that can be detected by real-timequantitative PCR, with a sensitivity of 0.01-0.001% [52]. The applicability of this latter meth‐od is useful in 90% of cases, however, a leukemic blast can be associated with more than oneVDJ rearrangement during disease progression; for this reason, it is recommended to use atleast two different rearrangements as a target for each patient [53].
MRD studies revealed that many patients who achieve remission by traditional methodsharbored residual disease predisposing them to relapse [46,48]. The most immediate ap‐
Genetic Markers in the Prognosis of Childhood Acute Lymphoblastic Leukemiahttp://dx.doi.org/10.5772/54288
199
plication of MRD testing is the identification of patients who are candidates for treat‐ment intensification, since levels of MRD are proportional to the risk of relapse [51]. Themost appropriate time for evaluation of MRD vary between different groups, for theALL-BMF 95 protocol in Austria, MRD quantification by flow cytometry of bone marrowsamples must be estimated on days 33 and 78 post-treatment. In the experience of St.Jude Children’s Research Hospital, the presence of 0.01% residual cells on days 19, 46, orsubsequent time points during treatment, is strongly associated with a high risk of re‐lapse [54,55]. The Children’s Oncology Group quantifies MRD in bone marrow on day29 post-treatment, and ≥ 0.01% of MRD is associated with poor outcome [56]. The Dana-Farber Cancer Institute ALL Consortium, considers MRD cut-off values of 0.1% for pre‐diction of 5-year relapse hazard [57]. Recently, the Italian cooperative group AIEOPidentified 3 risk groups based on MRD values by flow cytometry of bone marrow sam‐ples on day 15 of treatment. Those risk groups are: standard (<0.01% MRD) with a 5-years cumulative incidence of relapse (CIR) of 7.5%, intermediate (0.01% - <10% MRD)with CIR of 17.5%, and high (>10% MRD) with CIR of 47.2% [58]. MRD is also useful asan independent predictor of second relapse in patients with ALL who had a previous re‐lapse and achieved a second remission [59,60]. Notably, the time of first relapse andMRD are the only 2 significant predictors of outcome in a multivariate analysis [60].
3.2. Genetic abnormalities in ALL as prognostic factors
From a genetic point of view, ALL is one of the best characterized malignancies. Numericaland structural chromosomal abnormalities have been described by cytogenetic methods,FISH, PCR, and more recently, by next generation sequencing. Chromosomal abnormalitiesare clonal markers of the ALL blast, since the cytogenetic and molecular analyses have re‐vealed that approximately 75% of ALL-children present these genetic lesions [7]. To date,more than 200 genes have been found participating, downstream of common ALL transloca‐tions. Interestingly, a handful of these genes are affected by more than one translocation,thus supporting specific mechanisms of leukemogenesis [9].
The genetic abnormalities found in ALL are basically of two types: 1) gains or losses of oneor several chromosomes (numerical abnormalities) and 2) translocations generating gene fu‐sions that encode proteins with novel functions (chimeric proteins), or that re-locate a geneclose to a strong transcriptional promoter causing gene overexpression. These translocationsare produced by double-strand breaks (DSB) in different chromosomes or different regionsof one chromosome, that are then recombined through non-homologous end-joining mecha‐nisms [9,61]. These events of illegitimate recombination result in juxtaposition of normallyseparated regions, relocating a gene or producing a chimeric fusion gene [3].
Several studies have demonstrated that the first genetic lesion in childhood ALL often oc‐curs in uterus. Screening of many of the genetic lesions that characterize the ALL blast inblood samples from Guthrie cards supports their prenatal origin. These studies have shownthe presence of the same gene fusion in blood samples collected at birth and in the leukemicblasts at diagnosis. Thus, an intrauterine origin of MLL-AF4 has been observed in 100% ofthe studied cases, ETV6-RUNX1 in 75% of cases, E2A-PBX1 in 10% of cases and a numerical
Clinical Epidemiology of Acute Lymphoblastic Leukemia - From the Molecules to the Clinic200
abnormality, hyperdiploidy, in 100% of patients in one study [9]. However, it is acceptedthat for all mentioned cases this first oncogenic hit is not sufficient, and additional postnatalmutational events are required for disease initiation [62].
The known ALL genetic abnormalities have been relevant for the identification of genes in‐volved in cancer and therefore for the insights in the biology of the leukemogenic process.Importantly, these genetic abnormalities are a disease signature that has been an invaluabletool for the precise disease diagnosis, prognosis and stratification into risk groups, guidingpatient management and treatment choice [63]. The Third International Workshop on Chro‐mosomes in Leukemia was the first major study demonstrating the independent prognosticsignificance of cytogenetic findings in ALL, providing data on clinical relevance of chromo‐somal recurrent aberrations, and elucidating its molecular basis and biologic consequences[64]. Given their importance, it is the main goal of this chapter to describe in detail the mostimportant genetic abnormalities in the stratification of ALL patients, highlighting aspects oftheir oncogenic mechanisms, incidence and prognosis.
4. Molecular and cytogenetic subgroups in pediatric B cell ALL
As it was previously mentioned, several genetic abnormalities are characteristic of ALL andhave been relevant for the identification of genes involved in cancer and therefore have giv‐en insights into the biology of the leukemogenic process, plus they have been an invaluabletool for the precise disease diagnosis, prognosis and stratification into risk groups. Severalof them will be discussed in the coming sections.
4.1. BCR-ABL1 fusion
The BCR-ABL1 fusion is generated by a reciprocal translocation between sequences of theBCR (Breakpoint cluster region; do not confuse with the B cell receptor) gene located at22q11.23, and the ABL1 (Abelson tyrosine-protein kinase 1) gene located at 9q34.1. Thistranslocation generates a derivative chromosome 22 known as the Philadelphia (Ph) chro‐mosome, and was first observed in adult patients with chronic myeloid leukemia (CML),but later also in approximately 3-5% of pediatric ALL patients. The BCR gene contains 23exons and encodes a 160 kD phosphoprotein of still unclear function. However, its firstexon, which is normally present in the BCR-ABL1 protein, contains a serine/threonine kin‐ase activity and SH2 binding sites [65]. On the other hand, ABL1 is a proto-oncogene thatencodes a cytoplasmic and nuclear protein tyrosine kinase implicated in cell differentiation,cell division, cell adhesion, and stress response [66,67]. The BCR-ABL1 fusion produces achimeric protein with cytoplasmic localization and oncogenic potential because retains thecatalytic domain of ABL1 fused to the BCR domain, which mediates constitutive oligomeri‐zation of the fusion protein in the absence of physiologic activating signals, thereby promot‐ing aberrant tyrosine kinase constitutive activity, inducing aberrant signaling and activatingmultiple cellular pathways [3,68–70]. Among the signaling pathways activated contributing
Genetic Markers in the Prognosis of Childhood Acute Lymphoblastic Leukemiahttp://dx.doi.org/10.5772/54288
201
to leukemogenesis are JAK2 kinase/STAT5, MAP kinases and PI3K/Akt, which includes sev‐eral members of the Bcl-2 family of anti-apoptotic proteins.
The Ph chromosome detected in CML varies from the one in ALL, with different BCRbreakpoints between diseases. Two chimeric proteins with different leukemogenic poten‐tial are encoded, one of 210 kDa prevalent in CML and other of 190 kDa prevalent inchildhood ALL [70,71]. In vitro studies showed that the 190kDa BCR-ABL exhibits agreater tyrosine kinase activity than the 210kDa form. Thus, this fusion defines one ofthe subgroups of ALL with the worst clinical prognosis, mainly because it leads to genet‐ic instability through the reduction in DNA repair fidelity and by generation of reactiveoxygen species, that enhance spontaneous DNA damage in tumor cells that can yield theaccumulation of additional genetic mutations [72,73].
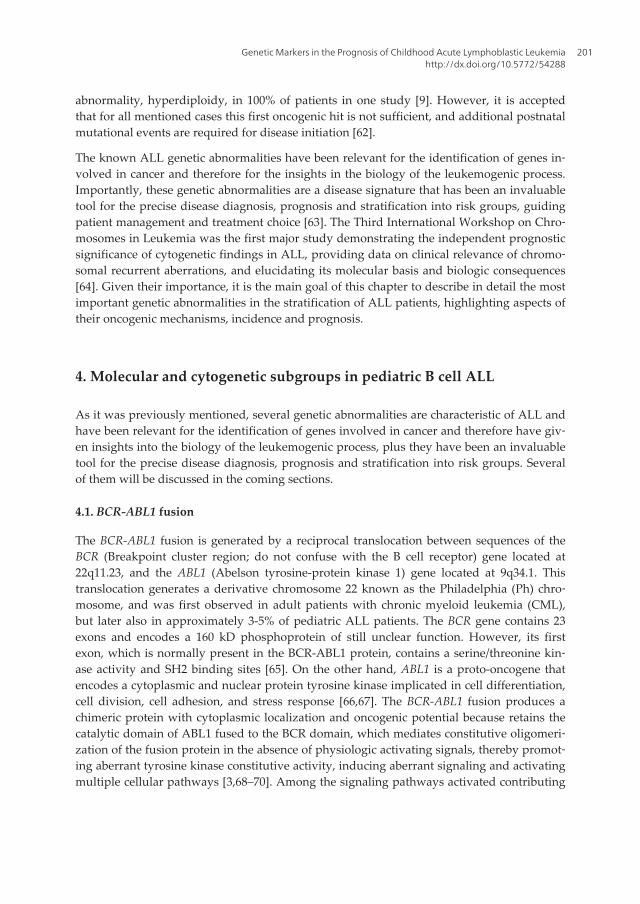
Ph positive childhood ALL is associated with older age at presentation, high leukocytecount, French-American-British (FAB) L2 morphology, and high incidence of centralnervous system. Age at ALL presentation influences the prognosis of this genetic rear‐rangement; patients with ages ranging from one to nine years have a better prognosisthan adolescents and young adults [70,74]. Thus, Ph positive is associated with a veryhigh risk and poor prognosis. Although more than 95% of patients achieve an adequateresponse to induction therapy, these remissions are shallow and short-lived [6]; addition‐ally, these patients frequently present high levels of MRD at the end of the inductiontherapy [75]. Ph positive ALL incidence varies among different cohorts (Table 1), rangingbetween 2-3% for Western European countries (Germany, Italy, Austria, Britain, Switzer‐land) [76–78], 1-4% for American countries (USA and Mexico) [4,79] and 7-15% for East‐ern countries (China, Taiwan, Malaysia-Singapore) [63].
Intensive research efforts were done to demonstrate the BCR-ABL1 transforming activityin vitro and in vivo, as well as to describe the downstream signaling pathways and tran‐scriptional programs affected by this translocation. These studies led to the developmentof successful targeted therapy with small-molecule tyrosine kinase inhibitors (TKI), suchas STI571 (Imatinib mesylate, Gleevec®, Novartis Pharmaceuticals, Basel, Switzerland).This TKI has successfully been used for treatment of Ph positive CML patients [69,87]and has also permitted a better management of ALL patients. Remissions have been ach‐ieved when Imatinib has been used either as single agent or as part of combination regi‐mens. In accordance with COG ALLL0031 trial (2002-2006), patients who received aregimen that included Imatinib achieved a 3-year EFS of 80%, which was more than thedouble of the EFS rate of patients treated without this agent. Although the number oftreated patients was small in this study, it supported that the addition of Imatinib to in‐tensive chemotherapy can improve the outcome of Ph positive ALL children [74,87]. Ge‐nomic studies have identified a subtype of pediatric B cell ALL Ph negative patientswith a gene-expression profile similar to BCR-ABL1 positive ones, it is thought that these“BCR-ABL1 like” disease harbors mutations that deregulate cytokine receptor and tyro‐sine kinase signaling, this subset of B cell ALL patients might also be benefited by theTKI therapy [87]. “BCR-ABL1 like” group will be mentioned in a following section.
Clinical Epidemiology of Acute Lymphoblastic Leukemia - From the Molecules to the Clinic202
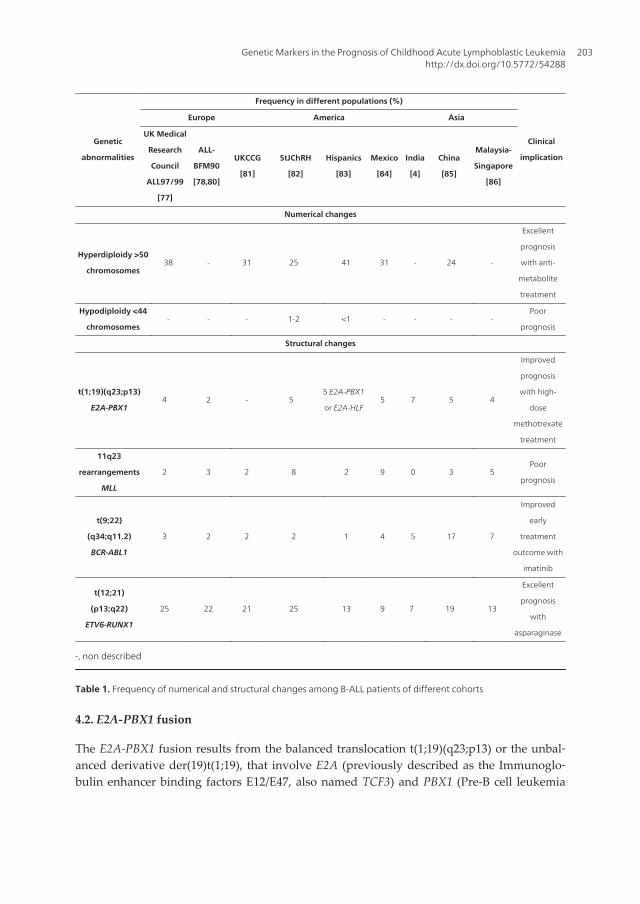
Genetic
abnormalities
Frequency in different populations (%)
Clinical
implication
Europe America Asia
UK Medical
Research
Council
ALL97/99
[77]
ALL-
BFM90
[78,80]
UKCCG
[81]
StJChRH
[82]
Hispanics
[83]
Mexico
[84]
India
[4]
China
[85]
Malaysia-
Singapore
[86]
Numerical changes
Hyperdiploidy >50
chromosomes38 - 31 25 41 31 - 24 -
Excellent
prognosis
with anti-
metabolite
treatment
Hypodiploidy <44
chromosomes- - - 1-2 <1 - - - -
Poor
prognosis
Structural changes
t(1;19)(q23;p13)
E2A-PBX14 2 - 5
5 E2A-PBX1
or E2A-HLF5 7 5 4
Improved
prognosis
with high-
dose
methotrexate
treatment
11q23
rearrangements
MLL
2 3 2 8 2 9 0 3 5Poor
prognosis
t(9;22)
(q34;q11.2)
BCR-ABL1
3 2 2 2 1 4 5 17 7
Improved
early
treatment
outcome with
imatinib
t(12;21)
(p13;q22)
ETV6-RUNX1
25 22 21 25 13 9 7 19 13
Excellent
prognosis
with
asparaginase
-, non described
Table 1. Frequency of numerical and structural changes among B-ALL patients of different cohorts
4.2. E2A-PBX1 fusion
The E2A-PBX1 fusion results from the balanced translocation t(1;19)(q23;p13) or the unbal‐anced derivative der(19)t(1;19), that involve E2A (previously described as the Immunoglo‐bulin enhancer binding factors E12/E47, also named TCF3) and PBX1 (Pre-B cell leukemia
Genetic Markers in the Prognosis of Childhood Acute Lymphoblastic Leukemiahttp://dx.doi.org/10.5772/54288
203
transcription factor 1) genes. E2A encodes two basic helix-loop-helix (bHLH) transcriptionfactors, E12 and E47, through alternative splicing. Both transcription factors are immunoglo‐bulin enhancer binding proteins involved in the regulation of immunoglobulin gene expres‐sion [34] and in the initiation and specification of the B cell lineage [29]. PBX1 also encodes atranscription factor (Leukemia Homeobox 1), a member of the three amino acid loop exten‐sion (TALE) family of homeodomain proteins. PBX1 forms heterodimers with HOX familyhomeodomain proteins and together with them cooperatively regulates transcription of sev‐eral target genes according to the HOX partner [88,89]. PBX1 regulates the self-renewal po‐tential of HSC by maintaining their quiescence state; additionally, it modulates early stagesof B-cell development. PBX1 is also important for the multi-linage potential of human em‐bryonic stem cells (hESC) [90].
E2A-PBX1 fusion results in chimeric proteins that contain the transcriptional activation do‐main of E2A linked to the DNA-binding domain and HOX heterodimerization domain ofPBX1. The resulting oncogenic transcription factor inappropriately activates the expressionof genes normally regulated by the PBX1-HOX heterodimers [3,91]. Among the transcrip‐tional targets of E2A-PBX1 are WNT16 and MerTK. Since the WTN family is widely recog‐nized to be involved in oncogenesis, it is possible that E2A-PBX1 initiates the leukemogenicprocess through its potent expression of WNT16 [10,92]. MerTK is a receptor with a coupledtyrosine kinase activity that regulates self-renewal of bone marrow precursor cells, and al‐though MerTK is not normally expressed in committed lymphocytes, high level expressionis detected in B and T cell ALL and mantle cell lymphomas [93,94].
According to studies in different populations (Table 1), E2A-PBX1 translocation is present inapproximately 2-6% of pediatric ALL cases; however its incidence among the specific pre-BALL subtype (the one with cytoplasmic or membrane IgM) is approximately 25% [64,95,96].The Total Therapy Study XIIIB at St Jude Children’s Research Hospital reported an inci‐dence of 4.7%, with 5-year EFS of 80-90% [4,97]. On the other hand, the reported incidencesfor European countries, such as Great Britain, Germany, Italy, Austria and Switzerland, isbetween 2.1 and 4%, while the reported incidences for Eastern countries (Malaysia, Singa‐pore and China) range from 4.12 to 5.37%. E2A-PBX1 has barely been detected in Guthriecards of B cell ALL patients, which suggests that in most cases emerges postnatally [9]. Also,the molecular breakpoints of the E2A-PBX1 fusion in IgM positive or IgM negative cases aregenerally dissimilar suggesting different origins of the disease [3,98].
Clinical features of pre-B ALL positive for E2A-PBX1, include 5 year age at presentation,WBC count of 21-28,000/µl and pseudodiploid karyotypes [64,87,99]. Risk stratification forE2A/PBX1 patients is controversial. It is considered of poor prognosis in adult cases, whilein children it has been reported either relatively favorable or of poor prognosis. This couldbe explained in part by treatment differences; although it was initially considered of an un‐favorable outcome, rate cures have been improved with the use of more effective therapies,such as dosage intensification with methotrexate [64,82]. Future treatment improvementscould be achieved based on the discovery of pathways for treatment resistance of E2A-PBX1positive cells. It has been shown that MerTK is activated by GAS6 (Growth arrest specific 6)produced in bone marrow by mesenchymal cells, which are part of the HSC supporting
Clinical Epidemiology of Acute Lymphoblastic Leukemia - From the Molecules to the Clinic204
stroma. One of the important functions regulated by GAS6 is HSC self-renewal and it is pos‐sible that the leukemic blast becomes resistant to conventional chemotherapy due to GAS6induced quiescence. Similar to BCR-ABL1 targeted therapy, GAS6-MerTK interaction mightbe an important target for directed therapy [94].
Another translocation involving the E2A gene in ALL is t(17;19)(q22;p13), present in 1% ofchildren, which produces the fusion of E2A to HLF (Hepatic leukemia factor). HLF is a mem‐ber of the bZIP family of transcription factors and the E2A-HLF fusion protein contains thetranscriptional activation domain of E2A linked to the DNA-binding and protein-protein in‐teraction motifs of HLF. The resulting chimeric protein most probably activates the tran‐scription of genes normally regulated by HLF. It is suggested that E2A-HLF inhibitsapoptosis through the aberrant up-regulation of SLUG and LMO2, which are anti-apoptoticfactors in normal hematopoietic progenitor cells [10,100].
4.3. MLL translocations
Myeloid/lymphoid or Mixed lineage leukemia gene (MLL, MLL1, ALL1, TRX, and HTRX) isthe human homologue of the Drosophila melanogaster trithorax gene; it is located at 11q23 andconsists of 36 exons. It encodes a 430 kDa DNA binding protein that positively regulatesHOX gene expression through methylation of lysine 4 of histone 3 (H3K4) [101]. MLL is alarge multi-domain protein, the N-terminus contains three short AT-hook motifs (ATH 1–3),which are thought to mediate DNA binding. There are two speckled nuclear localizationsites (SNL1 and SNL2) immediately C-terminal to the ATH motifs that are followed by atranscriptional repression domain consisting of two functional subunits, RD1 and RD2. RD1contains a DNA methyltransferase (DMT) homology domain with a CxxC zinc-finger motifthat might recruit transcriptional repressors. RD2 recruits histone deacetylases HDAC1 andHDAC2. There is also a plant homology domain (PHD) zinc-finger motif that might mediateprotein-protein interactions and a C-terminal SET (Su(var)3-9, enchancer-of-zeste, trithorax)domain that possesses histone H3 lysine 4 (H3K4) methyltransferase activity [95]. DespiteRD1 and RD2, MLL is thought to be primarily a transcriptional activator due to its methyl‐transferase activity and to the transcriptional activation domain, which recruits the tran‐scriptional co-activator CBP (CREB-binding protein). MLL is thought to be a master gene forepigenetic transcriptional memory regulation.
MLL in its mature form consists of two non-covalently associated subunits, an N-terminal320 kDa fragment (MLLN) and a C-terminal 180 kDa moiety (MLLC), which are both corecomponents of the MLL complex and result from the cleavage of nascent MLL by an aspart‐ic protease named taspase 1. The MLLN fragment is thought to bind DNA regulatory regionsof clustered HOX genes as part of a multi-subunit complex that includes components of thebasal transcription machinery and mediate transcriptional repression of HOX genes. How‐ever, in the presence of MLLC, the MLLN complex can lead to transcriptional activation. TheMLLC subunit contains the SET motif and associates with at least four proteins that modifychromatin for efficient transcription through methylation, acetylation and nucleosome re‐modeling processes [101,102]. MLL gene is ubiquitously expressed in haematopoietic cellsincluding stem and progenitor populations, and HOX genes are direct targets of MLL dur‐
Genetic Markers in the Prognosis of Childhood Acute Lymphoblastic Leukemiahttp://dx.doi.org/10.5772/54288
205
ing development [7,95,102]. Also, MLL is a key constituent of the mammalian DNA damageresponse pathway, and it is reported that deregulation of the S-phase checkpoint mediatedby MLL aberrations contributes to the pathogenesis of human MLL positive leukemias [103].
Most MLL translocations initiate within a well-characterized 8.3 kb breakpoint cluster regionthat encompasses exons 5-11. This region is AT-rich, contains Alu, LINE, and MER repeti‐tive sequences, putative DNA topoisomerase-II cleavage recognition sites, as well as a scaf‐fold and matrix attachment region (SAR/MAR); these elements have been proposed to playa direct or indirect role in promoting 11q23 rearrangements [104]. The proposed mecha‐nisms that yield MLL translocations include recombination of Alu elements, recombinationmediated by topoisomerase-II poisons, and an error prone non-homologous end joining(NHEJ) of DSB [101,104]. MLL fusions are diverse, since it has been found in more than 70different translocations with numerous partner genes. The most frequent are AF4, AF9, ENL,AF10, ELL and AF6. MLL-AF4 results from the translocation t(4;11)(q21;q23) that is common‐ly found in patients younger than one year of age (infant ALL), while MLL-AF9 is generatedby the translocation t(9;11)(p22;q23) that is more frequently seen in secondary, therapy-in‐duced malignancies. Although infrequent, other type of rearrangement involving MLL is thepartial tandem amplification [7].
All MLL fusions encode proteins that share a common transcriptional regulator function ca‐pable of regulating HOX genes expression. Some of the MLL fusion partners are themselveschromatin modifiers that function in histone acetylation, whereas other fusion partners canrecruit histone methyl-transferases, such as DOT1; methylation at lysine 79 of histone H3catalyzed by DOT1 has been recognized as a hallmark of chromatin activated by MLL fusionproteins [7,102,104]. MLL fusion proteins efficiently transform hematopoietic cells into leu‐kemic cells with stem cell-like self-renewal properties [7].
MLL translocations define subgroups of high risk ALL with specific clinical and biologicalcharacteristics associated to adverse prognosis. These subgroups include infant acute leuke‐mia (IAL), therapy-related leukemia (a subtype of leukemia developed by patients previous‐ly treated with etoposide after a cancer episode) and T cell ALL [102]. MLL translocationsare found in approximately 10% of all human leukemias including ALL, AML and bipheno‐typic (mixed lineage) leukaemia, this latter one is characterized by the expression of bothmyeloid and lymphoid antigens such as CD14 and CD19 in the leukemic blast [7,102]. MLLtranslocations are particularly frequent (70-80%) in high risk IAL.
MLL-AF4 is one of the leukemia-inducing genetic rearrangements documented to emerge inutero during fetal hematopoiesis. Concordant MLL-AF4 positive leukemia studies in identi‐cal monozygotic twins demonstrated that both siblings share the same breakpoints, al‐though the disease usually presents at different times in each twin [105]. Moreover, MLL-AF4 can be detected in archived neonatal blood from Guthrie cards in IAL or in ALLpatients. This evidence coupled with the short period of latency observed in patients thatdevelop IAL, strongly suggests that some leukemia-driving gene fusions can be acquiredprenatally [9,62,95]. These observations have raised the question if in utero exposition to spe‐cific environmental mutagens can induce MLL breakage and anomalous recombinationevents. In vitro and in vivo assays have identified bioflavonoids, hormones and insecticides
Clinical Epidemiology of Acute Lymphoblastic Leukemia - From the Molecules to the Clinic206
as potential inductors of MLL aberrations [80,106–110]. Additionally, the best-known induc‐tor of MLL aberrations is etoposide, which is a DNA topoisomerase-II inhibitor commonlyused as a chemotherapeutic agent. Etoposide induced genetic aberrations might be due toincreased concentrations of DNA topoisomerase-II DNA cleavage complex. 11q23 rear‐rangements, particularly those that generate MLL-AF9 fusions, are found in 5-15% of secon‐dary therapy-related leukemias [104,107,111–113].
As mentioned before, the frequency of MLL rearrangements in IAL, particularly the MLL-AF4 fusion, is approximately 80%; however, this frequency diminishes in older childrenwith ALL. MLL rearrangements incidences reported from American countries ranged from2.2-3.3%, while for European countries (Germany, Italy, Austria, UK and Switzerland) wasbetween 2.1-6%. The incidence of MLL rearrangements in Eastern countries (China, Taiwan,Malaysia and Singapore) also ranged from 2.1-4.9%. The estimated 5-year EFS for patientswith MLL translocations ranged between 30-40% [4] and therefore it is considered of verybad prognosis.
4.4. ETV6-RUNX1 fusion
RUNX1 (Runt-related transcription factor 1 and also known as AML1 or CBFα2) is a genethat maps in 21q22.3. RUNX1 encodes a transcription factor that contains a Runt domain es‐sential for interaction with transcription factor CBFβ and for DNA binding [114]. TheRUNX1-CBFβ heterodimer is a master regulator of early hematopoietic genes transcription.ETV6 (E-Twenty-Six, also named TEL), is localized in 12p13.1, belongs to the ets transcrip‐tion factor family, and contains two major domains: ETS and helix-loop-helix (HLH). ETV6participates in fetal hematopoiesis of all lineages [115,116]. A substantial proportion (7-25%of children and 2% of adults, Table 1) of ALL patients present the ETV6/RUNX1 fusion as aresult of the translocation t(12;21)(p13;q21). The chimeric protein from this fusion containsthe N-terminal region of ETV6 fused to almost all RUNX1, including the Runt domain. TheETV6 fragment losses the DNA binding domain but retains the protein binding domain thatinteracts with cellular proteins with transcriptional repression activity, N-CoR and mSin3a,producing stable repression complexes at the promoters of RUNX1 target genes. mSin3atranscriptional repressor function is due to a histone deacetylase activity(HDAC) [10] butthe ETV6-RUNX1 fusion has additional repressor functions through sequestration of tran‐scriptional complexes and competitive inhibition of the wild-type ETV6 activity [10,116].
Several abnormalities secondary to ETV6-RUNX1 fusion have been detected, such as ETV6loss, ETV6/RUNX1 duplication and extra copies of RUNX1 originated by trisomy 21. Recent‐ly, it has been described that ETV6 loss occurs postnatally in more mature cells than theETV6-RUNX1 fusion. Analysis of this deletion revealed an unexpected similarity with SINEand LINE retrotransposons, suggesting their participation in this loss of heterozygosity-likemechanism of ETV6 loss. These findings are consistent with Greaves´ double hit model ofleukemogenesis for this subtype of ALL [117].
ETV6/RUNX1 positive patients have been defined as a group with excellent outcome at 5years follow-up, which cannot be identified by standard prognostic features [118,119]. Inseveral studies based on different populations, this subgroup represented about 25% of cas‐
Genetic Markers in the Prognosis of Childhood Acute Lymphoblastic Leukemiahttp://dx.doi.org/10.5772/54288
207
es with B cell precursor immunophenotype [120]; and this genetic marker could also befound in T cell ALL [81]. Other studies support different incidence rates for ETV6/RUNX1fusions depending on ethnicity and geographic origin [83,85,121,122] (Table 1). In particular,the lowest frequencies have been described for Hispanic [83,121] and Oriental patients[85,123], compared to patients from West Europe and the United States. Given this differ‐ence, further studies should be conducted looking for environmental and genetic etiologicfactors, including exposure to leukemogenic agents, analysis of predisposition genes associ‐ated to ALL and genetic ancestry in different populations.
Several studies have supported that ETV6-RUNX1 positive patients have an excellent out‐come in clinical trials after treatment with corticosteroids, vincristine, and asparaginase [82].Nevertheless, ETV6/RUNX1 has been considered as a non-significant prognostic factor inother studies, since this fusion has been found in relapsed patients [124,125]. In spite of theirexcellent initial treatment response, and favorable short-term outcome, up to 24% of patientsrelapse [124], and this usually occurs in patients out of treatment, often several years aftercessation of treatment and occasionally as long as 10 to 20 years later [125]. Efforts have beenmade for obtaining a better understanding about the origin of relapses in this group of ALLpatients. Analyses of copy number abnormalities (CNAs) have provided evidence thatETV6-RUNX1 positive patients have an average of 6 CNAs at diagnosis, with increasingabundance of these CNAs at relapse, and the genes involved in CNAs usually include cellcycle regulator genes [125,126].
The clonal origin of relapse has been investigated comparing CNA profiles from matchedETV6/RUNX1 positive patients at diagnosis and relapse. Genes associated with cell cyclecontrol (cyclin-dependent kinase inhibitors CDKN2A, CDKN2B, CCNC) were found deletedin relapsed patients. As a novel finding, trisomy 16 was observed as a recurrent abnormali‐ty, although its significance is presently unknown [125]. A model of abnormalities acquisi‐tion from diagnosis to relapse has been proposed; mutations detected recurrently or knownto be involved in a leukemogenic pathway were classified as driver mutations, while muta‐tions defined as non-recurrent or without a known function in leukemogenesis were consid‐ered passenger mutations. Four genetic profiles have been proposed with this analysis: 1)diagnosis and relapse clones with the same abnormalities; 2) relapse clones with acquiredextra driver mutations; 3) relapse clones with losses and gains of driver mutations and 4)relapse clones without all original CNAs but with a novel profile of genetic alterations [125].At least 3 of these groups support that clones present at diagnosis are responsible for relap‐ses occurring months or years after treatment cessation. In one patient with a remission last‐ing 119 months a backtracking FISH analysis was performed, and a low number of leukemicsubclone was identified at presentation whose genotype matched that observed in the re‐lapse clone. This patient showed clonal diversity at diagnosis and the relapse subclone prob‐ably remained due to active mechanisms of chemotherapy resistance and quiescence. Theauthors suggested that this case of relapse represents an effect of a dormant clone with lowproliferative capacity and associated drug insensitivity rather than a mutation-induced re‐sistance effect [125]. This patient might exemplify the genetic variation sometimes observedbetween initiating and relapse clones. Thus, this study argues that evolutionary genetic
Clinical Epidemiology of Acute Lymphoblastic Leukemia - From the Molecules to the Clinic208
changes between the leukemic blast at presentation and relapse most probably are due tothe frequency and intrinsic genetic characteristics of the relapsed clone.
More recently, it has been shown that genes associated with glucocorticoid mediatedapoptosis could be deleted in ETV6/RUNX1 relapsed patients. One of the most alteredgenes is the Bcl2 modifying factor (BMF), whose deletion is often detected at diagnosisand relapse. The glucocorticoid receptor NR3C1, and genes of the mismatch repair path‐ways are also deleted, but this was only observed at relapse. All these genes participatein apoptosis induced by gluococorticoids, supporting that a drug resistance mechanismcould contribute to the episode of leukemia relapse, e.g. BMF deletions leading to surviv‐al of a specific leukemic clone after gluococorticoid treatment [126]. This information isrelevant for future evaluation of ETV6/RUNX1 patients and perhaps this genetic lesionshould be diagnosed in ALLs together with BMF, NR3C1 and other CNAs as a guide fornovel treatment approaches.
4.5. Hyperdiploidy
Hyperdiploidy with 51-65 chromosomes is also a frequent abnormality, 25-41% of ALLpatients present this numerical aberration [10,83,85] and are generally associated with afavorable outcome (Table 1). This includes age 3-5 years and relative low WBC count atpresentation, B cell precursor immunophenotype [127] and a 5-year EFS estimate of85-95% when patients are treated with anti-metabolite based therapy [4,127]. Leukemiclymphoblasts in this subgroup have a high propensity to undergo apoptosis in vitro andin vivo, and accumulate greater quantities of methotrexate and its active polyglutamatemetabolites than other ALL subgroups. These features are probably very important forthe associated good prognosis of this subtype of ALL.
High hyperdiploidy can be detected by cytogenetic analysis or flow cytometry. This lattertechnique measures the DNA content of the leukemic blasts in comparison to the normal cellpool and DNA content of 1.16 is considered as a prognostic indicator of favorable outcome.However, it is recommended to perform additional cytogenetic studies to detect specificchromosome gains, and discard the presence of additional genetic rearrangements, whichcould also influence disease outcome. About 50% of hyperdiploid cases present additionalabnormalities as duplications of 1q or isochromosome 17q, this last abnormality confers ad‐verse prognosis [128]. High hyperdiploidy is often characterized cytogenetically by massiveaneuploidy, originating a non-random gain of specific chromosomes, including some or allof +X, +4, +6, +10, +14, +17, +18, and +21; trisomies and tetrasomies of other chromosomes arealso present in this group of patients [127].
In spite of the excellent prognosis associated to this genetic subtype, about 25% of thepatients develop adverse events, indicating outcome differences and genetic subgroupsbetween high hyperdiploid patients. For this reason, diverse studies have been per‐formed trying to identify prognostic characteristics in these ALL patients. Based on cyto‐genetic studies and survival analyses, specific trisomies have been found associated toprognosis. Results from univariate analyses informed that gain of individual chromo‐somes 6, 4, 10 and 18 improves prognosis, in contrast, trisomy 5 confers worse prognosis
Genetic Markers in the Prognosis of Childhood Acute Lymphoblastic Leukemiahttp://dx.doi.org/10.5772/54288
209
[129–131]. Currently, the Children's Cancer Group (CCG) and the Pediatric OncologyGroup (POG) consider the presence of simultaneous trisomies of chromosomes 4, 10, and17 as a favorable prognostic factor [132].
Analysis by SNP array of high hyperdiploid patients have been performed and revealedthat 80% presented CNAs, which are not detected by traditional cytogenetic methods. Anassociation between duplication of 1q and +5 has often been observed, and also uniparentalisodisomies of chromosomes 9 and 11, gains of chromosomes 17q and 21q, deletions and mi‐crodeletions of ETV6, cyclin-dependent kinase inhibitor 2A (CKDN2A), PAX5 and PAN3poly(A) specific ribonuclease subunit homolog (PAN3). Interestingly, partial deletions of ATrich interactive domain 5B (ARID5B) were also detected [127] and polymorphisms of thisgene were recently associated to susceptibility for developing ALL, particularly associatedwith the high hyperdiploid subtype [133].
ALL cases with 47-50 chromosomes have an intermediate prognosis [71], near-triploidy (69to 81 chromosomes) [134] have a response to therapy similar to that of non-hyperdiploid,and ALL cases with near tetraploidy (82 to 94 chromosomes) have a high frequency of T cellimmunophenotype (see T cell ALL section) and frequently harbors a cryptic ETV6-RUNX1fusion [135]. These tetraploid leukemias, although significantly less common, have a worseprognosis than the ones with 51-65 chromosomes. The genetic reason for this differentialprognosis is presently unclear.
4.6. Hypodiploidy
The hypodiploid ALL is defined as leukemic blasts with less that 46 chromosomesand it is present in 6-7% of patients with childhood ALL. Three different subgroupshave been defined according to the number of chromosomes, which are also importantfor disease outcome: near-haploid ALL (less than 30 chromosomes), low hypodiploidALL (33-39 chromosomes) and high hypodiploid ALL (42-45 chromosomes). Near-hap‐loidy is observed approximately in 0.5% of ALL cases and it is most frequently associ‐ated with females, and together with low hypodiploidy is related with the worstprognosis. Also, children with near-haploidy tend to be younger than those with lowhypodiploidy [134,136]. Most of the hypodiploid ALL patients belong to the high hy‐podiploid group.
The pattern of chromosome loss in near-haploidy is not random as there is preferential re‐tention of two copies of chromosomes 6, 8, 10, 14, 18, 21, and the sex chromosomes. In rarecases, an apparent hyperdiploid genome is observed but the number of chromosomes re‐sults from doubling haploid or near-haploid chromosome content. In these cases, althoughthere is an increased in the total number of chromosomes, this ALL is still characterized bylosses of specific chromosomes. This ALL is frequently wrongly diagnosed without a carefulcytogenetic and DNA content analysis [136], and an appropriate diagnosis is important asnear-haploidy defines a rare type of ALL associated with short remission duration and poorprognosis. Therefore, a clear diagnosis of the total chromosome number is essential to strati‐fy patients into the appropriate risk group.
Clinical Epidemiology of Acute Lymphoblastic Leukemia - From the Molecules to the Clinic210
5. Molecular and cytogenetic subgroups in pediatric T-cell ALL
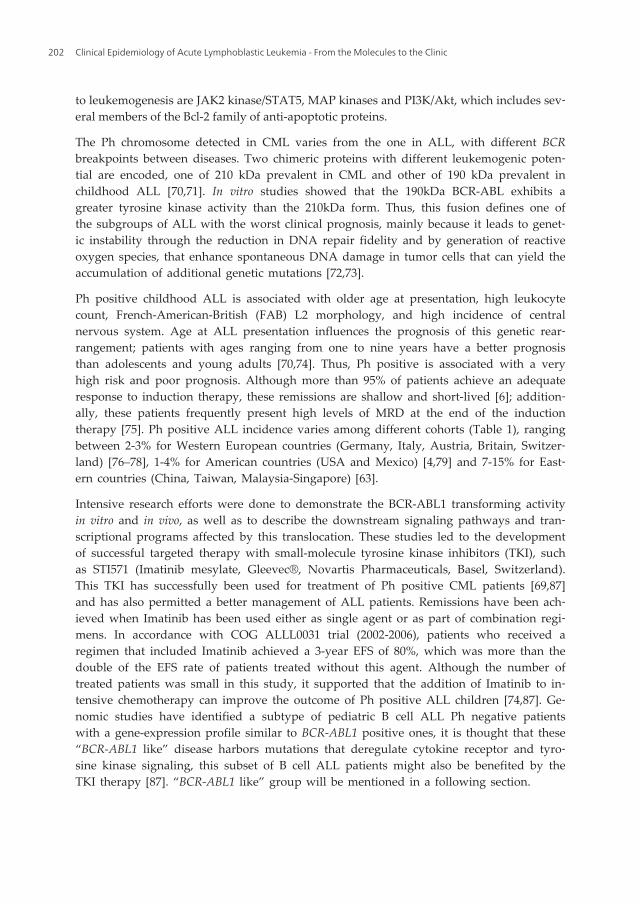
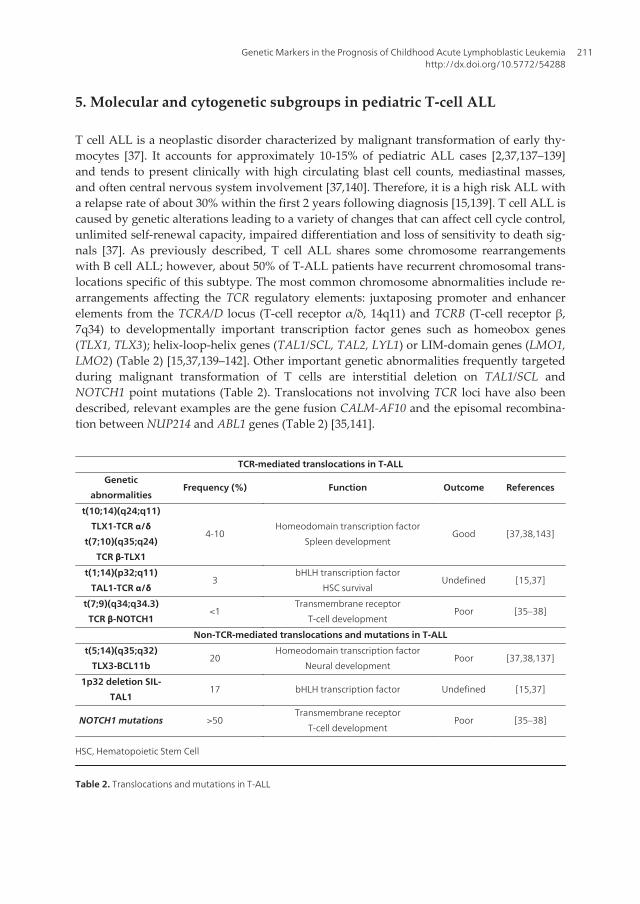
T cell ALL is a neoplastic disorder characterized by malignant transformation of early thy‐mocytes [37]. It accounts for approximately 10-15% of pediatric ALL cases [2,37,137–139]and tends to present clinically with high circulating blast cell counts, mediastinal masses,and often central nervous system involvement [37,140]. Therefore, it is a high risk ALL witha relapse rate of about 30% within the first 2 years following diagnosis [15,139]. T cell ALL iscaused by genetic alterations leading to a variety of changes that can affect cell cycle control,unlimited self-renewal capacity, impaired differentiation and loss of sensitivity to death sig‐nals [37]. As previously described, T cell ALL shares some chromosome rearrangementswith B cell ALL; however, about 50% of T-ALL patients have recurrent chromosomal trans‐locations specific of this subtype. The most common chromosome abnormalities include re‐arrangements affecting the TCR regulatory elements: juxtaposing promoter and enhancerelements from the TCRA/D locus (T-cell receptor α/δ, 14q11) and TCRB (T-cell receptor β,7q34) to developmentally important transcription factor genes such as homeobox genes(TLX1, TLX3); helix-loop-helix genes (TAL1/SCL, TAL2, LYL1) or LIM-domain genes (LMO1,LMO2) (Table 2) [15,37,139–142]. Other important genetic abnormalities frequently targetedduring malignant transformation of T cells are interstitial deletion on TAL1/SCL andNOTCH1 point mutations (Table 2). Translocations not involving TCR loci have also beendescribed, relevant examples are the gene fusion CALM-AF10 and the episomal recombina‐tion between NUP214 and ABL1 genes (Table 2) [35,141].
TCR-mediated translocations in T-ALL
Genetic
abnormalitiesFrequency (%) Function Outcome References
t(10;14)(q24;q11)
TLX1-TCR α/δ
t(7;10)(q35;q24)
TCR β-TLX1
4-10Homeodomain transcription factor
Spleen developmentGood [37,38,143]
t(1;14)(p32;q11)
TAL1-TCR α/δ3
bHLH transcription factor
HSC survivalUndefined [15,37]
t(7;9)(q34;q34.3)
TCR β-NOTCH1<1
Transmembrane receptor
T-cell developmentPoor [35–38]
Non-TCR-mediated translocations and mutations in T-ALL
t(5;14)(q35;q32)
TLX3-BCL11b20
Homeodomain transcription factor
Neural developmentPoor [37,38,137]
1p32 deletion SIL-
TAL117 bHLH transcription factor Undefined [15,37]
NOTCH1 mutations >50Transmembrane receptor
T-cell developmentPoor [35–38]
HSC, Hematopoietic Stem Cell
Table 2. Translocations and mutations in T-ALL
Genetic Markers in the Prognosis of Childhood Acute Lymphoblastic Leukemiahttp://dx.doi.org/10.5772/54288
211
5.1. Impaired differentiation caused by defects in transcription factors expression/function
5.1.1. Deregulation of TLX1 and TLX3 Homeobox genes
Homeobox genes (HOX) are divided into two classes: class I HOX genes (HOXA-D) andclass two HOX genes (TLX1 and TLX3). Class II HOX genes have been extensively studiedIn T cell ALL and from them TLX1 has been found activated in 4-10% of childhood T cellALL, most frequently by t(10;14)(q24;q11) and t(7;10)(q35;q24) chromosomal translocations[36,37,40,137,143–145]. Both rearrangements lead to the transcriptional activation of TLX1gene by re-location of TLX1 coding sequences under the transcriptional control of the TCRregulatory sequences (Table 2) [36,37,40,137]. TLX1 is not normally expressed in healthy Tcells. Interestingly, overexpression of TLX1 has also been observed in absence of knowntranslocations, suggesting that other mechanisms of up-regulation are involved. Epigeneticchanges mediated by promoter demethylation can also lead to TLX1 aberrant expression[36,137,145]. TLX1+ T cells are virtually all arrested at a developmental stage phenotypicallysimilar to the early cortical (CD1+) CD4+CD8+ “double-positive” stage of thymocyte devel‐opment (early cortical thymocytes) [40]. However, these leukemic T cells lack preTCR ex‐pression suggesting that the oncogenic event occurred very early in development (probablyto ETP/DN1 cells) and TLX1 aberrant expression helped the cell to bypass the first develop‐mental checkpoints until the cells were finally arrested at the double positive stage [139].The favorable clinical outcome of patients with this phenotype might support the arrest inthe double positive stage, since it is characterized by lack of expression of anti-apoptoticgenes because of the tolerance and negative selection mechanisms that are at work to elimi‐nate self-reactive T cell clones [35–37,143–145].
The cryptic chromosomal translocation t(5;14)(q35;q32) juxtaposes TLX3 to the distal regionof BCL11B producing a strong expression of TLX3, a genetic lesion present in approximately20% of childhood T cell ALL (Table 2) [15,35–37,137,141]. Like TLX1, TLX3 is not expressedduring normal T cell development [36]. Rare variants of t(5;14) have also been reported:t(5;14)(q32;q11) involving TRA/TRD and t(5;7)(q35;q21) involving CDK6 [35–37]. Some stud‐ies indicated that TLX3 confers a bad response to treatment, but this is controversial sincevariation has been found between different populations [139]. It is possible that the prognos‐tic meaning of TLX3 overexpression might be influenced by the presence of additional al‐tered oncogenes such NUP214-ABL1 or NOTCH1 [15,37].
5.1.2. Deregulation of TAL1, a basic Helix-Loop-Helix (bHLH) gene
Two different models have explained the oncogenic potential and transformation mecha‐nism of TAL1: 1) inappropriate activation of TAL1 target genes and 2) through a dominant-negative mechanism in which TAL1 binds to and inhibits the normal activity of the E2A(E47)/HEB transcription factor complex. The second mechanism suggests that E2A proteinsmay directly regulate cell cycle in thymocyte precursors [35,37,146]. TAL1 maps on chromo‐some 1p32 and abnormal function of this gene is one of the most common transcriptionaldefects in childhood T cell ALL (Table 2); in 17% of patients TAL1 activation is a conse‐
Clinical Epidemiology of Acute Lymphoblastic Leukemia - From the Molecules to the Clinic212
quence of a cryptic interstitial deletion that generates a SIL-TAL1 fusion, and in 3% of pa‐tients, t(1;14)(p32;q11) juxtaposes TAL1 to TCR transcriptional regulatory elements causingits ectopic expression [37]. Ectopic TAL1 expression is associated with a maturation arrest ofthymocytes. TAL1 protein could also induce overexpression of BCL2A1, resulting in anti-apoptotic activities in the stage of T cell development arrest and a poor response to therapy,particularly in young children [35,37,147,148].
It is documented that TLX3 expression confers a poor response to treatment, whereas TLX1activation is significantly associated with a better prognosis in T cell ALL. A high percentageof cryptic abnormalities of TLX1, TLX3 and TAL1 genes (both translocations and deletions),are mostly detected only using FISH with specific probes for each type of alteration [35]. Re‐cently, quantitative RT-PCR and expression microarrays have permitted a better and techni‐cally simpler T cell ALL classification based on the differential oncogene expression pattern[35]. Most probably, these new methodologies will positively impact the outcome of T cellALL patients, allowing for a better disease sub-typing and assignment of treatments withbetter therapeutic responses.
A novel subgroup of early T cell precursor leukemia has been reported, characterized by si‐multaneous expression of T cell/ stem-cell/myeloid markers and very poor prognosis whentreated with standard intensive chemotherapy. Interestingly, this subgroup includes a partof those patients with LYL1 and LMO1 overexpression [2].
5.2. Activation of the NOTCH1 signaling pathway
The first alteration described affecting NOTCH1 in T cell ALL was t(7;9)(q34;q34.3), whichcouples the coding sequences of the NOTCH1 ICN to the TCR β locus. This alteration ispresent in <1% of T cell ALL patients [36,38,138]. Currently, gain-of-function mutations inNOTCH1 are reported in >50% of all T cell leukemia patients. NOTCH1 mutations are main‐ly observed in the HD and PEST domains. Mutations in HD result in NOTCH1 constitutiveactivation and cell transformation. These HD NOTCH1 mutants are observed in an averageof 44% of T cell ALL patients. The deletion of the PEST domain enhances NOTCH1 intracel‐lular signaling and is present in 30% of patients. Both, HD and PEST mutations together arefound in 17% of cases, and have a synergistic effect on NOTCH1 activation [35,38,138].NOTCH1 mutations are found in all developmental subtypes of T cell ALL, supporting thatthese mutations might occur very early in T cell progenitors [35], and in general, they repre‐sent a marker of poor prognosis in patients with T cell ALL (Table 2) [138]. Zhu and colsreported that the outcome of patients with NOTCH1 mutations varies according to the con‐comitant expression of TLX1 and/or TLX3. Patients additionally positive for TLX3 expres‐sion, have worse prognosis than those with TLX1 expression since the latter ones tent toshow prolonged survival [138].
Glucocorticoids are normally used to treat T cell ALL patients and glucocorticoid resistancehave been mapped to NOTCH1 aberrant expression. Recently, a combination therapy withglucocorticoids and GSIs in a mouse model of resistant to treatment T cell ALL show prom‐ising results, arguing that NOTCH1 inhibitors in combination with traditional anti-leukemicdrugs might improve disease prognosis in patients with NOTCH1 mutations [149].
Genetic Markers in the Prognosis of Childhood Acute Lymphoblastic Leukemiahttp://dx.doi.org/10.5772/54288
213
6. New prognostic markers detected by genomic variation assays andgene expression evaluation in childhood ALL
The previously described genetic abnormalities in ALL influence the aggressive behavior ofleukemic cells and the response to treatment in an important manner. Unfortunately, thoseabnormalities are not 100% predictive of disease outcome. More recently, genome wideanalysis has identified genes associated with risk to relapse in patients with primary genefusions and hyperdiploidy. These studies have also found novel gene abnormalities proba‐bly leading to altered signaling pathways and gene expression patterns in the leukemicblast. Nowadays, many novel cryptic translocations, mutations, deletions, and abnormal ex‐pression profiles are considered useful outcome markers in children with ALL and severalof these more common markers will be further detailed in this section.
6.1. CASP8AP2
The Caspase-8-Associated Protein 2 gene, also known as FLICE associated Huge Protein(CASP8AP2 or FLASH), is located at 6q15. CASP8AP2 encodes a protein with multiplefunctions; although it has been traditionally recognized as a key mediator of apoptosis,several studies have demonstrated that also participates in cell division [150], NF-kappaBsignaling [151,152], c-Myb activation [153,154], S phase progression [155], histone tran‐scription and 3´-end maturation of histone mRNAs [155–157]. CASP8AP2 interacts withthe death-effector domain (DED) of caspase 8 and hence it plays an important regulatoryrole in Fas-mediated apoptosis.
The clinical significance of CASP8AP2 was first reported in Flotho and cols study [158], inwhich differences in expression levels were associated with in vivo responses to multiagentchemotherapy. CASP8AP2 expression was analyzed in 99 patients enrolled in St Jude TotalTherapy Study XIII and patients were divided into 3 groups according to expression. Pa‐tients with high expression levels had significantly better EFS rates and lower cumulativeincidences of relapse than those with intermediate or low CASP8AP2 expression. The pro-apoptotic function of CASP8AP2 and its low expression in leukemic blasts from patientswith persistent MRD, suggest that this gene could be a powerful predictor of treatment re‐sponse in childhood ALL. Furthermore, Flotho and cols [159] identified a signature of 14genes associated with MRD, and CASP8AP2 was among the signature genes with a low lev‐el expression. Other genes down regulated in these high risk patients were the H2A histonefamily member Z (H2AFZ), budding uninhibited by benzimidazoles 3 homolog (BUB3) andCDC28 protein kinase regulatory subunit 1B (CKS1B). All these patients showed suboptimalresponses to remission induction therapy and they eventually relapsed [159].
Analyses of CASP8AP2 as a prognostic marker used for risk stratification have beenmade in leukemic patients from different populations. In a cohort of 39 newly diagnosedALL patients enrolled in Beijing Children`s Hospital (BCH)-ALL 2003 protocol, the bonemarrow expression of CASP8AP2 at diagnosis was an useful indicator for relapse. In thesame study, 106 patients enrolled in Chinese Children´s Leukemia Group (CCLG)-ALL2008 protocol were also analyzed, and patients with low CASP8AP2 expression present‐
Clinical Epidemiology of Acute Lymphoblastic Leukemia - From the Molecules to the Clinic214
ed higher relapse rates, lower relapse free survival and lower overall survival, in com‐parison to the high-expression group [160].
Biologic basis of the variation of CASP8AP2 expression could be deletions at band6q15-16.1, which are often detected in patients with T cell ALL. This abnormality resultsin down regulation of CASP8AP2 expression and poor response to early treatment. In 73T cell ALL samples obtained from patients enrolled in the multicenter ALL-BFM 1990,ALL-BFM 1995 and ALL-BFM 2000 protocols, deletion 6q15-16.1 was associated with un‐favorable MRD levels. Although deletion 6q15-16.1 involves several genes, CASP8AP2was the single gene with a better association between the deletion and the less efficientinduction of apoptosis by chemotherapy [161].
The usefulness of CASP8AP2 expression as a potential marker of early response to treatmentand relapse is still controversial. Yang et. al. [157] failed to show prognostic significance forthis gene expression in a group of 78 B cell ALL and 12 T cell ALL newly diagnosed patientsenrolled in the Taiwan Pediatric Oncology Group (TPOG). Further studies should be per‐formed in ALL children from different populations and measuring different treatment pro‐tocols in order to clarify the prognostic significance of CASP8AP2.
6.2. IKZF1
The IKZF1 or LyF1 gene encodes Ikaros, a transcription factor located on chromosome 7p12,whose largest transcript comprises 6 zinc finger domains in 7 exons; four of these fingers arerequired for DNA binding and the other 2 for homo and heterodimeric associations withother Ikaros family members, for example Helios and Aiolos [162].
IKZF1 encodes 11 isoforms through a mechanism of alternative splicing, each isoform con‐taining a different set of zinc finger domains dictating differential DNA binding capabilities.Five of these isoforms (Ik-1, Ik-2, Ik-2A, Ik-3 and Ik-3A,) are considered as “long” and func‐tional, because they conserve at least 3 N-terminal DNA binding domains, which permitthem entering to the nucleus and presenting high transcriptional activity. The remaining iso‐forms are referred as “short” (Ik-4, Ik-4A, Ik-5, Ik-6, Ik-7 and Ik-8) and have 2 or less N-ter‐minal DNA binding domains. They are unable to bind DNA with high affinity, do not enterthe nucleus, therefore neither activate transcription, but retain the protein binding domainsand then the ability to form homo and heterodimers. This group might act as non-DNA-binding dominant-negative isoforms, reducing Ikaros activity. In particular, Ik-6 is not effi‐ciently translocated to the nucleus, resulting in null transcriptional activity [162,163].
Ikaros plays an essential role in development and differentiation of lymphoid and myeloidlineages. It acts as a tumor suppressor and as a regulator of gene expression through a chro‐matin remodeling function. In normal cells, long Ik-1 and Ik-2 isoforms are more expressedthan the predominantly dominant-negative isoforms, Ik-3, Ik-4, Ik-5 and Ik-6 [162,163]. Dur‐ing alternative splicing Ikaros is susceptible to loss the amino-terminal DNA-binding do‐main, leading to increased expression of specific isoforms, in particular Ik-6, which isstrongly associated with B and T cell ALL [164–166].
Genetic Markers in the Prognosis of Childhood Acute Lymphoblastic Leukemiahttp://dx.doi.org/10.5772/54288
215
On the other hand, SNP array analysis of B cell ALL children has revealed deletions of com‐plete IKZF1 locus; there were also deletions of coding exons 3 through 6, resulting in Ik-6expression in B-ALL patients. It has also detected point mutations (R111, L117fs, G158S,H224fs, S402fs and E504fs); in particular G158 attenuates the DNA-binding activity andmight act as a dominant-negative Ikaros allele. [167]. Approximately 28% of high risk B cellALL patients, and 9% of unselected risk patients show IKZF1 deletions [167,168]. Deletionsin IKZF1 in unselected B cell ALL Asian patients are present in 10-15%; this incidence is sim‐ilar to the one previously seen in Caucasian countries [85,157].
“Short” and “long” isoforms can be expressed in leukemic cells from both B and T cell ALLpatients, however, the frequency and expression levels seem to vary between specific immu‐nophenotype and genetic subgroups [169,170]. For instance, Ph positive B cell ALL patientstend to have higher levels of Ik-6 in contrast to Ik-1 and Ik-2 [170]. Interestingly, one studyfound that IKZF1 is deleted in 84% of Ph positive B cell ALL patients, supporting its impor‐tant role in the pathogenesis of this genetic subtype [168]. Ik-6 has also been found overex‐pressed in patients with the MLL-AF4 fusion [171].
Regarding prognosis, there is a strong correlation between mutations, deletions in IKZF1 orpresence of non-functional Ikaros isoforms, and poor outcome in both B and T cell ALL pa‐tients. Nevertheless, this association is independent of the presence of the BCR-ABL1 fusion,since both Ph positive and negative patients have poor outcome when IKZF1 is altered[167,168]. Furthermore, approximately 35% of ALL relapsed cases, this condition also con‐tributes to chemotherapy resistance [172,173]. Events of relapse have been predicted in 79%of non-high risk ALL patients based in both MRD and IKZF1 deletions [174]. Recently, anovel high risk ALL subgroup called “BCR-ABL1 like” has been identified, 39% of them pre‐sented IKZF1 deletions or mutations and they had a highly unfavorable prognosis as thatfound in the Ph positive B cell ALL group. About 20% of the total of B cell ALL patients be‐long to this “BCR-ABL1 like” subgroup [175].
6.3. JAK2
The JAK2 gene is located on 9p24 and encodes a kinase that belongs to the JAK family ofprotein tyrosine kinases (JAK1, JAK2, JAK3 and TYK2). All members of the JAK family areactivated by tyrosine phosphorylation and participate in proliferation, differentiation, andcellular migration processes after activation. Additionally, JAK2 regulates apoptosis duringhematopoiesis. After JAK2 is activated, this tyrosine phosphorylates STAT5 leading to its di‐merization, nuclear translocation and regulation of its target genes. The JAK/STAT pathwayis the main signaling mechanism for numerous cytokines and growth factors. Mutations indifferent members of the JAK family are associated with inflammatory disease, erythrocyto‐sis and childhood ALL [176,177].
Recently, it has been shown that the mutation R683, within the JAK2 pseudokinase domain,is present in approximately 3-4% of childhood ALL patients [178]. About 10% of high risk Bcell ALL patients are R683+, however, the incidence is increased in patients with Down syn‐drome (18-28%) [179–181]. The incidence of JAK2 mutations is about 10% in the high-risk“BCR-ABL1 like” group [182]. JAK2 mutations have also been observed in cell lines MHH-
Clinical Epidemiology of Acute Lymphoblastic Leukemia - From the Molecules to the Clinic216
CALL4 and MUTZ5, derived from B cell ALL patients without Down syndrome [183]. JAK2mutations in ALL are significantly associated with poor outcome and the prognosis is worsewhen are associated with IKZF1 deletions; this is an important observation since it has beenestimated that 87% of high risk ALL cases harbor JAK2 mutations together with IKZF1 dele‐tions [182].
6.4. CRLF2
The Cytokine receptor-like factor 2 or CRLF2 gene also termed thymic stromal lymphopoietinreceptor (TSLPR), encodes a type I cytokine receptor. This gene is located in the pseudoauto‐somal region 1 (PAR1) at both sex chromosomes, X (Xp22.3) and Y (Yp11.3). CRLF2 forms aheterodimeric receptor with IL7Rα which binds the thymic stromal lymphopoietin (TSLP)ligand. CRLF2 plays an important role during T cell and dendritic cell development, pro‐motes B cell survival and proliferation, and is involved in inflammation, allergic responsesand malignant transformation [183,184].
Approximately 40% of children with B cell ALL have CRLF2 cryptic genetic alterations,which induce abnormal signaling during B cell development [178]. CRLF2 is involved in 2types of genomic rearrangements: 1) an interstitial deletion within the PAR1 region of chro‐mosome X or Y that places the CRLF2 gene under the transcriptional control of the P2RY8promoter (P2RY8-CRLF2), and 2) two cryptic chromosomal translocations t(X;14)(p22; q32)and t(Y;14)(p11;q32), both involving the locus of the B cell antigen receptor heavy chain (fu‐sion IGH-CRLF2) [183,185,186]. PAR1 deletions seem to be more frequent than IGH-CRLF2translocation, however some groups report that translocation is the most frequent; these ob‐servations are still controversial. CRLF2 rearrangements are associated with aberrant over‐expression of CRLF2 in B cell ALL patients and might contribute to the pathogenesis of thedisease [187–190]. Approximately 50% of patients with high CRLF2 expression present aCRLF2 rearrangement. However, in a few studies, low CRLF2 expression has been detectedin ALL with the P2RY8-CRLF2 rearrangement. This low expression could result from a lowfrequency of the leukemic clone with the P2RY8-CRLF2 lesion within the heterogeneouspool of leukemic blasts, further studies will be necessary to clarify it [85,187,190].
About 5-7% of Caucasian non-selected B cell ALL patients present CRLF2 rearrangementsand overexpression. This frequency increased to 16-19% in high risk B cell ALL patients; forthis reason CRLF2 abnormalities have been associated with adverse prognosis[85,178,183,186,189–191]. Occurrence of CRLF2 abnormalities differs among ALL popula‐tions, this is probably influenced by the ethnic origin. Harvey and colleagues found that35.3% of Hispanic/Latin high risk B cell ALL patients have CRLF2 rearrangements and highexpression of its protein [188], this fact could explain in part the poor response to treatmentobserved in this group [178,187–190]. CRLF2 analysis by different groups have demonstrat‐ed that rearrangements in this gene do not coexist with other non-random ALL chromoso‐mal abnormalities [186,189,190]; except for a couple of BCR-ABL1 positive patients thatshowed a high CRLF2 expression, but not genomic alterations of the gene [187].
Rearrangements and overexpression of CRLF2 and JAK2 mutations are particularly abun‐dant in B cell ALL children with Down syndrome, coexistence of both lesions have been
Genetic Markers in the Prognosis of Childhood Acute Lymphoblastic Leukemiahttp://dx.doi.org/10.5772/54288
217
found in up to 45-60% [178,186]. For this group of patients, CRLF2 rearrangements are morefrequent than other ALL aberrations as high hyperdiploid, ETV6-RUNX1, E2A-PBX1 andMLL-AF4. A point mutation in CRLF2 (F232C) has been identified in 9% of Down syndromecases leading to CRLF2 overexpression [191]; it has been proposed that this alteration couldbe the first leukemogenic event in these children [178,183].
A strong interaction among IKZF1 deletion, CRLF2 overexpression and JAK2 mutationshas been described in B cell ALL. Recent studies support that 100% of B cell ALL pa‐tients with JAK2 mutations have CRLF2 overexpression, however, the opposite is nottrue. Analyses of different children ALL populations have identified coexistence of theseabnormalities: 81% of Hispanic/Latin patients present CRLF2 overexpression and IKZF1deletions, and 69% of them have JAK2 mutations [188]; in 40% of Caucasian patientswith CRLF2 overexpression IKZF1 deletions have been found [189]; 95% of Chinese pa‐tients with JAK2 mutations also present high CRLF2 expression [85]. In Dutch childrenwith Down syndrome, deletions of IKZF1 were found in 35%, JAK2 mutations in 15%and CRLF2 overexpression in 62% of cases [192].
According to these observations, it has been speculated that IKZF1 deletion, CRLF2 overex‐pression and JAK2 mutations collaborate during B lymphoid transformation perturbing thenormal lymphoid development. Furthermore, cooperative mutations could contribute to in‐crease the risk of relapse and promoting therapy resistance and treatment failure. Particular‐ly, CRLF2 alterations might be the first step in carcinogenic signaling, given that itsoverexpression is associated with activation of the STAT5 pathway through tyrosine phos‐phorylation in primary B-cell progenitors [183,189,193].
7. Conclusions
Progress in risk adapted treatment of childhood ALL can currently cure up to 80% of pa‐tients. Prognostic factors including patient and disease characteristics as well as response totreatment, play a key role in stratification. Through exhaustive genetic characterization ofALL, gene fusions, point mutations, deletions and gross losses or gains of genetic materialhave been associated to prognosis. Recently, gene expression and comparative genomic hy‐bridization microarrays have identified new potential genetic markers for predicting out‐come. These markers have been evaluated in order to recognize patients prone to relapse,even when they present low risk characteristics by conventional parameters of risk stratifica‐tion. Based on those studies, gene signatures, mutations and signaling pathways no previ‐ously associated to ALL have been identified. Detected abnormalities are involved indiverse cellular processes, as cell cycle progression, cell death, and regulation of gene ex‐pression. These activities directly influence how the leukemic blast responds to treatment,and have an important role in the relapse process. Novel genetic alterations that have beenassociated with poor outcome in ALL patients are rearrangements/mutations that triggerCRLF2 overexpression; JAK2 mutations; IKZF1 deletions and mutations, and down expres‐sion of CASP8AP2. Genomic analysis of relapse leukemic clones has also been useful detect‐
Clinical Epidemiology of Acute Lymphoblastic Leukemia - From the Molecules to the Clinic218
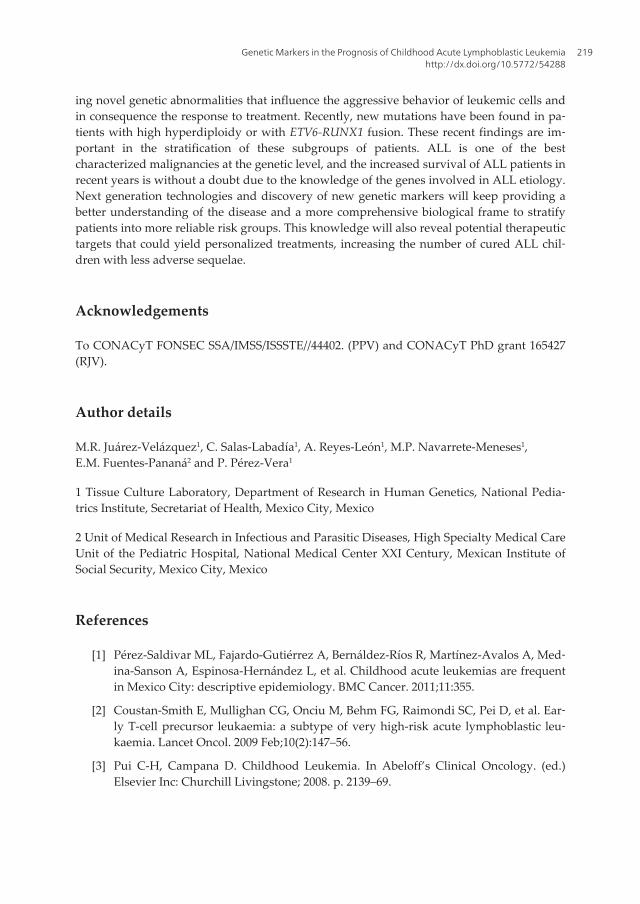
ing novel genetic abnormalities that influence the aggressive behavior of leukemic cells andin consequence the response to treatment. Recently, new mutations have been found in pa‐tients with high hyperdiploidy or with ETV6-RUNX1 fusion. These recent findings are im‐portant in the stratification of these subgroups of patients. ALL is one of the bestcharacterized malignancies at the genetic level, and the increased survival of ALL patients inrecent years is without a doubt due to the knowledge of the genes involved in ALL etiology.Next generation technologies and discovery of new genetic markers will keep providing abetter understanding of the disease and a more comprehensive biological frame to stratifypatients into more reliable risk groups. This knowledge will also reveal potential therapeutictargets that could yield personalized treatments, increasing the number of cured ALL chil‐dren with less adverse sequelae.
Acknowledgements
To CONACyT FONSEC SSA/IMSS/ISSSTE//44402. (PPV) and CONACyT PhD grant 165427(RJV).
Author details
M.R. Juárez-Velázquez1, C. Salas-Labadía1, A. Reyes-León1, M.P. Navarrete-Meneses1,E.M. Fuentes-Pananá2 and P. Pérez-Vera1
1 Tissue Culture Laboratory, Department of Research in Human Genetics, National Pedia‐trics Institute, Secretariat of Health, Mexico City, Mexico
2 Unit of Medical Research in Infectious and Parasitic Diseases, High Specialty Medical CareUnit of the Pediatric Hospital, National Medical Center XXI Century, Mexican Institute ofSocial Security, Mexico City, Mexico
References
[1] Pérez-Saldivar ML, Fajardo-Gutiérrez A, Bernáldez-Ríos R, Martínez-Avalos A, Med‐ina-Sanson A, Espinosa-Hernández L, et al. Childhood acute leukemias are frequentin Mexico City: descriptive epidemiology. BMC Cancer. 2011;11:355.
[2] Coustan-Smith E, Mullighan CG, Onciu M, Behm FG, Raimondi SC, Pei D, et al. Ear‐ly T-cell precursor leukaemia: a subtype of very high-risk acute lymphoblastic leu‐kaemia. Lancet Oncol. 2009 Feb;10(2):147–56.
[3] Pui C-H, Campana D. Childhood Leukemia. In Abeloff’s Clinical Oncology. (ed.)Elsevier Inc: Churchill Livingstone; 2008. p. 2139–69.
Genetic Markers in the Prognosis of Childhood Acute Lymphoblastic Leukemiahttp://dx.doi.org/10.5772/54288
219
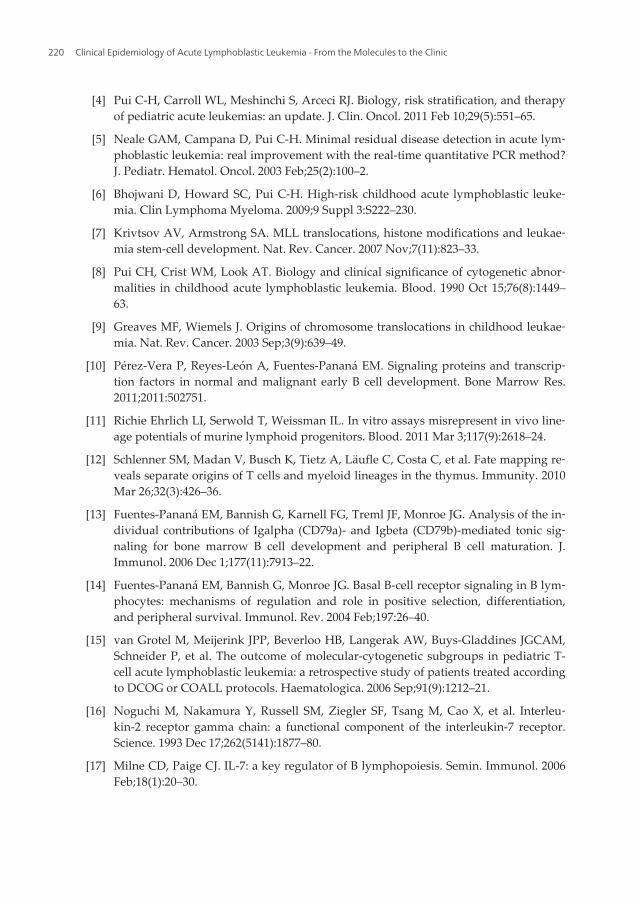
[4] Pui C-H, Carroll WL, Meshinchi S, Arceci RJ. Biology, risk stratification, and therapyof pediatric acute leukemias: an update. J. Clin. Oncol. 2011 Feb 10;29(5):551–65.
[5] Neale GAM, Campana D, Pui C-H. Minimal residual disease detection in acute lym‐phoblastic leukemia: real improvement with the real-time quantitative PCR method?J. Pediatr. Hematol. Oncol. 2003 Feb;25(2):100–2.
[6] Bhojwani D, Howard SC, Pui C-H. High-risk childhood acute lymphoblastic leuke‐mia. Clin Lymphoma Myeloma. 2009;9 Suppl 3:S222–230.
[7] Krivtsov AV, Armstrong SA. MLL translocations, histone modifications and leukae‐mia stem-cell development. Nat. Rev. Cancer. 2007 Nov;7(11):823–33.
[8] Pui CH, Crist WM, Look AT. Biology and clinical significance of cytogenetic abnor‐malities in childhood acute lymphoblastic leukemia. Blood. 1990 Oct 15;76(8):1449–63.
[9] Greaves MF, Wiemels J. Origins of chromosome translocations in childhood leukae‐mia. Nat. Rev. Cancer. 2003 Sep;3(9):639–49.
[10] Pérez-Vera P, Reyes-León A, Fuentes-Pananá EM. Signaling proteins and transcrip‐tion factors in normal and malignant early B cell development. Bone Marrow Res.2011;2011:502751.
[11] Richie Ehrlich LI, Serwold T, Weissman IL. In vitro assays misrepresent in vivo line‐age potentials of murine lymphoid progenitors. Blood. 2011 Mar 3;117(9):2618–24.
[12] Schlenner SM, Madan V, Busch K, Tietz A, Läufle C, Costa C, et al. Fate mapping re‐veals separate origins of T cells and myeloid lineages in the thymus. Immunity. 2010Mar 26;32(3):426–36.
[13] Fuentes-Pananá EM, Bannish G, Karnell FG, Treml JF, Monroe JG. Analysis of the in‐dividual contributions of Igalpha (CD79a)- and Igbeta (CD79b)-mediated tonic sig‐naling for bone marrow B cell development and peripheral B cell maturation. J.Immunol. 2006 Dec 1;177(11):7913–22.
[14] Fuentes-Pananá EM, Bannish G, Monroe JG. Basal B-cell receptor signaling in B lym‐phocytes: mechanisms of regulation and role in positive selection, differentiation,and peripheral survival. Immunol. Rev. 2004 Feb;197:26–40.
[15] van Grotel M, Meijerink JPP, Beverloo HB, Langerak AW, Buys-Gladdines JGCAM,Schneider P, et al. The outcome of molecular-cytogenetic subgroups in pediatric T-cell acute lymphoblastic leukemia: a retrospective study of patients treated accordingto DCOG or COALL protocols. Haematologica. 2006 Sep;91(9):1212–21.
[16] Noguchi M, Nakamura Y, Russell SM, Ziegler SF, Tsang M, Cao X, et al. Interleu‐kin-2 receptor gamma chain: a functional component of the interleukin-7 receptor.Science. 1993 Dec 17;262(5141):1877–80.
[17] Milne CD, Paige CJ. IL-7: a key regulator of B lymphopoiesis. Semin. Immunol. 2006Feb;18(1):20–30.
Clinical Epidemiology of Acute Lymphoblastic Leukemia - From the Molecules to the Clinic220
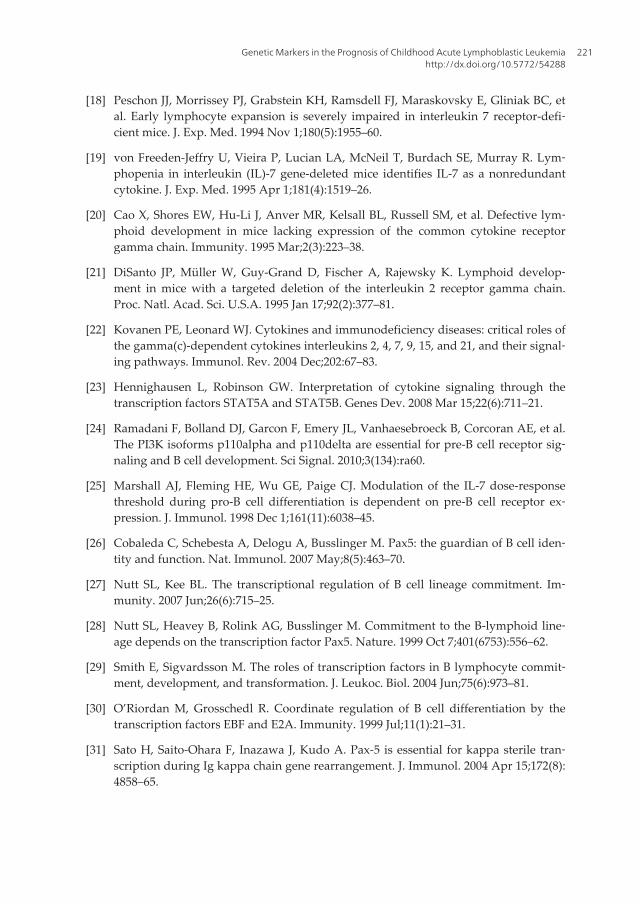
[18] Peschon JJ, Morrissey PJ, Grabstein KH, Ramsdell FJ, Maraskovsky E, Gliniak BC, etal. Early lymphocyte expansion is severely impaired in interleukin 7 receptor-defi‐cient mice. J. Exp. Med. 1994 Nov 1;180(5):1955–60.
[19] von Freeden-Jeffry U, Vieira P, Lucian LA, McNeil T, Burdach SE, Murray R. Lym‐phopenia in interleukin (IL)-7 gene-deleted mice identifies IL-7 as a nonredundantcytokine. J. Exp. Med. 1995 Apr 1;181(4):1519–26.
[20] Cao X, Shores EW, Hu-Li J, Anver MR, Kelsall BL, Russell SM, et al. Defective lym‐phoid development in mice lacking expression of the common cytokine receptorgamma chain. Immunity. 1995 Mar;2(3):223–38.
[21] DiSanto JP, Müller W, Guy-Grand D, Fischer A, Rajewsky K. Lymphoid develop‐ment in mice with a targeted deletion of the interleukin 2 receptor gamma chain.Proc. Natl. Acad. Sci. U.S.A. 1995 Jan 17;92(2):377–81.
[22] Kovanen PE, Leonard WJ. Cytokines and immunodeficiency diseases: critical roles ofthe gamma(c)-dependent cytokines interleukins 2, 4, 7, 9, 15, and 21, and their signal‐ing pathways. Immunol. Rev. 2004 Dec;202:67–83.
[23] Hennighausen L, Robinson GW. Interpretation of cytokine signaling through thetranscription factors STAT5A and STAT5B. Genes Dev. 2008 Mar 15;22(6):711–21.
[24] Ramadani F, Bolland DJ, Garcon F, Emery JL, Vanhaesebroeck B, Corcoran AE, et al.The PI3K isoforms p110alpha and p110delta are essential for pre-B cell receptor sig‐naling and B cell development. Sci Signal. 2010;3(134):ra60.
[25] Marshall AJ, Fleming HE, Wu GE, Paige CJ. Modulation of the IL-7 dose-responsethreshold during pro-B cell differentiation is dependent on pre-B cell receptor ex‐pression. J. Immunol. 1998 Dec 1;161(11):6038–45.
[26] Cobaleda C, Schebesta A, Delogu A, Busslinger M. Pax5: the guardian of B cell iden‐tity and function. Nat. Immunol. 2007 May;8(5):463–70.
[27] Nutt SL, Kee BL. The transcriptional regulation of B cell lineage commitment. Im‐munity. 2007 Jun;26(6):715–25.
[28] Nutt SL, Heavey B, Rolink AG, Busslinger M. Commitment to the B-lymphoid line‐age depends on the transcription factor Pax5. Nature. 1999 Oct 7;401(6753):556–62.
[29] Smith E, Sigvardsson M. The roles of transcription factors in B lymphocyte commit‐ment, development, and transformation. J. Leukoc. Biol. 2004 Jun;75(6):973–81.
[30] O’Riordan M, Grosschedl R. Coordinate regulation of B cell differentiation by thetranscription factors EBF and E2A. Immunity. 1999 Jul;11(1):21–31.
[31] Sato H, Saito-Ohara F, Inazawa J, Kudo A. Pax-5 is essential for kappa sterile tran‐scription during Ig kappa chain gene rearrangement. J. Immunol. 2004 Apr 15;172(8):4858–65.
Genetic Markers in the Prognosis of Childhood Acute Lymphoblastic Leukemiahttp://dx.doi.org/10.5772/54288
221
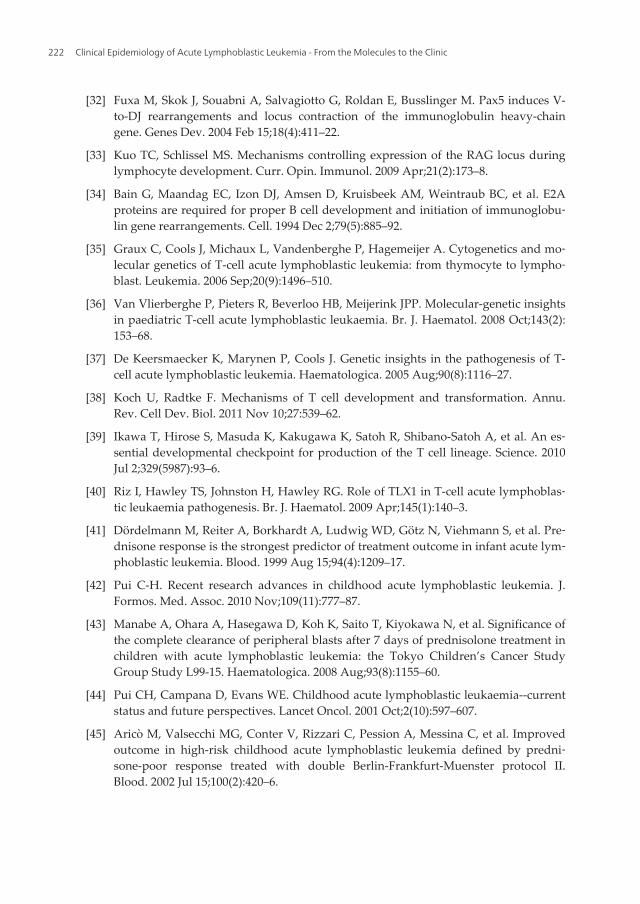
[32] Fuxa M, Skok J, Souabni A, Salvagiotto G, Roldan E, Busslinger M. Pax5 induces V-to-DJ rearrangements and locus contraction of the immunoglobulin heavy-chaingene. Genes Dev. 2004 Feb 15;18(4):411–22.
[33] Kuo TC, Schlissel MS. Mechanisms controlling expression of the RAG locus duringlymphocyte development. Curr. Opin. Immunol. 2009 Apr;21(2):173–8.
[34] Bain G, Maandag EC, Izon DJ, Amsen D, Kruisbeek AM, Weintraub BC, et al. E2Aproteins are required for proper B cell development and initiation of immunoglobu‐lin gene rearrangements. Cell. 1994 Dec 2;79(5):885–92.
[35] Graux C, Cools J, Michaux L, Vandenberghe P, Hagemeijer A. Cytogenetics and mo‐lecular genetics of T-cell acute lymphoblastic leukemia: from thymocyte to lympho‐blast. Leukemia. 2006 Sep;20(9):1496–510.
[36] Van Vlierberghe P, Pieters R, Beverloo HB, Meijerink JPP. Molecular-genetic insightsin paediatric T-cell acute lymphoblastic leukaemia. Br. J. Haematol. 2008 Oct;143(2):153–68.
[37] De Keersmaecker K, Marynen P, Cools J. Genetic insights in the pathogenesis of T-cell acute lymphoblastic leukemia. Haematologica. 2005 Aug;90(8):1116–27.
[38] Koch U, Radtke F. Mechanisms of T cell development and transformation. Annu.Rev. Cell Dev. Biol. 2011 Nov 10;27:539–62.
[39] Ikawa T, Hirose S, Masuda K, Kakugawa K, Satoh R, Shibano-Satoh A, et al. An es‐sential developmental checkpoint for production of the T cell lineage. Science. 2010Jul 2;329(5987):93–6.
[40] Riz I, Hawley TS, Johnston H, Hawley RG. Role of TLX1 in T-cell acute lymphoblas‐tic leukaemia pathogenesis. Br. J. Haematol. 2009 Apr;145(1):140–3.
[41] Dördelmann M, Reiter A, Borkhardt A, Ludwig WD, Götz N, Viehmann S, et al. Pre‐dnisone response is the strongest predictor of treatment outcome in infant acute lym‐phoblastic leukemia. Blood. 1999 Aug 15;94(4):1209–17.
[42] Pui C-H. Recent research advances in childhood acute lymphoblastic leukemia. J.Formos. Med. Assoc. 2010 Nov;109(11):777–87.
[43] Manabe A, Ohara A, Hasegawa D, Koh K, Saito T, Kiyokawa N, et al. Significance ofthe complete clearance of peripheral blasts after 7 days of prednisolone treatment inchildren with acute lymphoblastic leukemia: the Tokyo Children’s Cancer StudyGroup Study L99-15. Haematologica. 2008 Aug;93(8):1155–60.
[44] Pui CH, Campana D, Evans WE. Childhood acute lymphoblastic leukaemia--currentstatus and future perspectives. Lancet Oncol. 2001 Oct;2(10):597–607.
[45] Aricò M, Valsecchi MG, Conter V, Rizzari C, Pession A, Messina C, et al. Improvedoutcome in high-risk childhood acute lymphoblastic leukemia defined by predni‐sone-poor response treated with double Berlin-Frankfurt-Muenster protocol II.Blood. 2002 Jul 15;100(2):420–6.
Clinical Epidemiology of Acute Lymphoblastic Leukemia - From the Molecules to the Clinic222
[46] Szczepański T, Orfão A, van der Velden VH, San Miguel JF, van Dongen JJ. Minimalresidual disease in leukaemia patients. Lancet Oncol. 2001 Jul;2(7):409–17.
[47] Campana D. Status of minimal residual disease testing in childhood haematologicalmalignancies. Br. J. Haematol. 2008 Nov;143(4):481–9.
[48] Campana D. Determination of minimal residual disease in leukaemia patients. Br. J.Haematol. 2003 Jun;121(6):823–38.
[49] Campana D, Coustan-Smith E. Detection of minimal residual disease in acute leuke‐mia by flow cytometry. Cytometry. 1999 Aug 15;38(4):139–52.
[50] Gabert J, Beillard E, van der Velden VHJ, Bi W, Grimwade D, Pallisgaard N, et al.Standardization and quality control studies of “real-time” quantitative reverse tran‐scriptase polymerase chain reaction of fusion gene transcripts for residual disease de‐tection in leukemia - a Europe Against Cancer program. Leukemia. 2003 Dec;17(12):2318–57.
[51] Campana D. Minimal residual disease in acute lymphoblastic leukemia. Semin.Hematol. 2009 Jan;46(1):100–6.
[52] van der Velden VHJ, Hochhaus A, Cazzaniga G, Szczepanski T, Gabert J, van Don‐gen JJM. Detection of minimal residual disease in hematologic malignancies by real-time quantitative PCR: principles, approaches, and laboratory aspects. Leukemia.2003 Jun;17(6):1013–34.
[53] Flohr T, Schrauder A, Cazzaniga G, Panzer-Grümayer R, van der Velden V, FischerS, et al. Minimal residual disease-directed risk stratification using real-time quantita‐tive PCR analysis of immunoglobulin and T-cell receptor gene rearrangements in theinternational multicenter trial AIEOP-BFM ALL 2000 for childhood acute lympho‐blastic leukemia. Leukemia. 2008 Apr;22(4):771–82.
[54] Coustan-Smith E, Sancho J, Hancock ML, Boyett JM, Behm FG, Raimondi SC, et al.Clinical importance of minimal residual disease in childhood acute lymphoblasticleukemia. Blood. 2000 Oct 15;96(8):2691–6.
[55] Coustan-Smith E, Behm FG, Sanchez J, Boyett JM, Hancock ML, Raimondi SC, et al.Immunological detection of minimalresidual disease in children with acute lympho‐blastic leukaemia. Lancet. 1998 Feb 21;351(9102):550–4.
[56] Borowitz MJ, Devidas M, Hunger SP, Bowman WP, Carroll AJ, Carroll WL, et al.Clinical significance of minimal residual disease in childhood acute lymphoblasticleukemia and its relationship to other prognostic factors: a Children’s OncologyGroup study. Blood. 2008 Jun 15;111(12):5477–85.
[57] Zhou J, Goldwasser MA, Li A, Dahlberg SE, Neuberg D, Wang H, et al. Quantitativeanalysis of minimal residual disease predicts relapse in children with B-lineage acutelymphoblastic leukemia in DFCI ALL Consortium Protocol 95-01. Blood. 2007 Sep1;110(5):1607–11.
Genetic Markers in the Prognosis of Childhood Acute Lymphoblastic Leukemiahttp://dx.doi.org/10.5772/54288
223
[58] Basso G, Veltroni M, Valsecchi MG, Dworzak MN, Ratei R, Silvestri D, et al. Risk ofrelapse of childhood acute lymphoblastic leukemia is predicted by flow cytometricmeasurement of residual disease on day 15 bone marrow. J. Clin. Oncol. 2009 Nov1;27(31):5168–74.
[59] Eckert C, Biondi A, Seeger K, Cazzaniga G, Hartmann R, Beyermann B, et al. Prog‐nostic value of minimal residual disease in relapsed childhood acute lymphoblasticleukaemia. Lancet. 2001 Oct 13;358(9289):1239–41.
[60] Coustan-Smith E, Gajjar A, Hijiya N, Razzouk BI, Ribeiro RC, Rivera GK, et al. Clini‐cal significance of minimal residual disease in childhood acute lymphoblastic leuke‐mia after first relapse. Leukemia. 2004 Mar;18(3):499–504.
[61] Pfeiffer P, Goedecke W, Obe G. Mechanisms of DNA double-strand break repair andtheir potential to induce chromosomal aberrations. Mutagenesis. 2000 Jul;15(4):289–302.
[62] Greaves M. In utero origins of childhood leukaemia. Early Hum. Dev. 2005 Jan;81(1):123–9.
[63] Chen Z, Sandberg AA. Molecular cytogenetic aspects of hematological malignancies:clinical implications. Am. J. Med. Genet. 2002 Oct 30;115(3):130–41.
[64] Mrózek K, Harper DP, Aplan PD. Cytogenetics and molecular genetics of acute lym‐phoblastic leukemia. Hematol. Oncol. Clin. North Am. 2009 Oct;23(5):991–1010.
[65] Heisterkamp N, Stam K, Groffen J, de Klein A, Grosveld G. Structural organizationof the bcr gene and its role in the Ph’ translocation. Nature. 1985 Jul 27;315(6022):758–61.
[66] Barilá D, Superti-Furga G. An intramolecular SH3-domain interaction regulates c-Ablactivity. Nat. Genet. 1998 Mar;18(3):280–2.
[67] Chissoe SL, Bodenteich A, Wang YF, Wang YP, Burian D, Clifton SW, et al. Sequenceand analysis of the human ABL gene, the BCR gene, and regions involved in the Phil‐adelphia chromosomal translocation. Genomics. 1995 May 1;27(1):67–82.
[68] Fröhling S, Döhner H. Chromosomal abnormalities in cancer. N. Engl. J. Med. 2008Aug 14;359(7):722–34.
[69] Chalandon Y, Schwaller J. Targeting mutated protein tyrosine kinases and their sig‐naling pathways in hematologic malignancies. Haematologica. 2005 Jul;90(7):949–68.
[70] van Dongen JJ, Macintyre EA, Gabert JA, Delabesse E, Rossi V, Saglio G, et al. Stand‐ardized RT-PCR analysis of fusion gene transcripts from chromosome aberrations inacute leukemia for detection of minimal residual disease. Report of the BIOMED-1Concerted Action: investigation of minimal residual disease in acute leukemia. Leu‐kemia. 1999 Dec;13(12):1901–28.
[71] Raimondi SC, Roberson PK, Pui CH, Behm FG, Rivera GK. Hyperdiploid (47-50)acute lymphoblastic leukemia in children. Blood. 1992 Jun 15;79(12):3245–52.
Clinical Epidemiology of Acute Lymphoblastic Leukemia - From the Molecules to the Clinic224
[72] Nahar R, Ramezani-Rad P, Mossner M, Duy C, Cerchietti L, Geng H, et al. Pre-B cellreceptor-mediated activation of BCL6 induces pre-B cell quiescence through tran‐scriptional repression of MYC. Blood. 2011 Oct 13;118(15):4174–8.
[73] Skorski T. Genomic instability: The cause and effect of BCR/ABL tyrosine kinase.Curr Hematol Malig Rep. 2007 May;2(2):69–74.
[74] Pui C-H, Evans WE. Treatment of acute lymphoblastic leukemia. N. Engl. J. Med.2006 Jan 12;354(2):166–78.
[75] Pieters R, Carroll WL. Biology and treatment of acute lymphoblastic leukemia. Hem‐atol. Oncol. Clin. North Am. 2010 Feb;24(1):1–18.
[76] Szczepański T, Harrison CJ, van Dongen JJM. Genetic aberrations in paediatric acuteleukaemias and implications for management of patients. Lancet Oncol. 2010 Sep;11(9):880–9.
[77] Moorman AV, Ensor HM, Richards SM, Chilton L, Schwab C, Kinsey SE, et al. Prog‐nostic effect of chromosomal abnormalities in childhood B-cell precursor acute lym‐phoblastic leukaemia: results from the UK Medical Research Council ALL97/99randomised trial. Lancet Oncol. 2010 May;11(5):429–38.
[78] Schrappe M, Reiter A, Ludwig WD, Harbott J, Zimmermann M, Hiddemann W, et al.Improved outcome in childhood acute lymphoblastic leukemia despite reduced useof anthracyclines and cranial radiotherapy: results of trial ALL-BFM 90. German-Austrian-Swiss ALL-BFM Study Group. Blood. 2000 Jun 1;95(11):3310–22.
[79] Jiménez-Morales S, Miranda-Peralta E, Saldaña-Alvarez Y, Perez-Vera P, Paredes-Aguilera R, Rivera-Luna R, et al. BCR-ABL, ETV6-RUNX1 and E2A-PBX1: preva‐lence of the most common acute lymphoblastic leukemia fusion genes in Mexicanpatients. Leuk. Res. 2008 Oct;32(10):1518–22.
[80] Borkhardt A, Cazzaniga G, Viehmann S, Valsecchi MG, Ludwig WD, Burci L, et al.Incidence and clinical relevance of TEL/AML1 fusion genes in children with acutelymphoblastic leukemia enrolled in the German and Italian multicenter therapy tri‐als. Associazione Italiana Ematologia Oncologia Pediatrica and the Berlin-Frankfurt-Münster Study Group. Blood. 1997 Jul 15;90(2):571–7.
[81] Harrison CJ, Moorman AV, Barber KE, Broadfield ZJ, Cheung KL, Harris RL, et al.Interphase molecular cytogenetic screening for chromosomal abnormalities of prog‐nostic significance in childhood acute lymphoblastic leukaemia: a UK Cancer Cyto‐genetics Group Study. Br. J. Haematol. 2005 May;129(4):520–30.
[82] Pui C-H, Robison LL, Look AT. Acute lymphoblastic leukaemia. Lancet. 2008 Mar22;371(9617):1030–43.
[83] Aldrich MC, Zhang L, Wiemels JL, Ma X, Loh ML, Metayer C, et al. Cytogenetics ofHispanic and White children with acute lymphoblastic leukemia in California. Can‐cer Epidemiol. Biomarkers Prev. 2006 Mar;15(3):578–81.
Genetic Markers in the Prognosis of Childhood Acute Lymphoblastic Leukemiahttp://dx.doi.org/10.5772/54288
225
[84] Pérez-Vera P, Salas C, Montero-Ruiz O, Frías S, Dehesa G, Jarquín B, et al. Analysisof gene rearrangements using a fluorescence in situ hybridization method in Mexi‐can patients with acute lymphoblastic leukemia: experience at a single institution.Cancer Genet. Cytogenet. 2008 Jul 15;184(2):94–8.
[85] Chen B, Wang Y-Y, Shen Y, Zhang W-N, He H-Y, Zhu Y-M, et al. Newly diagnosedacute lymphoblastic leukemia in China (I): abnormal genetic patterns in 1346 child‐hood and adult cases and their comparison with the reports from Western countries.Leukemia. 2012 Jul;26(7):1608–16.
[86] Ariffin H, Chen S-P, Kwok CS, Quah T-C, Lin H-P, Yeoh AEJ. Ethnic differences inthe frequency of subtypes of childhood acute lymphoblastic leukemia: results of theMalaysia-Singapore Leukemia Study Group. J. Pediatr. Hematol. Oncol. 2007 Jan;29(1):27–31.
[87] Hunger SP. Tyrosine kinase inhibitor use in pediatric Philadelphia chromosome-pos‐itive acute lymphoblastic anemia. Hematology Am Soc Hematol Educ Program.2011;2011:361–5.
[88] Nourse J, Mellentin JD, Galili N, Wilkinson J, Stanbridge E, Smith SD, et al. Chromo‐somal translocation t(1;19) results in synthesis of a homeobox fusion mRNA that co‐des for a potential chimeric transcription factor. Cell. 1990 Feb 23;60(4):535–45.
[89] Biondi A, Masera G. Molecular pathogenesis of childhood acute lymphoblastic leu‐kemia. Haematologica. 1998 Jul;83(7):651–9.
[90] Chan KK-K, Zhang J, Chia N-Y, Chan Y-S, Sim HS, Tan KS, et al. KLF4 and PBX1 di‐rectly regulate NANOG expression in human embryonic stem cells. Stem Cells. 2009Sep;27(9):2114–25.
[91] LeBrun DP. E2A basic helix-loop-helix transcription factors in human leukemia.Front. Biosci. 2003 May 1;8:s206–222.
[92] Look AT. Oncogenic transcription factors in the human acute leukemias. Science.1997 Nov 7;278(5340):1059–64.
[93] Graham DK, Salzberg DB, Kurtzberg J, Sather S, Matsushima GK, Keating AK, et al.Ectopic expression of the proto-oncogene Mer in pediatric T-cell acute lymphoblasticleukemia. Clin. Cancer Res. 2006 May 1;12(9):2662–9.
[94] Shiozawa Y, Pedersen EA, Taichman RS. GAS6/Mer axis regulates the homing andsurvival of the E2A/PBX1-positive B-cell precursor acute lymphoblastic leukemia inthe bone marrow niche. Exp. Hematol. 2010 Feb;38(2):132–40.
[95] Armstrong SA, Look AT. Molecular genetics of acute lymphoblastic leukemia. J. Clin.Oncol. 2005 Sep 10;23(26):6306–15.
[96] Iacobucci I, Papayannidis C, Lonetti A, Ferrari A, Baccarani M, Martinelli G. Cytoge‐netic and molecular predictors of outcome in acute lymphocytic leukemia: recent de‐velopments. Curr Hematol Malig Rep. 2012 Jun;7(2):133–43.
Clinical Epidemiology of Acute Lymphoblastic Leukemia - From the Molecules to the Clinic226
[97] Pui C-H, Sandlund JT, Pei D, Campana D, Rivera GK, Ribeiro RC, et al. Improvedoutcome for children with acute lymphoblastic leukemia: results of Total TherapyStudy XIIIB at St Jude Children’s Research Hospital. Blood. 2004 Nov 1;104(9):2690–6.
[98] Privitera E, Kamps MP, Hayashi Y, Inaba T, Shapiro LH, Raimondi SC, et al. Differ‐ent molecular consequences of the 1;19 chromosomal translocation in childhood B-cell precursor acute lymphoblastic leukemia. Blood. 1992 Apr 1;79(7):1781–8.
[99] Crist WM, Carroll AJ, Shuster JJ, Behm FG, Whitehead M, Vietti TJ, et al. Poor prog‐nosis of children with pre-B acute lymphoblastic leukemia is associated with thet(1;19)(q23;p13): a Pediatric Oncology Group study. Blood. 1990 Jul 1;76(1):117–22.
[100] Inaba T, Inukai T, Yoshihara T, Seyschab H, Ashmun RA, Canman CE, et al. Reversalof apoptosis by the leukaemia-associated E2A-HLF chimaeric transcription factor.Nature. 1996 Aug 8;382(6591):541–4.
[101] Harper DP, Aplan PD. Chromosomal rearrangements leading to MLL gene fusions:clinical and biological aspects. Cancer Res. 2008 Dec 15;68(24):10024–7.
[102] Slany RK. The molecular biology of mixed lineage leukemia. Haematologica. 2009Jul;94(7):984–93.
[103] Liu H, Takeda S, Kumar R, Westergard TD, Brown EJ, Pandita TK, et al. Phosphory‐lation of MLL by ATR is required for execution of mammalian S-phase checkpoint.Nature. 2010 Sep 16;467(7313):343–6.
[104] Sung PA, Libura J, Richardson C. Etoposide and illegitimate DNA double-strandbreak repair in the generation of MLL translocations: new insights and new ques‐tions. DNA Repair (Amst.). 2006 Sep 8;5(9-10):1109–18.
[105] Chuk MK, McIntyre E, Small D, Brown P. Discordance of MLL-rearranged (MLL-R)infant acute lymphoblastic leukemia in monozygotic twins with spontaneous clear‐ance of preleukemic clone in unaffected twin. Blood. 2009 Jun 25;113(26):6691–4.
[106] Alexander FE, Patheal SL, Biondi A, Brandalise S, Cabrera ME, Chan LC, et al. Trans‐placental chemical exposure and risk of infant leukemia with MLL gene fusion. Can‐cer Res. 2001 Mar 15;61(6):2542–6.
[107] Bueno C, Catalina P, Melen GJ, Montes R, Sánchez L, Ligero G, et al. Etoposide indu‐ces MLL rearrangements and other chromosomal abnormalities in human embryonicstem cells. Carcinogenesis. 2009 Sep;30(9):1628–37.
[108] Schnyder S, Du NT, Le HB, Singh S, Loredo GA, Vaughan AT. Estrogen treatmentinduces MLL aberrations in human lymphoblastoid cells. Leuk. Res. 2009 Oct;33(10):1400–4.
[109] Blanco JG, Edick MJ, Relling MV. Etoposide induces chimeric Mll gene fusions. FA‐SEB J. 2004 Jan;18(1):173–5.
Genetic Markers in the Prognosis of Childhood Acute Lymphoblastic Leukemiahttp://dx.doi.org/10.5772/54288
227
[110] Barjesteh van Waalwijk van Doorn-Khosrovani S, Janssen J, Maas LM, GodschalkRWL, Nijhuis JG, van Schooten FJ. Dietary flavonoids induce MLL translocations inprimary human CD34+ cells. Carcinogenesis. 2007 Aug;28(8):1703–9.
[111] Rojas E, Mussali P, Tovar E, Valverde M. DNA-AP sites generation by etoposide inwhole blood cells. BMC Cancer. 2009;9:398.
[112] Moneypenny CG, Shao J, Song Y, Gallagher EP. MLL rearrangements are induced bylow doses of etoposide in human fetal hematopoietic stem cells. Carcinogenesis. 2006Apr;27(4):874–81.
[113] Brassesco MS, Montaldi AP, Gras DE, Camparoto ML, Martinez-Rossi NM, ScrideliCA, et al. Cytogenetic and molecular analysis of MLL rearrangements in acute lym‐phoblastic leukaemia survivors. Mutagenesis. 2009 Mar;24(2):153–60.
[114] Montero-Ruíz O, Alcántara-Ortigoza MA, Betancourt M, Juárez-Velázquez R, Gonzá‐lez-Márquez H, Pérez-Vera P. Expression of RUNX1 isoforms and its target geneBLK in childhood acute lymphoblastic leukemia. Leuk. Res. 2012 Sep;36(9):1105–11.
[115] Roudaia L, Cheney MD, Manuylova E, Chen W, Morrow M, Park S, et al. CBFbeta iscritical for AML1-ETO and TEL-AML1 activity. Blood. 2009 Mar 26;113(13):3070–9.
[116] De Braekeleer E, Douet-Guilbert N, Morel F, Le Bris M-J, Basinko A, De BraekeleerM. ETV6 fusion genes in hematological malignancies: A review. Leuk. Res. 2012 Aug;36(8):945–61.
[117] Wiemels JL, Hofmann J, Kang M, Selzer R, Green R, Zhou M, et al. Chromosome 12pdeletions in TEL-AML1 childhood acute lymphoblastic leukemia are associated withretrotransposon elements and occur postnatally. Cancer Res. 2008 Dec 1;68(23):9935–44.
[118] Shurtleff SA, Buijs A, Behm FG, Rubnitz JE, Raimondi SC, Hancock ML, et al. TEL/AML1 fusion resulting from a cryptic t(12;21) is the most common genetic lesion inpediatric ALL and defines a subgroup of patients with an excellent prognosis. Leuke‐mia. 1995 Dec;9(12):1985–9.
[119] Loh ML, Goldwasser MA, Silverman LB, Poon W-M, Vattikuti S, Cardoso A, et al.Prospective analysis of TEL/AML1-positive patients treated on Dana-Farber CancerInstitute Consortium Protocol 95-01. Blood. 2006 Jun 1;107(11):4508–13.
[120] Rubnitz JE, Downing JR, Pui CH, Shurtleff SA, Raimondi SC, Evans WE, et al. TELgene rearrangement in acute lymphoblastic leukemia: a new genetic marker withprognostic significance. J. Clin. Oncol. 1997 Mar;15(3):1150–7.
[121] Pérez-Vera P, Montero-Ruiz O, Frías S, Ulloa-Avilés V, Cárdenas-Cardós R, Paredes-Aguilera R, et al. Detection of ETV6 and RUNX1 gene rearrangements using fluores‐cence in situ hybridization in Mexican patients with acute lymphoblastic leukemia:experience at a single institution. Cancer Genet. Cytogenet. 2005 Oct 15;162(2):140–5.
Clinical Epidemiology of Acute Lymphoblastic Leukemia - From the Molecules to the Clinic228
[122] Siraj AK, Kamat S, Gutiérrez MI, Banavali S, Timpson G, Sazawal S, et al. Frequen‐cies of the major subgroups of precursor B-cell acute lymphoblastic leukemia in Indi‐an children differ from the West. Leukemia. 2003 Jun;17(6):1192–3.
[123] Liang D-C, Shih L-Y, Yang C-P, Hung I-J, Liu H-C, Jaing T-H, et al. Frequencies ofETV6-RUNX1 fusion and hyperdiploidy in pediatric acute lymphoblastic leukemiaare lower in far east than west. Pediatr Blood Cancer. 2010 Sep;55(3):430–3.
[124] Seeger K, Adams HP, Buchwald D, Beyermann B, Kremens B, Niemeyer C, et al.TEL-AML1 fusion transcript in relapsed childhood acute lymphoblastic leukemia.The Berlin-Frankfurt-Münster Study Group. Blood. 1998 Mar 1;91(5):1716–22.
[125] van Delft FW, Horsley S, Colman S, Anderson K, Bateman C, Kempski H, et al. Clo‐nal origins of relapse in ETV6-RUNX1 acute lymphoblastic leukemia. Blood. 2011 Jun9;117(23):6247–54.
[126] Kuster L, Grausenburger R, Fuka G, Kaindl U, Krapf G, Inthal A, et al. ETV6/RUNX1-positive relapses evolve from an ancestral clone and frequently acquire dele‐tions of genes implicated in glucocorticoid signaling. Blood. 2011 Mar 3;117(9):2658–67.
[127] Paulsson K, Forestier E, Lilljebjörn H, Heldrup J, Behrendtz M, Young BD, et al. Ge‐netic landscape of high hyperdiploid childhood acute lymphoblastic leukemia. Proc.Natl. Acad. Sci. U.S.A. 2010 Dec 14;107(50):21719–24.
[128] Pui CH, Raimondi SC, Williams DL. Isochromosome 17q in childhood acute lympho‐blastic leukemia: an adverse cytogenetic feature in association with hyperdiploidy?Leukemia. 1988 Apr;2(4):222–5.
[129] Harris MB, Shuster JJ, Carroll A, Look AT, Borowitz MJ, Crist WM, et al. Trisomy ofleukemic cell chromosomes 4 and 10 identifies children with B-progenitor cell acutelymphoblastic leukemia with a very low risk of treatment failure: a Pediatric Oncolo‐gy Group study. Blood. 1992 Jun 15;79(12):3316–24.
[130] Heerema NA, Sather HN, Sensel MG, Zhang T, Hutchinson RJ, Nachman JB, et al.Prognostic impact of trisomies of chromosomes 10, 17, and 5 among children withacute lymphoblastic leukemia and high hyperdiploidy (> 50 chromosomes). J. Clin.Oncol. 2000 May;18(9):1876–87.
[131] Moorman AV, Richards SM, Martineau M, Cheung KL, Robinson HM, Jalali GR, etal. Outcome heterogeneity in childhood high-hyperdiploid acute lymphoblastic leu‐kemia. Blood. 2003 Oct 15;102(8):2756–62.
[132] Sutcliffe MJ, Shuster JJ, Sather HN, Camitta BM, Pullen J, Schultz KR, et al. High con‐cordance from independent studies by the Children’s Cancer Group (CCG) and Pe‐diatric Oncology Group (POG) associating favorable prognosis with combinedtrisomies 4, 10, and 17 in children with NCI Standard-Risk B-precursor Acute Lym‐phoblastic Leukemia: a Children’s Oncology Group (COG) initiative. Leukemia. 2005May;19(5):734–40.
Genetic Markers in the Prognosis of Childhood Acute Lymphoblastic Leukemiahttp://dx.doi.org/10.5772/54288
229
[133] Treviño LR, Yang W, French D, Hunger SP, Carroll WL, Devidas M, et al. Germlinegenomic variants associated with childhood acute lymphoblastic leukemia. Nat. Gen‐et. 2009 Sep;41(9):1001–5.
[134] Moorman AV, Harrison CJ, Buck GAN, Richards SM, Secker-Walker LM, MartineauM, et al. Karyotype is an independent prognostic factor in adult acute lymphoblasticleukemia (ALL): analysis of cytogenetic data from patients treated on the MedicalResearch Council (MRC) UKALLXII/Eastern Cooperative Oncology Group (ECOG)2993 trial. Blood. 2007 Apr 15;109(8):3189–97.
[135] Raimondi SC, Zhou Y, Shurtleff SA, Rubnitz JE, Pui C-H, Behm FG. Near-triploidyand near-tetraploidy in childhood acute lymphoblastic leukemia: association with B-lineage blast cells carrying the ETV6-RUNX1 fusion, T-lineage immunophenotype,and favorable outcome. Cancer Genet. Cytogenet. 2006 Aug;169(1):50–7.
[136] Raimondi SC, Zhou Y, Mathew S, Shurtleff SA, Sandlund JT, Rivera GK, et al. Reas‐sessment of the prognostic significance of hypodiploidy in pediatric patients withacute lymphoblastic leukemia. Cancer. 2003 Dec 15;98(12):2715–22.
[137] Cavé H, Suciu S, Preudhomme C, Poppe B, Robert A, Uyttebroeck A, et al. Clinicalsignificance of HOX11L2 expression linked to t(5;14)(q35;q32), of HOX11 expression,and of SIL-TAL fusion in childhood T-cell malignancies: results of EORTC studies58881 and 58951. Blood. 2004 Jan 15;103(2):442–50.
[138] Zhu Y-M, Zhao W-L, Fu J-F, Shi J-Y, Pan Q, Hu J, et al. NOTCH1 mutations in T-cellacute lymphoblastic leukemia: prognostic significance and implication in multifacto‐rial leukemogenesis. Clin. Cancer Res. 2006 May 15;12(10):3043–9.
[139] van Grotel M, Meijerink JPP, van Wering ER, Langerak AW, Beverloo HB, Buijs-Gladdines JGCAM, et al. Prognostic significance of molecular-cytogenetic abnormali‐ties in pediatric T-ALL is not explained by immunophenotypic differences.Leukemia. 2008 Jan;22(1):124–31.
[140] Ferrando AA, Neuberg DS, Staunton J, Loh ML, Huard C, Raimondi SC, et al. Geneexpression signatures define novel oncogenic pathways in T cell acute lymphoblasticleukemia. Cancer Cell. 2002 Feb;1(1):75–87.
[141] Ballerini P, Landman-Parker J, Cayuela JM, Asnafi V, Labopin M, Gandemer V, et al.Impact of genotype on survival of children with T-cell acute lymphoblastic leukemiatreated according to the French protocol FRALLE-93: the effect of TLX3/HOX11L2gene expression on outcome. Haematologica. 2008 Nov;93(11):1658–65.
[142] Aifantis I, Raetz E, Buonamici S. Molecular pathogenesis of T-cell leukaemia andlymphoma. Nat. Rev. Immunol. 2008 May;8(5):380–90.
[143] Bergeron J, Clappier E, Radford I, Buzyn A, Millien C, Soler G, et al. Prognostic andoncogenic relevance of TLX1/HOX11 expression level in T-ALLs. Blood. 2007 Oct1;110(7):2324–30.
Clinical Epidemiology of Acute Lymphoblastic Leukemia - From the Molecules to the Clinic230
[144] Asnafi V, Beldjord K, Libura M, Villarese P, Millien C, Ballerini P, et al. Age-relatedphenotypic and oncogenic differences in T-cell acute lymphoblastic leukemias mayreflect thymic atrophy. Blood. 2004 Dec 15;104(13):4173–80.
[145] 145. De Keersmaecker K, Real PJ, Gatta GD, Palomero T, Sulis ML, Tosello V, et al.The TLX1 oncogene drives aneuploidy in T cell transformation. Nat. Med. 2010 Nov;16(11):1321–7.
[146] O’Neil J, Shank J, Cusson N, Murre C, Kelliher M. TAL1/SCL induces leukemia byinhibiting the transcriptional activity of E47/HEB. Cancer Cell. 2004 Jun;5(6):587–96.
[147] Mansur MB, Hassan R, Barbosa TC, Splendore A, Jotta PY, Yunes JA, et al. Impact ofcomplex NOTCH1 mutations on survival in paediatric T-cell leukaemia. BMC Can‐cer. 2012;12:9.
[148] Mansur MB, Emerenciano M, Brewer L, Sant’Ana M, Mendonça N, Thuler LCS, et al.SIL-TAL1 fusion gene negative impact in T-cell acute lymphoblastic leukemia out‐come. Leuk. Lymphoma. 2009 Aug;50(8):1318–25.
[149] Real PJ, Tosello V, Palomero T, Castillo M, Hernando E, de Stanchina E, et al. Gam‐ma-secretase inhibitors reverse glucocorticoid resistance in T cell acute lymphoblasticleukemia. Nat. Med. 2009 Jan;15(1):50–8.
[150] Kittler R, Putz G, Pelletier L, Poser I, Heninger A-K, Drechsel D, et al. An endoribo‐nuclease-prepared siRNA screen in human cells identifies genes essential for cell di‐vision. Nature. 2004 Dec 23;432(7020):1036–40.
[151] Choi YH, Kim KB, Kim HH, Hong GS, Kwon YK, Chung CW, et al. FLASH coordi‐nates NF-kappa B activity via TRAF2. J. Biol. Chem. 2001 Jul 6;276(27):25073–7.
[152] Jun J-I, Chung C-W, Lee H-J, Pyo J-O, Lee KN, Kim N-S, et al. Role of FLASH in cas‐pase-8-mediated activation of NF-kappaB: dominant-negative function of FLASHmutant in NF-kappaB signaling pathway. Oncogene. 2005 Jan 20;24(4):688–96.
[153] Alm-Kristiansen AH, Saether T, Matre V, Gilfillan S, Dahle O, Gabrielsen OS. FLASHacts as a co-activator of the transcription factor c-Myb and localizes to active RNApolymerase II foci. Oncogene. 2008 Aug 7;27(34):4644–56.
[154] Alm-Kristiansen AH, Lorenzo PI, Molværsmyr A-K, Matre V, Ledsaak M, Sæther T,et al. PIAS1 interacts with FLASH and enhances its co-activation of c-Myb. Mol. Can‐cer. 2011;10:21.
[155] Barcaroli D, Dinsdale D, Neale MH, Bongiorno-Borbone L, Ranalli M, Munarriz E, etal. FLASH is an essential component of Cajal bodies. Proc. Natl. Acad. Sci. U.S.A.2006 Oct 3;103(40):14802–7.
[156] Barcaroli D, Bongiorno-Borbone L, Terrinoni A, Hofmann TG, Rossi M, Knight RA,et al. FLASH is required for histone transcription and S-phase progression. Proc.Natl. Acad. Sci. U.S.A. 2006 Oct 3;103(40):14808–12.
Genetic Markers in the Prognosis of Childhood Acute Lymphoblastic Leukemiahttp://dx.doi.org/10.5772/54288
231
[157] Yang X, Xu B, Sabath I, Kunduru L, Burch BD, Marzluff WF, et al. FLASH is requiredfor the endonucleolytic cleavage of histone pre-mRNAs but is dispensable for the 5’exonucleolytic degradation of the downstream cleavage product. Mol. Cell. Biol.2011 Apr;31(7):1492–502.
[158] Flotho C, Coustan-Smith E, Pei D, Iwamoto S, Song G, Cheng C, et al. Genes contri‐buting to minimal residual disease in childhood acute lymphoblastic leukemia: prog‐nostic significance of CASP8AP2. Blood. 2006 Aug 1;108(3):1050–7.
[159] Flotho C, Coustan-Smith E, Pei D, Cheng C, Song G, Pui C-H, et al. A set of genesthat regulate cell proliferation predicts treatment outcome in childhood acute lym‐phoblastic leukemia. Blood. 2007 Aug 15;110(4):1271–7.
[160] Jiao Y, Cui L, Gao C, Li W, Zhao X, Liu S, et al. CASP8AP2 is a promising prognosticindicator in pediatric acute lymphoblastic leukemia. Leuk. Res. 2012 Jan;36(1):67–71.
[161] Remke M, Pfister S, Kox C, Toedt G, Becker N, Benner A, et al. High-resolution ge‐nomic profiling of childhood T-ALL reveals frequent copy-number alterations affect‐ing the TGF-beta and PI3K-AKT pathways and deletions at 6q15-16.1 as a genomicmarker for unfavorable early treatment response. Blood. 2009 Jul 30;114(5):1053–62.
[162] Molnár A, Georgopoulos K. The Ikaros gene encodes a family of functionally diversezinc finger DNA-binding proteins. Mol. Cell. Biol. 1994 Dec;14(12):8292–303.
[163] Sun L, Liu A, Georgopoulos K. Zinc finger-mediated protein interactions modulateIkaros activity, a molecular control of lymphocyte development. EMBO J. 1996 Oct1;15(19):5358–69.
[164] Sun L, Goodman PA, Wood CM, Crotty ML, Sensel M, Sather H, et al. Expression ofaberrantly spliced oncogenic ikaros isoforms in childhood acute lymphoblastic leuke‐mia. J. Clin. Oncol. 1999 Dec;17(12):3753–66.
[165] Sun L, Heerema N, Crotty L, Wu X, Navara C, Vassilev A, et al. Expression of domi‐nant-negative and mutant isoforms of the antileukemic transcription factor Ikaros ininfant acute lymphoblastic leukemia. Proc. Natl. Acad. Sci. U.S.A. 1999 Jan 19;96(2):680–5.
[166] Sun L, Crotty ML, Sensel M, Sather H, Navara C, Nachman J, et al. Expression ofdominant-negative Ikaros isoforms in T-cell acute lymphoblastic leukemia. Clin.Cancer Res. 1999 Aug;5(8):2112–20.
[167] Mullighan CG, Su X, Zhang J, Radtke I, Phillips LAA, Miller CB, et al. Deletion ofIKZF1 and prognosis in acute lymphoblastic leukemia. N. Engl. J. Med. 2009 Jan29;360(5):470–80.
[168] Mullighan CG, Miller CB, Radtke I, Phillips LA, Dalton J, Ma J, et al. BCR-ABL1 lym‐phoblastic leukaemia is characterized by the deletion of Ikaros. Nature. 2008 May1;453(7191):110–4.
Clinical Epidemiology of Acute Lymphoblastic Leukemia - From the Molecules to the Clinic232
[169] Olivero S, Maroc C, Beillard E, Gabert J, Nietfeld W, Chabannon C, et al. Detection ofdifferent Ikaros isoforms in human leukaemias using real-time quantitative polymer‐ase chain reaction. Br. J. Haematol. 2000 Sep;110(4):826–30.
[170] Meleshko AN, Movchan LV, Belevtsev MV, Savitskaja TV. Relative expression of dif‐ferent Ikaros isoforms in childhood acute leukemia. Blood Cells Mol. Dis. 2008 Dec;41(3):278–83.
[171] Ruiz A, Jiang J, Kempski H, Brady HJM. Overexpression of the Ikaros 6 isoform isrestricted to t(4;11) acute lymphoblastic leukaemia in children and infants and has arole in B-cell survival. Br. J. Haematol. 2004 Apr;125(1):31–7.
[172] Yang JJ, Bhojwani D, Yang W, Cai X, Stocco G, Crews K, et al. Genome-wide copynumber profiling reveals molecular evolution from diagnosis to relapse in childhoodacute lymphoblastic leukemia. Blood. 2008 Nov 15;112(10):4178–83.
[173] Kuiper RP, Waanders E, van der Velden VHJ, van Reijmersdal SV, Venkatachalam R,Scheijen B, et al. IKZF1 deletions predict relapse in uniformly treated pediatric pre‐cursor B-ALL. Leukemia. 2010 Jul;24(7):1258–64.
[174] Waanders E, van der Velden VHJ, van der Schoot CE, van Leeuwen FN, van Reij‐mersdal SV, de Haas V, et al. Integrated use of minimal residual disease classificationand IKZF1 alteration status accurately predicts 79% of relapses in pediatric acutelymphoblastic leukemia. Leukemia. 2011 Feb;25(2):254–8.
[175] Den Boer ML, van Slegtenhorst M, De Menezes RX, Cheok MH, Buijs-GladdinesJGCAM, Peters STCJM, et al. A subtype of childhood acute lymphoblastic leukaemiawith poor treatment outcome: a genome-wide classification study. Lancet Oncol.2009 Feb;10(2):125–34.
[176] Pellegrini S, Dusanter-Fourt I. The structure, regulation and function of the Januskinases (JAKs) and the signal transducers and activators of transcription (STATs).Eur. J. Biochem. 1997 Sep 15;248(3):615–33.
[177] Rawlings JS, Rosler KM, Harrison DA. The JAK/STAT signaling pathway. J. Cell. Sci.2004 Mar 15;117(Pt 8):1281–3.
[178] Mullighan CG, Collins-Underwood JR, Phillips LAA, Loudin MG, Liu W, Zhang J, etal. Rearrangement of CRLF2 in B-progenitor- and Down syndrome-associated acutelymphoblastic leukemia. Nat. Genet. 2009 Nov;41(11):1243–6.
[179] Bercovich D, Ganmore I, Scott LM, Wainreb G, Birger Y, Elimelech A, et al. Muta‐tions of JAK2 in acute lymphoblastic leukaemias associated with Down’s syndrome.Lancet. 2008 Oct 25;372(9648):1484–92.
[180] Gaikwad A, Rye CL, Devidas M, Heerema NA, Carroll AJ, Izraeli S, et al. Prevalenceand clinical correlates of JAK2 mutations in Down syndrome acute lymphoblasticleukaemia. Br. J. Haematol. 2009 Mar;144(6):930–2.
Genetic Markers in the Prognosis of Childhood Acute Lymphoblastic Leukemiahttp://dx.doi.org/10.5772/54288
233
[181] Kearney L, Gonzalez De Castro D, Yeung J, Procter J, Horsley SW, Eguchi-IshimaeM, et al. Specific JAK2 mutation (JAK2R683) and multiple gene deletions in Downsyndrome acute lymphoblastic leukemia. Blood. 2009 Jan 15;113(3):646–8.
[182] Mullighan CG, Zhang J, Harvey RC, Collins-Underwood JR, Schulman BA, PhillipsLA, et al. JAK mutations in high-risk childhood acute lymphoblastic leukemia. Proc.Natl. Acad. Sci. U.S.A. 2009 Jun 9;106(23):9414–8.
[183] Russell LJ, Capasso M, Vater I, Akasaka T, Bernard OA, Calasanz MJ, et al. Deregu‐lated expression of cytokine receptor gene, CRLF2, is involved in lymphoid transfor‐mation in B-cell precursor acute lymphoblastic leukemia. Blood. 2009 Sep 24;114(13):2688–98.
[184] Ziegler SF, Liu Y-J. Thymic stromal lymphopoietin in normal and pathogenic T celldevelopment and function. Nat. Immunol. 2006 Jul;7(7):709–14.
[185] Akasaka T, Balasas T, Russell LJ, Sugimoto K, Majid A, Walewska R, et al. Five mem‐bers of the CEBP transcription factor family are targeted by recurrent IGH transloca‐tions in B-cell precursor acute lymphoblastic leukemia (BCP-ALL). Blood. 2007 Apr15;109(8):3451–61.
[186] Hertzberg L, Vendramini E, Ganmore I, Cazzaniga G, Schmitz M, Chalker J, et al.Down syndrome acute lymphoblastic leukemia, a highly heterogeneous disease inwhich aberrant expression of CRLF2 is associated with mutated JAK2: a report fromthe International BFM Study Group. Blood. 2010 Feb 4;115(5):1006–17.
[187] Cario G, Zimmermann M, Romey R, Gesk S, Vater I, Harbott J, et al. Presence of theP2RY8-CRLF2 rearrangement is associated with a poor prognosis in non-high-riskprecursor B-cell acute lymphoblastic leukemia in children treated according to theALL-BFM 2000 protocol. Blood. 2010 Jul 1;115(26):5393–7.
[188] Harvey RC, Mullighan CG, Chen I-M, Wharton W, Mikhail FM, Carroll AJ, et al. Re‐arrangement of CRLF2 is associated with mutation of JAK kinases, alteration ofIKZF1, Hispanic/Latino ethnicity, and a poor outcome in pediatric B-progenitor acutelymphoblastic leukemia. Blood. 2010 Jul 1;115(26):5312–21.
[189] Ensor HM, Schwab C, Russell LJ, Richards SM, Morrison H, Masic D, et al. Demo‐graphic, clinical, and outcome features of children with acute lymphoblastic leuke‐mia and CRLF2 deregulation: results from the MRC ALL97 clinical trial. Blood. 2011Feb 17;117(7):2129–36.
[190] Palmi C, Vendramini E, Silvestri D, Longinotti G, Frison D, Cario G, et al. Poor prog‐nosis for P2RY8-CRLF2 fusion but not for CRLF2 over-expression in children with in‐termediate risk B-cell precursor acute lymphoblastic leukemia. Leukemia: officialjournal of the Leukemia Society of America, Leukemia Research Fund, U.K [Inter‐net]. 2012 Apr 9 [cited 2012 Jul 30]; Available from: http://www.ncbi.nlm.nih.gov/pubmed/22484421
Clinical Epidemiology of Acute Lymphoblastic Leukemia - From the Molecules to the Clinic234

[191] Yoda A, Yoda Y, Chiaretti S, Bar-Natan M, Mani K, Rodig SJ, et al. Functional screen‐ing identifies CRLF2 in precursor B-cell acute lymphoblastic leukemia. Proc. Natl.Acad. Sci. U.S.A. 2010 Jan 5;107(1):252–7.
[192] Buitenkamp TD, Pieters R, Gallimore NE, van der Veer A, Meijerink JPP, BeverlooHB, et al. Outcome in children with Down’s syndrome and acute lymphoblastic leu‐kemia: role of IKZF1 deletions and CRLF2 aberrations. Leukemia. 2012. Availablefrom: http://www.ncbi.nlm.nih.gov/pubmed/22441210 ( accessed 22 Mar 2012)
[193] Carpino N, Thierfelder WE, Chang M, Saris C, Turner SJ, Ziegler SF, et al. Absence ofan essential role for thymic stromal lymphopoietin receptor in murine B-cell devel‐opment. Mol. Cell. Biol. 2004 Mar;24(6):2584–92.
Genetic Markers in the Prognosis of Childhood Acute Lymphoblastic Leukemiahttp://dx.doi.org/10.5772/54288
235