Embed Size (px)
Citation preview
The degree to which genes and environment determine brainstructure and function is of fundamental importance. Large-scale neuroimaging and genetic studies are beginning to uncov-er normal and disease-specific patterns of gene and brainfunction in large human populations1,2. Yet, little is knownabout the genetic control of human brain structure, and howmuch individual genotype accounts for the wide variationsamong individual brains. Recent reports show that many cog-nitive skills are surprisingly heritable, with strong genetic influ-ences on IQ3,4, verbal and spatial abilities, perceptual speed5
and even some personality qualities, including emotional reac-tions to stress6. These genetic relationships persist even afterstatistical adjustments are made for shared family environ-ments, which tend to make members of the same family moresimilar. Given that genetic and environmental factors, in uteroand throughout lifetime, shape the physical development ofthe brain, we aimed to map patterns of brain structure that areunder significant genetic control, and determine whether thesestructural features are linked with measurable differences incognitive function. The few existing studies of brain structurein twins suggest that the overall volume of the brain itself7 andsome brain structures, including the corpus callosum8,9 andventricles, are somewhat genetically influenced, whereas gyralpatterns, observed qualitatively10 or by comparing their two-dimensional projections, are much less heritable11. To makethe transition from volumes of structures to detailed maps ofgenetic influences, advances in brain mapping technology haveallowed the detailed mapping of structural features of thehuman cortex, including gray matter distribution, gyral pat-terning, and brain asymmetry. These features each vary with
Genetic influences on brain structure
Paul Thompson1, Tyrone D. Cannon2, Katherine L. Narr1, Theo van Erp2, Veli-Pekka Poutanen3,Matti Huttunen4, Jouko Lönnqvist4, Carl-Gustaf Standertskjöld-Nordenstam3, Jaakko Kaprio3,Mohammad Khaledy1, Rajneesh Dail1, Chris I. Zoumalan1 and Arthur W. Toga1
1 Laboratory of Neuro Imaging and Brain Mapping Division (Rm. 4238, Reed Neurological Research Center), Department of Neurology, UCLA School of Medicine, 710 Westwood Plaza, Los Angeles, California 90095-1769, USA
2 Departments of Psychology, Psychiatry, and Human Genetics, UCLA School of Medicine [Author: Please provide full mailing address.]3 Department of Radiology, University of Helsinki [Author: Please provide full mailing address.]4 Department of Mental Health and Alcohol Research, National Public Health Institute of Finland [Author: Please provide full mailing address.]5 Department of Public Health, Universities of Helsinki and Oulu [Author: Please provide full mailing address.]
Correspondence should be addressed to P.T. ([email protected])
Published online: xxxx, DOI: 10.1038/ xxxx
Here we report on detailed three-dimensional maps revealing how brain structure is influenced byindividual genetic differences. A genetic continuum was detected, in which brain structure wasincreasingly similar in subjects with increasing genetic affinity. Genetic factors significantlyinfluenced cortical structure in Broca’s and Wernicke’s language areas, as well as frontal brainregions (r2
MZ > 0.8, p < 0.05). Preliminary correlations were performed suggesting that frontal graymatter differences may be linked to Spearman’s g, which measures successful test performanceacross multiple cognitive domains (p < 0.05). These genetic brain maps reveal how genes determineindividual differences, and may shed light on the heritability of cognitive and linguistic skills, as wellas genetic liability for diseases that affect the human cortex.
age, gender, handedness, hemispheric dominance and cogni-tive performance in both health and disease. Composite mapsof these features, generated for large populations, can revealpatterns not observable in an individual12. Such patternsinclude statistical maps that show whether heredity and non-genetic factors are involved in determining specific aspects ofbrain structure.
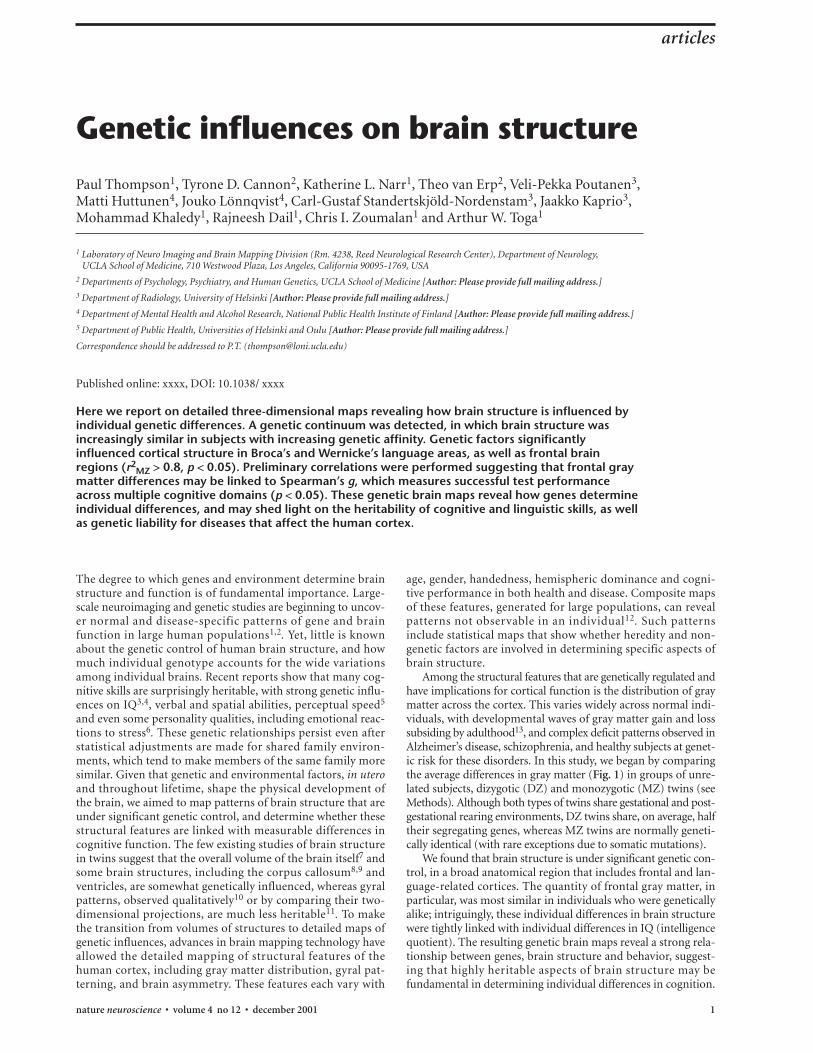
Among the structural features that are genetically regulated andhave implications for cortical function is the distribution of graymatter across the cortex. This varies widely across normal indi-viduals, with developmental waves of gray matter gain and losssubsiding by adulthood13, and complex deficit patterns observed inAlzheimer’s disease, schizophrenia, and healthy subjects at genet-ic risk for these disorders. In this study, we began by comparingthe average differences in gray matter (Fig. 1) in groups of unre-lated subjects, dizygotic (DZ) and monozygotic (MZ) twins (seeMethods). Although both types of twins share gestational and post-gestational rearing environments, DZ twins share, on average, halftheir segregating genes, whereas MZ twins are normally geneti-cally identical (with rare exceptions due to somatic mutations).
We found that brain structure is under significant genetic con-trol, in a broad anatomical region that includes frontal and lan-guage-related cortices. The quantity of frontal gray matter, inparticular, was most similar in individuals who were geneticallyalike; intriguingly, these individual differences in brain structurewere tightly linked with individual differences in IQ (intelligencequotient). The resulting genetic brain maps reveal a strong rela-tionship between genes, brain structure and behavior, suggest-ing that highly heritable aspects of brain structure may befundamental in determining individual differences in cognition.
articles
nature neuroscience • volume 4 no 12 • december 2001 1
2 nature neuroscience • volume 4 no 12 • december 2001
RESULTSMZ within-pair gray matter differences were almost zero (intra-class r ≈ 0.9 and higher, p < 0.0001 corrected; Fig. 1, right col-umn) in a broad anatomical band encompassing frontal,sensorimotor and linguistic cortices, including Broca’s speechand Wernicke’s language comprehension areas. Because MZ twinsare genetically identical, any regional differences would be inter-preted as being attributable to environmental effects orgene–environment interactions. Meanwhile, sensorimotor andparietal occipital but not frontal territory was significantly moresimilar in DZ twins than random pairs (Figs. 1 and 2). Affinitywas greatest in the MZ pairs, suggesting a genetic continuum inthe determination of structure.
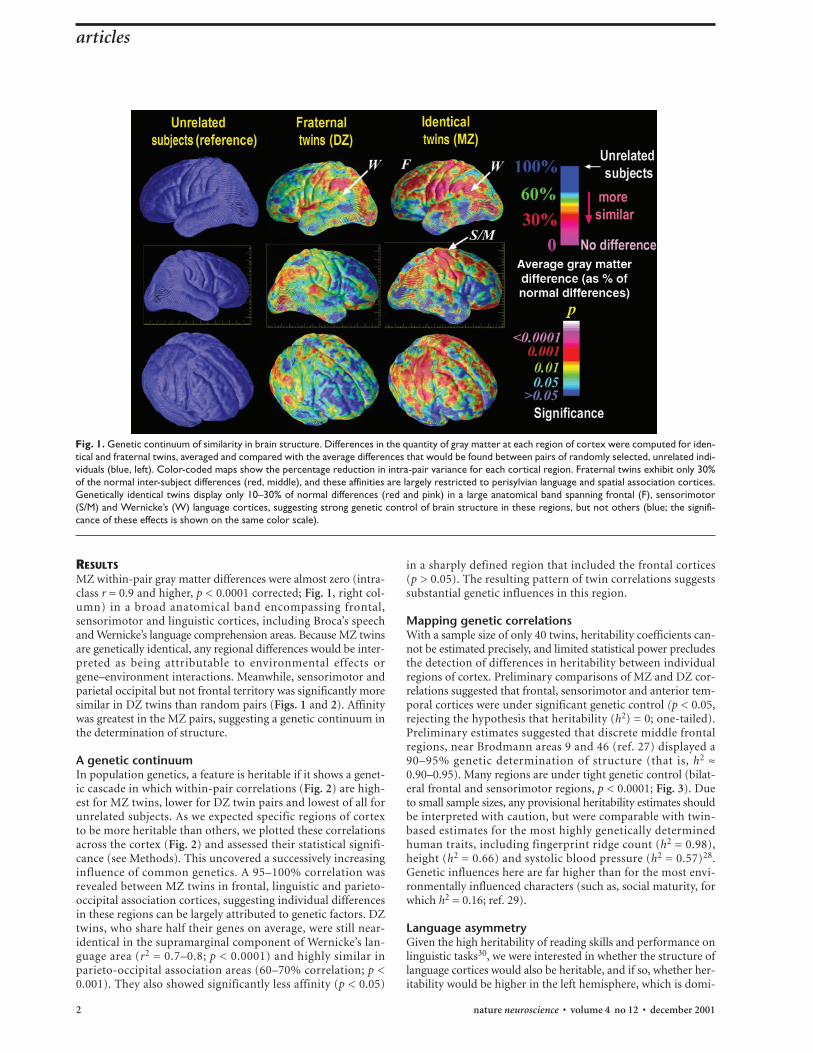
A genetic continuumIn population genetics, a feature is heritable if it shows a genet-ic cascade in which within-pair correlations (Fig. 2) are high-est for MZ twins, lower for DZ twin pairs and lowest of all forunrelated subjects. As we expected specific regions of cortexto be more heritable than others, we plotted these correlationsacross the cortex (Fig. 2) and assessed their statistical signifi-cance (see Methods). This uncovered a successively increasinginfluence of common genetics. A 95–100% correlation wasrevealed between MZ twins in frontal, linguistic and parieto-occipital association cortices, suggesting individual differencesin these regions can be largely attributed to genetic factors. DZtwins, who share half their genes on average, were still near-identical in the supramarginal component of Wernicke’s lan-guage area (r2 = 0.7–0.8; p < 0.0001) and highly similar inparieto-occipital association areas (60–70% correlation; p <0.001). They also showed significantly less affinity (p < 0.05)
in a sharply defined region that included the frontal cortices(p > 0.05). The resulting pattern of twin correlations suggestssubstantial genetic influences in this region.
Mapping genetic correlationsWith a sample size of only 40 twins, heritability coefficients can-not be estimated precisely, and limited statistical power precludesthe detection of differences in heritability between individualregions of cortex. Preliminary comparisons of MZ and DZ cor-relations suggested that frontal, sensorimotor and anterior tem-poral cortices were under significant genetic control (p < 0.05,rejecting the hypothesis that heritability (h2) = 0; one-tailed).Preliminary estimates suggested that discrete middle frontalregions, near Brodmann areas 9 and 46 (ref. 27) displayed a90–95% genetic determination of structure (that is, h2 ≈0.90–0.95). Many regions are under tight genetic control (bilat-eral frontal and sensorimotor regions, p < 0.0001; Fig. 3). Dueto small sample sizes, any provisional heritability estimates shouldbe interpreted with caution, but were comparable with twin-based estimates for the most highly genetically determinedhuman traits, including fingerprint ridge count (h2 = 0.98),height (h2 = 0.66) and systolic blood pressure (h2 = 0.57)28.Genetic influences here are far higher than for the most envi-ronmentally influenced characters (such as, social maturity, forwhich h2 = 0.16; ref. 29).
Language asymmetryGiven the high heritability of reading skills and performance onlinguistic tasks30, we were interested in whether the structure oflanguage cortices would also be heritable, and if so, whether her-itability would be higher in the left hemisphere, which is domi-
articles
Fig. 1. Genetic continuum of similarity in brain structure. Differences in the quantity of gray matter at each region of cortex were computed for iden-tical and fraternal twins, averaged and compared with the average differences that would be found between pairs of randomly selected, unrelated indi-viduals (blue, left). Color-coded maps show the percentage reduction in intra-pair variance for each cortical region. Fraternal twins exhibit only 30%of the normal inter-subject differences (red, middle), and these affinities are largely restricted to perisylvian language and spatial association cortices.Genetically identical twins display only 10–30% of normal differences (red and pink) in a large anatomical band spanning frontal (F), sensorimotor(S/M) and Wernicke’s (W) language cortices, suggesting strong genetic control of brain structure in these regions, but not others (blue; the signifi-cance of these effects is shown on the same color scale).
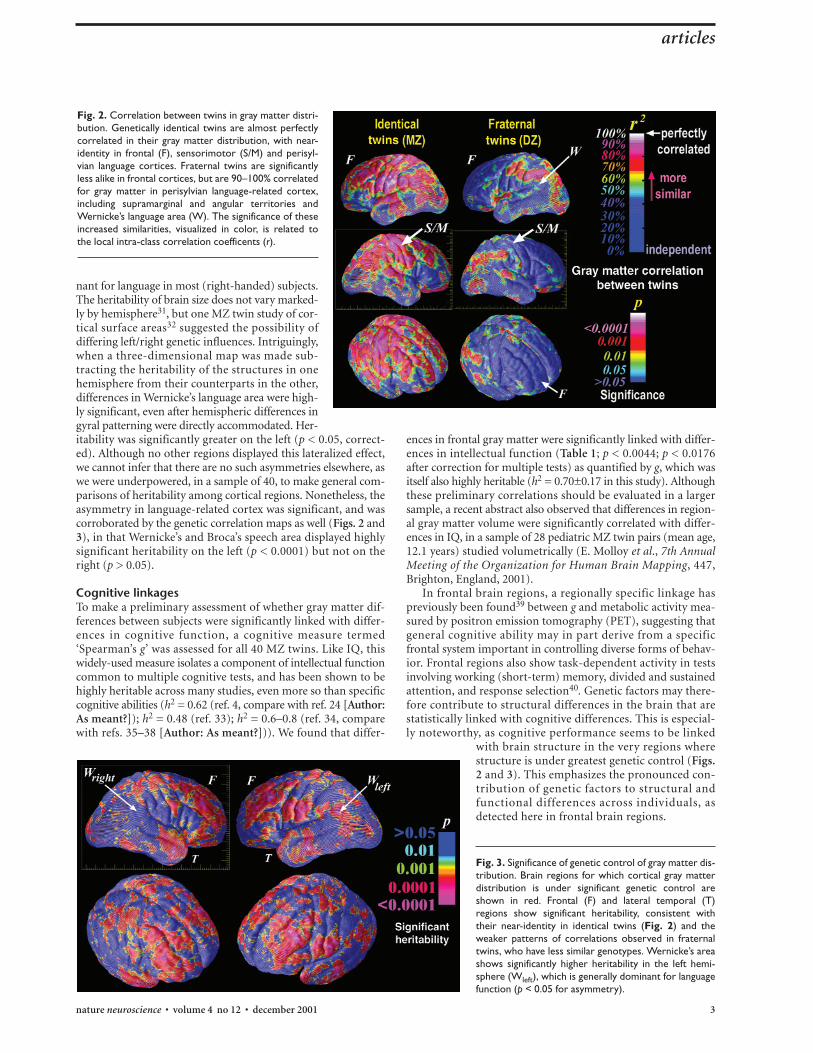
Fig. 3. Significance of genetic control of gray matter dis-tribution. Brain regions for which cortical gray matterdistribution is under significant genetic control areshown in red. Frontal (F) and lateral temporal (T)regions show significant heritability, consistent withtheir near-identity in identical twins (Fig. 2) and theweaker patterns of correlations observed in fraternaltwins, who have less similar genotypes. Wernicke’s areashows significantly higher heritability in the left hemi-sphere (Wleft), which is generally dominant for languagefunction (p < 0.05 for asymmetry).
Fig. 2. Correlation between twins in gray matter distri-bution. Genetically identical twins are almost perfectlycorrelated in their gray matter distribution, with near-identity in frontal (F), sensorimotor (S/M) and perisyl-vian language cortices. Fraternal twins are significantlyless alike in frontal cortices, but are 90–100% correlatedfor gray matter in perisylvian language-related cortex,including supramarginal and angular territories andWernicke’s language area (W). The significance of theseincreased similarities, visualized in color, is related tothe local intra-class correlation coefficents (r).
nant for language in most (right-handed) subjects.The heritability of brain size does not vary marked-ly by hemisphere31, but one MZ twin study of cor-tical surface areas32 suggested the possibility ofdiffering left/right genetic influences. Intriguingly,when a three-dimensional map was made sub-tracting the heritability of the structures in onehemisphere from their counterparts in the other,differences in Wernicke’s language area were high-ly significant, even after hemispheric differences ingyral patterning were directly accommodated. Her-itability was significantly greater on the left (p < 0.05, correct-ed). Although no other regions displayed this lateralized effect,we cannot infer that there are no such asymmetries elsewhere, aswe were underpowered, in a sample of 40, to make general com-parisons of heritability among cortical regions. Nonetheless, theasymmetry in language-related cortex was significant, and wascorroborated by the genetic correlation maps as well (Figs. 2 and3), in that Wernicke’s and Broca’s speech area displayed highlysignificant heritability on the left (p < 0.0001) but not on theright (p > 0.05).
Cognitive linkagesTo make a preliminary assessment of whether gray matter dif-ferences between subjects were significantly linked with differ-ences in cognitive function, a cognitive measure termed‘Spearman’s g’ was assessed for all 40 MZ twins. Like IQ, thiswidely-used measure isolates a component of intellectual functioncommon to multiple cognitive tests, and has been shown to behighly heritable across many studies, even more so than specificcognitive abilities (h2 = 0.62 (ref. 4, compare with ref. 24 [Author:As meant?]); h2 = 0.48 (ref. 33); h2 = 0.6–0.8 (ref. 34, comparewith refs. 35–38 [Author: As meant?])). We found that differ-
ences in frontal gray matter were significantly linked with differ-ences in intellectual function (Table 1; p < 0.0044; p < 0.0176after correction for multiple tests) as quantified by g, which wasitself also highly heritable (h2 = 0.70±0.17 in this study). Althoughthese preliminary correlations should be evaluated in a largersample, a recent abstract also observed that differences in region-al gray matter volume were significantly correlated with differ-ences in IQ, in a sample of 28 pediatric MZ twin pairs (mean age,12.1 years) studied volumetrically (E. Molloy et al., 7th AnnualMeeting of the Organization for Human Brain Mapping, 447,Brighton, England, 2001).
In frontal brain regions, a regionally specific linkage haspreviously been found39 between g and metabolic activity mea-sured by positron emission tomography (PET), suggesting thatgeneral cognitive ability may in part derive from a specificfrontal system important in controlling diverse forms of behav-ior. Frontal regions also show task-dependent activity in testsinvolving working (short-term) memory, divided and sustainedattention, and response selection40. Genetic factors may there-fore contribute to structural differences in the brain that arestatistically linked with cognitive differences. This is especial-ly noteworthy, as cognitive performance seems to be linked
with brain structure in the very regions wherestructure is under greatest genetic control (Figs.2 and 3). This emphasizes the pronounced con-tribution of genetic factors to structural andfunctional differences across individuals, asdetected here in frontal brain regions.
articles
nature neuroscience • volume 4 no 12 • december 2001 3
4 nature neuroscience • volume 4 no 12 • december 2001
DISCUSSIONGenetic brain mappingInfluences of nature and nurture in the determination of indi-vidual brain structure are not independent; genes necessarilyoperate through the environment, particularly if they concernsusceptibilities to environmental stressors or hazards41. Nonethe-less, twin designs can reveal the degree to which heredity isinvolved, and the extent to which individual differences can beattributed to genetic and environmental factors. Whereas genet-ic influences strongly determine aspects of intellect and its close-ly related traits, the extent to which genes shape brain structure isheterogeneous. The gene control of brain structure displays asym-metries that mirror asymmetries in the brain’s functional orga-nization, and genes strongly control a broad anatomical bandencompassing frontal, linguistic and sensorimotor cortex[Author: OK?]. As with any polygenic trait, multiple genes arelikely to combine additively or interact at the same or differentloci (dominance or epistasis) to structure the adult brain. Futurestudies mapping quantitative trait loci are likely to provide insightinto the genes that determine brain structure42, and neurocog-nitive skills that in some cases depend on it43.
The tight coupling of brain structure and genetics, particu-larly in frontal brain regions, may contribute to the genetic lia-bility for diseases that affect the integrity of the cortex. Frontalgray matter deficits are found in both schizophrenia patients andtheir healthy first-degree relatives44–46, and there is a strong famil-ial risk for many neurodegenerative diseases that affect the frontal
cortex, including frontotemporal dementia and primary pro-gressive aphasia. The genetic cascades implicated in these dis-eases may or may not overlap with those involved in corticaldetermination, but the genetic coupling of brain structure wereport here may result in increased familial liability to corticaldegenerative disease, specifically in highly genetically determinedfrontal regions. By controlling for nongenetic factors, twin stud-ies may offer unique advantages in isolating disease-specific dif-ferences in these highly heritable brain regions.
Genetic brain maps, such as those introduced in this study,may reveal how genes determine individual differences in brainstructure and function. Additional linkages were observedbetween cortical differences and intellectual function, suggest-ing that genetic brain mapping may shed light on the heritabili-ty of cognitive and linguistic skills, as well as familial liability fordiseases that affect the human cortex.
METHODSSubjects. 40 healthy normal subjects, consisting of 10 monozygotic (MZ)and 10 dizygotic (DZ) twin pairs were drawn from a twin cohort con-sisting of all the same-sex twins born in Finland between 1940 and 1957,inclusive, in which both members of each pair were alive and residing inFinland as of 1967 (n = 9,562 pairs, 2,495 MZ; 5,378 DZ; 1,689 ofunknown zygosity)14. Pairs were excluded if either member or any oftheir first-degree relatives had a history of hospitalization, medicine pre-scriptions, or work disability due to a psychiatric indication from 1969 to1991. MZ pairs were matched with the DZ pairs for age (48.2 ± 3.4 years),gender, handedness, duration of cohabitation and parental social class.
articles
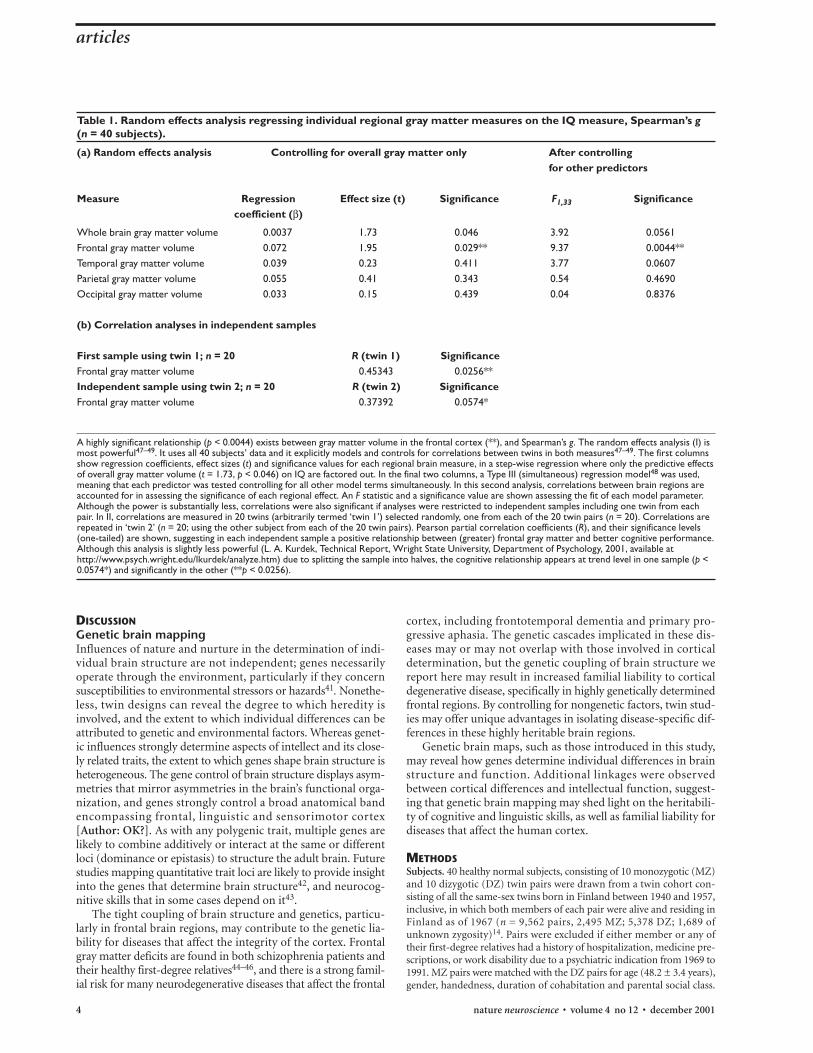
Table 1. Random effects analysis regressing individual regional gray matter measures on the IQ measure, Spearman’s g(n = 40 subjects).
(a) Random effects analysis Controlling for overall gray matter only After controllingfor other predictors
Measure Regression Effect size (t) Significance F1,33 Significancecoefficient (β)
Whole brain gray matter volume 0.0037 1.73 0.046 3.92 0.0561Frontal gray matter volume 0.072 1.95 0.029** 9.37 0.0044**Temporal gray matter volume 0.039 0.23 0.411 3.77 0.0607Parietal gray matter volume 0.055 0.41 0.343 0.54 0.4690Occipital gray matter volume 0.033 0.15 0.439 0.04 0.8376
(b) Correlation analyses in independent samples
First sample using twin 1; n = 20 R (twin 1) SignificanceFrontal gray matter volume 0.45343 0.0256**Independent sample using twin 2; n = 20 R (twin 2) SignificanceFrontal gray matter volume 0.37392 0.0574*
A highly significant relationship (p < 0.0044) exists between gray matter volume in the frontal cortex (**), and Spearman’s g. The random effects analysis (I) ismost powerful47–49. It uses all 40 subjects’ data and it explicitly models and controls for correlations between twins in both measures47–49. The first columnsshow regression coefficients, effect sizes (t) and significance values for each regional brain measure, in a step-wise regression where only the predictive effectsof overall gray matter volume (t = 1.73, p < 0.046) on IQ are factored out. In the final two columns, a Type III (simultaneous) regression model48 was used,meaning that each predictor was tested controlling for all other model terms simultaneously. In this second analysis, correlations between brain regions areaccounted for in assessing the significance of each regional effect. An F statistic and a significance value are shown assessing the fit of each model parameter.Although the power is substantially less, correlations were also significant if analyses were restricted to independent samples including one twin from eachpair. In II, correlations are measured in 20 twins (arbitrarily termed ‘twin 1’) selected randomly, one from each of the 20 twin pairs (n = 20). Correlations arerepeated in ‘twin 2’ (n = 20; using the other subject from each of the 20 twin pairs). Pearson partial correlation coefficients (R), and their significance levels(one-tailed) are shown, suggesting in each independent sample a positive relationship between (greater) frontal gray matter and better cognitive performance.Although this analysis is slightly less powerful (L. A. Kurdek, Technical Report, Wright State University, Department of Psychology, 2001, available athttp://www.psych.wright.edu/lkurdek/analyze.htm) due to splitting the sample into halves, the cognitive relationship appears at trend level in one sample (p <0.0574*) and significantly in the other (**p < 0.0256).
Each zygosity group included five male pairs and five female pairs. Thestudy protocol was reviewed and approved by the institutional reviewboards of the University of California (Los Angeles), and the NationalPublic Health Institute of Finland, and all subjects signed IRB-approvedinformed-consent forms.
Cognitive testing. Each twin in a pair received a neuropsychological testbattery15 from a different examiner blind to zygosity [Author: OK?]. Allsubjects received the same test battery in a fixed order. Seventeen differ-ent cognitive domains were assessed, including verbal and spatial work-ing memory, selective and divided attention, verbal knowledge, motorspeed and visuospatial ability. A measure of general cognitive ability, inthe form of an overall IQ was prorated from age-scaled scores on theVocabulary, Similarities, Block Design, and Digit Symbol subtests of theWechsler Adult Intelligence Scale—Revised (WAIS-R; D. Wechsler, WAIS-R Manual, Psychological Corporation, Cleveland). This measure exhib-ited 98% correlation with full-scale IQ based on all of the WAIS-Rsubtests.
Zygosity. For all pairs, zygosity was determined by DNA analysis usingthe following markers: DIS80 (20 alleles), DI7S30 (13 alleles), apoB (20alleles), COL2A1 (10 alleles), vWA (9 alleles) and HUMTH01 (6 alleles).Assuming an average heterozygosity rate of 70% per marker, this proce-dure will falsely classify a DZ pair as MZ in approximately 1/482 cases.
Magnetic resonance imaging. Three-dimensional maps of gray matterand models of cortical surface anatomy were derived from high-resolu-tion three-dimensional (2562 × 124 resolution) T1-weighted (MPRAGE)magnetic resonance images acquired from all 40 subjects on a 1.5 TSiemens scanner (Siemens, [Author: City of manufacturer?] New York).
Image processing and analysis. A radio-frequency bias field correctionalgorithm eliminated intensity drifts due to scanner field inhomogeneity.A supervised tissue classifier generated detailed maps of gray matter,white matter and cerebrospinal fluid (CSF). Briefly, 120 samples of eachtissue class were interactively tagged to compute the parameters of aGaussian mixture distribution that reflects statistical variability in theintensity of each tissue type16,17. A nearest-neighbor tissue classifierassigned each image voxel to a particular tissue class (gray, white or CSF),or to a background class. The inter/intra-rater reliability of this proto-col, and its robustness to changes in image acquisition parameters, havebeen described previously17. The error variance, that is, the variationassociated with map error and reproducibility, was further confirmed tobe small by the extremely high intra-class correlations in the MZ pairs(around 1.0), which would not otherwise be obtainable (Fig. 2). Graymatter maps were retained for subsequent analysis.
Three-dimensional cortical maps. To facilitate comparison and poolingof cortical data across subjects, a high-resolution surface model of thecortex was automatically extracted for each subject18. Thirty-eight gyraland sulcal boundaries, representing the primary gyral pattern of eachsubject, were digitized on the highly magnified three-dimensional sur-face models. Gyral patterns and cortical models were used to compute athree-dimensional vector deformation field, which reconfigures eachsubject’s anatomy to the average configuration of the entire group (n =40), matching landmark points, surfaces and curved anatomic interfaces.Data were accordingly averaged or compared, to the maximum possibledegree, across corresponding cortical regions12. Additional three-dimen-sional vector deformation fields reconfigured one twin’s anatomy intothe shape of the other, matching landmark points, surfaces and curvedanatomic interfaces the pair of three-dimensional image sets. Given thatthe deformation maps associate cortical locations with the same relationto the primary folding pattern across subjects, a local measurement ofgray matter density was made in each subject and averaged across equiv-alent cortical locations.
Gray matter mapping. To quantify local gray matter, we used a measuretermed ‘gray matter density,’ which has been used in previous studies tocompare the spatial distribution of gray matter across subjects19,20,12.This measures the proportion of tissue that segments as gray matter in
a small region of fixed radius (15 mm) around each cortical point. Giventhe large anatomic variability in some cortical regions, high-dimension-al elastic matching of cortical patterns21, constrained by all 1520 (40 _38) three-dimensional sulcal models, associated measures of gray mat-ter density from homologous cortical regions across subjects. Maps ofintra-pair gray matter differences, generated within each MZ and DZpair, were subsequently elastically realigned for averaging across the 10pairs within each group, before inter-group comparisons.
Mapping genetic correlations and asymmetry. Intra-class correlationbetween pairs of each zygosity was computed at each cortical point, aftertesting for heteroscedastic variance across each group. First, to assesswhether it was significantly non-zero, broad-sense heritability was com-puted using Falconer’s method22 to determine all genic influences on thephenotype (with heritability, h2, defined as twice the difference betweenMZ and DZ intra-class correlation coefficients). Because nongeneticfamilial effects contribute to the resemblance between relatives, sucheffects were accommodated, if not entirely eliminated, by assuming thesame common environmental variance for MZ and DZ pairs (comparewith ref. 4). For this study, random field models were preferred asopposed to a full structural equation model (for example, ref. 23) giventhe low degrees of freedom per point available to estimate dominanceand epistatic variance terms and reject simpler models based on the avail-able database of 40 scans. Interaction and gene–environment covarianceterms, as well as unique and shared environment factors, may beestimable with a more general familial design, an adoption design, or byusing sample sizes much larger than available in the present study23 (com-pare with 24). The significance of genetic effects was computed point-wise by reference to an analytical null distribution (F-test) and wasconfirmed separately by assembling an empirical null distribution using1,000,000 random pairings to avoid assuming bivariate normality. Allmap-based inferences were corrected for multiple comparisons by per-mutation. We used permutations to make statistical inferences that werenot based on any assumptions about the error covariances. To correctfor the multiple comparisons implicit in our brain maps we establishedthe null distribution of the largest statistic over the voxels analyzed. Byadopting the critical threshold of this largest statistic, we could then main-tain both strong and weak control over false-positive rates over the vox-els analyzed.
Asymmetric heritability was tested by computing a set of 40 flows dri-ving each subject’s left hemisphere model onto the right, matching gyralpatterns, and computing a field of heritability differences. This field wascompared with its standard error (pooled across contralateral corticalpoints, after testing equality of variance across hemispheres (comparewith ref. 25). Regions of asymmetric heritability were detected and theirsignificance was assessed by permuting the covariate vector coding forhemisphere. Maps of MZ intra-pair gray matter differences associatedwith intra-pair differences in the cognitive measure, Spearman’s g, weregenerated by elastically realigning three-dimensional maps for averag-ing across all MZ twin pairs and modeling g as a continuous covariatefor linkage with local gray matter distribution. Maps identifying theselinkages were computed point-wise across the cortex and assessed sta-tistically by permutation by computing the area of the average cortexwith statistics above a fixed threshold in the significance maps (P < 0.01).Null distributions were assembled from random pairings of unrelatedsubjects. We preferred this to an analytical null distribution to avoidassuming that the smoothness tensor of the residuals of the statisticalmodel was stationary across the cortical surface26. In each case, the covari-ate vector was permuted 1,000,000 times on an SGI RealityMonster super-computer with 32 internal R10000 processors. An algorithm was thendeveloped to report the significance probability for each map as a whole12,so the significance of intra-pair variance reduction by zygosity, heri-tability, asymmetry and cognitively linked patterns of gray matter dis-tribution could be assessed after the appropriate correction for multiplecomparisons.
ACKNOWLEDGEMENTSGrant support was provided by a P41 Resource Grant from the National Center
for Research Resources (P.T., A.W.T.; RR13642) and by a National Institute of
articles
nature neuroscience • volume 4 no 12 • december 2001 5
6 nature neuroscience • volume 4 no 12 • december 2001
Mental Health grant (T.D.C). Additional support for algorithm development
was provided by the National Library of Medicine, NINDS, the National Science
Foundation, and a Human Brain Project grant to the International Consortium
for Brain Mapping, funded jointly by NIMH and NIDA. Special thanks go to U.
Mustonen, A. Tanksanen, T. Pirkola, and A. Tuulio-Henriksson for their
contributions to subject recruitment and assessment.
RECEIVED 4 JUNE; ACCEPTED 19 OCTOBER 2001
1. Collins, F. S. & McKusick, V. A. Implications of the Human Genome Projectfor medical science. JAMA 285, 540–544 (2001).
2. Huerta, M. F. & Koslow, S. H. Neuroinformatics: opportunities acrossdisciplinary and national borders. Neuroimage 4, 4–6 (1996).
3. Plomin, R. & Loehlin, J. C. Direct and indirect IQ heritability estimates: apuzzle. Behav. Genet. 19, 331–342 (1989).
4. McClearn, G. E. et al. Substantial genetic influence on cognitive abilities intwins 80 or more years old. Science 276, 1560–1563 (1997).
5. Alarcón, M., Plomin, R., Fulker, D. W., Corley, R. & DeFries, J. C.Multivariate path analysis of specific cognitive abilities data at 12 years of agein the Colorado Adoption Project. Behav. Genet. 28, 255–264 (1998).
6. Eley, T. C. & Plomin, R. Genetic analyses of emotionality. Curr. Opin.Neurobiol. 7, 279–284 (1997).
7. Tramo, M. J. et al. Brain size, head size, and intelligence quotient inmonozygotic twins. Neurology 50, 1246–1252 (1998).
8. Oppenheim, J. S., Skerry, J. E., Tramo, M. J. & Gazzaniga, M. S. Magneticresonance imaging morphology of the corpus callosum in monozygotictwins. Ann. Neurol. 26, 100–104 (1989).
9. Pfefferbaum, A., Sullivan, E. V., Swan, G. E. & Carmelli, D. Brain structure inmen remains highly heritable in the seventh and eighth decades of life.Neurobiol. Aging 21, 63–74 (2000).
10. Biondi, A. et al. Are the brains of monozygotic twins similar? A three-dimensional MR study. Am. J. Neuroradiol. 19, 1361–1367 (1998).
11. Bartley, A. J., Jones, D. W. & Weinberger, D. R. Genetic variability of humanbrain size and cortical gyral patterns. Brain 120, 257–269 (1997).
12. Thompson, P. M. et al. Cortical change in Alzheimer’s disease detected with adisease-specific population-based brain atlas. Cereb. Cortex 11, 1–16 (2001).
13. Giedd, J. N. et al. Brain development during childhood and adolescence: alongitudinal MRI study. Nat. Neurosci. 2, 861–863 (1999).
14. Kaprio, J., Koskenvuo, M. & Rose, R. J. Change in cohabitation and intrapairsimilarity of monozygotic (MZ) cotwins for alcohol use, extraversion, andneuroticism. Behav. Genet. 20, 265–276 (1990).
15. Cannon, T. D. et al. The inheritance of neuropsychological dysfunction intwins discordant for schizophrenia. Am. J. Hum. Gen. 67, 369–382 (2000).
16. Zijdenbos, A. P. & Dawant, B. M. Brain segmentation and white matter lesiondetection in MR images. Crit. Rev. Biomed. Eng. 22, 401–465 (1994).
17. Sowell, E. R. et al. In vivo evidence for post-adolescent brain maturation infrontal and striatal regions. Nat. Neurosci. 2, 859–861 (1999).
18. MacDonald, D., Avis, D. & Evans, A. C. Multiple surface identification andmatching in magnetic resonance images. Proc. SPIE 2359, 160–169 (1994).
19. Wright, I. C. et al. A voxel-based method for the statistical analysis of gray andwhite matter density applied to schizophrenia. Neuroimage 2, 244–252(1995).
20. Ashburner, J. & Friston, K. J. Voxel-based morphometry—the methods.Neuroimage 11, 805–821 (2000).
21. Thompson, P. M., Woods, R. P., Mega, M. S. & Toga, A. W.Mathematical/computational challenges in creating deformable andprobabilistic atlases of the human brain. Hum. Brain Mapp. 9, 81–92 (2000).
22. Falconer, D. S. Introduction to Quantitative Genetics Edn. 3 (Longman, Essex,UK, 1989).
23. Neale, M. C. & Cardon, L. R. Methodology for Genetic Studies of Twins andFamilies (Kluwer Academic, Boston, 1992).
24. Feldman, M. W. & Otto, S. P. Twin studies, heritability, and intelligence.Science 278, 1383–1384 (1997).
25. Loehlin, J. C. & Nichols, R. C. Heredity, Environment and Personality (Univ. ofTexas Press, Austin, Texas, 1976).
26. Thompson, P. M. et al. in Handbook on Medical Image Analysis (ed.Fitzpatrick, M.) [AUTHOR: Page numbers?] (SPIE, [AUTHOR: City ofpublication?], 2000).
27. Rajkowska, G. & Goldman-Rakic, P. S. Cytoarchitectonic definition ofprefrontal areas in the normal human cortex: II. Variability in locations ofareas 9 and 46 and relationship to the Talairach Coordinate System. Cereb.Cortex 5, 323–337 (1995).
28. Smith, C. in Textbook of Human Genetics (eds. Fraser G. & Mayo O.)[AUTHOR: Page numbers?] (Blackwell, Oxford, 1975).
29. Huntley, R. M. C. in Genetic and Environmental Factors in Human Ability(eds. Meade, J. E. & Parkes, A. S.) [AUTHOR: Page numbers?] (Oliver andBoyd, Edinburgh, Scotland, 1966).
30. Gayan, J. & Olson, R. K. Reading disability: evidence for a genetic etiology.Eur. Child Adolesc. Psychiatry 8, 52–55 (1999).
31. Pennington B. F. et al. A twin MRI study of size variations in human brain. J.Cogn. Neurosci. 12, 223–232 (2000).
32. Tramo, M. J. et al. Surface area of human cerebral cortex and its grossmorphological subdivisions. J. Cogn. Neurosci. 7, 292–301 (1995).
33. Devlin, B., Daniels, M. & Roeder, K. The heritability of IQ. Nature 388,468–471 (1997).
34. Finkel, D. et al. Longitudinal and cross-sectional twin data on cognitiveabilities in adulthood: the Swedish adoption/twin study of aging. Devel.Psychol. 34, 1400–1413 (1998).
35. Swan, G. E. et al. Heritability of cognitive performance in aging twins. TheNational Heart, Lung, and Blood Institute Twin Study. Arch. Neurol. 47,259–262 (1990).
36. Loehlin, J. C. Partitioning environmental and genetic contributions tobehavioral development. Am. Psychol. 44, 1285–1292 (1989).
37. Chipuer, H. M., Rovine, M. J., Plomin, R. LISREL Modeling: genetic andenvironmental influences on IQ revisited. Br. J. Dev. Psychol. 10, 110[AUTHOR: Final page number?] (1990).
38. Plomin, R. & Petrill, S.A. Genetics and intelligence: What’s new? Intelligence24, 53 [AUTHOR: Final page number?] (1997).
39. Duncan, J. et al. A neural basis for general intelligence. Science 289, 457–460(2000).
40. Funahashi, S., Bruce, C. J. & Goldman-Rakic, P. S. Mnemonic coding ofvisual space in the monkey’s dorsolateral prefrontal cortex. J. Neurophysiol.61, 331–349 (1989).
41. Rutter, M., Silberg, J., O’Connor, T. & Simonoff, E. Genetics and childpsychiatry: I. Advances in quantitative and molecular genetics. J. ChildPsychol. Psychiatry 40, 3–18 (1999).
42. Williams, R. W., Strom, R. C., & Goldowitz, D. Natural variation in neuronnumber in mice is linked to a major quantitative trait locus on Chr 11. J.Neurosci. 18, 138–146 (1998).
43. Hill, L. et al. DNA pooling and dense marker maps: a systematic search forgenes for cognitive ability. Neuroreport 10, 843–848 (1999).
44. Cannon T. D. et al. Regional gray matter, white matter, and cerebrospinalfluid distributions in schizophrenic patients, their siblings, and controls.Arch. Gen. Psychiatry 51, 651–661 (1998).
45. Weinberger, D. R., DeLisi, L. E., Neophytides, A. N. & Wyatt, R. J. Familialaspects of CT scan abnormalities in chronic schizophrenic patients.Psychiatry Res. 4, 65–71 (1981).
46. Suddath, R. L. et al. Anatomical abnormalities in the brains of monozygotictwins discordant for schizophrenia. N. Engl. J. Med. 322, 789–794 (1990).
47. Kreft, I. & de Leeuw, J. Introducing Multilevel Modeling (Sage, London, 1998).48. Littell, R. C., Milliken, G. A., Stroup, W. W. & Wolfinger, R. D. SAS System for
Mixed Models (SAS Institute, Cary, North Carolina, 1996).49. Hedeker, D., Gibbons, R. D. & Flay, B. R. Random-effects regression models
for clustered data with an example from smoking prevention research. J.Consult. Clin. Psychol. 62, 757–765 (1994).
articles