Embed Size (px)
Citation preview
Mukhongo et al, 2014/J. Livestock Sci. 5: 65-78
65
Genetic Diversity and Population Structure of the
Indigenous Sheep in Kenya Based on Microsatellite
Analysis: Implications for their Conservation
D. M. Mukhongo1*
, O Mwai3, M Tapio
4, A. Muigai
2,
1- University of Cambridge, UK, 2-Jomo Kenyatta University of Agriculture and Technology-Nairobi,
Kenya , 3-International Livestock Research Institute-Nairobi, Kenya, 4- MTT Agrifood Research Finland,
31600 Jokioinen, Finland * Corresponding author & address
Leverhulme Centre for Human Evolutionary Studies
University of Cambridge
Fitzwilliam Street, Cambridge CB2 1QH
Contact email address:[email protected]
Journal of Livestock Science (ISSN online 2277-6214) 5:65-78
Received on 25/06/2014; Accepted on 20 /07/2014
ABSTRACT
Knowledge of the genetic relationship and admixture among neighbouring livestock
populations is crucial for conservation efforts. This study analyzed the molecular
diversity of fifteen sheep populations (both indigenous and exotic) in Kenya. Blood
samples from 582 individuals were genotyped across the 15 microsatellite markers. The
expected heterozygosity and Mean number of alleles ranged from 0.596 to 0.807 and 6.67
to 9.33 respectively. Most populations showed significant heterozygote deficiency due to
a moderately high level of inbreeding, fIS (0.109). Population genetic differentiation was
reasonably high (θST = 0.101). Four population clusters majorly based on geographical
proximity and interbreeding among populations were detected. These results indicate
levels of admixture warranting institution of conservation measures. However, a more
encompassing study including all regions in the country as well as more microsatellite
markers is necessary to comprehensively understand the dynamics of genetic
introgression.
Keywords: Admixture; exotic breeds; gene flow; Sustainable breeding programs

Mukhongo et al, 2014/J. Livestock Sci. 5: 65-78
66
INTRODUCTION
Indigenous and locally developed sheep breeds are an important asset due to the
unique combinations of adaptive traits they have developed and thus can respond
effectively to the pressures of the local environment (Buduram, 2004). Such adaptive
traits include tolerance to various diseases, fluctuations in feed quality, extreme climatic
conditions and the ability to survive and reproduce for long periods of time (Hammond,
2000).
African sheep are described as thin-tailed, fat-tailed or fat-rumped (Mason &
Maule, 1960) with thin-tailed further segregated into hairy or woolled types (Epstein,
1971). The Eastern African sheep are classified as either fat-tailed or fat-rumped (Rege et
al., 1996). More production units, mainly pastoralists, in African farming systems own
goats and sheep than any other species of domestic livestock except poultry, this is
because of their lower feed requirements, rapid reproduction cycles and the ease with
which they can be handled, thus they are particularly important for resource-poor
households and often are the property of underprivileged groups, such as women and
children (Devendra, 2002).
In Kenya, small ruminants are kept both for tangible benefits, such as cash
income from animal, milk and meat sales and for home consumption, and intangible
benefits including savings, an insurance against emergencies, cultural and ceremonial
purposes (Kosgey et al., 2006a, b). Kosgey et al., (2006b), ranks regular cash income as
the most important purpose of ovicaprids towards both smallholders and pastoral
extensive farmers. In Kenya, sheep supply an estimated 15-20 percent of the red meat
consumed in the country (Ministry of Livestock and Fisheries Development 2003).
According to Gathuka (1986), arid and semi-arid land forms eighty five percent of
Kenya’s diverse ecological zones which is also home to most of the indigenous sheep
genotypes. The indigenous fat-tailed sheep breeds found in Kenya include the Red
Maasai and East African Somali Blackhead Persian which are found in virtually all parts
of the country (Sheep and Goat Annual Report 2003).
It has become apparent over the past few decades though, that many of these
indigenous breeds are at risk of extinction. This has been occasioned by; the advent of
artificial insemination and improved transportation which have reduced the number of
breeding rams, thus leading to a reduction in the effective population size (Ne) of many
breeds. There is as well a change in focus to only a few highly yielding breeds, to the
detriment of rare or minority breeds, which are likely to be important genetic resources
because of their local adaptive traits (Mendelsohn, 2003). Minority breeds have also been
lost by introgression into large commercial populations. Such loss of diversity in
domestic species including sheep has far reaching economic, ecological and scientific as
well as social implications. An understanding of the evolutionary history of domestic
breeds and data on genetic variation within and among breeds is vital to these initiatives
to provide critically important data for the decision-making process (Rege and Gibson
2003). Information on both within and among-breed diversity is important as the former
provides information for management at the breed level whereas the latter helps identify
divergent breeds that may harbour distinct genotypes hence worthy of conservation
efforts even if their within-breed diversity is relatively high.
In the present study, a panel of 15 microsatellite markers was used to evaluate the
partitioning of genetic diversity within and among a diverse sample of 582 individuals

Mukhongo et al, 2014/J. Livestock Sci. 5: 65-78
67
obtained from 15 populations of domestic sheep. The extent of admixture and population
structure among the sheep populations in relation to conservation and management was
also examined.
MATERIALS AND METHODS
Sample collection and preparation
Blood samples were collected from 582 genetically unrelated individuals
representing 15 populations (Table 1 and Figure 1). Dorper sheep were sampled from a
research farm in Kapiti plains, Machakos, affiliated with the International Livestock
Research Institute.
Figure 1. Geographic distribution of the sheep populations used in this study
Table 1: Sampling sites, Population acronyms (in brackets), GPS positions, Breed and
number of sheep sampled Site Name Latitude Longitude Breed No. of
Ewes
sampled
No. of
Rams
sampled
BUNGOMA(BGM) +0.4592 +34.5163 East African fat-tailed 27 13
GARISSA(GAR) -0.5458 +39.6831 Blackhead Somali 29 11
WEST POKOT(WP) +1.4900 +35.0188 East African fat-tailed 31 10
VIPINGO(VIP) -2.3239 +40.7267 Red Maasai 30 12
LAMU(LAM0 -2.2337 +40.9071 Blackhead Somali 30 10
LOKICHOGGIO(LOK) +4.1829 +34.3231 Blackhead Somali 24 8
LOITOKTOK(LTK) -2.5784 +36.9474 Red Maasai 31 12
MOYALE(MOY) +3.5129 +39.0631 Blackhead Somali 32 11
KAPITI(KAP) -1.5678 +36.9322 Red Maasai and
Dorper
52 20
OKIRAMATIAN(OKM) -1.8652
+36.1656
Red Maasai and
Blackhead Somali
53 23
HOMABAY(HOM) -0.5873 +34.5941 East African fat-tailed 29 11
SOMALI(SBH) +7.5800 +47.4400 Blackhead Somali 30 10
MOMBASA(REMA) - 4.1028 +39.2737 Red Maasai 24 9
Total 422 160
Total number of sheep sampled = 582

Mukhongo et al, 2014/J. Livestock Sci. 5: 65-78
68
Microsatellite analysis and genotyping
Fifteen microsatellite markers used in this study were from the panel
recommended by ISAG/FAO for sheep diversity studies (http://dad.fap.prg/). Forward
primers were end-labeled with fluorescent dyes (6-FAM, VIC, PET or NED). PCR was
carried out in a total volume of 10 µl system containing 1 µl of template DNA (20 ng/µl),
0.2 µl of each primer, 5 µl of ReddyMixTM
PCR Master Mix (ABgene, UK) and 3.6 µl of
double distilled water. The cycling conditions included an initial activation step at 95 ◦C
for 5min, 30 cycles of 94 ◦C for 30 s, annealing at 50-65
◦C for 30 s and extension at 72
◦C for 30 s, and a final extension at 72
◦C for 10 min. PCR was performed on a 9800
GeneAMP®PCR System (Applied Biosystems, USA). PCR products were genotyped
using an ABI 3730 (Applied Biosystems, Warrington, UK) automated capillary DNA
sequencer. GeneMapper® software (version 3.7, Applied Biosystems, USA), was used to
perform allele calling using the third order least squares method for fragment sizing.
Statistical analyses
The exact test in GENEPOP package (Rice, 1989) was used to determine the
deviations from Hardy-Weinberg equilibrium (HWE) in the populations studied. To
assess within-population genetic diversity, mean number of alleles (MNA), observed
(HO) and expected heterozygosity (HE, Nei’s unbiased gene diversity) were calculated
using the Microsatellite Toolkit (available at http://animalgenomics.ucd.ie/sdepark/ms-
toolkit/). Allelic richness (r) was estimated using the FSTAT program version 2.9.3
(Goudet, 1995). The BOTTLENECK program (Cornuet and Luikart 1997) was used to
test the allele frequency data for heterozygosity excess or deficiency.
Using the variance-based method of Weir and Cockerham (1984), F-statistics (FIS, FIT
and FST) for calculating overall genetic differentiation among populations and between
pairs of populations were performed and tested using FSTAT with 1000 permutations.
Analysis of molecular variance (AMOVA) was computed using the GeneAlex 6.1
package (Peakall and Smouse 2006).
To detect the genetic relationships and population structure among the 15 sheep
populations, three approaches were applied. Firstly, Nei’s DA genetic distances (Nei et
al., 1983) calculated by Microsatellite Analyzer (Dieringer and Schlötterer 2002) helped
in the construction of the phylogenetic relationships of the sheep using PHYLIP package
(Felsenstein 2004) and the consensus tree drawn by the SplitsTree program (Huson and
Bryant 2006). Tree robustness was evaluated by bootstrapping over loci (1000
replicates). Independent Components Analysis (ICA) analysis was performed as an
alternative approach to understanding the genetic relationship amongst the populations.
Using the Bayesian clustering-model program STRUCTURE (Pritchard et al., 2000;
2007), population structure and the degree of admixture were determined. The output
from STRUCTURE was then sent to STRUCTURE HARVESTER (Earl, 2009) which
helped in plotting the graph according to Evanno et al., (2005) and Pritchard et al, (2000)
for K estimation as well as assist in the preparation of the input files for CLUMPP
(Jakobsson and Rosenberg 2007). The output from CLUMPP was then used an input for
DISTRUCT (Rosenberg, 2004) a cluster visualization program.

Mukhongo et al, 2014/J. Livestock Sci. 5: 65-78
69
RESULTS
173 alleles were found in the sheep populations studied across the 15
microsatellite loci. The mean number of alleles per population ranged from 6.67
(OKMRM) to 9.33 (KAPRM) (Table 2).
The various values obtained for heterozygosity and mean number of alleles are
shown in Table 2. Majority of the loci had their expected heterozygosity values
significantly higher than the observed heterozygosity indicating deviations from Hardy–
Weinberg equilibrium. ILSTS005 had the highest number of deviations (12) and
SRCRSP9 had the least deviations (3). The overall means of FIT, θST and fIS obtained from
jackknifing over loci were significantly different from zero (Table 3).
When all markers were considered, the highest chord distance (0.852) occurred
between the Olkiramatian Red Maasai and the Kapiti Dorper populations with the least
(0.143) between the Mombasa Red Maasai and the Loitoktok populations (Table 4).
Based on the consensus phylogenetic tree (Fig. 2) populations mainly clustered as
per their geographical locations and population identity. The bootstrap support across the
phylogenetic tree was low signifying the instability of the topology observed in the tree.
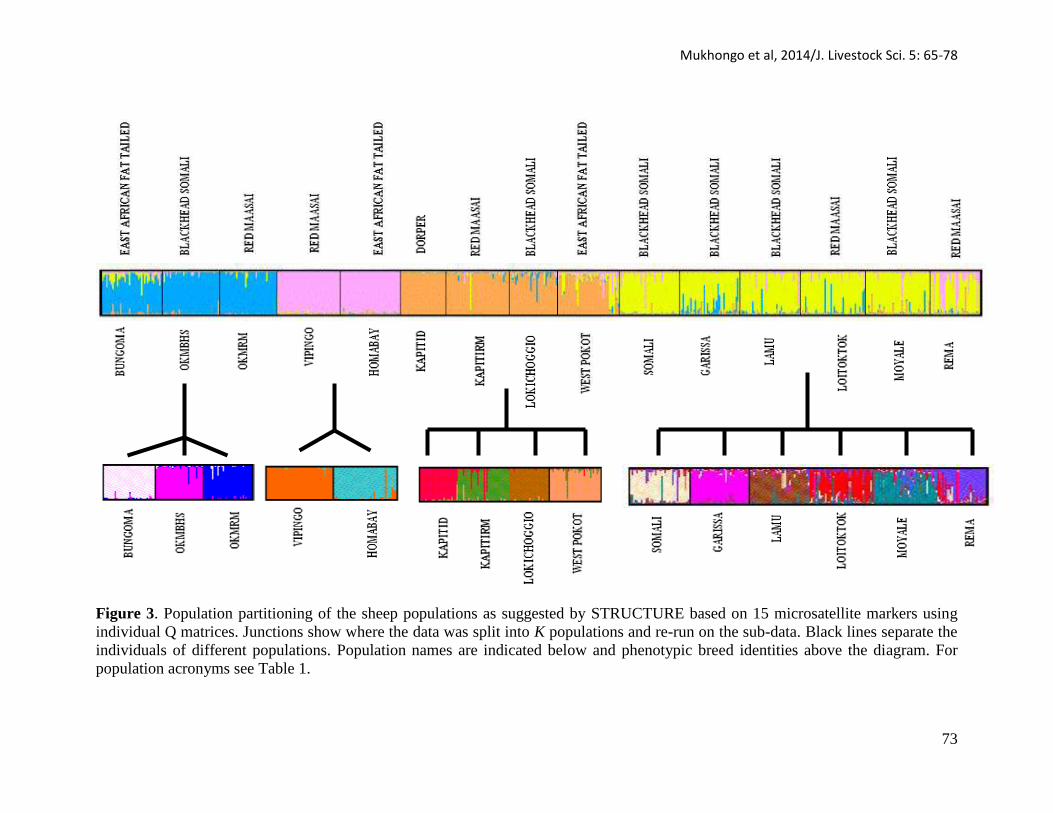
From the population structure analysis the true K value = 4 as shown in Figure 3.
Further genetic structure was revealed in each of the clusters obtained at K= 4 (Figure 3).
Independent Component Analysis clustered populations in a manner similar to
both STRUCTURE and the phylogenetic tree (Figure 4). The first three components
(IC1, IC2 and IC3) accounted for 0.3791, 0.3192 and 0.3017 of the total variation
respectively.
The tests for heterozygosity excess and deficit under the two phase mutation
model (TPM) at p<0.001, provided evidence for a recent genetic bottleneck in the Kapiti
Dorper population (Table 5).
Table 2: Number of Animals Sampled, Mean heterozygosity, Mean number of Alleles
and standard deviations for each of the fifteen populations studied Population Sample
size
Loci
typed HE HE SD HO HO SD MNA MNA SD
BGM 40 15 0.6861 0.0288 0.6186 0.0199 7.53 2.00
SBH 40 15 0.7021 0.0248 0.6373 0.0200 7.13 2.42
GAR 40 15 0.7089 0.0491 0.5641 0.0203 7.80 3.34
KAPD 30 15 0.8068 0.0159 0.8519 0.0168 7.80 2.27
KAPRM 42 15 0.8045 0.0131 0.7713 0.0167 9.33 2.55
VIP 42 15 0.7100 0.0293 0.6286 0.0193 6.93 1.98
LAM 40 15 0.6728 0.0335 0.6150 0.0199 8.00 3.09
LOK 32 15 0.7941 0.0204 0.7051 0.0208 8.60 2.29
LTK 43 15 0.7020 0.0380 0.6217 0.0191 7.80 2.46
MOY 43 15 0.7555 0.0240 0.6717 0.0185 8.20 2.43
OKMBHS 38 15 0.7230 0.0236 0.6415 0.0201 7.20 2.46
OKMRM 38 15 0.5956 0.0645 0.5120 0.0210 6.67 2.94
REMA 33 15 0.7580 0.0240 0.6626 0.0213 7.67 2.35
WP 41 15 0.7058 0.0227 0.5911 0.0198 7.47 1.77
HOM 40 15 0.7254 0.0307 0.6206 0.0198 7.40 1.96
Mean 38.8 15 0.7230 0.0300 0.6480 0.0200 7.70 2.42
NOTE: BGM- Bungoma, SBH-Somali Blackhead, GAR- Garissa, KAPD- Kapiti Dorper, KAPRM- Kapiti Red
Maasai, VIP-Vipingo, LAM- Lamu, LOK- Lokichoggio, LTK- Loitoktok, MOY- Moyale, OKMBHS-Olkiramatian Blackhead Somali, OKMRM- Olkiramatian Red Maasai, REMA- Mombasa Red Maasai, WP- West Pokot, HOM- Homa
Bay.

Mukhongo et al, 2014/J. Livestock Sci. 5: 65-78
70
Figure 2: An unrooted neighbour joining phylogenetic tree showing the relationship
among the fifteen Kenyan sheep populations studied (only values showing >50 %
bootstrap support are reported). For population acronyms see Table 1.

Mukhongo et al, 2014/J. Livestock Sci. 5: 65-78
71
Table 3: Weir and Cockerham 1984 multilocus estimates for diploid data based on Jackknife resampling over all loci (the
number in the parenthesis indicates the standard error)
Locus fIS θST FIT GST GST’ HT HS A
BM8125 0.0744* 0.1559** 0.2187** 0.149 0.158 0.687 0.585 7
DYMS1 0.1207** 0.1275** 0.2328** 0.114 0.121 0.762 0.675 13
HSC 0.0352* 0.0363** 0.0703** 0.034 0.037 0.862 0.832 12
HUJ616 0.1163** 0.1065** 0.2104** 0.10 0.106 0.84 0.756 17
ILSTS005 0.3123** 0.0730** 0.3625** 0.073 0.078 0.837 0.776 10
MAF209 0.1042** 0.1354** 0.2255** 0.125 0.133 0.86 0.752 10
MCM42 0.1212** 0.1067** 0.2150** 0.10 0.107 0.68 0.612 8
OARFCB11 0.0952** 0.1950** 0.2716** 0.184 0.194 0.861 0.703 12
OARFCB20 0.0683** 0.1088** 0.1696** 0.102 0.109 0.866 0.778 13
OARFCB226 0.1004** 0.0844** 0.1763** 0.08 0.085 0.824 0.758 16
OARHH47 0.1201** 0.1057** 0.2131** 0.10 0.107 0.873 0.785 17
OARJMP29 0.0719* 0.0668** 0.1339** 0.072 0.077 0.742 0.688 10
OARVH72 0.1116** 0.1460** 0.2413** 0.136 0.144 0.773 0.668 10
SRCRSP9 0.0098ns
0.0473** 0.0566ns
0.047 0.051 0.73 0.696 8
TGLA53 0.1516** 0.0256** 0.1733** 0.025 0.027 0.821 0.8 10
Overall: 0.109 (0.019)** 0.101(0.012)** 0.199 (0.02)** 0.096 0.102 0.801 0.724 173
fIS, within-population inbreeding estimate; FIT, total inbreeding estimate; θST, measure of population
differentiation;
A, the number of Alleles
Statistical significance: *- p<0.05, ** - p<0.01, ***- p<0.001 ns
- non-significant based on 10 000 randomisations (after Bonferroni
corrections)

Mukhongo et al, 2014/J. Livestock Sci. 5: 65-78
72
Table 4: Pairwise population matrix of Nei’s chord distances (DA) for the fifteen Kenyan sheep populations studied
POPLN BGM SBH GAR KAPD KAPRM VIP LAM LOK LTK MOY OKMBHS OKMRM REMA WP HOM
BGM 0.000
SBH 0.378 0.000
GAR 0.319 0.232 0.000
KAPD 0.557 0.419 0.419 0.000
KAPRM 0.405 0.305 0.402 0.285 0.000
VIP 0.339 0.316 0.348 0.506 0.361 0.000
LAM 0.270 0.206 0.209 0.521 0.391 0.297 0.000
LOK 0.577 0.465 0.665 0.618 0.497 0.704 0.655 0.000
LTK 0.192 0.161 0.214 0.449 0.331 0.278 0.179 0.543 0.000
MOY 0.243 0.193 0.224 0.396 0.334 0.368 0.175 0.509 0.152 0.000
OKMBHS 0.323 0.357 0.302 0.617 0.521 0.620 0.357 0.536 0.333 0.296 0.000
OKMRM 0.386 0.551 0.389 0.852 0.755 0.741 0.521 0.796 0.439 0.533 0.315 0.000
MOMBRM 0.255 0.177 0.226 0.456 0.281 0.196 0.251 0.513 0.143 0.226 0.419 0.533 0.000
WP 0.274 0.254 0.327 0.378 0.234 0.313 0.358 0.538 0.208 0.266 0.473 0.625 0.206 0.000
HOM 0.418 0.446 0.513 0.608 0.426 0.276 0.504 0.617 0.363 0.439 0.630 0.651 0.346 0.293 0.000
NOTE: BGM- Bungoma, SBH-Somali Blackhead, GAR- Garissa, KAPD- Kapiti Dorper, KAPRM- Kapiti Red
Maasai, VIP-Vipingo, LAM- Lamu,
LOK- Lokichoggio, LTK- Loitoktok, MOY- Moyale, OKMBHS- Olkiramatian Blackhead Somali,
OKMRM- Olkiramatian Red Maasai,
MOMBRM- Mombasa Red Maasai, WP- West Pokot, HOM- Homa Bay.
Mukhongo et al, 2014/J. Livestock Sci. 5: 65-78
73
Figure 3. Population partitioning of the sheep populations as suggested by STRUCTURE based on 15 microsatellite markers using
individual Q matrices. Junctions show where the data was split into K populations and re-run on the sub-data. Black lines separate the
individuals of different populations. Population names are indicated below and phenotypic breed identities above the diagram. For
population acronyms see Table 1.

Mukhongo et al, 2014/J. Livestock Sci. 5: 65-78
74
Table 5: The Wilcoxon test for genetic bottlenecks
Population Sample
Size
One Tail P-value (TPM)
H.deficit H.excess
Bungoma 40 0.10388 0.90619
Somali Blackhead 40 0.55481 0.46704
Garissa 40 0.91559 0.09381
Kapiti Dorper 30 0.99997 0.00005***
Kapiti Red Maasai 42 0.97232 0.03186
Vipingo 42 0.88535 0.12619
Lamu 40 0.17957 0.83487
Lokichoggio 32 0.99377 0.00754
Loitoktok 43 0.70026 0.31934
Moyale 43 0.87381 0.13843
Olkiramatian Blackhead Somali 38 0.64014 0.38077
Olkiramatian Red Maasai 38 0.07571 0.93231
Mombasa Red Maasai 33 0.97937 0.02396
West Pokot 41 0.26224 0.75565
Homa Bay 40 0.84860 0.16513
***- statistically significant at p<0.001 based on 10 000 replications (after Bonferroni corrections)
Figure 4: The Independent Component Analysis plot for the fifteen sheep populations.
For population acronyms see Table 1.

Mukhongo et al, 2014/J. Livestock Sci. 5: 65-78
75
DISCUSSION
This study yielded 7.70, 0.723 and 0.648 as the mean number of alleles (MNA),
expected and observed heterozygosities respectively, a testimony to the high genetic
diversity in these populations. These are comparable to the ones reported by Muigai
(2003) MNA, HE and HO of 7.24, 0.74 and 0.69 respectively for the sub-Saharan sheep as
well as Ligda et al., (2009) with MNA, HE and HO as 8.34, 0.74 and 0.696 respectively
for Greek sheep breeds. The MNA is an appropriate measure of genetic variation
compared to heterozygosity for it’s expected to be proportional to the extent of
polymorphism whereas the heterozygosity is hardly affected by low frequency alleles
(Nei, 1987).
Throughout the study, the farmers’ maintained populations had a comparatively
lower variability to the ones kept and maintained in nucleus herds with the exception of
the Kijipwa Red Maasai population kept and maintained by the Lafarge Ecosystems in
Mombasa. The Kapiti population, a nucleus herd kept and maintained by the International
Livestock Research Institute as opposed to the farmer herds has its animals sourced from
different source flocks and kept separately based on their sex with mating done in a way
to reduce consanguineous matings by using properly kept animal records. This is quite
unlike the farmers’ flocks where animals are grazed and housed together in the ‘bomas’
irrespective of their sex thus increasing the chances of closely related animals mating.
Lack of meticulously kept records for the Kijipwa Red Maasai prospectively explicates
their reduced variability since efficient control of siblings from mating might not be
possible. The animals in Kijipwa are kept for the sole purpose of grazing under the
Lafarge Ecosystems’ trees thus the chances of bringing new animals into the flock are
slim. The probability that animals held in the flock at any one time are the ones likely to
be ‘parents’ of future populations is high.
Populations deviating from mutation-drift equilibrium while exhibiting a
significant heterozygosity excess for selectively neutral markers can be considered to
have experienced a recent genetic bottleneck (Cornuet and Luikart 1996); this was the
case with the dorper population from Kapiti. Being a nucleus herd, the animals used to
establish it were obtained from several source populations The mating of such genetically
diverse animals, obtained from many flocks but with very little or none-representative
rare alleles from the source populations, will more often than not lead to significant
elevation in heterozygosity but reduced MNA. There is however need to assess if the
genetic bottleneck observed will have any impact on this dorper population.
The genetic distances observed among the populations were varied with the
highest population pairwise distances occurring between the Kapiti Dorper and the
Lokichoggio populations relative to the rest of the sheep populations. The distance
between the Kapiti Dorper and the other populations was rather expected since this is an
exotic breed whereas the rest are indigenous. The only surprising exception was between
the two Kapiti populations (Dorper and Red Maasai). This being a nucleus herd one
would have expected that the two populations be rather genetically distinct, but the
observed relationship could be as a result of the animals used to establish the flocks
especially the Red Maasai were not pure since they were acquired locally from farmers or
other nucleus herds. A revelation by Kwallah (2007) 8% dorper in the Red Maasai
genetic constitution that in the Olmagogo nucleus herd in Naivasha plausibly explains the
Kapiti case since some animals used to establish the Kapiti Red Maasai flock were

Mukhongo et al, 2014/J. Livestock Sci. 5: 65-78
76
sourced from Olmagogo. A more important observation however is that the Kapiti Red
Masaai does not represent the whole Kenyan Red Maasai population and one should
consider expanding their genetic base using other still existing Red Maasai populations.
The high genetic distances between the Lokichoggio and other populations can be
attributed to the physical geographical barrier given the long distance between
Lokichoggio and other sites from which other populations were sampled from. The close
relationship between the Garissa, Moyale, Lamu and Somali Blackhead populations is in
line with their geographical locations, the pastoral-nomadic way of life as well as the
raiding practices of the occupants of these places. This can as well suggest the presence
of common markets or the sharing of pastures and watering points thus enhancing gene
flow among the populations. Also, the frequent droughts and disease outbreaks in most of
these areas often results in massive animal deaths with follow-up restocking exercises
mostly done using animals bought from neighbouring areas. The close relationship of the
Somali Blackhead populations to the Loitoktok population in Kajiado, the heart of
Maasai land is a sure sign of the high rate of gene flow from indiscriminate crossbreeding
by the farmers ostensibly in an effort to improve on the size of their Red Maasai animals.
The average within population inbreeding coefficient for all the sheep studied was 0.109
suggesting a rather high level of inbreeding since most of the populations had open
breeding structures. The high fIS value obtained could as well emanate from the sub-
structuring among the sheep since different farmers’ populations are relatively isolated
and the local parental individuals contribute to the majority of the next sheep generation.
The θST and GST values as well as AMOVA analysis indicate that most of the genetic
variation (89.8%) is within populations with the pairwise between-population test
indicating that most populations were significantly different from each other with an
overall θST of 10.1%.
Implications of this study for the conservation of indigenous sheep in Kenya
With how genetically diverse the indigenous sheep in Kenya are, the biggest
challenge is how the observed diversity can be maintained, conserved and or even
improved upon. The inbreeding observed within the populations will likely compromise
their existence and productiveness due to the dangers associated with inbreeding
depression thus proper and sustainable breeding programs should be designed to help
deal with it. The admixture levels especially between the Red Maasai and other breeds is
worrying since the genetic qualities suitable for the unfavorable conditions in which the
indigenous sheep thrive are likely to be diluted and polluted. There is urgent need
therefore to set up proper conservation programs but given the limited resources the
greatest challenge is actually what to conserve?
Given the population structure observed, conserving one or a few populations will
not be enough to tap the wide genetic diversity resident in the indigenous sheep in Kenya.
The option would be therefore to determine those populations that contribute more to the
observed genetic diversity and prioritize them for conservation.

Mukhongo et al, 2014/J. Livestock Sci. 5: 65-78
77
REFERENCES
1) Buduram P, 2004. Genetic Characterization of South African Sheep Breeds Using
DNA markers. M.Sc. thesis, University of Free State, South Africa.
2) Cornuet JM and Luikart G, 1997. Description and power analysis of two tests for
detecting recent population bottlenecks from allele frequency data. Genetics,
144:2001-2014.
3) Devendra C, 2002. Potential productivity from small ruminants and contribution to
improved livelihoods in developing countries. In: "Proceedings of the Thirty
Ninth Reuniao Anual, Sociedade Brasilia de Zootechnia," Brasilia, Brazil.
4) Dieringer D and Schlötterer C, 2002. Microsatellite analyser (MSA): a platform
independent analysis tool for large microsatellite data sets. Mol Ecol Notes,
3:167-169.
5)Earl DA, 2009. Structure Harvester v0.3, from website:
http://users.soe.ucsc.edu/~dearl/software/struct_harvest/
6) Epstein H, 1971. The Origin of the Domestic Animals of Africa. Africana Publishing
Corporation: New York, USA.
7) Evanno G, Regnaut S and Goudet J, 2005. Detecting the number of clusters of
individuals using the software STRUCTURE: a simulation study. Mol Ecol, 14:
2611-2620.
8) Felsenstein J, 2004. PHYLIP: Phylogeny Inference Package, Version 3.6. University
of Washington, Seattle, USA.
9) Gathuka ZG, 1986. Management of small ruminant production systems in the farming
areas of Kenya In The “Workshop on the Improvement of Small Ruminants in
Eastern and Southern Africa” (Adeniji, K.O. (ed.); Kategile, J.A. (ed.) p. 195-205
Nairobi (Kenya) 18-22 Aug 1986.
10) Goudet J, 2001. FSTAT, a program to estimate and test gene diversities and fixation
indices (version 2.9.3). Available from
http://www2.unil.ch/popgen/softwares/fstat.htm. Updated from Goudet (1995).
11) Hammond K, 2000. A global strategy for the development of animal breeding
programmes in lower-input production environments. Animal Genet. Resour.,
Animal Production and Health Division, FAO, Rome, Italy.
12) Huson DH and Bryant D, 2006. Application of Phylogenetic Networks in
Evolutionary Studies, Mol. Biol. Evol., 23(2):254-267.
13) Jakobsson M, and Rosenberg NA, 2007. CLUMPP: a cluster matching and
permutation program for dealing with label switching and multimodality in
analysis of population structure. Bioinformatics, 23:1801-1806.
14) Kosgey IS, Baker RL, Udo HMJ and van Arendonk JAM, 2006a. Successes and
failures of small ruminant breeding programmes in the tropics: a review. Small
Rum. Res., 61: 13-28.
15) Kosgey IS, Rowlands GJ, van Arendonk JAM and Baker RL, 2006b. Small ruminant
production in smallholder and pastoral/ extensive farming systems in Kenya.
Small Rum. Res..
16) Kwallah AB, 2007. Characterization of Indigenous fat-tailed sheep in some parts of
Kenya: A Microsatellite Approach. MSc Thesis, Biochemistry Department, Jomo
Kenyatta University of Agriculture and Technology, Juja, Kenya.

Mukhongo et al, 2014/J. Livestock Sci. 5: 65-78
78
17) Ligda ChJ, Altarayrah A, Georgoudis and the ECONOGENE Consortium, 2009.
Genetic analysis of Greek sheep breeds using microsatellite markers for setting
conservation priorities. Small Rum. Res., 83:42-48.
18) Mason IL and Maule JP, 1960. The Indigenous Livestock of Eastern and Southern
Africa (Tech.Comm.N° 14, Commonw.Bur.Anim.Breed. Genet.). Commonwealth
Agricultural Bureaux: Farnham Royal, UK.
19) Mendelsohn R (2003). The challenge of conserving indigenous domesticated animals.
Ecol. Econ., 45: 501-510.
20) MLFD 2003. Ministry of Livestock and Fisheries Development, Annual Report.
MLFD, Nairobi, Kenya.
21) Muigai AWT, 2003. Characterization and conservation of indigenous animal genetic
resources: Genetic diversity and relationships of fat-tailed and thin-tailed sheep of
Africa. PhD Thesis, Biochemistry Department, Jomo Kenyatta University of
Agriculture and Technology, Juja, Kenya.
22) Nei M, 1987. Molecular Evolutionary Genetics. Columbia University Press: New
York.
23) Nei M, Tajima F, Tateno Y, 1983. Accuracy of estimated phylogenetic trees from
molecular data. J. of Mol. Evol. 19: pp.153-170.
24) Peakall R and Smouse P, 2006. GenAlEx 6. Genetic Analysis in Excel. Population
Genetic and Software for Teaching and Research.
25) Pritchard JK, Stephens M and Donnelly P, 2000. Inference of population structure
using multilocus genotype data. Genetics, 155: 945-959.
26) Pritchard JK, Wen X and Falush D, 2007. Documentation for structure software:
Version 2.2. http://pritch.bsd.uchicago.edu/software/structure22/.
27) Rege JEO, Yapi-Gnaore CV and Tawah CL. 1996. The indigenous domestic
ruminant genetic resources of Africa. In "2nd All Africa Conference on Animal
Agriculture" 1st - 4
th, April 1996, Pretoria, South Africa.
28) Rege JEO and Gibson JP, 2003. Animal genetic resources and economic
development: issues in relation to economic valuation. Ecol. Econ., 45:319-330.
29) Rice WR, 1989. Analyzing tables of statistical tests. Evolution, 43:223-225.
30) Rosenberg N. A. (2004) Distruct: a program for the graphical display of population
structure. Mol. Eco. Notes 4: 137-138.
31) Weir BS and Cockerham C, 1984. Estimating F-statistics for the analysis of
population structure. Evolution, 38:1358-69.