Embed Size (px)
Citation preview
Vol.:(0123456789)1 3
Conserv Genet DOI 10.1007/s10592-017-0994-y
RESEARCH ARTICLE
Genetic divergence between colonies of Flesh-footed Shearwater Ardenna carneipes exhibiting different foraging strategies
Anicee J. Lombal1 · Theodore J. Wenner1 · Jennifer L. Lavers2 · Jeremy J. Austin3 · Eric J. Woehler2 · Ian Hutton4 · Christopher P. Burridge1
Received: 24 January 2017 / Accepted: 4 July 2017 © Springer Science+Business Media B.V. 2017
indicated that individuals from both western and eastern colonies were migrating through this area, and hence the apparent segregation of the non-breeding distribution based on telemetry is invalid and cannot contribute to the popu-lation genetic structure among colonies. The genetic diver-gence among colonies is better explained by philopatry and evidence of differences in foraging strategies during the breeding season, as supported by the observed genetic divergence between Lord Howe Island and New Zea-land colonies. We suggest molecular analysis of fisheries’ bycatch individuals as a rigorous method to identify forag-ing segregation, and we recommend the eastern and west-ern A. carneipes colonies be regarded as different Manage-ment Units.
Keywords Oceanic seabirds · Ardenna carneipes · Gene flow · Genetic divergence · Foraging segregation · Genetic assignment · Conservation management
Abstract Increasing evidence suggests foraging segre-gation as a key mechanism promoting genetic divergence within seabird species. However, testing for a relationship between population genetic structure and foraging move-ments among seabird colonies can be challenging. Telem-etry studies suggest that Flesh-footed Shearwater Ardenna carneipes that breed at Lord Howe Island or New Zealand, versus southwestern Australia or Saint-Paul Island in the Indian Ocean, migrate to different regions (North Pacific Ocean and northern Indian Ocean, respectively) during the non-breeding season, which may inhibit gene flow among colonies. In this study, we sequenced a 858-base pair mitochondrial region and seven nuclear DNA fragments (352–654 bp) for 148 individuals to test genetic differen-tiation among colonies of Flesh-footed Shearwaters. Strong genetic divergence was detected between Pacific colonies relative to those further West. Molecular analysis of fish-eries’ bycatch individuals sampled in the Sea of Japan
Electronic supplementary material The online version of this article (doi:10.1007/s10592-017-0994-y) contains supplementary material, which is available to authorized users.
* Anicee J. Lombal [email protected]
Theodore J. Wenner [email protected]
Jennifer L. Lavers [email protected]
Jeremy J. Austin [email protected]
Eric J. Woehler [email protected]
Ian Hutton [email protected]
Christopher P. Burridge [email protected]
1 School of Biological Sciences, University of Tasmania, Hobart, TAS 7001, Australia
2 Institute for Marine and Antarctic Studies, University of Tasmania, Hobart, TAS 7004, Australia
3 Australian Centre for Ancient DNA, School of Biological Sciences, University of Adelaide, Adelaide, SA 5005, Australia
4 Lord Howe Island Museum, PO Box 157, Lord Howe Island, NSW 2898, Australia
Conserv Genet
1 3
Introduction
Understanding evolutionary processes and population dynamics within species is crucial to predict their long-term persistence and resilience to environmental pertur-bations (Avise and Hamrick 1996). This requires inves-tigating gene flow among populations to assess local extinction risk (Chepko-Sade and Halpin 1987; Ibrahim et al. 1996; Wright 1931). Isolation of populations can lead to genetic divergence, and often a decrease in genetic diversity through stochastic events such as genetic drift and increased inbreeding in small populations (Frankham 2010; Moritz 1999). This may increase extinction risk by reducing the potential for adaptation to future changes such as environmental variations and anthropogenic stressors, although gene flow can also inhibit adaptation by swamp-ing favoured alleles (Frankham 2005). Consequently, pre-dicting gene flow between populations based on factors such as wind-dispersed seeds in plants (Hamrick et al. 1992) or presence of pelagic larvae versus direct devel-opment in fishes (Dawson et al. 2014; Kyle and Boulding 2000) is highly desirable for identifying conservation pri-orities and maintaining viability of species (DeSalle and Amato 2004; Greenwood et al. 1978).
Among seabirds, several non-physical factors are asso-ciated with restricted movement and spatial structuring of genetic variation among colonies (Friesen et al. 2007). Although most seabird species have the ability to travel long distances (Shaffer et al. 2006), they also usually exhibit a high level of philopatry (Coulson 2001; Warham 1990), which appears to restrict gene flow among colo-nies in some species (Friesen et al. 2007; Friesen 2015). However, a number of seabird species showing philopatry do not present genetic structure among colonies (Austin et al. 1994; Avise et al. 1992; Lombal et al. 2016; Pearce et al. 2004; Roeder et al. 2001), such that philopatry is not always a predictor of population genetic structure or has not been accurately quantified in those species. Seabirds from different colonies also often display discrete foraging distri-butions during breeding or non-breeding seasons that may limit gene flow among populations and promote local dif-ferentiation (Catard et al. 2000; Peck and Congdon 2005).
Some seabirds that migrate to population-specific non-breeding areas appear to have less opportunity for gene flow among populations than those that have a single com-mon non-breeding area (Burg and Croxall 2001; Friesen et al. 2007; Friesen 2015; Kidd and Friesen 1998). For example, Burg and Croxall (2001) found that black-browed albatrosses Thalassarche spp. showing distinct foraging grounds during the non-breeding season differ genetically despite a lack of physical barriers to dispersal among colo-nies. However, segregation during the non-breeding season per se is unlikely to always explain restrictions in gene flow
among seabird colonies (Rayner et al. 2011a), as 63% of species whose populations overlap in non-breeding distri-bution show evidence of restrictions in gene flow among colonies (Friesen 2015). Population-specific foraging dis-tribution during the breeding season may also restrict gene flow among colonies (Friesen et al. 2007; Wiley et al. 2012). Hawaiian Petrels Pterodroma sandwichensis nesting on Hawaii versus Kauai and foraging in different areas dur-ing the breeding season exhibit significant spatial genetic structure (Wiley et al. 2012). However, a greater number of studies are required to test whether differences in foraging distributions influence genetic divergence between popula-tions, and to provide insights into behavioural and ecologi-cal mechanisms underlying the population genetic diversifi-cation of highly mobile taxa, such as seabirds.
Understanding the relationship between population genetic variation in seabirds and the foraging distributions of individuals from different colonies requires detailed information on the latter, yet these are often constrained by limited observations. Detailed observations of foraging movements are provided by telemetry studies, but these are typically restricted to a low number of individuals over a relatively short time interval (e.g., a single season), produc-ing temporally and spatially limited insights at best (Gen-ovart et al. 2007). Small rates of gene flow can strongly influence population genetic structure (Mills and Allendorf 1996; Slatkin 1987), and therefore foraging observations from a small number of individuals may be uninformative about rarer individual movements that can significantly influence genetic variation among colonies. In addition to telemetry, molecular analysis of fisheries’ bycatch indi-viduals can test foraging segregation by assigning birds to breeding colonies (Edwards et al. 2001) assuming that genetic structure exists among colonies; this approach has the potential to reject foraging segregation as a contributor to genetic structure.
The Flesh-footed Shearwater Ardenna carneipes is a species of oceanic seabird listed as vulnerable under the New South Wales (NSW) Threatened Species Conservation Act (1995) http://www.legislation.nsw.gov.au/. The species is a trans-equatorial migrant that breeds in northern New-Zealand, Lord Howe Island (Pacific Ocean), on islands off southwestern Australia and Saint-Paul Island (Indian Ocean) (Lavers 2014; Marchant and Higgins 1990; Waugh et al. 2013), and exhibits high fidelity to natal breeding sites as do most Procellariiformes (Brooke 2004; Warham 1990). Geolocation loggers deployed on 61 birds breeding in New Zealand (Rayner et al. 2011b; Waugh et al. 2016) and 57 breeders from Lord Howe Island (Reid et al. 2013b; Tuck and Wilcox 2010) showed that they transit through the central Pacific Ocean to the Sea of Japan for the non-breeding season. Conversely, GPS transmitters deployed on 13 breeders from southwestern Australia (Powell 2009;

Conserv Genet
1 3
Lavers, unpublished data) indicated migration in a north-western direction across the southern Indian Ocean to the Arabian Sea. Differences in foraging distribution during the breeding season have also been reported. Individuals breed-ing east of Australia are believed to forage in more inshore waters (<1000 km from land, Reid et al. 2012) and at a higher trophic level than individuals breeding on islands in Western Australia (Bond and Lavers 2014; Lindsey 1986; Taylor and Unit 2000).
Here, we generated a dataset of DNA sequences from one mitochondrial region and seven nuclear DNA frag-ments to test the hypothesis that eastern and western A. carneipes breeding colonies form two independent genetic clusters, as suggested by observed high philopatry and evidence of different foraging distributions and strategies during the breeding and non-breeding season. However, to more rigorously test the assumption of foraging segrega-tion during the non-breeding period, we inspected mtDNA sequences from fisheries’ bycatch individuals obtained in Japanese waters in the North Pacific Ocean. In addition, as Flesh-footed Shearwater colonies are threatened by
anthropological-driven changes, such as fisheries bycatch of individuals around their breeding colonies and dur-ing their transequatorial migration (Baker and Wise 2005; Waugh et al. 2016), which has led to a decline of ~40% of the world’s population (Lavers 2014; Reid et al. 2013a), we tested for historical population size variation to assess whether different foraging populations have experienced and survived similar demographic changes in the past.
Materials and methods
Sample collection
We collected blood samples from A. carneipes individu-als (n = 139) from 12 breeding colonies (Fig. 1; Table 1). Colonies were pooled into five geographic regions for analysis, with maximum inter-colony distance <150 km within a region and >2000 km between regions: Lord Howe Island (n = 43), New Zealand (n = 30), South Aus-tralia (n = 20), Western Australia (n = 45), Saint-Paul Island
Fig. 1 Sampling locations of Flesh-footed shearwaters (A. carneipes) and mtDNA haplotype network based on the TCS algorithm. a Sam-pling locations of breeding individuals: LHI Lord Howe Island, NZ New Zealand, SA South Australia, WA Western Australia, SPI Saint-Paul Island. NPO fisheries’ bycatch from the North Pacific Ocean. Pie charts representing shared versus pri-vate haplotypes of Cytochrome b. b Haplotype network of mtDNA sequences based on the TCS algorithm. Haplotypes are represented by circles, where the size of each circle is proportional to the frequency of the corresponding haplotype. Lines on connecting branches represent mutations
0 1250 2500 km
N
800 E 1000 E 1200 E 1400 E 1600 E 1800E
500S
400S
300S
200S
100S
SP
WA SALHI
NZ
NPO
LHINZSPNPOSAWA
10 samples
1 sample
(a)
(b)
Hap_1 Hap_2
Conserv Genet
1 3
(n = 1). Feathers sampled from a non-breeding area in the Sea of Japan, North Pacific Ocean (birds caught as fisheries bycatch in Japanese waters, n = 9), were provided by The Burke Museum. All blood samples from Lord Howe Island, Western Australia, South Australia and Lady Alice Island (New Zealand) were collected from Flesh-footed Shearwa-ters under Animal Ethics Permit number AEC 021028/02 issued by the Department of Environment, Climate Change and Water (DEWNR). The National Institute of Water and Atmospheric Research (NIWA) provided samples from the Coromandel Peninsula (New Zealand), and the Paris Museum provided the sample from Saint-Paul Island. Blood was preserved in Queen’s lysis buffer (Seutin et al. 1991). Museum Identification numbers are shown in the Electronic Supplementary Information SI 1.
Mitochondrial and nuclear DNA sequencing
Genomic DNA was extracted from 148 individuals using a Qiagen DNeasy® Blood and Tissue kit following the
manufacturer’s protocol. Extracted DNA was quanti-fied using a NanoDrop 8000 spectrophotometer (Thermo Fisher Scientific, USA). We determined the nucleotide sequences of a 858 bp fragment of the mitochondrial Cytochrome b gene for 145 A. carneipes individuals using primers L14841 and H15547 (Kocher et al. 1989), and 101–132 individuals for ~500 bp fragments of seven nuclear DNA fragments (4080, 18,503, 20,454, 22,519, Pema01, Pema07,Pema14) (Backström et al. 2008; Pat-terson et al. 2011; Silva et al. 2011). Amplification of nuclear DNA from fisheries’ bycatch samples was unsuc-cessful. The exact number of individuals sequenced for each locus from the five regions (Lord Howe Island, New Zealand, South Australia, Western Australia, Saint-Paul Island) and the non-breeding area in the North Pacific Ocean and associated GenBank Accession numbers are shown in the Electronic Supplementary Information SI 2. Primer sequences, optimal annealing temperatures and approximate locus length for seven nuclear DNA
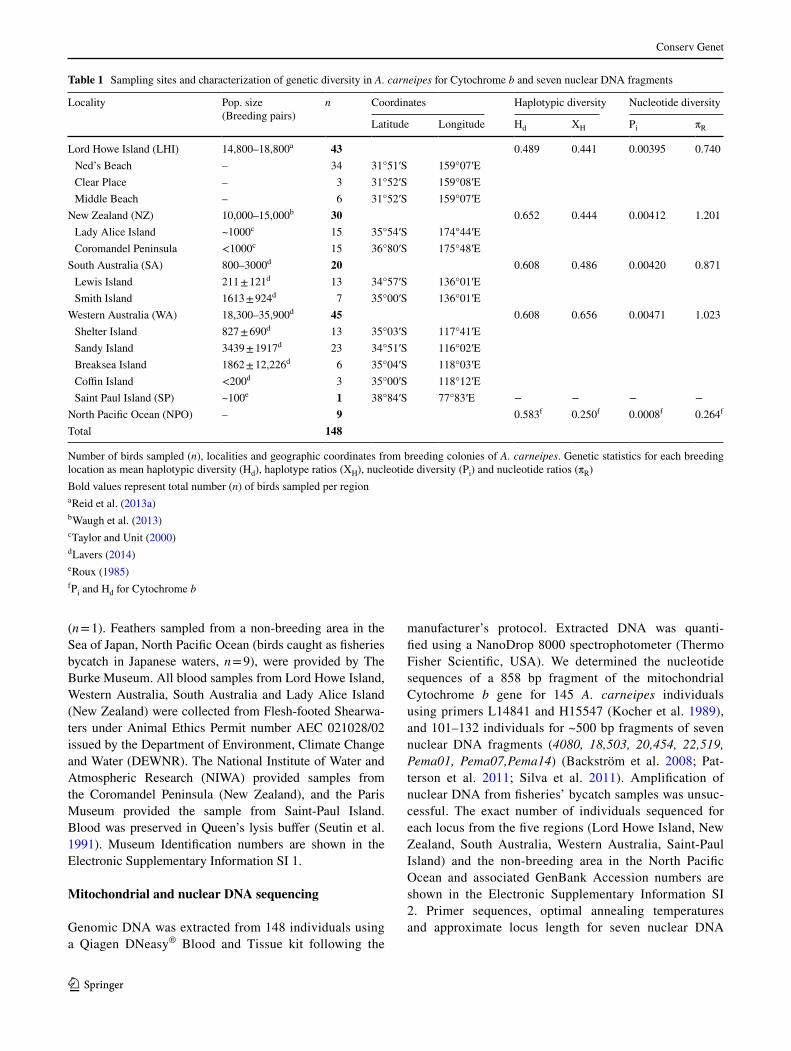
Table 1 Sampling sites and characterization of genetic diversity in A. carneipes for Cytochrome b and seven nuclear DNA fragments
Number of birds sampled (n), localities and geographic coordinates from breeding colonies of A. carneipes. Genetic statistics for each breeding location as mean haplotypic diversity (Hd), haplotype ratios (XH), nucleotide diversity (Pi) and nucleotide ratios (πR)Bold values represent total number (n) of birds sampled per regiona Reid et al. (2013a)b Waugh et al. (2013)c Taylor and Unit (2000)d Lavers (2014)e Roux (1985)f Pi and Hd for Cytochrome b
Locality Pop. size(Breeding pairs)
n Coordinates Haplotypic diversity Nucleotide diversity
Latitude Longitude Hd XH Pi πR
Lord Howe Island (LHI) 14,800–18,800a 43 0.489 0.441 0.00395 0.740 Ned’s Beach – 34 31°51′S 159°07′E Clear Place – 3 31°52′S 159°08′E Middle Beach – 6 31°52′S 159°07′E
New Zealand (NZ) 10,000–15,000b 30 0.652 0.444 0.00412 1.201 Lady Alice Island ~1000c 15 35°54′S 174°44′E Coromandel Peninsula <1000c 15 36°80′S 175°48′E
South Australia (SA) 800–3000d 20 0.608 0.486 0.00420 0.871 Lewis Island 211 ± 121d 13 34°57′S 136°01′E Smith Island 1613 ± 924d 7 35°00′S 136°01′E
Western Australia (WA) 18,300–35,900d 45 0.608 0.656 0.00471 1.023 Shelter Island 827 ± 690d 13 35°03′S 117°41′E Sandy Island 3439 ± 1917d 23 34°51′S 116°02′E Breaksea Island 1862 ± 12,226d 6 35°04′S 118°03′E Coffin Island <200d 3 35°00′S 118°12′E Saint Paul Island (SP) ~100e 1 38°84′S 77°83′E − − − −
North Pacific Ocean (NPO) – 9 0.583f 0.250f 0.0008f 0.264f
Total 148

Conserv Genet
1 3
fragments in A. carneipes are shown in the Electronic Supplementary Information SI 3.
All fragments were PCR amplified with MangoTaq™ DNA polymerase following the manufacturer’s protocol (Bioline Inc.). PCR reactions were performed in 25 µL using 50–100 ng DNA, and final concentrations of 0.5 U DNA polymerase, 0.2 mM of each dNTP, 1.5 mM MgCl2 and 0.3 µM of each primer. The thermal cycling profiles included an initial denaturation at 95 °C for 1 min followed by 29 cycles of denaturation at 95 °C for 30 s, annealing for 40 s, and extension of 72 °C for 90 s, with a final extension of 72 °C for 10 min. Negative controls were included with each set of PCRs.
Nucleotide sequences were determined on both strands of PCR products using a 3730xl DNA Analyzer (Applied Biosystem®) at Macrogen Inc., Korea. Sequences were aligned using the MUSCLE algorithm (Edgar 2004) in CODONCODE ALIGNER v3.7.1.1 (CodonCode Cor-poration). For nuclear DNA sequences containing multi-ple heterozygous positions, we used the Bayesian method implemented in PHASE v2.2.1 (Stephens et al. 2001) to reconstruct the haplotype phase of the sequences. We ran the algorithm three times from different starting points to verify convergence with 10,000 iterations per locus, and discarded the first 1000 samples as burn-in and the out-put probability threshold was set to 80%. The program SEQPHASE (Flot 2010) was used during this process.
Quantifying and testing assumptions of genetic variation
Haplotypic diversity h (Nei 1987) and nucleotide diversity π (Tajima 1983) were calculated for mtDNA and nuclear DNA sequences with SPADS v 1.0 (Dellicour and Mardu-lyn 2014). To detect potential hotspots of genetic diversity (e.g., refuge or secondary contact zones), haplotype ratios XH, and nucleotide diversity ratios πR (Mardulyn et al. 2009) were calculated for each region. To test whether pat-terns of genetic variation deviated from neutral expecta-tions, Tajima’s D (Tajima 1983) and Fu and Li’s D* (Fu and Li 1993) tests were performed using DNASP v 5.10 (Librado and Rozas 2009) for each region, and for all indi-viduals grouped as a single population, for each genetic marker.
Population genetic structure
Estimates of population differentiation (Fst, Gst and Nst) among four regions (Lord Howe Island, New Zealand, South Australia and Western Australia) were determined for Cytochrome b and seven nuclear DNA fragments using SPADS. Fisheries’ bycatch individuals sampled during the non-breeding period in the Sea of Japan were only included
in population differentiation analyses for Cytochrome b to assess their genetic connectivity with individuals sampled from the four breeding regions. The statistical significance of indices was assessed by 10,000 random permutations of individuals among geographical regions. TCS haplotype networks (Clement et al. 2000) were inferred for mitochon-drial and nuclear DNA sequences, and the frequencies of haplotypes depicted using PopART (http://popart.otago.ac.nz).
To define best clustering (K) of regions a posteriori based on genetic differentiation (Lord Howe Island, New Zealand, South Australia and Western Australia), AMOVA Φ-statistics (ΦSC ΦST ΦCT) (Excoffier et al. 1992) were calculated on all loci for K = 2 (seven possible group-ings), K = 3 (six possible groupings) and K = 4 (Table 3) with 10,000 permutations of individuals among regions using SPADS. AMOVA Φ-statistics were also calculated for Cytochrome b only for K = 2–4 following the same procedure.
Gene flow and divergence times
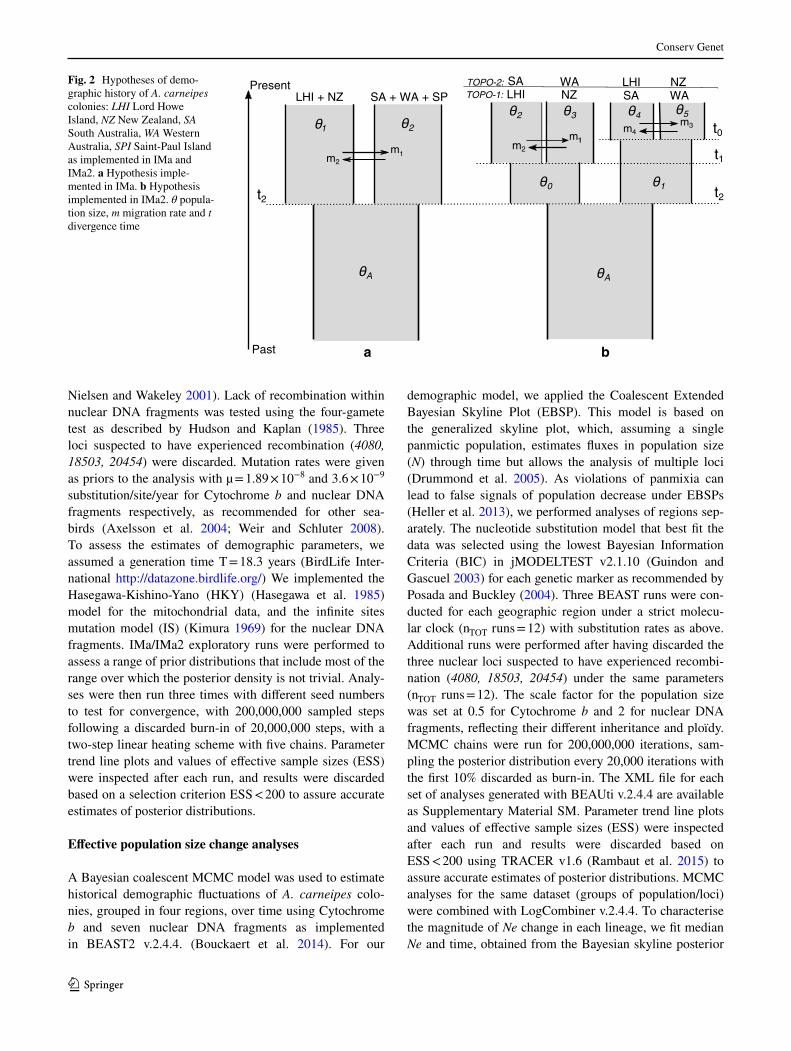
As Fst cannot distinguish between a situation of high gene flow among colonies that have diverged a long time, from one of a relatively recent shared history but no ongoing gene flow, we used the isolation with migration model (Hey 2010) to assess the demographic history of A. car-neipes colonies. Two methods were used for comparison. First, we estimated the time of divergence between eastern (Lord Howe Island and New Zealand) and western (South Australia, Western Australia and Saint Paul Island) regions considering the best genetic clustering as K = 2 (Fig. 2a). We used IMa and its model of isolation with migration (Hey and Nielsen 2007) to simultaneously estimate migra-tion (m) and lineage divergence time (t) between these two groups of colonies. Second, we assessed demographic his-tory of A. carneipes considering K = 4, with four regions (Lord Howe Island, New Zealand, South Australia, West-ern Australia) (Fig. 2b). Here, we used IMa2 (Hey 2010), that allows analysis of more than two regions. We defined the topology of the population tree implemented for the four distinct regions, and information on the ordering of the internal nodes in time, based on F-statistics and AMOVA Φ-statistics (ΦSC ΦST ΦCT). Alternate topologies were also tested (Fig. 2b) to investigate potential bias of the results due to incorrect assumption of the topology and the order-ing of internal nodes. Only gene flow between sister pop-ulations was allowed to reduce the number of parameters and the size of the overall model (Hey 2010).
The isolation with migration model is based on sev-eral assumptions including neutrality, random mating in ancestral and descendent populations, and free recombina-tion between but not within loci (Hey and Nielsen 2004;
Conserv Genet
1 3
Nielsen and Wakeley 2001). Lack of recombination within nuclear DNA fragments was tested using the four-gamete test as described by Hudson and Kaplan (1985). Three loci suspected to have experienced recombination (4080, 18503, 20454) were discarded. Mutation rates were given as priors to the analysis with µ = 1.89 × 10⁻⁸ and 3.6 × 10⁻⁹ substitution/site/year for Cytochrome b and nuclear DNA fragments respectively, as recommended for other sea-birds (Axelsson et al. 2004; Weir and Schluter 2008). To assess the estimates of demographic parameters, we assumed a generation time T = 18.3 years (BirdLife Inter-national http://datazone.birdlife.org/) We implemented the Hasegawa-Kishino-Yano (HKY) (Hasegawa et al. 1985) model for the mitochondrial data, and the infinite sites mutation model (IS) (Kimura 1969) for the nuclear DNA fragments. IMa/IMa2 exploratory runs were performed to assess a range of prior distributions that include most of the range over which the posterior density is not trivial. Analy-ses were then run three times with different seed numbers to test for convergence, with 200,000,000 sampled steps following a discarded burn-in of 20,000,000 steps, with a two-step linear heating scheme with five chains. Parameter trend line plots and values of effective sample sizes (ESS) were inspected after each run, and results were discarded based on a selection criterion ESS < 200 to assure accurate estimates of posterior distributions.
Effective population size change analyses
A Bayesian coalescent MCMC model was used to estimate historical demographic fluctuations of A. carneipes colo-nies, grouped in four regions, over time using Cytochrome b and seven nuclear DNA fragments as implemented in BEAST2 v.2.4.4. (Bouckaert et al. 2014). For our
demographic model, we applied the Coalescent Extended Bayesian Skyline Plot (EBSP). This model is based on the generalized skyline plot, which, assuming a single panmictic population, estimates fluxes in population size (N) through time but allows the analysis of multiple loci (Drummond et al. 2005). As violations of panmixia can lead to false signals of population decrease under EBSPs (Heller et al. 2013), we performed analyses of regions sep-arately. The nucleotide substitution model that best fit the data was selected using the lowest Bayesian Information Criteria (BIC) in jMODELTEST v2.1.10 (Guindon and Gascuel 2003) for each genetic marker as recommended by Posada and Buckley (2004). Three BEAST runs were con-ducted for each geographic region under a strict molecu-lar clock (nTOT runs = 12) with substitution rates as above. Additional runs were performed after having discarded the three nuclear loci suspected to have experienced recombi-nation (4080, 18503, 20454) under the same parameters (nTOT runs = 12). The scale factor for the population size was set at 0.5 for Cytochrome b and 2 for nuclear DNA fragments, reflecting their different inheritance and ploïdy. MCMC chains were run for 200,000,000 iterations, sam-pling the posterior distribution every 20,000 iterations with the first 10% discarded as burn-in. The XML file for each set of analyses generated with BEAUti v.2.4.4 are available as Supplementary Material SM. Parameter trend line plots and values of effective sample sizes (ESS) were inspected after each run and results were discarded based on ESS < 200 using TRACER v1.6 (Rambaut et al. 2015) to assure accurate estimates of posterior distributions. MCMC analyses for the same dataset (groups of population/loci) were combined with LogCombiner v.2.4.4. To characterise the magnitude of Ne change in each lineage, we fit median Ne and time, obtained from the Bayesian skyline posterior
Fig. 2 Hypotheses of demo-graphic history of A. carneipes colonies: LHI Lord Howe Island, NZ New Zealand, SA South Australia, WA Western Australia, SPI Saint-Paul Island as implemented in IMa and IMa2. a Hypothesis imple-mented in IMa. b Hypothesis implemented in IMa2. θ popula-tion size, m migration rate and t divergence time
Present
Past
t2 t2
t1
t0
SA + WA + SPLHI + NZ LHI NZ SA WA
m1
m1
m3m4
N2 N3 N4
a b
2
A A
0 1
2 3 4 5
m2
1
m2
SA WA LHI NZTOPO-1:TOPO-2:

Conserv Genet
1 3
distribution, to a linear model using a modified version of the plotEBSPR script (http://beast2.org/tutorials/) imple-mented in R v.3.1.2.
Results
We sequenced 858 bp of the mtDNA Cytochrome b gene, and a total of 3328 bp comprising seven nuclear DNA fragments in up to 148 A. carneipes individuals from five breeding regions (Lord Howe Island, New Zealand, South Australia, Western Australia and Saint-Paul Island), and one non-breeding area (Sea of Japan in the North Pacific Ocean). No length mutations were observed. A total of 16 (Cytochrome b), 24 (4080), 21 (18503), 40 (20454), 7 (22519), 5 (Pema01), 10 (Pema07) and 14 (Pema14) hap-lotypes were defined. Variable sites in the mtDNA marker Cytochrome b, shared (Hap_1 and Hap_2) vs. private (Hap_A–N) haplotypes, nucleotide and codon positions of variable sites, and substitution type (all are transitions), are shown in Supplementary Information SI 4. Global haplo-typic diversity (Hd) and nucleotide diversity (Pi) for each region are reported in Table 1. Hd and Pi for each genetic marker and each colony are reported in Supplementary Information SI 5. No significant difference in global nucle-otide diversities (π) among regions was detected (One-way ANOVA; H0 = means of π are equal in all regions; F1,4 = 0.033; p value = 0.992; see π values combined over all loci in Table 1). Tajima’s D showed significant positive values in one nuclear locus (20454) for all regions and when all individuals were grouped as a single population (Supple-mentary Information SI 6). Fu and Li’s D* tests showed positive values for the same nuclear locus (20454) in New Zealand and South Australia (Supplementary Information SI 6).
Population genetic structure
Haplotype networks (mtDNA, Fig. 1b; nuclear DNA frag-ments, Supplementary Information SI 7), mtDNA haplo-type frequencies (Fig. 1a) and significant F-statistic val-ues over eight loci (global Fst = 0.202, p < 0.005; global Gst = 0.118, p < 0.005) for mitochondrial and nuclear DNA sequences support strong structure of genetic vari-ation among regions. A significant phylogeographic sig-nal (global Nst = 0.132, p < 0.005) supports these results. The Fst pairwise matrix indicated a greater genetic struc-ture between the eastern (Lord Howe Island and New Zea-land) and the western (South Australia, Western Australia and Saint-Paul Island) parts of the breeding distribution, but still with significant difference between New Zealand and Lord Howe Island (Table 2). The magnitude of popu-lation genetic differentiation at the mtDNA marker was
in all cases higher than at nuclear DNA. No significant genetic structure was observed between Western Australia and South Australia. For Cytochrome b, significant Fst was observed among fisheries’ bycatch individuals from the North Pacific Ocean and eastern regions (Lord Howe Island, New Zealand), but not from western regions (South and Western Australia). The common haplotype from western regions was represented in the single Saint-Paul Island individual, but further samples are required to assess whether the Saint Paul Island colony is distinct from other western regions. Two private haplotypes were observed in the fisheries’ bycatch samples.
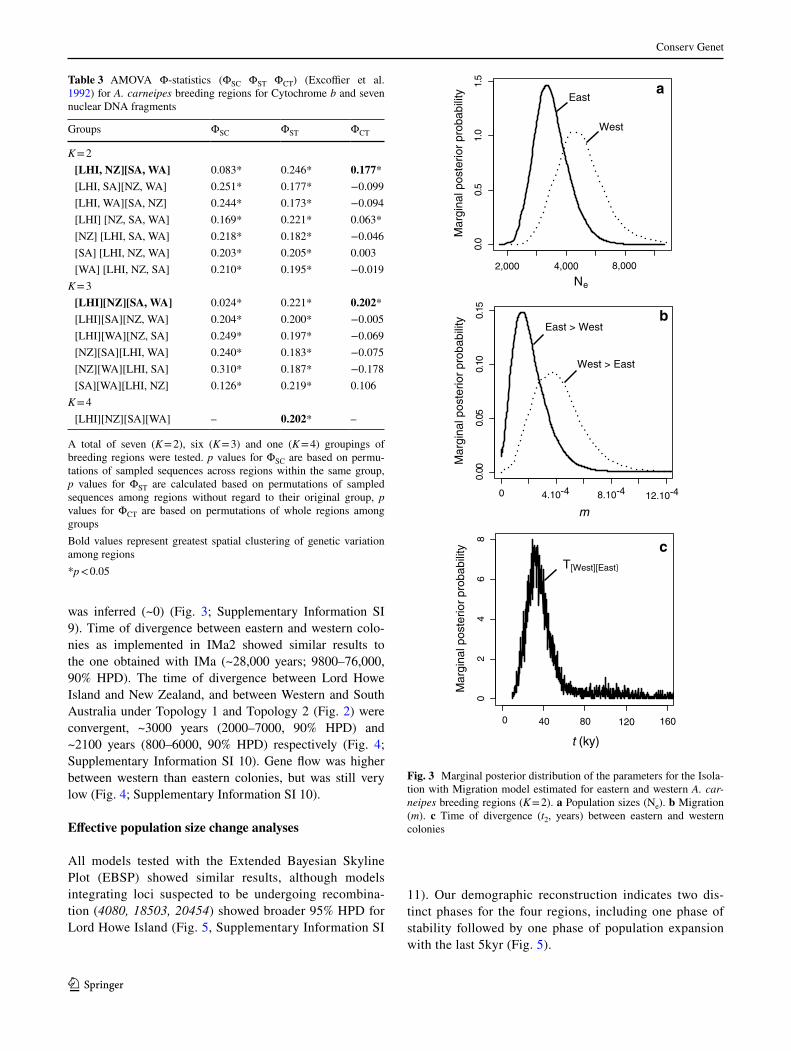
AMOVA Φ-statistics on combined genetic markers showed that greatest spatial structuring of genetic variation for clustering K = 2 was eastern and western regions (Group 1 = Lord Howe Island, New Zealand; Group 2 = South Aus-tralia, Western Australia, Saint-Paul Island, Table 3) where 17.7% of variance was explained by the region grouping. For K = 3, the greatest spatial structuring was as above but Lord Howe Island and New Zealand separated (Group 1 = Lord Howe Island, Group 2 = New Zealand, Group 3 = South Australia, Western Australia, Saint-Paul Island, Table 3), where 20.2% of variance was explained by the region grouping. AMOVA Φ-statistics for Cytochrome b showed the same greatest spatial structures as above for K = 2 where 71.4% of variance was explained by the region grouping, and K = 3 where 70% of variance was explained by the region grouping (Supplementary Information SI 8).
Gene flow and divergence times
Implementations of the isolation-with-migration models (IMa and IMa2) using nuclear DNA fragments and mito-chondrial DNA resulted in unimodal posterior density curves of migration parameters, which were convergent across runs. The time of divergence between eastern and western colonies as implemented in IMa was ~28,000 years ago (11,700–100,000, 90% HPD), and very low gene flow
Table 2 Pairwise differentiation matrix among A. carneipes colonies including fisheries’ bycatch individuals from the North Pacific Ocean
Below diagonal: pairwise Fst matrix combined for Cytochrome b and seven nuclear DNA fragments. Above diagonal: pairwise Fst matrix for Cytochrome b*p values <0.00833 after sequential Bonferonni correction
LHI NZ SA WA NPO
Lord Howe Island (LHI) – 0.457* 0.964* 0.768* 0.904*New Zealand (NZ) 0.139* – 0.824* 0.609* 0.667*South Australia (SA) 0.333* 0.253* – 0.080 0.119Western Australia (WA) 0.238* 0.190* 0.019 – −0.085North Pacific Ocean
(NPO)– – – – –
Conserv Genet
1 3
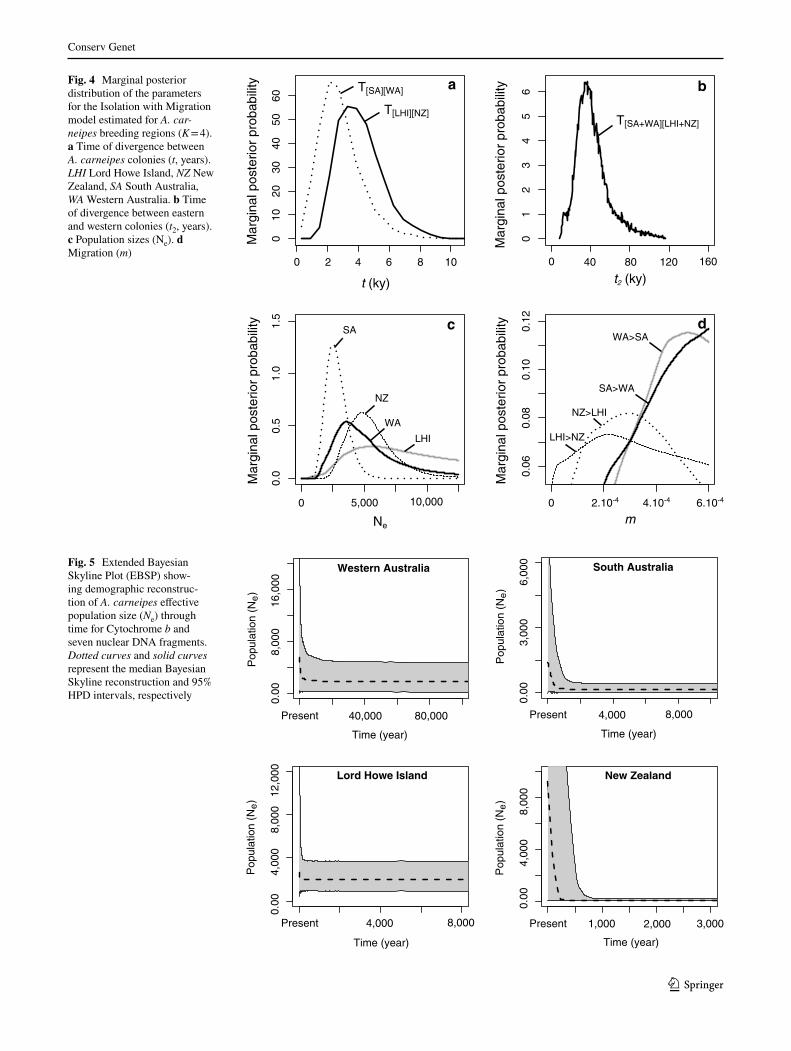
was inferred (~0) (Fig. 3; Supplementary Information SI 9). Time of divergence between eastern and western colo-nies as implemented in IMa2 showed similar results to the one obtained with IMa (~28,000 years; 9800–76,000, 90% HPD). The time of divergence between Lord Howe Island and New Zealand, and between Western and South Australia under Topology 1 and Topology 2 (Fig. 2) were convergent, ~3000 years (2000–7000, 90% HPD) and ~2100 years (800–6000, 90% HPD) respectively (Fig. 4; Supplementary Information SI 10). Gene flow was higher between western than eastern colonies, but was still very low (Fig. 4; Supplementary Information SI 10).
Effective population size change analyses
All models tested with the Extended Bayesian Skyline Plot (EBSP) showed similar results, although models integrating loci suspected to be undergoing recombina-tion (4080, 18503, 20454) showed broader 95% HPD for Lord Howe Island (Fig. 5, Supplementary Information SI
11). Our demographic reconstruction indicates two dis-tinct phases for the four regions, including one phase of stability followed by one phase of population expansion with the last 5kyr (Fig. 5).
Table 3 AMOVA Φ-statistics (ΦSC ΦST ΦCT) (Excoffier et al. 1992) for A. carneipes breeding regions for Cytochrome b and seven nuclear DNA fragments
A total of seven (K = 2), six (K = 3) and one (K = 4) groupings of breeding regions were tested. p values for ΦSC are based on permu-tations of sampled sequences across regions within the same group, p values for ΦST are calculated based on permutations of sampled sequences among regions without regard to their original group, p values for ΦCT are based on permutations of whole regions among groupsBold values represent greatest spatial clustering of genetic variation among regions*p < 0.05
Groups ΦSC ΦST ΦCT
K = 2 [LHI, NZ][SA, WA] 0.083* 0.246* 0.177* [LHI, SA][NZ, WA] 0.251* 0.177* −0.099 [LHI, WA][SA, NZ] 0.244* 0.173* −0.094 [LHI] [NZ, SA, WA] 0.169* 0.221* 0.063* [NZ] [LHI, SA, WA] 0.218* 0.182* −0.046 [SA] [LHI, NZ, WA] 0.203* 0.205* 0.003 [WA] [LHI, NZ, SA] 0.210* 0.195* −0.019
K = 3 [LHI][NZ][SA, WA] 0.024* 0.221* 0.202* [LHI][SA][NZ, WA] 0.204* 0.200* −0.005 [LHI][WA][NZ, SA] 0.249* 0.197* −0.069 [NZ][SA][LHI, WA] 0.240* 0.183* −0.075 [NZ][WA][LHI, SA] 0.310* 0.187* −0.178 [SA][WA][LHI, NZ] 0.126* 0.219* 0.106
K = 4 [LHI][NZ][SA][WA] – 0.202* –
0.0
0.5
1.0
1.5
Mar
gina
l pos
terio
r pr
obab
ility
2,000 8,0004,000
Ne
a
0
0.00
0.05
0.10
0.15
m
Mar
gina
l pos
terio
r pr
obab
ility
8.10-44.10-4 12.10-4
0
02
46
8
Mar
gina
l pos
terio
r pr
obab
ility
40 80 120 160
t (ky)
East
West
East > West
West > East
T[West][East]
b
c
Fig. 3 Marginal posterior distribution of the parameters for the Isola-tion with Migration model estimated for eastern and western A. car-neipes breeding regions (K = 2). a Population sizes (Ne). b Migration (m). c Time of divergence (t2, years) between eastern and western colonies
Conserv Genet
1 3
Fig. 4 Marginal posterior distribution of the parameters for the Isolation with Migration model estimated for A. car-neipes breeding regions (K = 4). a Time of divergence between A. carneipes colonies (t, years). LHI Lord Howe Island, NZ New Zealand, SA South Australia, WA Western Australia. b Time of divergence between eastern and western colonies (t2, years). c Population sizes (Ne). d Migration (m)
010
2030
4050
60
Mar
gina
l pos
terio
r pr
obab
ility
01
23
45
6
Mar
gina
l pos
terio
r pr
obab
ility
0
0.0
0.5
1.0
1.5
Mar
gina
l pos
terio
r pr
obab
ility
0
0.06
0.08
0.10
0.12
m
Mar
gina
l pos
terio
r pr
obab
ility
2 40 6 8 10
t (ky)
0 40 80 120 160
t2 (ky)
Ne
2.10-4 4.10-4 6.10-4
SA
NZ
WA
LHI LHI>NZ
NZ>LHI
SA>WA
WA>SA
a b
c d
T[LHI][NZ]
T[SA][WA]
T[SA+WA][LHI+NZ]
5,000 10,000
Fig. 5 Extended Bayesian Skyline Plot (EBSP) show-ing demographic reconstruc-tion of A. carneipes effective population size (Ne) through time for Cytochrome b and seven nuclear DNA fragments. Dotted curves and solid curves represent the median Bayesian Skyline reconstruction and 95% HPD intervals, respectively
Present
0.00
8,
000
16,0
00
Time (year)
Pop
ulat
ion
(Ne)
Present
0.00
3,00
0
6,0
00
Time (year)
Pop
ulat
ion
(Ne)
Present
0.00
4,00
0
8,0
00
12,0
00
Time (year)
Pop
ulat
ion
(Ne)
Present
0.00
4,0
00
8
,000
Time (year)
Pop
ulat
ion
(Ne)
Western Australia South Australia
Lord Howe Island New Zealand
40,000 80,000 4,000 8,000
4,000 8,000 1,000 2,000 3,000

Conserv Genet
1 3
Discussion
Genetic differentiation among A. carneipes colonies
Haplotype networks, AMOVA F-statistics, and Isola-tion with Migration models for mitochondrial and nuclear DNA sequences, indicated low gene flow and long diver-gence between A. carneipes colonies breeding east of Aus-tralia (Lord Howe Island and New Zealand) and western breeding colonies (Western Australia, South Australia, and Saint-Paul Island). The divergence between these regions (~28,000 years) roughly corresponds to the begin-ning of the Last Glacial Maximum (LGM). Previous stud-ies showed that in seabirds, availability of new breeding habitat due to sea level change and the latitudinal migra-tion of oceanic fronts influenced their global distribution and phylogeographic structure (Techow et al. 2010). Since the Flesh-footed Shearwater populations diverged, gene flow between eastern and western colonies has possibly been restricted by unsuitable breeding areas throughout the southeastern coast of Australia (Byrne 2008; Peck and Congdon 2004), as well as sea level changes leading to the relocation of breeding colonies during periods of warming and exposure of Bass Strait (Dartnall 1974; Lambeck et al. 2002). Northward range shifts may also have increased the isolation of eastern and western populations, as has been hypothesized for other temperate marine Australian taxa (Burridge 2000; Fraser et al. 2009). In addition, the star-like phylogeny of both the western and eastern regions may reflect spatially distinct refugia, which is consistent with areas of climatic suitability from species distribution mod-eling with projected LGM climatic conditions (Buckley et al. 2010; Nistelberger et al. 2014), followed by a range expansion. However, old divergences and an apparent lack of contemporary gene flow between eastern and western regions provide evidence of signatures of both historical and contemporary processes affecting the genetic structure of A. carneipes colonies.
Overlap in non-breeding distributions between colonies
Despite suggestions from telemetry of distinct routes of migration and distribution of individuals from western and eastern colonies during the non-breeding season, individu-als sampled during the non-breeding period in the Sea of Japan were assigned to eastern and western colonies. A majority of fisheries’ bycatch specimens (66%) possessed Haplotype_1, which has only otherwise been observed from Western and South Australia, where it is common (75% of individuals). As this haplotype was not observed among 73 individuals sampled from Lord Howe Island and New Zealand, if it exists there, its frequency is less than 1.5%. Therefore, it is unlikely that the presence of
Haplotype_1 in a high proportion of bycatch individuals from the Sea of Japan can be explained in the absence of migration by Western or South Australian individuals. The only possible alternate explanation is that western birds founded a new and presently unsampled and unknown colony in the eastern part of the species range, and these birds have adopted the migration route of Lord Howe and New Zealand individuals, and somehow constituted a large proportion of our bycatch sample, despite their source col-ony being undocumented. However, each of these required events (establishment of new colony in the east by western individuals, presently unknown colony, adoption of new migration route, and majority composition of the bycatch samples despite their source colony being unknown to sci-ence) seems unlikely, and in combination, discount the possibility that Western or South Australian birds are not migrating to the Sea of Japan in the North Pacific Ocean. Furthermore, the stable isotope and trace element analysis conducted by Lavers et al. (2013) also suggested that some Sea of Japan bycatch individuals were derived from West-ern and South Australian breeding colonies. Based on our observations, previous studies may have falsely invoked distinct non-breeding distributions for population genetic structure in seabirds in instances where there are limited data supporting distinction of non-breeding distributions. As a result, genetic structure among Flesh-footed Shearwa-ter colonies can hardly be explained by distinct non-breed-ing distribution.
Foraging distinction between eastern and western colonies during the breeding season
Significant genetic differentiation inferred between Lord Howe Island and New Zealand A. carneipes breeding colo-nies, as previously observed in a study using microsatel-lite markers (Hardesty et al. 2013), supports differences in foraging strategy during the breeding season as a fac-tor influencing dispersal between A. carneipes colonies, rather than geographic distances or differences in migration routes. The Flesh-footed Shearwater is a central place for-ager restricted within a certain range of their breeding site (Ashmole 1971), and has been shown to return to similar foraging areas during the breeding season from 1 year to the next (Kinsky 1957; Reid 2011). Individuals breeding on Lord Howe Island forage off the east coast of Australia not further than 1000 km from their breeding sites (Reid et al. 2012; Thalmann et al. 2009), as expected in migra-tory central-place foragers (Orians and Pearson 1979). This preference for foraging areas likely reflects western bound-ary currents moving south along the east coast of Australia that drive strong oceanographic features such as up-well-ings in the Tasman Sea, increasing prey availability in this area (Ridgway and Dunn 2003). Conversely, A. carneipes

Conserv Genet
1 3
individuals breeding on New Zealand islands mostly forage over continental shelves north of the sub-tropical conver-gence (Rayner et al. 2011b; Waugh et al. 2016).
Isotopic ratio analysis and shipboard observations sug-gest that individuals from eastern and western regions have distinct foraging strategies. Individuals breeding east of Australia may forage in more inshore waters (<1000 km, Reid et al. 2012) and at a higher trophic level than indi-viduals breeding at western colonies, believed to forage in offshore waters (Bond and Lavers 2014; Lombal, unpub-lished data). This may be explained by El Niño–Southern Oscillations (ENSO) events affecting the Cape Leeuwin Current near the western coast of Australia and lower asso-ciated prey availability, and the increase of industrial fish-ing in this region (Bond and Lavers 2014; Cheung et al. 2012; Lindsey 1986; Taylor and Unit 2000). These obser-vations are compatible with distinct foraging distributions during the breeding season affecting gene flow among Flesh-footed Shearwater colonies, which is consistent with Friesen (2015) showing that 91% of seabird species that either feed inshore or have population-specific forag-ing areas show some evidence of restriction in gene flow among colonies.
Intraspecific morphological variation and taxonomic status
Our observations of spatial genetic variation are consist-ent with previous morphological differences observed between Flesh-footed Shearwaters. Hindwood (1945) rec-ognized two subspecies: Puffinus carneipes carneipes at the Recherche Archipelago and other islands of south-west Western Australia, and Puffinus carneipes hullianus for Lord Howe Island and New Zealand, differing from the nominate subspecies by a more robust bill and longer wing. While Flesh-footed Shearwaters from eastern and western colonies do not show reciprocal monophyly for mtDNA alleles, this could be explained by the rapid evolution of phenotypic variation compared to sorting of MtDNA vari-ation in abundant taxa, which can take tens of thousands of years to evolve (Avise 2000; Mayr 1970). In addition, as both petrels and albatrosses show unusually low levels of genetic divergence (Nunn and Stanley 1998), the power of genetic analysis to resolve taxonomic uncertainties is usu-ally reduced in Procellariiformes (Abbott and Double 2003; Burg and Croxall 2001).
It is often difficult to determine whether populations have diverged to the extent that they should be consid-ered as distinct species (Harrison 1998; Sites and Mar-shall 2004). Speciation is thought to be a gradual process in animals, with complete reproductive isolation develop-ing at the final stage (Mayr 1963). As a result, the Biologi-cal Species Concept (BSP; Mayr 1942) defines species as
reproductively isolated groups of populations, which can only be directly observed if populations coexist in space and time, and therefore does not apply to allopatric popula-tions (Helbig et al. 2002; Mayr and Short 1970; McKitrick and Zink 1988). Conversely, the Phylogenetic Species Con-cept (PSC; Cracraft 1983) argues that reproductive isola-tion should not be a part of species concepts, and instead requires that (a) species be monophyletic groups, and (b) species be distinguishable from other such groups in one or more characters (i.e., diagnosability, Helbig et al. 2002). The recognition of Evolutionary Significant Units (ESU, Avise 1989) also requests reciprocal monophyly for mtDNA alleles but only significant divergence of allele frequencies at nuclear loci, as this concept considers phylogenetically unsorted alleles at nuclear loci. These requirements are comparable to the Agreement on the Conservation of Alba-trosses and Petrels (ACAP) guidelines adapted from Helbig et al. (2002), which has adapted the concept of monophyly by the condition that taxa are ‘likely to retain their genetic and phenotypic integrity in the future’ (ACAP Document 11 of AC2).
Moritz (1994) stressed that populations that do not show reciprocal monophyly for mtDNA alleles, yet have diverged in allele frequencies, are significant for conservation in that they represent populations connected by such low levels of gene flow that they are functionally independent. Therefore, Management Units (MUs) are recognized as populations with significant divergence of allele frequencies at nuclear or mitochondrial loci, regardless of the phylogenetic dis-tinctiveness of the alleles; MUs address current popula-tion structure, allele frequencies and short-term manage-ment issues (Moritz 1994). Eastern and western colonies of Flesh-footed Shearwaters may not represent cryptic species under the PCS given their lack of phylogeographic struc-ture but evidence of morphometric differences and strong divergence in allele frequencies among colonies give strong support that they are functioning as separate entities and that they should be considered as independent MUs. The Flesh-footed Shearwater likely represents a case of incipi-ent speciation, and for which taxonomic decision remains difficult.
Detection of demographic changes
Overall, the similarity of coalescent histories among colo-nies indicates that, although genetically independent, they have homologous demographic histories, including one phase of stability followed by one recent period of popu-lation expansion, occurring in the last 5kyr. This may be explained by population expansion associated with the LGM, as observed in many high latitude seabird popu-lations (Congdon et al. 2000; Hewitt 2000), although the timing of expansion is much more recent in this case.
Conserv Genet
1 3
Furthermore, while coalescent theory is a powerful tool to extract historical demographic information from DNA sequences (Hudson 1990), Grant (2015) observed that small and very recent population expansions often appear in Bayesian Skyline Plots of simulated populations that did not experience a sudden recent change in size. In fact, this pattern frequently reflects random sampling of the MCMC haplotype trees (Grant 2015). The flat portion of the BSP, usually interpreted as population stability, is also often misleading as population contractions can promote extinc-tions of haplotype lineages leading to the loss of informa-tion about earlier population history (Grant 2015). In addi-tion, as slightly deleterious mutations are slowly eliminated by selection, preventing low-frequency mutations from moving to higher frequencies (Charlesworth et al. 1993), haplotype frequency distributions shaped by selection are difficult to distinguish from distributions produced by a population expansion. For these reasons, and because of the lack of additional significant evidence of demographic changes in Flesh-footed Shearwater colonies, our BSPs results need to be interpreted cautiously, and may not repre-sent evidence for novelty of the presently observed popula-tion declines.
Consequences for conservation status of Flesh-footed Shearwaters
In this study, we show a lack of gene flow between A. carneipes colonies from Lord Howe Island, New Zea-land and localities to the west, indicating that popula-tions have clearly experienced independent evolution for a long time, which may greatly affect long-term viability and persistence of the species within these regions owing to local adaptation and demography independence. The Flesh-footed Shearwater is now listed as Near Threatened in Birdlife International (2017) IUCN Red list for birds (http://www.birdlife.org), and therefore there is an urgent need to develop a suite of mitigation measures that would reduce the level of bycatch currently being experienced in each of these regions.
Acknowledgements South Australia Nature Foundation, Trading Consultants (V. Wellington), Pennicott Wilderness Journeys and the Winifred Violet Scott Charitable Trust provided funding for the field and laboratory components of this research. Special thanks go to C. & G. Biddulph, P. Collins, A. Fidler, S. Goldsworthy, M. Stadler, the South Australian Department of Environment, Water & Natural Resources (DEWNR), and Western Australian Department of Parks and Wildlife (DPaW) for generously providing data and logistical support. This research was undertaken with animal ethic permissions from DPaW (SF009585), the University of Tasmania Animal Ethics committee (A13598 and A13836), DEWNR Resources permits (AEC 021028/02), and Lord Howe Island Board permits (LHIB 07/12 & LHIB 02/14). We thank the anonymous reviewers for their careful reading of our paper.
Author contributions AL, JL and IH performed the sample collec-tion. AL and TW collected the molecular data. AL performed the sta-tistical and Bayesian analyses. CB and JL designed the study. AL, CB, JL, IH, JA and EW contributed to the manuscript.
References
Abbott CL, Double MC (2003) Genetic structure, conservation genet-ics and evidence of speciation by range expansion in shy and white-capped albatrosses. Mol Ecol 12:2953–2962
Ashmole NP (1971) Seabird ecology and the marine environment. Avian Biol 1:223–286
Austin JJ, White RW, Ovenden JR (1994) Population-genetic struc-ture of a philopatric, colonially nesting seabird, the Short-tailed Shearwater (Puffinus tenuirostris). Auk 111:70–79
Avise JC (1989) A role for molecular genetics in the recognition and conservation of endangered species. Trends Ecol Evol 4:279–281
Avise JC (2000) Phylogeography: the history and formation of spe-cies. Harvard University Press, Cambridge
Avise JC, Hamrick JL (1996) Conservation genetics: case histories from nature. Chapman & Hall, UK
Avise JC, Alisauskas RT, Nelson WS, Ankney CD (1992) Matriarchal population genetic structure in an avian species with female natal philopatry. Evol Int J Org Evol 46:1084–1096
Axelsson E, Smith NG, Sundström H, Berlin S, Ellegren H (2004) Male-biased mutation rate and divergence in autosomal, Z-linked and W-linked introns of chicken and turkey. Mol Biol Evol 21:1538–1547
Backström N, Fagerberg S, Ellegren H (2008) Genomics of natural bird populations: a gene-based set of reference markers evenly spread across the avian genome. Mol Ecol 17:964–980
Baker GB, Wise BS (2005) The impact of pelagic longline fishing on the flesh-footed shearwater Puffinus carneipes in Eastern Aus-tralia. Biol Conserv 126:306–316
Bond AL, Lavers JL (2014) Climate change alters the trophic niche of a declining apex marine predator. Glob Change Biol 20:2100–2107
Bouckaert R et al (2014) BEAST 2: a software platform for Bayesian evolutionary analysis. PLoS Comput Biol 10:e1003537
Brooke M (2004) Albatrosses and petrels across the world. Oxford University Press, England
Buckley TR, Marske K, Attanayake D (2010) Phylogeography and ecological niche modelling of the New Zealand stick insect Clitarchus hookeri (White) support survival in multiple coastal refugia. J Biogeogr 37:682–695
Burg T, Croxall J (2001) Global relationships amongst black-browed and grey-headed albatrosses: analysis of population struc-ture using mitochondrial DNA and microsatellites. Mol Ecol 10:2647–2660
Burridge CP (2000) Biogeographic history of geminate cirrhitoids (Perciformes: Cirrhitoidea) with east–west allopatric distri-butions across southern Australia, based on molecular data. Global Ecol Biogeogr 9:517–525
Byrne M (2008) Evidence for multiple refugia at different time scales during Pleistocene climatic oscillations in southern Australia inferred from phylogeography. Quaternary Sci Rev 27:2576–2585
Catard A, Weimerskirch H, Cherel Y (2000) Exploitation of distant Antarctic waters and close shelf-break waters by white-chinned petrels rearing chicks. Mar Ecol-Prog Ser 194:249–261
Conserv Genet
1 3
Charlesworth B, Morgan M, Charlesworth D (1993) The effect of deleterious mutations on neutral molecular variation. Genetics 134:1289–1303
Chepko-Sade BD, Halpin ZT (1987) Mammalian dispersal patterns: the effects of social structure on population genetics. University of Chicago Press, USA
Cheung WW et al (2012) Climate-change induced tropicalisation of marine communities in Western Australia. Mar Freshwater Res 63:415–427
Clement M, Posada D, Crandall KA (2000) TCS: a computer program to estimate gene genealogies. Mol Ecol 9:1657–1659
Congdon BC, Piatt JF, Martin K, Friesen VL (2000) Mechanisms of population differentiation in marbled murrelets: historical ver-sus contemporary processes. Evol Int J org Evol 54:974–986
Coulson JC (2001) Biology of marine birds. CRC Press, USADartnall MA (1974) Littoral biogeography. In: Biogeography and
ecology in Tasmania. Springer, Netherlands, pp 171–194Dawson MN, Hays CG, Grosberg RK, Raimondi PT (2014) Dispersal
potential and population genetic structure in the marine inter-tidal of the eastern North Pacific. Ecol Monogr 84:435–456
Dellicour S, Mardulyn P (2014) SPADS 1.0: a toolbox to perform spatial analyses on DNA sequence data sets. Mol. Ecol Res 14:647–651
DeSalle R, Amato G (2004) The expansion of conservation genetics. Nature Rev Genet 5:702–712
Drummond AJ, Rambaut A, Shapiro B, Pybus OG (2005) Bayesian coalescent inference of past population dynamics from molecu-lar sequences. Mol Biol Evol 22:1185–1192
Edgar RC (2004) MUSCLE: multiple sequence alignment with high accuracy and high throughput. Nucleic Acids Res 32:1792–1797
Edwards SV, Silva MC, Burg T, Friesen V, Warheit KI Molecular genetic markers in the analysis of seabird bycatch populations. In: Proceedings of the Symposium Seabird Bycatch: Trends, Roadblocks and Solutions, 2001. pp 115–140
Excoffier L, Smouse PE, Quattro JM (1992) Analysis of molecular variance inferred from metric distances among DNA haplo-types: application to human mitochondrial DNA restriction data. Genetics 131:479–491
Flot JF (2010) SeqPHASE: a web tool for interconverting PHASE input/output files and FASTA sequence alignments. Mol Ecol Res 10:162–166
Frankham R (2005) Genetics and extinction. Biol Conserv 126:131–140
Frankham R (2010) Where are we in conservation genetics and where do we need to go? Conserv Genet 11:661–663
Fraser CI, Spencer HG, Waters JM (2009) Glacial oceanographic con-trasts explain phylogeography of Australian bull kelp. Mol Ecol 18:2287–2296
Friesen VL (2015) Speciation in seabirds: why are there so many spe-cies… and why aren’t there more? J Ornithol 156:27–39
Friesen V, Burg T, McCoy K (2007) Mechanisms of population dif-ferentiation in seabirds. Mol Ecol 16:1765–1785
Fu Y-X, Li W-H (1993) Statistical tests of neutrality of mutations. Genetics 133:693–709
Genovart M, Oro D, Juste J, Bertorelle G (2007) What genetics tell us about the conservation of the critically endangered Balearic Shearwater? Biol Conserv 137:283–293
Grant WS (2015) Problems and cautions with sequence mismatch analysis and Bayesian skyline plots to infer historical demogra-phy. J Hered 106:333–346
Greenwood PJ, Harvey PH, PERRINS CM (1978) Inbreeding and dis-persal in the great tit. Nature 271:52–54
Guindon S, Gascuel O (2003) A simple, fast, and accurate algorithm to estimate large phylogenies by maximum likelihood. Syst Biol 52:696–704
Hamrick JL, Godt MJW, Sherman-Broyles SL (1992) Factors influ-encing levels of genetic diversity in woody plant species. New For 6:95–124
Hardesty B, Metcalfe S, Wilcox C (2013) Genetic variability and population diversity as revealed by microsatellites for Flesh-footed Shearwaters (Puffinus carneipes) in the Southern Hem-isphere. Conserv Genet Resour 5:27–29
Harrison RG (1998) Linking evolutionary pattern and process. End-less Forms 19–31
Hasegawa M, Kishino H, Yano T-a (1985) Dating of the human-ape splitting by a molecular clock of mitochondrial DNA. J Mol Evol 22:160–174
Helbig AJ, Knox AG, Parkin DT, Sangster G, Collinson M (2002) Guidelines for assigning species rank. Ibis 144:518–525
Heller R, Chikhi L, Siegismund HR (2013) The confounding effect of population structure on Bayesian skyline plot inferences of demographic history. PloS ONE 8:e62992
Hewitt G (2000) The genetic legacy of the Quaternary ice ages. Nature 405:907–913
Hey J (2010) Isolation with migration models for more than two populations. Mol Biol Evol 27:905–920
Hey J, Nielsen R (2004) Multilocus methods for estimating popula-tion sizes, migration rates and divergence time, with applica-tions to the divergence of Drosophila pseudoobscura and D. persimilis. Genetics 167:747–760
Hey J, Nielsen R (2007) Integration within the Felsenstein equation for improved Markov chain Monte Carlo methods in popula-tion genetics. Proc Natl Acad Sci USA 104:2785–2790
Hindwood K (1945) The Fleshy-footed Shearwater (Puffinus car-neipes). Emu 44:241–248
Hudson RR (1990) Gene genealogies and the coalescent process. Oxford Surv Evol Biol 7:44
Hudson RR, Kaplan NL (1985) Statistical properties of the number of recombination events in the history of a sample of DNA sequences. Genetics 111:147–164
Ibrahim KM, Nichols RA, Hewitt GM (1996) Spatial patterns of genetic variation generated by different forms of dispersal. Heredity 77:282–291
Kidd MG, Friesen VL (1998) Sequence variation in the Guille-mot (Alcidae: Cepphus) mitochondrial control region and its nuclear homolog. Mol Biol Evol 15:61–70
Kimura M (1969) The number of heterozygous nucleotide sites maintained in a finite population due to steady flux of muta-tions. Genetics 61:893
Kinsky F (1957) 7th annual report of the Ornithological Society of New Zealand Ringing Committee for the year ending 31 March 1957. Notornis 7:123–135
Kocher TD, Thomas WK, Meyer A, Edwards SV, Pääbo S, Villablanca FX, Wilson AC (1989) Dynamics of mitochon-drial DNA evolution in animals: amplification and sequenc-ing with conserved primers. Proc Natl Acad Sci USA 86:6196–6200
Kyle C, Boulding E (2000) Comparative population genetic struc-ture of marine gastropods (Littorina spp.) with and without pelagic larval dispersal. Mar Biol 137:835–845
Lambeck K, Yokoyama Y, Purcell T (2002) Into and out of the Last Glacial Maximum: sea-level change during Oxygen Isotope Stages 3 and 2. Quaternary Sci Rev 21:343–360
Lavers JL (2014) Population status and threats to Flesh-footed Shearwaters (Puffinus carneipes) in South and Western Aus-tralia. ICES J Mar Sci 72(2):316–327
Lavers JL, Bond AL, Van Wilgenburg SL, Hobson KA (2013) Linking at-sea mortality of a pelagic shearwater to breeding colonies of origin using biogeochemical markers. Mar Ecol-Prog Ser 491:265–275
Conserv Genet
1 3
Librado P, Rozas J (2009) DnaSP v5: a software for comprehen-sive analysis of DNA polymorphism data. Bioinformatics 25:1451–1452
Lindsey T (1986) The seabirds of Australia. Angus & Robertson, National Photographic Index of Australian Wildlife, Australia
Lombal AJ, Wenner TJ, Carlile N, Austin JJ, Woehler E, Priddel D, Burridge CP (2016) Population genetic and behavioural varia-tion of the two remaining colonies of Providence petrel (Ptero-droma solandri). Conserv Genet 1–13
Marchant S, Higgins P (1990) Handbook of Australian, New Zealand and Antarctic birds. vol 1: Ratites to Ducks, Part A-Ratites to Petrels, Part B-Australian Pelican to Ducks. Oxford University Press, Australia
Mardulyn P, Mikhailov YE, Pasteels JM (2009) Testing phylogeo-graphic hypotheses in a Euro-Siberian cold-adapted leaf beetle with coalescent simulations. Evol Int J Org Evol 63:2717–2729
Mayr E (1942) Systematics and the origin of species, from the view-point of a zoologist. Harvard University Press, USA
Mayr E (1963) Animal species and evolution, vol 797. Belknap Press of Harvard University Press Cambridge, USA
Mayr E (1970) Populations, species, and evolution: an abridgment of animal species and evolution. Harvard University Press, USA
Mayr E, Short LL (1970) Species taxa of North American birds: a contribution to comparative systematics. Harvard University Press, USA
McKitrick MC, Zink RM (1988) Species concepts in ornithology. Condor 90:1–14
Mills LS, Allendorf FW (1996) The one-migrant-per-generation rule in conservation and management. Conserv Biol 10:1509–1518
Moritz C (1994) Defining ‘evolutionarily significant units’ for conser-vation. Trends Ecol Evol 9:373–375
Moritz C (1999) Conservation units and translocations: strategies for conserving evolutionary processes. Hereditas 130:217–228
Nei M (1987) Molecular evolutionary genetics. Columbia university Press, USA
Nielsen R, Wakeley J (2001) Distinguishing migration from isolation: a Markov chain Monte Carlo approach. Genetics 158:885–896
Nistelberger H, Gibson N, Macdonald B, Tapper S, Byrne M (2014) Phylogeographic evidence for two mesic refugia in a biodiver-sity hotspot. Heredity 113:454–463
Nunn GB, Stanley SE (1998) Body size effects and rates of cytochrome b evolution in tube-nosed seabirds. Mol Biol Evol 15:1360–1371
Orians GH, Pearson NE (1979) On the theory of central place for-aging. Analysis of Ecological Systems Ohio State University Press, Columbus, pp 155–177
Patterson S, Morris-Pocock J, Friesen V (2011) A multilocus phy-logeny of the Sulidae (Aves: Pelecaniformes). Mol Phylogenet Evol 58:181–191
Pearce JM, Talbot SL, Pierson BJ, Petersen MR, Scribner KT, Dick-son DL, Mosbech A (2004) Lack of spatial genetic structure among nesting and wintering King Eiders. Condor 106:229–240
Peck DR, Congdon BC (2004) Reconciling historical processes and population structure in the sooty tern Sterna fuscata. J Avian Biol 35:327–335
Peck DR, Congdon BC (2005) Colony-specific foraging behav-iour and co-ordinated divergence of chick development in the wedge-tailed shearwater Puffinus pacificus. Mar Ecol-Prog Ser 299:289–296
Posada D, Buckley TR (2004) Model selection and model averaging in phylogenetics: advantages of Akaike information criterion and Bayesian approaches over likelihood ratio tests. Syst Biol 53:793–808
Powell CD (2009) Foraging movements and the migration trajectory of Flesh-footed Shearwaters Puffinus carneipes from the south coast of Western Australia. Mar Ornithol 37:115–120
Rambaut A, Suchard MA, Xie D, Drummond AJ (2015) Tracer v1. 6. 2014, Available from http://beast.bio.ed.ac.uk/Tracer
Rayner MJ et al (2011a) Contemporary and historical separation of transequatorial migration between genetically distinct seabird populations. Nat Commun 2:332
Rayner MJ, Taylor GA, Thompson DR, Torres LG, Sagar PM, Shaffer SA (2011b) Migration and diving activity in three non-breeding flesh-footed shearwaters Puffinus carneipes. J Avian Biol 42:266–270
Reid TA (2011) Modelling the foraging ecology of the Flesh-footed Shearwater Puffinus carneipes in relation to fisheries and oceanography. Ph.D. Thesis, University of Tasmania
Reid TA, Hindell MA, Wilcox C (2012) Environmental determi-nants of the at-sea distribution of encounters between Flesh-footed Shearwaters Puffinus carneipes and fishing vessels. Mar Ecol-Prog Ser 447:231–242
Reid T, Hindell M, Lavers JL, Wilcox C (2013a) Re-examining mortality sources and population trends in a declining sea-bird: using Bayesian methods to incorporate existing informa-tion and new data. PloS ONE 8:e58230
Reid TA, Tuck GN, Hindell MA, Thalmann S, Phillips RA, Wilcox C (2013b) Nonbreeding distribution of Flesh-footed Shearwa-ters and the potential for overlap with north Pacific fisheries. Biol Conserv 166:3–10
Ridgway K, Dunn J (2003) Mesoscale structure of the mean East Australian Current System and its relationship with topogra-phy. Progr Oceanogr 56:189–222
Roeder AD et al (2001) Gene flow on the ice: genetic differentiation among Adélie penguin colonies around Antarctica. Mol Ecol 10:1645–1656
Roux J (1985) Status of Puffinus carneipes in Saint Paul Island (38843′S, 77830′E). L’oiseau et la Revue Francaise D’Ornithologie 55:155–157
Seutin G, White BN, Boag PT (1991) Preservation of avian blood and tissue samples for DNA analyses. Can J Zool 69:82–90
Shaffer SA et al (2006) Migratory shearwaters integrate oceanic resources across the Pacific Ocean in an endless summer. Proc Natl Acad Sci USA 103:12799–12802
Silva MC, Duarte MA, Coelho MM (2011) Anonymous nuclear loci in the White-faced Storm-Petrel Pelagodroma marina and their applicability to other Procellariiform seabirds. J Hered 102:362–365
Sites JW, Marshall JC (2004) Operational criteria for delimiting species. Annu Rev Ecol Evol Syst 35:199–227
Slatkin M (1987) Gene flow and the geographic structure of natural populations. Science 236:787–793
Stephens M, Smith NJ, Donnelly P (2001) A new statistical method for haplotype reconstruction from population data. Am J Hum Genet 68:978–989
Tajima F (1983) Evolutionary relationship of DNA sequences in finite populations. Genetics 105:437–460
Taylor GA, Unit BR (2000) Action plan for seabird conservation in New Zealand. Biodiversity Recovery Unit, Department of Conservation, New Zealand
Techow N et al (2010) Speciation and phylogeography of giant pet-rels Macronectes. Mol Phylogenet Evol 54:472–487
Thalmann SJ, Baker GB, Hindell M, Tuck GN (2009) Longline fisheries and foraging distribution of Flesh-footed Shearwa-ters in Eastern Australia. J Wildl Manage 73:399–406
Tuck GN, Wilcox C (2010) Assessing the potential impacts of fishing on the Lord Howe Island population of Flesh-footed Shearwaters. CSIRO Marine and Atmospheric Research, Tasmania
Warham J (1990) The petrels: their ecology and breeding systems. A&C Black, United Kingdom

Conserv Genet
1 3
Waugh SM, Tennyson A, Taylor GA, Wilson K-J (2013) Population sizes of shearwaters (Puffinus spp.) breeding in New Zealand, with recommendations for monitoring. Tuhinga 24:159–204
Waugh SM, Patrick SC, Filippi DP, Taylor GA, Arnould JP (2016) Overlap between Flesh-footed Shearwater Puffinus carneipes foraging areas and commercial fisheries in New Zealand waters. Mar Ecol-Prog Ser 551:249–260
Weir J, Schluter D (2008) Calibrating the avian molecular clock. Mol Ecol 17:2321–2328
Wiley AE et al (2012) Foraging segregation and genetic divergence between geographically proximate colonies of a highly mobile seabird. Oecologia 168:119–130
Wright S (1931) Evolution in Mendelian populations. Genetics 16:97