Embed Size (px)
Citation preview

GENETIC DISSECTION OF SORGHUM HEIGHT AND MATURITY VARIATION USING SORGHUM CONVERTED LINES AND THEIR EXOTIC PROGENITORS
BY
RACE H. HIGGINS
THESIS
Submitted in partial fulfillment of the requirements for the degree of Master of Science in Crop Sciences
in the Graduate College of the University of Illinois at Urbana-Champaign, 2013
Urbana, Illinois
Adviser: Assistant Professor Patrick Brown

ii
ABSTRACT
Sorghum is a photoperiod-sensitive, short-day tropical species that shows long
delays in flowering at temperate latitudes. Most temperate-adapted sorghum cultivars are
photoperiod-insensitive and dwarfed for grain production. Classical segregation studies
predict that temperate adaptedness involves four major loci each for maturity and
dwarfing. Two major maturity loci, Ma1 (PRR37) and Ma3 (phytochrome B), and a single
major dwarfing locus, Dw3 (PGP1/br2), have been cloned. Sorghum conversion (SC) lines
are exotic varieties that have been introgressed with early maturity and dwarfing QTL from
a common, temperate-adapted donor using a minimum of four backcrosses. In this study
partially-isogenic populations were generated by crossing six diverse SC lines to their
corresponding exotic progenitor (EP) lines to assess the phenotypic effects of individual
introgressions from the temperate-adapted donor. Initial genotyping results revealed one
of the six populations resulted from an outcross. In summer 2012, 192 F3 lines from the
five remaining populations were phenotyped for plant height and maturity. Subsets of 109-
175 F3 lines were genotyped using Illumina genotyping-by-sequencing (GBS) and used for
QTL analysis. QTL models explained 62.31-88.16% of the phenotypic variation for height
and maturity in these partially isogenic populations. Nearly all variation was accounted for
by the linked Ma1/Dw2 loci on chromosome 6 and the Dw3 and Dw1 loci on chromosomes
7 and 9 respectively. The Dw1 locus fractionated into linked QTL for height and maturity,
and a novel height QTL on chromosome 3 was discovered. Evidence is presented for
multiple functionally distinct alleles at Ma1, and for large differences in recombination rate
among populations on chromosome 6. Candidate genes underlying QTL for Dw2, Dw1, and
the new Dw1-linked maturity locus on chromosome 9 are discussed.

iii
Table of Contents
Introduction & Literature Review .................................................................................................................. 1
Methods ................................................................................................................................................................. 13
Results and Discussion .................................................................................................................................... 17
Conclusion............................................................................................................................................................. 35
Literature Cited ................................................................................................................................................... 37
Appendix A ........................................................................................................................................................... 41
Appendix B ........................................................................................................................................................... 45
Appendix C ............................................................................................................................................................ 46

1
Introduction & Literature Review
Sorghum (Sorghum bicolor (L) Moench), a C4 grass and relative of maize, ranks fifth
in global cereal production and is an important source of food, feed, fiber and fuel. Sorghum
was domesticated approximately 3000 years ago in Ethiopia, with additional centers of
origin in parts of the Congo, India, Sudan, and Nigeria (Ayana and Bekele 1998). Sorghum is
especially adapted to growth in hot, arid, or semi-arid climates. This water-efficient crop
requires fewer inputs than maize, with drier states such as Kansas, Texas, Nebraska,
Oklahoma, and Missouri producing most of the grain sorghum grown in the U.S. The U.S.
exports almost half of the sorghum it produces, controlling 70% to 80% of world exports,
where the other one-third of domestic production goes towards biofuels such as ethanol, in
comparison to global production, where over half of the sorghum grown is for human
consumption (“Environmental Protection Agency” 2013).
The genus Sorghum encompasses many species, including perennials S. halapense
(Johnson grass), S. propinquum, S. almum, and S. nitidum, and the annual Sorghum bicolor
which contains wild, weedy, and cultivated taxa. Sorghum has a genome size of 736 Mb and
is diploid. Its relatively small genome makes it a suitable model for other related crops with
much larger genomes or polyploidy, such as sugar cane. This provided the justification for
sorghum being the third plant species to have its genome sequenced. An 8x draft sequence
of cultivar BTx623 was released in 2007. (Nelson et al. 2011).
Cultivated Sorghum bicolor is traditionally classified into five races: bicolor, guinea,
caudatum, kafir, and durra (John Roy Quinby 1974). This classification is based on the
phenotypic characteristics of the spikelet and panicle. A study using a genetic data set of

2
434 single nucleotide polymorphisms and simple sequence repeat alleles in a 216 exotic
sorghum line panel found genetic groups that correspond closely to the guinea, caudatum,
kafir, and durra races of sorghum, but bicolor was paraphyletic (Patrick J. Brown, Myles,
and Kresovich 2011). Bicolor sorghums have a wide geographical distribution, are diverse,
and are more likely than other races to resemble wild sorghums. Guinea sorghums are
adapted to moist environments and originate in western Africa, spreading into eastern
Africa and India. They are characterized by long, loose, open inflorescence architecture.
Caudatum sorghums originate from eastern and central Africa and have excellent seed
quality for grain sorghum breeding, with dense to slightly open panicles. Kafir sorghums
originate from southern Africa and also play an important role in grain sorghum breeding,
with erect, cylindrical panicles. Durra sorghums are found within arid environments in
India and the Horn of Africa, and are identified by dense and compact inflorescence
structure (Brown, Myles, and Kresovich 2011). Because of the variability found in each race
and intermediates between races, the five races have been further subdivided into 70
working groups (Quinby 1974).
Apart from the phenotypic races, sorghum is classified into four groups based on
utility: dwarf grain sorghum, juicy-stemmed sweet sorghum, grassy forage sorghums, and
broomcorn. Recently, a new group consisting of photoperiod-sensitive biomass sorghums
has been developed to be utilized for bioenergy production. With its high yield potential,
established production systems, and high water-use efficiency (Jakob, Zhou, and Paterson
2009), sorghum is an ideal candidate for bioenergy production. The U.S. has made
significant investments in basic research and technology to reach the Congressionally
mandated target of 36 billion gallons (136 billion liters) of renewable liquid biofuel per

3
year by 2022 (Dweikat et al. 2012). Sorghum grown for bioenergy production systems has
the advantage of being established by seed, along with the potential to be perennialized
(Rooney et al. 2007), in comparison to current perennial candidates propagated by
rhizomatous plugs. Bioenergy sorghum differs from other temperate-grown sorghums by
being fully photoperiod-sensitive to produce maximum biomass by prolonged vegetative
growth.
Many elite agronomic traits exist in locally adapted grain and sweet types, such as
disease resistance and cold tolerance, but the majority of the diversity found in sorghum is
in exotic tropical accessions (Billot et al. 2013). Studies of pedigree records and
comparative molecular assays suggest that sorghum genotypes grown in the U.S. represent
only a fraction of the full range of diversity that exists in the species (Ahnert et al. 1996).
The International Crops Research Institute for the Semi-Arid Tropics (ICRISAT) and the U.S.
National Plant Germplasm System (NPGS) have taken the initiative to collect and discover
existing sorghum diversity through building their sorghum collections to approximately
35,000-40,000 accessions (“GRIN NPGS” 2013).
Several diversity studies on sorghum have been done using restriction fragment
length polymorphisms (RFLPS), random amplified polymorphic DNA (RAPDs), simple
sequence repeats (SSRs), amplified fragment length polymorphisms (AFLPS), and single
nucleotide polymorphisms (SNPS)(Morris et al. 2013; Ahnert et al. 1996; S. Smith et al.
2010; Agrama and Tuinstra 2004; Casa et al. 2005; Robert R. Klein et al. 2008). Sorghum is
primarily a self-pollinating crop, but will readily outcross. Reflecting this pattern, sorghum
has lower linkage disequilibrium (LD) than rice, another self-pollinating species with less
tendency to outcross, and much higher LD than outcrossing maize (Morris et al. 2013) . The

4
average extent of LD decay has been previously reported at 15–20 kb (Hamblin et al. 2005)
and 50–100 kb (Bouchet et al. 2012), with the most recent reported rate of 150 kb (Morris
et al. 2013). Of the major races, bicolor is the most genetically diverse, supporting the
hypothesis that bicolor is the progenitor Sorghum bicolor from which other cultivated races
evolved. The lowest genetic diversity is seen in the kafir race, found primarily in South
Africa, which may reflect a more recent origin of this race when it split from the eastern
guineas ( Brown, Myles, and Kresovich 2011).
A recent study identified the Sh1 gene responsible for seed shattering in sorghum,
and showed that it encodes a YABBY transcription factor (Z. Lin et al. 2012). Three
independent loss-of-function alleles of Sh1 confer loss of seed shattering in different races
of cultivated sorghum (Olsen 2012). Because seed shattering is one of the key traits
distinguishing wild and cultivated grasses, these data suggest that independent
domestication events may have given rise to the different races of cultivated sorghum.
Hybrid seed production in sorghum relies on cytoplasmic male sterility (CMS). The
A1 sterile cytoplasm is nearly universally used and relies on the interaction between kafir
nuclear genes, specifically the Rf1 locus (R. R. Klein et al. 2006) and durra cytoplasm. For
this reason, most of the elite female lines for widespread commercial hybrid production
today are derived from kafir germplasm.
Sorghum was introduced into the United States from Africa around 1874-1908. A
diverse but limited number of founder cultivars, including “milo” (durra), guinea, and kafir,
were widely planted, and spontaneous mutations for dwarfing and early maturity were
selected in individual plants during hand harvest. By 1960, 95% of U.S. sorghum was
planted to hybrids within this severely bottlenecked founder pool (S. Smith et al. 2010).

5
Plant breeders and scientists recognized that this could cause problems through common
susceptibility to new diseases or abiotic stresses. Though there were many diverse
accessions in the world sorghum collection, most of these could not be utilized in the U.S.
for breeding because of their photoperiod-sensitivity and extreme height. A program was
set in place to “convert” many of these accessions to photoperiod-insensitivity and reduced
height in order to increase their utility for commercial grain sorghum breeding (John Roy
Quinby 1974). Dwarfing and maturity genes from the very dwarf, photoperiod-insensitive
Figure 1 The Sorghum Conversion program. An elite, early-maturing, dwarf donor line, BTx406, was used to introgress QTL for early maturity and dwaring into ~800 exotic sorghum accessions. Early-maturing dwarf plants were selected from the selfed progeny of each backcross. After five backcrosses, most of the exotic progenitor’s genome is recovered in a sorghum converted (SC) line that is early and short.

6
BTx406 cultivar were introgressed into the exotic accessions using a backcrossing scheme
(fig 1). The initial cross was made in Puerto Rico between the exotic progenitor parent and
BTx406, resulting in a photoperiod-sensitive, tall F1. The F2 self-pollinated seed from selfed
F1 plants was planted in Texas where short, early maturing plants were selected. Seed from
selected early dwarfs was sent back to Puerto Rico to repeat the backcrossing cycle up to five
times. The final products were a series of sorghum converted (SC) lines, having the
cytoplasm and up to 99% of the genes from the exotic progenitor parent and the introgressed
maturity and height QTL from BTx406.
Introgressed regions still remaining after five backcrosses from the donor BTx406
are putative height and maturity QTL. To identify the number and location of QTL for these
traits, partially-isogenic populations can be constructed using the exotic progenitor (EP)
lines and their corresponding SC lines as parents. Partially-isogenic lines from these
populations can then be identified to study the individual and interaction effects of the
introgressed QTL in multiple combinations. With over 673 SC lines generated (Patrick J.
Brown and Paterson 2013), multiple partially-isogenic populations can be constructed to
study QTL effects in different genetic backgrounds. Identifying these height and maturity
QTL and characterizing the underlying genes will accelerate population improvement and
gene flow between diverse exotic accessions and elite temperate material.
Sorghum varies widely in height. Wild-type and traditional landrace sorghums grow
up to 3-4 meters (J. R. Quinby and Karper 1953). This is desirable for subsistence
agricultural systems where stover is used as building materials or fed to livestock. But in
response to mechanized agricultural systems, grain sorghums have been developed with
reduced height using recessive brachytic height mutations. Genetic control of sorghum

7
height has been classically determined to result from four height mutations designated as
dw1, dw2 dw3, and dw4 (J. R. Quinby and Karper 1953). Most commercial grain sorghums
contain three of the four height mutations in various combinations. Though other height
mutants have been recognized, only the four brachytic mutations (which affect only
internode length) are utilized for breeding purposes. Dw2 is linked to Ma1 on chromosome
6, based on a previous observation that these two were linked (John Roy Quinby 1974).
Dw1 is hypothesized to be Sb-HT9.1 on chromosome 9 (Patrick J. Brown et al. 2008).
Recessive dw4 exists in most US sorghum accessions, with the exception of tall broomcorn
varieties. Previous QTL analyses for both maturity and height in sorghum show that
relatively few loci are involved in controlling these traits (Pereira et al. 1994; Lin, Schertz,
and Paterson 1995).
Only one height mutant has been cloned, dw3, which encodes a P-glycoprotein that
modulates polar auxin transport (Multani et al. 2003). The recessive dw3 allele is
characterized by an 882–base pair direct duplication found in exon 5. Direct duplications
are prone to unequal crossovers, which is responsible for the frequent restoration of tall,
wild-type phenotypes in fields of dwarf sorghum. Tall revertants have been observed as
commonly as 1 out of every 600 plants (1 in 1,200 gametes) in genotypes with the unstable
dw3 duplication (Karper 1932). Unequal crossovers have also resulted in base pair
deletions around exon 5. These dw3 mutants, unlike those with the tandem repeat, are
stable and are currently being used for grain sorghum improvement (Mitchell Reed
Tuinstra and Johal 2013; Multani et al. 2003). Dw3 is noted for having a dwarfing effect that
is limited to the lower stalk internodes, and the plant apex is actually longer in dw3 mutant
plants, circumventing the problem of inadequate inflorescence exsertion found in other

8
dwarf sorghums. These mutants also have the benefit of increased stalk strength due to
extra layers of parenchyma cells in the internodes (Multani et al 2003, Brown and Paterson
2013). Other dwarfing genes may have similar benefits, creating the possibly of altering
biomass composition in ways favorable for biofuel production.
Sorghum originated as a photoperiod-sensitive tropical adapted species. In the
Sahel region of Africa, annual rains vary in onset and duration in narrow latitudinal belts.
Sorghum cultivars grown in these zones are strongly adapted to flower at the end of the
rainy season. Photoperiod-sensitive plants detect small increases in the night length to
initiate flowering at the opportune time in each particular environment. Prolonged day
length during the summer growing season at temperate latitudes prevents the necessary
~11 hours of night length needed to cue flowering, often preventing full seed set or even
flower initiation before the killing frost. Recessive mutations in the photoperiod pathway
have been discovered and selected by farmers at temperate latitudes. These early
selections rapidly displaced the original photoperiod sensitive cultivars, resulted in
increased acreages of sorghum, and provided genetic material for the development of
modern cultivars by plant breeders (C. W. Smith and Frederiksen 2000).
Classical genetic segregation studies determined that four loci influenced flowering
time in sorghum. These genes were designated maturity genes because they influenced the
duration of growth, or days to maturity, and were respectively named Ma1, Ma2, Ma3, and
Ma4 (John Roy Quinby 1974). Late maturity was found to be dominant or partially
dominant to early maturity. Loss-of-function mutations in these maturity genes were likely
critical both for early dispersal to temperate latitudes of Africa and Asia, and for
subsequent crop improvement during the first 40 years of the 20th century, when growers

9
and plant breeders in the United States and elsewhere selected for early maturing cultivars
suitable for grain production. Two of the four classical maturity genes, Ma1 and Ma3 have
been cloned. Ma1 encodes a pseudoresponse regulator protein 37 (PRR37; Murphy et al.
2011) and Ma3 encodes a phytochrome B (Childs 1997). Ma2 and Ma4 have no known
location. In addition to the four classically determined loci, additional loci designated as
Ma5, Ma6, and Ma7 have been reported (Mullet et al. 2010).
Ma1 has a large effect on maturity through its direct role in activating and
repressing genes in the floral pathway. Independent selection for early maturity in
different temperate regions has resulted in multiple mutations in this gene, creating an
allelic series for Ma1. The introgressed ma1 from donor BTx406 is the result of a single
nucleotide deletion and frameshift upstream of the pseudoresponse regulator (PRR)
domain (fig 2), causing a premature termination. A second allele often found in kafirs
Figure 2 Allelic variation at sorghum Ma1;(A) wild-type functional SbPRR37 allele; (B) recessive Sbprr37-1 allele from donor BTx406; (C) Sbprr37-2 allele from a kafir; (D) Sbprr37-3 allele from ATx623. Exons are shown as boxes, and introns as solid lines. Yellow boxes, protein coding sequence; blue boxes, pseudoreceiver domain; red boxes, CCT domain; light blue boxes, missense coding post frameshift. (Murphy et al. 2011)

10
from temperate southern Africa contains a missense mutation in the PRR domain at a
conserved Lys162 residue. A third allele, found in ATx623, the line used as to construct the
reference genome, contains both the kafir Lys162Asn substitution and a nonsense mutation
at Gln270 resulting in premature termination between the pseudoreceiver and CCT domains
(Murphy et al. 2011).
The manipulation of maturity loci has been of fundamental importance to the
production of high-biomass sorghum for bioenergy (Rooney et al. 2007). The transition
from vegetative to reproductive phases curtails biomass accumulation, so delayed
flowering is desirable in order to obtain maximum biomass yield. The discovery of multiple
maturity genes that induce photoperiod insensitivity enables a scenario where two early-
maturing lines can be hybridized to create photoperiod-sensitive, late maturing hybrids.
This method is currently being used to create high-biomass lines for biofuel production
(Mullet et al. 2010).
Many previous linkage and association studies identified QTL for sorghum plant
height and maturity. Plant height QTL have been reported on chromosomes 1,3,4, and 10 in
individual studies (Pereira and Lee 1995; R. R. Klein et al. 2001; Y. R. Lin, Schertz, and
Paterson 1995)and multiple studies have confirmed height QTL on chromosomes 7 (dw3),
6 (dw2), and 9 (dw1) and maturity QTL on chromosome 6 (ma1) and on chromosome 9
linked to dw1 (Hart et al. 2001; P. J. Brown et al. 2006; Y. R. Lin, Schertz, and Paterson 1995;
Pereira and Lee 1995; R. R. Klein et al. 2001; Murray et al. 2008; Murray et al. 2009; Patrick
J. Brown et al. 2008). High introgression frequencies in sorghum converted lines belonging
to the guinea-kafir subpopulation were found at ~1 Mb on chromosome 6 and around
11
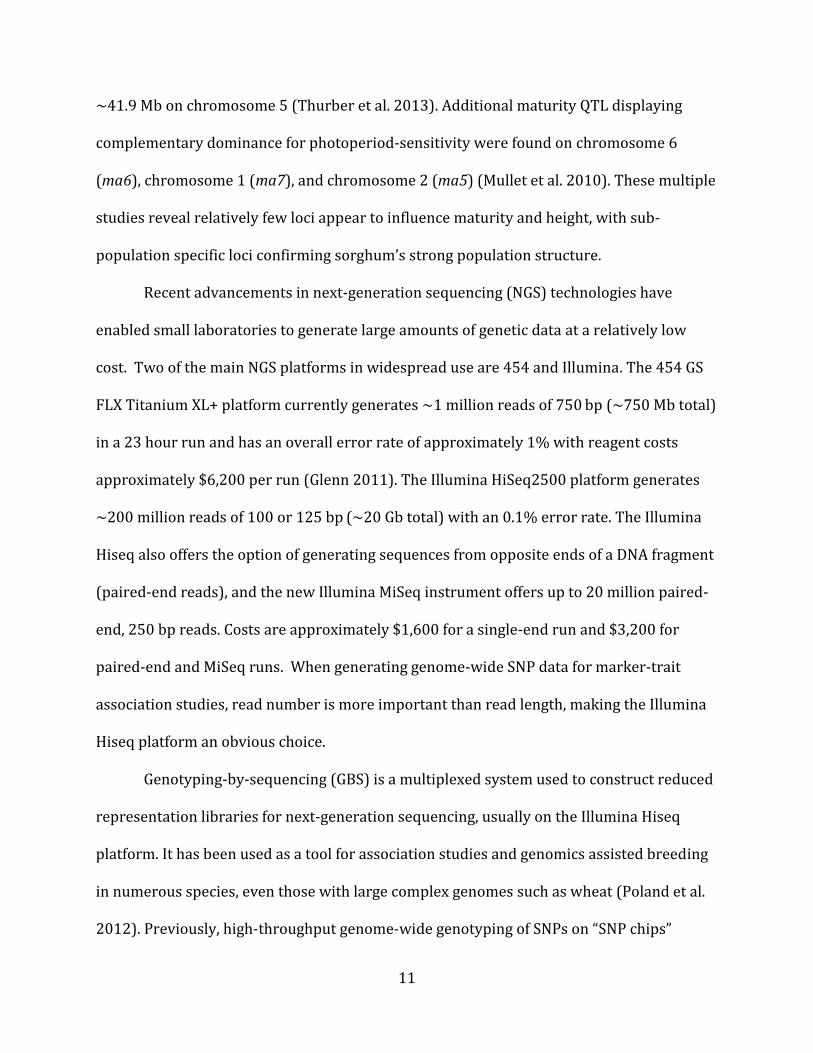
~41.9 Mb on chromosome 5 (Thurber et al. 2013). Additional maturity QTL displaying
complementary dominance for photoperiod-sensitivity were found on chromosome 6
(ma6), chromosome 1 (ma7), and chromosome 2 (ma5) (Mullet et al. 2010). These multiple
studies reveal relatively few loci appear to influence maturity and height, with sub-
population specific loci confirming sorghum’s strong population structure.
Recent advancements in next-generation sequencing (NGS) technologies have
enabled small laboratories to generate large amounts of genetic data at a relatively low
cost. Two of the main NGS platforms in widespread use are 454 and Illumina. The 454 GS
FLX Titanium XL+ platform currently generates ~1 million reads of 750 bp (~750 Mb total)
in a 23 hour run and has an overall error rate of approximately 1% with reagent costs
approximately $6,200 per run (Glenn 2011). The Illumina HiSeq2500 platform generates
~200 million reads of 100 or 125 bp (~20 Gb total) with an 0.1% error rate. The Illumina
Hiseq also offers the option of generating sequences from opposite ends of a DNA fragment
(paired-end reads), and the new Illumina MiSeq instrument offers up to 20 million paired-
end, 250 bp reads. Costs are approximately $1,600 for a single-end run and $3,200 for
paired-end and MiSeq runs. When generating genome-wide SNP data for marker-trait
association studies, read number is more important than read length, making the Illumina
Hiseq platform an obvious choice.
Genotyping-by-sequencing (GBS) is a multiplexed system used to construct reduced
representation libraries for next-generation sequencing, usually on the Illumina Hiseq
platform. It has been used as a tool for association studies and genomics assisted breeding
in numerous species, even those with large complex genomes such as wheat (Poland et al.
2012). Previously, high-throughput genome-wide genotyping of SNPs on “SNP chips”

12
required a SNP discovery phase to design pre-synthesized probe sequences. Such methods
were used extensively in human genetics and medicine, but humans are a relatively low
diversity species with ample research funding. Next-generation sequencing techniques
using GBS have facilitated large-scale discovery of SNPs in various model and non-model
plant species, with and without sequenced genomes, for linkage map construction, genetic
diversity analyses, association mapping, and marker-assisted selection (Kumar, Banks, and
Cloutier 2012).
In this study, GBS was used to obtain genome-wide SNP data for six partially
isogenic sorghum populations. The SNP data were used to construct linkage maps,
populations were phenotyped for plant height and flowering time, and QTL analysis was
used to identify regions controlling the traits of interest. These data are used to make
inferences about the incidence and effect sizes of key dwarfing and maturity QTL in SC lines
from different genetic backgrounds, and to generate hypotheses about the genes
underlying these QTL.

13
Methods
Population Development
Seed for the six SC lines was obtained from the USDA-ARS Cropping Systems
Research Laboratory (Lubbock, TX) and seed for the six EP lines was obtained from the
NPGS (“National Plant Germplasm System” 2013). Information on the geographic origins
and morphological racial classification of each SC line were obtained from Texas A&M
University (TAMU). The initial F1 crosses between the EP and matching SC lines were made
in the greenhouse in the winter of 2010-2011 after photoperiod induction for 10 weeks of
12-hour days in a growth chamber. Two F1 plants were made for the cross between an SC
627 female and an EP 627 male (population 627), and similarly two F1 plants were made
for populations 757, 991, and 1203 and one F1 was made for populations 673 and 1038.
F1’s were selfed in the greenhouse in Summer 2011, again after 10 weeks of photoperiod-
induction in the growth chamber. F2 seed was grown in the 2011-2012 winter nursery in
Puerto Vallarta with one panicle from each individual F2 selfed.
Figure 3 Partially-isogenic line creation. By crossing an exotic progenitor with the corresponding sorghum converted line, numerous isogenic combinations are possible.

14
In Urbana in Summer 2012, 192 F3 rows were planted for each of the six SC x EP
populations, in addition to four rows of each parent, for a total of 1,200 rows. Rows were
16’ long with 4’ alleys and 30” row spacing. Each row was thinned to ~6” spacing in order
to distinguish tillers from the main stalk later in the season.
Phenotyping
Plant height was measured in cm to the apex of a plant, and maturity was measured
in days from planting at the initiation of anthesis. These traits were phenotyped on
individual F2 plants in Puerto Vallarta, and on F3 rows in Urbana. Urbana maturity
phenotypes were the average of the first and last plant to flower in the each row. Urbana
height phenotypes were the average of the shortest and tallest plant in each row for the
very tall, very late maturing populations (populations 991, 1038, 1203; measured after the
killing frost), and the average of all individual plant heights in each row for populations 673
and 757.
It was observed in Puerto Vallarta that some F2 populations segregated for traits
that could be easily characterized within their populations. Population 1038 segregated for
awn length and population 991 segregated for anther color, either being yellow or pink,
and both traits were recorded.
Genotyping
Pooled genomic DNA was extracted from five etiolated seedlings from each F3 line
using a modified CTAB protocol (Thurber et al. 2013). Samples were then quantified using
PicoGreen (Invitrogen, NY, USA). To create the genomic libraries, DNAs (~250ng) were
double digested with either PstI-HF and BfaI or PstI-HF and HinP1I and ligated to one of
384 unique DNA barcodes. The resulting samples were then pooled for amplification and

15
size selection (Thurber et al. 2013). Each 384-sample library was submitted to the W.M.
Keck Center at the University of Illinois for single-end 100 bp sequencing on the Illumina
HiSeq2000. The Keck Center performed an additional qPCR assay on each library to adjust
concentrations before sequencing.
A subset of 109-175 F3’s from each population were genotyped using genotyping-
by-sequencing (GBS). 384 barcoded samples were included in each of the two Illumina
lanes. Sample size per lane was increased from the usual 96-plex used for inbred lines since
LD in biparental crosses is much higher. The TASSEL GBS pipeline (www.maizegenetics.net
2013) was used to process raw Illumina data using the default parameters, and the
undocumented ViterbiAlgorithmPlugin (P. Bradbury, personal communication) was used
to impute heterozygous genotypes and locate likely crossovers using a window size of 50
SNPs, minor allele frequency cutoff of 0.3, and an LD (r2) filter of 0.2. This plugin addresses
the problem of undercalling heterozygous genotypes in low-coverage GBS data. SNPs
segregating only in progeny traced back to one of the two source F1 plants within a
population were excluded using the minor allele frequency cutoff of 0.3. The complete
UNIX script file used for generation of genotype data from raw Illumina reads is included in
Appendix B.
QTL Analysis
R/qtl (“www.rqtl.org/” 2013) was used to create genetic maps and conduct QTL
analysis in each population. Permutation-based significance thresholds for each population
and phenotype were determined using Haley-Knott (HK) regression with 1,000
permutations at alpha= 0.05. QTL were constructed using the sim.geno function with 100
simulations and a step size of zero, where genotypes are drawn only at marker locations. A

16
drop-one-QTL-at-a-time ANOVA at alpha=0.05 was used to determine significant QTL and
calculate individual term variances for models of each phenotype. The complete R/qtl
script used to analyze the genotype data is included in Appendix C.

17
Results and Discussion
Population Development
Population Selection and Creation
The six populations developed for this project represent all the major racial groups
and much of the genetic diversity in sorghum. However, these six populations represent a
subset of the total number of attempted crosses. Several exotic parents did not flower even
after photoperiod induction. Therefore, our sampling may be biased against lines with very
stringent photoperiod induction requirements, and towards kafir lines from temperate and
subtropical latitudes in southern Africa (populations 627, 673, and 757). No guinea
populations were developed, possibly due to lack of photoperiod induction. However,
guineas are relatively closely related to the kafirs (fig 4).
Seed color segregation was observed in F2 panicles derived from one of the two F1
source plants of population 627. Segregation for plant architecture in the resulting F3 rows
suggested that half of population 627 resulted from an unintended outcross. F3 rows from
the other source of population 627 appeared identical to the original EP parent and did not
segregate, and were assumed to result from self-pollination instead of a true cross.
Molecular characterization of a subset of F3 families from both sources of population 627
confirmed both of these hypotheses; consequently no phenotypes were collected on
population 627. The other three populations that were derived from two F1 source plants
(757, 991, 1203) did not display any phenotypic or molecular divergence between sources.

18
Figure 4 Genetic diversity of sorghum populations evaluated in this study. Principal components analysis (PCA) was performed on 580 diverse EP lines using ~20k genome-wide SNPs. EP lines are colored by their morphological race. Populations evaluated include two kafirs (Pops 673 and 757), one durra (1038), one caudatum (1203), and one bicolor (991).
Field Development Urbana
Thinning each row assisted in collecting height and maturity measurements by
helping to distinguish individual F3 plants from tillers. Population 1203 was highly tillering
and remained problematic even after thinning. All rows were thinned when the field was at
the V5-V6 growth stage. Emphasis for thinning was placed on plant spacing instead of size
or vigor to prevent bias in selecting larger plants over dwarfs.
Throughout the growing season each population started to differentiate
phenotypically. Population 991 was easy to thin and appeared to allocate fewer resources
to root versus shoot biomass, while populations 1038 and 1203 were difficult to thin and
appeared to have greater relative root biomass. The summer of 2012 was also very dry,

19
with a period of plant wilting occurring in population 991 and a period of leaf curling in
1038. These responses to abiotic stresses appeared relatively uniform within populations,
but may have influenced the relative height and maturity distributions between
populations.
Phenotyping
Trait Ranges and Distributions
Height (HT) and maturity (MA) phenotypes were normally distributed in each
population and in both Puerto Vallarta (PV) and the Urbana Energy Farm (EF) locations (fig
5), with the following exceptions: 1) some PV maturity distributions were truncated on the
early side because early maturing F2’s were measured en masse upon arrival to the winter
nursery; 2) population 627 did not have a distribution like the other F2’s since half of the
population was a self of the exotic progenitor parent; and 3) Urbana heights for population
1203 along with the EP parents of populations 991, 1038, and 1203 were truncated
because of the limitation of the growing season, with a the killing frost in early October. In
the booting stage, the peduncle rapidly elongates and increases height, temporarily giving
some earlier maturing F3 plants a greater height than their late-maturing EP parents.
A much greater range in height and maturity was found in F3s grown in Urbana
compared to F2’s grown in Puerto Vallarta. The PV maturity range of all six populations
combined was ~15 days whereas the EF maturity range was ~80 days. All six populations
reached at least the booting stage of maturation in EF by the end of the growing season.
Phenotypic differences between these two short- and long-day environments indicate a
photoperiod response, since growing degree day (GDD) accumulation was similar between

20
environments for most of the growing season. The increase in additive genetic variance in
F3 versus F2 generations could also account for some of the increased HT and MA range in
the temperate EF locations. Cooler weather at the end of the Urbana growing season
lengthened the right tail of the maturity distributions when measured in days rather than
GDDs. HT was much greater in EF than in PV for three populations (991, 1038, and 1203)
indicating a strong photoperiod response. The two kafir populations (673 and 757) had
smaller differences in MA and HT between tropical and temperate environments, indicating
a weaker photoperiod response. Population-level variability for MA and HT in the
temperate EF environment was lowest for population 673 (~20 days and ~60 cm), and
highest for population 991(~75 days and ~330 cm). Population 673 was both shortest and
earliest, with mean HT and MA values of ~140 cm and ~70 days respectively, population
1203 was tallest, with a mean HT of ~380 cm, and population 1038 was latest with a mean
MA of ~105 days. The weaker photoperiod response in the kafir populations 673 and 757
is not unexpected since they originate from the temperate latitudes of Southern Africa.
Trait Correlations within and between Long and Short-Day Environments
For each population, HT was correlated between short and long day environments
but MA was not based on the Pearson correlation coefficient r2. The lack of MA correlation
between environments suggests that most MA variation in EF is due to photoperiod-
response. This is expected as the short-day environment fulfills the photoperiod induction
requirement (~11 hours of uninterrupted darkness) for the entire growing season,
whereas the long-day environment only begins to fulfill this requirement in late September,
four months after planting.

21
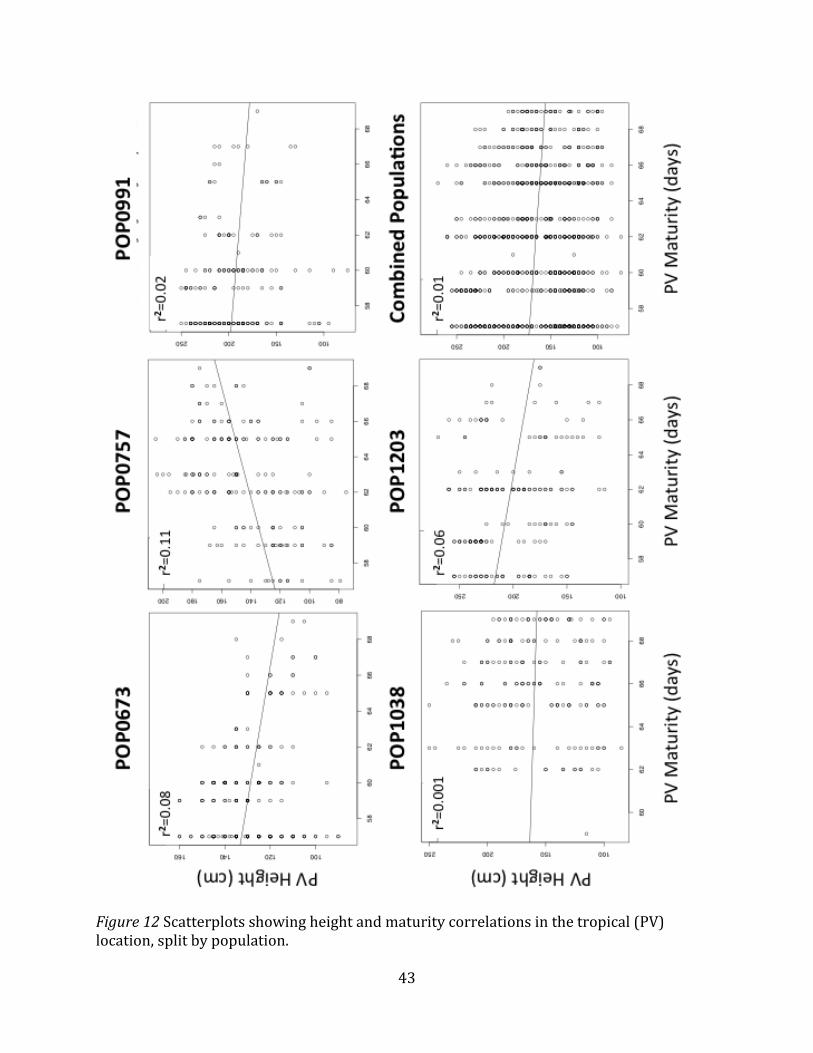
There were no significant Pearson correlations between HT and MA in PV, but
several populations had significant correlations between HT and MA in Urbana.
Populations that had a larger range in MA and HT and presumably stronger photoperiod-
response had a lower r2 value than shorter, earlier maturing populations. Populations with
low correlation included 1038, which had a large number of late maturing dwarfs, and
1203, which had a large number of medium maturing tall plants. Correlations between HT
and MA varied from 0.72 for population 673 to 0.17 for population 1038. The correlation
across five populations combined was 0.01 in PV, versus 0.51 in EF. Trait correlation
scatterplots between and among both environments can be found in Appendix A.

22
Figure 5 Boxplots of height and maturity distributions for partially-isogenic F3 populations, split by location and population, with biparental phenotypes indicated by diamonds.

23
Qualitative Traits
Table 1 Segregation ratios of qualitative anther color and awn length traits in Pops 991 and 1038, respectively.
Population 991 Anther Color
Pink Yellow Total χ² 3:1 p-val
139 60 199 0.09
Population 1038 Awn Length
Long awn Short awn Total χ² 3:1 p-val
139 53 192 0.40
Anther and awn phenotypes appeared to segregate in simple Mendelian 3:1 ratios,
suggesting the involvement of a single dominant locus for both traits. Pink anthers were
dominant to yellow anthers and long awns were dominant to short awns. Phenotypes for
these binary traits were only recorded for the F2s in the PV location (table 1). At
alpha=0.05, we failed to reject the null hypothesis of a 3:1 ratio by χ² test, based on the p-
values of 0.09 in population 991 and 0.40 in 1038. The nearly-significant segregation
distortion in favor of yellow anthers in population 991 may result from the difficulty in
differentiating the two colors when the anthers on mature panicles turned brown.
Genotyping and Genetic Map Construction
Marker Segregation in Partially Isogenic Populations
A subset of 109-175 F3’s from each population were genotyped using genotyping-
by-sequencing (GBS). 384 barcoded samples, instead of the usual 96-plex used for inbred
lines, were used since LD in biparental crosses is much higher. The populations used in this
study are different from ordinary biparental populations in that the two parents of each
populations are partially isogenic. After five backcrosses in the absence of selection, each
24
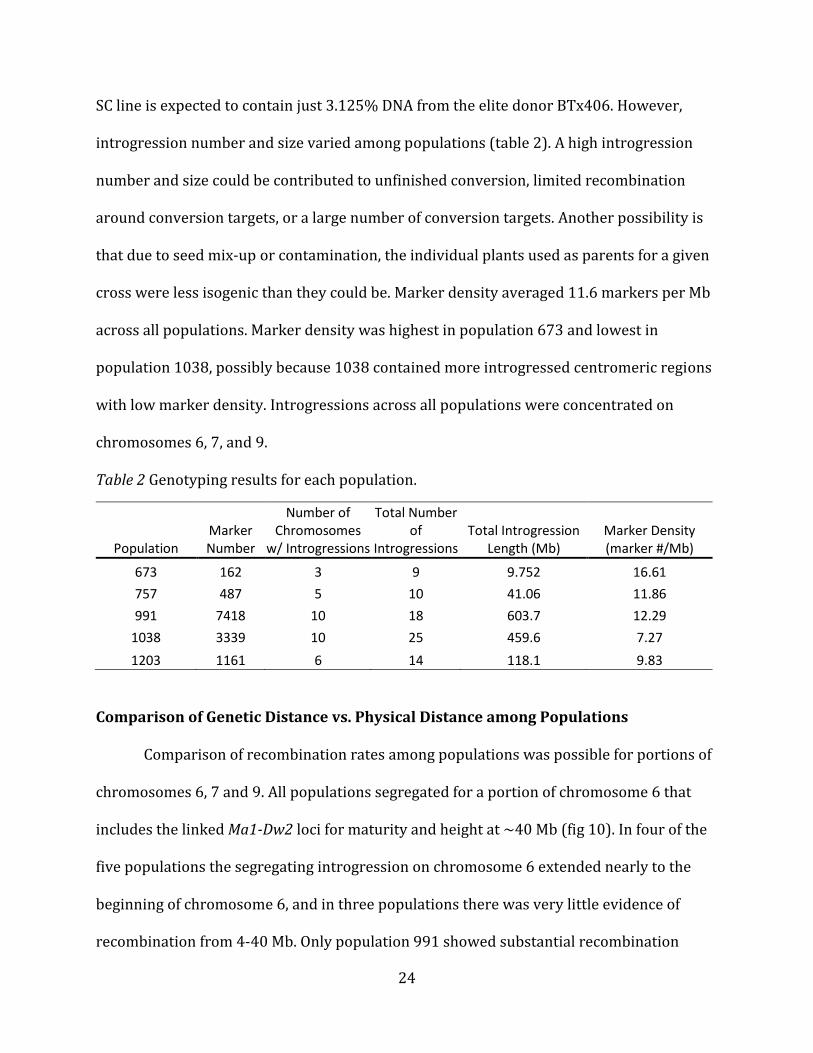
SC line is expected to contain just 3.125% DNA from the elite donor BTx406. However,
introgression number and size varied among populations (table 2). A high introgression
number and size could be contributed to unfinished conversion, limited recombination
around conversion targets, or a large number of conversion targets. Another possibility is
that due to seed mix-up or contamination, the individual plants used as parents for a given
cross were less isogenic than they could be. Marker density averaged 11.6 markers per Mb
across all populations. Marker density was highest in population 673 and lowest in
population 1038, possibly because 1038 contained more introgressed centromeric regions
with low marker density. Introgressions across all populations were concentrated on
chromosomes 6, 7, and 9.
Table 2 Genotyping results for each population.
Population Marker Number
Number of Chromosomes
w/ Introgressions
Total Number of
Introgressions Total Introgression
Length (Mb) Marker Density (marker #/Mb)
673 162 3 9 9.752 16.61
757 487 5 10 41.06 11.86
991 7418 10 18 603.7 12.29
1038 3339 10 25 459.6 7.27
1203 1161 6 14 118.1 9.83
Comparison of Genetic Distance vs. Physical Distance among Populations
Comparison of recombination rates among populations was possible for portions of
chromosomes 6, 7 and 9. All populations segregated for a portion of chromosome 6 that
includes the linked Ma1-Dw2 loci for maturity and height at ~40 Mb (fig 10). In four of the
five populations the segregating introgression on chromosome 6 extended nearly to the
beginning of chromosome 6, and in three populations there was very little evidence of
recombination from 4-40 Mb. Only population 991 showed substantial recombination

25
across this region, with ~10X greater genetic distance from 4-40 Mb than populations 757,
1038, and 1203. The higher observed recombination in this region in population 991
suggests that this population could be useful in separating the effects of maturity and
height QTL in this large LD block. Recombination rates in shared introgressed regions on
chromosomes 7 and 9 are much more uniform across populations, suggesting that the
differences observed on chromosome 6 do not result from genome-wide differences in
recombination rate.
Figure 6 Genetic versus physical distance in five partially-isogenic populations for selected regions of chromosomes 6, 7, and 9. The slope of the line reflects the recombination rate. Higher recombination is observed in chromosomal arms compared to centromeric regions. Chromosome 6 varies almost 10X in recombination rate amongst populations between 4-40 Mb, compared to the relative consistency on chromosomes 7 and 9.
26
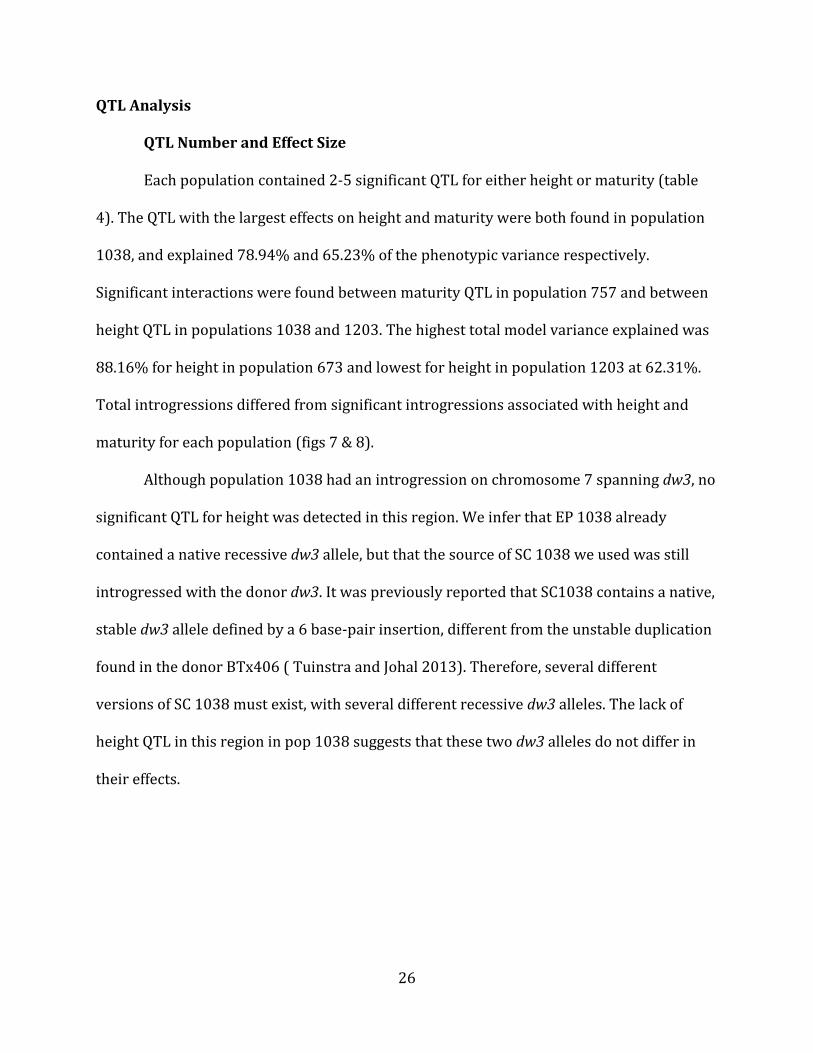
QTL Analysis
QTL Number and Effect Size
Each population contained 2-5 significant QTL for either height or maturity (table
4). The QTL with the largest effects on height and maturity were both found in population
1038, and explained 78.94% and 65.23% of the phenotypic variance respectively.
Significant interactions were found between maturity QTL in population 757 and between
height QTL in populations 1038 and 1203. The highest total model variance explained was
88.16% for height in population 673 and lowest for height in population 1203 at 62.31%.
Total introgressions differed from significant introgressions associated with height and
maturity for each population (figs 7 & 8).
Although population 1038 had an introgression on chromosome 7 spanning dw3, no
significant QTL for height was detected in this region. We infer that EP 1038 already
contained a native recessive dw3 allele, but that the source of SC 1038 we used was still
introgressed with the donor dw3. It was previously reported that SC1038 contains a native,
stable dw3 allele defined by a 6 base-pair insertion, different from the unstable duplication
found in the donor BTx406 ( Tuinstra and Johal 2013). Therefore, several different
versions of SC 1038 must exist, with several different recessive dw3 alleles. The lack of
height QTL in this region in pop 1038 suggests that these two dw3 alleles do not differ in
their effects.

27
Figure 7 Complete QTL maps for each population with permutation thresholds for height and maturity (thresholds nearly equal within pops).

28
Figure 8 Significant QTL maps for each population with permutation thresholds for height and maturity.

29
Po
pu
lati
on
Tr
ait
Mo
del
Q
TL
QTL
Ph
ysic
al
Loca
tio
n
% V
aria
nce
Ex
pla
ined
A
dd
itiv
e ef
fect
D
om
inan
ce
effe
ct
D/A
Tota
l V
aria
nce
of
Mo
del
673
M
atu
rity
y
~ Q
1 Q
1
6_3
99
22
33
0
69
.48
5
.36
0
.29
0
.05
6
9.4
8
H
eigh
t y
~ Q
1+Q
2
Q1
6
_44
41
60
69
1
0.6
2
18
.49
5
.79
0
.31
8
8.1
6
Q
2
6_3
99
22
33
0
2.8
8
7.1
6
1.2
2
0.1
7
757
M
atu
rity
y
~ Q
1+Q
2+Q
1:Q
2
Q1
6
_42
19
21
74
4
6.6
8
7.0
8
1.2
4
0.1
8
74
.57
Q
2
9_5
90
25
64
7
31
.93
5
.77
1
.01
0
.18
Q
1:Q
2
2.6
8
1.8
7
2.0
4
1.0
9
H
eigh
t y
~ Q
1+Q
2
Q1
9
_57
27
55
80
4
1.6
3
30
.02
2
.55
0
.08
7
9.5
8
Q
2
6_4
30
22
90
3
31
.57
2
4.1
5
7.3
6
0.3
991
M
atu
rity
y
~ Q
1+Q
2
Q1
6
_40
05
78
10
7
4.2
7
20
.69
2
.83
0
.14
7
4.2
7
H
eigh
t y
~ Q
1+Q
2+Q
3+Q
4
Q1
6
_43
23
69
84
1
7.8
3
50
.98
2
2.5
6
0.4
4
70
.66
Q
2
7_5
79
99
73
8
16
.62
4
6.5
8
11
.68
0
.25
Q
3
9_5
77
66
82
2
4.1
2
21
.44
1
1.4
2
0.5
3
Q
4
3_4
18
71
09
8
3.6
8
1.7
2
30
.26
1
7.5
9
103
8
Mat
uri
ty
y ~
Q1
Q
1
6_4
14
14
74
4
73
.61
2
0.2
2
2.2
1
0.1
7
3.6
1
H
eigh
t y
~ Q
1+Q
2+Q
1:Q
2
Q1
9
_56
69
50
00
6
0.4
3
70
.32
4
.03
0
.17
7
1.4
3
Q
2
6_4
14
14
74
4
17
.42
3
5.2
6
26
.86
0
.05
Q
1:Q
2
4.5
3
32
.32
9
.36
0
.09
120
3
Mat
uri
ty
y ~
Q1
+Q2
Q
1
6_3
98
69
77
7
59
.87
1
8.8
6
0.8
6
0.0
5
77
.82
Q
2
9_5
86
46
79
6
9.9
4
8.6
2
0.5
0
.06
H
eigh
t y
~ Q
1+Q
2+Q
1:Q
2
Q1
7
_58
82
57
37
3
1.2
9
38
.45
2
3.1
0
.6
62
.31
Q
2 6
_42
621
07
5
26
.64
33
.66
25
.68
0.7
6
Q
1:Q
2
3.2
4
-10
.94
-2
4.8
8
2.2
7
Table 3 QTL models for height and maturity in partially-isogenic sorghum populations.

30
Incidence of Putative Ma1, Dw2, Dw3, and Dw1
QTL were classified into six groups based on physical location across three
chromosomes (table 4). Maturity QTL near the Ma1 locus at 40.3 Mb on chromosome 6 were
found in all populations. The putative Ma1 QTL in Population 757 was the furthest from
cloned Ma1 gene at almost two Mb away, but this was the closest segregating marker to the
Ma1 locus in this population. Low marker density in this region in population 757 may be
due to genetic similarity with the elite donor BTx406. Two populations, 991 and 1203,
segregated for plant height QTL near the cloned dw3 locus at 58.6 Mb on chromosome 7.
Table 4 Comparison of QTL locations (Mb) across populations with reference to known (cloned or uncloned) loci.
Population Chr 3 Chr 6 Chr 6 Chr 7 Chr 9 Chr 9
Locus Dw?1 Ma1 Dw2 Dw3 Dw1 Ma?
Position ? 40.3 ? 58.6 ? ?
673 - 39.92 44.42 - - -
757 - 42.19 43.02 - 57.28 59.03
991 41.87 40.06 43.67 58 57.77 -
1038 - 41.41 - - 56.7 -
1203 - 39.87 42.62 58.83 - 58.65
1. Novel loci
For uncloned loci, populations 673, 757, 991 and 1203 have plant height QTL around
the putative Dw2 locus, expected to be several Mb distal to ma1 on chromosome 6. Some
disagreement existed between populations for location of dw2, which mapped within a 1.8
Mb region containing three genes encoding putative endo1,3;1,4betaDglucanase precursors.
A mutation found in the rice ortholog of these genes, OsGLU1, results in a dwarf phenotype
characterized by a reduction in cell elongation, a decrease in cellulose content, and an
increase in pectin content. It was therefore suggested that OsGLU1 affects both internode

31
elongation and cell wall composition of rice, with gibberellins and brassinosteroids
responsible for inducing OsGLU1 expression (Zhou et al. 2006). Populations 757, 991, and
1038 segregate for plant height QTL around the putative dw1 locus. Based on these three
QTL regions, dw1 falls within a 1.07 Mb region between 56.7 and 57.77 Mb on chromosome
9. This gene rich region contains several potential candidate genes, such as a putative auxin
responsive protein (Sb09g027990), an auxin responsive Aux/IAA gene family member
(Sb09g028210), a putative gibberellin 2-beta-dioxygenase (Sb09g028360), a putative auxin
response factor 15 (Sb09g028450), a fasciclin domain containing protein (Sb09g028480),
and an AP2 domain containing protein (Sb09g028567).
The dw1 locus fractionated into two linked height and maturity QTL as previously
reported (Thurber et al. 2013). This ma locus on chromosome 9 is possibly one of the
unmapped classical maturity loci (ma2 or ma4). Two populations, 757 and 1203, segregated
for this maturity locus, which mapped to a ~0.4 Mb region around ~58.6-59 Mb. Population
991 also appeared to have a weak maturity QTL at this locus at 58.47 Mb, but this QTL did
not pass the permutation threshold. This region is close to a possible candidate gene
encoding a putative early flowering (ELF3) protein (Sb09g030700). Natural variation in
Hd17, a rice homolog of Arabidopsis ELF3, in japonica rice was found to play an important
role in maintaining circadian rhythms and was associated with differences in flowering time
(Matsubara et al. 2012).
A novel height locus found only in population 991 was also the only locus reported
on chromosome 3. A previous QTL study reported the incidence of a potential height QTL on
this chromosome (Y. R. Lin, Schertz, and Paterson 1995). This QTL mapped to ~7 Mb interval
beginning at 41.9 Mb.

32
Comparison of Additive Effects by Population
Table 5 Comparison of additive effects1 between populations.
Population Chr 3 Chr 6 Chr 6 Chr 7 Chr 9 Chr 9
Locus Dw? Ma1 Dw2 Dw3 Dw1 Ma?
673 - 5.36 18.49 - - -
757 - 7.08 24.15 - 30.02 5.77
991 1.72 20.69 50.98 46.58 21.44 -
1038 - 20.64 37 - 69 -
1203 - 18.86 33.66 38.45 - 8.62
1. maturity (days) and height (cm)
Variation among the additive effects was observed for QTL of both traits. Ma1 has a
known allelic series, with kafirs having a distinct allele (Murphy et al. 2011), but the additive
effects of the ma1 allelic series are unknown. Our results show the additive effects of ma1
among the populations noticeably split between the kafirs (673, 757) and the other three
populations. The kafirs native ma1 allele appears to confer partial photoperiod insensitivity,
with an average additive effect of 6.22 days compared to 20.62 days (table 5) of the three
other populations, a 3x greater delay effect in maturity. The other maturity QTL on 9 had an
average effect of 7.2 days when comparing populations 757 and 1203.
The additive effects of the height QTL were not as uniform among the populations as
maturity, with later maturing populations tending to have larger height QTL effects. The
effects of dw2 had a range of 18.49 to 65 cm, whereas dw1 had a range of 15 to 69 cm. The
effects of dw3 were less variable with an average additive effect of 43.23 cm and range of 10
cm. The only locus on chromosome 3 for height and found only in population 991 had a low
additive effect of 1.72 cm, but a relatively high dominance effect of 30.24 cm (table 4).

33
Qualitative Traits
A QTL for awn length in population 1038 mapped to chromosome 10 at 59.32 Mb
(fig 11). No height or maturity QTL were found on this chromosome in any populations in
this experiment. Variation in awn length is observed in many other grass species such as
wheat, rice, and barley, and depending on the species, this phenotype functions for heat
dispersal, seed dispersal, and even as a photosynthetic organ. The short awn 2 (lks2) gene,
which encodes a SHI-family transcription factor found in barley, produces awns around
50% shorter than normal (Yuo et al. 2012), similar to the phenotype observed in
population 1038. An orthologous gene in sorghum maps to an expressed, putative SHI gene
at 59.53 Mb (Sb10g029800) on chromosome 10 (“www.phytozome.net” 2013), making it a
potential candidate gene.
The anther color gene mapped on chromosome 6 around 54.02 Mb in population
991 (fig 11). This QTL mapped to a ~650,000 bp region containing three putative
anthocyanin regulatory Lc proteins orthologous to the b locus in maize, which encodes a
transcription factor that regulates the expression of genes responsible for producing the
purple anthocyanin pigment (Selinger and Chandler 1999). Unpublished data from our
group also maps the plant color locus p, which conditions the accumulation of anthocyanin
in vegetative tissue, to this locus. As in maize, tissue-specific anthocyanin production in
sorghum is apparently the result of different b/p alleles being expressed in distinct tissues.

34
Figure 9 Qualitative trait associated peaks for populations 991 and 1038 with permutation thresholds shown as dashed horizontal lines.

35
Conclusion
The creation of partially isogenic populations aids in the identification of QTL that
influence sorghum height and maturity. Compared to typical biparental populations,
partially isogenic populations have simplified genetic architecture, and QTL models in
these populations explain a large proportion of the phenotypic variation. Genotyping-by-
sequencing libraries were constructed using 384 barcodes instead of the usual 96 to reduce
genotyping costs to under $10 per sample. Large differences in recombination rate among
populations are observed on chromosome 6.
As previously documented, a small number of QTL have relatively large effects on
height and maturity. Introgressions on chromosomes 6, 7, and 9 accounted for most of the
variation found for both traits. A maturity QTL mapped to the known, cloned Ma1 locus on
chromosome 6 in all populations, and evidence was presented for a series of functionally
distinct alleles at Ma1, present in different racial groups, with drastically different additive
effects. A height QTL mapped to the cloned Dw3 locus in populations 991 and 1203. Height
QTL were also mapped near the uncloned Dw2 locus on chromosome 6 and near the
uncloned Dw1 locus on chromosome 9. The Dw1 locus was shown to fractionate into
distinct height and maturity loci. Potential candidate genes were identified for these three
unknown loci. A unique population-specific height locus was discovered on chromosome 3
in population 991. Potential candidate genes were found for several qualitative traits:
anther color in population 991 and awn length in population 1038.
Identifying and fine-mapping QTL for height and maturity will further help breeders
utilize and introgress these QTL into desired genetic backgrounds, while exploiting and
recovering existing diversity around these regions. Individual lines with recombination
36
events in these QTL regions can be used for future fine-mapping and gene characterization
experiments, notably dw1 on chromosome 9, dw2 on chromosome 6, and a previously
uncharacterized maturity QTL on chromosome 9. Identifying additional population-specific
QTL that influence height and maturity, such as the height locus on chromosome 3 in
population 991, is possible through the creation of additional near isogenic populations
using the large diverse panel of sorghum converted lines and their exotic progenitors. The
efficiency of future experiments can be enhanced by optimizing barcode number and
population size.

37
Literature Cited
Agrama, H. A., and M. R. Tuinstra. 2004. “Phylogenetic Diversity and Relationships among
Sorghum Accessions Using SSRs and RAPDs.” African Journal of Biotechnology 2 (10)
(February 27): 334–340. doi:10.4314/ajb.v2i10.14848.
Ahnert, D., M. Lee, D. F. Austin, C. Livini, W. L. Woodman, S. J. Openshaw, J. S. C. Smith, K.
Porter, and G. Dalton. 1996. “Genetic Diversity among Elite Sorghum Inbred Lines
Assessed with DNA Markers and Pedigree Information.” Crop Science 36 (5): 1385–
1392. doi:10.2135/cropsci1996.0011183X003600050049x.
Ayana, Amsalu, and Endashaw Bekele. 1998. “Geographical Patterns of Morphological
Variation in Sorghum (Sorghum Bicolor (L.) Moench) Germplasm from Ethiopia and
Eritrea: Qualitative Characters.” Hereditas 129 (3): 195–205. doi:10.1111/j.1601-
5223.1998.t01-1-00195.x.
Billot, Claire, Punna Ramu, Sophie Bouchet, Jacques Chantereau, Monique Deu, Laetitia
Gardes, Jean-Louis Noyer, et al. 2013. “Massive Sorghum Collection Genotyped with
SSR Markers to Enhance Use of Global Genetic Resources.” PLoS ONE 8 (4) (April 2):
e59714. doi:10.1371/journal.pone.0059714.
Bouchet, Sophie, David Pot, Monique Deu, Jean-François Rami, Claire Billot, Xavier Perrier,
Ronan Rivallan, et al. 2012. “Genetic Structure, Linkage Disequilibrium and Signature of
Selection in Sorghum: Lessons from Physically Anchored DArT Markers.” PLoS ONE 7
(3) (March 13): e33470. doi:10.1371/journal.pone.0033470.
Brown, P. J., P. E. Klein, E. Bortiri, C. B. Acharya, W. L. Rooney, and S. Kresovich. 2006.
“Inheritance of Inflorescence Architecture in Sorghum.” Theoretical and Applied
Genetics 113 (5) (September 1): 931–942. doi:10.1007/s00122-006-0352-9.
Brown, Patrick J., Sean Myles, and Stephen Kresovich. 2011. “Genetic Support for Phenotype-
Based Racial Classification in Sorghum.” Crop Science 51 (1): 224.
doi:10.2135/cropsci2010.03.0179.
Brown, Patrick J., and Andrew H. Paterson. 2013. “Bridging Classical and Molecular Genetics
of Sorghum Plant Stature and Maturity.” In Genomics of the Saccharinae, edited by
Andrew H. Paterson, 333–345. Plant Genetics and Genomics: Crops and Models 11.
Springer New York. http://link.springer.com/chapter/10.1007/978-1-4419-5947-8_14.
Brown, Patrick J., William L. Rooney, Cleve Franks, and Stephen Kresovich. 2008. “Efficient
Mapping of Plant Height Quantitative Trait Loci in a Sorghum Association Population
With Introgressed Dwarfing Genes.” Genetics 180 (1) (September 1): 629–637.
doi:10.1534/genetics.108.092239.
Casa, A. M., S. E. Mitchell, M. T. Hamblin, H. Sun, J. E. Bowers, A. H. Paterson, C. F.
Aquadro, and S. Kresovich. 2005. “Diversity and Selection in Sorghum: Simultaneous
Analyses Using Simple Sequence Repeats.” Theoretical and Applied Genetics 111 (1)
(June 1): 23–30. doi:10.1007/s00122-005-1952-5.
Childs, K. 1997. “The Sorghum Photoperiod Sensitivity Gene, Ma3, Encodes a Phytochrome B.”
PLANT PHYSIOLOGY 113 (2) (February 1): 611–619. doi:10.1104/pp.113.2.611.
Dweikat, Ismail, Clifford Weil, Stephen Moose, Leon Kochian, Nathan Mosier, Klein Ileleji,
Patrick Brown, et al. 2012. “Envisioning the Transition to a next-Generation Biofuels
Industry in the US Midwest.” Biofuels, Bioproducts and Biorefining 6 (4): 376–386.
doi:10.1002/bbb.1342.

38
“Environmental Protection Agency.” 2013. Accessed May 28.
http://www.epa.gov/agriculture/ag101/cropmajor.html.
Glenn, Travis C. 2011. “Field Guide to next-Generation DNA Sequencers.” Molecular Ecology
Resources 11 (5): 759–769. doi:10.1111/j.1755-0998.2011.03024.x.
“GRIN NPGS.” 2013. Accessed July 29. http://www.ars-grin.gov/npgs/.
Hamblin, Martha T., Maria G. Salas Fernandez, Alexandra M. Casa, Sharon E. Mitchell, Andrew
H. Paterson, and Stephen Kresovich. 2005. “Equilibrium Processes Cannot Explain High
Levels of Short- and Medium-Range Linkage Disequilibrium in the Domesticated Grass
Sorghum Bicolor.” Genetics 171 (3) (November 1): 1247–1256.
doi:10.1534/genetics.105.041566.
Hart, G. E., K. F. Schertz, Y. Peng, and N. H. Syed. 2001. “Genetic Mapping of Sorghum
Bicolor (L.) Moench QTLs That Control Variation in Tillering and Other Morphological
Characters.” Theoretical and Applied Genetics 103 (8) (December 1): 1232–1242.
doi:10.1007/s001220100582.
Jakob, Katrin, Fasong Zhou, and Andrew H. Paterson. 2009. “Genetic Improvement of C4
Grasses as Cellulosic Biofuel Feedstocks.” In Vitro Cellular & Developmental Biology -
Plant 45 (3) (June 1): 291–305. doi:10.1007/s11627-009-9214-x.
Karper, R. E. 1932. “A Dominant Mutation of Frequent Recurrence in Sorghum.” The American
Naturalist 66 (707) (November 1): 511–529. doi:10.2307/2456778.
Klein, R. R., P. E. Klein, J. E. Mullet, P. Minx, W. L. Rooney, and K. F. Schertz. 2006. “Fertility
Restorer Locus Rf1 of Sorghum (Sorghum Bicolor L.) Encodes a Pentatricopeptide
Repeat Protein Not Present in the Colinear Region of Rice Chromosome 12.” Theoretical
and Applied Genetics 112 (2) (January 1): 388–388. doi:10.1007/s00122-005-0134-9.
Klein, R. R., R. Rodriguez-Herrera, J. A. Schlueter, P. E. Klein, Z. H. Yu, and W. L. Rooney.
2001. “Identification of Genomic Regions That Affect Grain-Mould Incidence and Other
Traits of Agronomic Importance in Sorghum.” Theoretical and Applied Genetics 102 (2-
3) (February 1): 307–319. doi:10.1007/s001220051647.
Klein, Robert R., John E. Mullet, David R. Jordan, Frederick R. Miller, William L. Rooney,
Monica A. Menz, Cleve D. Franks, and Patricia E. Klein. 2008. “The Effect of Tropical
Sorghum Conversion and Inbred Development on Genome Diversity as Revealed by
High-Resolution Genotyping.” Crop Science 48 (Supplement_1): S–12.
doi:10.2135/cropsci2007.06.0319tpg.
Kumar, Santosh, Travis W. Banks, and Sylvie Cloutier. 2012. “SNP Discovery through Next-
Generation Sequencing and Its Applications.” International Journal of Plant Genomics
2012 (November 22). doi:10.1155/2012/831460.
http://www.hindawi.com/journals/ijpg/2012/831460/abs/.
Lin, Y. R., K. F. Schertz, and A. H. Paterson. 1995. “Comparative Analysis of Qtls Affecting
Plant Height and Maturity across the Poaceae, in Reference to an Interspecific Sorghum
Population.” Genetics 141 (1) (September): 391–411.
Lin, Zhongwei, Xianran Li, Laura M. Shannon, Cheng-Ting Yeh, Ming L. Wang, Guihua Bai,
Zhao Peng, et al. 2012. “Parallel Domestication of the Shattering1 Genes in Cereals.”
Nature Genetics 44 (6) (June): 720–724. doi:10.1038/ng.2281.
Matsubara, Kazuki, Eri Ogiso-Tanaka, Kiyosumi Hori, Kaworu Ebana, Tsuyu Ando, and
Masahiro Yano. 2012. “Natural Variation in Hd17, a Homolog of Arabidopsis ELF3 That
Is Involved in Rice Photoperiodic Flowering.” Plant and Cell Physiology 53 (4) (April
1): 709–716. doi:10.1093/pcp/pcs028.
39
Morris, Geoffrey P., Punna Ramu, Santosh P. Deshpande, C. Thomas Hash, Trushar Shah, Hari
D. Upadhyaya, Oscar Riera-Lizarazu, et al. 2013. “Population Genomic and Genome-
Wide Association Studies of Agroclimatic Traits in Sorghum.” Proceedings of the
National Academy of Sciences 110 (2) (January 8): 453–458.
doi:10.1073/pnas.1215985110.
Mullet, John E., William L. Rooney, Patricia E. Klein, Daryl Morishige, Rebecca Murphy, and
Jeff A. Brady. 2010. “Discovery and Utilization of Sorghum Genes (ma5/ma6).”
Multani, Dilbag S., Steven P. Briggs, Mark A. Chamberlin, Joshua J. Blakeslee, Angus S.
Murphy, and Gurmukh S. Johal. 2003. “Loss of an MDR Transporter in Compact Stalks
of Maize br2 and Sorghum dw3 Mutants.” Science 302 (5642) (October 3): 81–84.
doi:10.1126/science.1086072.
Murphy, R. L., R. R. Klein, D. T. Morishige, J. A. Brady, W. L. Rooney, F. R. Miller, D. V.
Dugas, P. E. Klein, and J. E. Mullet. 2011. “Coincident Light and Clock Regulation of
Pseudoresponse Regulator Protein 37 (PRR37) Controls Photoperiodic Flowering in
Sorghum.” Proceedings of the National Academy of Sciences 108 (39) (September 19):
16469–16474. doi:10.1073/pnas.1106212108.
Murray, Seth C., William L. Rooney, Martha T. Hamblin, Sharon E. Mitchell, and Stephen
Kresovich. 2009. “Sweet Sorghum Genetic Diversity and Association Mapping for Brix
and Height.” The Plant Genome Journal 2 (1): 48.
doi:10.3835/plantgenome2008.10.0011.
Murray, Seth C., William L. Rooney, Sharon E. Mitchell, Arun Sharma, Patricia E. Klein, John
E. Mullet, and Stephen Kresovich. 2008. “Genetic Improvement of Sorghum as a Biofuel
Feedstock: II. QTL for Stem and Leaf Structural Carbohydrates.” Crop Science 48 (6):
2180. doi:10.2135/cropsci2008.01.0068.
“National Plant Germplasm System.” 2013. Accessed June 5. http://www.ars-grin.gov/npgs/.
Nelson, James C., Shichen Wang, Yuye Wu, Xianran Li, Ginny Antony, Frank F. White, and
Jianming Yu. 2011. “Single-Nucleotide Polymorphism Discovery by High-Throughput
Sequencing in Sorghum.” BMC Genomics 12 (1) (July 7): 352. doi:10.1186/1471-2164-
12-352.
Olsen, Kenneth M. 2012. “One Gene’s Shattering Effects.” Nature Genetics 44 (6) (June): 616–
617. doi:10.1038/ng.2289.
Pereira, M. G., and M. Lee. 1995. “Identification of Genomic Regions Affecting Plant Height in
Sorghum and Maize.” Theoretical and Applied Genetics 90 (3-4) (March 1): 380–388.
doi:10.1007/BF00221980.
Poland, Jesse A., Patrick J. Brown, Mark E. Sorrells, and Jean-Luc Jannink. 2012. “Development
of High-Density Genetic Maps for Barley and Wheat Using a Novel Two-Enzyme
Genotyping-by-Sequencing Approach.” PLoS ONE 7 (2) (February 28): e32253.
doi:10.1371/journal.pone.0032253.
Quinby, J. R., and R. E. Karper. 1953. “Inheritance of height in sorghum.” 98–99 pp.
CABDirect2.
Quinby, John Roy. 1974. Sorghum Improvement and the Genetics of Growth. Texas Agricultural
Experiment Station.
Rooney, William L., Jürg Blumenthal, Brent Bean, and John E. Mullet. 2007. “Designing
Sorghum as a Dedicated Bioenergy Feedstock.” Biofuels, Bioproducts and Biorefining 1
(2): 147–157. doi:10.1002/bbb.15.

40
Selinger, David A., and Vicki L. Chandler. 1999. “Major Recent and Independent Changes in
Levels and Patterns of Expression Have Occurred at the B Gene, a Regulatory Locus in
Maize.” Proceedings of the National Academy of Sciences of the United States of
America 96 (26) (December 21): 15007–15012.
Smith, C. Wayne, and Richard A. Frederiksen. 2000. Sorghum: Origin, History, Technology, and
Production. John Wiley & Sons.
Smith, Stephen, Valerio Primomo, Roger Monk, Barry Nelson, Elizabeth Jones, and Kay Porter.
2010. “Genetic Diversity of Widely Used U.S. Sorghum Hybrids 1980–2008.” Crop
Science 50 (5): 1664. doi:10.2135/cropsci2009.10.0619.
Thurber, Carrie S., Justin M. Ma, Race H. Higgins, and Patrick J. Brown. 2013. “Retrospective
Genomic Analysis of Sorghum Adaptation to Temperate-Zone Grain Production.”
Genome Biology 14 (6) (June 26): R68. doi:10.1186/gb-2013-14-6-r68.
Tuinstra, Mitchell R., and Gurmukh S. Johal. 2013. “A Stable dw3 Allele for Sorghum and a
Molecular Marker to Facilitate Selection.”
Tuinstra, Mitchell Reed, and Gurmukh S. Johal. 2013. “Stable dw3 Allele for Sorghum and a
Molecular Marker to Facilitate Selection.” Accessed July 29.
http://www.google.com/patents?id=M5vvAQAAEBAJ.
“Www.maizegenetics.net.” 2013. Accessed July 23.
http://www.maizegenetics.net/index.php?option=com_content&task=view&id=89&Itemi
d=119.
“Www.phytozome.net.” 2013. Accessed July 2. http://www.phytozome.net/.
“Www.rqtl.org/.” 2013. Accessed July 30. http://www.rqtl.org/.
Yuo, Takahisa, Yuko Yamashita, Hiroyuki Kanamori, Takashi Matsumoto, Udda Lundqvist,
Kazuhiro Sato, Masahiko Ichii, Stephen A. Jobling, and Shin Taketa. 2012. “A SHORT
INTERNODES (SHI) Family Transcription Factor Gene Regulates Awn Elongation and
Pistil Morphology in Barley.” Journal of Experimental Botany 63 (14) (September 1):
5223–5232. doi:10.1093/jxb/ers182.
Zhou, Hua-Lin, Si-Jie He, Yang-Rong Cao, Tao Chen, Bao-Xing Du, Cheng-Cai Chu, Jin-Song
Zhang, and Shou-Yi Chen. 2006. “OsGLU1, A Putative Membrane-Bound Endo-1,4-ß-
D-Glucanase from Rice, Affects Plant Internode Elongation.” Plant Molecular Biology
60 (1) (January 1): 137–151. doi:10.1007/s11103-005-2972-x.

41
Appendix A
Figure 10 Scatterplots showing height correlations between temperate (Urbana) and tropical (PV) locations, split by population.

42
Figure 11 Scatterplots showing maturity correlations between temperate (Urbana) and tropical (PV) locations, split by population.
43
Figure 12 Scatterplots showing height and maturity correlations in the tropical (PV) location, split by population.

44
Figure 13 Scatterplots showing height and maturity correlations in the temperate (Urbana) location, split by population.

45
Appendix B
#/U
sers
/pat
rick
bro
wn
/tas
sel/
run
_pip
elin
e.p
l -f
ork
1 -
Fas
tqT
oT
agC
ou
ntP
lugi
n -
i fa
stq
/12
IL0
14
-k
f3
_gb
s_k
ey.t
xt -
e P
stI-
Hin
P1
I -o
tag
Co
un
ts/1
2IL
01
4 -
s 2
20
00
00
00
-en
dP
lugi
n -
run
fork
1 |
tee
logf
iles
/GB
Slo
gfil
e_1
a.tx
t #
/Use
rs/p
atri
ckb
row
n/t
asse
l/ru
n_p
ipel
ine.
pl
-fo
rk1
-F
astq
To
Tag
Co
un
tPlu
gin
-i
fast
q/1
2IL
02
6 -
k f
3_g
bs_
key
.txt
-e
Pst
I-H
inP
1I
-o t
agC
ou
nts
/12
IL0
26
-s
22
00
00
00
0 -
end
Plu
gin
-ru
nfo
rk1
| t
ee lo
gfil
es/G
BSl
ogf
ile_
1b
.txt
#
/Use
rs/p
atri
ckb
row
n/t
asse
l/ru
n_p
ipel
ine.
pl
-fo
rk1
-F
astq
To
Tag
Co
un
tPlu
gin
-i
fast
q/1
3IL
00
5 -
k f
3_g
bs_
key
.txt
-e
Pst
I-H
inP
1I-
Bfa
I -o
tag
Co
un
ts/1
3IL
00
5
-s 2
20
00
00
00
-en
dP
lugi
n -
run
fork
1 |
tee
logf
iles
/GB
Slo
gfil
e_1
c.tx
t #
/Use
rs/p
atri
ckb
row
n/t
asse
l/ru
n_p
ipel
ine.
pl -
fork
1 -
Fas
tqT
oT
agC
ou
ntP
lugi
n -
i fa
stq
/13
IL0
06
-k
f3
_gb
s_k
ey.t
xt -
e P
stI-
Hin
P1
I-B
faI
-o t
agC
ou
nts
/13
IL0
06
-s
22
00
00
00
0 -
end
Plu
gin
-ru
nfo
rk1
| t
ee lo
gfil
es/G
BSl
ogf
ile_
1c.
txt
#/U
sers
/pat
rick
bro
wn
/tas
sel/
run
_pip
elin
e.p
l -f
ork
1 -
Mer
geM
ult
iple
Tag
Co
un
tPlu
gin
-i
tagC
ou
nts
/ -o
mer
ged
Tag
Co
un
ts/F
3T
ags.
cnt
-c 1
0 -
t -e
nd
Plu
gin
-ru
nfo
rk1
| t
ee lo
gfil
es/G
BSl
ogf
ile_
2.t
xt
#b
wa
aln
/U
sers
/pat
rick
bro
wn
/gen
om
es/f
asta
/so
rgh
um
.fa
mer
ged
Tag
Co
un
ts/F
3T
ags.
cnt.
fq >
mer
ged
Tag
Co
un
ts/F
3T
ags.
sai
| te
e lo
gfil
es/G
BSl
ogf
ile_
4.t
xt
#b
wa
sam
se /
Use
rs/p
atri
ckb
row
n/g
eno
mes
/fas
ta/s
org
hu
m.f
a m
erge
dT
agC
ou
nts
/F3
Tag
s.sa
i mer
ged
Tag
Co
un
ts/F
3T
ags.
cnt.
fq >
m
erge
dT
agC
ou
nts
/F3
Tag
s.sa
m |
tee
logf
iles
/GB
Slo
gfil
e_5
.txt
#
/Use
rs/p
atri
ckb
row
n/t
asse
l/ru
n_p
ipel
ine.
pl
-fo
rk1
-SA
MC
on
ver
terP
lugi
n -
i mer
ged
Tag
Co
un
ts/F
3T
ags.
sam
-o
to
pm
/F3
Tag
s.to
pm
.bin
-en
dP
lugi
n -
run
fork
1 |
tee
logf
iles
/GB
Slo
gfil
e_6
.txt
#
/Use
rs/p
atri
ckb
row
n/t
asse
l/ru
n_p
ipel
ine.
pl
-fo
rk1
-F
astq
To
TB
TP
lugi
n -
i fa
stq
-k
f3
_gb
s_k
ey.t
xt -
e P
stI-
Hin
P1
I-B
faI
-o t
bt/
all -
m t
op
m/F
3T
ags.
top
m.b
in -
y -
end
Plu
gin
-ru
nfo
rk1
| t
ee G
BSl
ogf
ile_
7b
.txt
#
/Use
rs/p
atri
ckb
row
n/t
asse
l/ru
n_p
ipel
ine.
pl
-fo
rk1
-M
erge
Tag
sBy
Tax
aFil
esP
lugi
n -
i tb
t/al
l -o
mer
ged
TB
T/A
LL
.tb
t.b
yte
-en
dP
lugi
n -
run
fork
1 |
tee
lo
gfil
es/G
BSl
ogf
ile_
8b
.txt
#
/Use
rs/p
atri
ckb
row
n/m
aize
gen
etic
s/ru
n_p
ipel
ine.
pl -
fork
1 -
Tag
sTo
SNP
By
Ali
gnm
entP
lugi
n -
i m
erge
dT
BT
/AL
L.t
bt.
by
te -
y -
m t
op
m/F
3T
ags.
top
m.b
in -
o
hap
map
/un
filt
/all
-s
1 -
e 1
0 -
end
Plu
gin
-ru
nfo
rk1
| t
ee lo
gfil
es/G
BSl
ogf
ile_
9a.
txt
#/U
sers
/pat
rick
bro
wn
/mai
zege
net
ics/
run
_pip
elin
e.p
l -f
ork
1 -
Mer
geD
up
lica
teSN
PsP
lugi
n -
hm
p h
apm
ap/u
nfi
lt/a
ll/m
erge
dT
BT
.c+
.hm
p.t
xt -
o
hap
map
/mer
ged
SNP
s/al
l/A
LL
.mer
ged
SNP
s.c+
.hm
p.t
xt -
s 1
-e
10
-en
dP
lugi
n -
run
fork
1 |
tee
logf
iles
/GB
Slo
gfil
e_1
0a.
txt
#/U
sers
/pat
rick
bro
wn
/mai
zege
net
ics/
run
_pip
elin
e.p
l -f
ork
1 -
GB
SHap
Map
Fil
ters
Plu
gin
-h
mp
hap
map
/mer
ged
SNP
s/al
l/A
LL
.mer
ged
SNP
s.c+
.hm
p.t
xt -
o
hap
map
/fil
t/al
l/m
ySt
ud
y.m
erge
dSN
Ps.
filt
.c+
.hm
p.t
xt -
hL
D -
sC 1
-eC
10
-en
dP
lugi
n -
run
fork
1 |
tee
logf
iles
/GB
Slo
gfil
e_1
1a.
txt
#/U
sers
/pat
rick
bro
wn
/mai
zege
net
ics/
run
_pip
elin
e.p
l -f
ork
1 -
Mer
geId
enti
calT
axaP
lugi
n -
hm
p h
apm
ap/f
ilt/
all/
my
Stu
dy
.me
rged
SNP
s.fi
lt.c
+.h
mp
.txt
-o
h
apm
ap/m
erge
d2
/new
_my
Stu
dy
.mer
ged
SNP
s.fi
lt.c
+.h
mp
.txt
-sC
1 -
eC 1
0 -
end
Plu
gin
-ru
nfo
rk1
| t
ee lo
gfil
es/G
BSl
ogf
ile_
12
a.tx
t cd
hap
map
/mer
ged
2
for
file
nam
e in
*; d
o
/Use
rs/p
atri
ckb
row
n/t
asse
l4/r
un
_pip
elin
e.p
l -fo
rk1
-h
$fi
len
ame
-Cal
lPar
entA
llel
esP
lugi
n -
p "
../../
ped
igre
es/p
ed_p
06
27
_2.t
xt"
-w 5
0 -
m 0
.9 -
f 0
.3 -
r 0
.2 -
logf
ile
"../
../lo
gfil
es/p
06
27
_lo
g.tx
t" -
end
Plu
gin
-V
iter
biA
lgo
rith
mP
lugi
n -
h 0
.5 -
g tr
ue
-en
dP
lugi
n -
Wri
teP
op
ula
tio
nA
lign
men
tPlu
gin
-f
"../
../w
ind
ow
size
50
/p0
62
7/w
50
_f0
.3_r
0.2
_"$
file
nam
e -m
fal
se -
o p
aren
ts -
end
Plu
gin
-ru
nfo
rk1
d
on
e

46
Appendix C
library(qtl) #Construct genetic map p0673=read.cross("csv",dir="”sep=""),na.strings=c("N"),genotypes=c("A","M","C","Y","Z"),estimate.map=T) plot(p0673) #Look at LD within pops rf0673=est.rf(p0673) plot.rf(rf0673) #QTL discovery p0673=calc.genoprob(p0673,step=0,error.prob=0.01) out.em.p0673=scanone(p0673,pheno.col=c(1,2)) write.table(out.em.p0673, file = ".txt", append =FALSE, quote=TRUE, sep="\t",eol="\n", na ="NA", dec =".", row.names =TRUE,col.names =TRUE, qmethod=c("escape", "double"),fileEncoding="") #Plot QTL plot(out.em.p0673, , main="POP0673", ylab="LOD", lodcolumn=c(1,2) , chr=6, show.marker.names=F) #Permutation thresholds for each phenotype operm.hk=scanone(p0673, method="hk", n.perm=1000,pheno.col=c(1,2)) summary(operm.hk,alpha=0.05, pvalues=TRUE) abline(h=1.99, lwd=1,lty=2,col=1) abline(h=1.98, lwd=1,lty=2,col="blue") #Constructing Model #Simulate genotypes hyper = sim.geno(p0673, step=0, n.draws=100, err=0.001) #Construct QTL chr=c(6,6) pos=c(0,8.37) qtl=makeqtl(hyper,chr,pos) #Model my.formula=y~Q1 out.fitqtl=fitqtl(hyper1,pheno.col=1,qtl=qtl, formula=my.formula, get.ests=TRUE) summary(out.fitqtl)


![RESEARCH Open Access Genotypic variation in sorghum [Sorghum … · 2018-06-03 · RESEARCH Open Access Genotypic variation in sorghum [Sorghum bicolor (L.) Moench] exotic germplasm](https://img.pdfslide.us/doc/110x75/5f03a3af7e708231d40a0b15/research-open-access-genotypic-variation-in-sorghum-sorghum-2018-06-03-research.jpg)


![Chapter 3 Phenotyping in Sorghum [Sorghum bicolor (L.) Moench]](https://img.pdfslide.us/doc/110x75/61b4aa26258cbf24e0723b12/chapter-3-phenotyping-in-sorghum-sorghum-bicolor-l-moench.jpg)