Embed Size (px)
Citation preview

1SCIentIfIC RePoRTS | (2018) 8:13526 | DOI:10.1038/s41598-018-31951-z
www.nature.com/scientificreports
Genetic dissection of grain zinc concentration in spring wheat for mainstreaming biofortification in CIMMYT wheat breedingGovindan Velu 1, Ravi Prakash Singh1, Leonardo Crespo-Herrera1, Philomin Juliana1, Susanne Dreisigacker 1, Ravi Valluru1,2, James Stangoulis 3, Virinder Singh Sohu4, Gurvinder Singh Mavi4, Vinod Kumar Mishra5, Arun Balasubramaniam5, Ravish Chatrath6, Vikas Gupta6, Gyanendra Pratap Singh6 & Arun Kumar Joshi7
Wheat is an important staple that acts as a primary source of dietary energy, protein, and essential micronutrients such as iron (Fe) and zinc (Zn) for the world’s population. Approximately two billion people suffer from micronutrient deficiency, thus breeders have crossed high Zn progenitors such as synthetic hexaploid wheat, T. dicoccum, T. spelta, and landraces to generate wheat varieties with competitive yield and enhanced grain Zn that are being adopted by farmers in South Asia. Here we report a genome-wide association study (GWAS) using the wheat Illumina iSelect 90 K Infinitum SNP array to characterize grain Zn concentrations in 330 bread wheat lines. Grain Zn phenotype of this HarvestPlus Association Mapping (HPAM) panel was evaluated across a range of environments in India and Mexico. GWAS analysis revealed 39 marker-trait associations for grain Zn. Two larger effect QTL regions were found on chromosomes 2 and 7. Candidate genes (among them zinc finger motif of transcription-factors and metal-ion binding genes) were associated with the QTL. The linked markers and associated candidate genes identified in this study are being validated in new biparental mapping populations for marker-assisted breeding.
More than two billion people worldwide do not get enough essential vitamins and minerals in their diets1. Inadequate Zn intake affects 17.3% of the world’s population, mostly across Asia and Africa2, and is responsible for the deaths of 433,000 children under the age of five each year3. The impact of micronutrient deficiencies is most serious in women of reproductive age (especially pregnant women) and children under the age of five, due to their increased micronutrient requirements4,5.
Wheat is an important staple food crop that provides about 20% of daily dietary energy and protein and is a major source of essential micronutrients such as Fe and Zn6. For more than 70 years, the International Maize and Wheat Improvement Center (CIMMYT) has bred wheat for improved grain yield potential and processing quality, resulting billions of dollars of benefits to farmers and consumers over this period7. The development and dissemination of high-yielding, nutrient-rich wheat varieties is a cost-effective and sustainable solution for minimizing nutrition gaps in remote rural households8. However, breeding for enhanced Zn concentrations is quite challenging due to the complexity of genetic and metabolic networks controlling the Zn homeosta-sis9–11. Moreover, differences in wheat plants Zn use efficiency, variability of translocation into the grain, and genotype-dependent source-sink relations can affect internal mobilization patterns of these micronutrients12.
Nutritional quality traits (such as Zn and Fe) tend to be multigenic. Breeding strategies are therefore focusing on novel approaches to broaden the genetic base using wild relatives and landraces, and identifying genetic con-trol and their effects13. The biofortification breeding program at CIMMYT emphasizes the development of new spring bread wheat germplasm that combines wide adaptability, high yields, high grain Zn concentration, better
1International Maize and Wheat Improvement Center (CIMMYT), Mexico, D.F., Apdo Postal 6-641, Mexico. 2Cornell University, Ithaca, NY, 14850, USA. 3Flinders University, School of Biological Sciences, Adelaide, 5001, Australia. 4Punjab Agricultural University (PAU), Ludhiana, India. 5Banaras Hindu University (BHU), Varanasi, India. 6Indian Institute of Wheat and Barley Research (IIWBR), Karnal, India. 7CIMMYT, Global Wheat Program, New Delhi, India. Correspondence and requests for materials should be addressed to G.V. (email: [email protected])
Received: 17 April 2018
Accepted: 29 August 2018
Published: xx xx xxxx
OPEN
www.nature.com/scientificreports/
2SCIentIfIC RePoRTS | (2018) 8:13526 | DOI:10.1038/s41598-018-31951-z
processing quality, disease resistance, and stress tolerance. Targeted breeding for improved nutritional quality has successfully incorporated 30–40% more grain Zn into CIMMYT-derived high yielding wheat genotypes14,15. Yet, dissecting the genetic bases and exploring important chromosomal loci of nutritional quality traits is extremely important for further improving wheat nutritional quality.
Genome-wide association studies (GWAS) are one of the main approaches for dissecting the genetic bases of complex traits16–18. To date, numerous QTL studies have attempted to uncover the genetic basis of grain Zn and Fe concentrations in wheat19–23. However, the traditional QTL mapping approach is limited to the bi-parental population used and identifies QTL positions at low resolution. In wheat, GWAS have been widely used to analyze the genetic control of complex traits. Advantages of GWAS over traditional QTL mapping include increased QTL resolution, allele coverage, and the potential to use large sets of natural germplasm resources such as landraces, elite cultivars, and advanced breeding lines. In wheat, few studies have used GWAS to dissect the genetics of
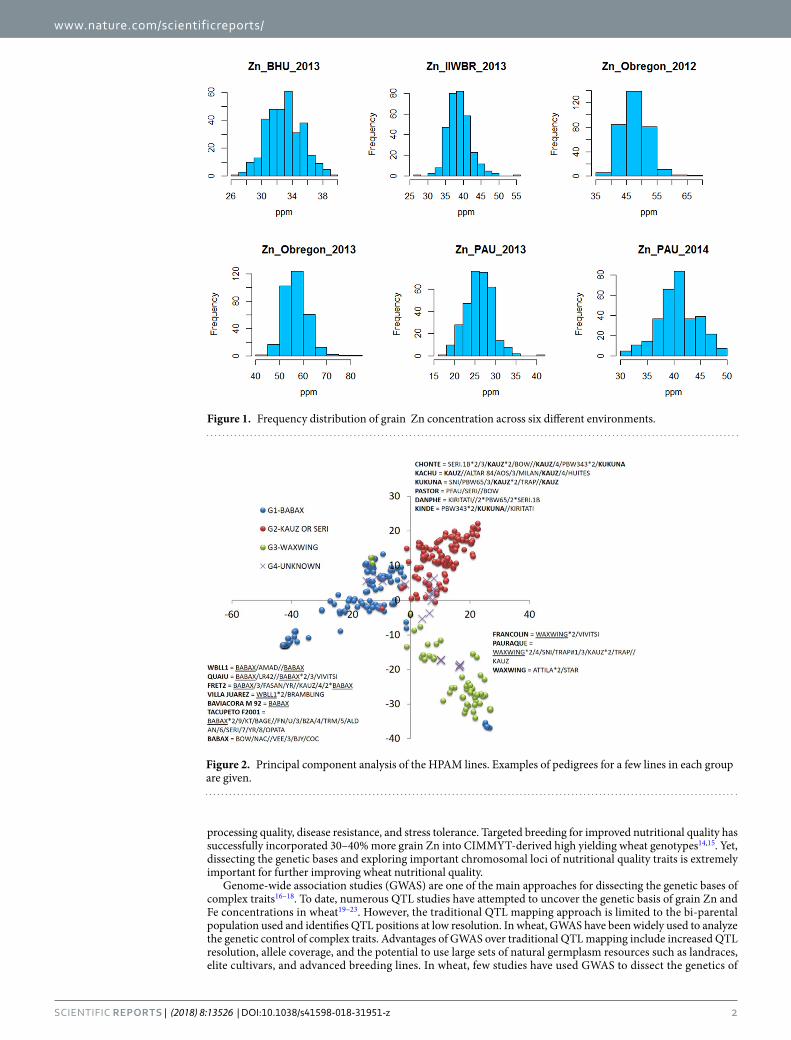
Figure 1. Frequency distribution of grain Zn concentration across six different environments.
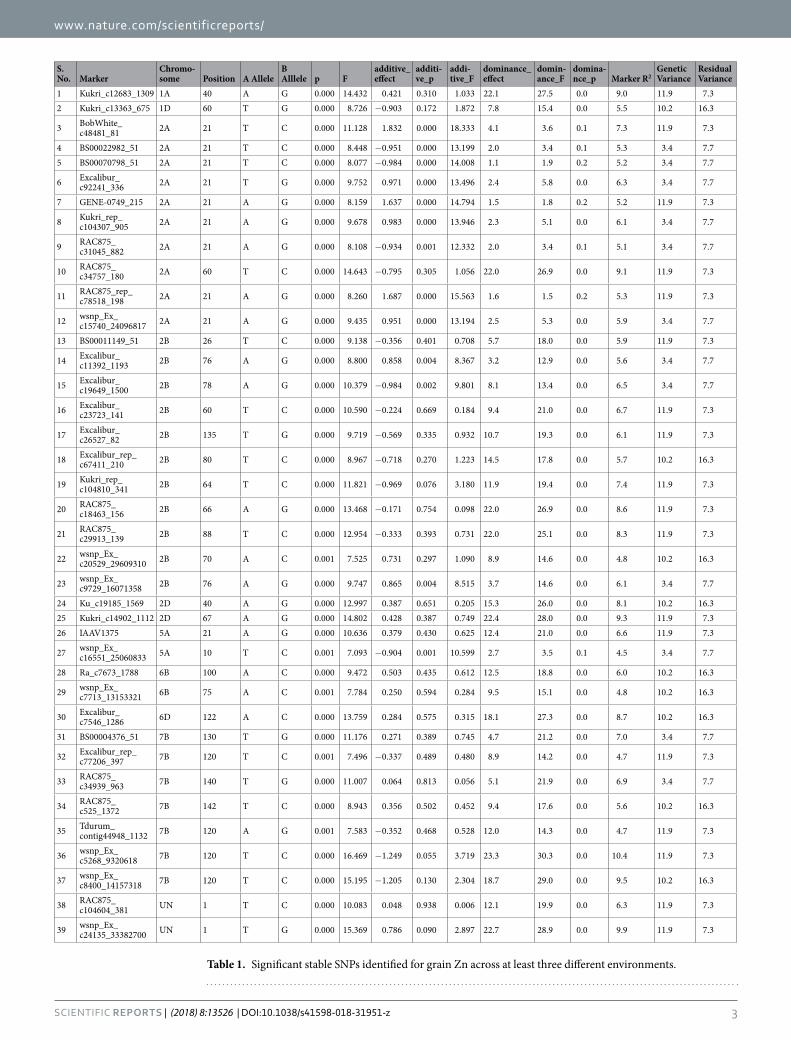
Figure 2. Principal component analysis of the HPAM lines. Examples of pedigrees for a few lines in each group are given.
www.nature.com/scientificreports/
3SCIentIfIC RePoRTS | (2018) 8:13526 | DOI:10.1038/s41598-018-31951-z
S. No. Marker
Chromosome Position A Allele
B Alllele p F
additive_effect
ad diti ve_p
additive_F
dominance_effect
dominance_F
dominance_p Marker R2
Genetic Variance
Residual Variance
1 Kukri_c12683_1309 1A 40 A G 0.000 14.432 0.421 0.310 1.033 22.1 27.5 0.0 9.0 11.9 7.32 Kukri_c13363_675 1D 60 T G 0.000 8.726 −0.903 0.172 1.872 7.8 15.4 0.0 5.5 10.2 16.3
3 BobWhite_c48481_81 2A 21 T C 0.000 11.128 1.832 0.000 18.333 4.1 3.6 0.1 7.3 11.9 7.3
4 BS00022982_51 2A 21 T C 0.000 8.448 −0.951 0.000 13.199 2.0 3.4 0.1 5.3 3.4 7.75 BS00070798_51 2A 21 T C 0.000 8.077 −0.984 0.000 14.008 1.1 1.9 0.2 5.2 3.4 7.7
6 Excalibur_c92241_336 2A 21 T G 0.000 9.752 0.971 0.000 13.496 2.4 5.8 0.0 6.3 3.4 7.7
7 GENE-0749_215 2A 21 A G 0.000 8.159 1.637 0.000 14.794 1.5 1.8 0.2 5.2 11.9 7.3
8 Kukri_rep_c104307_905 2A 21 A G 0.000 9.678 0.983 0.000 13.946 2.3 5.1 0.0 6.1 3.4 7.7
9 RAC875_c31045_882 2A 21 A G 0.000 8.108 −0.934 0.001 12.332 2.0 3.4 0.1 5.1 3.4 7.7
10 RAC875_c34757_180 2A 60 T C 0.000 14.643 −0.795 0.305 1.056 22.0 26.9 0.0 9.1 11.9 7.3
11 RAC875_rep_c78518_198 2A 21 A G 0.000 8.260 1.687 0.000 15.563 1.6 1.5 0.2 5.3 11.9 7.3
12 wsnp_Ex_c15740_24096817 2A 21 A G 0.000 9.435 0.951 0.000 13.194 2.5 5.3 0.0 5.9 3.4 7.7
13 BS00011149_51 2B 26 T C 0.000 9.138 −0.356 0.401 0.708 5.7 18.0 0.0 5.9 11.9 7.3
14 Excalibur_c11392_1193 2B 76 A G 0.000 8.800 0.858 0.004 8.367 3.2 12.9 0.0 5.6 3.4 7.7
15 Excalibur_c19649_1500 2B 78 A G 0.000 10.379 −0.984 0.002 9.801 8.1 13.4 0.0 6.5 3.4 7.7
16 Excalibur_c23723_141 2B 60 T C 0.000 10.590 −0.224 0.669 0.184 9.4 21.0 0.0 6.7 11.9 7.3
17 Excalibur_c26527_82 2B 135 T G 0.000 9.719 −0.569 0.335 0.932 10.7 19.3 0.0 6.1 11.9 7.3
18 Excalibur_rep_c67411_210 2B 80 T C 0.000 8.967 −0.718 0.270 1.223 14.5 17.8 0.0 5.7 10.2 16.3
19 Kukri_rep_c104810_341 2B 64 T C 0.000 11.821 −0.969 0.076 3.180 11.9 19.4 0.0 7.4 11.9 7.3
20 RAC875_c18463_156 2B 66 A G 0.000 13.468 −0.171 0.754 0.098 22.0 26.9 0.0 8.6 11.9 7.3
21 RAC875_c29913_139 2B 88 T C 0.000 12.954 −0.333 0.393 0.731 22.0 25.1 0.0 8.3 11.9 7.3
22 wsnp_Ex_c20529_29609310 2B 70 A C 0.001 7.525 0.731 0.297 1.090 8.9 14.6 0.0 4.8 10.2 16.3
23 wsnp_Ex_c9729_16071358 2B 76 A G 0.000 9.747 0.865 0.004 8.515 3.7 14.6 0.0 6.1 3.4 7.7
24 Ku_c19185_1569 2D 40 A G 0.000 12.997 0.387 0.651 0.205 15.3 26.0 0.0 8.1 10.2 16.325 Kukri_c14902_1112 2D 67 A G 0.000 14.802 0.428 0.387 0.749 22.4 28.0 0.0 9.3 11.9 7.326 IAAV1375 5A 21 A G 0.000 10.636 0.379 0.430 0.625 12.4 21.0 0.0 6.6 11.9 7.3
27 wsnp_Ex_c16551_25060833 5A 10 T C 0.001 7.093 −0.904 0.001 10.599 2.7 3.5 0.1 4.5 3.4 7.7
28 Ra_c7673_1788 6B 100 A C 0.000 9.472 0.503 0.435 0.612 12.5 18.8 0.0 6.0 10.2 16.3
29 wsnp_Ex_c7713_13153321 6B 75 A C 0.001 7.784 0.250 0.594 0.284 9.5 15.1 0.0 4.8 10.2 16.3
30 Excalibur_c7546_1286 6D 122 A C 0.000 13.759 0.284 0.575 0.315 18.1 27.3 0.0 8.7 10.2 16.3
31 BS00004376_51 7B 130 T G 0.000 11.176 0.271 0.389 0.745 4.7 21.2 0.0 7.0 3.4 7.7
32 Excalibur_rep_c77206_397 7B 120 T C 0.001 7.496 −0.337 0.489 0.480 8.9 14.2 0.0 4.7 11.9 7.3
33 RAC875_c34939_963 7B 140 T G 0.000 11.007 0.064 0.813 0.056 5.1 21.9 0.0 6.9 3.4 7.7
34 RAC875_c525_1372 7B 142 T C 0.000 8.943 0.356 0.502 0.452 9.4 17.6 0.0 5.6 10.2 16.3
35 Tdurum_contig44948_1132 7B 120 A G 0.001 7.583 −0.352 0.468 0.528 12.0 14.3 0.0 4.7 11.9 7.3
36 wsnp_Ex_c5268_9320618 7B 120 T C 0.000 16.469 −1.249 0.055 3.719 23.3 30.3 0.0 10.4 11.9 7.3
37 wsnp_Ex_c8400_14157318 7B 120 T C 0.000 15.195 −1.205 0.130 2.304 18.7 29.0 0.0 9.5 10.2 16.3
38 RAC875_c104604_381 UN 1 T C 0.000 10.083 0.048 0.938 0.006 12.1 19.9 0.0 6.3 11.9 7.3
39 wsnp_Ex_c24135_33382700 UN 1 T G 0.000 15.369 0.786 0.090 2.897 22.7 28.9 0.0 9.9 11.9 7.3
Table 1. Significant stable SNPs identified for grain Zn across at least three different environments.
www.nature.com/scientificreports/
4SCIentIfIC RePoRTS | (2018) 8:13526 | DOI:10.1038/s41598-018-31951-z
end-use quality traits24. To our knowledge, this is the first study that applies GWAS to dissect the genetics of grain Zn concentration in CIMMYT germplasm.
Our study used the Illumina iSelect 90 K Infinitum SNP array25 to genotype and analyze a diverse panel of 330 high zinc wheat lines for grain micronutrients across multiple environments. The study aimed to identify molecular markers associated with grain Zn concentrations and to identify associated candidate genes using recently-published wheat reference sequence information. The results will facilitate marker-assisted breeding for enhanced grain Zn in wheat.
ResultsThe combined analysis of variance across six environments showed significant differences between genotypes and significant genotype × environment interaction effects for grain Zn concentration, which was evident from the moderate level of broad-sense heritability (H2 = 0.6) for grain Zn. Continuous variation of grain Zn con-centration (the primary target trait) was observed in all environments (Fig. 1). Across both seasons in Ciudad Obregon, Mexico, there was much wider variation in grain Zn concentration at CENEB (high Zn environment), compared to intermediate grain Zn levels at IIWBR and lower levels at PAU and BHU (low Zn environments) was observed. Differences in grain Zn between environments were probably caused by different soil Zn levels at each test location.
Large variation for grain Zn concentration was observed in crop seasons Y-2012 and Y-2013, with a range of 35.5–67.7 mg/kg and 42.5–80.3 mg/kg, respectively, and mean of 47.8 mg/kg and 56.9 mg/kg, respectively. Moderate variation was observed at IIWBR (27.2–54.6 mg/kg, mean 38.8 mg/kg), and low variation was observed in low Zn environments at BHU (26.7 to 39.4 mg/kg) and PAU-2013 (17.8 to 40.5 mg/kg) and PAU 2014 (27.9 to 50.9 mg/kg) (Fig. 1).
GWAS for grain zinc and agronomic traits. Principal component analysis indicated four groups in the HPAM panel (Fig. 2). The first principal component separated a group of Veery (Babax)-derived lines (G1) from a second large group of lines with the parents Kauz or Seri in their pedigree (G2). Lines with Attila and Waxwing in their genetic background formed a third group (G3). The fourth group (G4) was formed by lines unrelated to any of the previous three groups. Since the lines included in the panel were selected based on pedigree informa-tion, the partitioning of the genetic diversity in subgroups remained a distinct feature of the panel, similar to that observed in other elite wheat collections26.
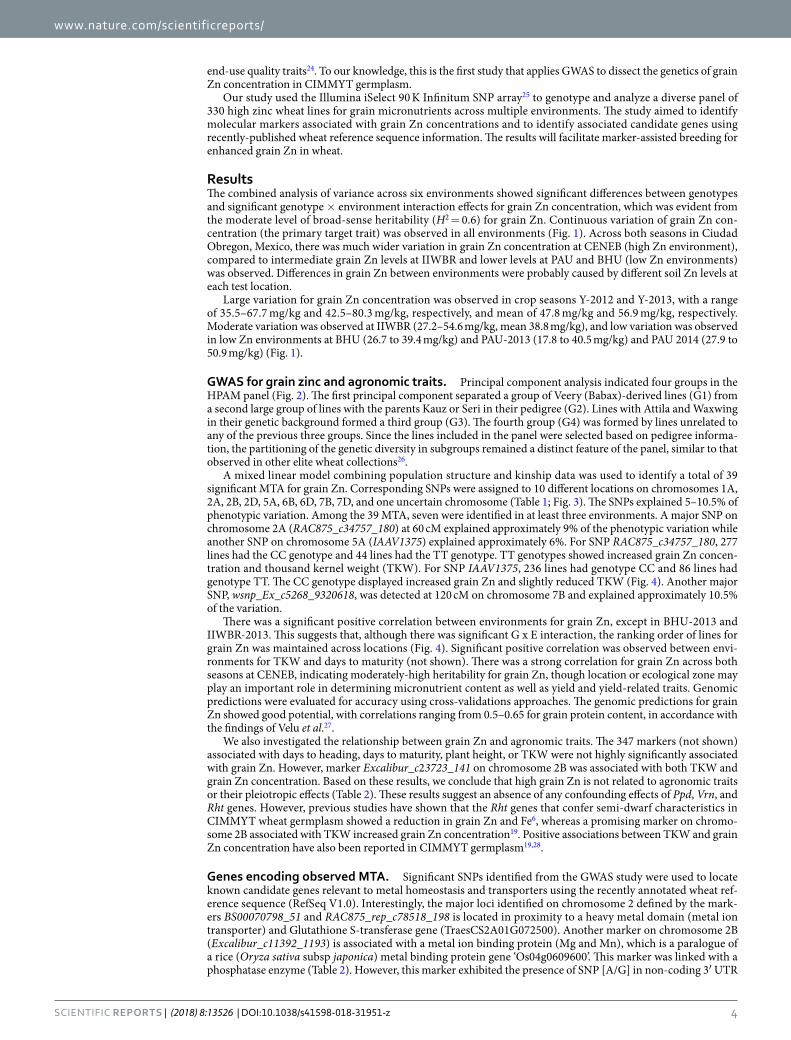
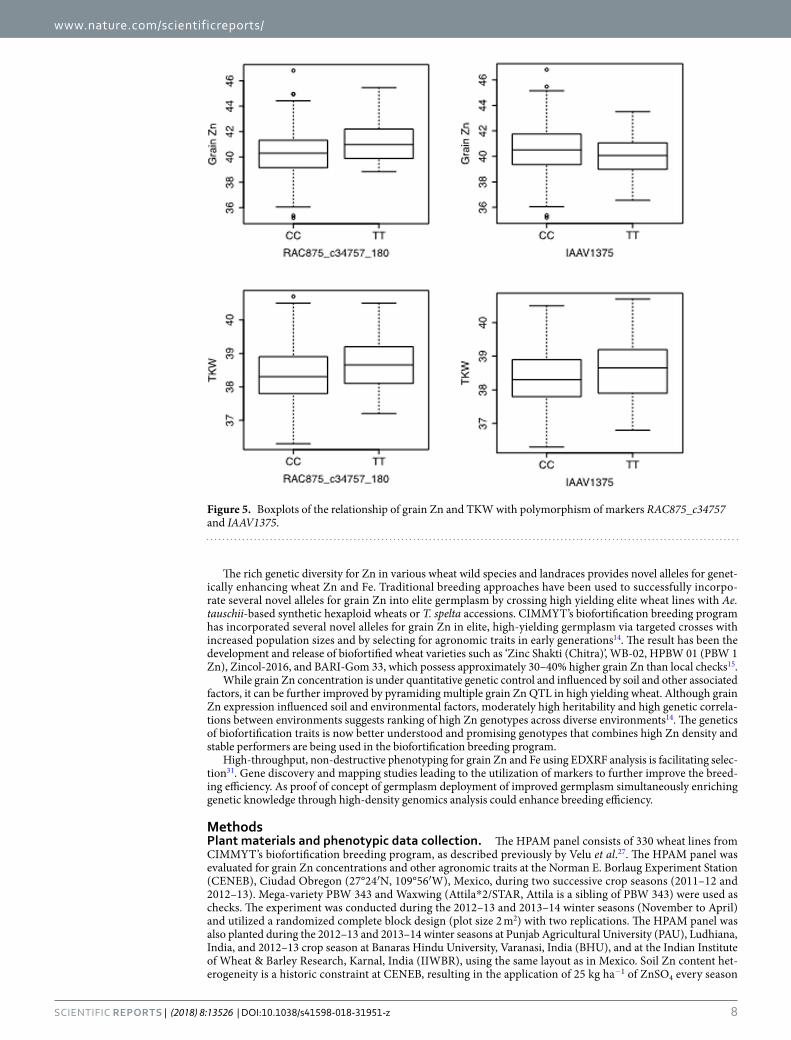
A mixed linear model combining population structure and kinship data was used to identify a total of 39 significant MTA for grain Zn. Corresponding SNPs were assigned to 10 different locations on chromosomes 1A, 2A, 2B, 2D, 5A, 6B, 6D, 7B, 7D, and one uncertain chromosome (Table 1; Fig. 3). The SNPs explained 5–10.5% of phenotypic variation. Among the 39 MTA, seven were identified in at least three environments. A major SNP on chromosome 2A (RAC875_c34757_180) at 60 cM explained approximately 9% of the phenotypic variation while another SNP on chromosome 5A (IAAV1375) explained approximately 6%. For SNP RAC875_c34757_180, 277 lines had the CC genotype and 44 lines had the TT genotype. TT genotypes showed increased grain Zn concen-tration and thousand kernel weight (TKW). For SNP IAAV1375, 236 lines had genotype CC and 86 lines had genotype TT. The CC genotype displayed increased grain Zn and slightly reduced TKW (Fig. 4). Another major SNP, wsnp_Ex_c5268_9320618, was detected at 120 cM on chromosome 7B and explained approximately 10.5% of the variation.
There was a significant positive correlation between environments for grain Zn, except in BHU-2013 and IIWBR-2013. This suggests that, although there was significant G x E interaction, the ranking order of lines for grain Zn was maintained across locations (Fig. 4). Significant positive correlation was observed between envi-ronments for TKW and days to maturity (not shown). There was a strong correlation for grain Zn across both seasons at CENEB, indicating moderately-high heritability for grain Zn, though location or ecological zone may play an important role in determining micronutrient content as well as yield and yield-related traits. Genomic predictions were evaluated for accuracy using cross-validations approaches. The genomic predictions for grain Zn showed good potential, with correlations ranging from 0.5–0.65 for grain protein content, in accordance with the findings of Velu et al.27.
We also investigated the relationship between grain Zn and agronomic traits. The 347 markers (not shown) associated with days to heading, days to maturity, plant height, or TKW were not highly significantly associated with grain Zn. However, marker Excalibur_c23723_141 on chromosome 2B was associated with both TKW and grain Zn concentration. Based on these results, we conclude that high grain Zn is not related to agronomic traits or their pleiotropic effects (Table 2). These results suggest an absence of any confounding effects of Ppd, Vrn, and Rht genes. However, previous studies have shown that the Rht genes that confer semi-dwarf characteristics in CIMMYT wheat germplasm showed a reduction in grain Zn and Fe6, whereas a promising marker on chromo-some 2B associated with TKW increased grain Zn concentration19. Positive associations between TKW and grain Zn concentration have also been reported in CIMMYT germplasm19,28.
Genes encoding observed MTA. Significant SNPs identified from the GWAS study were used to locate known candidate genes relevant to metal homeostasis and transporters using the recently annotated wheat ref-erence sequence (RefSeq V1.0). Interestingly, the major loci identified on chromosome 2 defined by the mark-ers BS00070798_51 and RAC875_rep_c78518_198 is located in proximity to a heavy metal domain (metal ion transporter) and Glutathione S-transferase gene (TraesCS2A01G072500). Another marker on chromosome 2B (Excalibur_c11392_1193) is associated with a metal ion binding protein (Mg and Mn), which is a paralogue of a rice (Oryza sativa subsp japonica) metal binding protein gene ‘Os04g0609600’. This marker was linked with a phosphatase enzyme (Table 2). However, this marker exhibited the presence of SNP [A/G] in non-coding 3′ UTR
www.nature.com/scientificreports/
5SCIentIfIC RePoRTS | (2018) 8:13526 | DOI:10.1038/s41598-018-31951-z
region and did not exhibit any alteration in corresponding protein when the marker-linked cDNA was computa-tionally translated into a putative protein. Further BLAST-N analysis revealed the higher conservation and 100% identity of this protein with Aegilops taushii, 90% with T. urartu, 92% with Oryza sativa, and more than 80% iden-tity with other dicot species. This analysis revealed higher conservation of this gene from monocots to dicots and this marker is linked with an essential gene phosphatase for catalyzing phosphate ion cleavage on target proteins. It is presumed that higher phosphorous concentration competes with Zn accumulation and this phosphatase enzyme catalyzes phosphate and helps to accumulate more Zn in grain. Moreover, this phosphatase enzyme is an Mg2+ or Mn2+-dependent protein, which is highly conserved even from prokaryotes to eukaryotes.
Figure 3. Significant SNPs (−10 log P values) associated with grain Zn from the Manhattan plot analysis of five promising environments.

www.nature.com/scientificreports/
6SCIentIfIC RePoRTS | (2018) 8:13526 | DOI:10.1038/s41598-018-31951-z
One of the markers on chromosome 7B (wsnp_Ex_c5268_9320618) aligned with the database sequence from plants.ensembl.org. This marker was identified as ‘Zn finger motif ’ with synonymous mutation. We expect that this transcription factor would not affect its own function and thus should not affect activation of downstream genes. This kind of genes is highly conserved and may sustain the function of other genes. Since it is ‘Zn finger motif ’, a certain level of Zn is necessary for gene function, or if additional Zn becomes available the function of this transcription factor will be activated29.
Interestingly, another marker on chromosome 6B (Ra_c7673_1788) was associated with ABC transporter G family (28-like). The ABC transporter in wheat is associated with pathogenic defense (for example, Lr34) and is critical for adaptation to stress environments30. Subsequent analysis suggests that allelic variation in SNPs (CC vs. TT) had appreciable positive effects on grain Zn and TKW for the SNP RAC875_c34757_180 on chromosome 2B Fig. 5. In contrast, SNP IAAV1375 on chromosome 5A had a positive effect on grain Zn but negative effect on TKW. Nevertheless, there was a positive pleiotropic effect of grain Zn with TKW, which is evident from the positive significant correlation between grain Zn and TKW19,28.
DiscussionThe diverse panel of 330 wheat lines were phenotyped in a range of environments in India and in Mexico and genotyped using the high-density iselect 90 K SNP assay to disclose the genetic mechanism of Zn accumulation in wheat grain. GWAS identified 39 MTA for grain Zn concentration, and associated candidate genes were localized using the sequence annotation (RefSeq v1.0) for finding the positions of the markers and the annotations of the genes. GWAS study identified two major effect QTL on 2 and 7 chromosome groups. A number of QTL for high grain Fe and Zn have been mapped on 2 and 7 chromosomes of wheat19–22. These results confirm that the group 2 and 7 chromosomes holding genes for nutrient uptake, translocation and sequestration of mineral in wheat plant21,23.
This study identified some promising genetic loci associated with grain Zn in wheat. Novel candidate regions, together with genes previously shown to regulate metal homeostasis genes, are among the promising genes for further validation and testing in CIMMYT wheat germplasm. Major QTL regions were identified on chromo-somes 2B and 7B, concurring with previous studies and highlighting the potential of this region for fine mapping and gene discovery research. Our results indicate that the Zinc finger motif transcription factor and phosphatase (metal ion binding) play major roles in loading additional Zn to the wheat grain. Functional analysis is now being conducted for the selected markers using metabolomics approaches to give further information about Zn accu-mulation regulators and associated metal transport pathways. The markers and allelic combinations identified here can be used for marker-assisted selection. Fixing and accumulating these common loci and introducing new rare alleles into high-yielding elite germplasm represents a promising opportunity in breeding Zn biofortified wheat. In addition, genomic prediction based on all SNPs seems to be a more effective strategy than selection based on only a few SNPs. Genomic prediction approaches using dense DNA markers can therefore enable more efficient selection of lines at early stages of wheat breeding programs to reduce the breeding cycle compared to phenotyping.
Our study provides comprehensive use of wild progenitor species such as T. spelta, T. dicoccum, and Ae. tauschii for offering new source of alleles for high grain Zn in wheat. Sequences of significant SNP markers were aligned to contigs on publicly available databases (e.g. https://urgi.versailles.inra.fr/) to identify candidate
Figure 4. Correlation co-efficient between environments for grain Zn concentration.

www.nature.com/scientificreports/
7SCIentIfIC RePoRTS | (2018) 8:13526 | DOI:10.1038/s41598-018-31951-z
genes from wheat, barley, Brachypodium, and rice. Furthermore, SNPs and corresponding gene sequences allowed us to anchor the some potential genomic regions (e.g. Zinc finger motif and metal ion binding genes) to recently-released wheat assemblies that are being investigated for genes involved in the biosynthesis and metal transport pathways. These genes, together with other known candidate genes, are being investigated and sig-nificant SNPs will be converted into Kompetitive Allele Specific PCR (KASP) markers that can be efficiently employed to transfer rare alleles into elite wheat lines. This study has demonstrated that modern genotyping technologies efficiently detect promising loci for nutritional quality traits. The development of PCR-based mark-ers (such as KASP assays) can accelerate breeding through efficient marker-assisted selection and by pyramiding diverse QTL regions from different genetic resources.
Transcription factor candidate genes known to be associated with Zn accumulation which were mapped on chromosome 7B and probably associated with loci identified in bi-parental QTL analyses21. In addition, 18 SNPs identified in this study were co-located in/near regions of QTL for seed size. The co-location of QTL for Zn with seed size indicates that breeding for both higher micronutrients and seed size is highly possible. Marker-assisted selection for high Zn and Fe could simultaneously improve multi-associated target traits of seed size by using the co-associated genetic loci.
S. No. Marker Chromosome Position p Marker_R2Genetic Variance Linked genes
Candidate genes (closest/nearby) Species
1 Kukri_c12683_1309 1A 40 0 9 11.9
TRIAE_CS42_7AS_TGACv1_571804_AA1849960
BTB/POZ domain-containing protein At3g05675-like
Aegilops taushii
2 RAC875_c34757_180 2A 60 0 9.1 11.9
TRIAE_CS42_2AS_TGACv1_112656_AA0342940
Na+/H+ antiporter (NHX2)
T. aestivum
3 BobWhite_c48481_81 2A 21 0 7.3 11.9
TRIAE_CS42_2AS_TGACv1_113144_AA0352040
Vacuolar protein sorting-associated protein 54
Aegilops taushii
4 RAC875_c18463_156 2B 66 0 8.6 11.9
5 RAC875_c29913_139 2B 88 0 8.3 11.9
TRIAE_CS42_2DL_TGACv1_160628_AA0552420
D-3-phosphoglycerate dehydrogenase 1, chloroplastic-like
Aegilops taushii
6 Kukri_rep_c104810_341 2B 64 0 7.4 11.9
7 Excalibur_c23723_141 2B 60 0 6.7 11.9
TRIAE_CS42_2BS_TGACv1_147153_AA0478820
8 Excalibur_c19649_1500 2B 78 0 6.5 3.4
TRIAE_CS42_2BL_TGACv1_130672_AA0415740
BEACH domain-containing protein C2
Aegilops taushii
9 Kukri_c14902_1112 2D 67 0 9.3 11.9
10 Ku_c19185_1569 2D 40 0 8.1 10.2TRIAE_CS42_2DL_TGACv1_159449_AA0538480
11 IAAV1375 5A 21 0 6.6 11.9TRIAE_CS42_5AL_TGACv1_377519_AA1247650
Probable UDP-arabinose 4-epimerase 1
Aegilops taushii
12 Excalibur_c7546_1286 6D 122 0 8.7 10.2
TRIAE_CS42_6DL_TGACv1_526968_AA1696350
13 wsnp_Ex_c5268_9320618 7B 120 0 10.4 11.9
TRIAE_CS42_7BL_TGACv1_578120_AA1889690
Zinc finger CCCH domain-containing protein 13
Brachpodium
14 wsnp_Ex_c8400_14157318 7B 120 0 9.5 10.2
TRIAE_CS42_7BL_TGACv1_579256_AA1905850
NF-X1-type zinc finger protein NFXL1-like
Aegilops taushii
15 BS00004376_51 7B 130 0 7 3.4TRIAE_CS42_7BL_TGACv1_577483_AA1876500
TaMYB59 MYB-related protein T. aestivum
16 RAC875_c34939_963 7B 140 0 6.9 3.4
TRIAE_CS42_7BL_TGACv1_578066_AA1888730
17 wsnp_Ex_c24135_33382700 UN 1 0 9.9 11.9
TRIAE_CS42_2BL_TGACv1_131885_AA0433240
Protein IQ-DOMAIN 32 Brachpodium
Table 2. List of candidate genes associated with the stable SNPs identified.
www.nature.com/scientificreports/
8SCIentIfIC RePoRTS | (2018) 8:13526 | DOI:10.1038/s41598-018-31951-z
The rich genetic diversity for Zn in various wheat wild species and landraces provides novel alleles for genet-ically enhancing wheat Zn and Fe. Traditional breeding approaches have been used to successfully incorpo-rate several novel alleles for grain Zn into elite germplasm by crossing high yielding elite wheat lines with Ae. tauschii-based synthetic hexaploid wheats or T. spelta accessions. CIMMYT’s biofortification breeding program has incorporated several novel alleles for grain Zn in elite, high-yielding germplasm via targeted crosses with increased population sizes and by selecting for agronomic traits in early generations14. The result has been the development and release of biofortified wheat varieties such as ‘Zinc Shakti (Chitra)’, WB-02, HPBW 01 (PBW 1 Zn), Zincol-2016, and BARI-Gom 33, which possess approximately 30–40% higher grain Zn than local checks15.
While grain Zn concentration is under quantitative genetic control and influenced by soil and other associated factors, it can be further improved by pyramiding multiple grain Zn QTL in high yielding wheat. Although grain Zn expression influenced soil and environmental factors, moderately high heritability and high genetic correla-tions between environments suggests ranking of high Zn genotypes across diverse environments14. The genetics of biofortification traits is now better understood and promising genotypes that combines high Zn density and stable performers are being used in the biofortification breeding program.
High-throughput, non-destructive phenotyping for grain Zn and Fe using EDXRF analysis is facilitating selec-tion31. Gene discovery and mapping studies leading to the utilization of markers to further improve the breed-ing efficiency. As proof of concept of germplasm deployment of improved germplasm simultaneously enriching genetic knowledge through high-density genomics analysis could enhance breeding efficiency.
MethodsPlant materials and phenotypic data collection. The HPAM panel consists of 330 wheat lines from CIMMYT’s biofortification breeding program, as described previously by Velu et al.27. The HPAM panel was evaluated for grain Zn concentrations and other agronomic traits at the Norman E. Borlaug Experiment Station (CENEB), Ciudad Obregon (27°24′N, 109°56′W), Mexico, during two successive crop seasons (2011–12 and 2012–13). Mega-variety PBW 343 and Waxwing (Attila*2/STAR, Attila is a sibling of PBW 343) were used as checks. The experiment was conducted during the 2012–13 and 2013–14 winter seasons (November to April) and utilized a randomized complete block design (plot size 2 m2) with two replications. The HPAM panel was also planted during the 2012–13 and 2013–14 winter seasons at Punjab Agricultural University (PAU), Ludhiana, India, and 2012–13 crop season at Banaras Hindu University, Varanasi, India (BHU), and at the Indian Institute of Wheat & Barley Research, Karnal, India (IIWBR), using the same layout as in Mexico. Soil Zn content het-erogeneity is a historic constraint at CENEB, resulting in the application of 25 kg ha−1 of ZnSO4 every season
Figure 5. Boxplots of the relationship of grain Zn and TKW with polymorphism of markers RAC875_c34757 and IAAV1375.
www.nature.com/scientificreports/
9SCIentIfIC RePoRTS | (2018) 8:13526 | DOI:10.1038/s41598-018-31951-z
since 2009–10 to enrich the available soil Zn and minimize Zn heterogeneity. Sufficient nutrition and water were supplied throughout the trials to avoid potential nutrient and drought stresses. Fungicide and pesticides were applied to protect the crop from pest and diseases. Field observations were recorded for TKW, plant height, days to heading and days to maturity.
Grain sampling and trait determination. Plant materials were harvested after physiological maturity when grains were totally dry in the field. Grain samples (approx. 20 g/entry) were carefully cleaned, with broken grains and foreign materials discard, and the residual sample was used for micronutrient analysis. Grain samples from all five environments were analyzed using a ‘bench-top’, non-destructive, energy-dispersive X-ray fluores-cence spectrometry (EDXRF) instrument (model X-Supreme 8000, Oxford Instruments plc, Abingdon, UK) that was standardized for high-throughput screening of grain Zn and Fe concentration (unit: mg/kg) in wholegrain wheat31. A proficiency study was conducted by Flinders University, Adelaide comparing EDXRF instrument results with the original Inductively Coupled Plasma (ICP) data which confirmed that the EDXRF results are reproducible. Soil analysis of the experimental area showed average Zn concentration of 1.3 ppm at 0–30 cm depth and 0.78 ppm at a soil depth of 30–60 cm.
Statistical models. Broad-sense heritability (H2) was estimated across environments, using the formula σ σ σ σ= + +H g g ge e rl/( /1 / )2 2 2 2 2 , where σg2 is the genotypic variance, σge2 is the genotype × environment
variance, and σe2 is the residual error variance for r replicates and l locations using the R program. Genotypic values (i.e. line means) were estimated as Best Linear Unbiased Estimators as fixed effect, with a random effect for replicates nested within each environment.
Genotypic data and GWAS. DNA was extracted according to standard CTAB procedures and genotyped using the Illumina iSelect 90 K Infinitum SNP array developed in wheat25. The array revealed a total of 28,074 SNP markers, which we coded as 0 and 1 for homozygote and 0.5 for heterozygote allele scores for data analysis. Markers were filtered for 70% missing data, 0.10 minor allele frequency, and greater than 10% heterozygosity, giving a remaining total of 14,273 SNP markers for GWAS.
Significant MTAs were identified using the mixed linear model approach in TASSEL5.0, which simultaneously accounted for population structure and kinship. Population structure (summarized by the Q matrix) was inferred by the STRUCTURE program v.2.2, and the kinship matrix (summarized by the K matrix) was calculated using TASSEL5.0. SNPs with p ≤ 0.0001 were considered significantly associated with individual traits. R2 was used to evaluate the magnitude of MTA effects. The recent version of IWGSC RefSeq v1.0 have been accessed for identi-fying associated candidate genes.
References 1. World Health Organization. The double burden of malnutrition, http://www.who.int/nutrition/publications/doubleburdenmalnutrition-
policybrief/en/ (2017). 2. Black, R. E. et al. Maternal and child undernutrition and overweight in low-income and middle-income countries. The Lancet 382,
427–451, https://doi.org/10.1016/s0140-6736(13)60937-x (2013). 3. Cakmak, I. Enrichment of cereal grains with zinc: Agronomic or genetic biofortification? Plant Soil 302, 1–17, https://doi.
org/10.1007/s11104-007-9466-3 (2007). 4. Stoecker, B. J. et al. Zinc status and cognitive function of pregnant women in southern ethiopia. Eur. J. Clin. Nutri. 63, 916–918,
https://doi.org/10.1038/ejcn.2008.77 (2009). 5. White, P. J. & Broadley, M. R. Physiological limits to zinc biofortification of edible crops. Front. Plant Sci. 2, 80, https://doi.
org/10.3389/fpls.2011.00080 (2011). 6. Velu, G., Singh, R. P., Huerta, J. & Guzmán, C. Genetic impact of rht dwarfing genes on grain micronutrients concentration in wheat.
Field Crop. Rese. 214, 373–377, https://doi.org/10.1016/j.fcr.2017.09.030 (2017). 7. Lantican, M. et al. Impacts of International Wheat Improvement Research, 1994–2014. https://repository.cimmyt.org/xmlui/
bitstream/handle/10883/4822/57826.pdf?sequence=4. 8. Bouis, H. E., Hotz, C., Mcclafferty, B., Meenakshi, J. V. & Pfeiffer, W. H. Biofortification: a new tool to reduce micronutrient
malnutrition. Food Nutr. Bull. 32, 31S–40S, https://doi.org/10.1079/9781780642994.0202 (2011). 9. Ishimaru, Y., Bashir, K. & Nishizawa, N. K. Zn uptake and translocation in rice plants. Rice 4, 21–27, https://doi.org/10.1007/s12284-
011-9061-3 (2011). 10. Sinclair, S. A. & Krämer, U. The zinc homeostasis network of land plants. Biochimica et Biophys. Acta (BBA) – Mol. Cell Res. 1823,
1553–1567, https://doi.org/10.1016/j.bbamcr.2012.05.016 (2012). 11. Sperotto, R. A., Ricachenevsky, F. K., Waldow, V. D. A. & Fett, J. P. Iron biofortification in rice: Its a long way to the top. Plant Sci. 190,
24–39, https://doi.org/10.1016/j.plantsci.2012.03.004 (2012). 12. Sperotto, R. A. Zn/fe remobilization from vegetative tissues to rice seeds: should i stay or should i go? ask zn/fe supply! Front. Plant
Sci. 4, https://doi.org/10.3389/fpls.2013.00464 (2013). 13. Cakmak, I., Pfeiffer, W. H. & Mcclafferty, B. Biofortification of durum wheat with zinc and iron. Cereal Chem. J. 87, 10–20, https://
doi.org/10.1094/cchem-87-1-0010 (2010). 14. Velu, G., Ortiz-Monasterio, I., Cakmak, I., Hao, Y. & Singh, R. Biofortification strategies to increase grain zinc and iron
concentrations in wheat. J. Cereal Sci. 59, 365–372, https://doi.org/10.1016/j.jcs.2013.09.001 (2014). 15. Velu, G. et al. Reaching out to farmers with high zinc wheat varieties through public-private partnerships – an experience from
eastern-gangetic plains of india. Adv. Food Technol. Nutr. Sci. 1, 73–75, https://doi.org/10.17140/aftnsoj-1-112 (2015). 16. Breseghello, F. & Sorrells, M. E. Association analysis as a strategy for improvement of quantitative traits in plants. Crop. Scie. 46,
1323, https://doi.org/10.2135/cropsci2005.09-0305 (2006). 17. Bradbury, P. J. et al. Tassel: software for association mapping of complex traits in diverse samples. Bioinforma. 23, 2633–2635, https://
doi.org/10.1093/bioinformatics/btm308 (2007). 18. Lopes, M. S., Dreisigacker, S., Peñ, A. R. J., Sukumaran, S. & Reynolds, M. P. Genetic characterization of the wheat association
mapping initiative (wami) panel for dissection of complex traits in spring wheat. Theor. Appl. Genet. 128, 453–464, https://doi.org/10.1007/s00122-014-2444-2 (2014).

www.nature.com/scientificreports/
1 0SCIentIfIC RePoRTS | (2018) 8:13526 | DOI:10.1038/s41598-018-31951-z
19. Hao, Y., Velu, G., Peñ, A. R. J., Singh, S. & Singh, R. P. Genetic loci associated with high grain zinc concentration and pleiotropic effect on kernel weight in wheat (triticum aestivum l.). Mol. Breed. 34, 1893–1902, https://doi.org/10.1007/s11032-014-0147-7 (2014).
20. Velu, G. et al. Qtl mapping for grain zinc and iron concentrations and zinc efficiency in a tetraploid and hexaploid wheat mapping populations. Plant Soil 411, 81–99, https://doi.org/10.1007/s11104-016-3025-8 (2016).
21. Crespo-Herrera, L. A., Govindan, V., Stangoulis, J., Hao, Y. & Singh, R. P. Qtl mapping of grain zn and fe concentrations in two hexaploid wheat ril populations with ample transgressive segregation. Front. Plant Sci. 8, 1800–1800, https://doi.org/10.3389/fpls.2017.01800 (2017).
22. Srinivasa, J. et al. Zinc and iron concentration qtl mapped in a triticum spelta x t. aestivum cross. Theor. Appl. Genet. 127, 1643–1651, https://doi.org/10.1007/s00122-014-2327-6 (2014).
23. Tiwari, V. K. et al. Mapping of quantitative trait loci for grain iron and zinc concentration in diploid a genome wheat. J. Hered. 100, 771–776, https://doi.org/10.1093/jhered/esp030 (2009).
24. Battenfield, S. D. et al. Genomic selection for processing and end-use quality traits in the cimmyt spring bread wheat breeding program. The Plant Genome 9 https://doi.org/10.3835/plantgenome2016.01.0005 (2016).
25. Wang, S. et al. Characterization of polyploid wheat genomic diversity using a high-density 90,000 snp array. Plant biotechnology journal 12, 787–796 (2014).
26. Sehgal, D. et al. Identification of genomic regions for grain yield and yield stability and their epistatic interactions. Sci. Reports 7, 41578, https://doi.org/10.1038/srep41578 (2017).
27. Velu, G. et al. Genomic prediction for grain zinc and iron concentrations in spring wheat. Theor. applied genetics 129, 1595–1605 (2016).
28. Crespo-Herrera, L., Velu, G. & Singh, R. Quantitative trait loci mapping reveals pleiotropic effect for grain iron and zinc concentrations in wheat. Annals Appl. Biol. 169, 27–35, https://doi.org/10.1111/aab.12276 (2016).
29. Kambe, T., Hashimoto, A. & Fujimoto, S. Current understanding of zip and znt zinc transporters in human health and diseases. Cell. molecular life sciences 71, 3281–3295 (2014).
30. Krattinger, S. G. et al. A putative abc transporter confers durable resistance to multiple fungal pathogens in wheat. Sci. 323, 1360–1363 (2009).
31. Paltridge, N. G. et al. Energy-dispersive x-ray fluorescence spectrometry as a tool for zinc, iron and selenium analysis in whole grain wheat. Plant Soil 361, 261–269, https://doi.org/10.1007/s11104-012-1423-0 (2012).
AcknowledgementsThe authors acknowledge the financial support from the HarvestPlus challenge program and CGIAR research program on Agriculture for Nutrition and Health (partly funded by Bill and Melinda Gates Foundation [OPP1019962]). Special thanks to Yuanfeng Hao for outsourcing the genotyping service at Kansas State University, Manhattan, USA. Editing assistance from Emma Quilligan is appreciated.
Author ContributionsG.V. designed the field experiments and drafted the manuscript; P.J. conducted GWAS analysis; R.P.S., L.C.-H., A.K.J., R.C., A.B., V.K.M., G.S.M., G.P.S., V.G. and V.S.S. and conducted field experiments; J.S., R.V. and S.D. conducted bioinformatics to identify associated candidate genes.
Additional InformationCompeting Interests: The authors declare no competing interests.Publisher's note: Springer Nature remains neutral with regard to jurisdictional claims in published maps and institutional affiliations.
Open Access This article is licensed under a Creative Commons Attribution 4.0 International License, which permits use, sharing, adaptation, distribution and reproduction in any medium or
format, as long as you give appropriate credit to the original author(s) and the source, provide a link to the Cre-ative Commons license, and indicate if changes were made. The images or other third party material in this article are included in the article’s Creative Commons license, unless indicated otherwise in a credit line to the material. If material is not included in the article’s Creative Commons license and your intended use is not per-mitted by statutory regulation or exceeds the permitted use, you will need to obtain permission directly from the copyright holder. To view a copy of this license, visit http://creativecommons.org/licenses/by/4.0/. © The Author(s) 2018
![Dissection-BKW · 2018. 6. 1. · Dissection. Wereplaceournaive c -sumalgorithmbymoreadvancedtime-memorytechniqueslike Schroeppel-Shamir[34]anditsgeneralization,Dissection[11],toreducetheclassicrunningtime.Wecall](https://img.pdfslide.us/doc/110x75/5ffc5cc4c887922f656f708b/dissection-bkw-2018-6-1-dissection-wereplaceournaive-c-sumalgorithmbymoreadvancedtime-memorytechniqueslike.jpg)