Embed Size (px)
Citation preview
Genetic Characterization of Lagocephalus spadiceus among Two Populations Using
Microsatellite DNA Markers
Janet Tang Hung Sing
(18592)
A Thesis submitted in partial fulfillment of
the requirements for the degree of Bachelor of Science with Honours
(Resource Biotechnology)
Faculty of Resource Science and Technology
University Malaysia Sarawak 2010

ACKNOWLEDGEMENTS
I would like to extend my sincere thanks to my supervisor, Dr. Yuzine B. Esa for giving me an
opportunity to work under this project under his careful guidance, encouragement and generous
suggestion throughout this project. Also making an invaluable contribution to this project is Mr.
Huzal, lab assistant for his assistance especially in term of technical problems. Lastly, I would
like my special thanks to the Ms. Ting Jen Ching for sharing her lab work experiences and
knowledge with my throughout project; not forgetting my friends, especially Bong Siew Fong
for teaching me techniques regarding to lab works. I am also wish to thank to my family
members for their support and comfort.
ii
TABLE OF CONTENTS
Content Page
Acknowledgement ii
Table of Contents iii
List of Abbreviations v
Listing of Figures vi
Listing of Tables vii
Abstract viii
CHAPTER 1: INTRODUCTION
1.1 Introduction 1
1.2 Objectives 3
CHAPTER 2: LITERATURE REVIEW
2.1 Puffer fish, Lagocephalus spadiceus 4
2.2 Microsatellite 6
2.3 PCR optimization 7
2.4 Genetic characterization 8
2.5 Cross-species microsatellite amplification 9
iii
CHAPTER 3: MATERIALS AND METHODS
3.1 DNA extractions 10
3.2 PCR
3.2.1 Microsatellite primers 10
3.2.2 PCR optimization and PCR amplification 12
3.3 Agarose gel electrophoresis 13
CHAPTER 4 : RESULT 15
CHAPTER 5: DISCUSSION 23
CHAPTER 6: CONCLUSION and RECOMMENDATION 29
REFERENCES 30
APPENDIX 1 36
APPENDIX 2 38
APPENDIX 3 39
APPENDIX 4 40
iv
List of Abbreviations
0C Degree Celsius
% Percent
µg Micro gram
mg Miligram
µl Micro liter
DNA Deoxyribonucleic acid
ng Nanogram
dNTP Deoxynucleoside-5’-triphosphate
M Mole
Taq Thermus Aquaticus
ml Mililiter
V Volume
PCR Polymerase Chain Reaction
rpm Rotation Per Minute
MgCl Magnesium Chloride
Kb kilo base
CTAB Hexadecyltrimethylammonium bromide
NaCl Sodium cholride
EtOH Ethanol
MgCl2 Magnesium (II) chloride
dNTPs Dioxyribonucleotidetriphosphate
v
LIST OF FIGURES
Figure Page
Figure 1.1: Location of the two populations (Kudat & Tawau) 2
Figure 2.2: Distribution map of Lagocephalus spadiceus 4
Figure 2.3: Picture of Lagocephalus spadiceus Tran, H.H. 5
Figure 4.4: Gel photograph shows DNA extraction bands for 15 samples
(M6-M10 & M21-M30) in population 1 17
Figure 4.5: PCR optimization result for pimers Tob 13 and Tob 53 18
Figure 4.6: PCR optimization result for the primers of P1 and P2 18
Figure 4.7: PCR optimization result for primers of P3 and P4 19
Figure 4.8: PCR optimization result for primers of P6 19
Figure 4.9: PCR amplification result for primer P6 20
Figure 4.10: PCR amplification of primer P3 with samples M1, M4-M10, M12,
M14, M15, M17&M18 21
Figure 4.11: PCR amplification of primer P3 with samples M19-M30 21
Figure 4.12: Gel photo shows PCR amplification of primer P3 with samples T1-T16 22
Figure 4.13: PCR amplification of primer P3 with samples T17-T28 22
vi
LIST OF TABLES
Tables Page
Table 3.1: Primer pairs designed for Takifugu rubriges 12
Table 3.2: Polymorphic microsatellite markers of Takifugu obscures 12
Table 3.4: Microsatellite PCR reaction mix 14
Table 3.4: Microsatellite PCR profile 14
Table 4.5: 8 Gradient temperature of PCR optimization for the primers of Tob13
and Tob53 respectively 18
Table 4.6: 8 Gradient temperatures of PCR optimization for the primer P2 18
Table 4.7: 8 Gradient temperatures for PCR optimization of both primers of P3 and P4
respectively 19
Table 4.8: 8 Gradient temperatures for PCR optimization for primer P6 20
vii
Genetic Characterization of Lagocephalus spadiceus among Two Populations Using
Microsatellite DNA Markers
Janet Tang Hung Sing
Resource Biotechnology Programme
Faculty of Resource Science and Technology
University Malaysia Sarawak
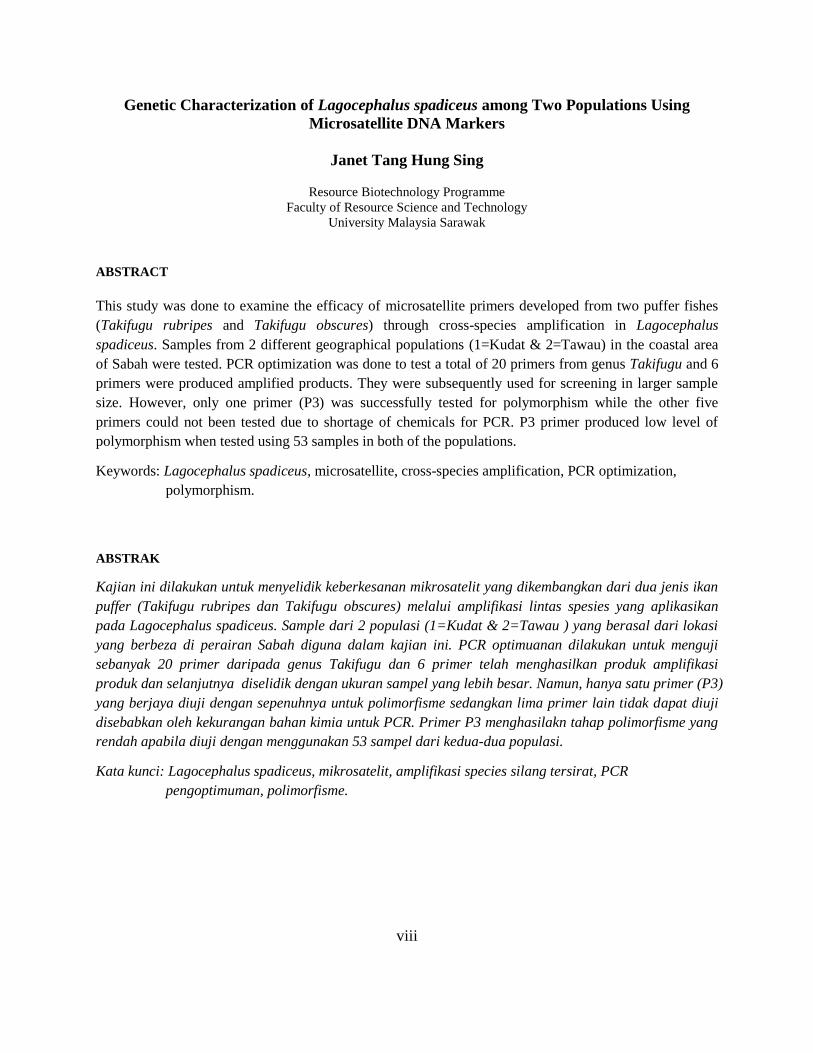
ABSTRACT
This study was done to examine the efficacy of microsatellite primers developed from two puffer fishes
(Takifugu rubripes and Takifugu obscures) through cross-species amplification in Lagocephalus
spadiceus. Samples from 2 different geographical populations (1=Kudat & 2=Tawau) in the coastal area
of Sabah were tested. PCR optimization was done to test a total of 20 primers from genus Takifugu and 6
primers were produced amplified products. They were subsequently used for screening in larger sample
size. However, only one primer (P3) was successfully tested for polymorphism while the other five
primers could not been tested due to shortage of chemicals for PCR. P3 primer produced low level of
polymorphism when tested using 53 samples in both of the populations.
Keywords: Lagocephalus spadiceus, microsatellite, cross-species amplification, PCR optimization,
polymorphism.
ABSTRAK
Kajian ini dilakukan untuk menyelidik keberkesanan mikrosatelit yang dikembangkan dari dua jenis ikan
puffer (Takifugu rubripes dan Takifugu obscures) melalui amplifikasi lintas spesies yang aplikasikan
pada Lagocephalus spadiceus. Sample dari 2 populasi (1=Kudat & 2=Tawau ) yang berasal dari lokasi
yang berbeza di perairan Sabah diguna dalam kajian ini. PCR optimuanan dilakukan untuk menguji
sebanyak 20 primer daripada genus Takifugu dan 6 primer telah menghasilkan produk amplifikasi
produk dan selanjutnya diselidik dengan ukuran sampel yang lebih besar. Namun, hanya satu primer (P3)
yang berjaya diuji dengan sepenuhnya untuk polimorfisme sedangkan lima primer lain tidak dapat diuji
disebabkan oleh kekurangan bahan kimia untuk PCR. Primer P3 menghasilakn tahap polimorfisme yang
rendah apabila diuji dengan menggunakan 53 sampel dari kedua-dua populasi.
Kata kunci: Lagocephalus spadiceus, mikrosatelit, amplifikasi species silang tersirat, PCR
pengoptimuman, polimorfisme.
viii
1
CHAPTER 1
INTRODUCTION
1.1 Introduction
Microsatellites are a good molecular approach toward study in genetic characterization as
they are abundant throughout the genome, highly polymorphism, co-dominant inheritance,
high heterozygosities, Mendelian inheritance and easy genotyping at DNA level (Koreth et al.,
1996). Microsatellite markers are PCR based method, low quantity of template DNA and
partially degraded DNA can be used (Murray, 1996). They are powerful tools that can be
exchanged between laboratories and their data are highly informative (Morgante & Oliveri,
1993). The use of microsatellite markers to analyze genetic variation has been increasingly
reported in the last few years (Mc Connell et al., 1995). They had been widely used to
investigate animal populations in order to gain good genetic information of the many different
aspects of species biology and ecology (Rustkowski et al., 2009).
However, lack of enough polymorphic microsatellite markers has limited the
development of genetic diversity, population structure, and molecular marker-assisted
breeding for fish species (Ma et al., 2008; Miao et al., 2008). In addition, their developments
are intensive and costly including requires cloning and sequencing. To overcome these
limitations, researches had adapted information about microsatellite markers originally
developed for one species for use in other closely related species (Rutkowski et al., 2007).
This technique is known as cross-species microsatellite amplification. Cross-species
microsatellite amplification not only frequently with success (Rutkowski et al., 2007) but also
promote genetic studies without developing polymorphic marker for each target species (Kim
et al., 2009). Therefore, cross-species microsatellite technique is an appropriate method
2
applied on this study as Lagocephalus spadiceus that has no molecular markers developed for
this species reported to date.
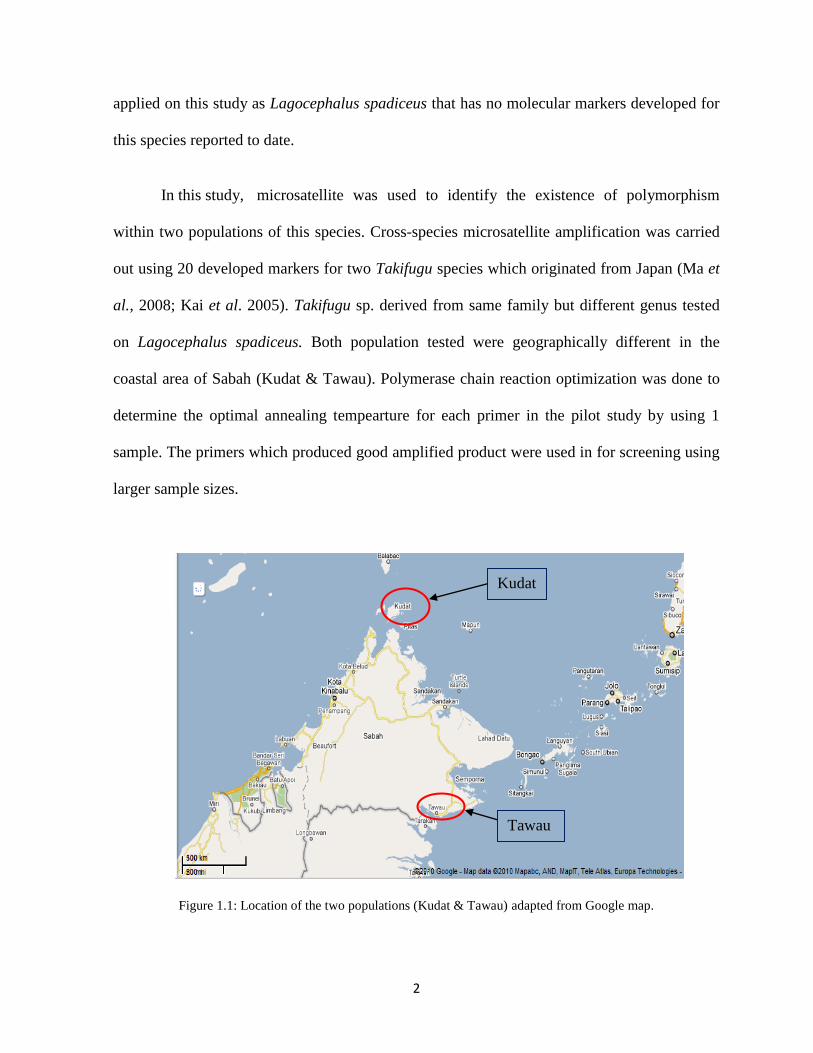
In this study, microsatellite was used to identify the existence of polymorphism
within two populations of this species. Cross-species microsatellite amplification was carried
out using 20 developed markers for two Takifugu species which originated from Japan (Ma et
al., 2008; Kai et al. 2005). Takifugu sp. derived from same family but different genus tested
on Lagocephalus spadiceus. Both population tested were geographically different in the
coastal area of Sabah (Kudat & Tawau). Polymerase chain reaction optimization was done to
determine the optimal annealing tempearture for each primer in the pilot study by using 1
sample. The primers which produced good amplified product were used in for screening using
larger sample sizes.
Figure 1.1: Location of the two populations (Kudat & Tawau) adapted from Google map.
Kudat
Tawau
3
1.2 Objectives
1. To identify microsatellite markers developed from Takifugu sp. in Lagocephalus spadiceus
through cross-species amplification technique.
2. To identify the polymorphic microsatellite markers from the amplified primers by screening
with larger sample size.
3. To determine level of polymorphism level between and within populations L. spadiceus.
4
CHAPTER 2
LITERATURE REVIEW
2.1 Puffer fish, Lagocephalus spadiceus
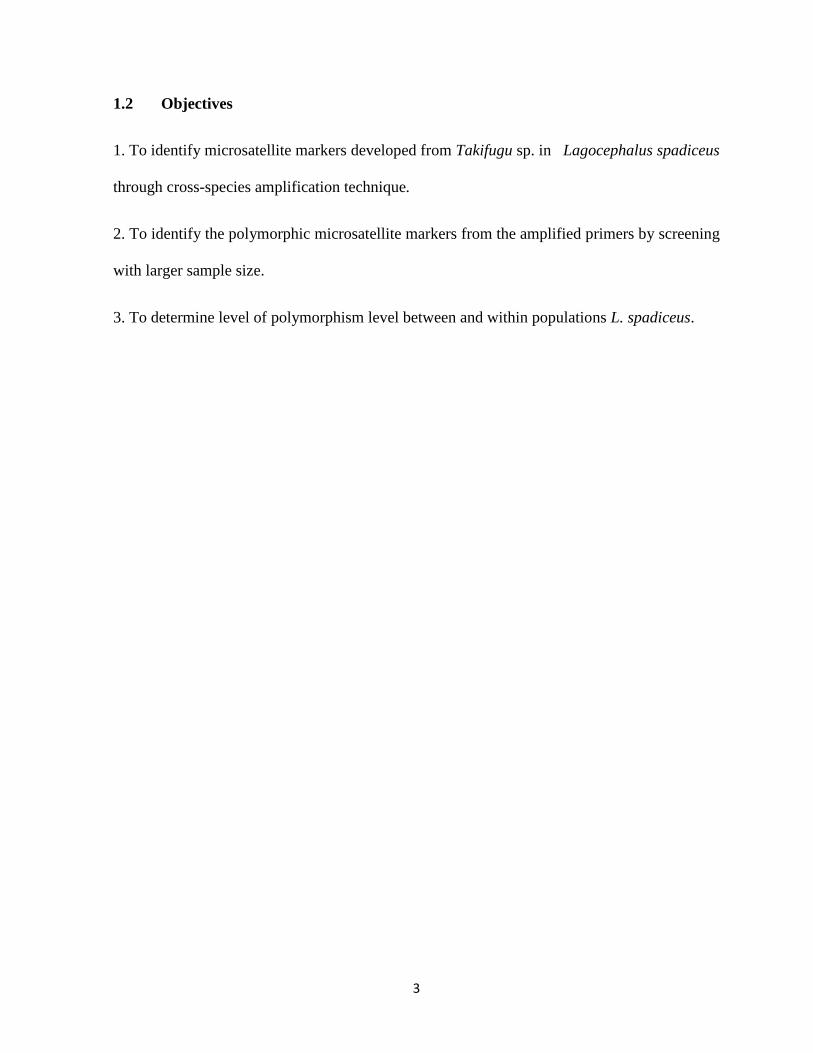
Lagocephalus spadiceus (Richardson, 1845) is known as half-smooth golden puffer fish. This
species is characterized by elongated body; dorsal and anal fin pointed; nasal organ consisting
of 2 holes on side of snout; smooth body except for small spines from chin to anus and on
abdomen; tail with slightly concave fin (Discovery life). It is generally distributed in temperate
and tropical sea area of Atlantic, Indian and Pacific (GBIF Data Portal).
Figure 2.2: Distribution map of Lagocephalus spadiceus adapted from GBIF Data Portal.
Note:* represents the distribution area of puffer fishes.
Taxonomy of Lagocephalus spadiceus is shown as below (Zipcodezoo):
Domain: Eukaryota
Kingdom: Animalia
Phylum: Chordata
Class: Actinopterygii
Order: Tetraodontiformes
5
Family: Tetraodontidae
Genus: Lagocephalus
Specific name: spadiceus
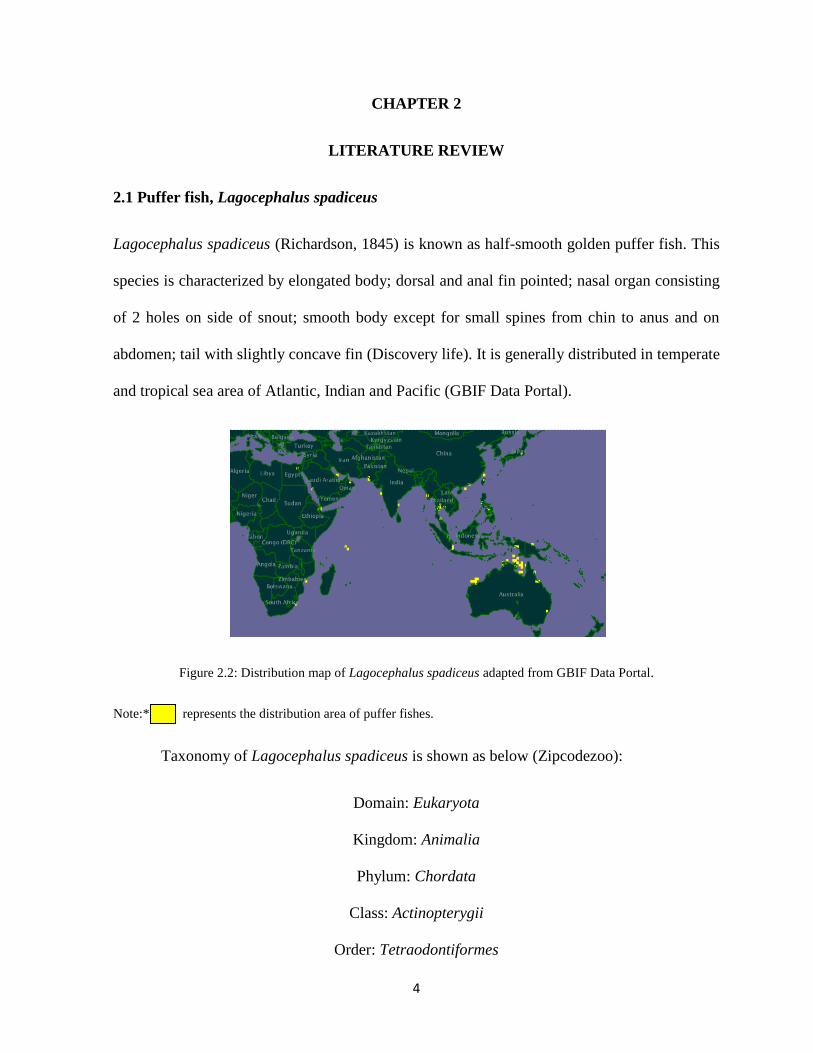
Figure 2.3: Picture of Lagocephalus spadiceus Tran, H.H. adapted from Google images.
Most of the puffer fishes contain toxin that come from the ingestion of the flesh or
viscera of certain species of the family Tetradontidae (Yu & Yu, 1998). They are popular as
one of the choices for the seafood consumption. Japan is the main consumer of cultured and
captured puffer fishes (Song et al., 2001). Lagocephalus spadiceus is a non-toxic puffer fish
that is considered as delicious and nutritious seafood among the local fishermen. However,
consumption of this species actually may cause effect of TTX (tetrodotoxin) intoxification (Yu
& Yu, 1998).
Puffer fishes are considered as good animal model for sequencing and mapping the
genomes of higher-taxa vertebrates (Song et al., 2001) since its genomes preserves the
structural complexity reflected in the intron and exon arrangements observed in the
homologous genes in the higher vertebrates (Elgar et al., 1996; Koop & Nadeau, 1996). There
was previously a genome project of Takifugu rubripes which also under the family of
Tetraodontidae completed in 2002 (Ma et al., 2008). The genome of this species can help to
discover genes and gene regulatory regions in the human genome (Kai et al. 2005).
6
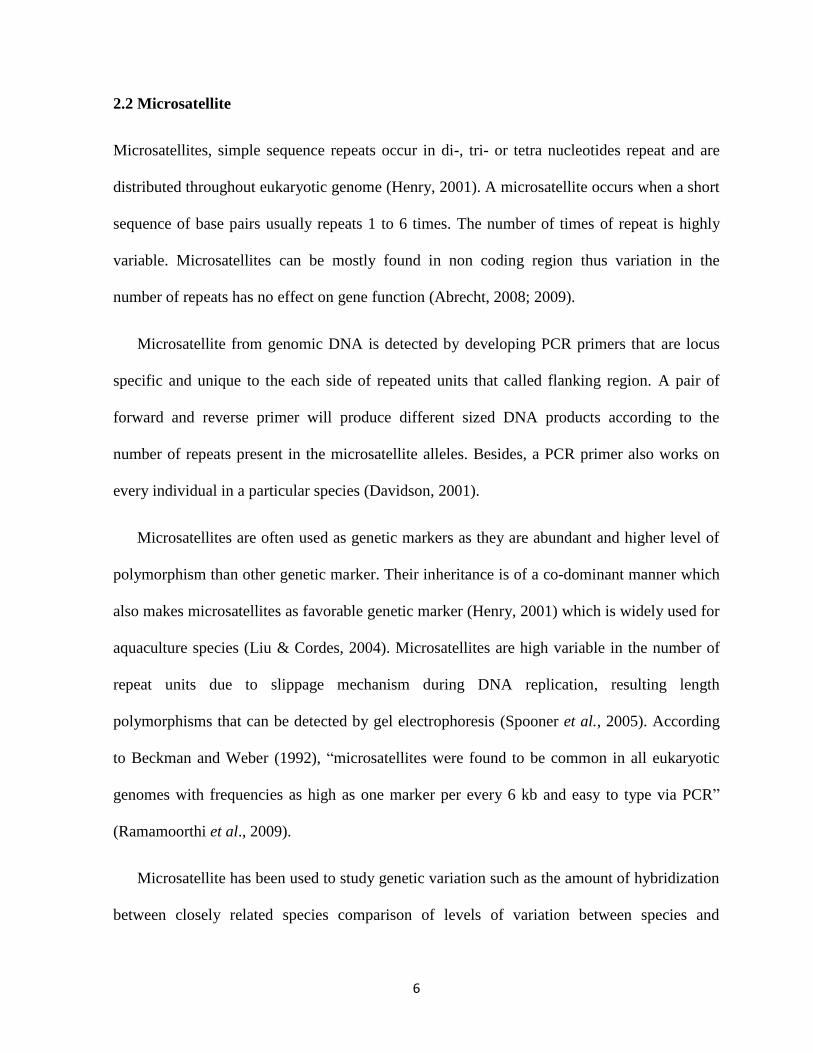
2.2 Microsatellite
Microsatellites, simple sequence repeats occur in di-, tri- or tetra nucleotides repeat and are
distributed throughout eukaryotic genome (Henry, 2001). A microsatellite occurs when a short
sequence of base pairs usually repeats 1 to 6 times. The number of times of repeat is highly
variable. Microsatellites can be mostly found in non coding region thus variation in the
number of repeats has no effect on gene function (Abrecht, 2008; 2009).
Microsatellite from genomic DNA is detected by developing PCR primers that are locus
specific and unique to the each side of repeated units that called flanking region. A pair of
forward and reverse primer will produce different sized DNA products according to the
number of repeats present in the microsatellite alleles. Besides, a PCR primer also works on
every individual in a particular species (Davidson, 2001).
Microsatellites are often used as genetic markers as they are abundant and higher level of
polymorphism than other genetic marker. Their inheritance is of a co-dominant manner which
also makes microsatellites as favorable genetic marker (Henry, 2001) which is widely used for
aquaculture species (Liu & Cordes, 2004). Microsatellites are high variable in the number of
repeat units due to slippage mechanism during DNA replication, resulting length
polymorphisms that can be detected by gel electrophoresis (Spooner et al., 2005). According
to Beckman and Weber (1992), “microsatellites were found to be common in all eukaryotic
genomes with frequencies as high as one marker per every 6 kb and easy to type via PCR”
(Ramamoorthi et al., 2009).
Microsatellite has been used to study genetic variation such as the amount of hybridization
between closely related species comparison of levels of variation between species and
7
populations (Murray, 1996) and enormously useful for the elucidation of the population
structure of a wide variety of species of plants and animals (Reis et al., 2008). According to
Holmen et al. (2009), the flanking regions of microsatellites usually mutate at a much slower
rate than the microsatellites themselves and will in many cases be identical across a species'
range of distribution. They may even be conserved well enough through evolution to serve as
primer templates for closely related species. Another great advantage of microsatellite in
conservation genetics is primers developed for one particular species has been shown can be
applied to widely range of related taxonomy in animals (Ciofi et al., n.d.).
Their ease of use and high informative has ensures that microsatellites have become most
important tool in mapping genome. Microsatellites had largely replaced RFLPs as a mapping
technology in humans (Donini et al., 1998). Microsatellites also serve as markers of
biomedical diagnosis for diseases conditions that related with mutations occur in coding
regions. Their high specificity also contributes as primary marker in DNA testing of forensic
in matching identity for both human and wildlife (McDonald, 2008).
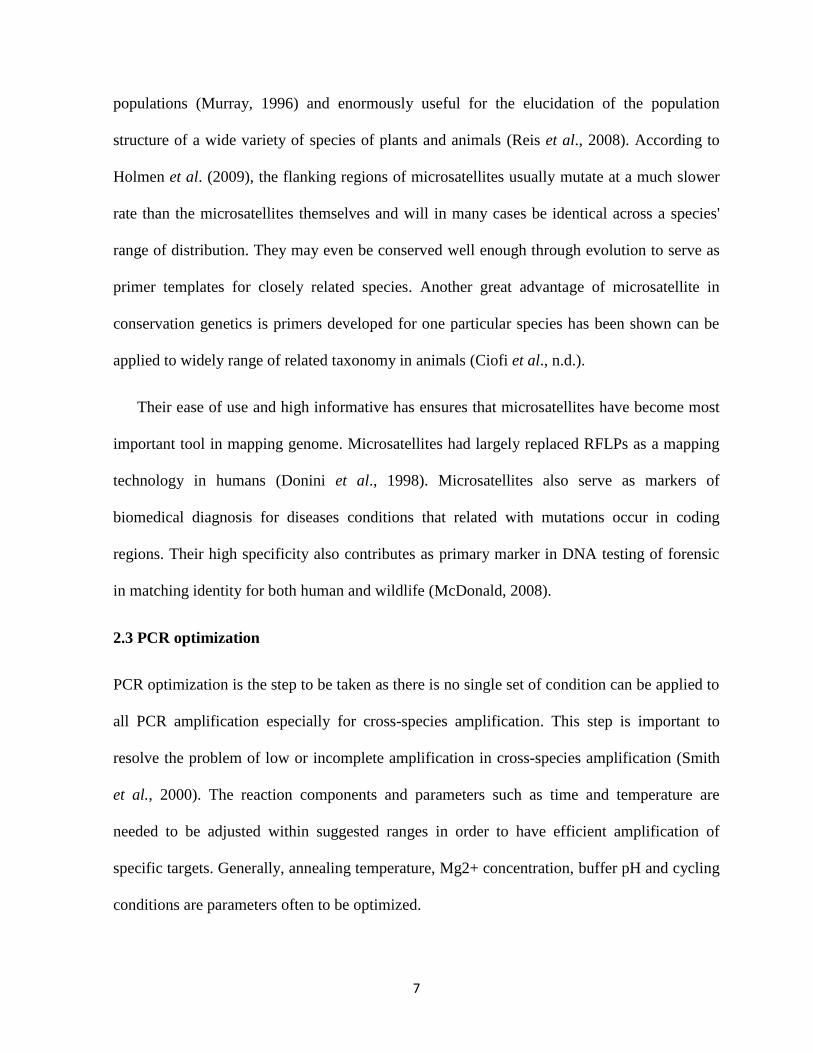
2.3 PCR optimization
PCR optimization is the step to be taken as there is no single set of condition can be applied to
all PCR amplification especially for cross-species amplification. This step is important to
resolve the problem of low or incomplete amplification in cross-species amplification (Smith
et al., 2000). The reaction components and parameters such as time and temperature are
needed to be adjusted within suggested ranges in order to have efficient amplification of
specific targets. Generally, annealing temperature, Mg2+ concentration, buffer pH and cycling
conditions are parameters often to be optimized.
8
The selection of the annealing temperature is the most critical component for
optimizing the specificity of a PCR reaction. In most cases, this temperature must be
empirically tested (Prezioso & Jahns, 2000). High concentration of primers is needed for
efficient hybridization during short annealing time but this may lead the primers hybridize to
non-complementary sequences and result in competition of hybridization to the
complementary sequences (Applied Biosystems). PCR optimization of annealing temperature
normally begins with calculation of the primer-template pairs melting point (Tm). However,
any calculated Tm should be considered as an approximation (Roux, 1995) as the formula was
developed based on hybridization experiments conducted at a higher salt concentration. The
calculated Tm might often need adjustments for nucleotides longer than 20 bp, in
microsatellites case (Ogliari et al., 2000). The annealing temperature can be raised in 2°C-5°C
increments in subsequent optimization runs if non-specific bands are observed. High-
temperature annealing should improve specificity. Primer extension generally works
effectively at a temperature of 72 °C and seldom needs optimization.
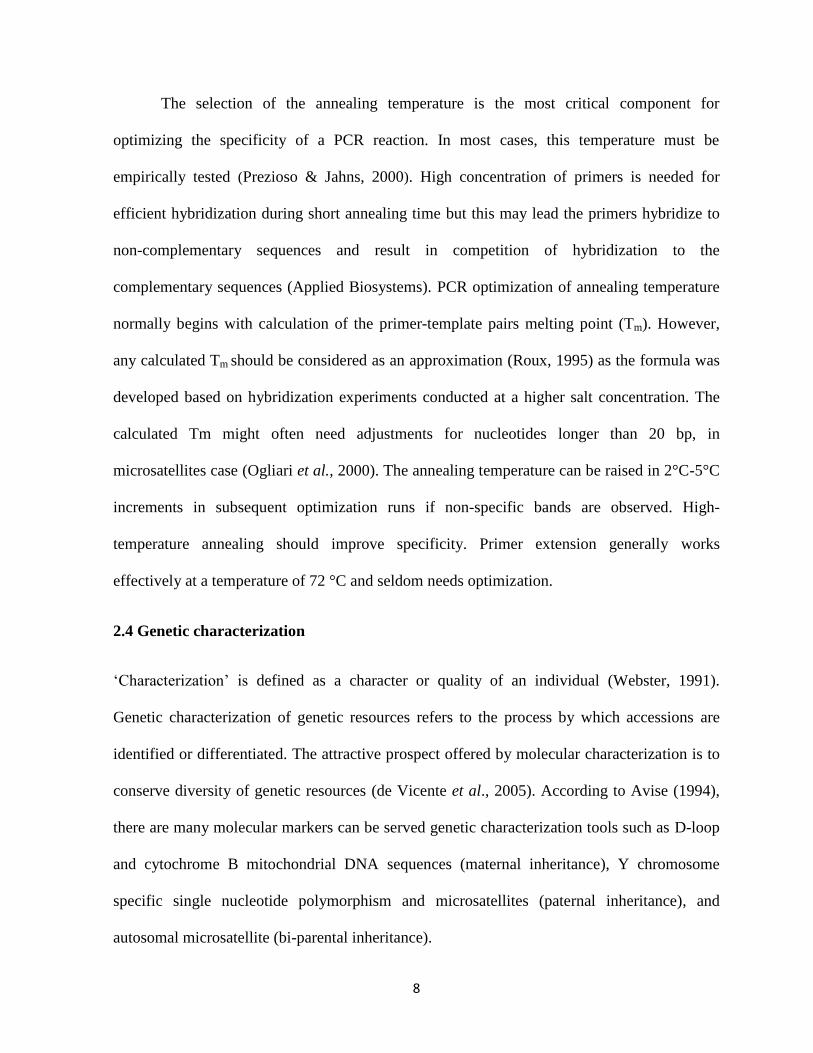
2.4 Genetic characterization
„Characterization‟ is defined as a character or quality of an individual (Webster, 1991).
Genetic characterization of genetic resources refers to the process by which accessions are
identified or differentiated. The attractive prospect offered by molecular characterization is to
conserve diversity of genetic resources (de Vicente et al., 2005). According to Avise (1994),
there are many molecular markers can be served genetic characterization tools such as D-loop
and cytochrome B mitochondrial DNA sequences (maternal inheritance), Y chromosome
specific single nucleotide polymorphism and microsatellites (paternal inheritance), and
autosomal microsatellite (bi-parental inheritance).
9
An important assumption of the use of genetic markers for genetic characterization in
population studies is variation in allele frequencies between populations will reflect the
distribution of genetic diversity within and among populations. Microsatellite markers with a
locus single are appropriate to be the choice in population diversity estimations, differentiation
of populations, calculations of genetic distances, andgenetic relationships and population
genetic admixture estimation (Hanotte & Jianlin, 2005). To analyze the genetic
characterization of within and between populations with microsatellite DNA loci, the number
of allele per locus, allele size range, numbers of genotype (G), size and frequency are
necessary to be determined for each population at each locus (Cui et al., 2005) and finally
genetic diversity is estimated.
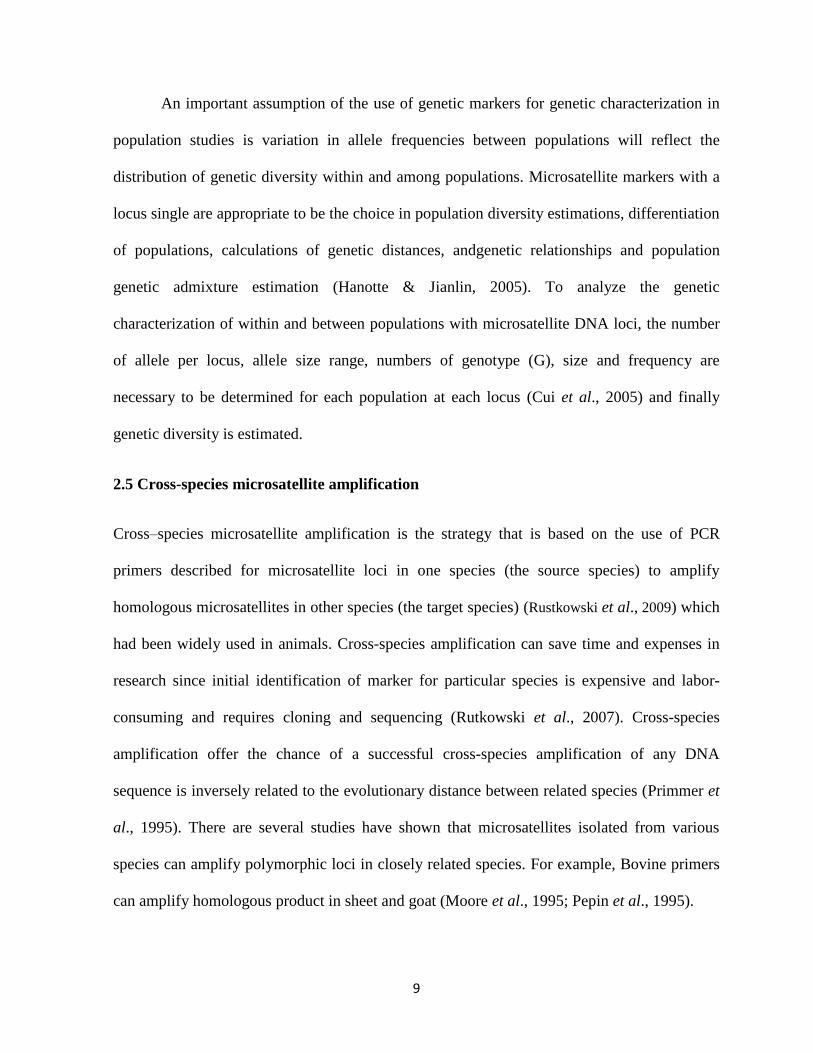
2.5 Cross-species microsatellite amplification
Cross–species microsatellite amplification is the strategy that is based on the use of PCR
primers described for microsatellite loci in one species (the source species) to amplify
homologous microsatellites in other species (the target species) (Rustkowski et al., 2009) which
had been widely used in animals. Cross-species amplification can save time and expenses in
research since initial identification of marker for particular species is expensive and labor-
consuming and requires cloning and sequencing (Rutkowski et al., 2007). Cross-species
amplification offer the chance of a successful cross-species amplification of any DNA
sequence is inversely related to the evolutionary distance between related species (Primmer et
al., 1995). There are several studies have shown that microsatellites isolated from various
species can amplify polymorphic loci in closely related species. For example, Bovine primers
can amplify homologous product in sheet and goat (Moore et al., 1995; Pepin et al., 1995).
10
CHAPTER 3
MATERIALS AND METHOD
3.1 DNA extraction
Genomic DNA was extracted from preserved muscle tissue of Lagocephalus spadiceus using a
modified CTAB protocol (Grewe et al., 1993). The muscle tissues were wet slightly by CTAB
for mince and then put in a 1.5 ml eppendorf tube with 700ul of CTAB buffer. After that, 7ul
to 10ul of Proteinase K was added into the tubes and then vortex by machine for a while. The
tubes were then incubated in water bath at 55ºC for 45 to 60 minutes. Next, 700ul of
chloroform-isoamyl alcohol was added and then vortex for a while. The color of the samples
becomes milky. The samples were centrifugation with 15,000 rpm for 10 minutes and two
phases were appeared. After that, the same volume of absolute ethanol with volume of
aqueous phase taken was added. Then, 25ul of 3M NaCl and 70% ethanol were added to it
and mixed by inversion. This was followed by centrifugation with 15000 rpm for 10 minutes.
The supernatant was poured off and the pellet was dried in laminar flow hood by fan for 10
minutes to 20 minutes. After that, the pellet was dissolved in 30ul of ddH2O. The quality of
extracted DNA was verified by metaphor agarose gel electrophoresis before proceed to PCR
optimization.
3.2 PCR
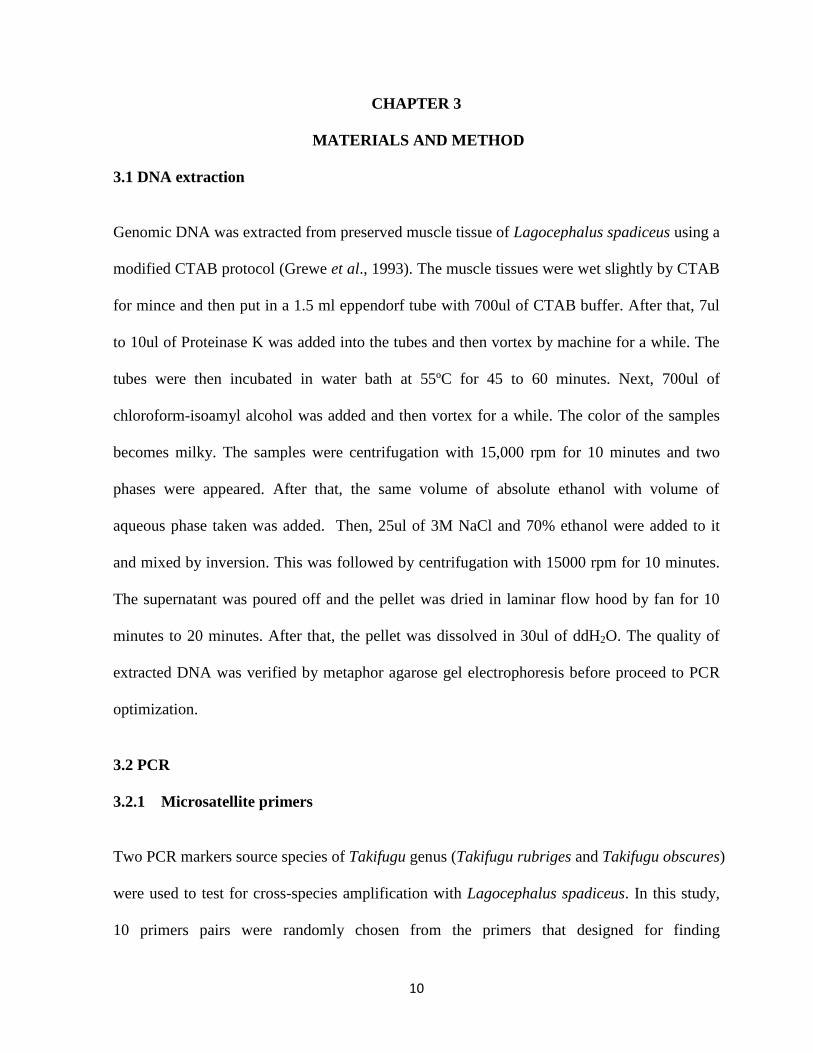
3.2.1 Microsatellite primers
Two PCR markers source species of Takifugu genus (Takifugu rubriges and Takifugu obscures)
were used to test for cross-species amplification with Lagocephalus spadiceus. In this study,
10 primers pairs were randomly chosen from the primers that designed for finding
11
heterozygous markers in one or both parents in a genetic linkage map study of Takifugu
rubripes These primer sequences were obtained from DDBJ/EMBL/GenBank with accession
no. AB213693-AB214112 (Kai et al., 2005).
No. PCR primer forward PCR primer reverse
Primer 1 CTGAACCGCTTTGAATGAGTCCT GGGCTGGCTGCTTGGTG
Primer 2 TGCAAACACGCCCATAC CTCTCCGCCTTAGTGTTTTGT
Primer 3 AGCAAAAACACTCTTCACATTACA CTCTCGCCTCCATCAGTCC
Primer 4 CAACACTAGATAAGGCTGGTAACT TGAATCGAGGCACATAAAC
Primer 5 TGTGTTCGCCTTCATTTCATTC GATTATCCGGGAGCCATTTGTA
Primer 6 AGAGGCCACAGTGAAAACAAAACC CATCAGTAGCGCACAATCAACAAA
Primer 7 CACAGAGGGGCCGTTCAGG CAGGCAGGCAGGGTGGAGA
Primer 8 ACGGTCGTGTCCACTTTATCTCCA GCAGTCAGCAGCAAATTCAACAAC
Primer 9 AGTCTTGTGCCCTCCTACCAGT TCACCACAGCCCAGAAGAAAT
Primer 10 ACTGTGCTGTGGGCTGAATGTGAC GCTGCTCTGCGGCGATGCT
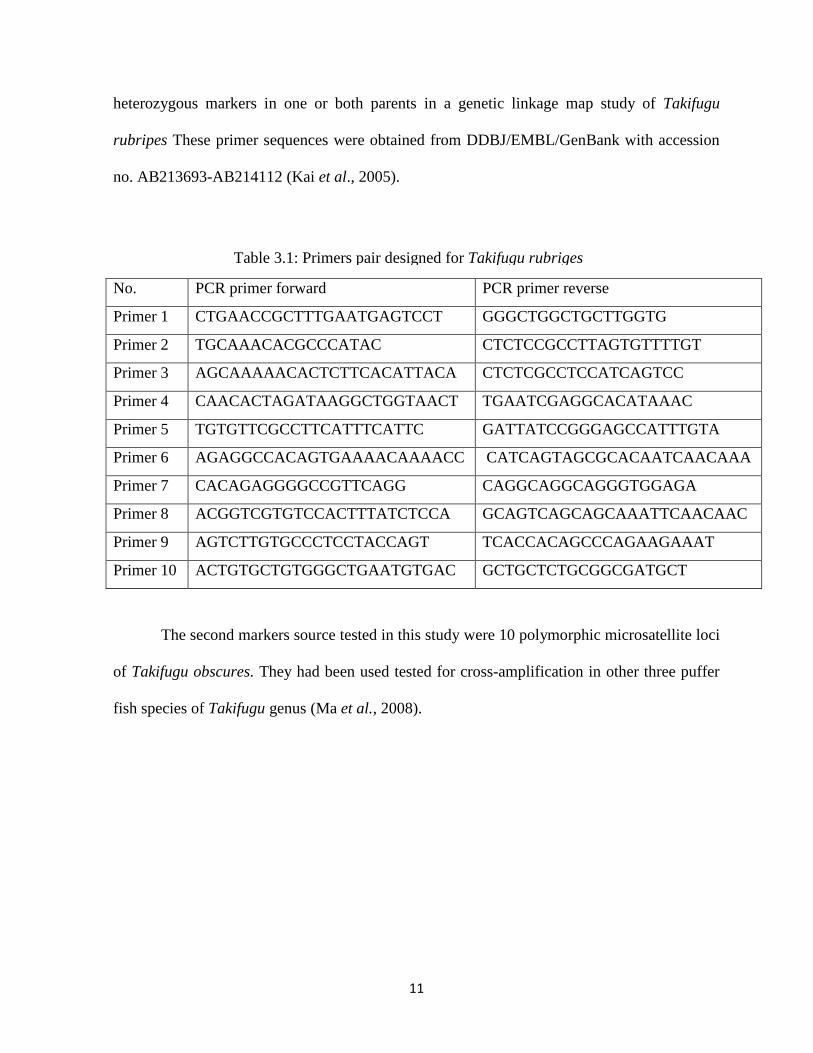
The second markers source tested in this study were 10 polymorphic microsatellite loci
of Takifugu obscures. They had been used tested for cross-amplification in other three puffer
fish species of Takifugu genus (Ma et al., 2008).
Table 3.1: Primers pair designed for Takifugu rubriges
12
Locus PCR primer forward / repeat sequences PCR primer reverse / repeated sequences
Tob10 ACCCACTCCGTCCTTCCT
(CA)190
TCAACCGCCCTTCCAACT
(CA)190
Tob11
GCCATATTGACCACTCACC
(CA)4...(CA)3...(CA)4...(CA)4
ACCACAGAATGTCCTGCTT
...(CA)5...(CA)5...(CA)21
Tob13 AGTAGAACGCTCGGTCAG
(CA)20
GTTTGTAATCATCAAAAGG
(CA)20
Tob25 ACTCTTTCTCCAGCTCTTC
(TG)21
TGCTTCCTTTGATTTGTAT
(TG)21
Tob53 CCTACATCTCACCCAGTG
(GATG)11(GACG)2(GATG)3
AGGAAGCAAGACAAATAAG
(GACG)2
Tob55 GCGCAGCTTGCACTGTAT
(AC)17GC(AC)3GC(AC)3
TAGCCTCTTTAGTCTTGATGG
(AC)17GC(AC)3GC(AC)3
Tob61 AGAGGCTCCTGGGGAATT
(TG)30
CAGCCCTGTCTCACACAT
(TG)30
Tob91 ATTACATCGACCAGAGCCT
(AC)3...(AC)7GC(AC)5GC
CACCTATACATCTTAGAATACCC
(AC)3...(AC)3GC(AC)2GC(AC)4
Tob107 GACCAGTCTCACTCCCTCC
(CA)35
TGTGGTAACGGCCATTTCT
(CA)35
Tob108 TCCATTACCACAGAATGTCCTGC
(GT)15GA(GT)5...(GT)5...(GT)5
GTGCCATATTGACCACTCACCTA
...(GT)4...(GT)4...(GT)3...(GT)4
Table 3.2: Polymorphic microsatellite markers of Takifugu obscures
13
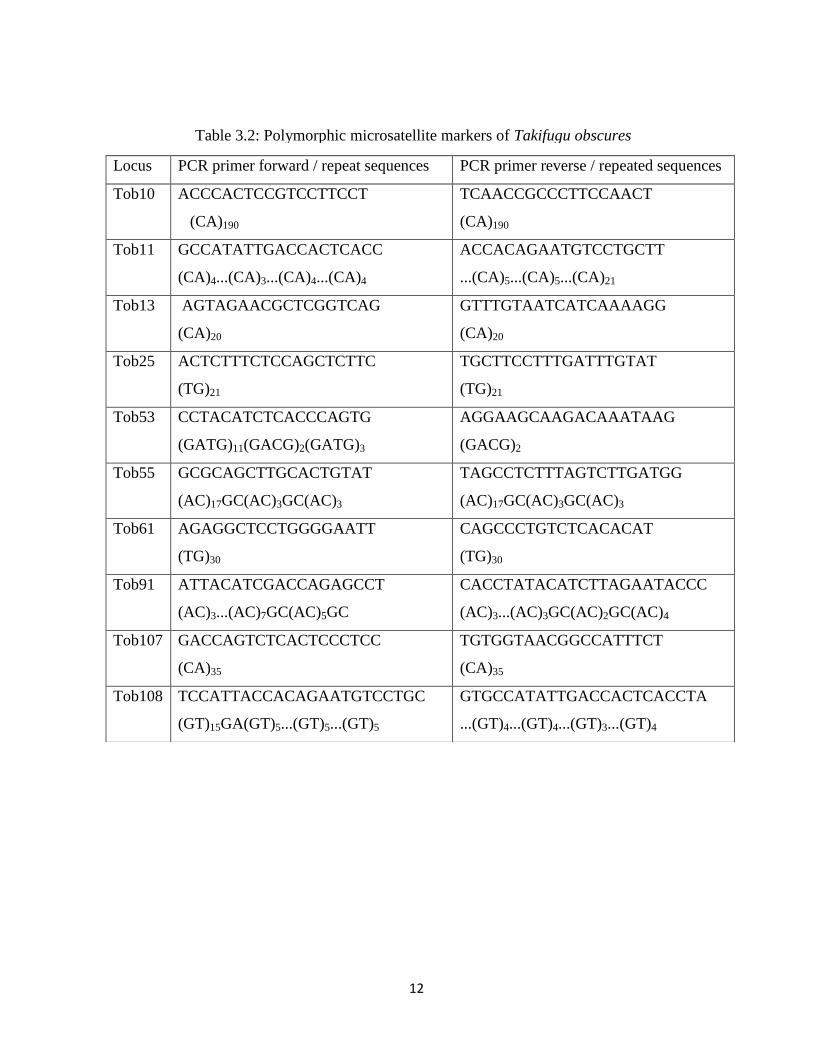
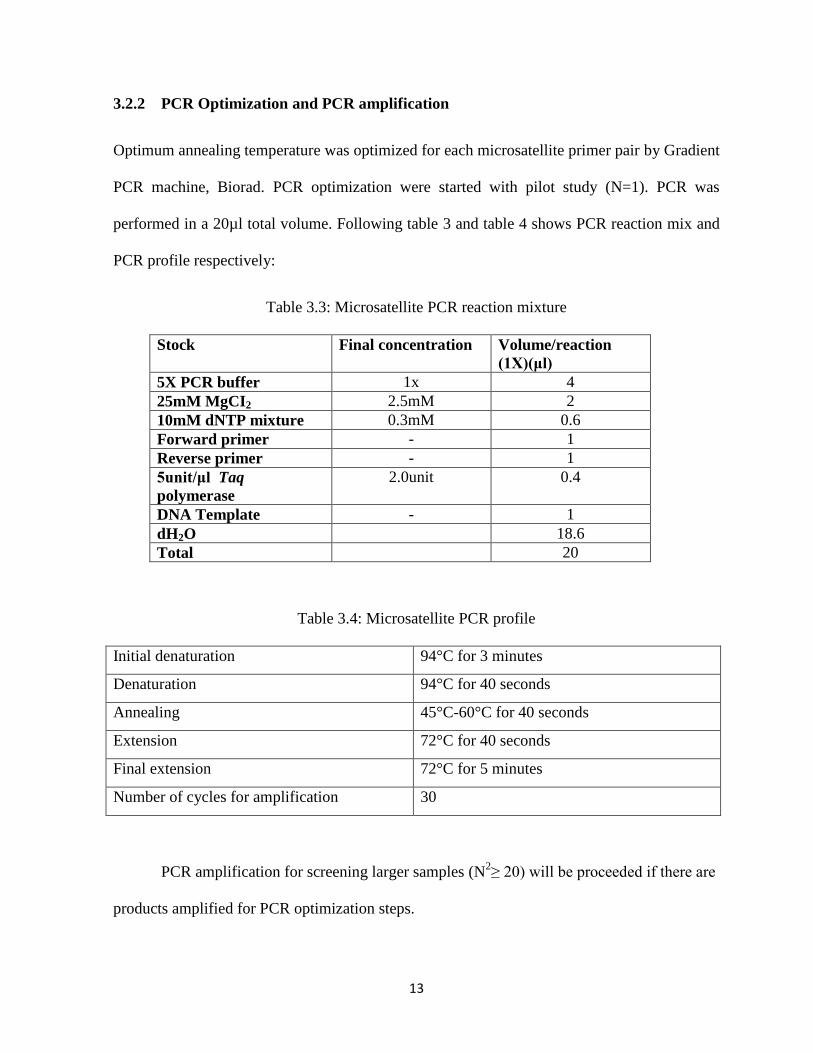
3.2.2 PCR Optimization and PCR amplification
Optimum annealing temperature was optimized for each microsatellite primer pair by Gradient
PCR machine, Biorad. PCR optimization were started with pilot study (N=1). PCR was
performed in a 20µl total volume. Following table 3 and table 4 shows PCR reaction mix and
PCR profile respectively:
Table 3.3: Microsatellite PCR reaction mixture
Stock Final concentration Volume/reaction
(1X)(μl)
5X PCR buffer 1x 4
25mM MgCI2 2.5mM 2
10mM dNTP mixture 0.3mM 0.6
Forward primer - 1
Reverse primer - 1
5unit/μl Taq
polymerase
2.0unit 0.4
DNA Template - 1
dH2O 18.6
Total 20
Table 3.4: Microsatellite PCR profile
Initial denaturation 94°C for 3 minutes
Denaturation 94°C for 40 seconds
Annealing 45°C-60°C for 40 seconds
Extension 72°C for 40 seconds
Final extension 72°C for 5 minutes
Number of cycles for amplification 30
PCR amplification for screening larger samples (N2≥ 20) will be proceeded if there are
products amplified for PCR optimization steps.
14
3.3 Agarose gel electrophoresis
First, 1.5 % of agarose was slowly added to the 1xTBE or 1x TBA buffer with
continuous swirling. After that, it was heated in the microwave for 90 seconds at medium
temperature. Just prior to pouring the gel into casting tray, 1 or 2 drops of ethidium bromide
(0.3 μg/ml) were mixed to the dissolved agarose and then wait for the molten gel became
solidified. It took approximately 20 minutes for the gel to solidify.
Then, 1 or 2 μl of 6x loading dye was loaded into the gel well and then followed by
adding either 6 to 8 μl for PCR product or 2 to 3 μl for DNA samples. The gel was then
submerged in 1x TBA buffer and was electrophoresed for about 30 minutes at 90Volts. After
electrophoresis, the gel was visualized under UV transilluminator and photographed. Upon
completion of electrophoresis, the locations of the bands were visualized.
15
CHAPTER 4
RESULTS
4.1 DNA Extraction
At this stage, the genetic materials (DNA) of 58 samples were extracted from the muscle
tissues of L. spadiceus by using modified CTAB protocol. The muscle tissues had been
preserved in 70% ethanol for few months. The results show that only half of the samples from
population 1 (Kudat) produced either clear or faint and smeared DNA bands. Smearing down
the lane occurred in majority samples either with bands or without band. For 28 samples from
populations 2 (Tawau), almost whole population produce smearing down the lane without
band were observed. All DNA samples were still proceeding to PCR stage that includes
optimization and amplification with larger samples as PCR using microsatellite require only
small amount of DNA and workable for even degraded DNA. There were 14 samples from
population 2 had been subjected to DNA quantification by using spectrophotometer since their
gel photo showed poor outcome. As a result, both of the OD reading and concentration of
DNA in the 14 samples were considered good and can be used to run PCR. As for same DNA
extraction method was applied to all samples, therefore, remaining DNA samples also
considered had potential to try in PCR stage although the result of agarose gel electrophoresis
shows the most the quality of DNA samples are poor.
16
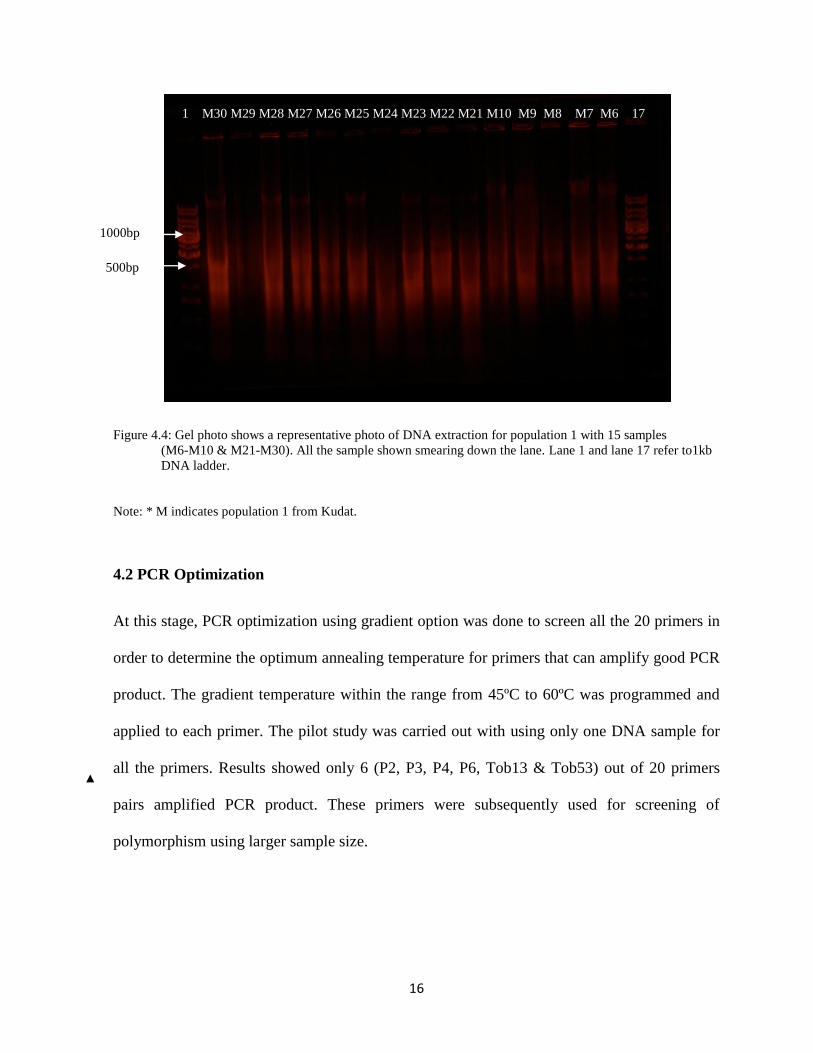
Figure 4.4: Gel photo shows a representative photo of DNA extraction for population 1 with 15 samples
(M6-M10 & M21-M30). All the sample shown smearing down the lane. Lane 1 and lane 17 refer to1kb
DNA ladder.
Note: * M indicates population 1 from Kudat.
4.2 PCR Optimization
At this stage, PCR optimization using gradient option was done to screen all the 20 primers in
order to determine the optimum annealing temperature for primers that can amplify good PCR
product. The gradient temperature within the range from 45ºC to 60ºC was programmed and
applied to each primer. The pilot study was carried out with using only one DNA sample for
all the primers. Results showed only 6 (P2, P3, P4, P6, Tob13 & Tob53) out of 20 primers
pairs amplified PCR product. These primers were subsequently used for screening of
polymorphism using larger sample size.
1 M30 M29 M28 M27 M26 M25 M24 M23 M22 M21 M10 M9 M8 M7 M6 17
500bp
1000bp