Embed Size (px)
Citation preview
1
Genetic analysis of postzygotic hybridisation
barriers in Arabidopsis thaliana
Ahmed Abd El-Halim Bolbol
A thesis submitted for the degree of Doctor of philosophy
University of Bath
Department of Biology and Biochemistry
October 2010
Attention is drawn to the fact that copyright of this thesis rests with its author. A copy of
this thesis has been supplied on condition that anyone who consults it is understood to
recognise that its copyright rests with the author and they must not copy it or use material
from it except as permitted by law or with the consent of the author.
This thesis may be made available for consultation within
the University Library and may be photocopied or lent to other libraries
for the purposes of consultation.
Signed:
Ahmed Bolbol

2
For my Father
3
Acknowledgements
I would like to thank my supervisor Prof. Rod Scott for his never-ending patience,
encouragement, generous support, helpful guidance and understanding during my PhD
project. Many thanks for Dr. Melissa Spielman, who I‘ll never forget for managing the
project with my supervisor and for her technical support and helpful comments on my first
experiments. I am also very grateful to Dr. Sushma Tiwari for unending support, guidance,
and for sharing her experience and wealth of knowledge of molecular biology. Many
thanks also to Dr. James Doughty for his encouragement and helpful discussions and to Dr.
Paula Kover for her contribution to the QTL mapping and for helpful comments. Thanks to
my colleague Alec Topham for his assistance with computing. Thanks to all lab members
3S 1.13 for their support and friendship: Rhiannon Hughes, Lucy Mathers, Ahlam
Bouariky, Lyndsay Dytham, Alec Topham, Holly Smith-Baedorf, Valentyna Varenko,
Richard Mead, Baoxiu Qi, Sapu Pradeepika, and Lihua Zhang. Grateful acknowledgements
are given to Angie Vale and Julia Watling for caring for my plants, and to all members and
technical staff in the Biology and Biochemistry department for their kind cooperation.
I would like to thank the Egyptian government for funding and continuous care and
support. Thanks also to all staff members and friends: Prof. Ahmed Ghareeb, Dr. Alaa
Said, Waled, Mahmoud, Mostafa, and Nabih in the University of Zagazig, Egypt, for their
support and encouragement.
Appreciation go to my Mum, Dad (God bless him), brother, and sisters and all
other members of my family. I‘ll not forget my wife Eman for her patience and continuous
support and my lovely children Toleen and Mohammed.
4
Abstract
Most studies of plant hybridisation are concerned with documenting its occurrence
in different plant groups. Many flowering plants are polyploids and seeds developed from
crosses between individuals of different ploidies usually show abnormal features and often
abort. The success or failure of interploidy crosses is very important to understanding the
evolution of plants as well as to agriculture, but much remains to be learned about the
nature of hybridisation barriers. Several mechanisms have been proposed to explain
postzygotic barriers, including negative interactions between diverged sequences, global
genome rearrangements, and widespread epigenetic reprogramming. Some recent advances
in our understanding of the process of hybridisation are derived from different
experimental studies on a series of A. thaliana ecotypes. Crosses between diploid (2x) and
tetraploid (4x) individuals of the same ecotype can result in F1 lethality, and this dosage-
sensitive incompatibility plays a major role in polyploidy speciation research. We have
performed interploidy crosses between different diploid maternal A. thaliana ecotypes and
tetraploid paternal Col-0 ecotype and identified a genetic variation in F1 lethality. We also
found that maternal parents of some ecotypes such as Tsu-1 suppressed the F1 lethality
caused by paternal-excess interploidy cross of Col-0 ecotype. A preliminary mapping
exercise produced advanced backcross populations that are suitable for mapping maternal
modifiers and for the identification of modifier genes. Furthermore, we studied the killer
effect caused by Col-0 and identified three additive QTL that affect the rate of postzygotic
lethality in F1 during interploidy crosses. This information will facilitate the identification
of paternal genes that cause F1 lethality and contribute to reproductive isolation.
The moa-1 (mosaic aneuploidy 1) mutant of A. thaliana was obtained in a screen of
chemically (EMS) mutagenised seeds of Landsberg erecta (Ler). moa-1 has various
phenotypic differences to wild type; the preliminary karyotype analysis showed that the
cells of individual moa-1 mutant plants have a variable number of chromosomes (usually
between 11-18). In contrast, the cells of wild type Arabidopsis plants and conventional
aneuploids have a fixed number of chromosomes in each somatic cell. This data showed
that all moa-1 plants have an abnormal number of chromosomes and thus they were termed
as mosaic aneuploids.
5
Abbreviations and Acronyms
ANOVA analysis of variance
A. thaliana Arabidopsis thaliana
Bla Blanes/Gerona
Bur Burren
CIM composite interval mapping
Col Columbia
Co Coimbra
CSS chromosome substitution strains
Cvi Cape Verdi Islands
DAP days after pollination
DNA deoxyribonucleic acid
EBN endosperm balance number
EMS ethylmethane sulphonate
er erecta
Kas Kashmir
Ler Landsberg erecta
LOD log-likelihood
moa mosaic aneuploidy
NASC Nottingham Arabidopsis Stock Centre
Ob-0 Oberusel/Hasen
Per Perm
QTL quantitative trait loci
RILs recombinant inbred lines
se standard error of the mean
SRL single recombinant line
STAIRS stepped aligned inbred recombinant strains
Stw Stobowa/Orel
TAIR The Arabidopsis Information Resource
Ws Wassilewskija (Vaseljevisi)/Dnjepr
6
Contents
Acknowledgements ................................................................................................................ 3
Abstract .................................................................................................................................. 4
Abbreviations and Acronyms ................................................................................................. 5
Contents ................................................................................................................................. 6
Chapter 1 .............................................................................................................................. 10
1. General introduction......................................................................................................... 10
1.1. Hybridisation barriers in plants ................................................................................. 10
1.1.1. Postzygotic hybridisation barriers in plants ....................................................... 11
1.2. The model plant A. thaliana ...................................................................................... 15
1.3. Endosperm development with special reference to A. thaliana ................................ 16
1.3.1. Consequences of parental imbalance in interploidy/interspecific crosses ......... 17
1.3.2. The endosperm balance number (EBN) hypothesis ........................................... 19
1.4. Polyploidy: causes and consequences ....................................................................... 20
1.4.1. Triploid block theory and the formation of unreduced gametes ........................ 21
1.4.2. Aneuploidy and mosaic aneuploidy ................................................................... 23
1.5. QTL genetic mapping ............................................................................................... 24
1.6. Research aim and objectives ..................................................................................... 27
2. Materials and Methods ..................................................................................................... 28
2.1. Materials .................................................................................................................... 28
2.1.1. Plant material ..................................................................................................... 28
2.1.2. Primer design and synthesis ............................................................................... 29
2.1.3. Statistical analysis .............................................................................................. 31
2.1.4. Image capture and processing ............................................................................ 31
2.1.5. QTL mapping and statistical analysis ................................................................ 31
2.2. Methods ..................................................................................................................... 32
2.2.1. Growth conditions for A. thaliana ..................................................................... 32
2.2.2. Cross pollination ................................................................................................ 32
2.2.3. Cytological technique for counting mitotic chromosomes ................................ 32
2.2.3.1. Fixation ....................................................................................................... 32
2.2.3.2. Processing ................................................................................................... 33
2.2.4. Phenotypic characterisation ............................................................................... 33
2.2.5. Seed weight ........................................................................................................ 33
2.2.6. Categorising the seeds ........................................................................................ 33
2.2.7. Seed germination ................................................................................................ 34
2.2.8. Making tetraploids from diploids ....................................................................... 34
2.2.9. Seed clearing and differential contrast (DIC) microscopy ................................. 34
2.2.10. Feulgen staining and confocal microscopy ...................................................... 34
2.2.11. Plant DNA extraction ....................................................................................... 36
2.2.12. DNA amplification for genotyping analysis .................................................... 36
2.2.13. Agarose gel electrophoresis ............................................................................. 38
2.2.14. Construction of a genetic linkage map ............................................................. 38
2.2.15. Mapping population ......................................................................................... 38
Chapter 3 .............................................................................................................................. 40
3. The genetics and characterisation of A. thaliana MOA gene ........................................... 40
3.1. Introduction ............................................................................................................... 40
3.1.1. Cell cycle control ............................................................................................... 40
3.1.2. Mitosis and its role in cell division .................................................................... 40
7
3.1.3. Aneuploidy ......................................................................................................... 41
3.1.3.1. Aneuploidy theory ....................................................................................... 42
3.1.3.2. Factors causing aneuploidy ......................................................................... 43
3.1.3.3. The relationship between aneuploidy and triploidy .................................... 43
3.1.4. Mosaic aneuploidy ............................................................................................. 44
3.1.4.1. The behaviour of moa-1 (mosaic aneuploidy-1) ......................................... 44
3.3. Results ....................................................................................................................... 45
3.3.1. Phenotypic traits ................................................................................................. 45
3.3.2. From genotype to karyotype .............................................................................. 47
3.3.3. Genetics of moa-1 .............................................................................................. 49
3.3.3.1. Crosses between moa-1 and wild type (Ler 2x) plants ............................... 49
3.3.4. Seed viability test ............................................................................................... 51
3.3.5. Endosperm development and genomic imbalance ............................................. 53
3.3.6. Embryo development in moa-1 crossed plants .................................................. 54
3.4. Discussion ................................................................................................................. 58
3.4.1. Characteristics of moa-1 phenotype ................................................................... 58
3.4.2. moa-1 is a mosaic aneuploid mutant .................................................................. 58
3.4.3. Allelic dominancy of moa-1 .............................................................................. 59
3.5.3. Endosperm behaviour, embryo development and role of imprinting ................ 59
3.5. Conclusion ................................................................................................................ 60
4. Genetic variation for triploid block in A. thaliana ........................................................... 61
4.1. Introduction ............................................................................................................... 61
4.1.1. Triploid block and its discovery ......................................................................... 61
4.1.2. Triploid block and its lethal association in A. thaliana ...................................... 61
4.1.3. The relation between triploid block and imprinting ........................................... 62
4.1.4. Triploidy and the unreduced gametes ................................................................ 63
4.1.5. Triploid block in the ecotype Col-0 ................................................................... 63
4.2. Results ....................................................................................................................... 65
4.2.1. The Columbia syndrome .................................................................................... 65
4.2.2. Genetic variation for asymmetric interploidy hybridisation barriers ................. 67
4.2.3. Weak mother or strong father? ........................................................................... 74
4.2.3.1. Inter-ecotype [Col 2x X ecotype 4x] crosses .............................................. 75
4.2.3.2. [ecotype 2x X Col 4x] crosses .................................................................... 78
4.2.4. The RLD ecotype has an asymmetric interploidy hybridisation barrier ............ 81
4.2.4.1. The RLD and Col- 0 syndromes ................................................................. 83
4.2.5. Comparison between tetraploid Col-0 plants and diploid male meiotic mutants
Atps1-1 and jas-3 ......................................................................................................... 85
4.2.5.1. Atps1-1 pollen causes high frequency seed abnormality in crosses to Col-0
.................................................................................................................................. 85
4.2.5.2. jas-3 pollen also causes elevated levels of abnormal seed production in
crosses with Col-0 .................................................................................................... 86
4.3. Discussion ................................................................................................................. 89
4.3.1. The behaviour of tetraploid Col-0 ...................................................................... 89
4.3.2. Parent-of-origin effects in intra and inter-ecotype crosses ................................ 90
4.3.2.1. The Col-syndrome: weak mother or aggressive father ............................... 91
4.3.3. Do RLD and Col-0 share the same syndrome? .................................................. 92
4.3.3.1. The Col-0/RLD syndrome - potential mechanisms .................................... 93
4.3.4. Chromosome doubling vs non-reduction ........................................................... 94
4.4. Conclusion ................................................................................................................ 95
Chapter 5 .............................................................................................................................. 96
8
5. The genetics of a maternal modifier................................................................................. 96
5.1. Introduction ............................................................................................................... 96
5.1.1. The Tsu-1 maternal modifier of Col-killing....................................................... 96
5.1.2. A. thaliana is useful in studying genetics .......................................................... 96
5.1.3. Principles and requirements for genetic mapping .............................................. 97
5.1.4. Polymorphism identification .............................................................................. 98
5.1.5. Identifying and mapping genes .......................................................................... 99
5.2. Results ..................................................................................................................... 100
5.2.1. Seed development in interploidy [Tsu 2x X Col 4x] crosses ........................... 100
5.2.1.1. Embryo sac area ........................................................................................ 102
5.2.1.2. Chalazal endosperm and nodules size ....................................................... 102
5.2.1.3. Peripheral endosperm cellularisation ........................................................ 104
5.2.2. Genetic analysis of the maternal modifier behaviour of Tsu-1 ........................ 105
5.2.2.1. Establishing a convenient and effective quantitative test for the Tsu-1
modifier behaviour (mean seed weight measure) .................................................. 105
5.2.2.2. Genetic analysis of the F1 generation – Is the Tsu-1 modifier dominant or
recessive? ............................................................................................................... 107
5.2.2.3. Analysis of the F2 generation .................................................................... 112
5.2.3. Mapping the maternal modifier trait ................................................................ 115
5.2.3.1. Identification of resistant BC1(Col-0)F1 and submissive BC1(Tsu-1 )F1
plants ...................................................................................................................... 115
5.2.3.2. Identification of resistant BC1(Col-0)F2 and submissive BC1(Tsu-1)F2
plants ...................................................................................................................... 119
5.2.3.3. Identification of resistant BC2(Col-0)F2 and submissive BC2(Tsu-1)F2
plants ...................................................................................................................... 122
5.2.3.4. Identification of resistant BC2(Col-0)F3 and submissive BC2(Tsu-1)F3
plants ...................................................................................................................... 125
5.2.3.5. Identification of resistant BC3(Col-0)F3 and submissive BC3(Tsu-1)F3
plants ...................................................................................................................... 128
5.2.4. Molecular genetic evaluation of the BC3F3 populations .................................. 131
5.2.4.1. Marker analysis of BC3(Col-0) F3 progenies ........................................... 132
5.2.4.2. Marker analysis of BC3(Tsu-1) F3 progenies ........................................... 134
5.3. Discussion ............................................................................................................... 136
5.3.1. The Tsu-1 maternal modifier resists Col-killing by promoting endosperm
cellularisation in [2x X 4x] seed ................................................................................ 136
5.3.2. The Tsu-1 maternal modifier behaves as a genetically dominant trait ............ 138
5.3.3. Recurrent backcrossing produces plants with potential for mapping the Tsu-1
maternal modifier ....................................................................................................... 139
5.4. Conclusion .............................................................................................................. 140
Chapter 6 ............................................................................................................................ 141
6. The genetics of the Col-0 killing trait ............................................................................ 141
6.1. Introduction ............................................................................................................. 141
6.1.1. Hybridisation barriers control F1 lethality in the Col-0 ecotype ...................... 141
6.1.2. STAIRS and CSS lines: powerful genetic resources for functional genomic
studies in Arabidopsis ................................................................................................ 142
6.1.3. Recombinant inbred lines (RILs) and their role in Arabidopsis genomic studies
.................................................................................................................................... 143
6.1.4. QTLs experimental crosses and its statistical determination ........................... 144
6.2. Results ..................................................................................................................... 146
6.2.1. Strategies for the genetic analysis of the Col-killer trait .................................. 146
9
6.2.2. The Col-killer trait is expressed in tetraploid Col/Ler F1 hybrids ................... 146
6.2.3. Rough mapping of the Col-0 killer trait using CSS and STAIR lines ............. 148
6.2.3.1. Generating tetraploid 4x populations from diploid 2x CSS and STAIR
(SRL1) plants ......................................................................................................... 149
6.2.3.2. The Col-0 killer trait: one locus or a QTL?............................................... 151
6.2.4. Mapping the Col-0 trait using tetraploid Recombinant Inbred Lines (RILs) ... 154
6.2.4.1. Generating tetraploid 4x RILs ................................................................... 154
6.2.4.2. Mapping the Col-killer trait using tetraploid RILs ................................... 156
6.3. Discussion ............................................................................................................... 161
6.3.1. STAIRS, CSS and RIL are powerful tools in identifying the QTL of Col-0 killer
trait ............................................................................................................................. 161
6.3.1.1. Advantages of RIL in QTL mapping ........................................................ 162
6.4. Conclusion .............................................................................................................. 164
Chapter 7 ............................................................................................................................ 165
7. General Discussion......................................................................................................... 165
7.1. Postzygotic hybridisation barriers and its consequences for Arabidopsis crosses
.................................................................................................................................... 165
7.2. The Tsu-1 maternal modifier of Col-killing ....................................................... 169
7.3. QTL mapping in plant breeding .......................................................................... 170
References .......................................................................................................................... 188
10
Chapter 1
1. General introduction
Hybridisation can have several meanings for evolutionary biologists, but
can be restricted to an organism that developed from a cross fertilisation between
individuals of different species. Hybridisation is useful in transferring genetic variability in
cultivated species, for example as a source of disease and pest resistance for crop
improvement. The interspecific hybridisation process is accepted as a major mechanism for
generating novelty in the plant kingdom (Abbott, 1992). Several evolutionary studies were
performed on hybridisation during the early 20th
century. Wingë (1917) showed that new
and constant hybrid species could be derived by the duplication of a hybrid‘s chromosome
complement (allopolyploidy). This hypothesis was confirmed experimentally in a variety
of plant species. Work carried out by Müntzing (1930) on homoploid hybrids or
recombinational speciation found that sorting of chromosomal rearrangements in later
generation hybrids may lead to the formation of a new homozygous population. The new
hybrid population may be fertile, stable, and similar to their parents in their ploidy level.
Anderson (1936) suggested that the products of interspecific hybridisation, particularly
those resulting from backcrossing or introgression, might be favoured by selection and thus
contributes to adaptive evolution within population.
1.1. Hybridisation barriers in plants
Most studies of plant hybridisation are concerned with documenting its occurrence
in different plant groups. However, understanding the basis of the process of hybridisation
and of hybridisation barriers between species is important in understanding the process of
speciation and the extent of gene flow between species (Rieseberg and Blackman, 2010).
Barriers to hybridisation restrict gene flow between species and may play a major role in
speciation (Dilkes et al., 2008; Rieseberg and Blackman, 2010). Recently, the genetic
basis of these barriers to gene flow have been attributed to so called ‗speciation genes‘ that
can act at multiple prezygotic and postzygotic stages of the life-cycle (Figure 1.1;
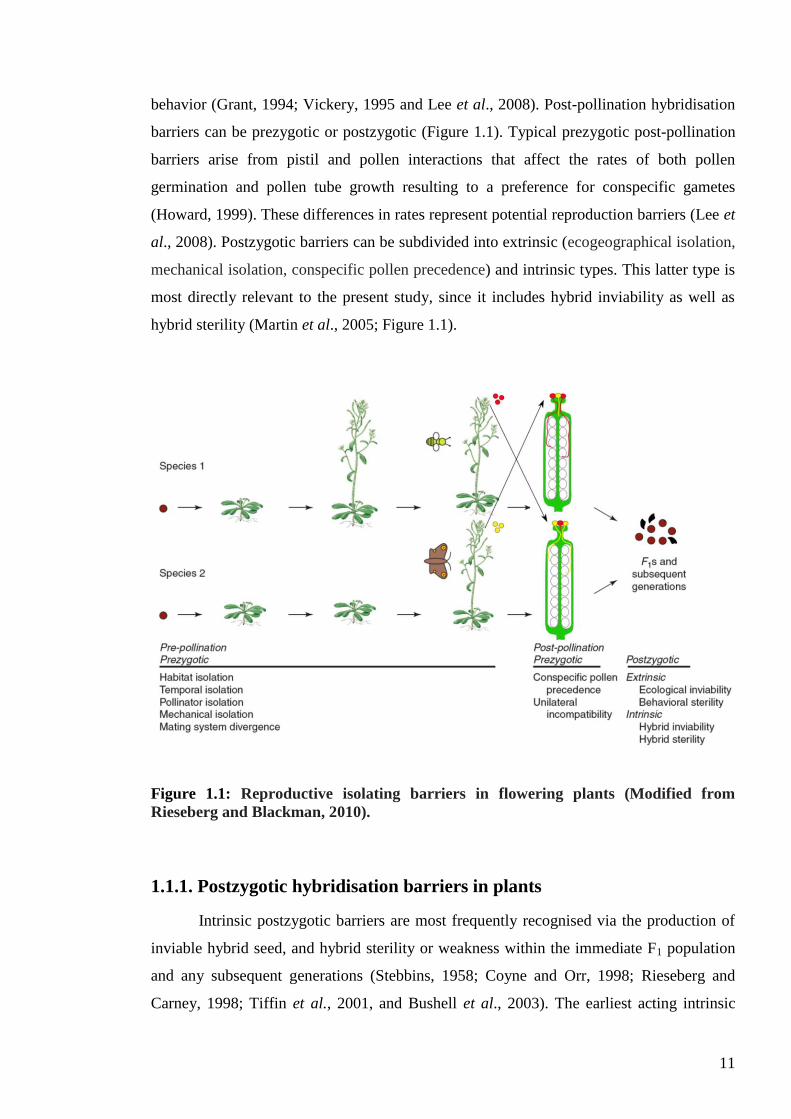
Rieseberg and Blackman, 2010). Arnold (1998) found that in angiosperms reproductive
barriers could be divided into premating (pre-pollinating), post-pollinating, and post-
fertilisation (postzygotic) types. Premating barriers include spatial, temporal, and
mechanical barriers, as well as morphological specializations that affect pollinator
11
behavior (Grant, 1994; Vickery, 1995 and Lee et al., 2008). Post-pollination hybridisation
barriers can be prezygotic or postzygotic (Figure 1.1). Typical prezygotic post-pollination
barriers arise from pistil and pollen interactions that affect the rates of both pollen
germination and pollen tube growth resulting to a preference for conspecific gametes
(Howard, 1999). These differences in rates represent potential reproduction barriers (Lee et
al., 2008). Postzygotic barriers can be subdivided into extrinsic (ecogeographical isolation,
mechanical isolation, conspecific pollen precedence) and intrinsic types. This latter type is
most directly relevant to the present study, since it includes hybrid inviability as well as
hybrid sterility (Martin et al., 2005; Figure 1.1).
Figure 1.1: Reproductive isolating barriers in flowering plants (Modified from
Rieseberg and Blackman, 2010).
1.1.1. Postzygotic hybridisation barriers in plants
Intrinsic postzygotic barriers are most frequently recognised via the production of
inviable hybrid seed, and hybrid sterility or weakness within the immediate F1 population
and any subsequent generations (Stebbins, 1958; Coyne and Orr, 1998; Rieseberg and
Carney, 1998; Tiffin et al., 2001, and Bushell et al., 2003). The earliest acting intrinsic
12
postzygotic barrier is due to the failure of seed development. For instance, Johnston et al.,
(1980) and Lin (1984) showed in their work with karyotypic variants and interspecies
hybrids in plants that postzygotic hybridisation barriers occurs if the contributions of both
pollen and seed parents deviate from the normal 2 maternal (m):1 paternal (p) ratio in the
endosperm, indicating that a balance between these contributions is required for normal
sexual reproduction.
The success or failure of crosses between related plant species has been the subject
of many studies (Thompson, 1930; Haig and Westoby, 1991; Rieseberg and Carney, 1998;
Tiffin et al., 2001) and the genetic mechanisms and the underlying speciation genes that
govern reproductive barriers between species are now being elucidated (Rieseberg and
Black, 2010; Table 1.1). Hybrid sterility or inviability (necrosis) has been studied in many
species (Watkins, 1932; Stebbins, 1958; Wan et al., 1996; Li et al., 1997; Bomblies et al.,
2007) and a variety of mechanisms have been proposed to explain the operation of this
postzygotic barrier and the fitness problems of the hybrids such as negative interaction
between diverged sequences, widespread epigenetic reprogramming, and rearrangements
of the global genome (Rieseberg and Carney, 1998; Bushell et al., 2003). Moreover, some
genetic differences are proposed as the source of fitness problem to the hybrid from
postzygotic barriers such as different chromosome arrangements or different alleles that
are unable to function correctly together in the hybrid (Coyne and Orr, 1998). In addition,
Burke and Arnold, (2001) found that two common mechanisms are thought to be the cause
of postzygotic isolation; 1) The deleterious interactions between heterospecific genes may
lead to hybrid sterility and hybrid inviability, 2) Chromosomal rearrangements in the
parental species may result in abnormal meiotic products in their hybrids with negative
effects on hybrid fertility. More recently, Bomblies and Weigel (2007) have suggested that
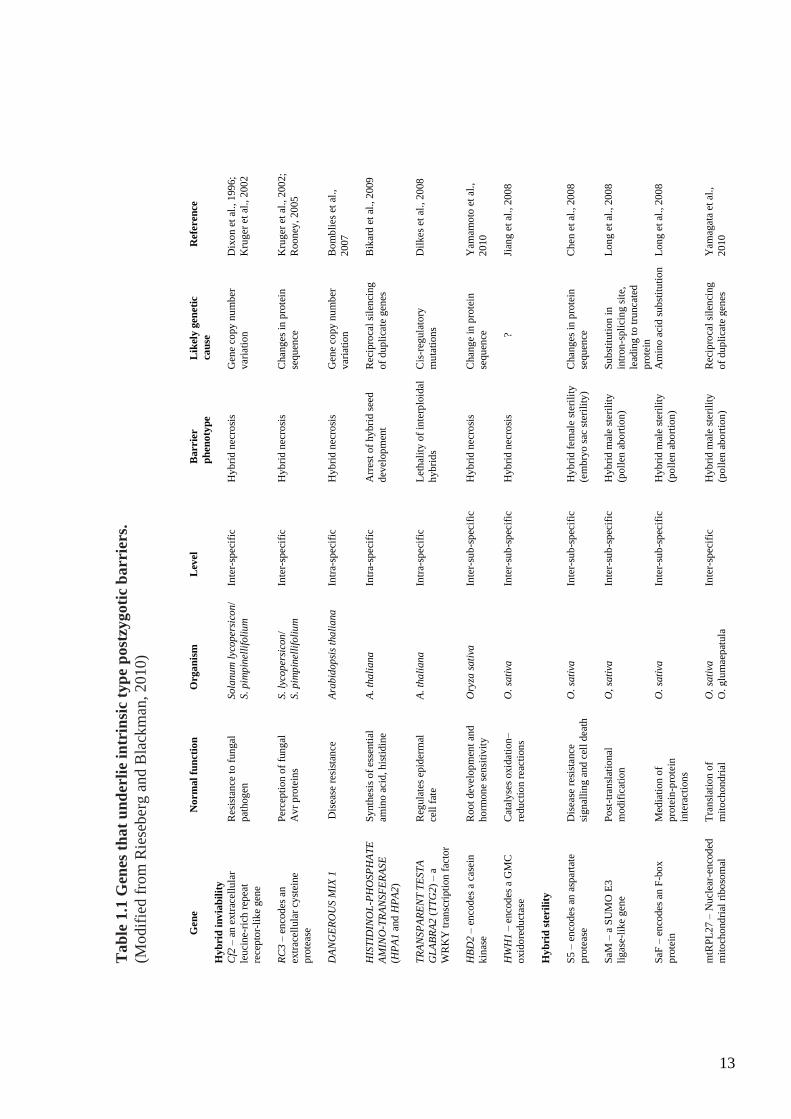
disease resistance genes play an important role in reproductive isolation (Table 1.1). Strong
supportive evidence has come from the discovery that incompatibilities among
complementary disease resistance genes are the cause of necrosis in crosses between A.
thaliana ecotypes (Bomblies et al., 2007). Similarly, disease resistance genes appear to
mediate necrosis in crosses between rice varieties (Yamamoto et al., 2010).
13
Tab
le 1
.1 G
enes
th
at
un
der
lie
intr
insi
c ty
pe
post
zygo
tic
barri
ers.
(Modif
ied f
rom
Rie
seber
g a
nd B
lack
man
, 2010)
G
ene
N
orm
al
fun
cti
on
O
rga
nis
m
Lev
el
B
arrie
r
Lik
ely g
en
eti
c R
efe
ren
ce
ph
en
oty
pe
ca
use
Hy
bri
d i
nv
iab
ilit
y
Cf2
– a
n e
xtr
acel
lula
r R
esis
tan
ce t
o f
un
gal
S
ola
nu
m l
ycop
ersi
con/
Inte
r-sp
ecif
ic
Hy
bri
d n
ecro
sis
Gen
e co
py
nu
mb
er
Dix
on e
t al
., 1
99
6;
leu
cine-
rich
rep
eat
pat
hog
en
S. p
imp
inel
lifo
liu
m
var
iati
on
Kru
ger
et
al., 2
00
2
rece
pto
r-li
ke
gen
e
RC
3 –
en
cod
es a
n
Per
cep
tion
of
fung
al
S. ly
cop
ersi
con
/ In
ter-
spec
ific
H
yb
rid
nec
rosi
s C
han
ges
in
pro
tein
K
rug
er e
t al
., 2
00
2;
extr
acel
lula
r cy
stei
ne
Av
r p
rote
ins
S. p
imp
inel
lifo
liu
m
sequ
ence
R
oon
ey, 20
05
pro
teas
e
DA
NG
ER
OU
S M
IX 1
D
isea
se r
esis
tan
ce
Ara
bid
op
sis
tha
liana
In
tra-
spec
ific
H
yb
rid
nec
rosi
s
Gen
e co
py
nu
mb
er
Bo
mb
lies
et
al.,
v
aria
tion
2007
HIS
TID
INO
L-P
HO
SP
HA
TE
S
ynth
esis
of
esse
nti
al
A.
tha
liana
In
tra-
spec
ific
A
rres
t o
f hyb
rid s
eed
R
ecip
roca
l si
len
cing
B
ikar
d e
t al
., 2
009
AM
INO
-TR
AN
SF
ER
AS
E
amin
o a
cid
, h
isti
din
e
d
evel
op
men
t o
f dup
lica
te g
enes
(HP
A1
and
HP
A2
)
TR
AN
SP
AR
EN
T T
ES
TA
R
egula
tes
epid
erm
al
A.
tha
liana
In
tra-
spec
ific
L
eth
alit
y o
f in
terp
loid
al
Cis
-reg
ula
tory
D
ilkes
et
al.,
20
08
GL
AB
RA
2 (
TT
G2
) –
a
cell
fat
e
h
yb
rid
s m
uta
tion
s
WR
KY
tra
nsc
ripti
on
fac
tor
HB
D2
– e
nco
des
a c
asei
n
Roo
t dev
elop
men
t an
d
Ory
za s
ati
va
Inte
r-su
b-s
pec
ific
H
yb
rid
nec
rosi
s
Chan
ge
in p
rote
in
Yam
amo
to e
t al
.,
kin
ase
h
orm
on
e se
nsi
tiv
ity
sequ
ence
2
010
HW
H1
– e
nco
des
a G
MC
C
atal
yse
s oxid
atio
n–
O.
sati
va
Inte
r-su
b-s
pec
ific
H
yb
rid
nec
rosi
s
?
Jian
g e
t al
., 2
00
8
oxid
ore
du
ctas
e
redu
ctio
n r
eact
ion
s
Hy
bri
d s
teril
ity
S5
– e
nco
des
an
asp
arta
te
Dis
ease
res
ista
nce
O
. sa
tiva
In
ter-
sub
-sp
ecif
ic
Hy
bri
d f
emal
e st
eril
ity
C
han
ges
in
pro
tein
C
hen
et
al., 2
00
8
pro
teas
e
sign
alli
ng
and
cel
l dea
th
(em
bry
o s
ac s
teri
lity
) se
qu
ence
SaM
– a
SU
MO
E3
Po
st-t
ran
slat
ional
O
, sa
tiva
In
ter-
sub
-sp
ecif
ic
Hy
bri
d m
ale
ster
ilit
y
Su
bst
ituti
on
in
Lon
g e
t al
., 2
00
8
lig
ase-
lik
e gen
e
mo
dif
icat
ion
(poll
en a
bo
rtio
n)
intr
on
-spli
cin
g s
ite,
le
adin
g t
o t
runca
ted
p
rote
in
SaF
– e
nco
des
an F
-bo
x
Med
iati
on
of
O.
sati
va
Inte
r-su
b-s
pec
ific
H
yb
rid
mal
e st
eril
ity
A
min
o a
cid
sub
stit
uti
on
Lon
g e
t al
., 2
00
8
pro
tein
p
rote
in-p
rote
in
(poll
en a
bo
rtio
n)
in
tera
ctio
ns
mtR
PL
27
– N
ucl
ear-
enco
ded
T
ran
slat
ion o
f O
. sa
tiva
In
ter-
spec
ific
H
yb
rid
mal
e st
eril
ity
Rec
ipro
cal
sile
nci
ng
Y
amag
ata
et a
l.,
mit
och
ond
rial
rib
oso
mal
m
ito
chond
rial
O
. glu
mae
pat
ula
(poll
en a
bo
rtio
n)
of
dup
lica
te g
enes
2
010
14
Endosperm abortion resulting from endosperm breakdown is a common intrinsic
postzygotic hybridisation barrier in plants (Lester and Kang, 1998; Datson et al., 2006). In
interspecies crosses, endosperm abnormality and breakdown is often mentioned as the
cause of seed abortion following successful fertilisation, with embryo abortion as a
secondary effect (Watkins, 1932; Brink and Cooper, 1947; Stebbins, 1958; Haig; Westoby,
1991; Bushell et al., 2003).
Postzygotic lethality in interploidy crosses is hypothesized to play an important role
in polyploid speciation by genetically isolating populations of divergent ploidy (Johnston
et al., 1980; Burton and Husband, 2000; Dilkes et al., 2008). Successful hybridisation in
interploidy crosses is rare. Postzygotic hybridisation barriers have been widely studied in
many interploidy crosses within the same or different plant species. For example, Repkova
et al., (2006) studied the impact of post-fertilisation barriers on embryo development in
Trifolium spp. after interspecific crosses between diploid and tetraploid T. pratense and
diploid wild species T. alpestre L., T. medium L. and T. sarosiense Hazsl. In the crosses
between diploid T. pretense and the others the growth of the pollen tube was arrested.
When T. pretense (4x) was crossed with T. alpestre or T. sarosiense no hybrid embryos
could be detected by seed clearing followed by microscopy despite an enlargement of the
immature seeds was observed. When T. medium was used as the pollen parent in a cross
with T. pretense (4x) as the seed parent, different stages of embryos till torpedo stage were
observed 7 days after pollination (DAP).
Also, Fu et al., (2009) found severe postzygotic crossability hybridisation barriers
resulting in difficulties in transferring useful genes from Oriza meyeriana to Oriza sativa
in their interspecific hybridisation crosses. They found that hybrid embryo abortion is a
major reason for this hybridisation barrier, inducing no production of viable hybrid seeds
in maternal plants. Additionally, postzygotic reproductive barriers in the intergeneric
hybridisation between Chrysanthemum grandiflorum (Ramat.) Kitam. (female parent) and
Ajania przewalskii Poljak (male parent) plants resulted in low yield of seeds as
demonstrated by Deng et al., (2010).
Recently, several genes have been implicated in intrinsic postzygotic barriers that
operate at the level of hybrid seed failure. For example, copies of the HISTIDINOL-
PHOSPHATE AMINO-TRANSFERASE (HPA1 and HPA2) gene, which encodes a key
enzyme in the biosynthesis of the essential amino-acid histidine, are subject to differential
silencing in different ecotypes of A. thaliana resulting in a proportion of hybrid progeny
15
lacking functional HPA expression (Bikard et al., 2009; Table 1.1). Seeds containing such
progeny undergo developmental arrest and the seed aborts. An extensive survey of A.
thaliana ecotypes revealed an array of different mechanisms fort HPA silencing including
deletions, early stop codons and/or loss of expression. This confirmed a long standing idea
that the reciprocal silencing of duplicate genes is a potentially widespread cause of
intrinsic postzygotic barriers (Werth and Windham, 1991).
Differential expression of the TRANSPARENT TESTA GLABRA2 (TTG2) gene has
also been implicated in seed lethality following crosses between A. thaliana ecotypes, in
this instance, when the parental plants differ in ploidy level (Dilkes et al., 2008).
Landsberg erecta (Ler) and Columbia (Col-0) ecotypes vary in their tolerance to inter-
ploidy crosses. Low resolution genetic analysis first identified a major QTL for this
interploidy lethality, and then fine mapping revealed that a maternally expressed WRKY
transcription factor, TTG2, was explained the QTL effects. Sequence and expression
comparisons of the Ler and Col TTG2 alleles found cis-regulated differences in expression
levels rather than changes in coding sequence were the likely cause of variability in inter-
ploidy hybrid inviability.
1.2. The model plant A. thaliana
A. thaliana is a small flowering herb that is widely used as a model organism in
plant biology. Arabidopsis belongs to the mustard family (Brassicaceae) and it is mainly
autogamous with infrequent out crossing under laboratory condition. Although not of
major agronomic significance, Arabidopsis offers important advantages for basic research
in genetics and molecular biology (Griffing and Scholl, 1991). It was the first plant for
which the complete genome was sequenced and has a small genome size (120 Mb) (Can et
al. 2003). The genome is organized into five chromosomes having an estimated 20,000
genes (Meinke et al. 1998). The cultivation process of A. thaliana is very simple and the
entire life cycle from seed to seed can be completed in 6 weeks.
Arabidopsis users benefit from the seed stock centers such as Nottingham
Arabidopsis Stock Centre (NASC), from which large collection of naturally occurring
ecotypes and mutant lines are available. Arabidopsis ecotypes show different variation in
many physiological traits and provide a useful resource for identifying the molecular basis
of complex traits exploiting the polymorphism in nucleotide sequences. The use of A.
thaliana chromosome substitution lines (CSS) (Koumproglou et al., 2002) and
16
recombinant inbred lines (RIL) such as (Col/Ler) (Lister and Dean, 1993) can serve as
powerful tools for genetic molecular mapping studies especially for agriculturally
important traits such as yield, quality and some forms of disease resistances that are
controlled by a number of genes known as quantitative trait loci (QTL). Since 2000, all
information about Arabidopsis including genes, polymorphism, markers, sequences, maps,
clones, and access to DNA and seed stocks (Garcia-Hernandez and Reiser, 2002) are
available through the TAIR website (www.arabidopsis.org).
1.3. Endosperm development with special reference to A.
thaliana
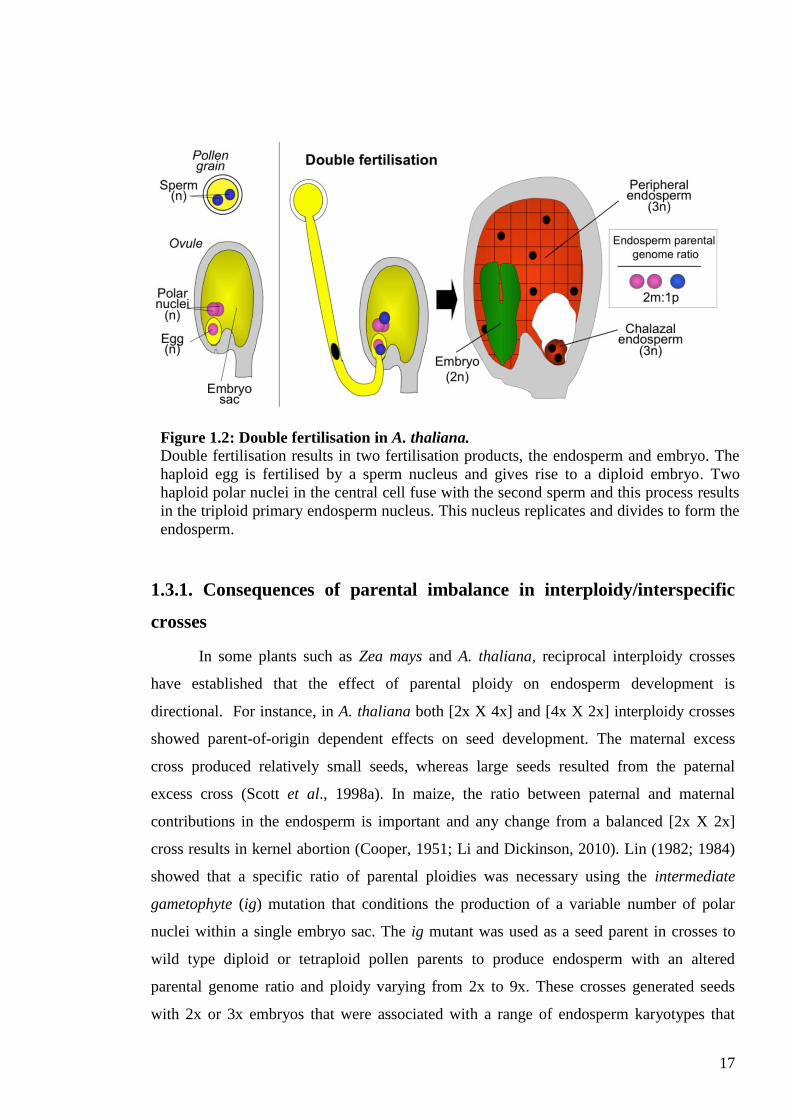
The development of seeds in higher plants is initiated by double fertilisation, a
process in which the two haploid male gametes resulting from the division of the single
generative cell of the pollen grain unite with cells of the megagametophyte. One gamete
fuses with the haploid egg nucleus to produce the diploid embryo, whilst the other gamete
fuses with two haploid polar nuclei of the central cell to form a triploid product that
develops into the endosperm (Figure 1.2); (reviewed by Haig, 1990; Brown et al., 1999).
A. thaliana has been used as a model plant for studying the development of the
endosperm. After fertilisation, the development of the endosperm starts by successive
divisions of the triploid primary endosperm nucleus without cytokinesis (Mansfield and
Briarty, 1990b; Berger, 1999, 2003). During the first few free-nuclear divisions, some
nuclei migrate to the micropylar and chalazal poles (Mansfield and Briarty, 1990a; Brown
et al., 1999; Herr, 1999) forming three distinct mitotic domains of the endosperm, as
verified by time-lapse observations (Boisnard-Lorig et al., 2001).
In wild type seeds, cellularisation of the endosperm is coupled to the eighth cycle
of synchronous mitosis in the peripheral endosperm that are initiated in the micropylar
mitotic domain and spread as a wave across the peripheral endosperm. At the chalazal
pole, a prominent multinucleate structure known as the chalazal endosperm is formed
(Scott et al., 1998a). The embryo sac expands progressively, increasing seed volume, as
the peripheral endosperm proliferates. At the time of endosperm cellularisation, the
embryo is usually at the heart stage of development. After cellularisation, the embryo
maintains its development and absorbs and assimilates the contents of the endosperm cells.
Only a single aleurone layer of endosperm cells persists in the mature seed.
17
1.3.1. Consequences of parental imbalance in interploidy/interspecific
crosses
In some plants such as Zea mays and A. thaliana, reciprocal interploidy crosses
have established that the effect of parental ploidy on endosperm development is
directional. For instance, in A. thaliana both [2x X 4x] and [4x X 2x] interploidy crosses
showed parent-of-origin dependent effects on seed development. The maternal excess
cross produced relatively small seeds, whereas large seeds resulted from the paternal
excess cross (Scott et al., 1998a). In maize, the ratio between paternal and maternal
contributions in the endosperm is important and any change from a balanced [2x X 2x]
cross results in kernel abortion (Cooper, 1951; Li and Dickinson, 2010). Lin (1982; 1984)
showed that a specific ratio of parental ploidies was necessary using the intermediate
gametophyte (ig) mutation that conditions the production of a variable number of polar
nuclei within a single embryo sac. The ig mutant was used as a seed parent in crosses to
wild type diploid or tetraploid pollen parents to produce endosperm with an altered
parental genome ratio and ploidy varying from 2x to 9x. These crosses generated seeds
with 2x or 3x embryos that were associated with a range of endosperm karyotypes that
Figure 1.2: Double fertilisation in A. thaliana.
Double fertilisation results in two fertilisation products, the endosperm and embryo. The
haploid egg is fertilised by a sperm nucleus and gives rise to a diploid embryo. Two
haploid polar nuclei in the central cell fuse with the second sperm and this process results
in the triploid primary endosperm nucleus. This nucleus replicates and divides to form the
endosperm.
18
differed in total ploidy and maternal and paternal genomic ratios. Lin found that
endosperms that deviated from a 2 maternal (m):1 paternal (p) ratio were not able to
complete development and were associated with seed abortion. This led Lin to conclude
that a 2m:1p genomic ratio rather than a specific ploidy is the critical factor for normal
endosperm development.
Unlike maize, in which crosses between a 2x and a 4x are lethal, A. thaliana
tolerates some deviation from the 2m:1p genome ratio in the endosperm: A. thaliana seeds
from [2x X 4x] crosses with a ratio of 2m:2p are viable, as are seed from [4x X 2x] crosses
with a ratio of 4m:1p. Extra paternal genomes in the endosperm (paternal excess), for
example in a [2x X 4x] cross, result in large seeds in which both the peripheral and
chalazae endosperm proliferate to a greater extent than the balanced [2x X 2x] cross and
endosperm cellularisation is delayed. Extra maternal genomes in the endosperm of the
reciprocal cross (maternal excess) in a [4x X 2x] cross, produce small seeds following
early cellularisation of an underproliferated endosperm (Scott et al., 1998a). Despite the
development of abnormal endosperm both interploidy crosses result in the production of
viable seed. This is in contrast to the outcome in many other species of crosses between 2x
and 4x plants which result in seed abortion (Haig and Westoby, 1991).
The observed endosperm abnormalities in crosses between 2x and 4x A. thaliana
are more severe in [2x X 6x] and [6x X 2x] crosses. These interploidy crosses resulted in
endosperm with extreme paternal or maternal excess phenotypes and eventually seed
abortion (Scott et al., 1998a). The interploidy cross [2x X 6x] resulted in the formation of
seed that contained severely over-proliferated endosperm that failed to undergo
cellularisation. Such seed contained an embryo arrested at the globular to heart stage and
almost never germinated. The reciprocal interploidy cross [6x X 2x] produced inviable
seed that were small, contained a small peripheral endosperm that cellularised very early.
A similar outcome to extreme imbalance is observed in other Arabidopsis species. Comai
found that seeds developed from crosses between [2x A. thaliana X 4x A. arenosa]
enlarged at the normal rate for 10 days, but embryos within these seeds arrested at the
globular stage. Such seeds subsequently collapsed and failed to germinate. However, in
contrast [4x A. thaliana X 4x A. arenosa] crosses produced seed with embryos at a range
of different stage; whilst most of this seed also aborted, a small proportion matured to
viable seed (Comai et al., 2000). Bushell et al., (2003) consolidated this idea by showing
that the cross between [2x A. thaliana X 4x A. arenosa] generated severely paternalised
endosperm similar to those observed in [2x X 6x] crosses in A. thaliana (Scott et al.,
19
1998a). In contrast, they found that seeds developed from the [4x A. thaliana X 4x A.
arenosa] cross fell into two categories: 60% were relatively large and plump and 40% were
relatively small and shriveled. Their hypothesis was that that imprinting is involved in the
hybridisation barrier between A. thaliana and A. arenosa supported by their observation
that doubling the maternal ploidy, to make the [4x A. thaliana X 4x A. arenosa] cross,
resulted in a high proportion of viable seed. However, endosperm in this cross exhibited a
dramatic reduction in peripheral endosperm proliferation and restoration of endosperm
cellularisation in comparison to [2x A. thaliana X 4x A. arenosa]. These crosses were
interpreted as demonstrating the higher ‗genomic strength‘ of A. arenosa relative to A.
thaliana. Bushell et al., (2003) also concluded that the ability of the A. arenosa and A.
thaliana genomes to function together to produce viable embryos in the [4x A. thaliana X
4x A. arenosa] cross and subsequently a healthy fertile hybrid suggests that there is no
general incompatibility or incongruity between the two parental genomes due to sequence
divergence.
1.3.2. The endosperm balance number (EBN) hypothesis
In interspecific or interploidy crosses, the success of seed development does
not depend solely on the 2m:1p ratio in the endosperm. The varied outcomes from both
crosses in several genera have lead to the development of several hypotheses to explain the
basis for normal seed development following both intra and interspecific crosses. Early
hypotheses suggested a need for a particular ratio of chromosome sets between the
fundamental parts of the developing seed (i.e. maternal tissue, embryo and endosperm) for
normal seed growth (Haig and Westoby, 1991). With the advent of the endosperm balance
number (EBN) concept by Johnston et al., (1980) which requires 2m: 1p EBN balance
ratio in the endosperm, a new understanding of both interecotype and interspecific
crossability barriers has been recognized. According to the EBN hypothesis, each species
has a genome-specific effective ploidy level which does not necessarily correspond to the
actual ploidy. For example, the EBN has been used to explain the behavior of crosses
within Solanum species (Johnston and Hanneman, 1980). These authors chose Solanum
chalconase (2n=24) as the standard species and assigned this an EBN of 2. Other species
were assigned an EBN value based on the success or failure of crosses to Solanum
chalconase. Crosses between species with different EBN values generally resulted in
failure of seed development whilst crosses between species with the same EBN value were
20
viable. Significantly, success or failure was not dependent on achieving a 2m: 1p genomic
ratio within the endosperm.
There are some exceptions where modest deviations from the 2 maternal: 1 paternal
ratio is tolerated. For instance, Ehlenfeldt and Hanneman, (1988) found that an excess of
maternal EBN dose is tolerated better than paternal excess in crosses between 2EBN and
1.5EBN species. Whilst a [2 EBN X 1.5 EBN] cross produced small and viable seed, as
similar to those observed in an A. thaliana [4x X 2x] cross, the reciprocal cross resulted in
shriveled non-viable seed.
The EBN hypothesis has been extended to explain hybridisation in a number of
other genera, implying that the EBN system is appropriate to a wide range of species
(Carputo et al., 1999). Even though the term endosperm balance number (EBN) was
proposed to explain the pattern of dosage-dependent incompatibility intrinsic to each
species or ecotype (Johnston et al., 1980; Dilkes et al., 2008), such phenomena are not
limited to angiosperms. For example, interspecies hybridisations in some vertebrates such
as crosses within the genus Hyla showed increased fertility when the maternal parent
genomes increased compared to the paternal one (Mable and Bogart, 1995).
EBN has been assigned to a large number of species (Johnston and Hanneman,
1982; Hawkes and Jackson, 1992). It is suggested that a change in regulation of the genes
involved in EBN can lead to changes in overall EBN level, and can therefore lead to
speciation (Ehlenfeldt and Hanneman, 1988 and Bushell et al., 2003). The EBN system
enables predictions to be made regarding the outcome of crosses within or between
species. For example, the EBN hypothesis was developed primarily to explain crosses
between Solanum (potato) species (Johnston and Hanneman, 1982; Bamberg, 1994;
Masuelli and Camadro, 1997) and later extended to include other genera such as
Lycopersicon (tomato), Datura and Trifolium (clover) (Parrott and Smith, 1986; Ehlenfeldt
and Hanneman, 1992; Johnston and Hanneman, 1999; Repkova et al., 2006).
1.4. Polyploidy: causes and consequences
Polyploidy has played a major role in evolution of flowering plants (Ramsey and
Schemske, 1998; Soltis et al., 2003). Polyploidy is the presence of more than two sets of
chromosomes within a nucleus, and it is widespread among plants. Moreover, there is
strong evidence to suggest that 60-70 % of the flowering plants have polyploid ancestory
(Wang et al., 2004; Köhler et al., 2010).
21
A. thaliana is an attractive model plant to demonstrate fundamental biological
processes associated with evolutionary consequences and molecular mechanisms of
polyploid formation. The small genome of A. thaliana may have been derived from three
rounds of polyploidisation (Bowers et al., 2003, and Soltis, 2005). The combination of two
genomes may create interactions that give rise to novel gene expression. As a result,
polyploid species often display new traits and genetic variability (Wang et al., 2004).
Allopolyploids have multiple chromosome sets are formed through the combined
processes of interspecific hybridisation and chromosome doubling (Otto and Whitton,
2000, and Soltis, 2005). In contrast, autopolyploids arise within a single species through
chromosome multiplication (Otto and Whitton, 2000; Soltis, 2005, and Köhler et al.,
2010).
Current studies of polyploid species have revealed genetic variability among and
within populations, due to varied contributions of multiple parental individuals.
Additionally, crossing among genetically different individuals of separate origin may
generate greater genetic diversity through independent assortment. Furthermore, the result
may be many genetically different polyploid individuals that may respond differently to
various selection pressures, providing more opportunities for polyploidy species to survive
changing environments (Soltis, 2005). Until now, the mechanisms of polyploid formation
have not been entirely elucidated.
1.4.1. Triploid block theory and the formation of unreduced gametes
Triploidy occurs frequently in diploid species of both animals and plants as a result
from the accidental fusion of 2n gamete to a regular 1n gamete. Errors during meiosis are
likely a common cause of unreduced gametes in diploid individuals (d‘Erfurth et al., 2008;
Köhler et al., 2010). Triploids can also arise as a result of crosses between diploid and
tetraploid individuals (Bretagnolle and Thompson, 1995; Ramsey and Schemske, 1998).
In humans, triploidy is not tolerated and is implicated in postzygotic lethality
(miscarriage) in approximately 2% of all conceptions between parents of apparently
normal karyotypes (Menasha et al., 2005). In contrast, some triploid fish and amphibia can
grow to adulthood and some species are even fixed in the triploid state (Tock et al., 2002).
Muller (1925) argued that triploidy is rarer in animals than plants because animals have a
more complex development, with more organ systems that are more sensitive to gene
dosage.
22
In plants, where crosses between diploid and tetraploid individuals of the same or
related species, result in a frequent failure of seed set, a reproductive barrier known as the
‗triploid block‘ is held responsible. The name is derived from the failure to produce the
expected triploid progeny. The phenomenon of triploid block has been extensively studied
within a variety of different species including brassica (Howard, 1939; Hakansson, 1956),
Lycopersicon (Cooper and Brink, 1945), rye (Hakansson and Ellerstrom, 1950), maize
(Cooper, 1951), Galeopsis pubscens (Hakansson, 1952), barley (Hakansson, 1953),
Primula (Woodell and Valentine, 1961), and Poinsettia (Milbocke and Sink, 1969).
In plants most triploid embryos apparently die because of abnormal endosperm
development (Satina and Blakeslee, 1938; Markes, 1966). Triploid block can result in a
high degree of instant postzygotic reproductive isolation between tetraploids and their
diploid progenitors, since nonviable progeny are formed by backcrossing to either parent
(Ramsey and Schemske, 1998; Köhler et al., 2010).
In A. thaliana, crosses between diploids and tetraploids of the C24 and Ler
ecotypes did not exhibit the high levels of triploid block found in other species. However,
Redei (1964) had earlier described a radically different outcome for reciprocal crosses
between a diploid genotype ‗W‘ and its autotetraploid ‗K-16‘. Whilst, the [K-16 (4x) X W
(2x)] produced mainly (91.6 %) plump seed, the reciprocal [W (2x) and K-16 (4x)] cross
produced mainly (97.3 %) shrivelled seed. The ‗W‘ genotype used in the Redei is believed
to be the Col-0 ecotype (pers comm. between George Redei (University of Columbia-
USA) and Rod Scott (University of Bath-UK). Further strong evidence for this association
was provided by Dilkes et al., (2008), who demonstrated essentially the same outcome
using a bona fide Col-0 diploid and derived autotetraploid in reciprocal crosses. Dilkes et
al., (2008) thus confirmed the existence of genetic variation for triploid block in A.
thaliana, albeit of an unusual character i.e. asymmetric (paternal-only) triploid block.
Until recently, neither the formation of unreduced gametes nor the mechansim of
triploid block was understood at the molecular level. The genetic basis of unreduced
gamete production has been subjected to analysis in A. thaliana (Ramsey and Schemske,
1998 and Köhler et al., 2010). Unreduced male gametes are formed at high frequency in
the Arabidopsis parallel spindle 1 (Atps1) mutant by a parallel orientation of the spindle
during meiosis II causing failure of the homologous chromosomes to migrate to opposing
pole (d‘Erfurth et al., 2008). On the other hand, the unreduced male gametes formed in the
jason (jas) mutant are formed due to a failure in homologous chromosome pairing during
meiosis I (Erilova et al., 2009).
23
Unreduced female gametes have been explained by many researchers; typical
examples being the switch 1/dyad mutant formed by mitotic-like division in the female
meiocyte at meiosis I (Mercier et al., 2001; Agashe et al., 2002). Omission of the second
meiotic division (Bretagnolle and Thompson, 1995), which occurs in the Arabidopsis
omission of second division 1 (osd1) mutant also produces unreduced female gametes
(d‘Erfurth et al., 2009).
1.4.2. Aneuploidy and mosaic aneuploidy
Chromosome segregation is an important process in mitosis and must be performed
correctly to ensure that the two resulting daughter cells have the same DNA content.
Missegregation of chromosomes results in aneuploidy, something that is frequently found
in cancers, suggesting that the machinery surveying the chromosome segregation process
has somehow been compromised during the development of these tumours. Aneuploidy
introduces dosage imbalance on a chromosomal scale and is proposed to alter phenotypes
by simultaneously disrupting the stoichiometry of all dosage-sensitive gene products
encoded by a chromosome, or subset of chromosomes (Birchler et al., 2001). Aneuploidy
has played an important role in the study of plant genetics. Plants with aneuploid
chromosome numbers were first reported in the hybrid between Oenothera lata and
Oenothera gigas generations by Lutz (1909). However, the term aneuploidy was first
introduced by Tackholm (1922) following her research in the genus Rosa. There are two
types of aneuploidy usually observed 1) monosomy (2n-1) which is the lack of one of a
pair of chromosomes, 2) trisomy (2n+1) that refers to an individual having additional
chromosome to the normal diploid number (Hartwell et al. , 2004). Among aneuploids,
trisomics by far are the best documented (Khush, 1973). Triploids were used as sources of
trisomics in different plants such Datura (Blakeslee, 1921), maize (McClintock, 1929), etc;
however, these studies introduced the idea that triploids could produce viable aneuploids,
which were mostly trisomics.
Aneuploidy is often associated with distinct and usually deleterious phenotypes that
are specific to the type of aneuploidy (Blakeslee, 1921; Khush, 1973; Henry et al., 2006).
Henry et al., (2005) stated that chromosome doubling of a plant usually has little effect on
fertility, while drastic changes to the phenotype may results from adding a single
chromosome and mainly could lead to sterility. In polyploid backgrounds, relative
chromosome imbalance is reduced due to the overall higher chromosome copy number and
aneuploidy can have minor phenotypic consequences (Ramsey and Schemske, 1998).
24
When aneuploidy is detected in a fraction of cells in an individual, it is called
chromosomal mosaicism. Mosaic aneuploidy or the term ―mosaicism‖ describes a situation
in which different cells in the same individual have different numbers or arrangements of
chromosomes (Montalenti, 1978). Youssoufian and Pyeritz, (2002) stated that aneuploid
mosaicism is the presence of more than one genetically (karyotypically) distinct cell line
within a single organism. Mosaic aneuploidy is frequently seen within human
preimplantation embryos (Delhanty et al., 1993) and has been suggested to represent a
common condition in humans (Voullaire et al., 2000). Until now the mosaic aneuploidy is
not reported in plants; however, our preliminary data suggested that A. thaliana mutant
plant mosaic aneuploidy-1 (moa-1) is a mosaic aneuploid. Identifying the gene underlying
this mutation would provide valuable insights into the mechanism of mosaic aneuploidy.
1.5. QTL genetic mapping
The anomalous behavior of the Col-0 [2x X 4x] crosses showing high F1 lethality
similar to those observed in crop species has opened up avenues to understand the basis of
seed abortion following crosses. However, a single phenotypic trait could be determined by
many genes that constitute quantitative trait loci (QTL). QTL mapping is the statistical
study of the alleles that occur in a locus and the phenotypes that they produce. Because
most traits of interest are controlled by more than one gene, it is important to study the
entire locus of related genes to understand what might affect the genotype of an individual.
In simple terms, QTL analysis is based on the principle of detecting an association between
phenotype and genotype. Genetic mapping or linkage mapping refers to the determination
of relative position and distances between markers along chromosomes. Genetic mapping
is based on the principle that genes segregate via chromosome recombination during sexual
reproduction (i.e. meiosis division), thus allowing their analysis in the progeny (Paterson,
1996).
Many agriculturally important characters such as yield, quality, and some forms of
disease resistance are controlled by many different genes or quantitative traits (polygenic
inheritance). The regions within genomes that contain genes associated with a particular
quantitative trait art known as quantitative trait loci (QTL) (Collard et al., 2005). They can
be attributed to the interactions between two or more genes and their environment.
Nevertheless, QTLs can be molecularly identified to help map regions of the genome that
contain genes involved in specifying a quantitative trait (Collard et al., 2005). This can be
25
an early step in identifying and sequencing these genes. QTL analysis to identify genomic
regions associated with traits is known as QTL mapping (Paterson, 1996 and Mohan et al.,
1997). In many biological researches, the QTL identification is accomplished by studying
DNA markers. However, the use of DNA markers in plant breeding has opened a new area
in agriculture called molecular breeding (Rafalski and Tingey, 1993). DNA markers that
are linked to agronomically important genes may be used as molecular tools for marker
assisted selection in plant breeding (Ribaut and Hoisington, 1998).
DNA markers arise from different classes of DNA mutations such as point
mutations, rearrangements (insertion or deletion) or errors in replication of repeated DNA
(Paterson, 1996). DNA markers are divided into three categories based on the method of
their detection: hybridisation-based, polymerase chain reaction or PCR-based, and DNA
sequence-based (Jones et al., 1997). The DNA markers are useful if they reveal differences
between individuals of the same or different species (polymorphic markers). However,
polymorphic markers are either dominant or co-dominant markers, thus both markers can
easily differentiate between heterozygous and homozygous individuals. Additionally, the
co-dominant markers indicates differences in size whereas dominant markers are either
present or absent (Collard et al., 2005). A number of excellent reviews have been written
about the construction of linkage maps, QTL analysis and the application of markers in
marker assisted-selection such as (Tanksley, 1993; Jones et al., 1997; Collard et al., 2005;
Semagn et al., 2006).
QTL analysis is based on the principle of detecting an association between
phenotype and the genotype of markers. Markers are used to partition the mapping
population into different genotypic groups based on the presence or absence of a particular
marker locus and to determine whether significant differences exist between groups with
respect to the trait being measured (Tanksley, 1993). Most QTL experiments to identify
different phenotypic traits and marker genotypes have been carried out using several
crossing methods from inbred lines including backcross (BC), advanced backcross, F2,
recombinant inbred (RI) populations, intermated recombinant inbred (IRI) populations,
advanced intercross (AI) populations, advanced backcross populations, double haploid
(DH) populations (Winkler et al., 2003; Broman, 2005; Kao, 2006).
The use of A. thaliana recombinant inbred lines (RILs) can serve as powerful tools
for genetic mapping studies in plants (Lister and Dean, 1992). Several RIL populations
have been widely used for mapping in different organisms including mice (Bailey, 1981;
Carnerio et al., 2009), maize (Burr et al., 1988; Austin and Lee, 1996), rice (Nair et al.,
26
1995; Cho et al., 2010), sunflower (Langar et al., 2003), soybean (Mansur et al., 1996;
Choi et al., 2010), and Arabidopsis thaliana (Kobayashi and Koyama, 2002; Kobayashi et
al., 2004; Lisec et al., 2009). However, there are many useful A. thaliana QTL studies that
investigated life history traits such as flowering time (Clarke et al., 1995; Alonso-Blanco et
al., 1998), seed dormancy (van Schaar et al., 1997), growth (Mitchell-Olds, 1996; Alonso-
Blanco et al., 1999), and seed size (Alonso-Blanco et al., 1999).
27
1.6. Research aim and objectives
The aim of this research project was to investigate the role of hybridisation barriers
in seed development. Our research aim was carried out in two main aspects:
1) To determine the molecular genetic basis of mosaic aneuploidy in A. thaliana.
2) To understand the molecular genetic basis of the A. thaliana postzygotic hybridisation
barrier.
The objectives of this research were as follows:
1. Determine the molecular genetic basis of the mosaic aneuploidy phenotype of the moa-1
mutation. The approach was to 1) confirm the mosaic aneuploidy phenotype by extensive
karyotype analysis; 2) study the genetics of moa-1 inheritance; 3) attempt to map and
identify the moa-1 gene.
2. Determine the extent of genetic variation for triploid block in A. thaliana.
Dilkes et al., (2008) working with the Col-0 ecotype first demonstrated the existence of
genetic variation for triploid block in A. thaliana. In Col-0, in contrast to Ler and C24, the
[2x X 4x] cross exhibited high levels of triploid block; the reciprocal [4x X 2x] cross
behaved as Ler and C24 in being non-abortive. An important question therefore was which
of the two behaviors - no triploid block or paternal-only triploid block - or some other
permutation, is most representative of the A. thaliana species. The experimental approach
was to test the crossing behaviour of multiple additional ecotypes and to use meiotic
mutants to investigate aspects of the Col paternal-only triploid block.
3. To identify and characterise a potent maternal modifier that prevents expression of Col-0
triploid block. This was expected to provide valuable insights into the process of Col-0
induced seed abortion, particularly at the cell biological and molecular genetic level.
4. Determine the genetics of the Col-0 killing trait.
The approach taken to increasing our understanding of the mechanism underlying the Col-
killer trait was to map and ultimately identify the gene or genes responsible.
28
Chapter 2
2. Materials and Methods
2.1. Materials
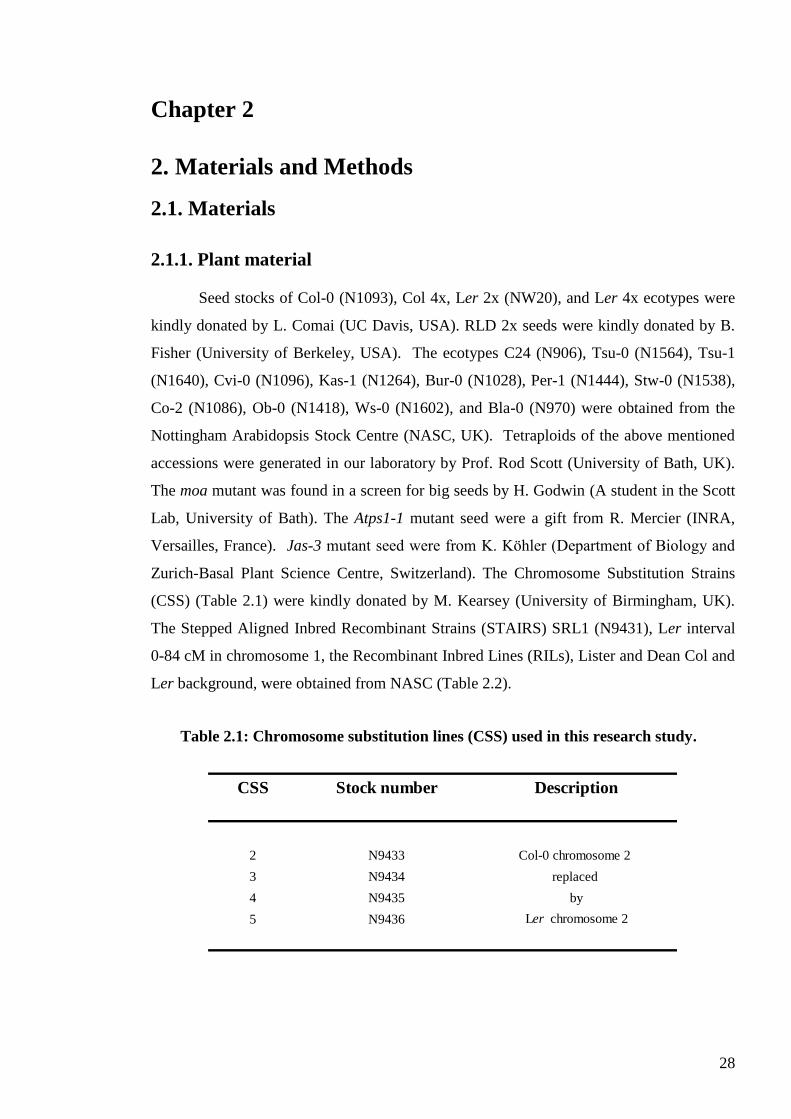
2.1.1. Plant material
Seed stocks of Col-0 (N1093), Col 4x, Ler 2x (NW20), and Ler 4x ecotypes were
kindly donated by L. Comai (UC Davis, USA). RLD 2x seeds were kindly donated by B.
Fisher (University of Berkeley, USA). The ecotypes C24 (N906), Tsu-0 (N1564), Tsu-1
(N1640), Cvi-0 (N1096), Kas-1 (N1264), Bur-0 (N1028), Per-1 (N1444), Stw-0 (N1538),
Co-2 (N1086), Ob-0 (N1418), Ws-0 (N1602), and Bla-0 (N970) were obtained from the
Nottingham Arabidopsis Stock Centre (NASC, UK). Tetraploids of the above mentioned
accessions were generated in our laboratory by Prof. Rod Scott (University of Bath, UK).
The moa mutant was found in a screen for big seeds by H. Godwin (A student in the Scott
Lab, University of Bath). The Atps1-1 mutant seed were a gift from R. Mercier (INRA,
Versailles, France). Jas-3 mutant seed were from K. Köhler (Department of Biology and
Zurich-Basal Plant Science Centre, Switzerland). The Chromosome Substitution Strains
(CSS) (Table 2.1) were kindly donated by M. Kearsey (University of Birmingham, UK).
The Stepped Aligned Inbred Recombinant Strains (STAIRS) SRL1 (N9431), Ler interval
0-84 cM in chromosome 1, the Recombinant Inbred Lines (RILs), Lister and Dean Col and
Ler background, were obtained from NASC (Table 2.2).
CSS Stock number Description
2 N9433 Col-0 chromosome 2
3 N9434 replaced
4 N9435 by
5 N9436 Ler chromosome 2
Table 2.1: Chromosome substitution lines (CSS) used in this research study.
29
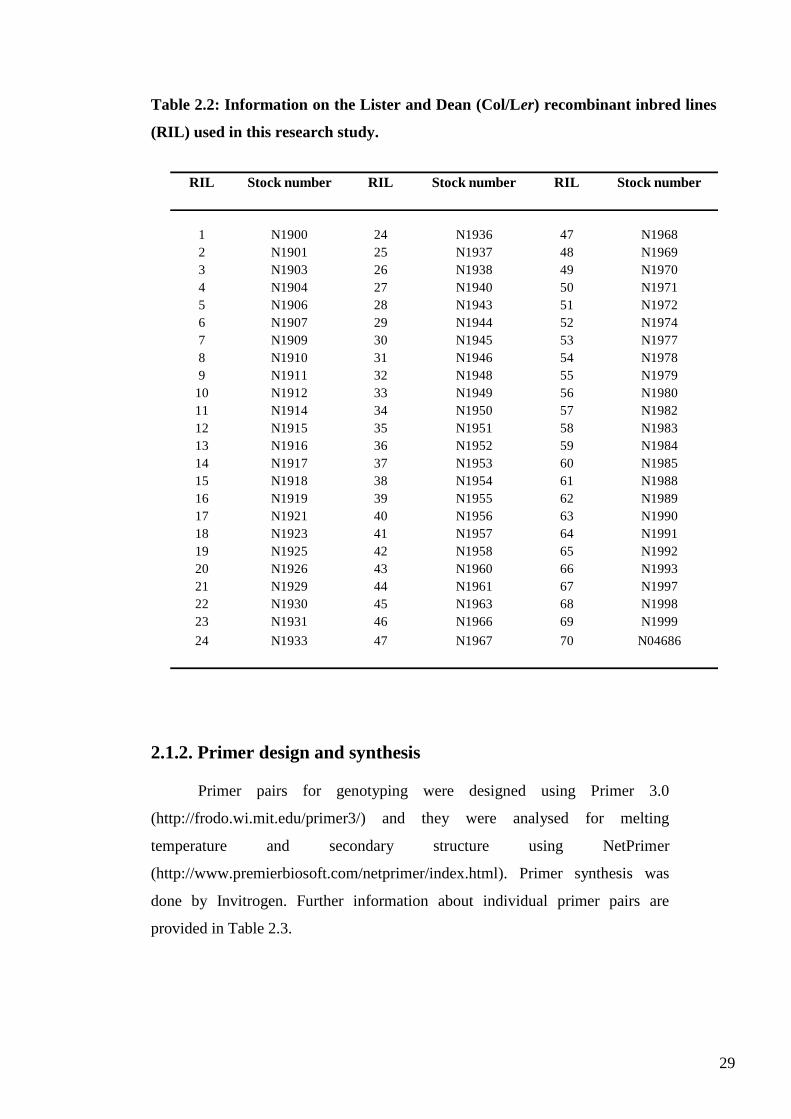
Table 2.2: Information on the Lister and Dean (Col/Ler) recombinant inbred lines
(RIL) used in this research study.
2.1.2. Primer design and synthesis
Primer pairs for genotyping were designed using Primer 3.0
(http://frodo.wi.mit.edu/primer3/) and they were analysed for melting
temperature and secondary structure using NetPrimer
(http://www.premierbiosoft.com/netprimer/index.html). Primer synthesis was
done by Invitrogen. Further information about individual primer pairs are
provided in Table 2.3.
RIL Stock number RIL Stock number RIL Stock number
1 N1900 24 N1936 47 N1968
2 N1901 25 N1937 48 N1969
3 N1903 26 N1938 49 N1970
4 N1904 27 N1940 50 N1971
5 N1906 28 N1943 51 N1972
6 N1907 29 N1944 52 N1974
7 N1909 30 N1945 53 N1977
8 N1910 31 N1946 54 N1978
9 N1911 32 N1948 55 N1979
10 N1912 33 N1949 56 N1980
11 N1914 34 N1950 57 N1982
12 N1915 35 N1951 58 N1983
13 N1916 36 N1952 59 N1984
14 N1917 37 N1953 60 N1985
15 N1918 38 N1954 61 N1988
16 N1919 39 N1955 62 N1989
17 N1921 40 N1956 63 N1990
18 N1923 41 N1957 64 N1991
19 N1925 42 N1958 65 N1992
20 N1926 43 N1960 66 N1993
21 N1929 44 N1961 67 N1997
22 N1930 45 N1963 68 N1998
23 N1931 46 N1966 69 N1999
24 N1933 47 N1967 70 N04686
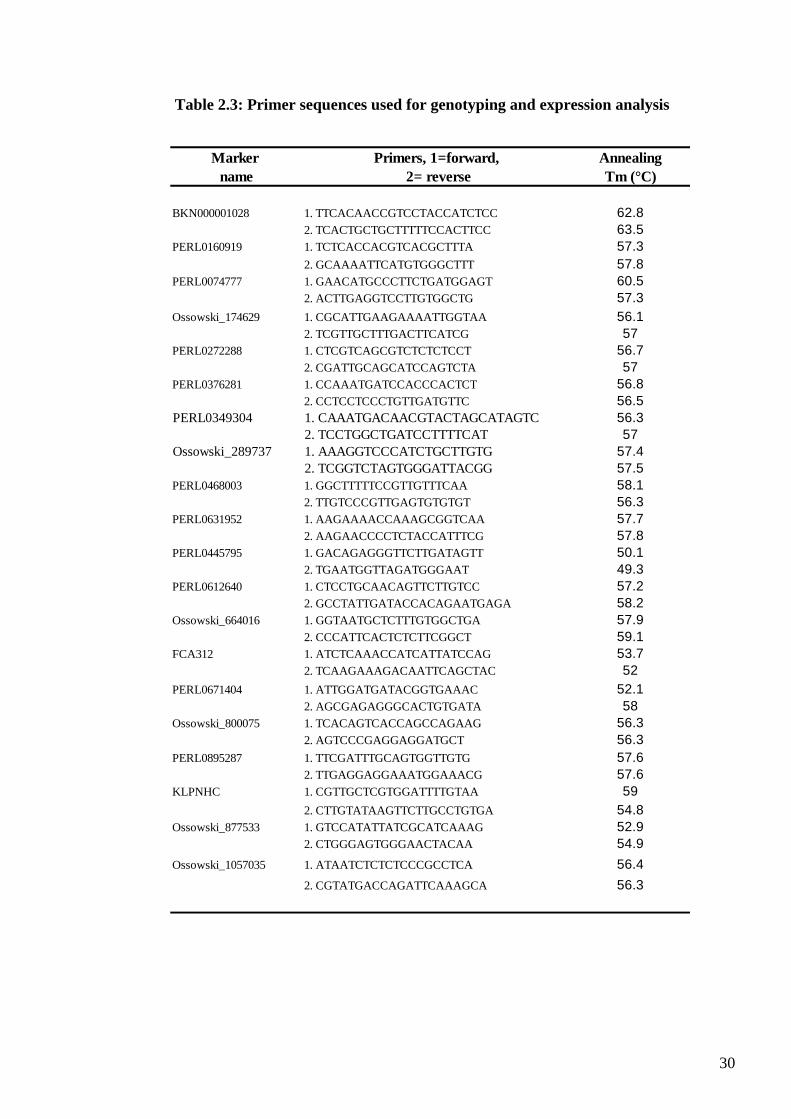
30
Table 2.3: Primer sequences used for genotyping and expression analysis
Marker Primers, 1=forward, Annealing
name 2= reverse Tm (°C)
BKN000001028 1. TTCACAACCGTCCTACCATCTCC 62.8
2. TCACTGCTGCTTTTTCCACTTCC 63.5
PERL0160919 1. TCTCACCACGTCACGCTTTA 57.3
2. GCAAAATTCATGTGGGCTTT 57.8
PERL0074777 1. GAACATGCCCTTCTGATGGAGT 60.5
2. ACTTGAGGTCCTTGTGGCTG 57.3
Ossowski_174629 1. CGCATTGAAGAAAATTGGTAA 56.1
2. TCGTTGCTTTGACTTCATCG 57
PERL0272288 1. CTCGTCAGCGTCTCTCTCCT 56.7
2. CGATTGCAGCATCCAGTCTA 57
PERL0376281 1. CCAAATGATCCACCCACTCT 56.8
2. CCTCCTCCCTGTTGATGTTC 56.5
PERL0349304 1. CAAATGACAACGTACTAGCATAGTC 56.3
2. TCCTGGCTGATCCTTTTCAT 57
Ossowski_289737 1. AAAGGTCCCATCTGCTTGTG 57.4
2. TCGGTCTAGTGGGATTACGG 57.5
PERL0468003 1. GGCTTTTTCCGTTGTTTCAA 58.1
2. TTGTCCCGTTGAGTGTGTGT 56.3
PERL0631952 1. AAGAAAACCAAAGCGGTCAA 57.7
2. AAGAACCCCTCTACCATTTCG 57.8
PERL0445795 1. GACAGAGGGTTCTTGATAGTT 50.1
2. TGAATGGTTAGATGGGAAT 49.3
PERL0612640 1. CTCCTGCAACAGTTCTTGTCC 57.2
2. GCCTATTGATACCACAGAATGAGA 58.2
Ossowski_664016 1. GGTAATGCTCTTTGTGGCTGA 57.9
2. CCCATTCACTCTCTTCGGCT 59.1
FCA312 1. ATCTCAAACCATCATTATCCAG 53.7
2. TCAAGAAAGACAATTCAGCTAC 52
PERL0671404 1. ATTGGATGATACGGTGAAAC 52.1
2. AGCGAGAGGGCACTGTGATA 58
Ossowski_800075 1. TCACAGTCACCAGCCAGAAG 56.3
2. AGTCCCGAGGAGGATGCT 56.3
PERL0895287 1. TTCGATTTGCAGTGGTTGTG 57.6
2. TTGAGGAGGAAATGGAAACG 57.6
KLPNHC 1. CGTTGCTCGTGGATTTTGTAA 59
2. CTTGTATAAGTTCTTGCCTGTGA 54.8
Ossowski_877533 1. GTCCATATTATCGCATCAAAG 52.9
2. CTGGGAGTGGGAACTACAA 54.9
Ossowski_1057035 1. ATAATCTCTCTCCCGCCTCA 56.4
2. CGTATGACCAGATTCAAAGCA 56.3
31
2.1.3. Statistical analysis
Statistical tests for the data were carried out using Minitab 15 software (Minitab
Inc, USA). Comparisons for normally distributed data with equal variances were
performed using Student‘s t-test or one way (ANOVA) followed by Tukey‘s multiple
comparisons (family error rate = 5). Where data did not follow a normal distribution the
analysis was done using the Mann-Whitney U-test with the P-value adjusted for ties.
2.1.4. Image capture and processing
Images of the whole plant, inflorescences, and chromosomes were obtained using a
Coolpix 4500 digital camera (Nikon). Flowers, siliques, and mature seeds were
photographed under a SMZ1500 dissecting microscope (Nikon) using a Digital Sight DS-
U1 colour camera (Nikon). Captured images were processed using the Adobe Photoshop
Elements Software.
2.1.5. QTL mapping and statistical analysis
QTL analysis was carried out using composite interval mapping (CIM)
implemented by the software computer program QTL Cartographer (Basten et al., 1994,
2001). Log-likelihood (LOD) thresholds were used to determine the significance of the
QTLs. The analyses were performed on the means and principal component scores of 70
tetraploid RILs as pollen parent crossed with Col-0 as seed parent. The CIM analysis was
done by P. Kover (University of Bath, UK).
32
2.2. Methods
2.2.1. Growth conditions for A. thaliana
Seeds were stratified in 0.15% agarose at 4°C for 3-5 days. Seeds were sown onto
Levingtons F2 compost pre-treated with 0.2gm/L insecticidal intercept solution (Intercept
70 WG - Scotts). Sown seeds were covered with propagator lids for about 10 days after
germination. Plants were grown in a glass house with a day length of 16 hours at 24°C
(day) and 18°C (night) or in a Sanyo controlled environment room with a day length of 16
hours, 70% relative humidity, 22 °C (day) and 18 °C (night).
2.2.2. Cross pollination
For reciprocal crosses between individual Arabidopsis plants, the seed parents were
emasculated one day prior to anthesis and pollinated two to three days after emasculation.
Pollination was done when the stigmatic papillae were fully extended. Mature pollen from
the pollen parent was gently dabbed onto the mature stigmas. The process of emasculation
was done carefully by selecting only 3-5 buds per branch, and removing either a few or all
the remaining flower buds around the emasculated buds to avoid self- and cross-
pollination. Both emasculation and pollination were carried out under a Leica MZ6
dissecting microscope.
2.2.3. Cytological technique for counting mitotic chromosomes
Young Arabidopsis thaliana flower buds were selected for chromosome squashs.
2.2.3.1. Fixation
Young auxiliary inflorescences were collected from relevant plants, and the buds
were immersed in. freshly made Carnoy solution (3 parts absolute alcohol: 1 part glacial
acetic acid). The material was stored in the fixative at 4°C. At least 30 minutes fixation
was allowed before hydrolysis.
33
2.2.3.2. Processing
Following the method of Bailey and Stace (1992), the plant material was removed
from fixative and hydrolysed for 10 minutes in 5N HCl. After hydrolysis the inflorescences
were removed from HCl and placed in freshly prepared 70% ethanol. The inflorescences
were then dissected using fine pair of needles in a drop of 45% glacial acetic acid under a
dissecting microscope. The material was then placed in a drop of 1% aceto- orcine (1gm
orcein: 55 ml glacial acetic acid: 45 ml distilled H2O), covered with a coverslip and heated
from beneath for 4-5 seconds for staining. The slide was placed in a fold of filter paper,
placed on a flat surface and the squash was made by applying pressure using the thumb.
The slide was examined and chromosome counts done using a Phase Contrast Microscope
(Olympus, BH-2, Japan).
2.2.4. Phenotypic characterisation
Phenotypic characterisation of moa-1 mutant plants was done by growing the
mutant plant and its wild type control Ler, under the same growth conditions and scoring
them for variation in size and shape of the leaf and stem, flower size and petal number,
silique length, and seed size and shape.
2.2.5. Seed weight
After approximately 8 weeks from sowing, mature seeds were harvested from dry
siliques that were naturally desiccated. Occasionally, seeds were stored in a sealed
container with silica gel to ensure complete dessication. Mean seed weight was obtained by
weighing all the seeds from 3-6 individual siliques from 3 different plants. Seed weights
were measured using a Mettler UMT2 microbalance (Mettler-Toledo, Leicester, UK).
2.2.6. Categorising the seeds
Once the mature seeds were collected from different ecotype crosses, they were
separated and categorised into two groups: plump and shrivelled. The process was done by
eye under light microscope.
34
2.2.7. Seed germination
Two filter disks (Grade1, size 8.5cm, 90mm, Whatmann) were placed into a Petri
dish. A glass microfiber filter paper (GF/A, 70mm, Whatmann, UK) was place on top and
5ml of sterile milli-Q water was added to the Petri dish. Seeds were placed evenly spaced
into the Petri dish and sealed with parafilm (M, UK). The petri dishes with the seeds were
placed in a Sanyo control environment room with day length of 16 hours, 70% relative
humidity, 22 °C (day) and 18 °C (night) for approximately two weeks. After 2 weeks the
seeds were scored for germination (i.e. when the radicle and cotyledonary leaves are
formed), and representative sample photographs taken.
2.2.8. Making tetraploids from diploids
Tetraploids of Arabidopsis thaliana ecotypes, CSS lines and RILs were generated
by treating two-week old seedlings with 6 µl of either 0.125% or 0.25% colchicine
(Sigma). Treated plants were grown to maturity scored for phenotypic alteration to flowers,
inflorescence and seed sizes to validate the success of colchicine treatment. Seed was
harvested from plants showing the appropriate morphology (large flowers) and increase in
seed size (area and weight) compared to the corresponding wild type. A small number of
plants were grown from each putative tetraploid line and subjected to karyotype analysis
(method section 2.2.3) to confirm the appropriate ploidy level.
2.2.9. Seed clearing and differential contrast (DIC) microscopy
Seeds after 3, 5, 6, 7 DAP were dissected from siliques and mounted in clearing
solution (chloral hydrate/ water/ glycerol, 8:3:1). They were then left for 1-6 hours to clear
depending on the number of days after pollination. Cleared seeds were examined under a
Nikon 90i Eclipse microscope (Tokyo, Japan), using differential interference contrast
optics. The slides were imaged and photographed with a DS-U1 colour camera (Nikon).
2.2.10. Feulgen staining and confocal microscopy
Feulgen staining of seeds was carried out according to the method of Braselton et
al., (1996). Arabidopsis siliques (3, 5, 7, or 9 DAP) were placed in freshly prepared
Carnoy‘s fixative solution (3 ethanol: 1 acetic acid) and stored overnight at 4 °C. Siliques
were removed from the fixative solution and transferred to 70% ethanol where they could
35
be kept at 4 °C for several weeks before use. A 3 day protocol for staining and slide
preparation was followed.
Day 1: siliques were washed 3 times in sterile milli-Q water for 15 mins to remove
any remaining ethanol before hydrolysis in 5N HCl for 1 hour, this was followed by three
washes in sterile milli-Q water for 10 mins each. To avoid any tissue damage, after the last
wash Schiff‘s reagent was pipetted in the same tubes and they were incubated at room
temperature in the dark for 2 hours. Each silique, now stained pink, was individually
washed in cold tap water 3 times for 10 mins. The samples were then taken through an
ethanol series: 1 wash in 70% and 95%, two washes in 100%, each for 10 mins. Samples
were then incubated overnight in fresh 100% ethanol at 4 °C.
Day 2: The 100% ethanol was changed every hour till no pink colour leached from
the siliques. The siliques could be stored for several weeks at -20 °C at this point).
Following this, the ethanol was replaced with 1 ethanol: 1 LR White Resin (Agar
Scientific, UK) for 1 hour with occasional mixing by gently inverting the tube. The
ethanol/LR White resin mix was replaced by pure resin for 1 hour, again with occasional
gentle mixing. A final change with fresh pure resin followed and the samples were stored
overnight at 4 °C.
Day 3: A drop of resin containing LR White Accelerator (Agar Scientific) was
placed in the centre of a microscope slide and two coverslips were pushed partway into it
from either side. The stained silique was placed on the slide within the resin droplet and
opened with two shallow longitudinal cuts on either side of the septum. Seeds were gently
dissected from the pod into the resin using fine needles and the pod wall removed using
fine forceps. A third coverslip was then placed over the seeds with its edges supported by
the other two coverslips. Once the resin was polymerised, the slides were kept aside for
microscopy at a later time.
The Feulgen stained seeds were imaged with an argon ion laser, 488-nm excitation
and 515/530-nm emission, using a Nikon C1 confocal microscope system with a 90i
Eclipse microscope and EZC1software (Nikon UK). Images were saved as TIFFs and
processed with Adobe Photoshop.
36
2.2.11. Plant DNA extraction
Plant DNA extraction for genotyping was done according to a modified protocol of
Edwards et al., (1991). The method was carried out by placing two or three small, young
leaves in 1.5 ml tube on ice with a toothpick of glass beads (Sigma) and 450 µl extraction
buffer (200 mM Tris-HCl pH 7.5, 250 mM NaCl and 25 mM EDTA). A bench drill with a
sterile plastic pestle was used to grind the leaf material to fine slurry, after which the debris
was pelleted by centrifugation at maximum speed (14,000 rpm) in bench-top centrifuge.
The supernatant was decanted to a new tube and subjected to a second centrifugation step
and the clear supernatant was carefully pipette out in a fresh eppendorf tube. An equal
volume of 100% isopropanol was added to the supernatant, followed by incubation at room
temperature for 2-5 minutes. DNA pellets were obtained by centrifugation at speed (14,000
rpm) for 10 minutes. The pellet was washed three times with 70% ethanol, and left to dry
in laminar flow hood for 5 minutes or until all traces of liquid had evaporated. The pellet
was dissolved in 80µl sterile milli-Q H2O and the sample stored at 4 °C for use with 2-3
months.
2.2.12. DNA amplification for genotyping analysis
Each 25 µl reaction contained 2 µl of extracted DNA solution, 17.75 µl sterile
milli-Q H2O, 2.5 µl of 10x PCR buffer ( 100 mM Tris-HCl pH8.3, 500 mM KCl, 15 mM
MgCl2 ), 0.5 µl dNTPs mix (10 mM ),1µl of each forward and reverse primers (10 µM),
and 0.25 µl Taq DNA polymerase (5 U/ µl). All reactions were carried out on a PTC- 200
Peltier Thermal Cycler (MJ Research, USA). The amplification programme consisted of:
Initial denaturation at 94°C for 4.0 min, followed by 32 cycles of denaturation at 94 °C for
30 seconds, annealing at X°C (where X depends on the primer pairs used) for 30 seconds
and extension at 72 °C for ~ 1 min (depending on the fragment length, 1 min/kb)., A final
extension for 10 min at 72 °C was done to finish off the PCR products. Details of PCR
primer sequences used for genotyping are shown in (Table 2.4). The PCR product was
cleaved with appropriate enzymes to ascertain the genotype.
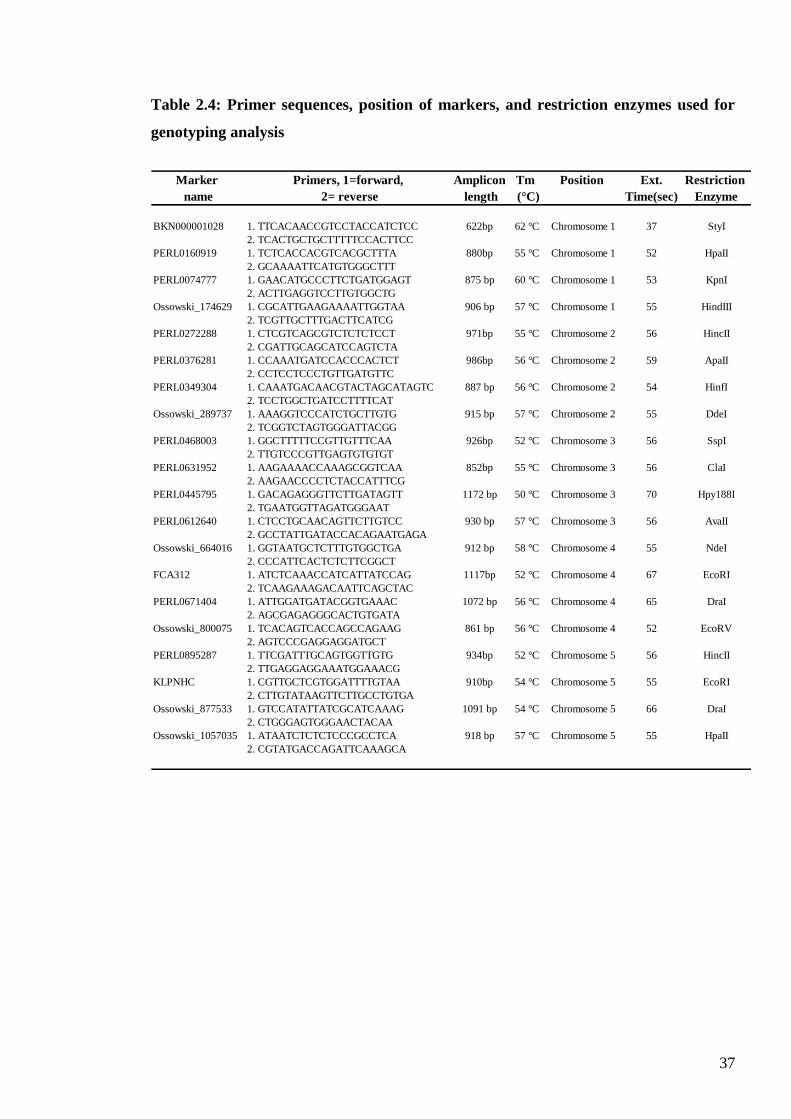
37
Table 2.4: Primer sequences, position of markers, and restriction enzymes used for
genotyping analysis
Marker Primers, 1=forward, Amplicon Tm Position Ext. Restriction
name 2= reverse length (°C) Time(sec) Enzyme
BKN000001028 1. TTCACAACCGTCCTACCATCTCC 622bp 62 °C Chromosome 1 37 StyI
2. TCACTGCTGCTTTTTCCACTTCC
PERL0160919 1. TCTCACCACGTCACGCTTTA 880bp 55 °C Chromosome 1 52 HpaII
2. GCAAAATTCATGTGGGCTTT
PERL0074777 1. GAACATGCCCTTCTGATGGAGT 875 bp 60 °C Chromosome 1 53 KpnI
2. ACTTGAGGTCCTTGTGGCTG
Ossowski_174629 1. CGCATTGAAGAAAATTGGTAA 906 bp 57 °C Chromosome 1 55 HindIII
2. TCGTTGCTTTGACTTCATCG
PERL0272288 1. CTCGTCAGCGTCTCTCTCCT 971bp 55 °C Chromosome 2 56 HincII
2. CGATTGCAGCATCCAGTCTA
PERL0376281 1. CCAAATGATCCACCCACTCT 986bp 56 °C Chromosome 2 59 ApaII
2. CCTCCTCCCTGTTGATGTTC
PERL0349304 1. CAAATGACAACGTACTAGCATAGTC 887 bp 56 °C Chromosome 2 54 HinfI
2. TCCTGGCTGATCCTTTTCAT
Ossowski_289737 1. AAAGGTCCCATCTGCTTGTG 915 bp 57 °C Chromosome 2 55 DdeI
2. TCGGTCTAGTGGGATTACGG
PERL0468003 1. GGCTTTTTCCGTTGTTTCAA 926bp 52 °C Chromosome 3 56 SspI
2. TTGTCCCGTTGAGTGTGTGT
PERL0631952 1. AAGAAAACCAAAGCGGTCAA 852bp 55 °C Chromosome 3 56 ClaI
2. AAGAACCCCTCTACCATTTCG
PERL0445795 1. GACAGAGGGTTCTTGATAGTT 1172 bp 50 °C Chromosome 3 70 Hpy188I
2. TGAATGGTTAGATGGGAAT
PERL0612640 1. CTCCTGCAACAGTTCTTGTCC 930 bp 57 °C Chromosome 3 56 AvaII
2. GCCTATTGATACCACAGAATGAGA
Ossowski_664016 1. GGTAATGCTCTTTGTGGCTGA 912 bp 58 °C Chromosome 4 55 NdeI
2. CCCATTCACTCTCTTCGGCT
FCA312 1. ATCTCAAACCATCATTATCCAG 1117bp 52 °C Chromosome 4 67 EcoRI
2. TCAAGAAAGACAATTCAGCTAC
PERL0671404 1. ATTGGATGATACGGTGAAAC 1072 bp 56 °C Chromosome 4 65 DraI
2. AGCGAGAGGGCACTGTGATA
Ossowski_800075 1. TCACAGTCACCAGCCAGAAG 861 bp 56 °C Chromosome 4 52 EcoRV
2. AGTCCCGAGGAGGATGCT
PERL0895287 1. TTCGATTTGCAGTGGTTGTG 934bp 52 °C Chromosome 5 56 HincII
2. TTGAGGAGGAAATGGAAACG
KLPNHC 1. CGTTGCTCGTGGATTTTGTAA 910bp 54 °C Chromosome 5 55 EcoRI
2. CTTGTATAAGTTCTTGCCTGTGA
Ossowski_877533 1. GTCCATATTATCGCATCAAAG 1091 bp 54 °C Chromosome 5 66 DraI
2. CTGGGAGTGGGAACTACAA
Ossowski_1057035 1. ATAATCTCTCTCCCGCCTCA 918 bp 57 °C Chromosome 5 55 HpaII
2. CGTATGACCAGATTCAAAGCA
38
2.2.13. Agarose gel electrophoresis
Agarose gels were made by dissolving electrophoresis grade agarose (from either
Invitrogen or Fisher, UK) in 1x TAE buffer (40 mM Tris, 1 mM EDTA, glacial acetic acid
(1.14%), pH 7.6), and adding ethidium bromide to a final concentration of 0.2 µg/ml
before setting. Gels were left to set for 30-60 min, and then submerged in 1x TAE buffer
containing ethedium bromide in gel Sub-Cell tank (Bio-Rad). Prior to loading of samples,
an appropriate volume of 6x loading dye was added to each. Either a 1 kb or 100bp DNA
ladder (New England BioLabs) was loaded on each gel as a molecular weight marker.
Electrophoresis was normally carried out using a Powerpac 300 power supply (Bio-Rad) at
~ 100 V. The DNA bands were visualised on a UV transilluminator (UVP, USA).
2.2.14. Construction of a genetic linkage map
Construction of linkage map requires:
a) Development of appropriate mapping population and deciding the sample size.
b) Selection of suitable markers for genotyping the mapping population.
c) Screening parents for marker polymorphisms and then genotype the mapping population
(parents and the progenies).
d) Linkage analysis (Calculate the recombination frequencies between markers, establish
linkage groups, estimate a map distances, and determine a map order) using specific
statistical programmes.
2.2.15. Mapping population
The mapping population was developed to study the killing effect caused by Col-0
ecotype. A cross was made between Tsu-1 (maternal modifier parent) and Col-0 A.
thaliana ecotypes. The F1 was left to self fertilise to produce F2 population, both
populations were screened for plump and shrivelled seeds by crossing them with Col 4x
pollen parent. The F2 plants were backcrossed (BC) to the recurrent parent Tsu-1 for the
highly submissive, and to Col-0 for the highly resistant plants. The new generated BC1F1
plants were categorised to either resistant or submissive by pollination with Col 4x. The
highly resistant and submissive BC1F1 plants were then harvested individually and left to

39
self fertilise to produce BC1F2. These plants were crossed with Col 4x (pollen parent) to
select both highly resistant and highly submissive plants. BC1F2 highly resistant and
highly submissive plants were again backcrossed to both Col-0 and Tsu-1 as described
before to generate BC2F2 plants. The process of backcrossing, self fertilisation, Col 4x
pollination, and selecting both highly resistant and highly submissive plants was used to
produce BC3F3 progenies which were then used for genetic characterisation, see more
details in chapter 5 (Figure 5.9).
40
Chapter 3
3. The genetics and characterisation of A. thaliana MOA
gene
3.1. Introduction
3.1.1. Cell cycle control
The cell reproduces and duplicates itself through a series of events called the cell
cycle. It is the basis of reproduction and sustained growth of all living organisms. The cell
cycle requires two major events, S-phase and mitosis, both of them ensure that the newly
formed cells receive a full complement of chromosomes. Defects in these events result in
the formation of daughter cells that will not receive the full set of genes required for all
cellular activities. These cells either die or sustain genetic damage and so can no longer
function correctly (Nurse, 1990).
3.1.2. Mitosis and its role in cell division
Mitosis has been studied since the early 1880s. It is a fundamental process for life
in which all the cell contents, including its chromosomes, duplicates and splits to form two
identical daughter cells. The transmission of the genetic material from the mother cell to
daughter cells must be executed in a coordinated and precise manner.
Mitosis is a complex process consisting of numerous inter-related steps, including
chromosome condensation, spindle formation, centromere attachment to the spindle, and
separation of sister chromatides and chromosome movement toward the poles, followed by
elongation of the spindle and decondensation of the chromosome (Samejima et al., 1993).
Mitosis is controlled by a number of genes, however, the most common genes controlling
mitotic division are cyclin-dependent kinase (CDK) complexes and their regulatory
subunits (cyclins) (Jacobs, 1995; Dewitte and Murray, 2003). Errors in regulating mitosis
lead to a disorganised mitosis with a change in the genetic information in the daughter
cells. Compton (2005) stated that accurate chromosome segregation is important for the
mitotic phase of the cell cycle and failure in this process leads to aneuploidy, which results
in the initiation and progression of cancer.
41
The mitosis mechanism is universally conserved in eukaryotes, but specific
solutions to achieve this process have been adapted by different organisms during
evolution (Criqui and Genschik, 2002). Although cytological studies of plant cells have
contributed to our understanding of mitotic chromatin dynamics, many of the molecular
mechanisms that control mitosis have been identified in animal and yeast cells (Criqui and
Genschik, 2002). Many researchers such as Nurse (1990) and Yanagida (1989) isolated a
number of mitotic mutants of the fission yeast Schizosaccharomyces pombe which are
useful in understanding the control of mitosis. In fission yeast the regulation of the mitotic
onset involves at least four gene functions acting in a network together (Nurse, 1990).
Cyclin-dependent kinases (CDKs) that are activated by mitotic cyclins are the key
players in mitotic division (Pines, 1999). Nevertheless, several regulatory kinases and
phosphatases, as well as other regulatory proteins and structural components, are involved
in the regulation of mitosis (Pines, 1999). Genes that are involved in the control of cell
division and growth are variable. Spellman et al., (1998) found that ~800 genes are cell
cycle regulated, which constitutes more than 10% of all protein coding genes in the
genome.
3.1.3. Aneuploidy
Aneuploidy is the condition of having less than or more than the normal diploid
number of chromosomes, and is the most frequently observed type of cytogenetic
abnormality. Aneuploidy has played a central role in plant genetics. It is a very specialized
subject of both theoretical and practical importance. It has been found that doubling of the
entire chromosome complement of a plant usually has little effect on fertility, while
addition of a single chromosome may result in very drastic changes to the phenotype and
could lead to sterility (Henry et al., 2005). Furthermore, plants are the best organisms for
studying the effects of aneuploidy on gene stability and expression (Khush, 1973; Papp et
al., 1996) because many species tolerate the presence of extra chromosomes especially
polyploidy.
42
3.1.3.1. Aneuploidy theory
Aneuploidy is any deviation from euploidy in which the cell may have more than or
less than the normal diploid number of chromosomes during the fusion of gametes in the
meiotic division. It is the most frequently observed type of cytogenetic abnormality. The
two most commonly observed forms of aneuploidy are monosomy (2n-1) which is the lack
of one of a pair of chromosomes and trisomy (2n+1) that refers to an individual having
additional chromosome to the normal diploid number (Hartwell et al. , 2004). Lutz (1909)
was the first to report aneuploid chromosomes in the hybrid between Oenothera lata and
Oenothera gigas.
Tackholm (1922) was the first to introduce the term aneuploidy following her
research on Rosa genus (Koul and Dhar, 1998). Aneuploids have played a major role in
plant genetics since it was reported a considerable time ago in Avena (Khush, 1973),
Oenothera (Lutz, 1909) and Datura (Blakeslee, 1921) species. Aneuploidy also received
attention after the classic studies of Datura trisomics by Blakeslee and co-workers
(Blakeslee, 1921; Blakeslee et al., 1920). Trisomics are useful for assigning genes to
specific chromosomes and for studying the effects of extra chromosome on the characters
of phenotype (Khush, 1973; Papp et al., 1996).
Khush (1973) also found that addition of a single chromosome can result in very
drastic changes to the phenotype that results in sterility. In human genetics, chromosome
abnormality (Hassold et al., 1993) and solid tumor cells (Nowell, 1976) are most
commonly aneuploids. The deleterious nature of chromosomal imbalance is also
highlighted by the fact that cancerous cells are aneuploidy and that aneuploidy may be a
cause of cancer (Matzke at al., 2003; Pihan and Doxsey, 2003). Furthermore, the structure
and number of each chromosome in many cancer cells can be highly variable (aneuploid),
(Storchova and Pellman, 2004). Henry et al., (2007) stated that most aneuploids in humans
are embryo-lethal, and several developmental effects are associated with the few viable
ones. Henry et al., (2006) showed that aneuploidy is deleterious and introduces gene
dosage imbalance on a chromosomal scale that is proposed to cause change to phenotypes.
In addition, dosage imbalance caused by aneuploidy is generally less sensitive in plants
than animals (Henry et al., 2007).
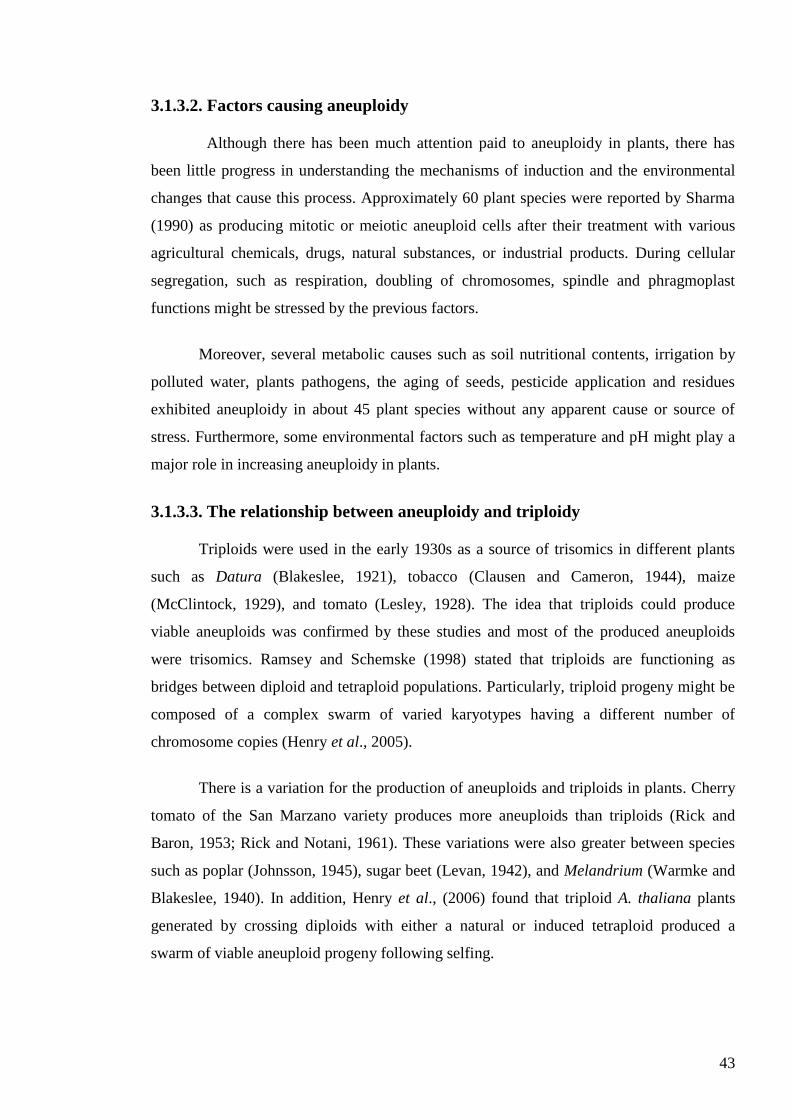
43
3.1.3.2. Factors causing aneuploidy
Although there has been much attention paid to aneuploidy in plants, there has
been little progress in understanding the mechanisms of induction and the environmental
changes that cause this process. Approximately 60 plant species were reported by Sharma
(1990) as producing mitotic or meiotic aneuploid cells after their treatment with various
agricultural chemicals, drugs, natural substances, or industrial products. During cellular
segregation, such as respiration, doubling of chromosomes, spindle and phragmoplast
functions might be stressed by the previous factors.
Moreover, several metabolic causes such as soil nutritional contents, irrigation by
polluted water, plants pathogens, the aging of seeds, pesticide application and residues
exhibited aneuploidy in about 45 plant species without any apparent cause or source of
stress. Furthermore, some environmental factors such as temperature and pH might play a
major role in increasing aneuploidy in plants.
3.1.3.3. The relationship between aneuploidy and triploidy
Triploids were used in the early 1930s as a source of trisomics in different plants
such as Datura (Blakeslee, 1921), tobacco (Clausen and Cameron, 1944), maize
(McClintock, 1929), and tomato (Lesley, 1928). The idea that triploids could produce
viable aneuploids was confirmed by these studies and most of the produced aneuploids
were trisomics. Ramsey and Schemske (1998) stated that triploids are functioning as
bridges between diploid and tetraploid populations. Particularly, triploid progeny might be
composed of a complex swarm of varied karyotypes having a different number of
chromosome copies (Henry et al., 2005).
There is a variation for the production of aneuploids and triploids in plants. Cherry
tomato of the San Marzano variety produces more aneuploids than triploids (Rick and
Baron, 1953; Rick and Notani, 1961). These variations were also greater between species
such as poplar (Johnsson, 1945), sugar beet (Levan, 1942), and Melandrium (Warmke and
Blakeslee, 1940). In addition, Henry et al., (2006) found that triploid A. thaliana plants
generated by crossing diploids with either a natural or induced tetraploid produced a
swarm of viable aneuploid progeny following selfing.
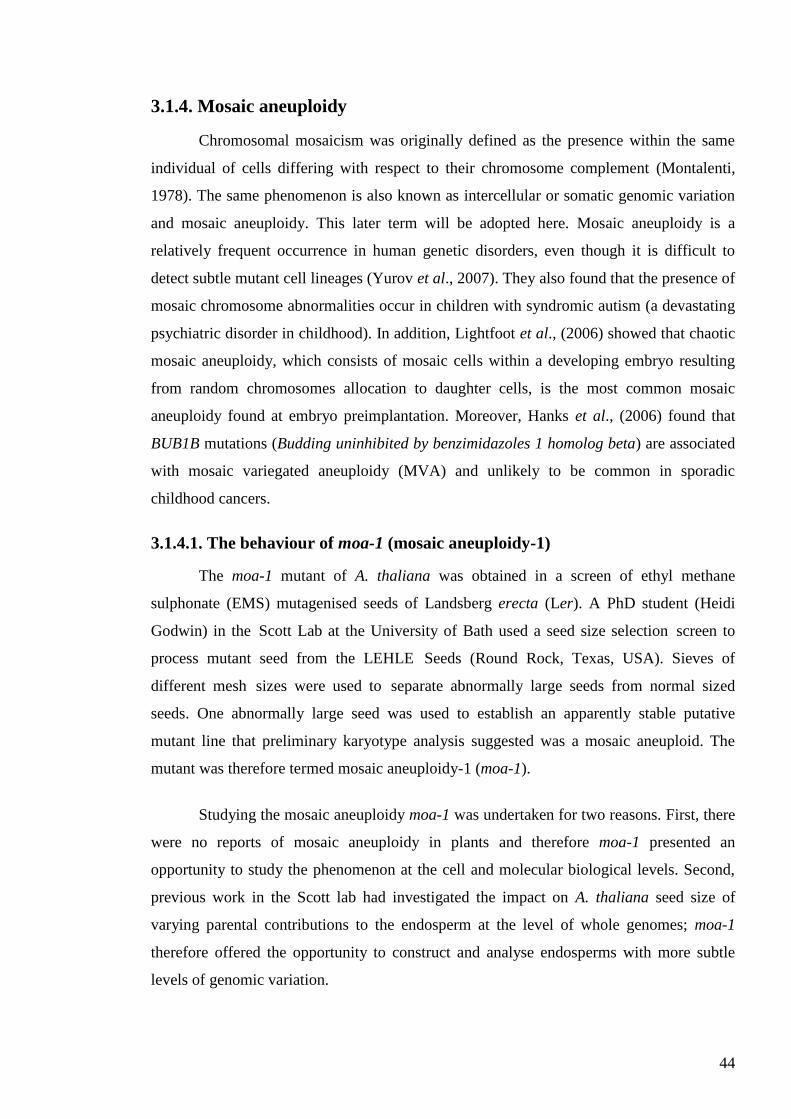
44
3.1.4. Mosaic aneuploidy
Chromosomal mosaicism was originally defined as the presence within the same
individual of cells differing with respect to their chromosome complement (Montalenti,
1978). The same phenomenon is also known as intercellular or somatic genomic variation
and mosaic aneuploidy. This later term will be adopted here. Mosaic aneuploidy is a
relatively frequent occurrence in human genetic disorders, even though it is difficult to
detect subtle mutant cell lineages (Yurov et al., 2007). They also found that the presence of
mosaic chromosome abnormalities occur in children with syndromic autism (a devastating
psychiatric disorder in childhood). In addition, Lightfoot et al., (2006) showed that chaotic
mosaic aneuploidy, which consists of mosaic cells within a developing embryo resulting
from random chromosomes allocation to daughter cells, is the most common mosaic
aneuploidy found at embryo preimplantation. Moreover, Hanks et al., (2006) found that
BUB1B mutations (Budding uninhibited by benzimidazoles 1 homolog beta) are associated
with mosaic variegated aneuploidy (MVA) and unlikely to be common in sporadic
childhood cancers.
3.1.4.1. The behaviour of moa-1 (mosaic aneuploidy-1)
The moa-1 mutant of A. thaliana was obtained in a screen of ethyl methane
sulphonate (EMS) mutagenised seeds of Landsberg erecta (Ler). A PhD student (Heidi
Godwin) in the Scott Lab at the University of Bath used a seed size selection screen to
process mutant seed from the LEHLE Seeds (Round Rock, Texas, USA). Sieves of
different mesh sizes were used to separate abnormally large seeds from normal sized
seeds. One abnormally large seed was used to establish an apparently stable putative
mutant line that preliminary karyotype analysis suggested was a mosaic aneuploid. The
mutant was therefore termed mosaic aneuploidy-1 (moa-1).
Studying the mosaic aneuploidy moa-1 was undertaken for two reasons. First, there
were no reports of mosaic aneuploidy in plants and therefore moa-1 presented an
opportunity to study the phenomenon at the cell and molecular biological levels. Second,
previous work in the Scott lab had investigated the impact on A. thaliana seed size of
varying parental contributions to the endosperm at the level of whole genomes; moa-1
therefore offered the opportunity to construct and analyse endosperms with more subtle
levels of genomic variation.
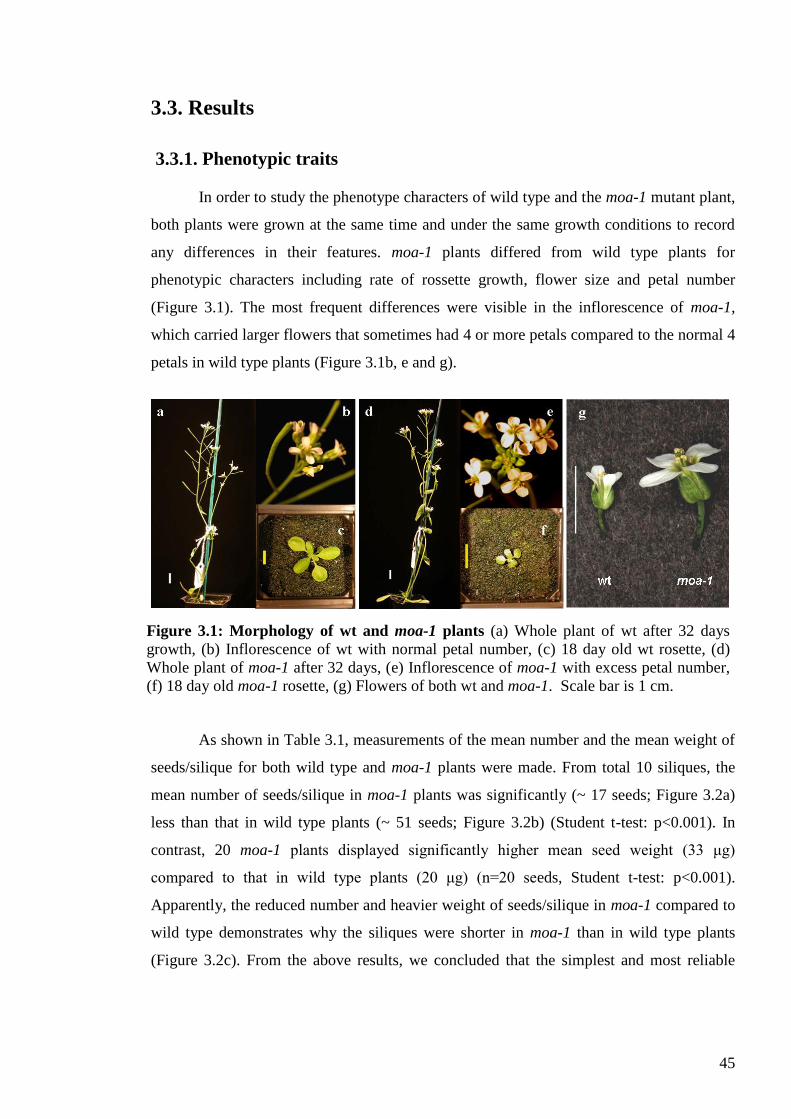
45
3.3. Results
3.3.1. Phenotypic traits
In order to study the phenotype characters of wild type and the moa-1 mutant plant,
both plants were grown at the same time and under the same growth conditions to record
any differences in their features. moa-1 plants differed from wild type plants for
phenotypic characters including rate of rossette growth, flower size and petal number
(Figure 3.1). The most frequent differences were visible in the inflorescence of moa-1,
which carried larger flowers that sometimes had 4 or more petals compared to the normal 4
petals in wild type plants (Figure 3.1b, e and g).
As shown in Table 3.1, measurements of the mean number and the mean weight of
seeds/silique for both wild type and moa-1 plants were made. From total 10 siliques, the
mean number of seeds/silique in moa-1 plants was significantly (~ 17 seeds; Figure 3.2a)
less than that in wild type plants (~ 51 seeds; Figure 3.2b) (Student t-test: p<0.001). In
contrast, 20 moa-1 plants displayed significantly higher mean seed weight (33 μg)
compared to that in wild type plants (20 μg) (n=20 seeds, Student t-test: p<0.001).
Apparently, the reduced number and heavier weight of seeds/silique in moa-1 compared to
wild type demonstrates why the siliques were shorter in moa-1 than in wild type plants
(Figure 3.2c). From the above results, we concluded that the simplest and most reliable
Figure 3.1: Morphology of wt and moa-1 plants (a) Whole plant of wt after 32 days
growth, (b) Inflorescence of wt with normal petal number, (c) 18 day old wt rosette, (d)
Whole plant of moa-1 after 32 days, (e) Inflorescence of moa-1 with excess petal number,
(f) 18 day old moa-1 rosette, (g) Flowers of both wt and moa-1. Scale bar is 1 cm.
46
phenotypic differences between moa-1 and wild type plants were the size of both the
flowers and the seed.
Table 3.1: The mean number of seeds and weight/silique in both wild type and moa-1
plants.
33.3 ± 1.0
(n=20)
16.8 ± 1.6
(n=10)moa-1
20.1 ± 0.5
(n=20)
51.3 ± 0.8
(n=10)wt
Mean weight of seeds /
silique (μg) ± se
(n=seed number)
Mean no. of seeds /
silique± se
(n=silique number)
Type
33.3 ± 1.0
(n=20)
16.8 ± 1.6
(n=10)moa-1
20.1 ± 0.5
(n=20)
51.3 ± 0.8
(n=10)wt
Mean weight of seeds /
silique (μg) ± se
(n=seed number)
Mean no. of seeds /
silique± se
(n=silique number)
Type
Figure 3.2: Phenotypic traits of wild type and moa-1. (a) Mature seed of moa-
1, (b) Mature seed of wild type, (c) Siliques of both wild type and moa-1. Scale
bar for a, b is 1mm and 1cm for c.
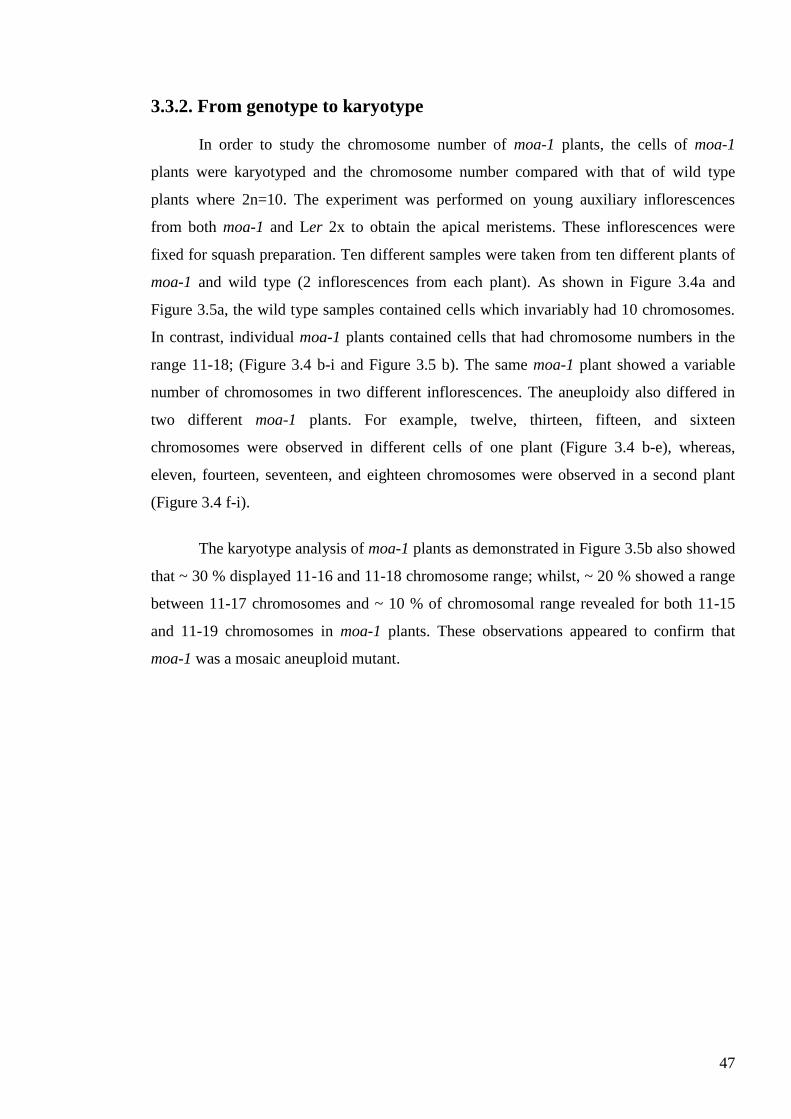
47
3.3.2. From genotype to karyotype
In order to study the chromosome number of moa-1 plants, the cells of moa-1
plants were karyotyped and the chromosome number compared with that of wild type
plants where 2n=10. The experiment was performed on young auxiliary inflorescences
from both moa-1 and Ler 2x to obtain the apical meristems. These inflorescences were
fixed for squash preparation. Ten different samples were taken from ten different plants of
moa-1 and wild type (2 inflorescences from each plant). As shown in Figure 3.4a and
Figure 3.5a, the wild type samples contained cells which invariably had 10 chromosomes.
In contrast, individual moa-1 plants contained cells that had chromosome numbers in the
range 11-18; (Figure 3.4 b-i and Figure 3.5 b). The same moa-1 plant showed a variable
number of chromosomes in two different inflorescences. The aneuploidy also differed in
two different moa-1 plants. For example, twelve, thirteen, fifteen, and sixteen
chromosomes were observed in different cells of one plant (Figure 3.4 b-e), whereas,
eleven, fourteen, seventeen, and eighteen chromosomes were observed in a second plant
(Figure 3.4 f-i).
The karyotype analysis of moa-1 plants as demonstrated in Figure 3.5b also showed
that ~ 30 % displayed 11-16 and 11-18 chromosome range; whilst, ~ 20 % showed a range
between 11-17 chromosomes and ~ 10 % of chromosomal range revealed for both 11-15
and 11-19 chromosomes in moa-1 plants. These observations appeared to confirm that
moa-1 was a mosaic aneuploid mutant.
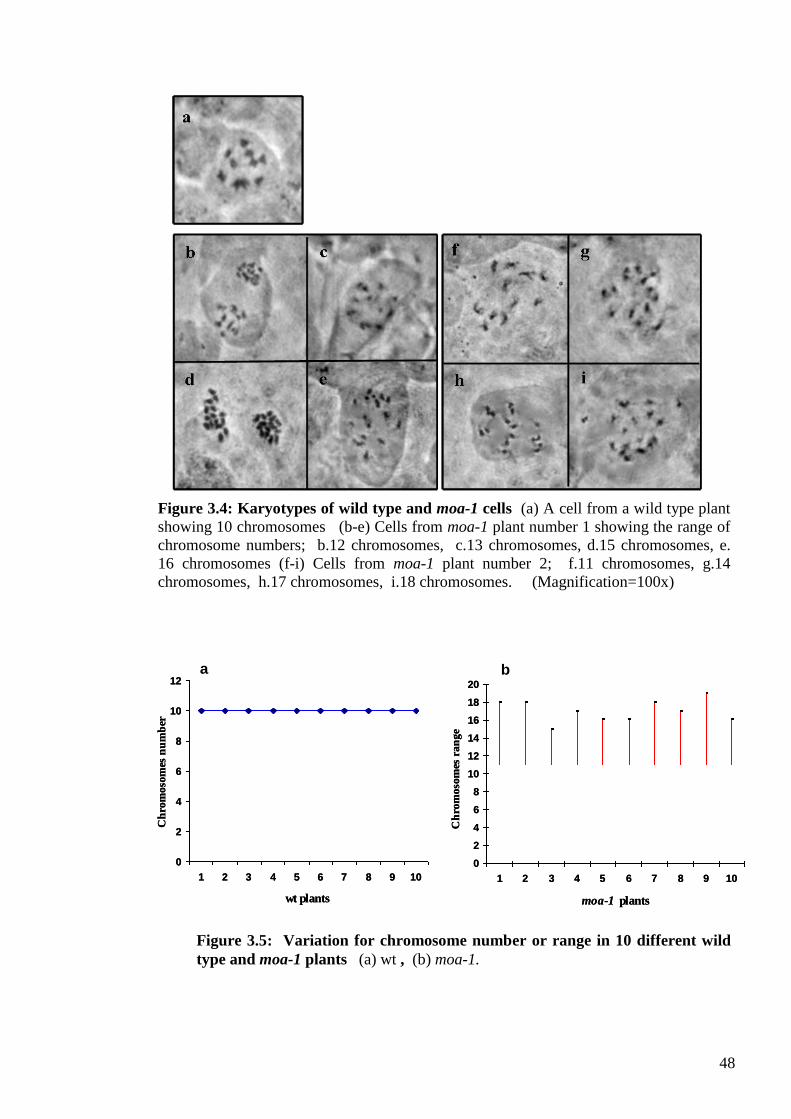
48
0
2
4
6
8
10
12
14
16
18
20
1 2 3 4 5 6 7 8 9 10
moa-1 plants
Ch
rom
oso
mes
ran
ge
0
2
4
6
8
10
12
1 2 3 4 5 6 7 8 9 10
wt plants
Ch
rom
oso
mes
nu
mb
er
a b
0
2
4
6
8
10
12
14
16
18
20
1 2 3 4 5 6 7 8 9 10
moa-1 plants
Ch
rom
oso
mes
ran
ge
0
2
4
6
8
10
12
1 2 3 4 5 6 7 8 9 10
wt plants
Ch
rom
oso
mes
nu
mb
er
a b
Figure 3.4: Karyotypes of wild type and moa-1 cells (a) A cell from a wild type plant
showing 10 chromosomes (b-e) Cells from moa-1 plant number 1 showing the range of
chromosome numbers; b.12 chromosomes, c.13 chromosomes, d.15 chromosomes, e.
16 chromosomes (f-i) Cells from moa-1 plant number 2; f.11 chromosomes, g.14
chromosomes, h.17 chromosomes, i.18 chromosomes. (Magnification=100x)
(H) 17 chromosomes (I) 18 chromosomes (X100). (A= wt , B-I = moa-1)
(A= wt , B-I = moa-1)
Figure 3.5: Variation for chromosome number or range in 10 different wild
type and moa-1 plants (a) wt , (b) moa-1.
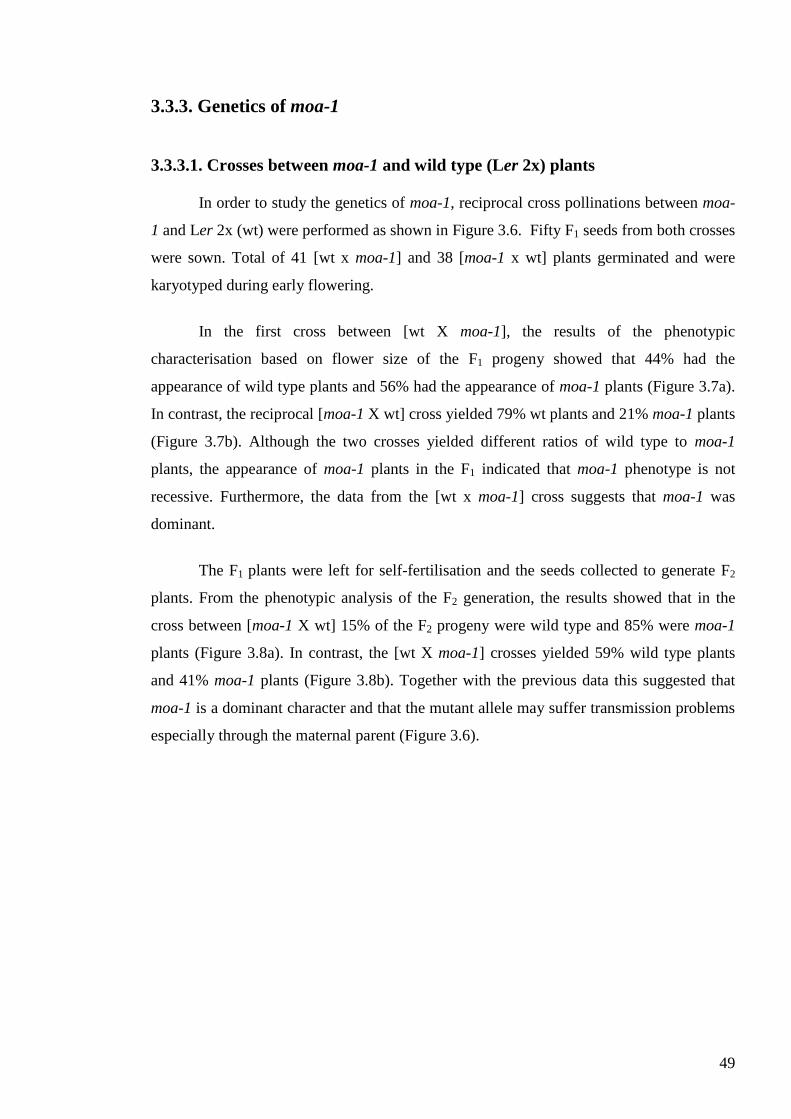
49
3.3.3. Genetics of moa-1
3.3.3.1. Crosses between moa-1 and wild type (Ler 2x) plants
In order to study the genetics of moa-1, reciprocal cross pollinations between moa-
1 and Ler 2x (wt) were performed as shown in Figure 3.6. Fifty F1 seeds from both crosses
were sown. Total of 41 [wt x moa-1] and 38 [moa-1 x wt] plants germinated and were
karyotyped during early flowering.
In the first cross between [wt X moa-1], the results of the phenotypic
characterisation based on flower size of the F1 progeny showed that 44% had the
appearance of wild type plants and 56% had the appearance of moa-1 plants (Figure 3.7a).
In contrast, the reciprocal [moa-1 X wt] cross yielded 79% wt plants and 21% moa-1 plants
(Figure 3.7b). Although the two crosses yielded different ratios of wild type to moa-1
plants, the appearance of moa-1 plants in the F1 indicated that moa-1 phenotype is not
recessive. Furthermore, the data from the [wt x moa-1] cross suggests that moa-1 was
dominant.
The F1 plants were left for self-fertilisation and the seeds collected to generate F2
plants. From the phenotypic analysis of the F2 generation, the results showed that in the
cross between [moa-1 X wt] 15% of the F2 progeny were wild type and 85% were moa-1
plants (Figure 3.8a). In contrast, the [wt X moa-1] crosses yielded 59% wild type plants
and 41% moa-1 plants (Figure 3.8b). Together with the previous data this suggested that
moa-1 is a dominant character and that the mutant allele may suffer transmission problems
especially through the maternal parent (Figure 3.6).
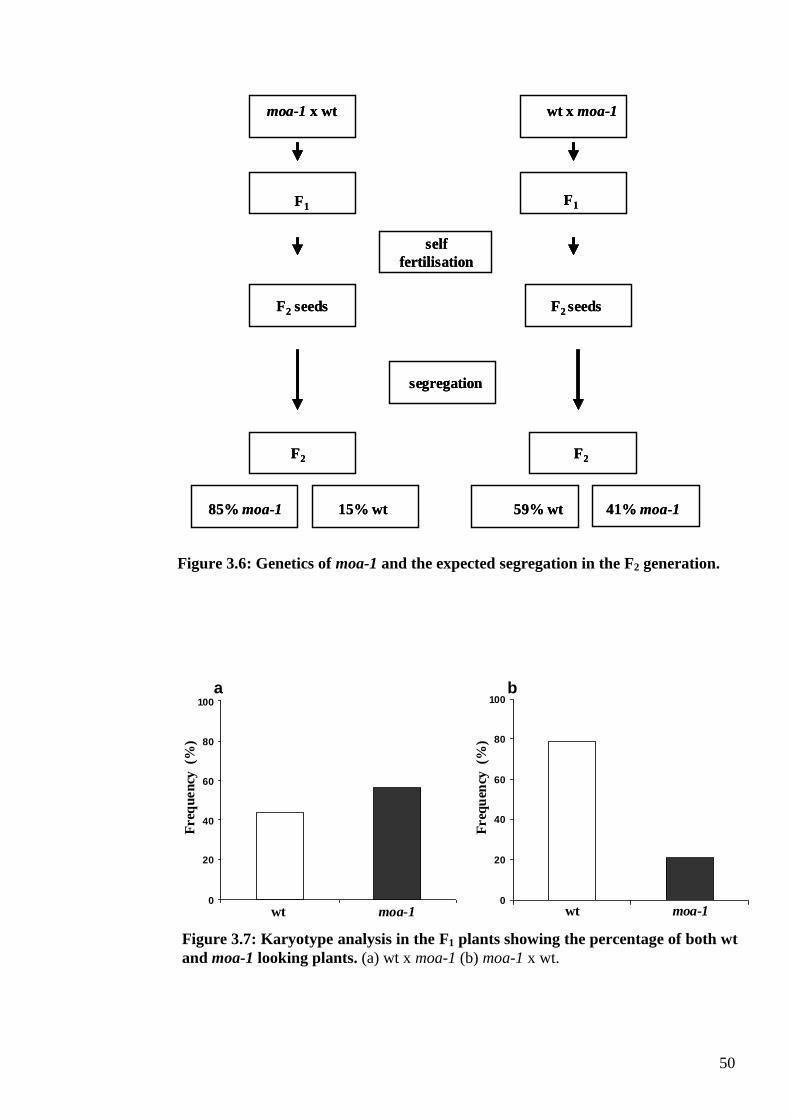
50
wt x moa-1
F1F1
self
fertilisation
F2 seeds F2 seeds
segregation
F2 F2
85% moa-1 15% wt 59% wt 41% moa-1
moa-1 x wt wt x moa-1
F1F1
self
fertilisation
F2 seeds F2 seeds
segregation
F2 F2
85% moa-1 15% wt 59% wt 41% moa-1
moa-1 x wt
0
20
40
60
80
100
0
20
40
60
80
100
Freq
uen
cy (%
)
A B
Freq
uen
cy (%
)
wt moa-1 wt moa-1
wt moa-1
a b
Figure 3.6: Genetics of moa-1 and the expected segregation in the F2 generation.
Figure 3.7: Karyotype analysis in the F1 plants showing the percentage of both wt
and moa-1 looking plants. (a) wt x moa-1 (b) moa-1 x wt.
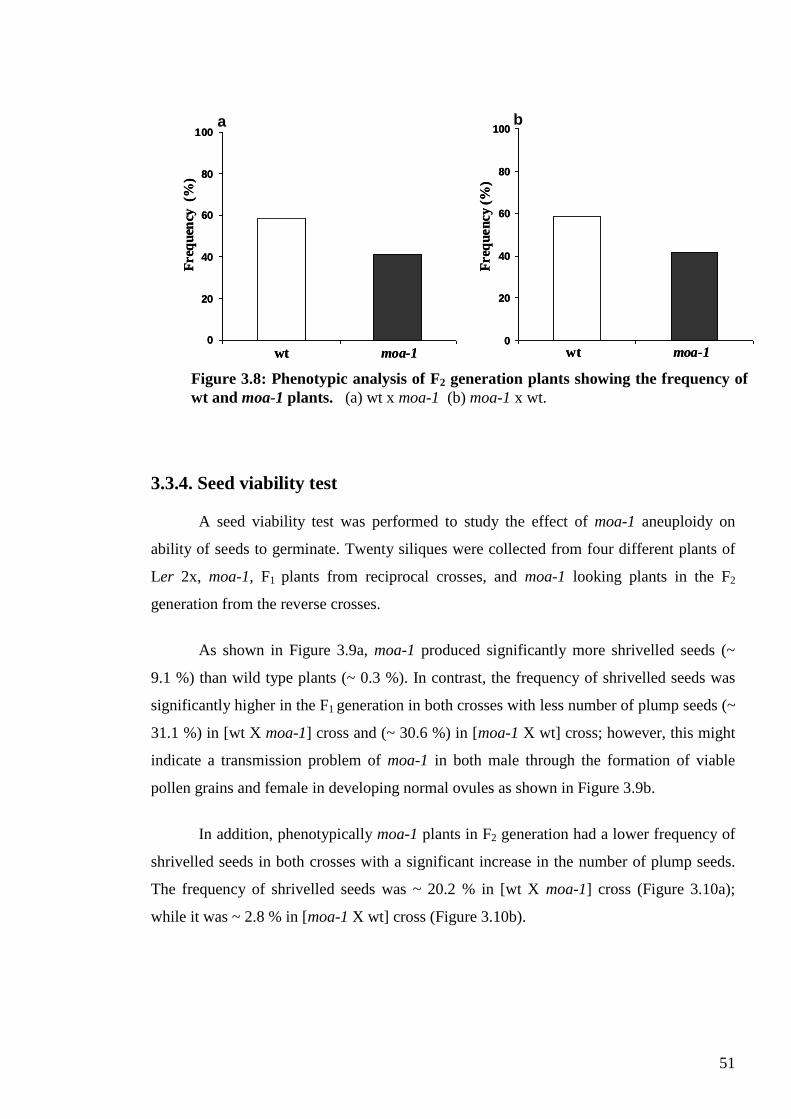
51
3.3.4. Seed viability test
A seed viability test was performed to study the effect of moa-1 aneuploidy on
ability of seeds to germinate. Twenty siliques were collected from four different plants of
Ler 2x, moa-1, F1 plants from reciprocal crosses, and moa-1 looking plants in the F2
generation from the reverse crosses.
As shown in Figure 3.9a, moa-1 produced significantly more shrivelled seeds (~
9.1 %) than wild type plants (~ 0.3 %). In contrast, the frequency of shrivelled seeds was
significantly higher in the F1 generation in both crosses with less number of plump seeds (~
31.1 %) in [wt X moa-1] cross and (~ 30.6 %) in [moa-1 X wt] cross; however, this might
indicate a transmission problem of moa-1 in both male through the formation of viable
pollen grains and female in developing normal ovules as shown in Figure 3.9b.
In addition, phenotypically moa-1 plants in F2 generation had a lower frequency of
shrivelled seeds in both crosses with a significant increase in the number of plump seeds.
The frequency of shrivelled seeds was ~ 20.2 % in [wt X moa-1] cross (Figure 3.10a);
while it was ~ 2.8 % in [moa-1 X wt] cross (Figure 3.10b).
a b
0
20
40
60
80
100
0
20
40
60
80
100
Freq
uen
cy (%
)
Freq
uen
cy (
%)
A B
wt moa-1
wt moa-1 wt moa-10
20
40
60
80
100
0
20
40
60
80
100
Freq
uen
cy (%
)
Freq
uen
cy (
%)
A B
wt moa-1
wt moa-1 wt moa-1
Figure 3.8: Phenotypic analysis of F2 generation plants showing the frequency of
wt and moa-1 plants. (a) wt x moa-1 (b) moa-1 x wt.
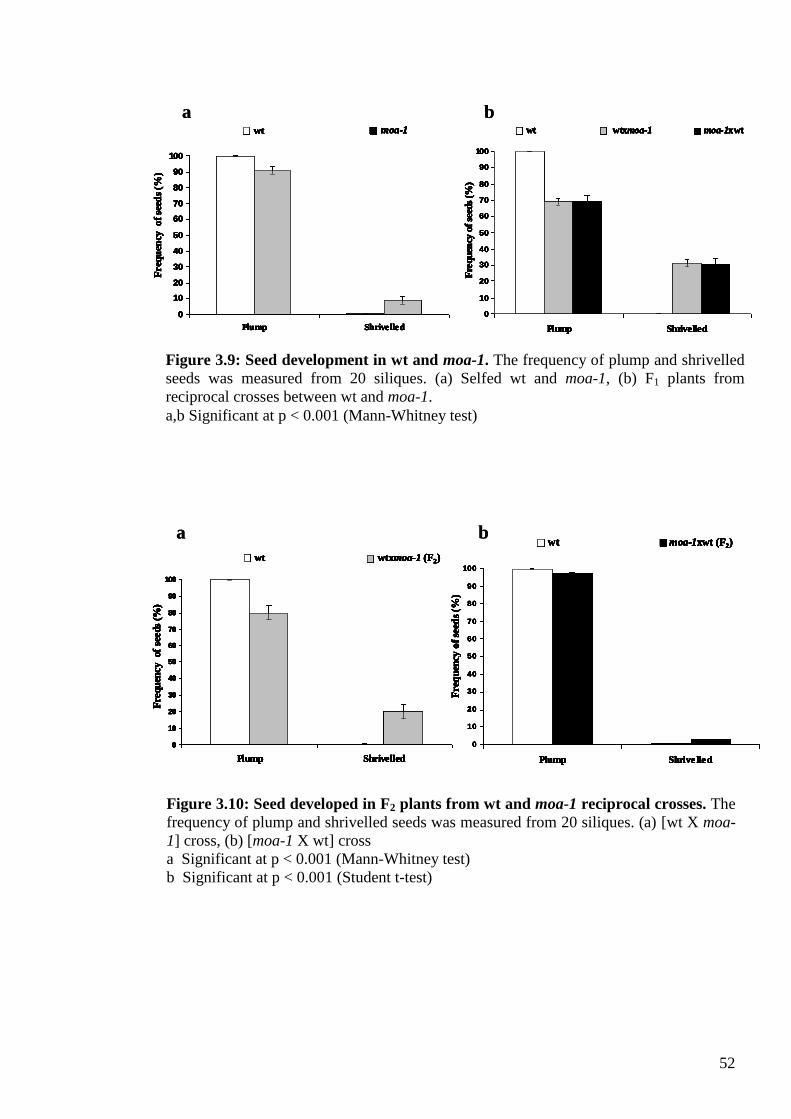
52
a b
0
10
20
30
40
50
60
70
80
90
100
Plump Shrivelled
Fre
qu
ency
of
seeds
(%)
wt wtxmoa-1 (F2)
0
10
20
30
40
50
60
70
80
90
100
Plump Shrivelled
Fre
qu
ency
of
seeds
(%)
wt wtxmoa-1 (F2)
0
10
20
30
40
50
60
70
80
90
100
Plump Shrive lled
Freq
uen
cy o
f se
eds
(%)
moa-1xwt (F2)wt
0
10
20
30
40
50
60
70
80
90
100
Plump Shrive lled
Freq
uen
cy o
f se
eds
(%)
moa-1xwt (F2)wt
0
10
20
30
40
50
60
70
80
90
100
Plump Shrivelled
Fre
qu
ency
of
seeds
(%)
wt wtxmoa-1 (F2)
0
10
20
30
40
50
60
70
80
90
100
Plump Shrivelled
Fre
qu
ency
of
seeds
(%)
wt wtxmoa-1 (F2)
0
10
20
30
40
50
60
70
80
90
100
Plump Shrive lled
Freq
uen
cy o
f se
eds
(%)
moa-1xwt (F2)wt
0
10
20
30
40
50
60
70
80
90
100
Plump Shrive lled
Freq
uen
cy o
f se
eds
(%)
moa-1xwt (F2)wta b
0
10
20
30
40
50
60
70
80
90
100
Plump Shrivelled
Fre
qu
ency
of
seeds
(%)
wt wtxmoa-1 (F2)
0
10
20
30
40
50
60
70
80
90
100
Plump Shrivelled
Fre
qu
ency
of
seeds
(%)
wt wtxmoa-1 (F2)
0
10
20
30
40
50
60
70
80
90
100
Plump Shrive lled
Freq
uen
cy o
f se
eds
(%)
moa-1xwt (F2)wt
0
10
20
30
40
50
60
70
80
90
100
Plump Shrive lled
Freq
uen
cy o
f se
eds
(%)
moa-1xwt (F2)wt
0
10
20
30
40
50
60
70
80
90
100
Plump Shrivelled
Fre
qu
ency
of
seeds
(%)
wt wtxmoa-1 (F2)
0
10
20
30
40
50
60
70
80
90
100
Plump Shrivelled
Fre
qu
ency
of
seeds
(%)
wt wtxmoa-1 (F2)
0
10
20
30
40
50
60
70
80
90
100
Plump Shrive lled
Freq
uen
cy o
f se
eds
(%)
moa-1xwt (F2)wt
0
10
20
30
40
50
60
70
80
90
100
Plump Shrive lled
Freq
uen
cy o
f se
eds
(%)
moa-1xwt (F2)wt
0
10
20
30
40
50
60
70
80
90
100
Plump Shrivelled
Freq
uen
cy o
f se
eds
(%)
wt moa-1
0
10
20
30
40
50
60
70
80
90
100
Plump Shrivelled
Freq
uen
cy o
f se
eds
(%)
wt moa-1
0
10
20
30
40
50
60
70
80
90
100
Plump Shrivelled
Fre
quen
cy o
f se
eds
(%)
wt wtxmoa-1 moa-1xwt
0
10
20
30
40
50
60
70
80
90
100
Plump Shrivelled
Fre
quen
cy o
f se
eds
(%)
wt wtxmoa-1 moa-1xwt
0
10
20
30
40
50
60
70
80
90
100
Plump Shrivelled
Freq
uen
cy o
f se
eds
(%)
wt moa-1
0
10
20
30
40
50
60
70
80
90
100
Plump Shrivelled
Freq
uen
cy o
f se
eds
(%)
wt moa-1
0
10
20
30
40
50
60
70
80
90
100
Plump Shrivelled
Fre
quen
cy o
f se
eds
(%)
wt wtxmoa-1 moa-1xwt
0
10
20
30
40
50
60
70
80
90
100
Plump Shrivelled
Fre
quen
cy o
f se
eds
(%)
wt wtxmoa-1 moa-1xwt
a b
0
10
20
30
40
50
60
70
80
90
100
Plump Shrivelled
Freq
uen
cy o
f se
eds
(%)
wt moa-1
0
10
20
30
40
50
60
70
80
90
100
Plump Shrivelled
Freq
uen
cy o
f se
eds
(%)
wt moa-1
0
10
20
30
40
50
60
70
80
90
100
Plump Shrivelled
Fre
quen
cy o
f se
eds
(%)
wt wtxmoa-1 moa-1xwt
0
10
20
30
40
50
60
70
80
90
100
Plump Shrivelled
Fre
quen
cy o
f se
eds
(%)
wt wtxmoa-1 moa-1xwt
0
10
20
30
40
50
60
70
80
90
100
Plump Shrivelled
Freq
uen
cy o
f se
eds
(%)
wt moa-1
0
10
20
30
40
50
60
70
80
90
100
Plump Shrivelled
Freq
uen
cy o
f se
eds
(%)
wt moa-1
0
10
20
30
40
50
60
70
80
90
100
Plump Shrivelled
Fre
quen
cy o
f se
eds
(%)
wt wtxmoa-1 moa-1xwt
0
10
20
30
40
50
60
70
80
90
100
Plump Shrivelled
Fre
quen
cy o
f se
eds
(%)
wt wtxmoa-1 moa-1xwt
a b
Figure 3.9: Seed development in wt and moa-1. The frequency of plump and shrivelled
seeds was measured from 20 siliques. (a) Selfed wt and moa-1, (b) F1 plants from
reciprocal crosses between wt and moa-1.
a,b Significant at p < 0.001 (Mann-Whitney test)
Figure 3.10: Seed developed in F2 plants from wt and moa-1 reciprocal crosses. The
frequency of plump and shrivelled seeds was measured from 20 siliques. (a) [wt X moa-
1] cross, (b) [moa-1 X wt] cross
a Significant at p < 0.001 (Mann-Whitney test)
b Significant at p < 0.001 (Student t-test)
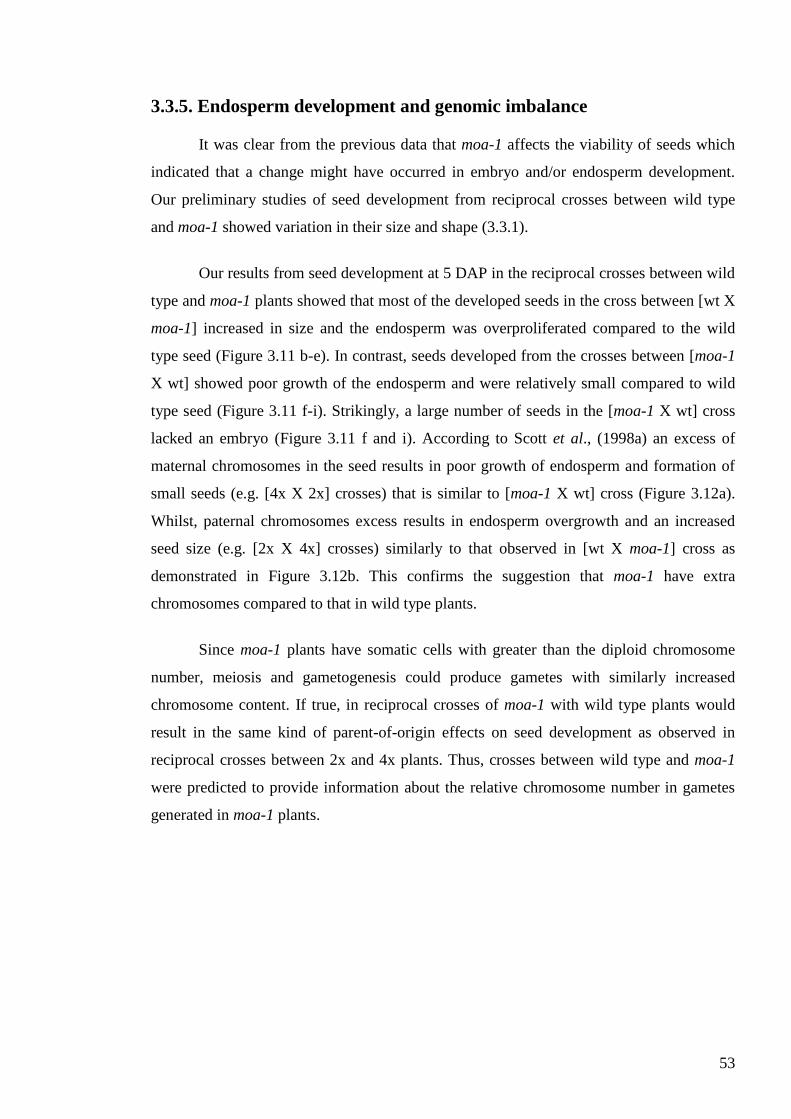
53
3.3.5. Endosperm development and genomic imbalance
It was clear from the previous data that moa-1 affects the viability of seeds which
indicated that a change might have occurred in embryo and/or endosperm development.
Our preliminary studies of seed development from reciprocal crosses between wild type
and moa-1 showed variation in their size and shape (3.3.1).
Our results from seed development at 5 DAP in the reciprocal crosses between wild
type and moa-1 plants showed that most of the developed seeds in the cross between [wt X
moa-1] increased in size and the endosperm was overproliferated compared to the wild
type seed (Figure 3.11 b-e). In contrast, seeds developed from the crosses between [moa-1
X wt] showed poor growth of the endosperm and were relatively small compared to wild
type seed (Figure 3.11 f-i). Strikingly, a large number of seeds in the [moa-1 X wt] cross
lacked an embryo (Figure 3.11 f and i). According to Scott et al., (1998a) an excess of
maternal chromosomes in the seed results in poor growth of endosperm and formation of
small seeds (e.g. [4x X 2x] crosses) that is similar to [moa-1 X wt] cross (Figure 3.12a).
Whilst, paternal chromosomes excess results in endosperm overgrowth and an increased
seed size (e.g. [2x X 4x] crosses) similarly to that observed in [wt X moa-1] cross as
demonstrated in Figure 3.12b. This confirms the suggestion that moa-1 have extra
chromosomes compared to that in wild type plants.
Since moa-1 plants have somatic cells with greater than the diploid chromosome
number, meiosis and gametogenesis could produce gametes with similarly increased
chromosome content. If true, in reciprocal crosses of moa-1 with wild type plants would
result in the same kind of parent-of-origin effects on seed development as observed in
reciprocal crosses between 2x and 4x plants. Thus, crosses between wild type and moa-1
were predicted to provide information about the relative chromosome number in gametes
generated in moa-1 plants.
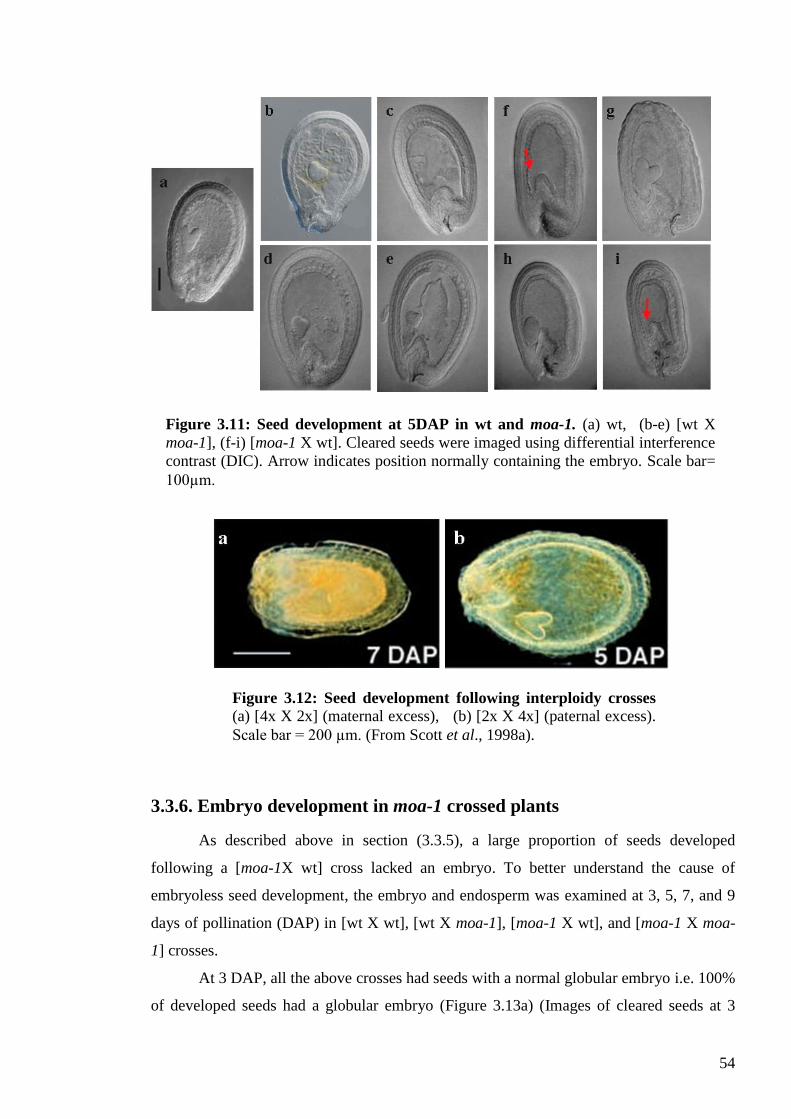
54
3.3.6. Embryo development in moa-1 crossed plants
As described above in section (3.3.5), a large proportion of seeds developed
following a [moa-1X wt] cross lacked an embryo. To better understand the cause of
embryoless seed development, the embryo and endosperm was examined at 3, 5, 7, and 9
days of pollination (DAP) in [wt X wt], [wt X moa-1], [moa-1 X wt], and [moa-1 X moa-
1] crosses.
At 3 DAP, all the above crosses had seeds with a normal globular embryo i.e. 100%
of developed seeds had a globular embryo (Figure 3.13a) (Images of cleared seeds at 3
Figure 3.11: Seed development at 5DAP in wt and moa-1. (a) wt, (b-e) [wt X
moa-1], (f-i) [moa-1 X wt]. Cleared seeds were imaged using differential interference
contrast (DIC). Arrow indicates position normally containing the embryo. Scale bar=
100µm.
Figure 3.12: Seed development following interploidy crosses
(a) [4x X 2x] (maternal excess), (b) [2x X 4x] (paternal excess).
Scale bar = 200 µm. (From Scott et al., 1998a).
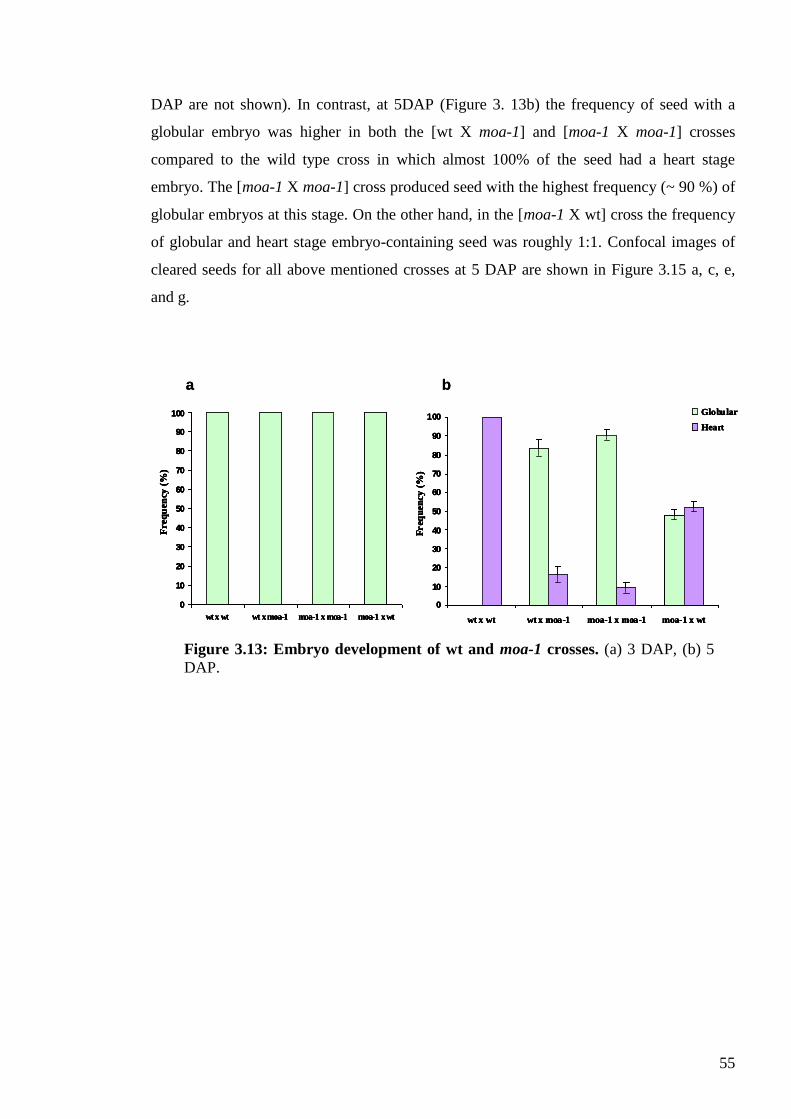
55
DAP are not shown). In contrast, at 5DAP (Figure 3. 13b) the frequency of seed with a
globular embryo was higher in both the [wt X moa-1] and [moa-1 X moa-1] crosses
compared to the wild type cross in which almost 100% of the seed had a heart stage
embryo. The [moa-1 X moa-1] cross produced seed with the highest frequency (~ 90 %) of
globular embryos at this stage. On the other hand, in the [moa-1 X wt] cross the frequency
of globular and heart stage embryo-containing seed was roughly 1:1. Confocal images of
cleared seeds for all above mentioned crosses at 5 DAP are shown in Figure 3.15 a, c, e,
and g.
0
10
20
30
40
50
60
70
80
90
100
wt x wt wt x moa-1 moa-1 x moa-1 moa-1 x wt
Freq
uen
cy (
%)
0
10
20
30
40
50
60
70
80
90
100
wt x wt wt x moa-1 moa-1 x moa-1 moa-1 x wt
Fr
equ
en
cy
(%
)Globular
Heart
0
10
20
30
40
50
60
70
80
90
100
wt x wt wt x moa-1 moa-1 x moa-1 moa-1 x wt
Freq
uen
cy (
%)
0
10
20
30
40
50
60
70
80
90
100
wt x wt wt x moa-1 moa-1 x moa-1 moa-1 x wt
Fr
equ
en
cy
(%
)Globular
Heart
a b
0
10
20
30
40
50
60
70
80
90
100
wt x wt wt x moa-1 moa-1 x moa-1 moa-1 x wt
Freq
uen
cy (
%)
0
10
20
30
40
50
60
70
80
90
100
wt x wt wt x moa-1 moa-1 x moa-1 moa-1 x wt
Fr
equ
en
cy
(%
)Globular
Heart
0
10
20
30
40
50
60
70
80
90
100
wt x wt wt x moa-1 moa-1 x moa-1 moa-1 x wt
Freq
uen
cy (
%)
0
10
20
30
40
50
60
70
80
90
100
wt x wt wt x moa-1 moa-1 x moa-1 moa-1 x wt
Fr
equ
en
cy
(%
)Globular
Heart
a b
Figure 3.13: Embryo development of wt and moa-1 crosses. (a) 3 DAP, (b) 5
DAP.
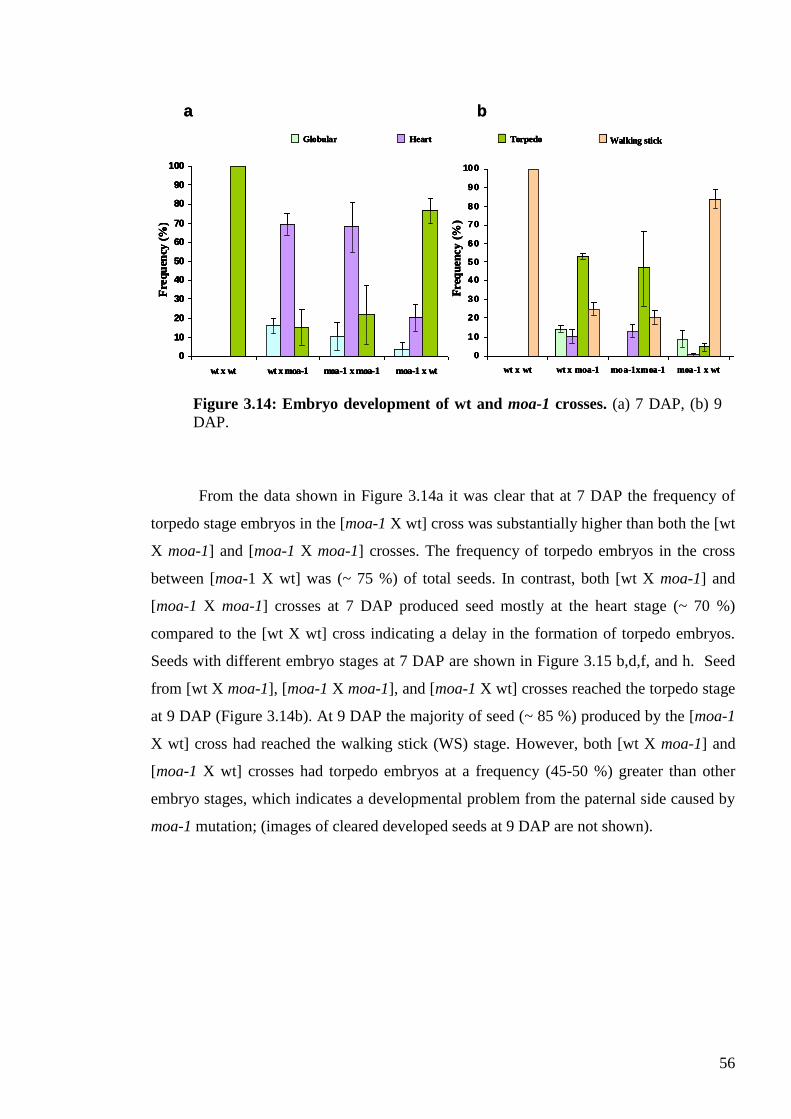
56
From the data shown in Figure 3.14a it was clear that at 7 DAP the frequency of
torpedo stage embryos in the [moa-1 X wt] cross was substantially higher than both the [wt
X moa-1] and [moa-1 X moa-1] crosses. The frequency of torpedo embryos in the cross
between [moa-1 X wt] was (~ 75 %) of total seeds. In contrast, both [wt X moa-1] and
[moa-1 X moa-1] crosses at 7 DAP produced seed mostly at the heart stage (~ 70 %)
compared to the [wt X wt] cross indicating a delay in the formation of torpedo embryos.
Seeds with different embryo stages at 7 DAP are shown in Figure 3.15 b,d,f, and h. Seed
from [wt X moa-1], [moa-1 X moa-1], and [moa-1 X wt] crosses reached the torpedo stage
at 9 DAP (Figure 3.14b). At 9 DAP the majority of seed (~ 85 %) produced by the [moa-1
X wt] cross had reached the walking stick (WS) stage. However, both [wt X moa-1] and
[moa-1 X wt] crosses had torpedo embryos at a frequency (45-50 %) greater than other
embryo stages, which indicates a developmental problem from the paternal side caused by
moa-1 mutation; (images of cleared developed seeds at 9 DAP are not shown).
a b
Globular Heart Torpedo Walking stick
0
10
20
30
40
50
60
70
80
90
100
wt x wt wt x moa-1 moa-1 x moa-1 moa-1 x wt
Fre
qu
ency
(%
)
0
10
20
30
40
50
60
70
80
90
100
wt x wt wt x moa-1 moa-1xmoa-1 moa-1 x wt
Freq
uen
cy
(%
)
Globular Heart Torpedo Walking stick
0
10
20
30
40
50
60
70
80
90
100
wt x wt wt x moa-1 moa-1 x moa-1 moa-1 x wt
Fre
qu
ency
(%
)
0
10
20
30
40
50
60
70
80
90
100
wt x wt wt x moa-1 moa-1xmoa-1 moa-1 x wt
Freq
uen
cy
(%
)
Figure 3.14: Embryo development of wt and moa-1 crosses. (a) 7 DAP, (b) 9
DAP.
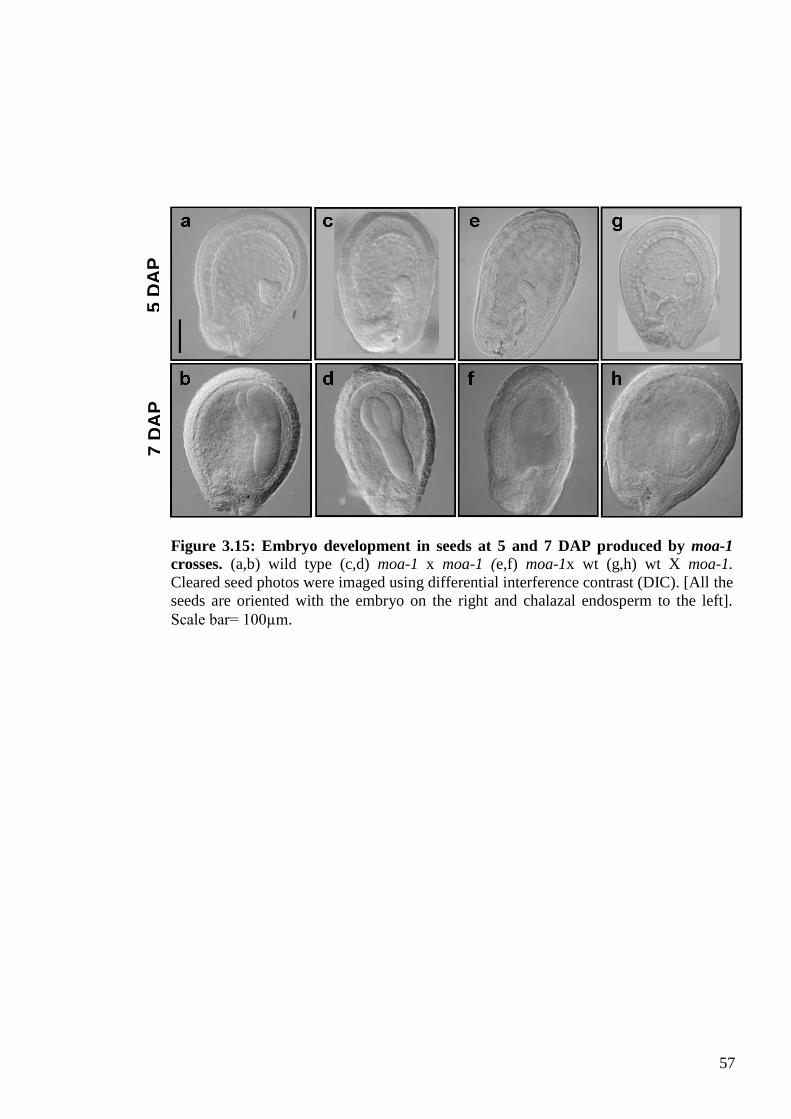
57
5 D
AP
7 D
AP
Figure 3.15: Embryo development in seeds at 5 and 7 DAP produced by moa-1
crosses. (a,b) wild type (c,d) moa-1 x moa-1 (e,f) moa-1x wt (g,h) wt X moa-1.
Cleared seed photos were imaged using differential interference contrast (DIC). [All the
seeds are oriented with the embryo on the right and chalazal endosperm to the left].
Scale bar= 100µm.
58
3.4. Discussion
In the present study a mosaic aneuploidy mutant of the A. thaliana (Landsberg
erecta) was identified from a chemically (EMS) mutagenised seed based on a seed size
selection screen. The moa-1 plants displayed mosaic aneuploidy which is variation in
chromosome number in the cells of the same individual. Numerous studies have been
performed on aneuploidy, but until the present work there were no descriptions of mosaic
aneuploidy in plants.
3.4.1. Characteristics of moa-1 phenotype
The present study of moa-1 phenotypic features revealed several easily
recognisable differences from the wild type phenotype. Although moa-1 plants were easily
distinguished from wild type plants based on their relatively large overall size, the most
reliable phenotypic marker was the large flower size and the extra petals. In addition, the
siliques of moa-1 plants were shorter and contained fewer seeds than those of wild type
plants.
3.4.2. moa-1 is a mosaic aneuploid mutant
To confirm that moa-1 was a mosaic aneuploid mutant, chromosome karyotyping
was the major approach used in this study (3.3.2). As expected, wild type cells of the same
or different individuals always contained 10 chromosomes. In contrast, plants that were
phenotypically moa-1 produced karyotypes ranging from 11 to 18 chromosomes. Thus
some cells in moa-1 plants have a larger number of extra chromosomes than is found in the
cells of triploid plants in A. thaliana. What cannot be determined from the data presented
here is the identity of the extra chromosomes: these may be a random set, or biased toward
one or a few particular chromosomes.
In humans, Griffiths et al., (2000) reported trisomy 16 as the most common
aneuploidy; however, they found that fetuses affected with the full version of this
chromosome abnormality do not survive. On the other hand, individuals having the mosaic
form where trisomy 16 existed in some cells but not all could survive. They concluded that
individuals who are mosaic for a chromosomal aneuploidy tend to have a less severe form
of the syndrome compared to those with full trisomy. They also found that among many
the autosomal trisomies, only mosaic cases can survive.
59
In contrast to A. thaliana, Micale et al., (2007) reporting on mosaic variegated
aneuploidy (MVA) in humans noted multiple trisomies, but rarely monosomies, suggesting
intolerance to large deviations from the diploid complement. Interestingly, MVA caused
by BUBIB mutations, a condition characterised by constitutional aneuploidies and
childhood cancer predisposition, suggest that mosaic aneuploidy can arise due to mitotic
spindle dysfunction (Hanks et al., 2006; Suijkerbuijk et al., 2010).
3.4.3. Allelic dominancy of moa-1
To study the genetics of moa-1 by reciprocal cross pollinations with wild type
plants suggested the mutant was dominant or semi-dominant in character. The data from F2
and F3 generations largely supported this conclusion.
3.5.3. Endosperm behaviour, embryo development and role of imprinting
Interestingly, data from the crosses between the moa-1 mutant and wild type plants
showed that most of the seeds which were developed from the crosses between [wt x moa-
1] exhibited a normal endosperm and viable embryos producing normal seed size. In
contrast, most of the seed developed in the reciprocal [moa-1 x wt] was abnormally small
with reduced endosperm proliferation and either no embryo or an abnormal embryo. The
embryonic autonomy raised a question as to the degree embryo development depends on
endosperm size. Data from this work showed that during early endosperm development (3
DAP) embryo growth was similar for both wild type and moa-1 crosses (Figure 3.14).
However, data for later time points (5, 7, and 9 DAP) indicated that paternal moa-1
delayed the embryo and endosperm growth (Figures 3.15, 3.16, and 3.17).
The viability and final size of seeds in moa-1 and wild type crosses may reflect the
effectiveness of the endosperm in provisioning the embryo during its development. This is
supported by Scott et al., (1998a) who suggested that the growth of endosperm and embryo
are disturbed during interploidy crosses in A. thaliana due to numbers of nuclei, timing of
cellularisation, or development of certain regions of the endosperm. Moreover, the parental
conflict theory predicts that extra doses of paternally expressed loci will result in increased
provisioning of the offspring through the endosperm, and this process appears to fail with
lethal paternal excess.
60
The present work did not help understand why the embryo failed to develop in a
high proportion of seeds in the crosses between [moa-1 x wt]. One possibility is that the
egg in a proportion of moa-1 ovules is either absent or abnormal in some way that
prevented its fertilisation and subsequent development. Whatever the cause, an
autonomous endosperm does successfully develop in embryoless seed. This was most
likely the result of fertilisation of the central cell by moa-1 sperm since autonomous
endosperm development in A. thaliana occurs only in specific mutant backgrounds e.g.
fis1 (mea) (Chaudhury et al., 1997) and fie/met1 (Vinkenoog et al., 2000).
3.5. Conclusion
The current study confirmed that moa-1 plant is a mosaic aneuploid and that the
moa-1 phenotype was most likely a dominant trait. There were significant parent specific
differences the transmission of the moa-1 allele. A paternally transmitted moa-1 allele also
had dramatic effects on seed development, including the production of embryoless seed,
whereas the maternal allele had little impact on seed development.
This work left many unanswered questions including 1) why moa-1 caused
vegetative and floral over-growth phenotypes, 2) why the frequency of allelic transmission
was subject to sex-specific variation, 3) whether the aneuploidy involved specific
chromosomes or was random.
Unfortunately, during the course of this study the transmission of the moa-1
phenotype became highly unpredictable, such that the segregation ratios in potential
mapping crosses did not provide confidence that the moa-1 gene was suitable for map-
based cloning. Consequently, all work on moa-1 was stopped.
61
4. Genetic variation for triploid block in A. thaliana
4.1. Introduction
4.1.1. Triploid block and its discovery
In most flowering plants, the seeds develop abnormally and often abort when
parents with different ploidy numbers are crossed (von Wangenheim and Peterson, 2004).
Where there is a frequent failure of seed set in the crosses between diploid and tetraploid
plants of the same or related species this process is known as the ‗triploid block‘. Triploid
block can result in a high degree of immediate postzygotic reproductive isolation between
tetraploids and from their diploid progenitors, since backcrossing to either parent will
produce mainly nonviable progeny. This reproductive barrier is caused by malfunction of
the endosperm (Köhler et al., 2010).
Henry et al., (2005) stated that plants can be classified into two categories
according to their response to triploidy: in some species, most triploid embryos die because
of abnormal endosperm development and the few individuals that develop exhibit highly
reduced fertility. Triploid block was first discovered when studying intra-specific diploid
and autotetraploid crosses [2x X 4x and 4x X 2x] in different plant species such as maize
(Cooper, 1951), brassica (Howard, 1939 and Hakansson, 1956), Lycopersicon (Cooper and
Brink, 1945), barley (Hakansson, 1953), rye (Hakansson and Ellerstrom, 1950), Primula
(Woodell and Valentine, 1961), Galeopsis pubscens (Hakansson, 1952) and Poinsettia
(Milbocke and Sink, 1969).
4.1.2. Triploid block and its lethal association in A. thaliana
Many flowering plants are polyploids and easily tolerate this condition (Leitch and
Bennett, 1997; Scott et al., 1998a). However, in many plant species a 2:1 ratio of maternal
to paternal genomes in the endosperm is required for normal seed development (Lin, 1984;
Scott et al., 1998a; Erilova et al., 2009). Both gene dosage effects and the imprinting of
regulatory genes in the endosperm are regarded as the main cause of developmental failure
in seeds with abnormal parental contributions (Lin, 1984; Westoby and Haig, 1991;
Birchler, 1993; Erilova et al., 2009).
The 2:1 ratio also implies that maternally and paternally derived genomes are not
functionally equivalent. Scott et al., (1998a) showed that in A. thaliana interploidy
62
crosses, seeds developed from [2x X 4x] or [4x X 2x] were abnormal but viable and
showed complementary parent-of-origin seed size phenotypes. The maternal excess cross
produced relatively small seeds, whereas large seeds resulted from the paternal excess
cross; these phenotypes were correlated to the size of the endosperm. In contrast, seeds
generated from the more extreme [2x X 6x] or [6x X 2x] almost all aborted, and were
associated with extreme over- or under-proliferation of the endosperm, respectively. Thus,
in contrast to many other plant species, A. thaliana appears to have tetraploid rather than
triploid block.
4.1.3. The relation between triploid block and imprinting
The phenomenon of triploid block is clearly visible in the endosperm, which
constitutes a transient tissue of particular sensitivity to ploidy imbalance. The gene dosage
balance hypothesis (Lin, 1984; Haig and Westoby, 1991) suggested that parent-of-origin
dependent gene expression is responsible for ploidy effects in the endosperm. Thus, the
dosage-dependent phenotypes arise as consequence of stoichiometric imbalances in
macromolecular complexes, owing to differential parental contributions of dosage-
sensitive regulators that are part of these complexes (Birchler, 2001; Veitia, 2003). In A.
thaliana, mutations in the Polycomb Group (PcG) genes MEDEA (MEA) (Grossniklaus et
al., 1998; Kiyosue et al., 1999) and FERTILIZATION INDEPENDENT SEED2 (FIS2)
(Chaudhury et al., 1997), cause phenotypic abnormalities that are strikingly similar to seed
produced in extreme paternal excess [2x X 6x] crosses (Scott et al., 1998b; Dilkes et al.,
2008). Recent studies by Erilova et al., (2009) showed that the imprinted expression of
MEDEA is the underlying cause of the endosperm failure in A. thaliana developed seeds
that have an increased paternal genome contribution because MEDEA is only maternally
expressed in the endosperm. Thus, the compartment in the malfunctioning seed that most
likely lacks MEDEA activity is the endosperm, and as a result, development of the embryo
aborts. Hence, the parent-of-origin effects of medea mutations on embryo development are
likely to be indirect and result from defects in endosperm function (Kinoshita et al., 1999).
Moreover, the target genes of the PcG genes may be inhibited when MEDEA expression is
increased resulting in normal development of seeds, and this phenomenon explains the
expression of MEDEA genes as the major effect of triploid block of seeds (Erilova et al.,
2009).
63
4.1.4. Triploidy and the unreduced gametes
Many important crop plants are polyploids (Otto and Whitton, 2000). However,
even plants with small genomes, such as A. thaliana, are paleopolyploids (Blanc et al.,
2000; Adams and Wendel, 2005 and d‘Erfurth et al., 2008). For a long time, polyploids
were thought to originate from somatic chromosome doubling (Wingë, 1917). Triploids
can form by fusion of an unreduced (2n) gamete with a haploid gamete or by polyspermy.
Equational division of the female meiocyte in dyads indicated the likelihood of fertilisation
of unreduced female gametes by haploid male gametes (Ravi et al., 2008). In this case, the
new developed seeds would carry an excess contribution from the maternal genome.The
most common meiotic abnormalities that lead to the formation of (2n) gametes include
abnormal cytokinesis, the omission of the first or second division and abnormal spindle
arrangement, in particular parallel or fused spindles (co-orientation of second division
spindles), (Veilleux, 1985; Bretagnolle and Thompson, 1995; d‘Erfurth et al., 2008). The
frequency of unreduced gametes in diploid plants can approach a few percent according to
the species, genotype, and environmental conditions such as temperature and chemical
agents (Carputo et al., 2003; Ramsey, 2006; Kato and Birchler, 2006; Dilkes et al., 2008).
However, the production of 2n gametes is under strong genetic control (Ramsey and
Schemske, 1998).
The fusion of both normal and unreduced gametes can result in the formation of
tetraploid plants. In some species without strong postzygotic lethality interploidy crosses
can form polyploids via the production of the triploid bridge (Ramsey and Schemske 1998:
Dilkes et al., 2008). These triploids serve as a bridge or step towards higher ploidy levels
(Bretagnolle and Thompson, 1995; Ramsey and Schemske, 1998; Otto and Whitton, 2000
and d‘Erfurth et al., 2008).
4.1.5. Triploid block in the ecotype Col-0
Scott et al., (1998a) tested only two ecotypes, Ler and C24, in [2x X 4x] or [4x X
2x] crosses, making any generalizations about triploid block in A. thaliana impossible.
Ecotypes are different land races of the same species of plant (Crossa Raynaud, 1977);
however, A. thaliana has many different ecotypes (over 500,000 ecotypes) that are widely
distributed and grow in differing climates across the world. Ecotypes are a valuable source
of with-in species genetic variation, and has been exploited to identify genes and
quantitative trait loci that underpin complex phenotypes such as Col-0/Ler (Lister and
64
Dean, 1993; Meyre et al., 2001), C24/Col-0 (Törjek et al., 2006, 2008; Lisec et al., 2009),
Cvi-0/Ler (El-Assal et al., 2001), Col-0/Ler/Cvi-0 (Alonso-Blanco et al., 1998), and Kas-
1/Tsu-1 (McKay et al., 2008; Juenger et al., 2010).
Dilkes et al., (2008) working with the Col-0 ecotype first demonstrated the
existence of genetic variation for triploid block in A. thaliana. In Col-0, in contrast to Ler
and C24, the [2x X 4x] cross exhibited high levels of triploid block; the reciprocal [4x X
2x] cross behaved as Ler and C24 in being non-abortive. Such an extreme asymmetric or
paternal-only, postzygotic hybridisation barrier had not been reported previously in plants.
An important question that the work reported in this thesis set out to address was which of
the two behaviors - no triploid block or paternal-only triploid block - or some other
permutation, is most representative of the A. thaliana species. The experimental approach
was to test the crossing behaviour of multiple additional ecotypes and to use meiotic
mutants to investigate aspects of the Col paternal- only triploid block.
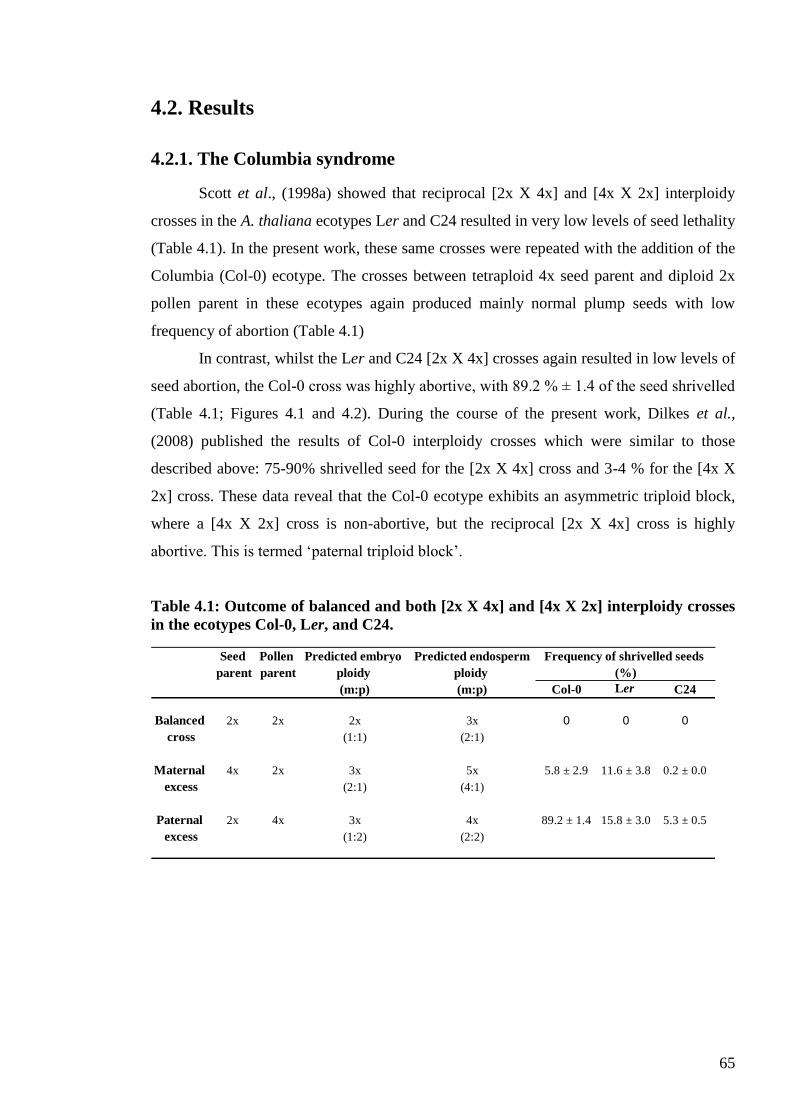
65
4.2. Results
4.2.1. The Columbia syndrome
Scott et al., (1998a) showed that reciprocal [2x X 4x] and [4x X 2x] interploidy
crosses in the A. thaliana ecotypes Ler and C24 resulted in very low levels of seed lethality
(Table 4.1). In the present work, these same crosses were repeated with the addition of the
Columbia (Col-0) ecotype. The crosses between tetraploid 4x seed parent and diploid 2x
pollen parent in these ecotypes again produced mainly normal plump seeds with low
frequency of abortion (Table 4.1)
In contrast, whilst the Ler and C24 [2x X 4x] crosses again resulted in low levels of
seed abortion, the Col-0 cross was highly abortive, with 89.2 % ± 1.4 of the seed shrivelled
(Table 4.1; Figures 4.1 and 4.2). During the course of the present work, Dilkes et al.,
(2008) published the results of Col-0 interploidy crosses which were similar to those
described above: 75-90% shrivelled seed for the [2x X 4x] cross and 3-4 % for the [4x X
2x] cross. These data reveal that the Col-0 ecotype exhibits an asymmetric triploid block,
where a [4x X 2x] cross is non-abortive, but the reciprocal [2x X 4x] cross is highly
abortive. This is termed ‗paternal triploid block‘.
Table 4.1: Outcome of balanced and both [2x X 4x] and [4x X 2x] interploidy crosses
in the ecotypes Col-0, Ler, and C24.
Seed Pollen Predicted embryo Predicted endosperm Frequency of shrivelled seeds
parent parent ploidy ploidy (%)
(m:p) (m:p) Col-0 Ler C24
Balanced 2x 2x 2x 3x 0 0 0
cross (1:1) (2:1)
Maternal 4x 2x 3x 5x 5.8 ± 2.9 11.6 ± 3.8 0.2 ± 0.0
excess (2:1) (4:1)
Paternal 2x 4x 3x 4x 89.2 ± 1.4 15.8 ± 3.0 5.3 ± 0.5
excess (1:2) (2:2)
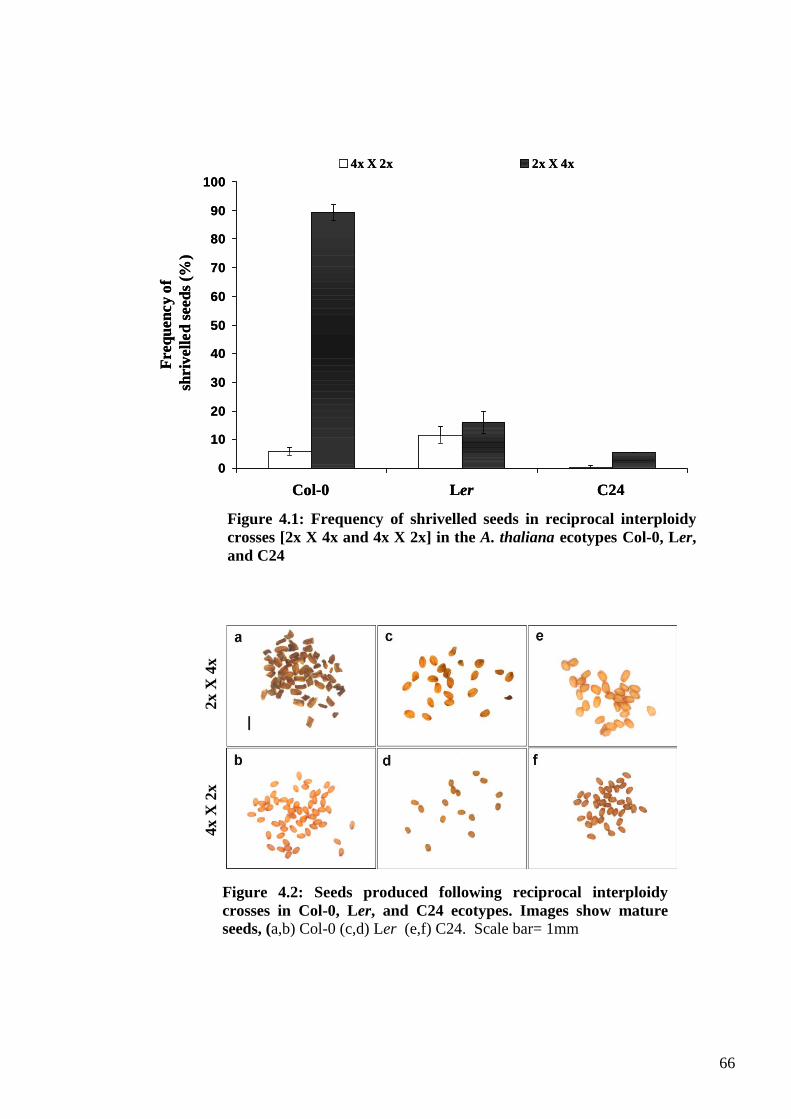
66
Freq
uen
cy o
f
shriv
ell
ed
seed
s (%
)
Col-0 Ler C24
0
10
20
30
40
50
60
70
80
90
100
4x X 2x 2x X 4xF
req
uen
cy o
f
shriv
ell
ed
seed
s (%
)
Col-0 Ler C24
0
10
20
30
40
50
60
70
80
90
100
4x X 2x 2x X 4x
Figure 4.2: Seeds produced following reciprocal interploidy
crosses in Col-0, Ler, and C24 ecotypes. Images show mature
seeds, (a,b) Col-0 (c,d) Ler (e,f) C24. Scale bar= 1mm
Figure 4.1: Frequency of shrivelled seeds in reciprocal interploidy
crosses [2x X 4x and 4x X 2x] in the A. thaliana ecotypes Col-0, Ler,
and C24
2x X
4x
4x X
2x
67
4.2.2. Genetic variation for asymmetric interploidy hybridisation barriers
Having established that Col-0 behaves differently to Ler and C24 in possessing
paternal triploid block, an important question was which of these two behaviors is most
representative of A. thaliana. To address the question, autotetraploid plants of a further
eleven A. thaliana ecotypes (Table 4.2) were generated by colchicine treatment from
diploid stocks sourced from NASC for use in reciprocal interploidy crosses. Putative
tetraploids were identified based on a large flower size relative to untreated diploid plants,
and subsequently verified as tetraploid by karyotyping. Reciprocal intra-ecotype
interploidy crosses were then conducted and the outcomes assessed using two measures: 1)
the frequency of shrivelled seed and 2) the mean seed weight. The mean seed weight was
calculated from the total number of seeds per silique (shrivelled and plump) and the total
weight of these seeds (shrivelled and plump), and was intended to provide a more objective
measure of seed abortion than the potentially subjective measure of shrivelled seed
frequency.
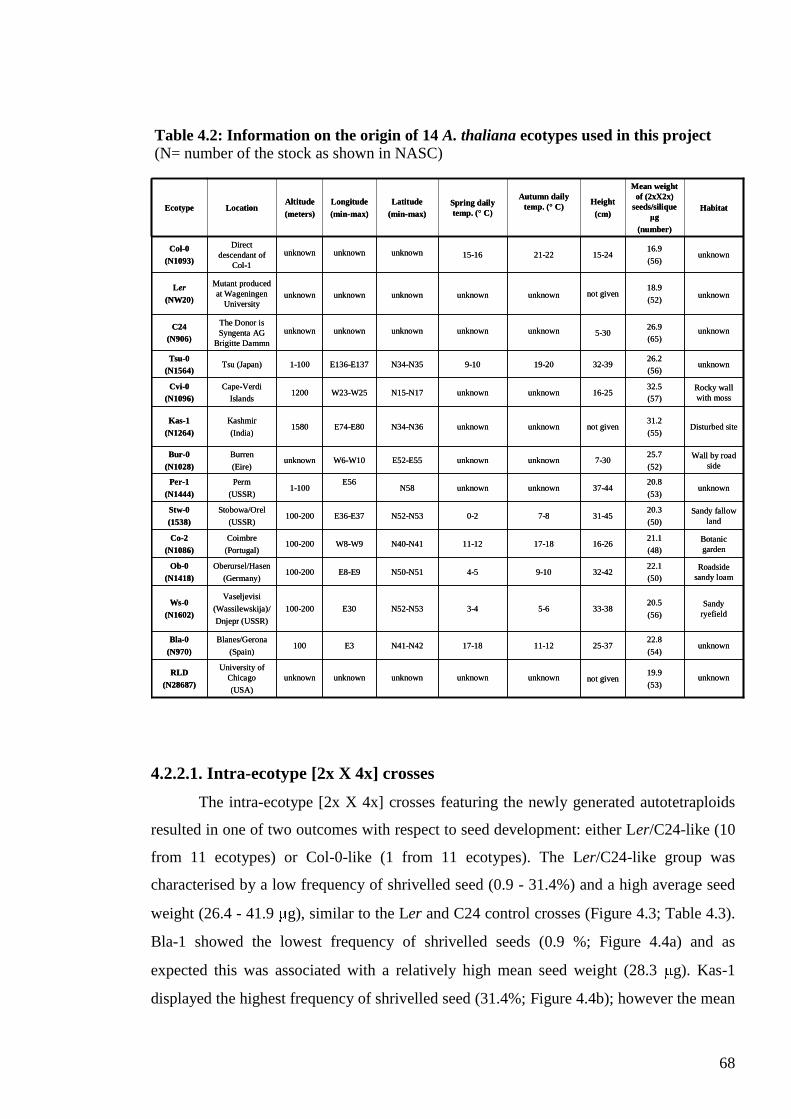
68
4.2.2.1. Intra-ecotype [2x X 4x] crosses
The intra-ecotype [2x X 4x] crosses featuring the newly generated autotetraploids
resulted in one of two outcomes with respect to seed development: either Ler/C24-like (10
from 11 ecotypes) or Col-0-like (1 from 11 ecotypes). The Ler/C24-like group was
characterised by a low frequency of shrivelled seed (0.9 - 31.4%) and a high average seed
weight (26.4 - 41.9 g), similar to the Ler and C24 control crosses (Figure 4.3; Table 4.3).
Bla-1 showed the lowest frequency of shrivelled seeds (0.9 %; Figure 4.4a) and as
expected this was associated with a relatively high mean seed weight (28.3 g). Kas-1
displayed the highest frequency of shrivelled seed (31.4%; Figure 4.4b); however the mean
19.9
(53)
22.8
(54)
20.5
(56)
22.1
(50)
21.1
(48)
20.3
(50)
20.8
(53)
25.7
(52)
31.2
(55)
32.5
(57)
26.2
(56)
26.9
(65)
18.9
(52)
16.9
(56)
Mean weight
of (2xX2x)
seeds/silique
μg
(number)
unknown25-3711-1217-18N41-N42E3100Blanes/Gerona
(Spain)
Bla-0
(N970)
unknownnot givenunknownunknownunknownunknownunknown
University of
Chicago
(USA)
RLD
(N28687)
unknown15-2421-2215-16unknownunknownunknownDirect
descendant of
Col-1
Col-0
(N1093)
unknownnot givenunknownunknownunknownunknownunknown
Mutant produced
at Wageningen
University
Ler
(NW20)
unknown5-30unknownunknownunknownunknownunknownThe Donor is
Syngenta AG
Brigitte Dammn
C24
(N906)
33-38
32-42
16-26
31-45
37-44
7-30
not given
16-25
32-39
Height
(cm)
Sandy
ryefield5-63-4N52-N53E30100-200
Vaseljevisi
(Wassilewskija)/
Dnjepr (USSR)
Ws-0
(N1602)
Roadside
sandy loam9-104-5N50-N51E8-E9100-200
Oberursel/Hasen
(Germany)
Ob-0
(N1418)
Botanic
garden17-1811-12N40-N41W8-W9100-200
Coimbre
(Portugal)
Co-2
(N1086)
Sandy fallow
land7-80-2N52-N53E36-E37100-200
Stobowa/Orel
(USSR)
Stw-0
(1538)
unknownunknownunknownN58E56
1-100Perm
(USSR)
Per-1
(N1444)
Wall by road
sideunknownunknownE52-E55W6-W10unknown
Burren
(Eire)
Bur-0
(N1028)
Disturbed siteunknownunknownN34-N36E74-E801580Kashmir
(India)
Kas-1
(N1264)
Rocky wall
with mossunknownunknownN15-N17W23-W251200
Cape-Verdi
Islands
Cvi-0
(N1096)
unknown19-209-10N34-N35E136-E1371-100Tsu (Japan)Tsu-0
(N1564)
Habitat
Autumn daily
temp. (° C)Spring daily
temp. (° C)
Latitude
(min-max)
Longitude
(min-max)
Altitude
(meters)LocationEcotype
Table 4.2: Information on the origin of 14 A. thaliana ecotypes used in this project
(N= number of the stock as shown in NASC)
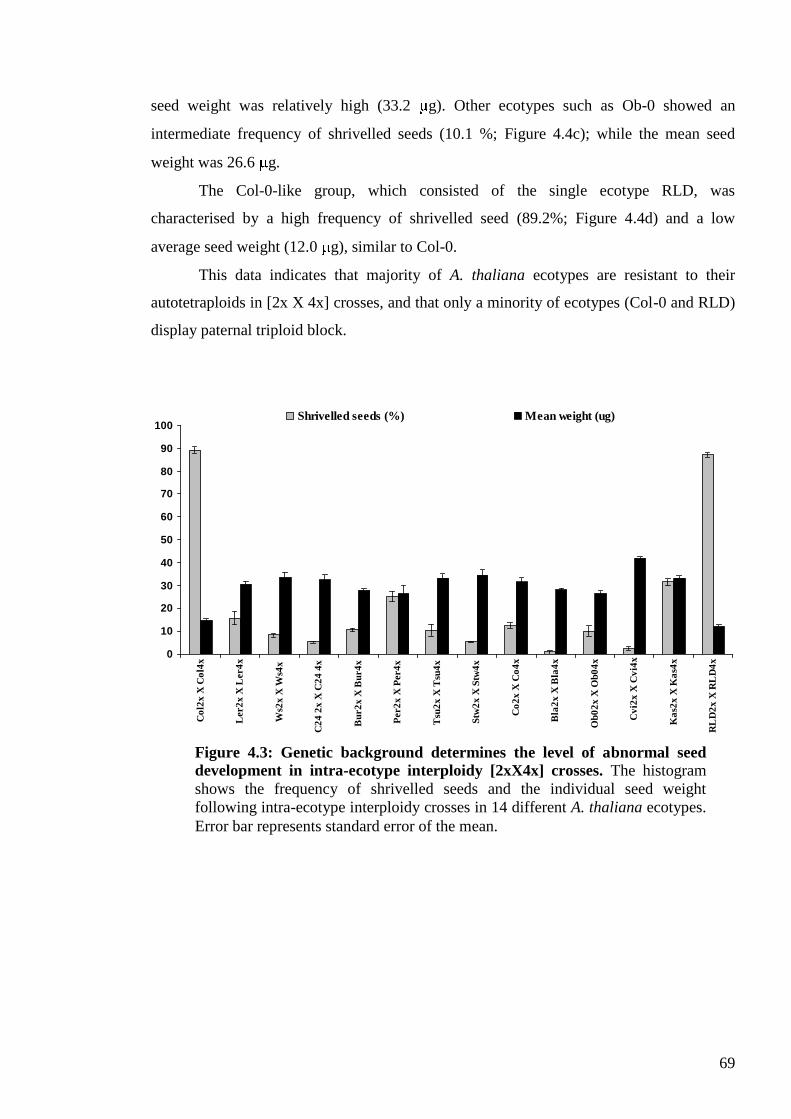
69
seed weight was relatively high (33.2 g). Other ecotypes such as Ob-0 showed an
intermediate frequency of shrivelled seeds (10.1 %; Figure 4.4c); while the mean seed
weight was 26.6 g.
The Col-0-like group, which consisted of the single ecotype RLD, was
characterised by a high frequency of shrivelled seed (89.2%; Figure 4.4d) and a low
average seed weight (12.0 g), similar to Col-0.
This data indicates that majority of A. thaliana ecotypes are resistant to their
autotetraploids in [2x X 4x] crosses, and that only a minority of ecotypes (Col-0 and RLD)
display paternal triploid block.
0
10
20
30
40
50
60
70
80
90
100
Co
l2x
X C
ol4
x
Ler2
x X
Ler4
x
Ws2
x X
Ws4
x
C2
4 2
x X
C2
4 4
x
Bu
r2
x X
Bu
r4
x
Per2
x X
Per4
x
Tsu
2x
X T
su4
x
Stw
2x
X S
tw4
x
Co
2x
X C
o4
x
Bla
2x
X B
la4
x
Ob
02
x X
Ob
04
x
Cv
i2x
X C
vi4
x
Ka
s2x
X K
as4
x
RL
D2
x X
RL
D4
x
Shrivelled seeds (%) Mean weight (ug)
Figure 4.3: Genetic background determines the level of abnormal seed
development in intra-ecotype interploidy [2xX4x] crosses. The histogram
shows the frequency of shrivelled seeds and the individual seed weight
following intra-ecotype interploidy crosses in 14 different A. thaliana ecotypes.
Error bar represents standard error of the mean.
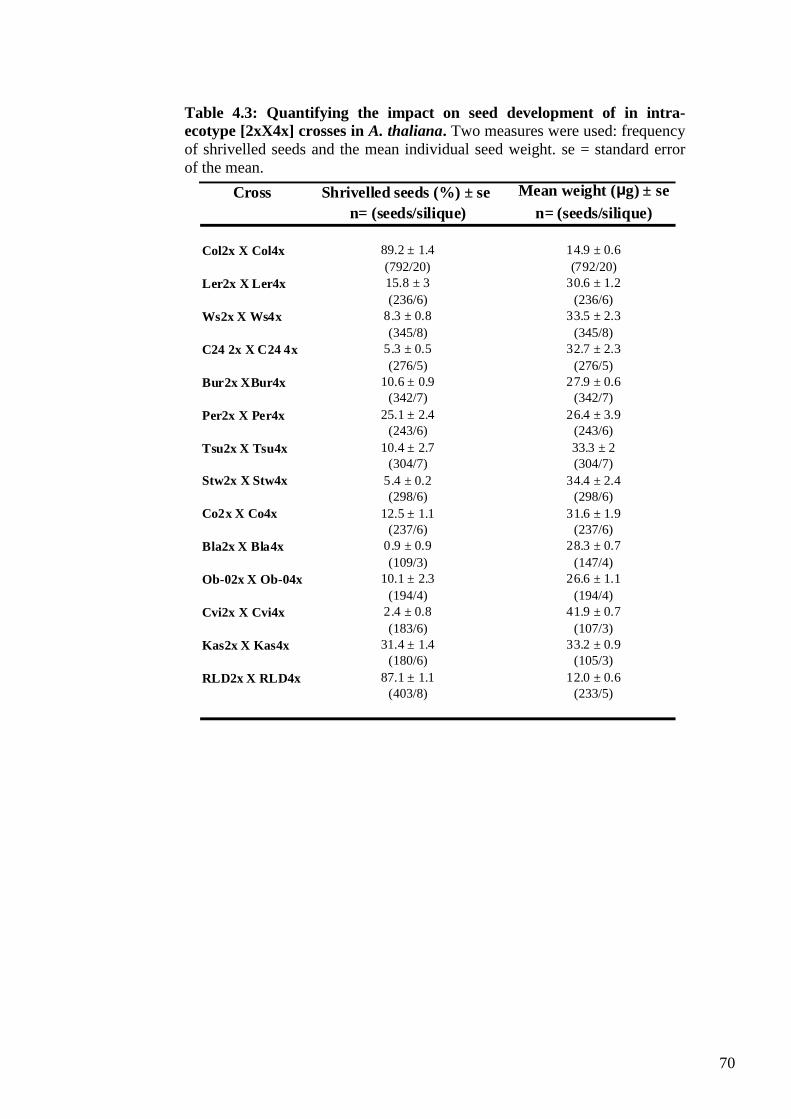
70
Cross Shrivelled seeds (%) ± se Mean weight (μg) ± se
n= (seeds/silique) n= (seeds/silique)
Col2x X Col4x 89.2 ± 1.4 14.9 ± 0.6
(792/20) (792/20)
Ler2x X Ler4x 15.8 ± 3 30.6 ± 1.2
(236/6) (236/6)
Ws2x X Ws4x 8.3 ± 0.8 33.5 ± 2.3
(345/8) (345/8)
C24 2x X C24 4x 5.3 ± 0.5 32.7 ± 2.3
(276/5) (276/5)
Bur2x XBur4x 10.6 ± 0.9 27.9 ± 0.6
(342/7) (342/7)
Per2x X Per4x 25.1 ± 2.4 26.4 ± 3.9
(243/6) (243/6)
Tsu2x X Tsu4x 10.4 ± 2.7 33.3 ± 2
(304/7) (304/7)
Stw2x X Stw4x 5.4 ± 0.2 34.4 ± 2.4
(298/6) (298/6)
Co2x X Co4x 12.5 ± 1.1 31.6 ± 1.9
(237/6) (237/6)
Bla2x X Bla4x 0.9 ± 0.9 28.3 ± 0.7
(109/3) (147/4)
Ob-02x X Ob-04x 10.1 ± 2.3 26.6 ± 1.1
(194/4) (194/4)
Cvi2x X Cvi4x 2.4 ± 0.8 41.9 ± 0.7
(183/6) (107/3)
Kas2x X Kas4x 31.4 ± 1.4 33.2 ± 0.9
(180/6) (105/3)
RLD2x X RLD4x 87.1 ± 1.1 12.0 ± 0.6
(403/8) (233/5)
Table 4.3: Quantifying the impact on seed development of in intra-
ecotype [2xX4x] crosses in A. thaliana. Two measures were used: frequency
of shrivelled seeds and the mean individual seed weight. se = standard error
of the mean.
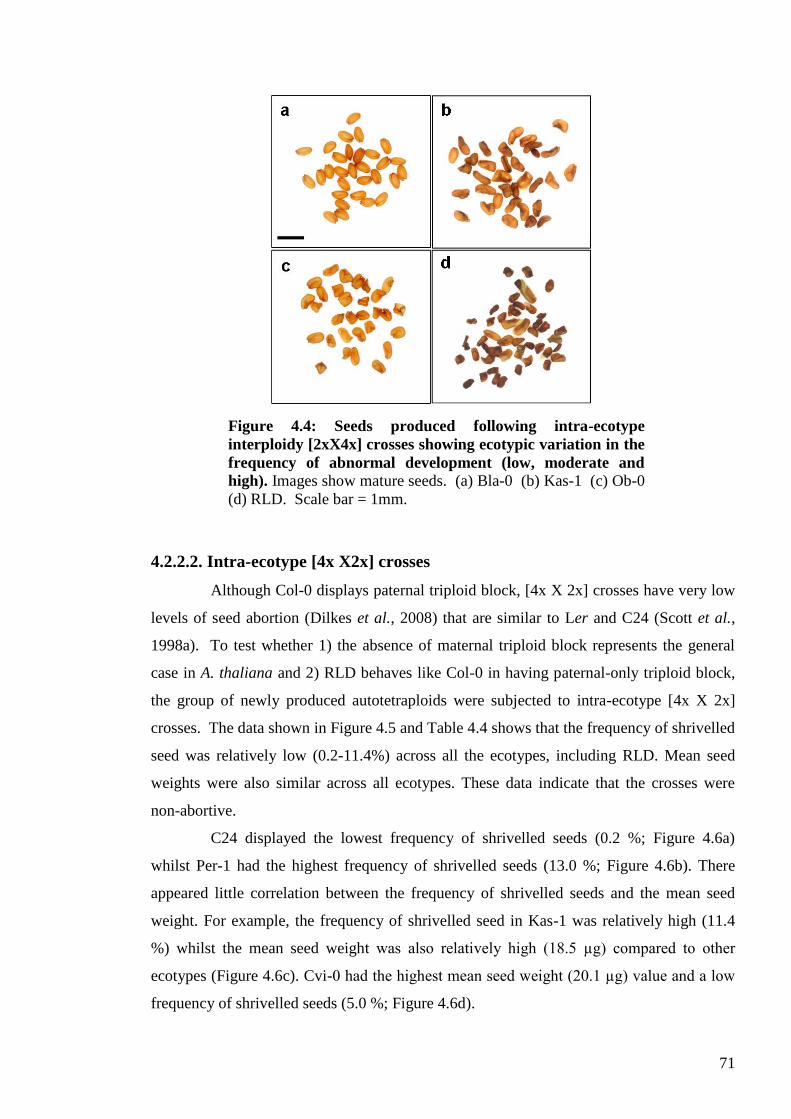
71
4.2.2.2. Intra-ecotype [4x X2x] crosses
Although Col-0 displays paternal triploid block, [4x X 2x] crosses have very low
levels of seed abortion (Dilkes et al., 2008) that are similar to Ler and C24 (Scott et al.,
1998a). To test whether 1) the absence of maternal triploid block represents the general
case in A. thaliana and 2) RLD behaves like Col-0 in having paternal-only triploid block,
the group of newly produced autotetraploids were subjected to intra-ecotype [4x X 2x]
crosses. The data shown in Figure 4.5 and Table 4.4 shows that the frequency of shrivelled
seed was relatively low (0.2-11.4%) across all the ecotypes, including RLD. Mean seed
weights were also similar across all ecotypes. These data indicate that the crosses were
non-abortive.
C24 displayed the lowest frequency of shrivelled seeds (0.2 %; Figure 4.6a)
whilst Per-1 had the highest frequency of shrivelled seeds (13.0 %; Figure 4.6b). There
appeared little correlation between the frequency of shrivelled seeds and the mean seed
weight. For example, the frequency of shrivelled seed in Kas-1 was relatively high (11.4
%) whilst the mean seed weight was also relatively high (18.5 µg) compared to other
ecotypes (Figure 4.6c). Cvi-0 had the highest mean seed weight (20.1 µg) value and a low
frequency of shrivelled seeds (5.0 %; Figure 4.6d).
Figure 4.4: Seeds produced following intra-ecotype
interploidy [2xX4x] crosses showing ecotypic variation in the
frequency of abnormal development (low, moderate and
high). Images show mature seeds. (a) Bla-0 (b) Kas-1 (c) Ob-0
(d) RLD. Scale bar = 1mm.
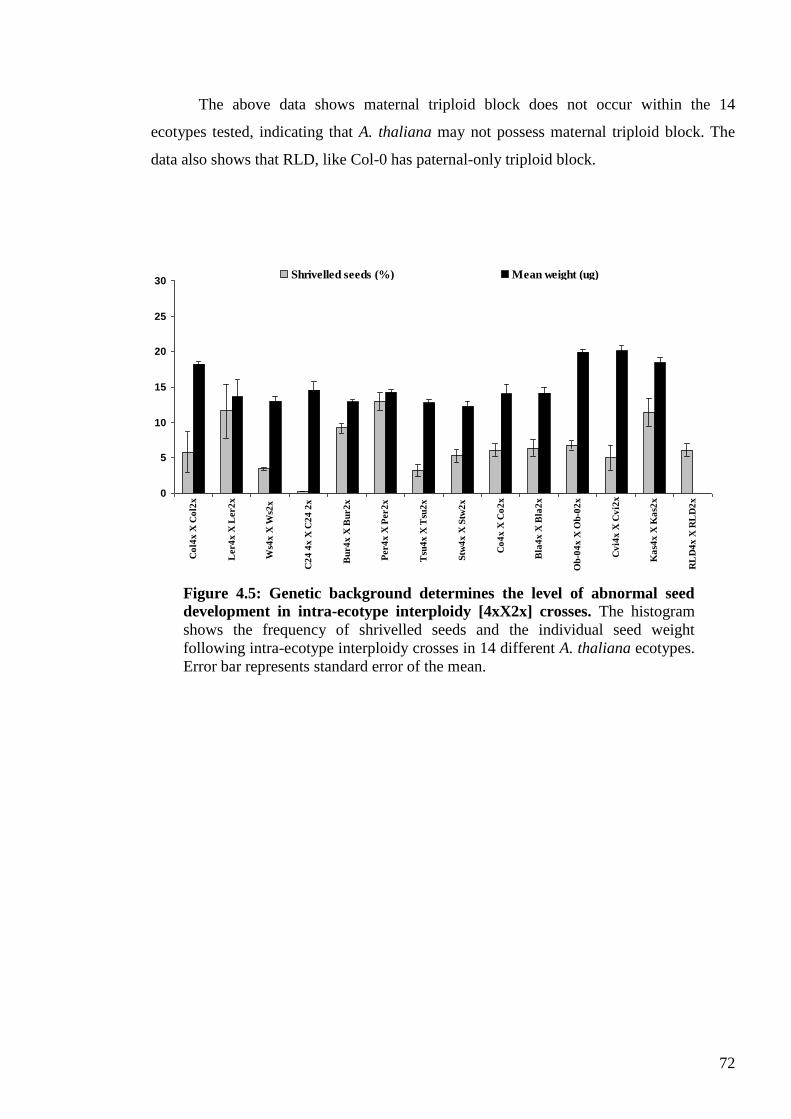
72
The above data shows maternal triploid block does not occur within the 14
ecotypes tested, indicating that A. thaliana may not possess maternal triploid block. The
data also shows that RLD, like Col-0 has paternal-only triploid block.
0
5
10
15
20
25
30
Co
l4x
X C
ol2
x
Ler4
x X
Ler2
x
Ws4
x X
Ws2
x
C2
4 4
x X
C2
4 2
x
Bu
r4
x X
Bu
r2
x
Per4
x X
Per2
x
Tsu
4x
X T
su2
x
Stw
4x
X S
tw2
x
Co
4x
X C
o2
x
Bla
4x
X B
la2
x
Ob
-04
x X
Ob
-02
x
Cv
i4x
X C
vi2
x
Ka
s4x
X K
as2
x
RL
D4
x X
RL
D2
x
Shrivelled seeds (%) Mean weight (ug)
Figure 4.5: Genetic background determines the level of abnormal seed
development in intra-ecotype interploidy [4xX2x] crosses. The histogram
shows the frequency of shrivelled seeds and the individual seed weight
following intra-ecotype interploidy crosses in 14 different A. thaliana ecotypes.
Error bar represents standard error of the mean.
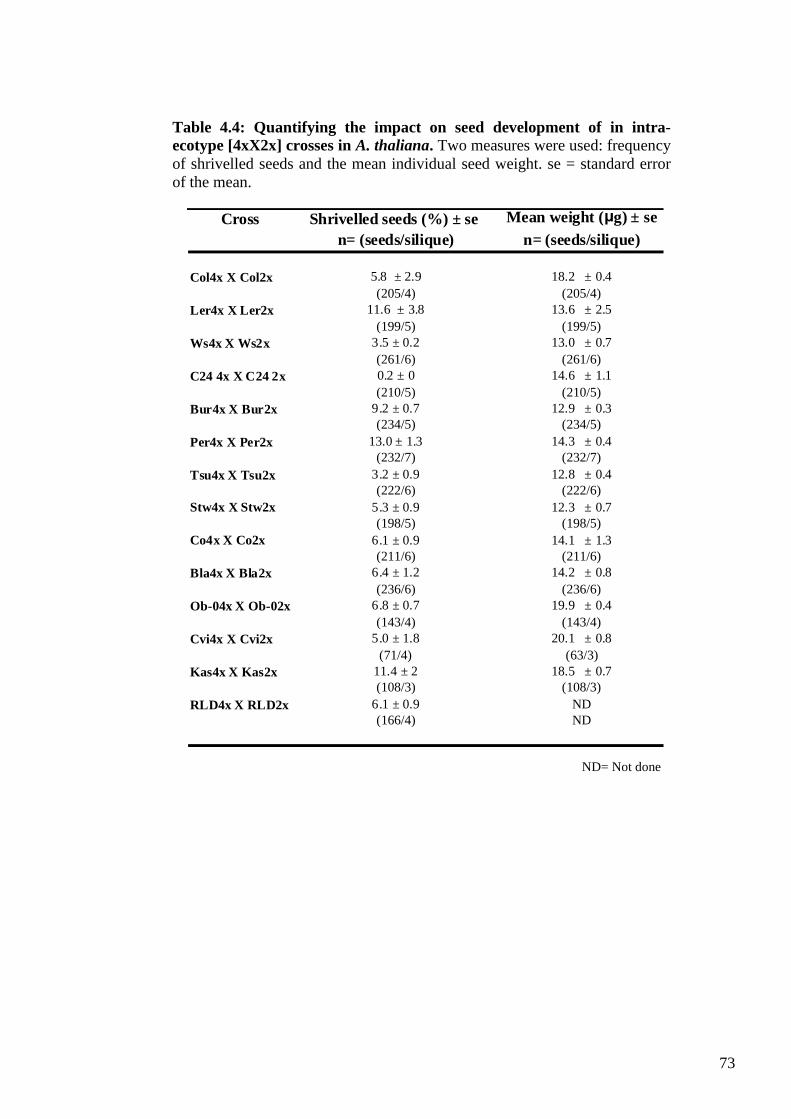
73
ND= Not done
Cross Shrivelled seeds (%) ± se Mean weight (μg) ± se
n= (seeds/silique) n= (seeds/silique)
Col4x X Col2x 5.8 ± 2.9 18.2 ± 0.4
(205/4) (205/4)
Ler4x X Ler2x 11.6 ± 3.8 13.6 ± 2.5
(199/5) (199/5)
Ws4x X Ws2x 3.5 ± 0.2 13.0 ± 0.7
(261/6) (261/6)
C24 4x X C24 2x 0.2 ± 0 14.6 ± 1.1
(210/5) (210/5)
Bur4x X Bur2x 9.2 ± 0.7 12.9 ± 0.3
(234/5) (234/5)
Per4x X Per2x 13.0 ± 1.3 14.3 ± 0.4
(232/7) (232/7)
Tsu4x X Tsu2x 3.2 ± 0.9 12.8 ± 0.4
(222/6) (222/6)
Stw4x X Stw2x 5.3 ± 0.9 12.3 ± 0.7
(198/5) (198/5)
Co4x X Co2x 6.1 ± 0.9 14.1 ± 1.3
(211/6) (211/6)
Bla4x X Bla2x 6.4 ± 1.2 14.2 ± 0.8
(236/6) (236/6)
Ob-04x X Ob-02x 6.8 ± 0.7 19.9 ± 0.4
(143/4) (143/4)
Cvi4x X Cvi2x 5.0 ± 1.8 20.1 ± 0.8
(71/4) (63/3)
Kas4x X Kas2x 11.4 ± 2 18.5 ± 0.7
(108/3) (108/3)
RLD4x X RLD2x 6.1 ± 0.9 ND
(166/4) ND
Table 4.4: Quantifying the impact on seed development of in intra-
ecotype [4xX2x] crosses in A. thaliana. Two measures were used: frequency
of shrivelled seeds and the mean individual seed weight. se = standard error
of the mean.
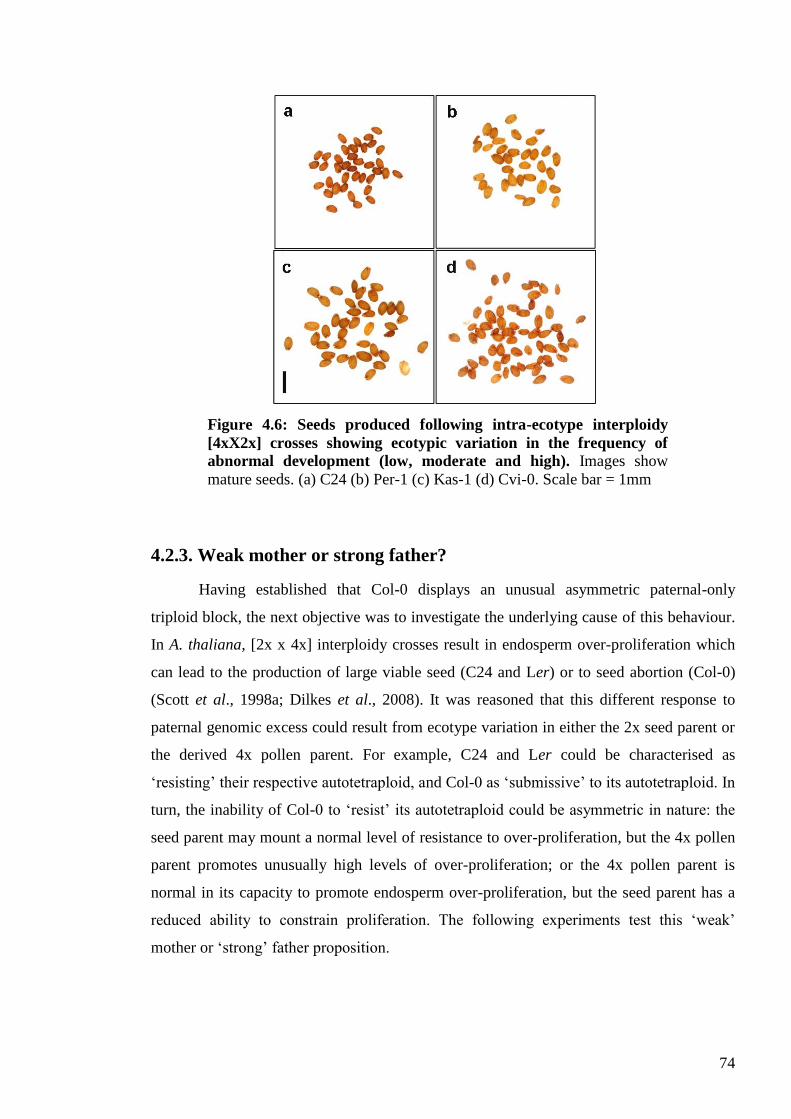
74
4.2.3. Weak mother or strong father?
Having established that Col-0 displays an unusual asymmetric paternal-only
triploid block, the next objective was to investigate the underlying cause of this behaviour.
In A. thaliana, [2x x 4x] interploidy crosses result in endosperm over-proliferation which
can lead to the production of large viable seed (C24 and Ler) or to seed abortion (Col-0)
(Scott et al., 1998a; Dilkes et al., 2008). It was reasoned that this different response to
paternal genomic excess could result from ecotype variation in either the 2x seed parent or
the derived 4x pollen parent. For example, C24 and Ler could be characterised as
‗resisting‘ their respective autotetraploid, and Col-0 as ‗submissive‘ to its autotetraploid. In
turn, the inability of Col-0 to ‗resist‘ its autotetraploid could be asymmetric in nature: the
seed parent may mount a normal level of resistance to over-proliferation, but the 4x pollen
parent promotes unusually high levels of over-proliferation; or the 4x pollen parent is
normal in its capacity to promote endosperm over-proliferation, but the seed parent has a
reduced ability to constrain proliferation. The following experiments test this ‗weak‘
mother or ‗strong‘ father proposition.
Figure 4.6: Seeds produced following intra-ecotype interploidy
[4xX2x] crosses showing ecotypic variation in the frequency of
abnormal development (low, moderate and high). Images show
mature seeds. (a) C24 (b) Per-1 (c) Kas-1 (d) Cvi-0. Scale bar = 1mm
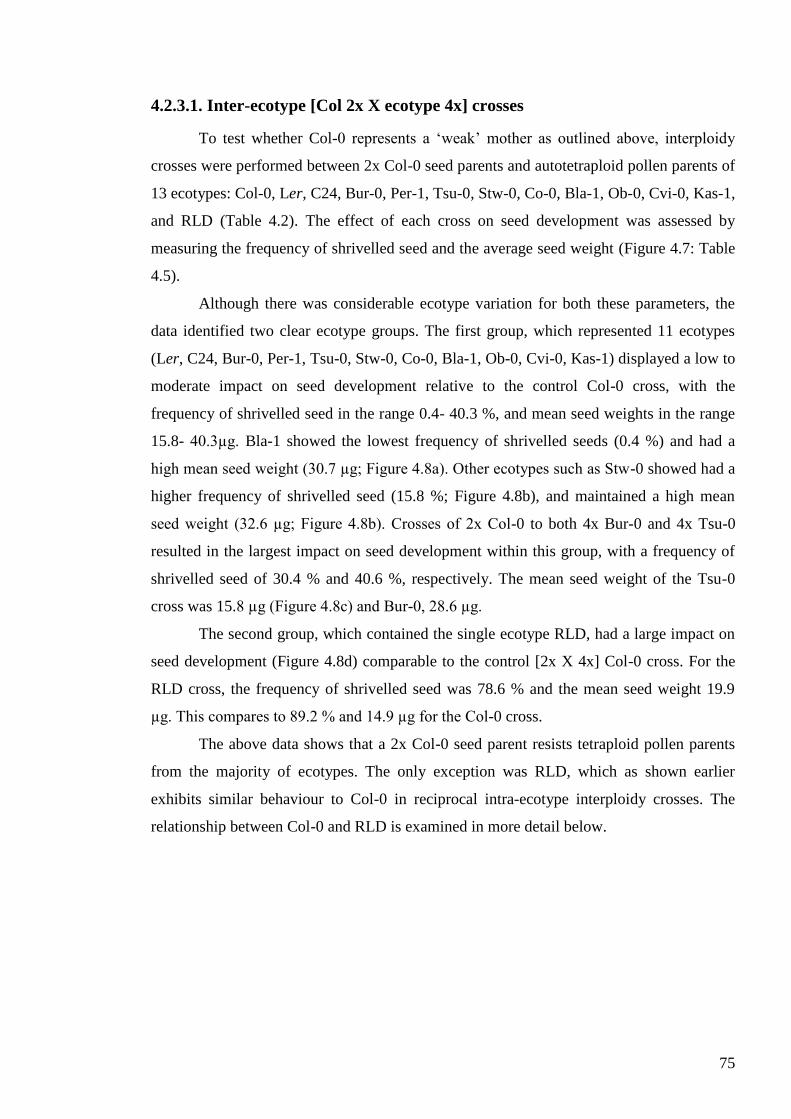
75
4.2.3.1. Inter-ecotype [Col 2x X ecotype 4x] crosses
To test whether Col-0 represents a ‗weak‘ mother as outlined above, interploidy
crosses were performed between 2x Col-0 seed parents and autotetraploid pollen parents of
13 ecotypes: Col-0, Ler, C24, Bur-0, Per-1, Tsu-0, Stw-0, Co-0, Bla-1, Ob-0, Cvi-0, Kas-1,
and RLD (Table 4.2). The effect of each cross on seed development was assessed by
measuring the frequency of shrivelled seed and the average seed weight (Figure 4.7: Table
4.5).
Although there was considerable ecotype variation for both these parameters, the
data identified two clear ecotype groups. The first group, which represented 11 ecotypes
(Ler, C24, Bur-0, Per-1, Tsu-0, Stw-0, Co-0, Bla-1, Ob-0, Cvi-0, Kas-1) displayed a low to
moderate impact on seed development relative to the control Col-0 cross, with the
frequency of shrivelled seed in the range 0.4- 40.3 %, and mean seed weights in the range
15.8- 40.3µg. Bla-1 showed the lowest frequency of shrivelled seeds (0.4 %) and had a
high mean seed weight (30.7 µg; Figure 4.8a). Other ecotypes such as Stw-0 showed had a
higher frequency of shrivelled seed (15.8 %; Figure 4.8b), and maintained a high mean
seed weight (32.6 µg; Figure 4.8b). Crosses of 2x Col-0 to both 4x Bur-0 and 4x Tsu-0
resulted in the largest impact on seed development within this group, with a frequency of
shrivelled seed of 30.4 % and 40.6 %, respectively. The mean seed weight of the Tsu-0
cross was 15.8 µg (Figure 4.8c) and Bur-0, 28.6 µg.
The second group, which contained the single ecotype RLD, had a large impact on
seed development (Figure 4.8d) comparable to the control [2x X 4x] Col-0 cross. For the
RLD cross, the frequency of shrivelled seed was 78.6 % and the mean seed weight 19.9
µg. This compares to 89.2 % and 14.9 µg for the Col-0 cross.
The above data shows that a 2x Col-0 seed parent resists tetraploid pollen parents
from the majority of ecotypes. The only exception was RLD, which as shown earlier
exhibits similar behaviour to Col-0 in reciprocal intra-ecotype interploidy crosses. The
relationship between Col-0 and RLD is examined in more detail below.
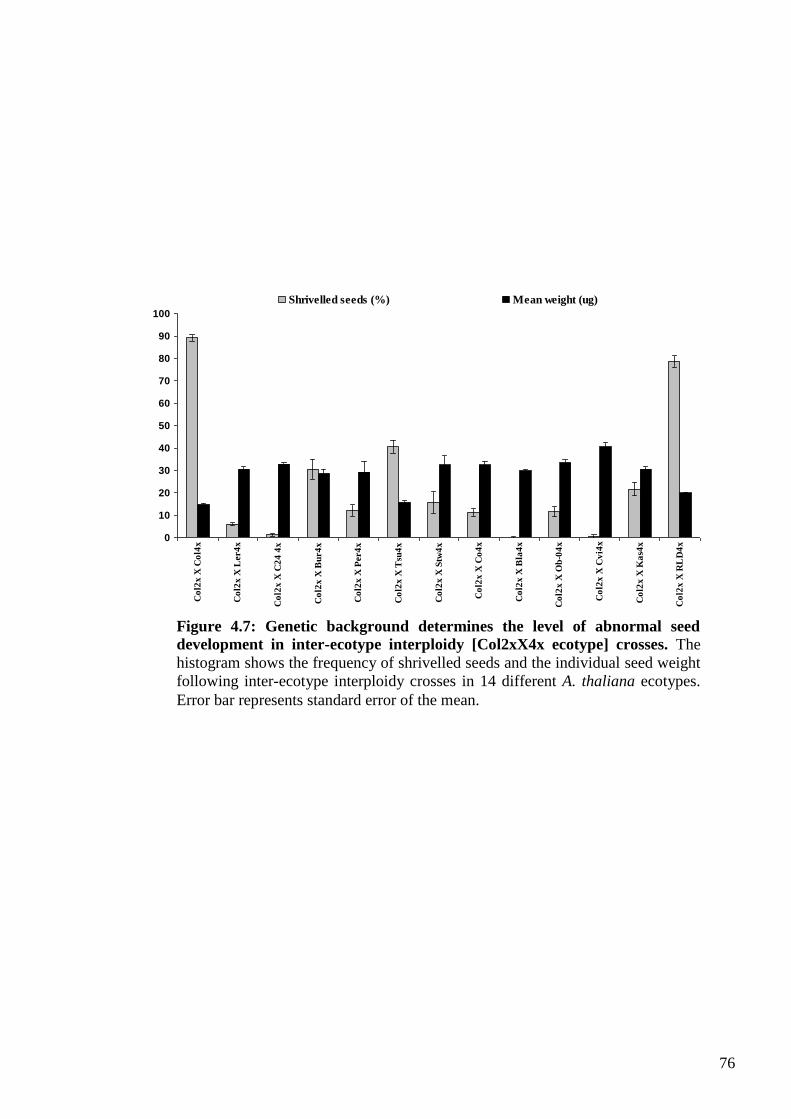
76
0
10
20
30
40
50
60
70
80
90
100
Co
l2x
X C
ol4
x
Co
l2x
X L
er4
x
Co
l2x
X C
24
4x
Co
l2x
X B
ur4
x
Co
l2x
X P
er4
x
Co
l2x
X T
su4
x
Co
l2x
X S
tw4
x
Co
l2x
X C
o4
x
Co
l2x
X B
la4
x
Co
l2x
X O
b-0
4x
Co
l2x
X C
vi4
x
Co
l2x
X K
as4
x
Co
l2x
X R
LD
4x
Shrivelled seeds (%) Mean weight (ug)
Figure 4.7: Genetic background determines the level of abnormal seed
development in inter-ecotype interploidy [Col2xX4x ecotype] crosses. The
histogram shows the frequency of shrivelled seeds and the individual seed weight
following inter-ecotype interploidy crosses in 14 different A. thaliana ecotypes.
Error bar represents standard error of the mean.
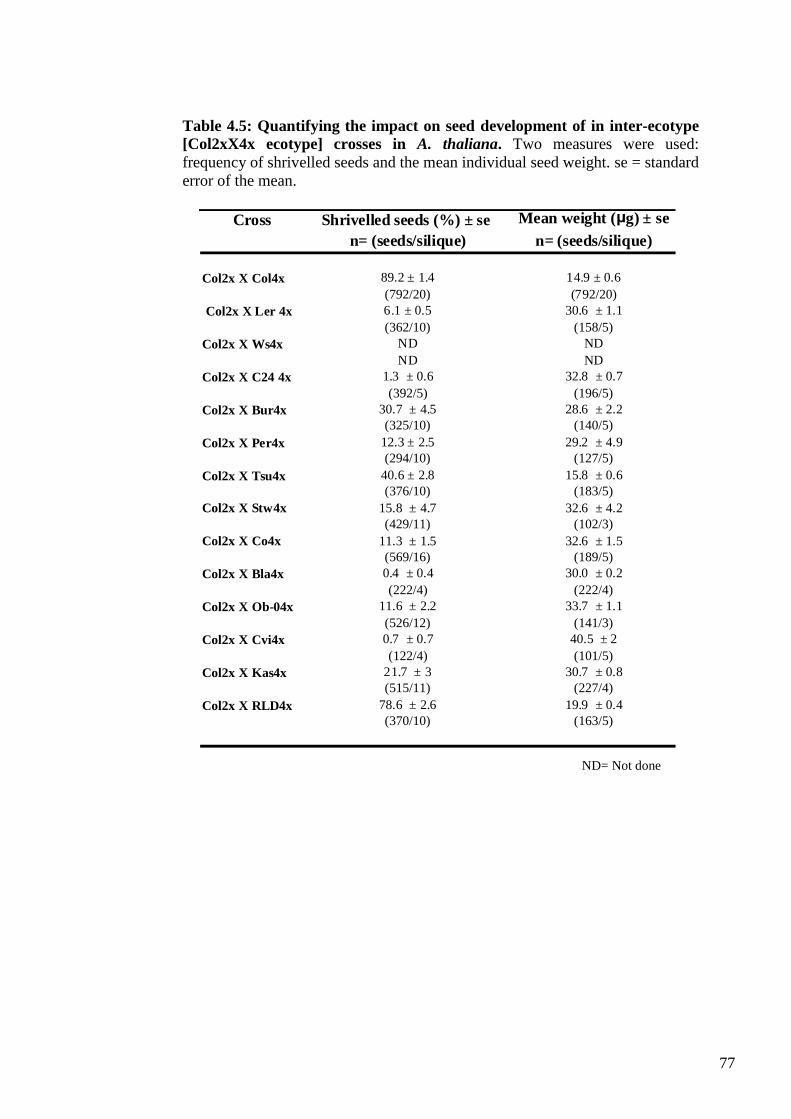
77
ND= Not done
Cross Shrivelled seeds (%) ± se Mean weight (μg) ± se
n= (seeds/silique) n= (seeds/silique)
Col2x X Col4x 89.2 ± 1.4 14.9 ± 0.6
(792/20) (792/20)
Col2x X Ler 4x 6.1 ± 0.5 30.6 ± 1.1
(362/10) (158/5)
Col2x X Ws4x ND ND
ND ND
Col2x X C24 4x 1.3 ± 0.6 32.8 ± 0.7
(392/5) (196/5)
Col2x X Bur4x 30.7 ± 4.5 28.6 ± 2.2
(325/10) (140/5)
Col2x X Per4x 12.3 ± 2.5 29.2 ± 4.9
(294/10) (127/5)
Col2x X Tsu4x 40.6 ± 2.8 15.8 ± 0.6
(376/10) (183/5)
Col2x X Stw4x 15.8 ± 4.7 32.6 ± 4.2
(429/11) (102/3)
Col2x X Co4x 11.3 ± 1.5 32.6 ± 1.5
(569/16) (189/5)
Col2x X Bla4x 0.4 ± 0.4 30.0 ± 0.2
(222/4) (222/4)
Col2x X Ob-04x 11.6 ± 2.2 33.7 ± 1.1
(526/12) (141/3)
Col2x X Cvi4x 0.7 ± 0.7 40.5 ± 2
(122/4) (101/5)
Col2x X Kas4x 21.7 ± 3 30.7 ± 0.8
(515/11) (227/4)
Col2x X RLD4x 78.6 ± 2.6 19.9 ± 0.4
(370/10) (163/5)
Table 4.5: Quantifying the impact on seed development of in inter-ecotype
[Col2xX4x ecotype] crosses in A. thaliana. Two measures were used:
frequency of shrivelled seeds and the mean individual seed weight. se = standard
error of the mean.
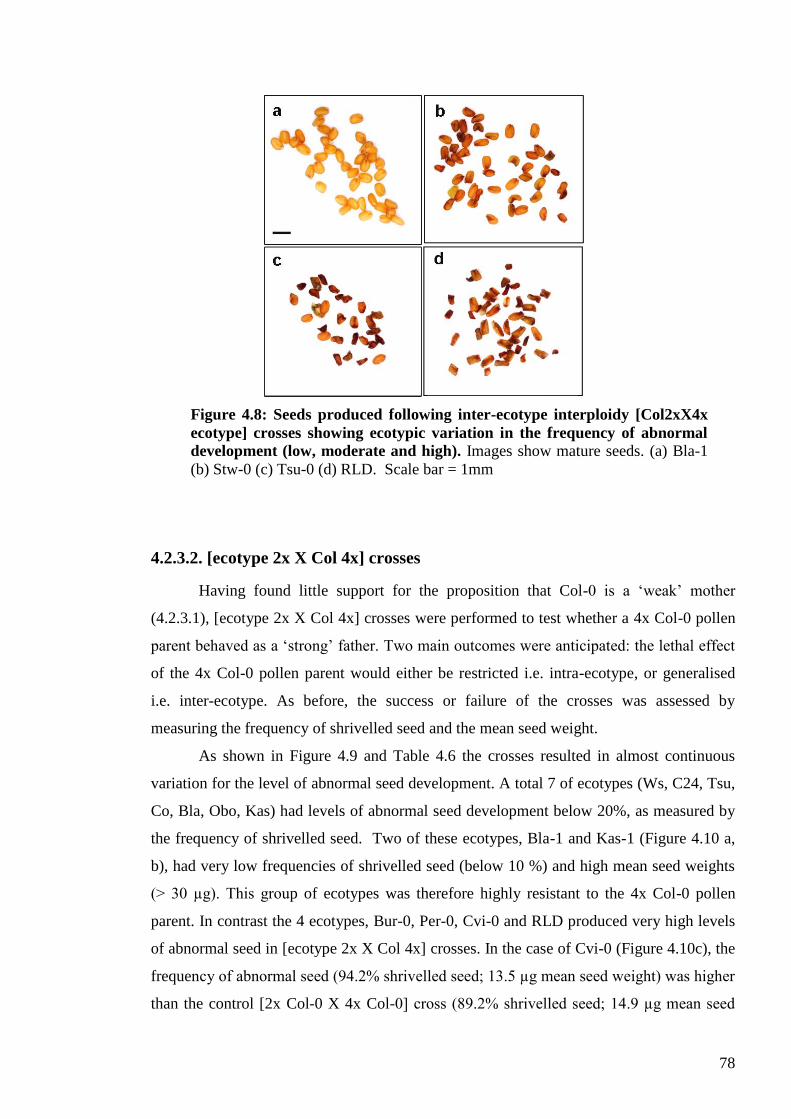
78
4.2.3.2. [ecotype 2x X Col 4x] crosses
Having found little support for the proposition that Col-0 is a ‗weak‘ mother
(4.2.3.1), [ecotype 2x X Col 4x] crosses were performed to test whether a 4x Col-0 pollen
parent behaved as a ‗strong‘ father. Two main outcomes were anticipated: the lethal effect
of the 4x Col-0 pollen parent would either be restricted i.e. intra-ecotype, or generalised
i.e. inter-ecotype. As before, the success or failure of the crosses was assessed by
measuring the frequency of shrivelled seed and the mean seed weight.
As shown in Figure 4.9 and Table 4.6 the crosses resulted in almost continuous
variation for the level of abnormal seed development. A total 7 of ecotypes (Ws, C24, Tsu,
Co, Bla, Obo, Kas) had levels of abnormal seed development below 20%, as measured by
the frequency of shrivelled seed. Two of these ecotypes, Bla-1 and Kas-1 (Figure 4.10 a,
b), had very low frequencies of shrivelled seed (below 10 %) and high mean seed weights
(> 30 µg). This group of ecotypes was therefore highly resistant to the 4x Col-0 pollen
parent. In contrast the 4 ecotypes, Bur-0, Per-0, Cvi-0 and RLD produced very high levels
of abnormal seed in [ecotype 2x X Col 4x] crosses. In the case of Cvi-0 (Figure 4.10c), the
frequency of abnormal seed (94.2% shrivelled seed; 13.5 µg mean seed weight) was higher
than the control [2x Col-0 X 4x Col-0] cross (89.2% shrivelled seed; 14.9 µg mean seed
Figure 4.8: Seeds produced following inter-ecotype interploidy [Col2xX4x
ecotype] crosses showing ecotypic variation in the frequency of abnormal
development (low, moderate and high). Images show mature seeds. (a) Bla-1
(b) Stw-0 (c) Tsu-0 (d) RLD. Scale bar = 1mm
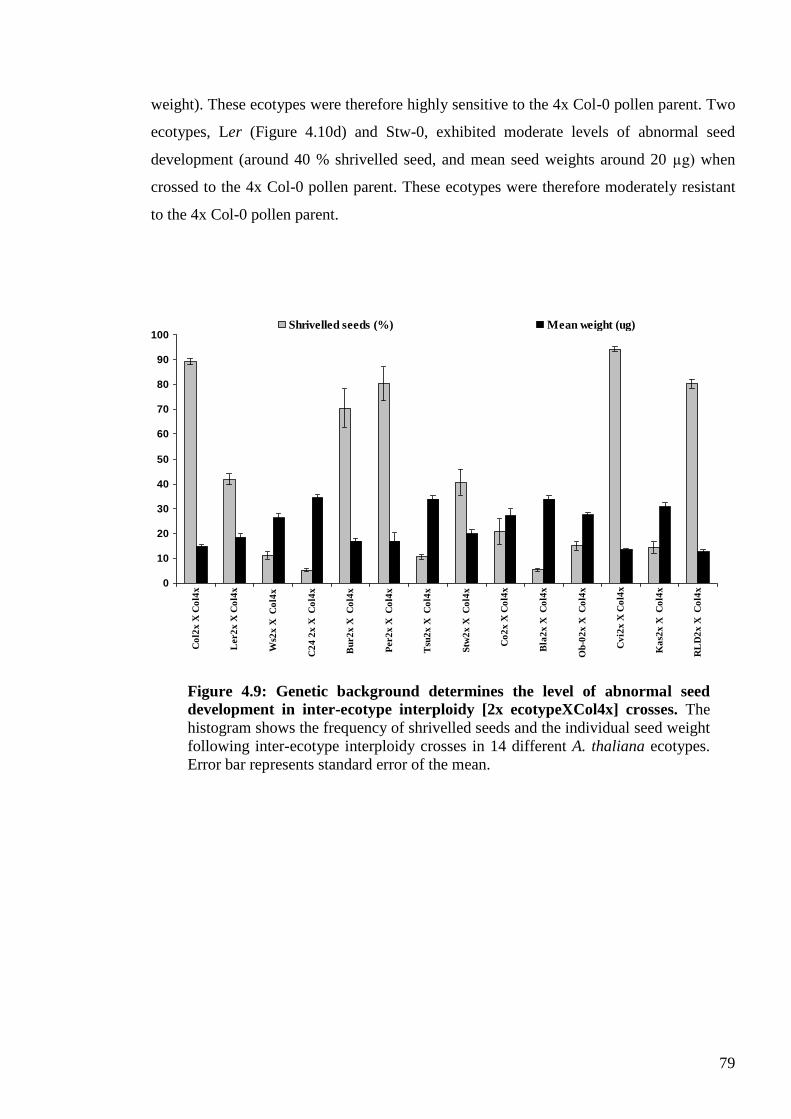
79
weight). These ecotypes were therefore highly sensitive to the 4x Col-0 pollen parent. Two
ecotypes, Ler (Figure 4.10d) and Stw-0, exhibited moderate levels of abnormal seed
development (around 40 % shrivelled seed, and mean seed weights around 20 µg) when
crossed to the 4x Col-0 pollen parent. These ecotypes were therefore moderately resistant
to the 4x Col-0 pollen parent.
0
10
20
30
40
50
60
70
80
90
100
Co
l2x
X C
ol4
x
Ler2
x X
Co
l4x
Ws2
x X
C
ol4
x
C2
4 2
x X
C
ol4
x
Bu
r2
x X
C
ol4
x
Per2
x X
C
ol4
x
Tsu
2x
X C
ol4
x
Stw
2x
X C
ol4
x
Co
2x
X C
ol4
x
Bla
2x
X C
ol4
x
Ob
-02
x X
C
ol4
x
Cv
i2x
X C
ol4
x
Ka
s2x
X C
ol4
x
RL
D2
x X
C
ol4
x
Shrivelled seeds (%) Mean weight (ug)
Figure 4.9: Genetic background determines the level of abnormal seed
development in inter-ecotype interploidy [2x ecotypeXCol4x] crosses. The
histogram shows the frequency of shrivelled seeds and the individual seed weight
following inter-ecotype interploidy crosses in 14 different A. thaliana ecotypes.
Error bar represents standard error of the mean.
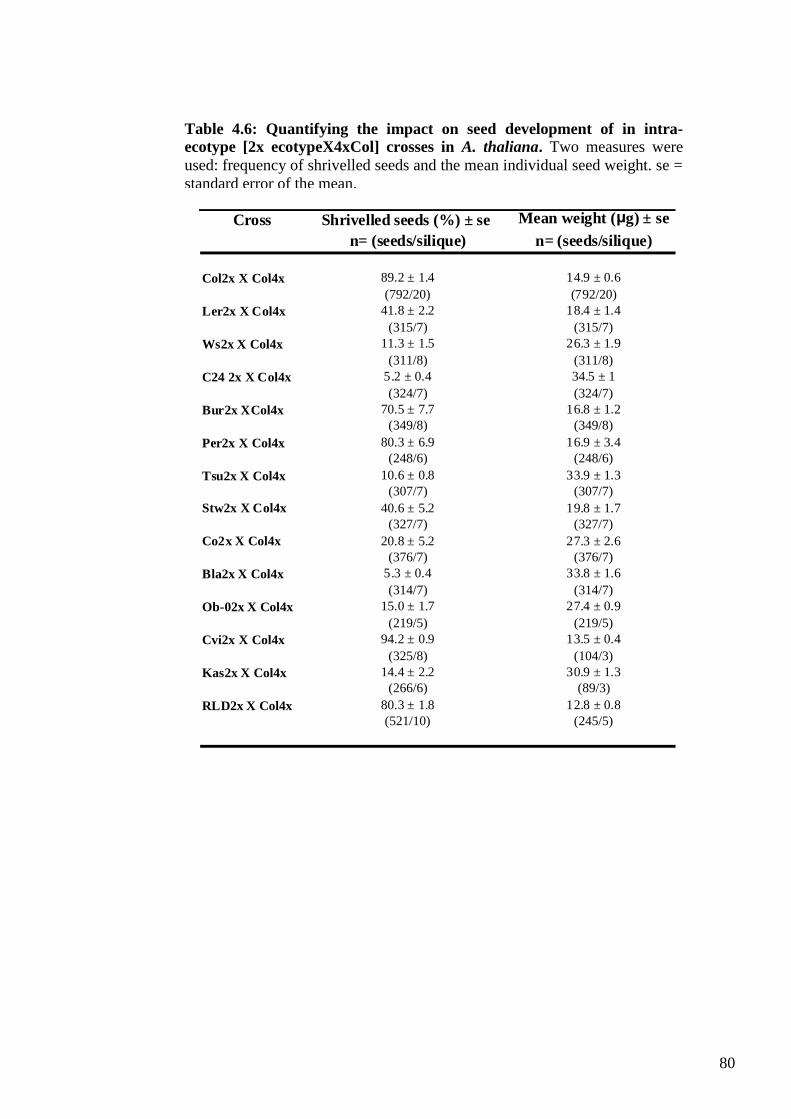
80
Cross Shrivelled seeds (%) ± se Mean weight (μg) ± se
n= (seeds/silique) n= (seeds/silique)
Col2x X Col4x 89.2 ± 1.4 14.9 ± 0.6
(792/20) (792/20)
Ler2x X Col4x 41.8 ± 2.2 18.4 ± 1.4
(315/7) (315/7)
Ws2x X Col4x 11.3 ± 1.5 26.3 ± 1.9
(311/8) (311/8)
C24 2x X Col4x 5.2 ± 0.4 34.5 ± 1
(324/7) (324/7)
Bur2x XCol4x 70.5 ± 7.7 16.8 ± 1.2
(349/8) (349/8)
Per2x X Col4x 80.3 ± 6.9 16.9 ± 3.4
(248/6) (248/6)
Tsu2x X Col4x 10.6 ± 0.8 33.9 ± 1.3
(307/7) (307/7)
Stw2x X Col4x 40.6 ± 5.2 19.8 ± 1.7
(327/7) (327/7)
Co2x X Col4x 20.8 ± 5.2 27.3 ± 2.6
(376/7) (376/7)
Bla2x X Col4x 5.3 ± 0.4 33.8 ± 1.6
(314/7) (314/7)
Ob-02x X Col4x 15.0 ± 1.7 27.4 ± 0.9
(219/5) (219/5)
Cvi2x X Col4x 94.2 ± 0.9 13.5 ± 0.4
(325/8) (104/3)
Kas2x X Col4x 14.4 ± 2.2 30.9 ± 1.3
(266/6) (89/3)
RLD2x X Col4x 80.3 ± 1.8 12.8 ± 0.8
(521/10) (245/5)
Table 4.6: Quantifying the impact on seed development of in intra-
ecotype [2x ecotypeX4xCol] crosses in A. thaliana. Two measures were
used: frequency of shrivelled seeds and the mean individual seed weight. se =
standard error of the mean.
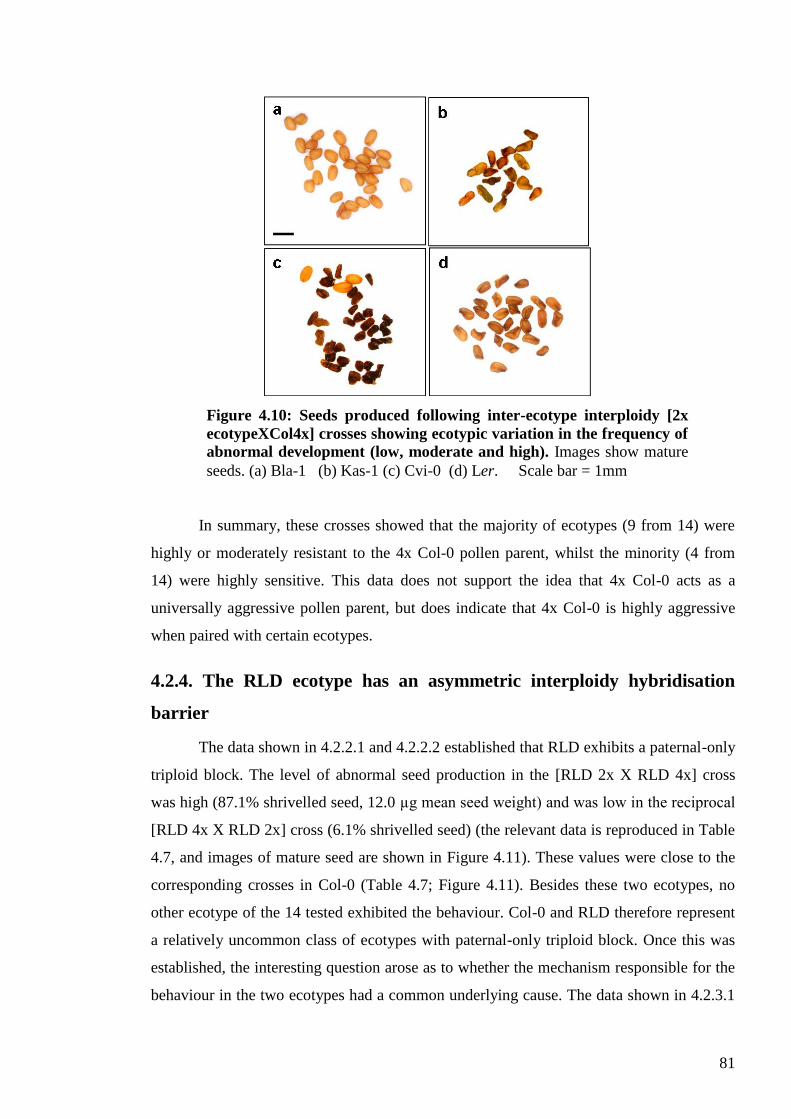
81
In summary, these crosses showed that the majority of ecotypes (9 from 14) were
highly or moderately resistant to the 4x Col-0 pollen parent, whilst the minority (4 from
14) were highly sensitive. This data does not support the idea that 4x Col-0 acts as a
universally aggressive pollen parent, but does indicate that 4x Col-0 is highly aggressive
when paired with certain ecotypes.
4.2.4. The RLD ecotype has an asymmetric interploidy hybridisation
barrier
The data shown in 4.2.2.1 and 4.2.2.2 established that RLD exhibits a paternal-only
triploid block. The level of abnormal seed production in the [RLD 2x X RLD 4x] cross
was high (87.1% shrivelled seed, 12.0 µg mean seed weight) and was low in the reciprocal
[RLD 4x X RLD 2x] cross (6.1% shrivelled seed) (the relevant data is reproduced in Table
4.7, and images of mature seed are shown in Figure 4.11). These values were close to the
corresponding crosses in Col-0 (Table 4.7; Figure 4.11). Besides these two ecotypes, no
other ecotype of the 14 tested exhibited the behaviour. Col-0 and RLD therefore represent
a relatively uncommon class of ecotypes with paternal-only triploid block. Once this was
established, the interesting question arose as to whether the mechanism responsible for the
behaviour in the two ecotypes had a common underlying cause. The data shown in 4.2.3.1
Figure 4.10: Seeds produced following inter-ecotype interploidy [2x
ecotypeXCol4x] crosses showing ecotypic variation in the frequency of
abnormal development (low, moderate and high). Images show mature
seeds. (a) Bla-1 (b) Kas-1 (c) Cvi-0 (d) Ler. Scale bar = 1mm
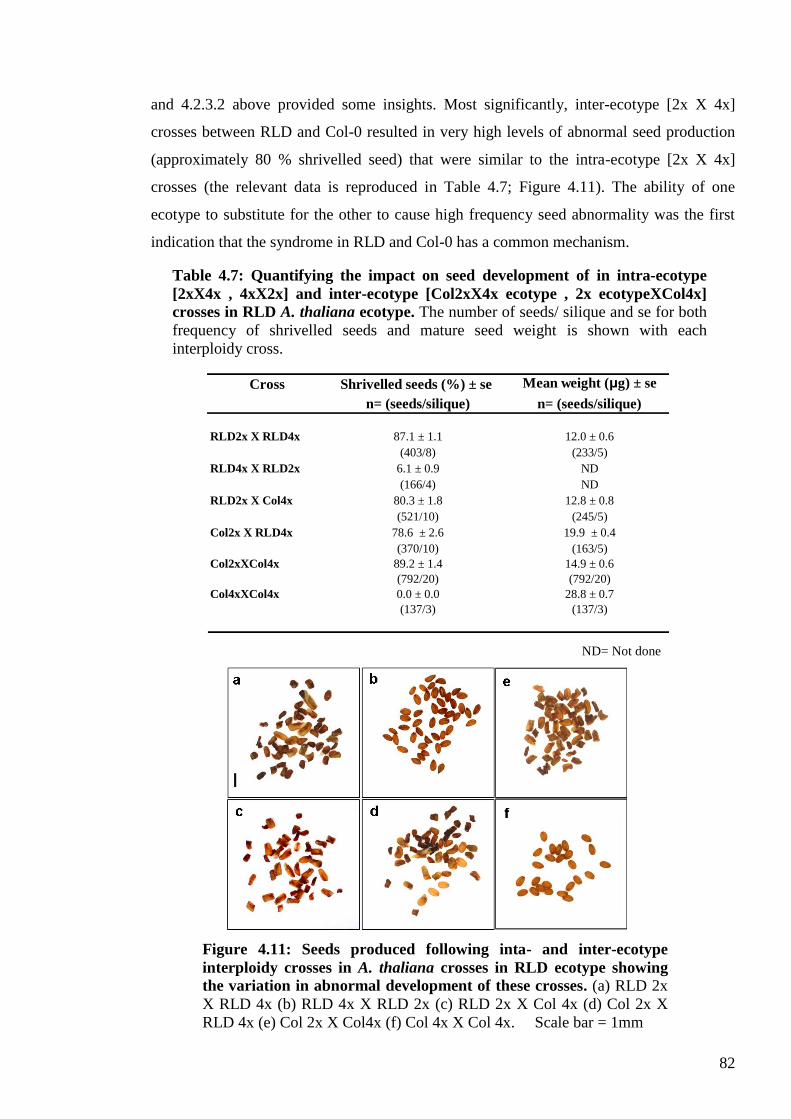
82
and 4.2.3.2 above provided some insights. Most significantly, inter-ecotype [2x X 4x]
crosses between RLD and Col-0 resulted in very high levels of abnormal seed production
(approximately 80 % shrivelled seed) that were similar to the intra-ecotype [2x X 4x]
crosses (the relevant data is reproduced in Table 4.7; Figure 4.11). The ability of one
ecotype to substitute for the other to cause high frequency seed abnormality was the first
indication that the syndrome in RLD and Col-0 has a common mechanism.
ND= Not done
Cross Shrivelled seeds (%) ± se Mean weight (μg) ± se
n= (seeds/silique) n= (seeds/silique)
RLD2x X RLD4x 87.1 ± 1.1 12.0 ± 0.6
(403/8) (233/5)
RLD4x X RLD2x 6.1 ± 0.9 ND
(166/4) ND
RLD2x X Col4x 80.3 ± 1.8 12.8 ± 0.8
(521/10) (245/5)
Col2x X RLD4x 78.6 ± 2.6 19.9 ± 0.4
(370/10) (163/5)
Col2xXCol4x 89.2 ± 1.4 14.9 ± 0.6
(792/20) (792/20)
Col4xXCol4x 0.0 ± 0.0 28.8 ± 0.7
(137/3) (137/3)
Figure 4.11: Seeds produced following inta- and inter-ecotype
interploidy crosses in A. thaliana crosses in RLD ecotype showing
the variation in abnormal development of these crosses. (a) RLD 2x
X RLD 4x (b) RLD 4x X RLD 2x (c) RLD 2x X Col 4x (d) Col 2x X
RLD 4x (e) Col 2x X Col4x (f) Col 4x X Col 4x. Scale bar = 1mm
Table 4.7: Quantifying the impact on seed development of in intra-ecotype
[2xX4x , 4xX2x] and inter-ecotype [Col2xX4x ecotype , 2x ecotypeXCol4x]
crosses in RLD A. thaliana ecotype. The number of seeds/ silique and se for both
frequency of shrivelled seeds and mature seed weight is shown with each
interploidy cross.
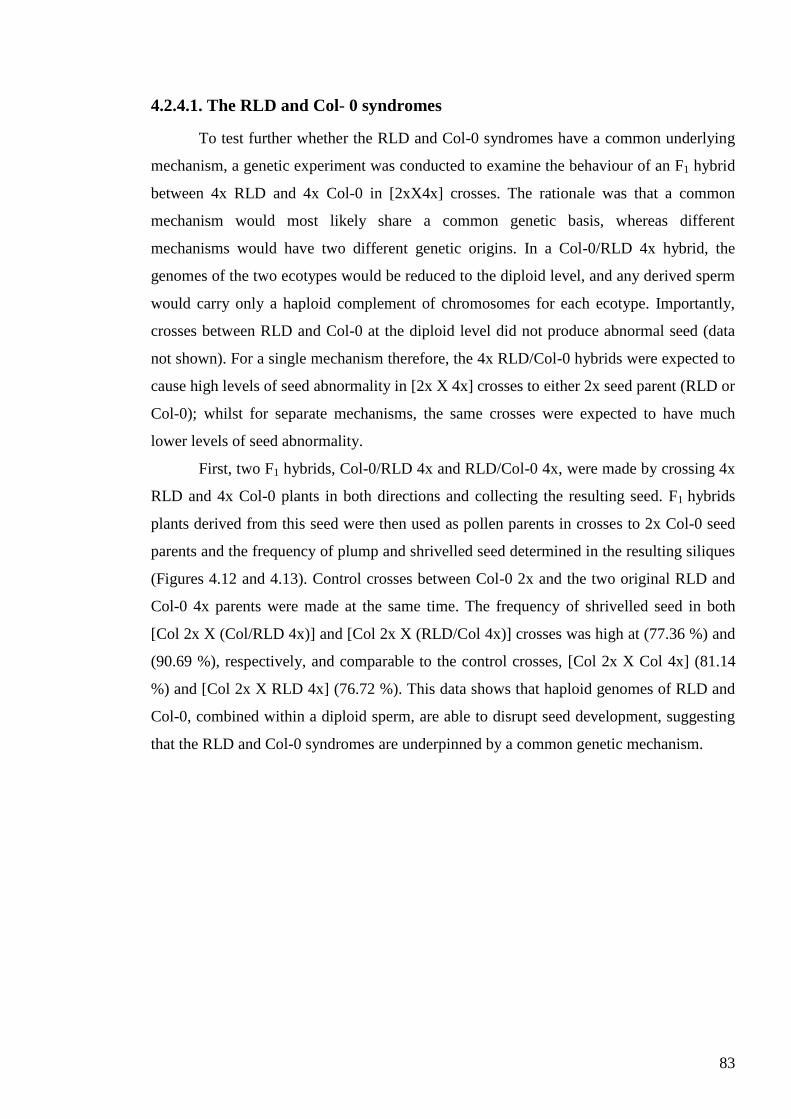
83
4.2.4.1. The RLD and Col- 0 syndromes
To test further whether the RLD and Col-0 syndromes have a common underlying
mechanism, a genetic experiment was conducted to examine the behaviour of an F1 hybrid
between 4x RLD and 4x Col-0 in [2xX4x] crosses. The rationale was that a common
mechanism would most likely share a common genetic basis, whereas different
mechanisms would have two different genetic origins. In a Col-0/RLD 4x hybrid, the
genomes of the two ecotypes would be reduced to the diploid level, and any derived sperm
would carry only a haploid complement of chromosomes for each ecotype. Importantly,
crosses between RLD and Col-0 at the diploid level did not produce abnormal seed (data
not shown). For a single mechanism therefore, the 4x RLD/Col-0 hybrids were expected to
cause high levels of seed abnormality in [2x X 4x] crosses to either 2x seed parent (RLD or
Col-0); whilst for separate mechanisms, the same crosses were expected to have much
lower levels of seed abnormality.
First, two F1 hybrids, Col-0/RLD 4x and RLD/Col-0 4x, were made by crossing 4x
RLD and 4x Col-0 plants in both directions and collecting the resulting seed. F1 hybrids
plants derived from this seed were then used as pollen parents in crosses to 2x Col-0 seed
parents and the frequency of plump and shrivelled seed determined in the resulting siliques
(Figures 4.12 and 4.13). Control crosses between Col-0 2x and the two original RLD and
Col-0 4x parents were made at the same time. The frequency of shrivelled seed in both
[Col 2x X (Col/RLD 4x)] and [Col 2x X (RLD/Col 4x)] crosses was high at (77.36 %) and
(90.69 %), respectively, and comparable to the control crosses, [Col 2x X Col 4x] (81.14
%) and [Col 2x X RLD 4x] (76.72 %). This data shows that haploid genomes of RLD and
Col-0, combined within a diploid sperm, are able to disrupt seed development, suggesting
that the RLD and Col-0 syndromes are underpinned by a common genetic mechanism.
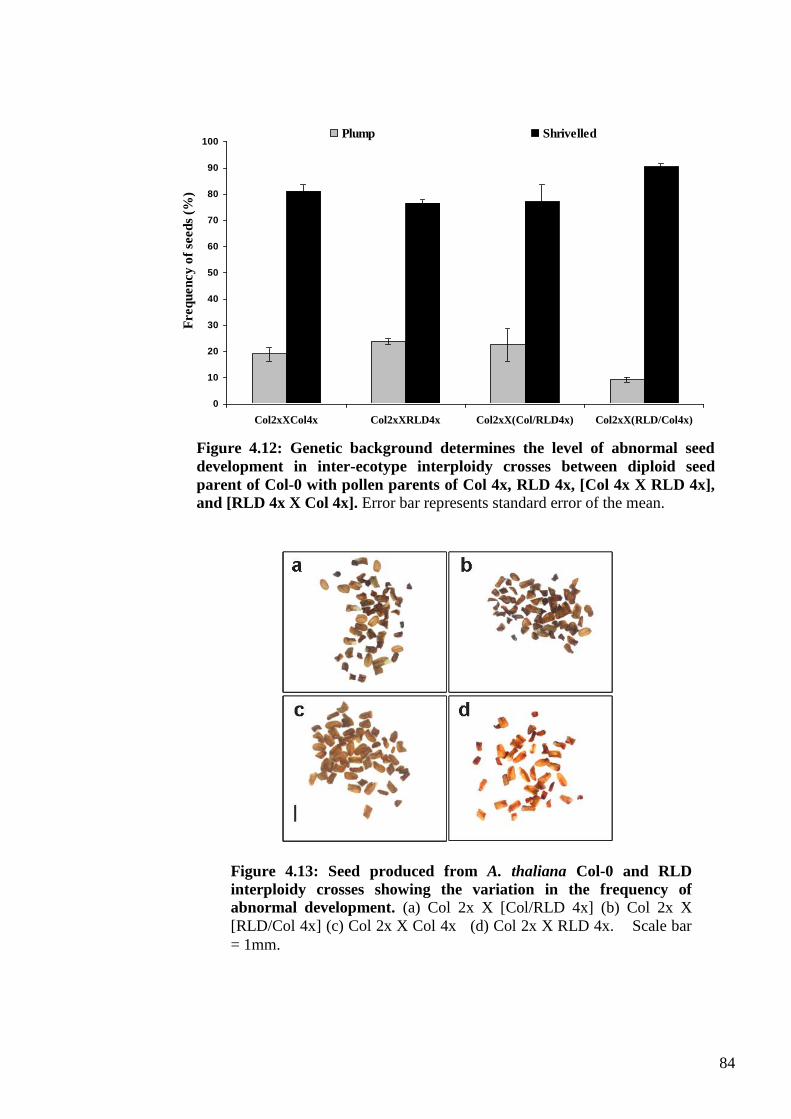
84
0
10
20
30
40
50
60
70
80
90
100
Col2xXCol4x Col2xXRLD4x Col2xX(Col/RLD4x) Col2xX(RLD/Col4x)
Freq
uen
cy
of
seed
s (%
)
Plump Shrivelled
Figure 4.12: Genetic background determines the level of abnormal seed
development in inter-ecotype interploidy crosses between diploid seed
parent of Col-0 with pollen parents of Col 4x, RLD 4x, [Col 4x X RLD 4x],
and [RLD 4x X Col 4x]. Error bar represents standard error of the mean.
Figure 4.13: Seed produced from A. thaliana Col-0 and RLD
interploidy crosses showing the variation in the frequency of
abnormal development. (a) Col 2x X [Col/RLD 4x] (b) Col 2x X
[RLD/Col 4x] (c) Col 2x X Col 4x (d) Col 2x X RLD 4x. Scale bar
= 1mm.
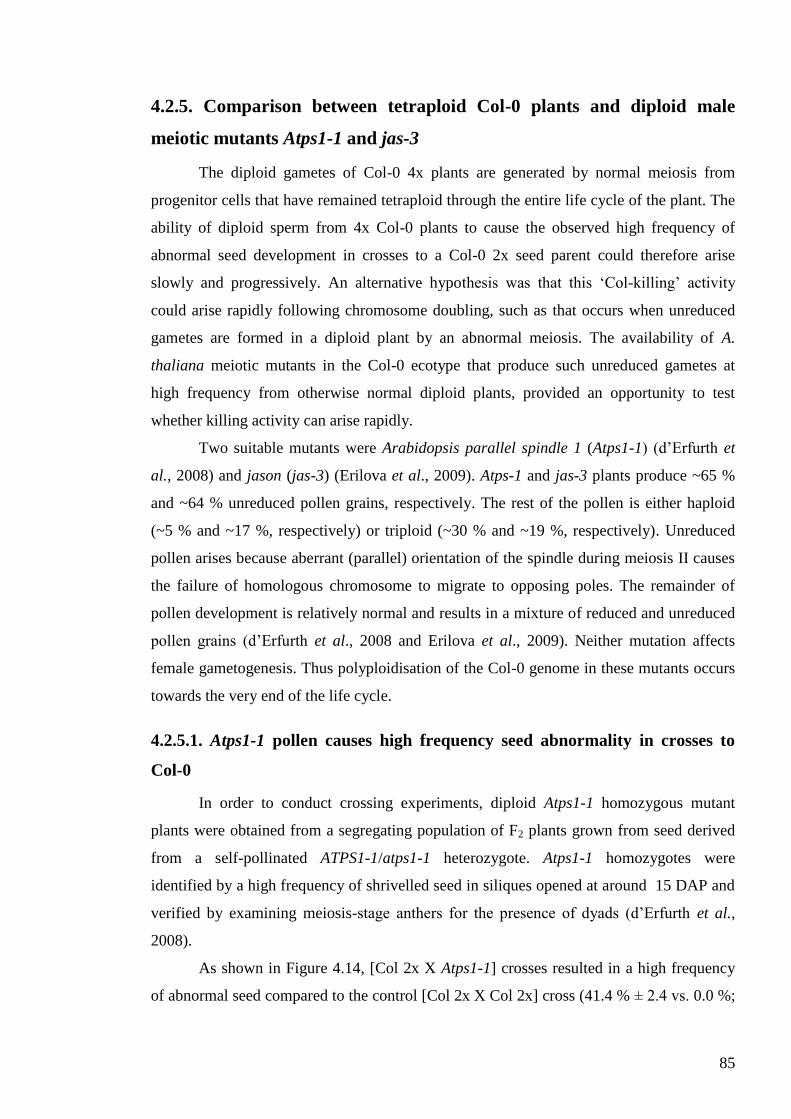
85
4.2.5. Comparison between tetraploid Col-0 plants and diploid male
meiotic mutants Atps1-1 and jas-3
The diploid gametes of Col-0 4x plants are generated by normal meiosis from
progenitor cells that have remained tetraploid through the entire life cycle of the plant. The
ability of diploid sperm from 4x Col-0 plants to cause the observed high frequency of
abnormal seed development in crosses to a Col-0 2x seed parent could therefore arise
slowly and progressively. An alternative hypothesis was that this ‗Col-killing‘ activity
could arise rapidly following chromosome doubling, such as that occurs when unreduced
gametes are formed in a diploid plant by an abnormal meiosis. The availability of A.
thaliana meiotic mutants in the Col-0 ecotype that produce such unreduced gametes at
high frequency from otherwise normal diploid plants, provided an opportunity to test
whether killing activity can arise rapidly.
Two suitable mutants were Arabidopsis parallel spindle 1 (Atps1-1) (d‘Erfurth et
al., 2008) and jason (jas-3) (Erilova et al., 2009). Atps-1 and jas-3 plants produce ~65 %
and ~64 % unreduced pollen grains, respectively. The rest of the pollen is either haploid
(~5 % and ~17 %, respectively) or triploid (~30 % and ~19 %, respectively). Unreduced
pollen arises because aberrant (parallel) orientation of the spindle during meiosis II causes
the failure of homologous chromosome to migrate to opposing poles. The remainder of
pollen development is relatively normal and results in a mixture of reduced and unreduced
pollen grains (d‘Erfurth et al., 2008 and Erilova et al., 2009). Neither mutation affects
female gametogenesis. Thus polyploidisation of the Col-0 genome in these mutants occurs
towards the very end of the life cycle.
4.2.5.1. Atps1-1 pollen causes high frequency seed abnormality in crosses to
Col-0
In order to conduct crossing experiments, diploid Atps1-1 homozygous mutant
plants were obtained from a segregating population of F2 plants grown from seed derived
from a self-pollinated ATPS1-1/atps1-1 heterozygote. Atps1-1 homozygotes were
identified by a high frequency of shrivelled seed in siliques opened at around 15 DAP and
verified by examining meiosis-stage anthers for the presence of dyads (d‘Erfurth et al.,
2008).
As shown in Figure 4.14, [Col 2x X Atps1-1] crosses resulted in a high frequency
of abnormal seed compared to the control [Col 2x X Col 2x] cross (41.4 % ± 2.4 vs. 0.0 %;
86
Student‘s t-test, p < 0.001). Figure 4.14 also shows that this level of abnormal seed was
50% of that produced in the [Col 2x X Col 4x] cross. However, as outlined above, only
~65 % of pollen produced by an Atps1-1 plant is diploid and therefore potentially capable
of causing Col-killing. Thus, the frequency of diploid pollen in Atps1-1 (~65 %) closely
matched the frequency of abnormal seed (41.4 %) in the [Col 2x X Atps1-1] cross.
The abnormal seeds produced by the [Col 2x X Atps1-1] cross (Figure 4.16a) were
large and irregularly shaped and morphologically similar to [Col 2x X Col 4x] seed (Figure
4.16c), suggesting that Atps1-1 and Col 4x pollen cause abnormal seed production via the
same or a similar mechanism. Since the common factor between Atps1-1 and Col-0 4x
plants is the production of diploid sperm, the data above strongly suggests that the
unreduced sperm of Atps1-1 have Col-killing activity, and that this appears rapidly in
diploid sperm.
4.2.5.2. jas-3 pollen also causes elevated levels of abnormal seed production in
crosses with Col-0
Homozygous jas-3 plants were produced as described for Atps1-1 above, and used
in the same series of crosses. The [Col 2x X jas-3] cross resulted in a significantly
0
10
20
30
40
50
60
70
90
80
100
Fre
qu
en
cy o
f se
eds
(%)
Plump Shrivelled
Col 2x X Col 4x Col 2x X Atps1-1Col 2x X Col 2x
0
10
20
30
40
50
60
70
90
80
100
Fre
qu
en
cy o
f se
eds
(%)
PlumpPlump ShrivelledShrivelled
Col 2x X Col 4x Col 2x X Atps1-1Col 2x X Col 2x
Figure 4.14: Atps1-1 results in a high frequency of abnormal seed abortion
as a pollen parent in crosses to a diploid Col-0 seed parent. n = 9 siliques
Error bar represents standard error of the mean
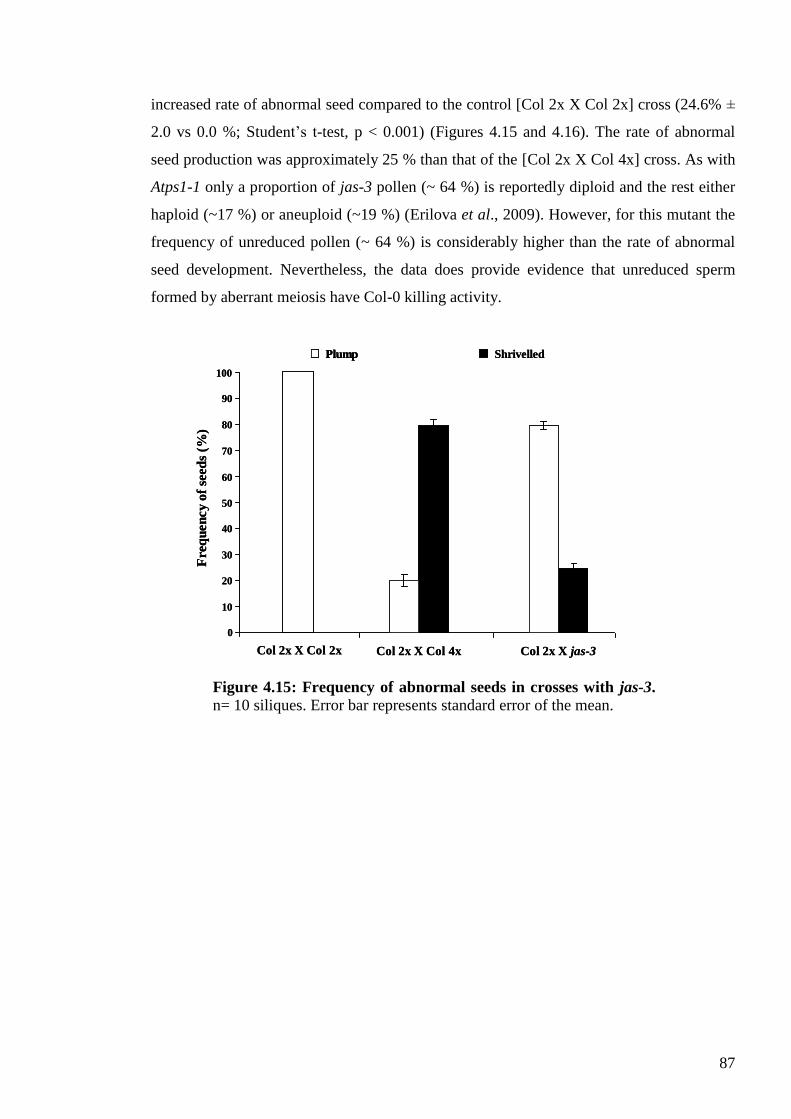
87
increased rate of abnormal seed compared to the control [Col 2x X Col 2x] cross (24.6% ±
2.0 vs 0.0 %; Student‘s t-test, p < 0.001) (Figures 4.15 and 4.16). The rate of abnormal
seed production was approximately 25 % than that of the [Col 2x X Col 4x] cross. As with
Atps1-1 only a proportion of jas-3 pollen (~ 64 %) is reportedly diploid and the rest either
haploid (~17 %) or aneuploid (~19 %) (Erilova et al., 2009). However, for this mutant the
frequency of unreduced pollen (~ 64 %) is considerably higher than the rate of abnormal
seed development. Nevertheless, the data does provide evidence that unreduced sperm
formed by aberrant meiosis have Col-0 killing activity.
0
10
20
30
40
50
60
70
90
80
100
Fre
qu
en
cy o
f se
eds
(%)
Plump Shrivelled
Col 2x X Col 4x Col 2x X jas-3Col 2x X Col 2x
0
10
20
30
40
50
60
70
90
80
100
Fre
qu
en
cy o
f se
eds
(%)
PlumpPlump Shrivelled
Col 2x X Col 4x Col 2x X jas-3Col 2x X Col 2x
Figure 4.15: Frequency of abnormal seeds in crosses with jas-3.
n= 10 siliques. Error bar represents standard error of the mean.
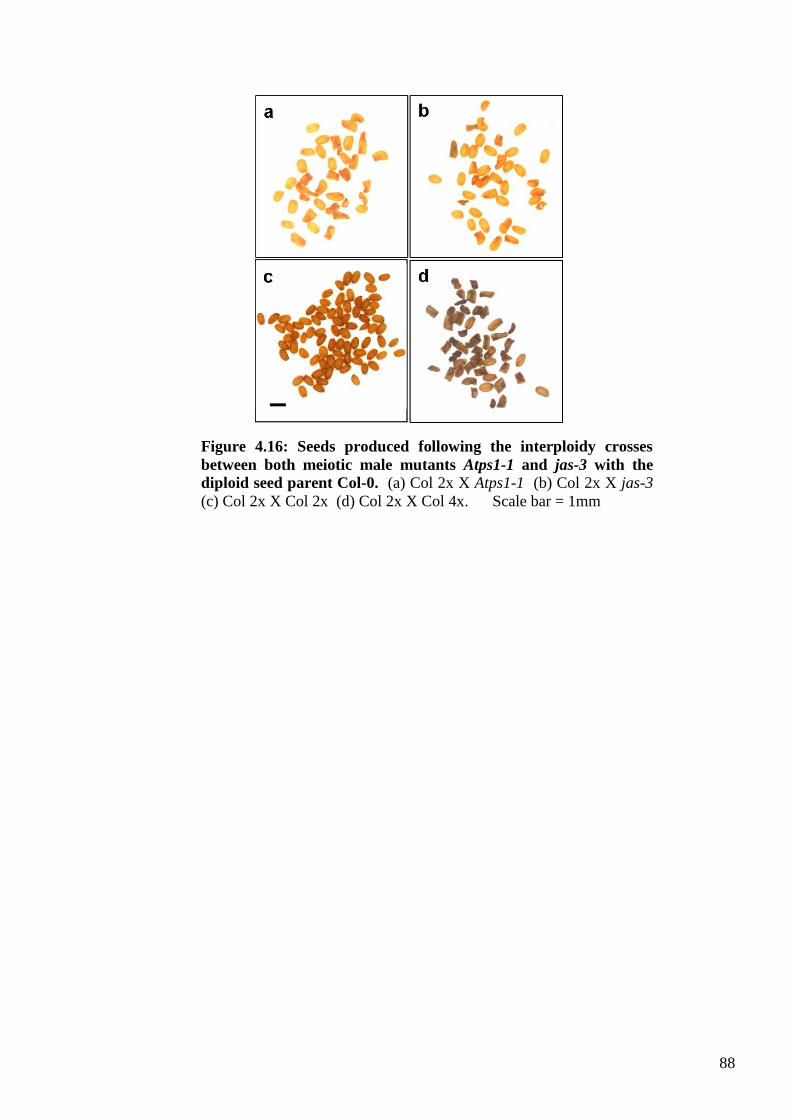
88
Figure 4.16: Seeds produced following the interploidy crosses
between both meiotic male mutants Atps1-1 and jas-3 with the
diploid seed parent Col-0. (a) Col 2x X Atps1-1 (b) Col 2x X jas-3
(c) Col 2x X Col 2x (d) Col 2x X Col 4x. Scale bar = 1mm
89
4.3. Discussion
Several mechanisms minimize gene flow between species and contribute to
their reproductive isolation (Gutierrez-Marcos et al., 2003; Rieseberg and Blackman,
2010). One class of mechanism termed a postzygotic hybridisation barrier acts within the
seed following fertilisation (Bushell et al., 2003). Soltis et al., (2007) stated that these
barriers have been proposed as one of the main mechanisms that drive the process of
speciation by shifting the ploidy of individuals. Speciation itself depends on the
establishment of reproductive barriers that allow populations to diverge from each other
(Josefsson et al., 2006). Indeed variability in postzygotic barriers or speciation mechanisms
exist within the same species or between different species to provide the raw material for
speciation (Ramsey and Schemske, 1998; Leblanc et al., 2002, and Dilkes et al., 2008).
The work reported in this chapter represents a preliminary investigation into the genetic
mechanisms responsible for variation in the lethality of interploidy crosses in A. thaliana.
The objective was to improve our understanding of this type of postzygotic hybridisation
barrier, and ultimately identify genes that underpin the phenomenon.
4.3.1. The behaviour of tetraploid Col-0
It has been shown previously that in A. thaliana, reciprocal crosses between diploid
and tetraploid plants resulted in dramatic and reciprocal differences in seed size, but very
low levels of seed lethality (Scott et al., 1998a). However, this study was restricted to only
two ecotypes, namely C24 and Ler. More recently, Dilkes et al., (2008) showed that for
Col-0 this pattern was true for the [4x X 2x] cross, but the reciprocal [2x X 4x] resulted in
very high levels of seed lethality (Figure 4.1). Thus Col-0 possessed what can be described
as an asymmetric paternal-only postzygotic hybridisation barrier. In fact, Redei (1964) had
much earlier described a similar outcome for reciprocal crosses between an A. thaliana
diploid ‗genotype‘ ‗W‘ and its autotetraploid ‗K-16‘. In this case, the two crosses, [K-16
(4x) X W (2x)] and [W (2x) and K-16 (4x)], produced 7.4% and 97.3% abnormal
(misshapen or shrivelled) seeds, respectively. George Redei (USA) confirmed the ‗W‘
genotype as the Columbia ecotype in a personal communication to Rod Scott, University
of Bath.
In cell biological terms, the different behaviours of C24, Ler and Col-0 in [2x
X4x] crosses appears to depend on endosperm cellularisation: C24 and Ler endosperms
cellularise, whereas in Col-0 cellularisation rarely occurs in a [2x X 4x] cross (Dilkes et
90
al., 2008). Excessive proliferation and failure to cellularise are common features of
endosperm development in species with postzygotic hybrisation barriers, including those
triggered by interploidy crosses (Jansky, 2005). Thus, [2x X 4x] crosses in Col-0 are
representative of the situation in many plant species, making this ecotype potentially useful
in identifying and dissecting the mechanisms underlying postzygotic barriers.
4.3.2. Parent-of-origin effects in intra and inter-ecotype crosses
Many researchers have stated that the result of both inter-ecotype and interspecific
crosses can be manipulated by changing the ploidy of the crossing partners (reviewed by
Köhler et al., 2010). The developed seeds resulting from intra-and inter-ecotype crosses
discussed here incorporate genomes that differ in parent-of-origin. However, the
interaction between genomes in both the seed and any resulting hybrid plant may be
affected by this difference.
In interploidy crosses, seed abortion could be attributed to different factors such as:
negative interaction between products of evolutionarily diverged gene sequences
(Rieseberg and Carney, 1998), widespread changes to genome structure or gene expression
(Rieseberg and Carney, 1998; Bushell et al., 2003), and imbalances between the effects of
uniparentally expressed genes (genomic imprinting) (Haig and Westoby, 1991), either
because of ploidy imbalance or divergence in gene expression patterns (Bushell et al.,
2003). The analyses presented in section 4.2.2 of [2x X 4x] and [4x X 2x] crosses within
14 different A. thaliana ecotype, including Col-0, provided several important findings with
respect to the impact of interploidy crosses on seed size and viability in this species. First,
all [4x X 2x] and [2x X 4x] intra-ecotype crosses resulted in parent-of-origin effects on
seed size, seed viability, or both (Tables 4.3 and 4.4). For each ecotype, [4x X 2x] seed
was substantially smaller than its [2x X 2x] seed, and the frequency of shrivelled seed was
low (> 15%); (Tables 4.2 and 4.4). Scott et al., (1998a) described similar outcomes for [4x
X 2x] crosses in the ecotypes C24 and Ler. Thus, the data strongly suggest that A. thaliana
as a species responds to moderate maternal genomic excess (4m: 1p) in the endosperm by
producing relatively small but viable seed. By extension, A. thaliana appears not to have
maternal triploid block.
The behaviour of [2x X 4x] crosses was more complex. The majority of ecotypes
displayed a typical parent-of-origin effect on seed phenotype: the seed was substantially
larger than the [2x X 2x] control crosses and mostly plump. In contrast, RLD [2x X 4x]
crosses resulted in the similarly high level of abnormal seed production as [2x X 4x] Col-0
91
crosses. As discussed above, both of these ecotypes produced low levels of abnormal seed
in the reciprocal [4x X 2x] cross. Thus, RLD possesses a paternal-only triploid block
similar to that observed in Col-0 (Dilkes et al., 2008). Collectively then, 2 of the 14
ecotypes tested have this type of block, representing a frequency of 14% of A. thaliana
ecotypes. Thus genetic variation for triploid block occurs in A. thaliana, but a larger
number of ecotypes should be tested before drawing firm conclusions about prevalence.
4.3.2.1. The Col-syndrome: weak mother or aggressive father
Two scenarios were considered that might explain the Col-syndrome: either the
maternal parent is weak or submissive to an otherwise normal diploid paternal parent, or
the diploid genome of the paternal parent is unusually aggressive and the maternal parent
normal. This ‗weak‘ mother or ‗strong‘ father idea was investigated in two crossing
experiments (4.2.3). In the first, the 2x Col-0 seed parent was crossed to the panel of 4x
ecotypes, to test whether Col-0 represents a weak mother (4.2.3.1). In the second, 4x Col-0
was used a pollen parent in crosses to the panel of 2x ecotypes, to test whether Col-0 is a
strong father (4.2.3.2). The resulting data provided little support for the weak mother idea
since, with one exception, the levels of shrivelled seed production were low in the [Col-0
2x X ecotype 4x] crosses. The exception was RLD, which resulted a high frequency of
shrivelled seed that was comparable to a [Col 2x X Col 4x] cross. The behaviour of this
ecotype is discussed further below (4.3.3).
In contrast, the crossing data did suggest that 4x Col-0 can behave as a strong
father: crosses to 4 ecotypes (C24, Per, Cvi and RLD) resulted in high levels (>70%) of
abnormal seed and a further 2 ecotypes (Ler and Stw) produced moderate levels (>40%) of
abnormal seed. However, 50% (7 from 14) of the ecotypes tested produced very low levels
of abnormal seed. Thus, 4x Col-0 is not a universally aggressive pollen parent, but is
highly aggressive when paired with certain ecotypes.
Interestingly, with the exception of RLD, the response of an ecotype to a 4x Col-0
pollen was not linked to its response to its own autotetraploid in [2x X 4x] crosses. The
data presented in 4.2.2.1 clearly showed that only Col-0 and RLD [2x X 4x] intra-ecotype
crosses resulted in high levels of abnormal seed. Thus, a seed parent capable of
successfully resisting lethal endosperm disruption when crossed to its own autotetaploid
fails to do so when crossed to 4x Col-0.
This above indicates that the interaction between Col-0 and other ecotypes is highly
specific, but few clues as the nature of the underlying processes. One possibility however,
92
is that mis- or over-expression of one or a few genes involved in regulating endosperm
development might be sufficient to cause endosperm failure. Dilkes et al., (2008) showed
that seed abortion in [Col 2x X Col 4x] crosses was most likely caused by the absence or
mistiming of endosperm cellularisation.
Köhler et al., (2010) showed that any change in the ratio of two maternal to one
paternal genomes (2m:1p) such as [2x X 4x] cross in the endosperm might cause
endosperm failure in interploidy crosses and the developed seeds usually abort. This is
because the endosperm supports development of the embryo by providing nutrients and
signals for its growth (Lopes and Larkins, 1993) and is important for viable seed formation
(Costa, 2004). However, increasing the contributions of maternal and paternal genomes has
opposite effects: 1) Increasing maternal genomes inhibits endosperm proliferation, 2)
Increasing paternal genomes causes excess of the endosperm (Scott et al., 1998a).
Moreover, there is a differential dosage effect of maternal and paternal factors on
endosperm development (Haig and Westoby, 1991). Several possibilities could account for
this effect, including the unbalanced maternal contribution to the endosperm (Scott et al.,
1998a). Another explanation would be related to the genomic imprinting (Lin, 1984; Haig
and Westoby, 1991) because the imprinted genes are differentially marked in the gametes,
rendering different function for both maternal and paternal chromosomes (Feil and Berger,
2007).
The MADS box transcription factor AGL62 promotes endosperm proliferation at
the expense of cellularisation in A. thaliana, (Kang et al., 2008). The mis-expression of
AGL62 or a similar regulatory gene, could delay endosperm cellularisation and cause seed
failure in interploidy crosses. Such mis-expression could result from general genomic
incompatibility (Kang et al., 2008), or more specific causes such as the maternal genome
failing to limit or counter the expression of genes such as AGL62 from the paternal genome
(Walia et al., 2009). Additionally, Dilkes and Comai, (2004) stated that postzygotic
lethality of interspecies hybrids can results from differences in gene expression, copy
number, or coding sequence and can be overcome by altering parental genome dosage
(Josefsson et al., 2006).
4.3.3. Do RLD and Col-0 share the same syndrome?
As discussed earlier, RLD was the only newly tested ecotype to behave like Col-0
in reciprocal diploid-tetraploid crosses (4.2.2.1 and 4.2.2.2). This revealed that RLD has
paternal-only triploid block. Once established, the question was addressed as to whether
93
the mechanism responsible for the behaviour in the two ecotypes had a common
underlying cause (4.2.4.1).
Inter-ecotype reciprocal crosses had already established that substituting Col-0 and
RLD one for the other resulted in the same outcomes as intra-ecotype crosses (4.2.3.1 and
4.2.3.2). This suggested that the syndrome in the two ecotypes has a common cause. This
was subjected to a genetic test by examining the behaviour of an F1 hybrid between 4x
RLD and 4x Col-0 in [2x X 4x] crosses. Meiosis II in the hybrid would produce diploid
sperm containing only a single haploid chromosome complement of the two parental
ecotypes. Since haploid sperm do not affect seed development, the ability of the diploid
hybrid sperm to cause high levels of abnormal seed production in crosses to 2x Col-0
would be evidence of a shared genetic basis. In the event, this was the case (4.2.4.1): the 4x
RLD/Col-0 F1 hybrids caused abnormal seed development at the roughly the same
frequency as the original 4x parents. This suggests that the RLD and Col-0 syndromes are
underpinned by a common genetic mechanism.
Until now there are no clear similarities in the genetic behaviour, environmental
conditions, geographical location, disease resistance, etc. in both Col-0 and RLD ecotypes.
However, RLD have been usefully used in some Arabidopsis biological researches such as
disease resistance (Kwon et al., 2004), downy mildew resistance (Joos et al., 1996), and
imprinting (Kinoshita et al., 1999).
4.3.3.1. The Col-0/RLD syndrome - potential mechanisms
In both Col-0 and RLD, [2x X 2x] and [4x X 4x] crosses produce only very low
levels of shrivelled seed. Like wise [4x X 2x] crosses. However, for both ecotypes the [2x
X 4x] cross results in >80% shrivelled seed. This is the Col-0/RLD syndrome: an
asymmetric postzygotic hybridisation barrier. Any explanation of the syndrome must
therefore account for this asymmetry, and in particular that 1) a diploid sperm is disruptive
to seed development in a [2x X 4x] cross but not in a [4x X 4x] cross, 2) a haploid sperm is
not disruptive, and 3) diploid maternal gametes in Col-0 do not maternalize seeds more
than those of other ecotypes in [4x X 2x] crosses.
How might this asymmetry arise? Various studies have shown that polyploid
formation can result in genomic rearrangements, epigenetic alterations to DNA and
changes in gene expression patterns (Song et al., 1995; Weiss and Maluszynska, 2000;
Comai et al., 2000; Kashkush et al., 2002; Osborne et al., 2003). The genomic differences
that occur when a plant becomes a tetraploid could have different consequences for
94
maternal and paternal gametes, and therefore explain the behaviour of diploid gametes in
Col-0 and RLD. Mega- and micro-gametogenesis are different in a several ways, including
the number of mitosis prior to gamete formation (Scott and Spielman, 2006), the extent of
chromatin condensation (Valencia, 1982), development of the surrounding sporophytic
tissues (Grossniklaus and Schneitz, 1998; Simao et al., 2007), molecular and genetic basis
of cell specification and differentiation (Grossniklaus and Schneitz, 1998). It is possible
therefore that the polyploidisation–induced alterations to DNA structure could impact the
two genders of gametes differently.
4.3.4. Chromosome doubling vs non-reduction
As discussed above, the Col/RLD syndrome might be a consequence of a sex-
specific difference in the response to genomic changes that can accompany genome
doubling. When tetraploids are formed by colchicine treatment, genome doubling and any
associated genome changes occur in somatic cells well before the onset of gametogenesis.
However, the most common route to polyploidisation, which occurs in many taxa, is via
unreduced gametes that retain the somatic chromosome number (n=2n) (Ramsey and
Schemske, 1998; Köhler et al., 2010). In these cases, diploid gametes usually result from
the failure of meiosis to half the chromosome number, rather than as a consequence of
doubling somatic chromosome number. In interesting question therefore, was whether the
killing activity of Col/RLD sperm flows only from doubling somatic chromosome
doubling, or can it also arise following a failure to reduce chromosome number? A related
question was whether the mechanism acts slowly or rapidly following either trigger. The
answer has implications for both understanding the mechanism underpinning the Col/RLD
syndrome and postzygotic hybridisation barriers, and the role played by polyploidisation in
reproduction isolation.
The A. thaliana (Col-0) mutants Atps-1 and jas-3 produce unreduced pollen grains
at high frequency due to faulty meiosis II (d‘Erfurth et al., 2008; Erilova et al., 2009). Any
Col-killing activity would therefore have to arise rapidly (after meiosis II) and as a
consequence of failed reduction. Both mutants caused triploid block when used as pollen
parents with a 2x Col-0 seed parent (4.2.5). In the case of Atps-1, the frequency of
shrivelled seeds was almost equal to the frequency of diploid pollen grains, indicating that
diploid sperm formed by non-reduction in this Atps-1and chromosome-doubling in a
tetraploid are similarly disruptive to endosperm development. The data also shows that the
disruptive activity arises very rapidly in Atps-1, since there are only two mitosis between
95
meiosis II, when non-reduction occurs, and fertilisation. However, more data is needed to
determine whether the disruptive activity in tetraploids also appears rapidly or involves the
same mechanism.
4.4. Conclusion
The data presented in this chapter revealed limited genetic variation among A.
thaliana ecotypes for triploid block. From a total of 14 ecotypes only two, Col-0 and RLD,
displayed triploid block, which was asymmetric in being restricted to the paternal
tetraploid. Genetic analysis indicated that Col-0 and RLD triploid block probably operate
through a common mechanism, since a tetraploid Col-0/RLD F1 hybrid induced the same
level of triploid block as the individual tetraploids. We focused on studying the ecotype
Col-0 and discovered that a diploid Col-0 is not a‘ weak‘ mother, but that the tetraploid
Col-0 is an aggressive‘ father since a number of ecotypes that resisted their own tetraploid
succumbed to 4x Col-0. We identified variation in F1 lethality in interploidy crosses that
indicated that the maternal parents of some ecotypes suppress F1 lethality caused by Col-0
paternal excess while others do not.
96
Chapter 5
5. The genetics of a maternal modifier
5.1. Introduction
5.1.1. The Tsu-1 maternal modifier of Col-killing
Many flowering plants have the ability to tolerate ploidy changes, but the offspring
of parents with different ploidies levels frequently fail to survive due to highly disrupted
seed development (Dilkes et al., 2008), more details are described in chapter 1 (section
1.3). We investigated this phenomenon in A. thaliana and found ecotype-based obvious
variation in the viability of F1 seed resulting from interploidy crosses, see more details in
chapter 4 (section 4.2.1). The extent of postzygotic seed lethality was most striking in
crosses between a diploid seed parent and a tetraploid pollen parent of the Columbia (Col-
0) ecotype, (4.2.1). However, substituting the Col seed parent with one from other
ecotypes revealed a high degree of variation in the levels of seed lethality (4.2.3.2). Some
ecotypes behaved as Col, suffering similarly high levels of seed lethality, whereas others,
such as C24 and Tsu-1 almost completely resisted Col-killing activity to produce near
100% viable seed. These ecotypes appear to possess maternal ‗modifiers‘ that somehow
resist the Col-killer. This chapter presents the further phenotypic and genetic
characterisation of the Tsu-1 maternal modifier and preliminary efforts to map the gene or
genes responsible.
5.1.2. A. thaliana is useful in studying genetics
Many important traits in plant breeding are controlled by a number of genes that
show continuous variation among progeny (Takahashi et al., 2001). Genetic variation
affects fitness in wild populations adapting to different environments, and phenotypic
plasticity is expected to reflect the genetic variation. Because of naturally occurring
variation among ecotypes in response to environment, A. thaliana has become an important
tool in studying the genetics of plant growth and development (Meinke et al., 1998).
Genetic studies in A. thaliana has also benefited from the development and application of
genetic tools such as an easy to use on-line genome sequence in a database that is
continuously updated as more information is obtained about polymorphisms, gene
97
function, markers, and so on. Moreover, expanding databases of other plant species and
genomes facilitate the application of model plant research to other crop species such as
maize, rice, wheat, and Brassica. Today, the A. thaliana genome sequence and the
associated database also facilitate the process of trait mapping (Lukowitz et al., 2000), in
principal enabling the identification of genes underlying complex phenotypes.
5.1.3. Principles and requirements for genetic mapping
To understand genetic mapping, the first important principle is that genes segregate
during meiosis, thus allowing their analysis in the progeny (Paterson, 1996; Semagn et al.,
2006). According to Mendel‘s second law the chromosomes assort randomly into gametes;
thus the alleles of one gene will segregate independently of second gene (independent
assortment law). Furthermore, where two genes are close to each other on the same
chromosome non-random assortment occurs that indicates linkage (Semagn et al., 2006).
The closer the linkage, the greater the deviation from independent assortment.
To construct a genetic linkage map the following steps are necessary:
Develop a mapping family from two genetically divergent parents and decide the
sample size.
Select suitable markers for the mapping population.
Screen the parents for marker polymorphism, and genotype both parents and
progenies.
Perform linkage analysis using statistically-based programs.
Currently, genetic maps are constructed using different types and sizes of mapping
populations, marker systems, statistical procedures, and computer packages (Ferreira et al.,
2006). However, the efficiency of the mapping process is affected by any of these previous
factors (Liu, 1998). In A. thaliana, which is self pollinating, a mapping family is easily
produced from homozygous inbred parents. Mapping can be conducted in F2 populations,
backcrosses, recombinant inbred lines, doubled haploids, and near isogenic populations
(Doerge, 2002; Collard et al., 2005; Semagn et al., 2006).
Backcross (BC) breeding has been an important tool for plant breeders for more
than 80 years, and with the relatively recent incorporation of transformation as a plant
breeding tool the importance of the backcross method has increased (Briggs and Allard,
1953; Lewis and Kernodle, 2009). Backcrossing allows the plant breeder more precise
control of allele frequencies than other traditional plant breeding methods. In most
98
backcross programs the objective is to recover the recurrent parent basically unchanged
except for the introgression of the new characteristic or underlying gene or genes. In a
backcrossing approach, repeating the process for six generations will produce a BC6
genome that is 99% derived from the recurrent parent (Babu et al., 2004).
5.1.4. Polymorphism identification
In order to construct a linkage map it is necessary to identify DNA markers that
show clear differences between the parents (polymorphic markers). Collard et al., (2005)
showed that there are high levels of DNA polymorphism in cross-pollinating species
compared to inbreeding species. Moreover, mapping in inbreeding species is facilitated by
the selection of distantly related parents. After selecting suitable DNA markers they are
screened across the whole mapping population including the parents in a process called
marker genotyping.
In A. thaliana, the efficient use of genetic markers requires accurate knowledge of
their map position. The first A. thaliana genetic maps were constructed using F2/F3
mapping populations (Koornneef et al., 1983; Chang et al., 1988; Alonso-Blanco et al.,
1998). Additionally, Lister and Dean (1993) created recombinant inbred lines (RILs)
which constitute permanent mapping populations because they are practically homozygous
genotypes and can therefore be multiplied repeatedly enabling any laboratory to use them.
The Lister-Dean RILs were derived from the Columbia and Ler ecotypes; however,
numerous other combinations have been made such as: Ler/Cvi (Alonso-Blanco et al.,
1998) and C24/Col-0 (Törjek et al., 2006).
Numerous different types of marker are used for trait and gene mapping in A.
thaliana. Restriction Fragment Length Polymorphism (RFLP) markers are co-dominant
and very reliable, but can prove laborious to use (Chang et al., 1988 and Alonso-Blanco et
al., 1998). Different methods have been developed to accelerate the analysis of restriction
polymorphisms such as the conversion of RFLP markers into PCR markers called CAPS
(Cleaved Amplified Polymorphic Sequences) (Konieczny and Ausubel, 1993). AFLP
(Amplified Fragment Length Polymorphism) was developed to detect restriction fragments
by PCR amplification without knowledge of the sequence (Vos et al., 1995 and Alonso-
Blanco et al., 1998). Other PCR-based markers include Random Amplified Polymorphic
DNAs (RAPDs) (Reiter et al., 1992) and Simple Sequence Length Polymorphisms
(SSLPs), (Bell and Ecker, 1994).
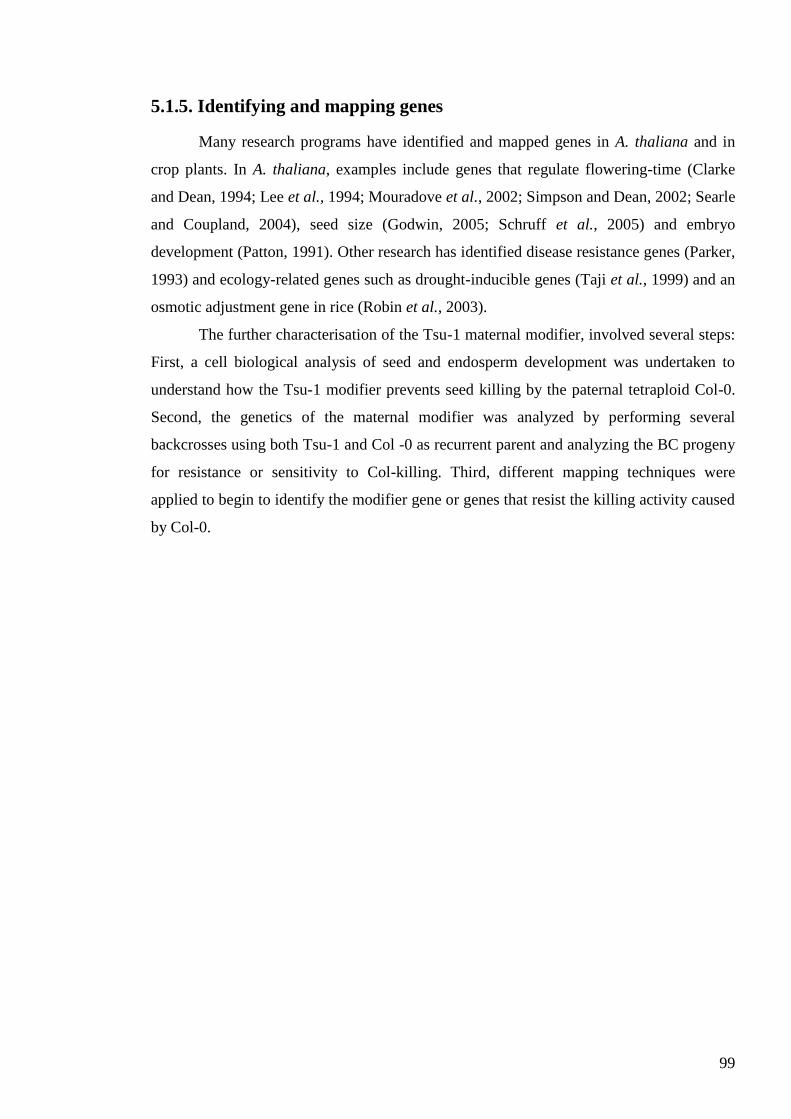
99
5.1.5. Identifying and mapping genes
Many research programs have identified and mapped genes in A. thaliana and in
crop plants. In A. thaliana, examples include genes that regulate flowering-time (Clarke
and Dean, 1994; Lee et al., 1994; Mouradove et al., 2002; Simpson and Dean, 2002; Searle
and Coupland, 2004), seed size (Godwin, 2005; Schruff et al., 2005) and embryo
development (Patton, 1991). Other research has identified disease resistance genes (Parker,
1993) and ecology-related genes such as drought-inducible genes (Taji et al., 1999) and an
osmotic adjustment gene in rice (Robin et al., 2003).
The further characterisation of the Tsu-1 maternal modifier, involved several steps:
First, a cell biological analysis of seed and endosperm development was undertaken to
understand how the Tsu-1 modifier prevents seed killing by the paternal tetraploid Col-0.
Second, the genetics of the maternal modifier was analyzed by performing several
backcrosses using both Tsu-1 and Col -0 as recurrent parent and analyzing the BC progeny
for resistance or sensitivity to Col-killing. Third, different mapping techniques were
applied to begin to identify the modifier gene or genes that resist the killing activity caused
by Col-0.
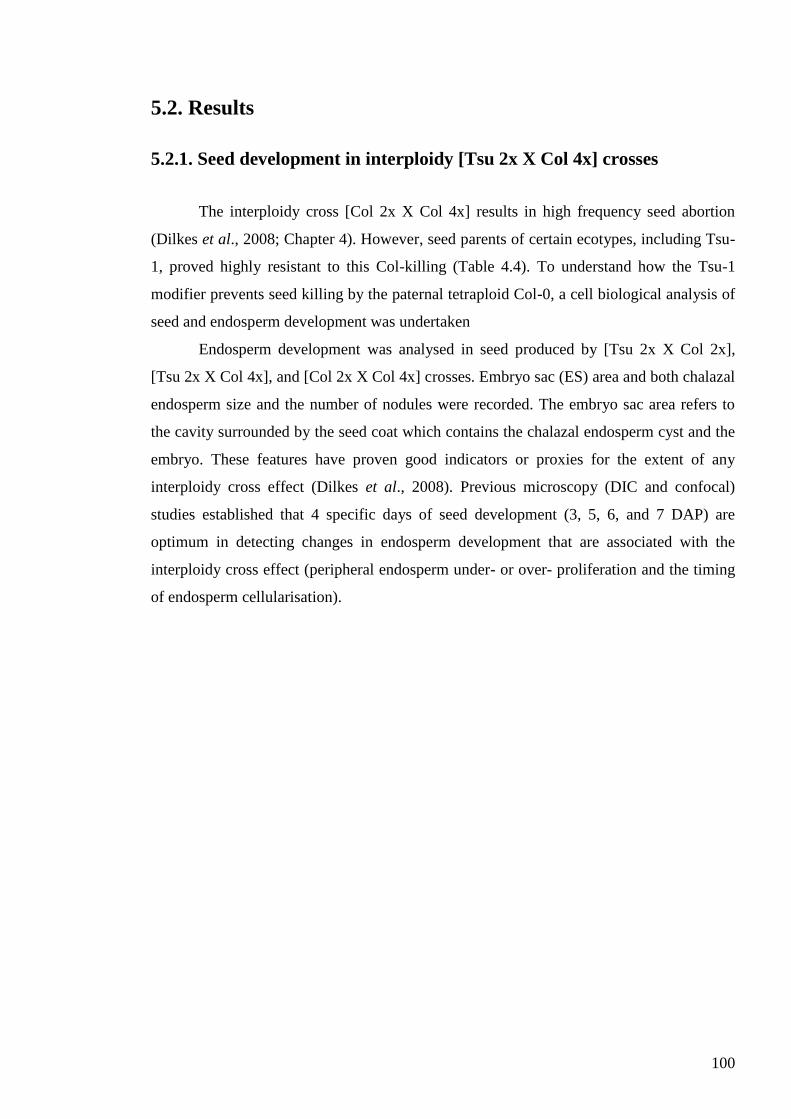
100
5.2. Results
5.2.1. Seed development in interploidy [Tsu 2x X Col 4x] crosses
The interploidy cross [Col 2x X Col 4x] results in high frequency seed abortion
(Dilkes et al., 2008; Chapter 4). However, seed parents of certain ecotypes, including Tsu-
1, proved highly resistant to this Col-killing (Table 4.4). To understand how the Tsu-1
modifier prevents seed killing by the paternal tetraploid Col-0, a cell biological analysis of
seed and endosperm development was undertaken
Endosperm development was analysed in seed produced by [Tsu 2x X Col 2x],
[Tsu 2x X Col 4x], and [Col 2x X Col 4x] crosses. Embryo sac (ES) area and both chalazal
endosperm size and the number of nodules were recorded. The embryo sac area refers to
the cavity surrounded by the seed coat which contains the chalazal endosperm cyst and the
embryo. These features have proven good indicators or proxies for the extent of any
interploidy cross effect (Dilkes et al., 2008). Previous microscopy (DIC and confocal)
studies established that 4 specific days of seed development (3, 5, 6, and 7 DAP) are
optimum in detecting changes in endosperm development that are associated with the
interploidy cross effect (peripheral endosperm under- or over- proliferation and the timing
of endosperm cellularisation).
101
a c
d
g h i
j k l
3 DAP
5 DAP
6 DAP
7 DAP
Tsu 2x X Col 2x Tsu 2x X Col 4x Col 2x X Col 4x
b
e f
ES
E
CE
N
Figure 5.1: Seed development in inter-ecotype Tsu-1 and Col-0
crosses. Confocal photomicrographs of developing seeds from the inter-
ecotype [Tsu 2x X Col 2x , Tsu 2x X Col 4x] and intra-ecotype [Col 2x
X Col 4x] interploidy crosses are shown at 3, 5, 6, and 7 DAP. All the
seeds are oriented with the embryo on the left and chalazal endosperm to
the right. Scale bar = 100 µm
ES= embryo sac, E= embryo, CE= chalazal endosperm, N= nodules
102
5.2.1.1. Embryo sac area
Embryo sac area measurements were taken from 20-22 cleared whole-mount seeds
at 3, 5, 6, and 7 DAP (Figures 5.1 and 5.2). At 3 and 5 DAP there were no significant
differences in the embryo sac area of seeds produced by the three crosses. In contrast, at 6
and 7 DAP the embryo sac area of [Col 2x X Col 4x] seed was larger (116076 μm2
± 2392,
P < 0.001 and 129258 μm2
± 4458, P < 0.001, respectively) than that of both the [Tsu 2x X
Col 2x] and [Tsu 2x X Col 4x] cross. This data indicates that the Tsu-1 seed parent restricts
over-proliferation of the endosperm normally induced by a Col 4x pollen parent.
5.2.1.2. Chalazal endosperm and nodule size
Further studies were carried out on the size of chalazal endosperm and nodules
(Figure 5.3), since these were previously observed to be larger in lethal than viable paternal
excess (Scott et al., 1998a). At 3 DAP, there were no significant differences between the
crosses in the area of the chalazal endosperm (Figures 5.3). The chalazal endosperm area in
0
20000
40000
60000
80000
100000
120000
140000
160000
3dap 5dap 6dap 7dap
Tsu2xXCol2x Tsu2xXCol4x Col2xXCol4x
*
*
0
20000
40000
60000
80000
100000
120000
140000
160000
3dap 5dap 6dap 7dap
Tsu2xXCol2x Tsu2xXCol4x Col2xXCol4x
*
*
Figure 5.2: Embryo sac area associated with different interploidy
crosses success. The area of embryo sac was measured using Image J
at 3, 5, 6, and 7 DAP in the crosses between [Tsu 2x X Col 2x], [Tsu
2x X Col 4x], and [Col 2x X Col 4x].
* Significant at P < 0.05
Em
bry
o s
ac
are
a (μ
m2)
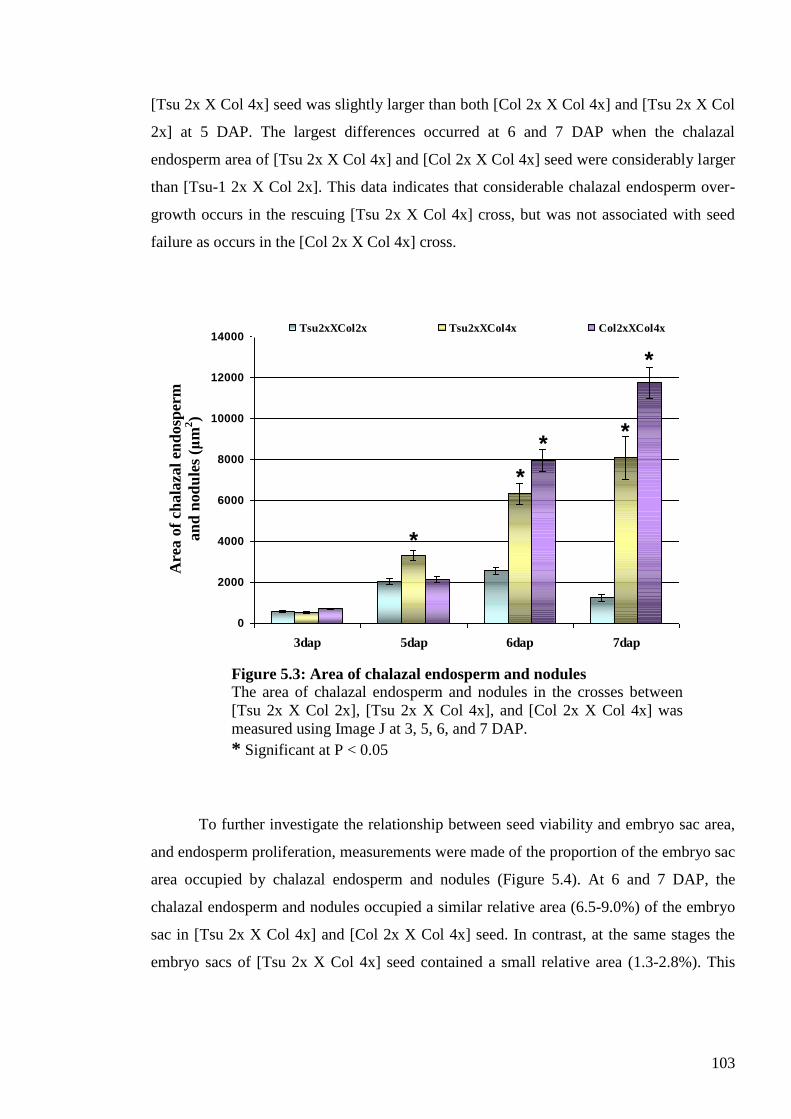
103
[Tsu 2x X Col 4x] seed was slightly larger than both [Col 2x X Col 4x] and [Tsu 2x X Col
2x] at 5 DAP. The largest differences occurred at 6 and 7 DAP when the chalazal
endosperm area of [Tsu 2x X Col 4x] and [Col 2x X Col 4x] seed were considerably larger
than [Tsu-1 2x X Col 2x]. This data indicates that considerable chalazal endosperm over-
growth occurs in the rescuing [Tsu 2x X Col 4x] cross, but was not associated with seed
failure as occurs in the [Col 2x X Col 4x] cross.
To further investigate the relationship between seed viability and embryo sac area,
and endosperm proliferation, measurements were made of the proportion of the embryo sac
area occupied by chalazal endosperm and nodules (Figure 5.4). At 6 and 7 DAP, the
chalazal endosperm and nodules occupied a similar relative area (6.5-9.0%) of the embryo
sac in [Tsu 2x X Col 4x] and [Col 2x X Col 4x] seed. In contrast, at the same stages the
embryo sacs of [Tsu 2x X Col 4x] seed contained a small relative area (1.3-2.8%). This
0
2000
4000
6000
8000
10000
12000
14000
3dap 5dap 6dap 7dap
Tsu2xXCol2x Tsu2xXCol4x Col2xXCol4x
*
**
*
*
0
2000
4000
6000
8000
10000
12000
14000
3dap 5dap 6dap 7dap
Tsu2xXCol2x Tsu2xXCol4x Col2xXCol4x
*
**
*
*
Are
a o
f ch
ala
zal
end
osp
erm
an
d n
od
ule
s (μ
m2)
Figure 5.3: Area of chalazal endosperm and nodules
The area of chalazal endosperm and nodules in the crosses between
[Tsu 2x X Col 2x], [Tsu 2x X Col 4x], and [Col 2x X Col 4x] was
measured using Image J at 3, 5, 6, and 7 DAP.
* Significant at P < 0.05
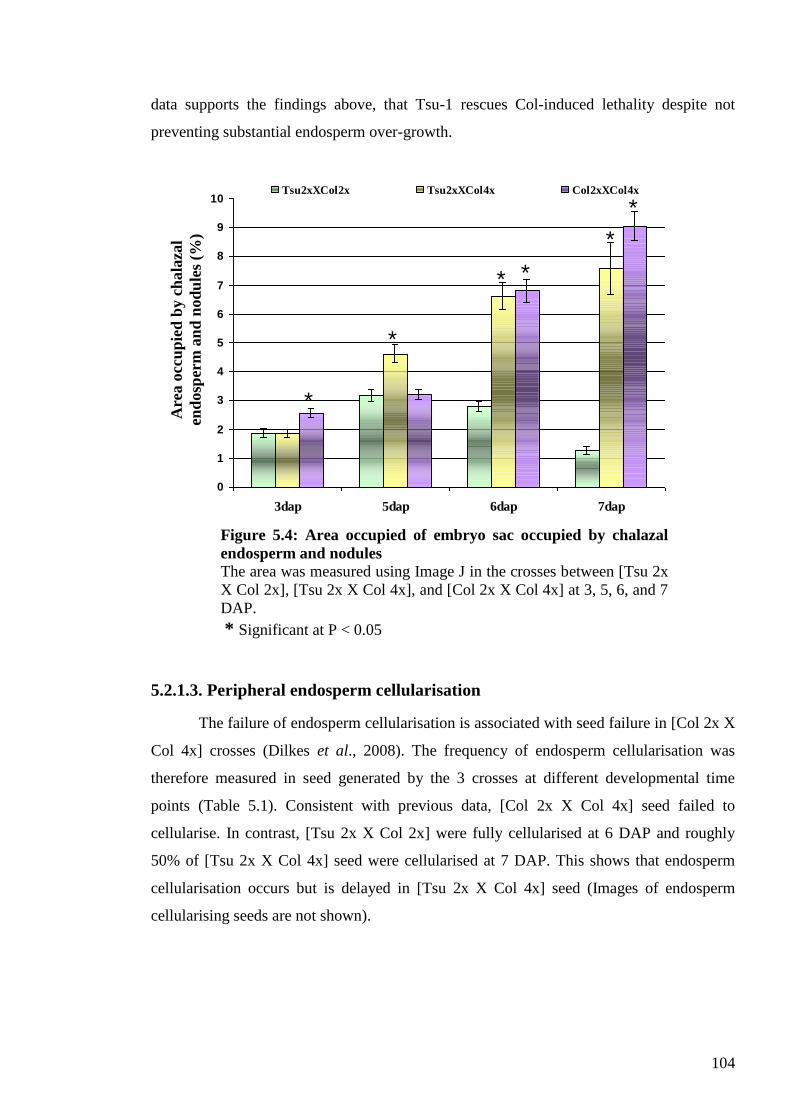
104
data supports the findings above, that Tsu-1 rescues Col-induced lethality despite not
preventing substantial endosperm over-growth.
5.2.1.3. Peripheral endosperm cellularisation
The failure of endosperm cellularisation is associated with seed failure in [Col 2x X
Col 4x] crosses (Dilkes et al., 2008). The frequency of endosperm cellularisation was
therefore measured in seed generated by the 3 crosses at different developmental time
points (Table 5.1). Consistent with previous data, [Col 2x X Col 4x] seed failed to
cellularise. In contrast, [Tsu 2x X Col 2x] were fully cellularised at 6 DAP and roughly
50% of [Tsu 2x X Col 4x] seed were cellularised at 7 DAP. This shows that endosperm
cellularisation occurs but is delayed in [Tsu 2x X Col 4x] seed (Images of endosperm
cellularising seeds are not shown).
0
1
2
3
4
5
6
7
8
9
10
3dap 5dap 6dap 7dap
Tsu2xXCol2x Tsu2xXCol4x Col2xXCol4x
**
*
*
*
*
0
1
2
3
4
5
6
7
8
9
10
3dap 5dap 6dap 7dap
Tsu2xXCol2x Tsu2xXCol4x Col2xXCol4x
**
*
*
*
*
Figure 5.4: Area occupied of embryo sac occupied by chalazal
endosperm and nodules
The area was measured using Image J in the crosses between [Tsu 2x
X Col 2x], [Tsu 2x X Col 4x], and [Col 2x X Col 4x] at 3, 5, 6, and 7
DAP.
* Significant at P < 0.05
Are
a o
ccu
pie
d b
y c
hala
zal
end
osp
erm
an
d n
od
ule
s (%
)
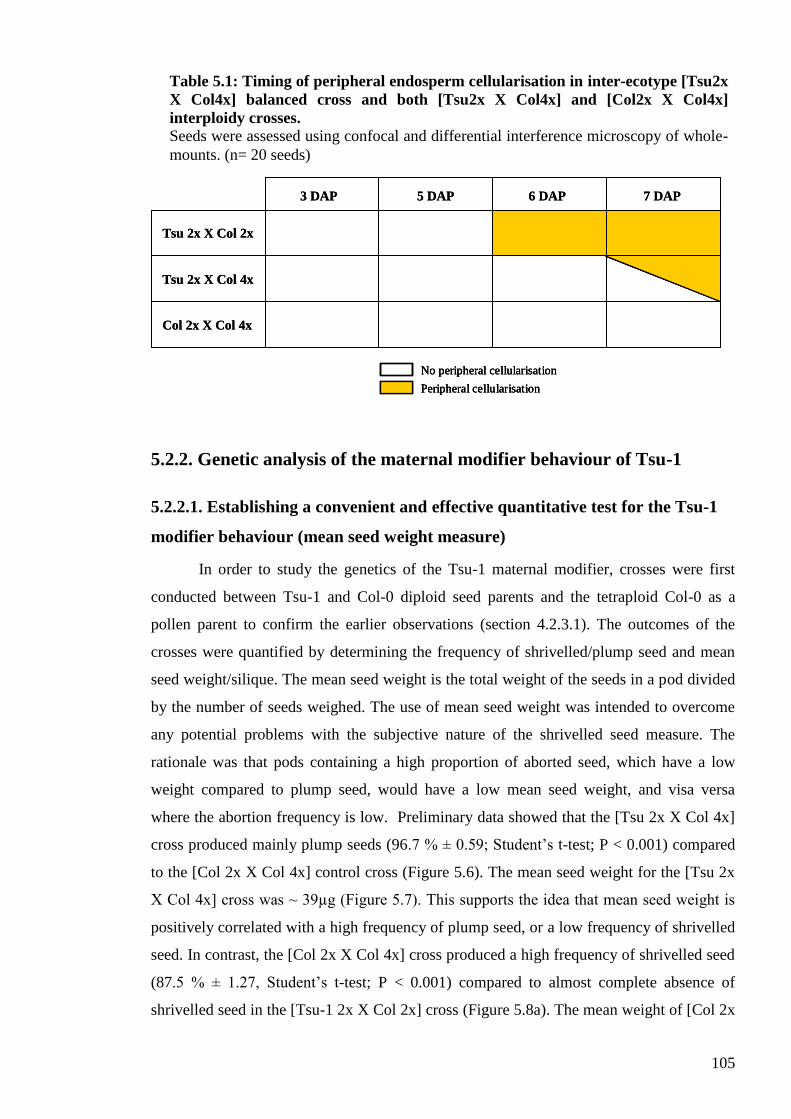
105
5.2.2. Genetic analysis of the maternal modifier behaviour of Tsu-1
5.2.2.1. Establishing a convenient and effective quantitative test for the Tsu-1
modifier behaviour (mean seed weight measure)
In order to study the genetics of the Tsu-1 maternal modifier, crosses were first
conducted between Tsu-1 and Col-0 diploid seed parents and the tetraploid Col-0 as a
pollen parent to confirm the earlier observations (section 4.2.3.1). The outcomes of the
crosses were quantified by determining the frequency of shrivelled/plump seed and mean
seed weight/silique. The mean seed weight is the total weight of the seeds in a pod divided
by the number of seeds weighed. The use of mean seed weight was intended to overcome
any potential problems with the subjective nature of the shrivelled seed measure. The
rationale was that pods containing a high proportion of aborted seed, which have a low
weight compared to plump seed, would have a low mean seed weight, and visa versa
where the abortion frequency is low. Preliminary data showed that the [Tsu 2x X Col 4x]
cross produced mainly plump seeds (96.7 % ± 0.59; Student‘s t-test; P < 0.001) compared
to the [Col 2x X Col 4x] control cross (Figure 5.6). The mean seed weight for the [Tsu 2x
X Col 4x] cross was ~ 39µg (Figure 5.7). This supports the idea that mean seed weight is
positively correlated with a high frequency of plump seed, or a low frequency of shrivelled
seed. In contrast, the [Col 2x X Col 4x] cross produced a high frequency of shrivelled seed
(87.5 % ± 1.27, Student‘s t-test; P < 0.001) compared to almost complete absence of
shrivelled seed in the [Tsu-1 2x X Col 2x] cross (Figure 5.8a). The mean weight of [Col 2x
Tsu 2x X Col 4x
Tsu 2x X Col 2x
Col 2x X Col 4x
3 DAP 5 DAP 6 DAP 7 DAP
No peripheral cellularisation
Peripheral cellularisation
Tsu 2x X Col 4x
Tsu 2x X Col 2x
Col 2x X Col 4x
3 DAP 5 DAP 6 DAP 7 DAP
No peripheral cellularisation
Peripheral cellularisation
No peripheral cellularisation
Peripheral cellularisation
Table 5.1: Timing of peripheral endosperm cellularisation in inter-ecotype [Tsu2x
X Col4x] balanced cross and both [Tsu2x X Col4x] and [Col2x X Col4x]
interploidy crosses.
Seeds were assessed using confocal and differential interference microscopy of whole-
mounts. (n= 20 seeds)
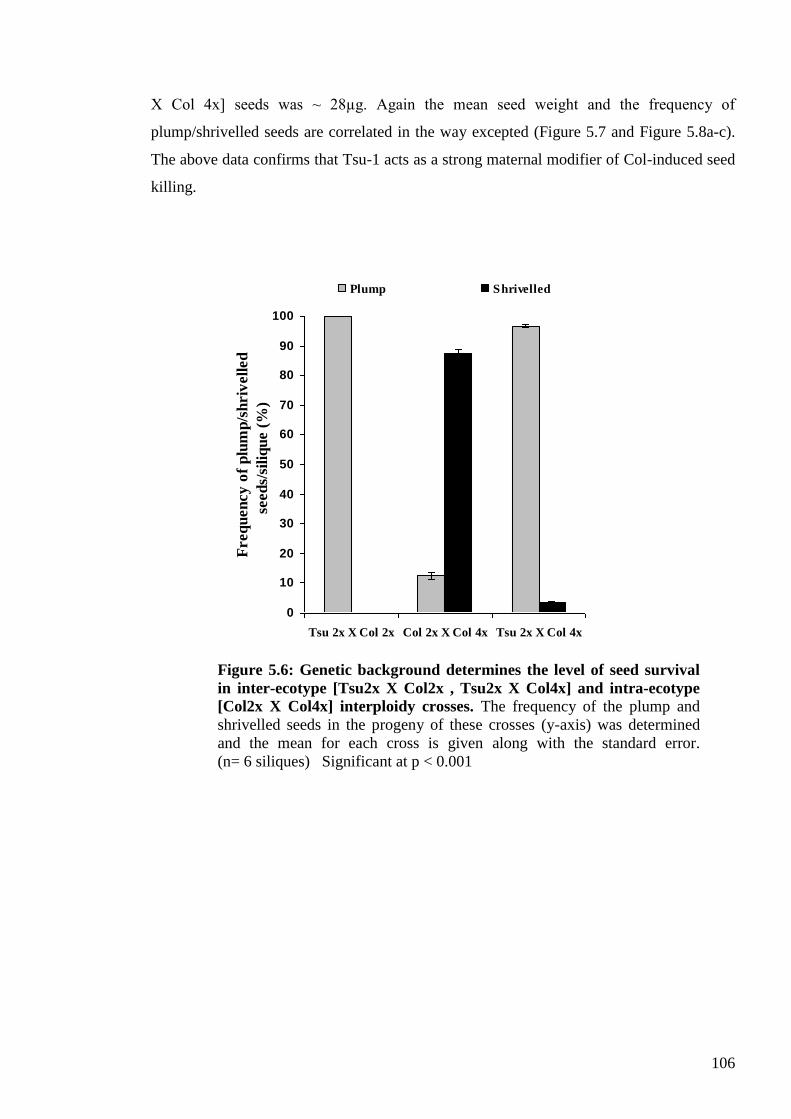
106
X Col 4x] seeds was ~ 28µg. Again the mean seed weight and the frequency of
plump/shrivelled seeds are correlated in the way excepted (Figure 5.7 and Figure 5.8a-c).
The above data confirms that Tsu-1 acts as a strong maternal modifier of Col-induced seed
killing.
0
10
20
30
40
50
60
70
80
90
100
Tsu 2x X Col 2x Col 2x X Col 4x Tsu 2x X Col 4x
Freq
uen
cy
of
plu
mp
/sh
riv
ell
ed
seed
s/si
liq
ue (
%)
Plump Shrivelled
Figure 5.6: Genetic background determines the level of seed survival
in inter-ecotype [Tsu2x X Col2x , Tsu2x X Col4x] and intra-ecotype
[Col2x X Col4x] interploidy crosses. The frequency of the plump and
shrivelled seeds in the progeny of these crosses (y-axis) was determined
and the mean for each cross is given along with the standard error.
(n= 6 siliques) Significant at p < 0.001
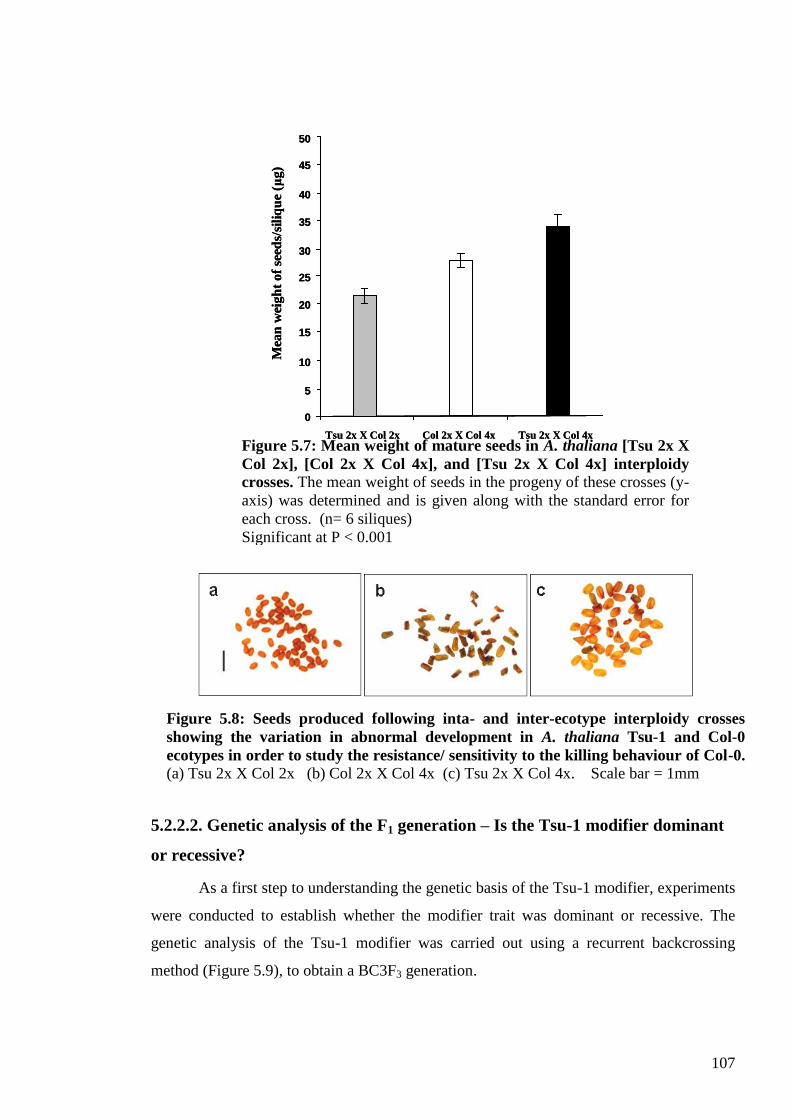
107
5.2.2.2. Genetic analysis of the F1 generation – Is the Tsu-1 modifier dominant
or recessive?
As a first step to understanding the genetic basis of the Tsu-1 modifier, experiments
were conducted to establish whether the modifier trait was dominant or recessive. The
genetic analysis of the Tsu-1 modifier was carried out using a recurrent backcrossing
method (Figure 5.9), to obtain a BC3F3 generation.
5
10
15
20
25
30
35
40
45
50
Tsu 2x X Col 2x Col 2x X Col 4x Tsu 2x X Col 4x
Mea
n w
eigh
t of
seed
s/si
liq
ue
(μg)
0
5
10
15
20
25
30
35
40
45
50
Tsu 2x X Col 2x Col 2x X Col 4x Tsu 2x X Col 4x
Mea
n w
eigh
t of
seed
s/si
liq
ue
(μg)
0
Figure 5.7: Mean weight of mature seeds in A. thaliana [Tsu 2x X
Col 2x], [Col 2x X Col 4x], and [Tsu 2x X Col 4x] interploidy
crosses. The mean weight of seeds in the progeny of these crosses (y-
axis) was determined and is given along with the standard error for
each cross. (n= 6 siliques)
Significant at P < 0.001
Figure 5.8: Seeds produced following inta- and inter-ecotype interploidy crosses
showing the variation in abnormal development in A. thaliana Tsu-1 and Col-0
ecotypes in order to study the resistance/ sensitivity to the killing behaviour of Col-0.
(a) Tsu 2x X Col 2x (b) Col 2x X Col 4x (c) Tsu 2x X Col 4x. Scale bar = 1mm
(Scale bar = 1mm)
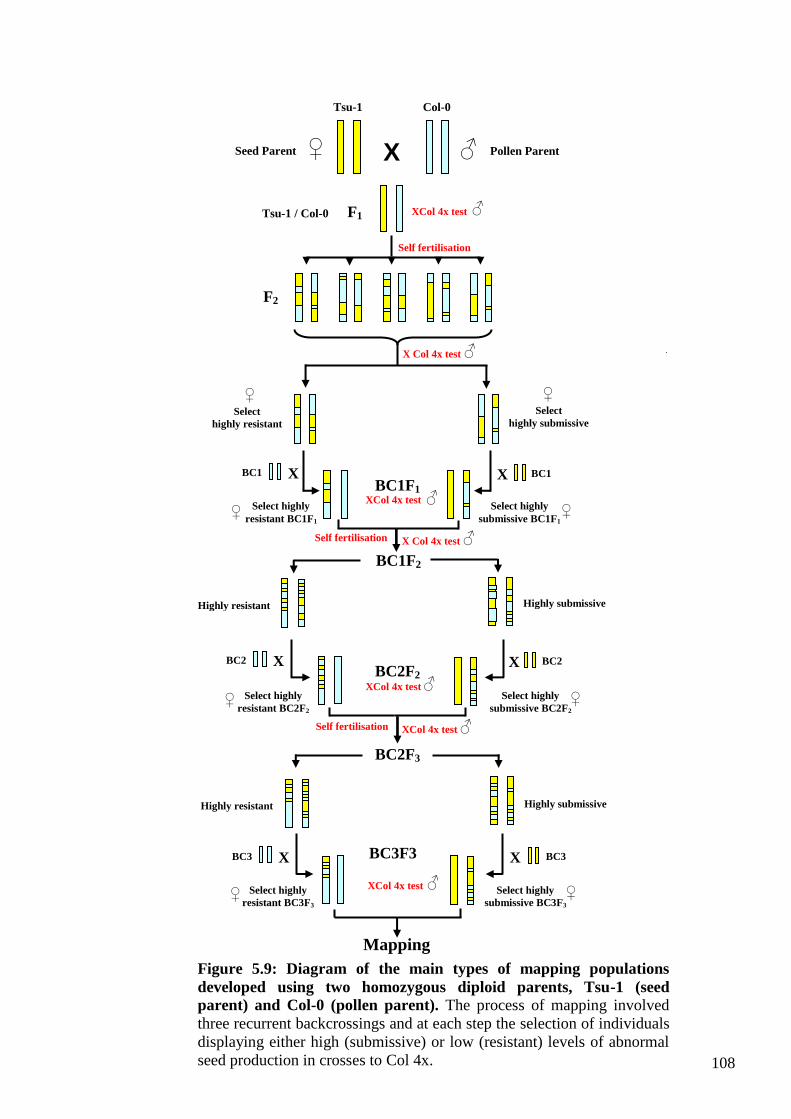
108
X
Tsu-1 Col-0
Seed Parent Pollen Parent
Tsu-1 / Col-0
F1
F2
BC2F2
BC3F3
Self fertilisation
Select
highly resistant
Select
highly submissive
BC1F1
X Col 4x test
X Col 4x test
XCol 4x test
BC1 BC1
BC2 BC2
BC1F2
Self fertilisation
Self fertilisation
BC2F3
Highly resistant
Highly resistant
Highly submissive
Highly submissive
BC3 BC3
Select highly
resistant BC2F2
Select highly
submissive BC2F2
Select highly
resistant BC1F1
Select highly
submissive BC1F1
Select highly
submissive BC3F3
Select highly
resistant BC3F3
X
X X
X
X X
XCol 4x test
XCol 4x test
XCol 4x test
XCol 4x test
♀ ♂
♀ ♀
♀ ♀
♀ ♀ ♂
♂
♂
♂
♂
♂
♂
♀ ♀
Figure 5.9: Diagram of the main types of mapping populations
developed using two homozygous diploid parents, Tsu-1 (seed
parent) and Col-0 (pollen parent). The process of mapping involved
three recurrent backcrossings and at each step the selection of individuals
displaying either high (submissive) or low (resistant) levels of abnormal
seed production in crosses to Col 4x.
Mapping
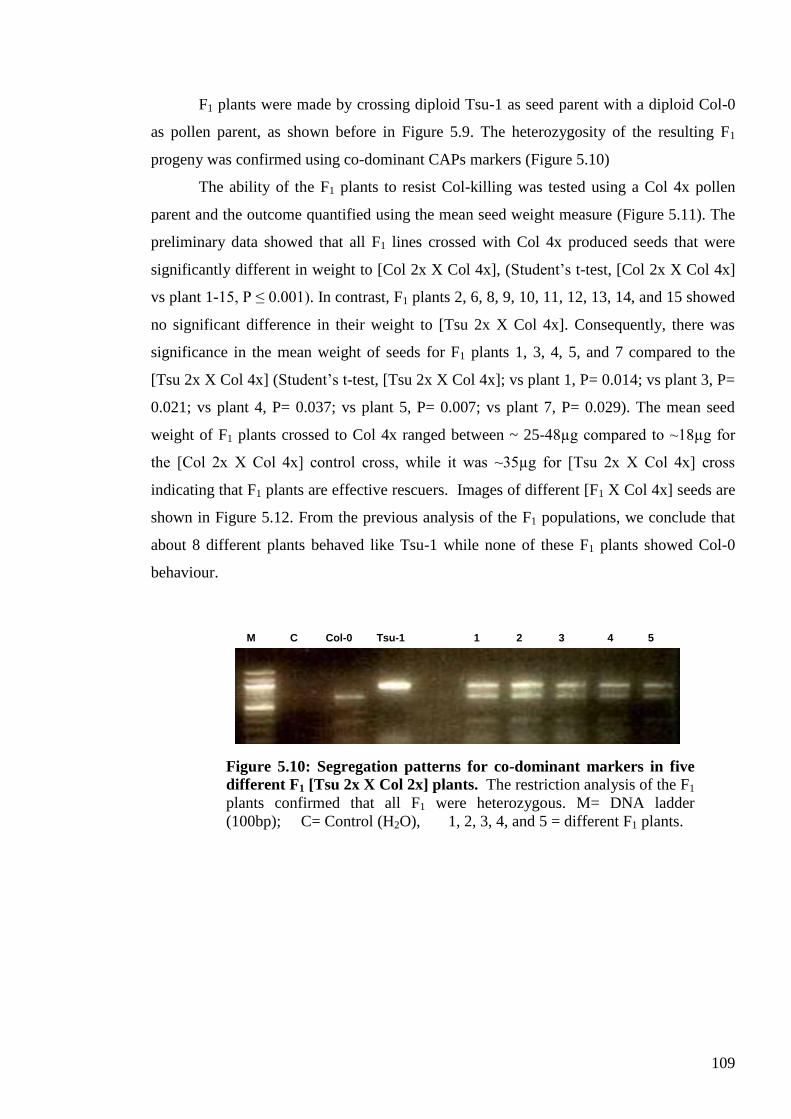
109
F1 plants were made by crossing diploid Tsu-1 as seed parent with a diploid Col-0
as pollen parent, as shown before in Figure 5.9. The heterozygosity of the resulting F1
progeny was confirmed using co-dominant CAPs markers (Figure 5.10)
The ability of the F1 plants to resist Col-killing was tested using a Col 4x pollen
parent and the outcome quantified using the mean seed weight measure (Figure 5.11). The
preliminary data showed that all F1 lines crossed with Col 4x produced seeds that were
significantly different in weight to [Col 2x X Col 4x], (Student‘s t-test, [Col 2x X Col 4x]
vs plant 1-15, P ≤ 0.001). In contrast, F1 plants 2, 6, 8, 9, 10, 11, 12, 13, 14, and 15 showed
no significant difference in their weight to [Tsu 2x X Col 4x]. Consequently, there was
significance in the mean weight of seeds for F1 plants 1, 3, 4, 5, and 7 compared to the
[Tsu 2x X Col 4x] (Student‘s t-test, [Tsu 2x X Col 4x]; vs plant 1, P= 0.014; vs plant 3, P=
0.021; vs plant 4, P= 0.037; vs plant 5, P= 0.007; vs plant 7, P= 0.029). The mean seed
weight of F1 plants crossed to Col 4x ranged between ~ 25-48µg compared to ~18µg for
the [Col 2x X Col 4x] control cross, while it was ~35µg for [Tsu 2x X Col 4x] cross
indicating that F1 plants are effective rescuers. Images of different [F1 X Col 4x] seeds are
shown in Figure 5.12. From the previous analysis of the F1 populations, we conclude that
about 8 different plants behaved like Tsu-1 while none of these F1 plants showed Col-0
behaviour.
M Col-0 Tsu-1 C 1 2 3 4 5
Figure 5.10: Segregation patterns for co-dominant markers in five
different F1 [Tsu 2x X Col 2x] plants. The restriction analysis of the F1
plants confirmed that all F1 were heterozygous. M= DNA ladder
(100bp); C= Control (H2O), 1, 2, 3, 4, and 5 = different F1 plants.
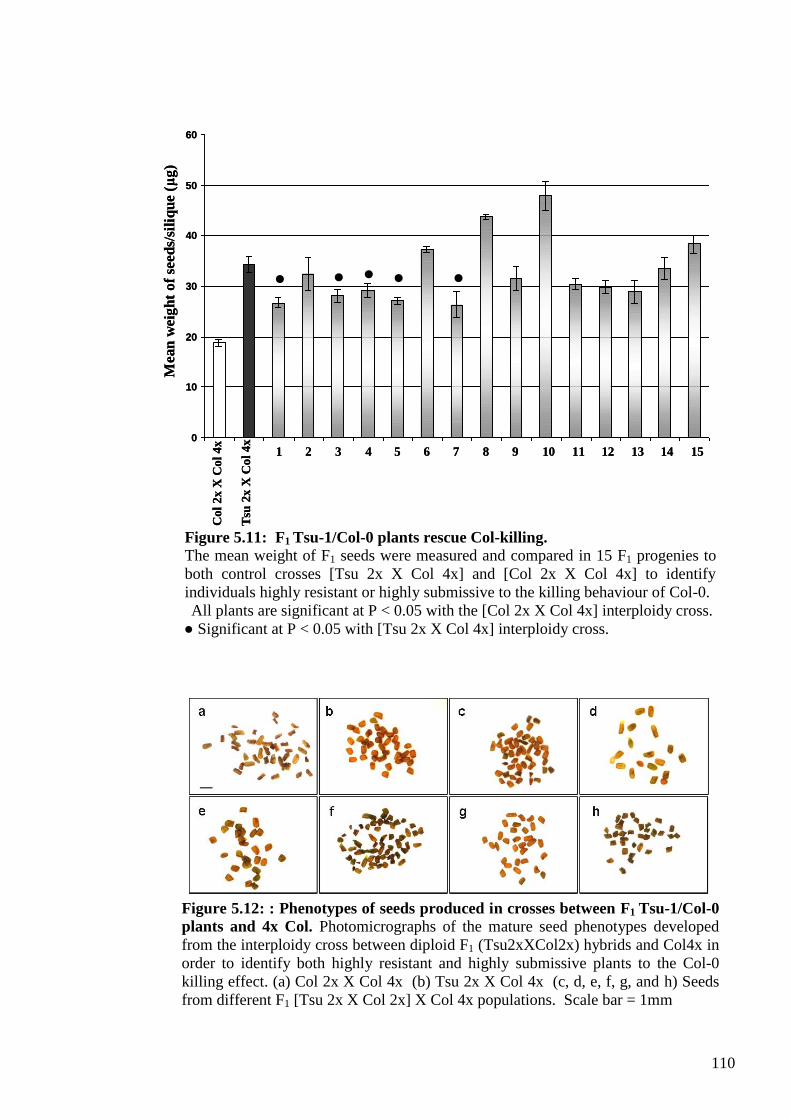
110
Co
l 2
x X
Co
l 4
x
Tsu
2x
X C
ol
4x0
10
20
30
40
50
60
Mean
weig
ht
of
seed
s/si
liq
ue (μ
g)
1 2 3 4 5 6 7 8 9 10 11 12 13 14 15
Co
l 2
x X
Co
l 4
x
Tsu
2x
X C
ol
4x0
10
20
30
40
50
60
Mean
weig
ht
of
seed
s/si
liq
ue (μ
g)
1 2 3 4 5 6 7 8 9 10 11 12 13 14 15
● ● ● ● ●
Figure 5.11: F1 Tsu-1/Col-0 plants rescue Col-killing.
The mean weight of F1 seeds were measured and compared in 15 F1 progenies to
both control crosses [Tsu 2x X Col 4x] and [Col 2x X Col 4x] to identify
individuals highly resistant or highly submissive to the killing behaviour of Col-0.
All plants are significant at P < 0.05 with the [Col 2x X Col 4x] interploidy cross.
● Significant at P < 0.05 with [Tsu 2x X Col 4x] interploidy cross.
Figure 5.12: : Phenotypes of seeds produced in crosses between F1 Tsu-1/Col-0
plants and 4x Col. Photomicrographs of the mature seed phenotypes developed
from the interploidy cross between diploid F1 (Tsu2xXCol2x) hybrids and Col4x in
order to identify both highly resistant and highly submissive plants to the Col-0
killing effect. (a) Col 2x X Col 4x (b) Tsu 2x X Col 4x (c, d, e, f, g, and h) Seeds
from different F1 [Tsu 2x X Col 2x] X Col 4x populations. Scale bar = 1mm
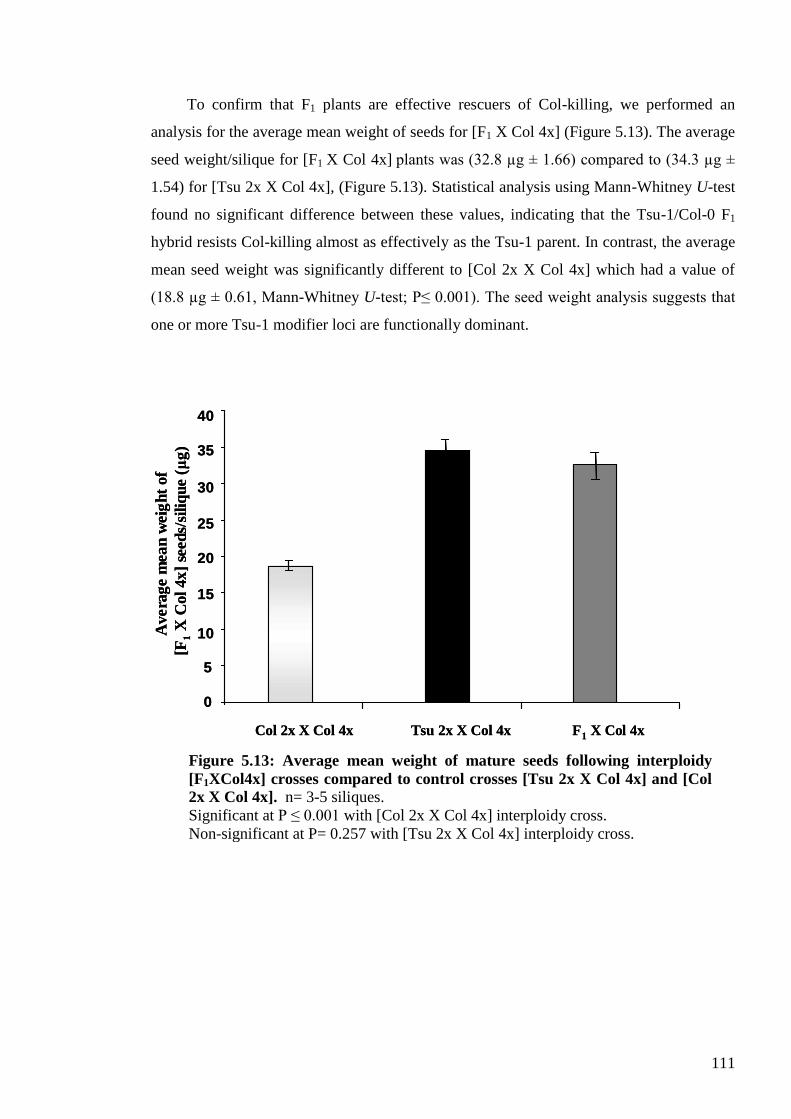
111
To confirm that F1 plants are effective rescuers of Col-killing, we performed an
analysis for the average mean weight of seeds for [F1 X Col 4x] (Figure 5.13). The average
seed weight/silique for [F1 X Col 4x] plants was (32.8 µg ± 1.66) compared to (34.3 µg ±
1.54) for [Tsu 2x X Col 4x], (Figure 5.13). Statistical analysis using Mann-Whitney U-test
found no significant difference between these values, indicating that the Tsu-1/Col-0 F1
hybrid resists Col-killing almost as effectively as the Tsu-1 parent. In contrast, the average
mean seed weight was significantly different to [Col 2x X Col 4x] which had a value of
(18.8 µg ± 0.61, Mann-Whitney U-test; P≤ 0.001). The seed weight analysis suggests that
one or more Tsu-1 modifier loci are functionally dominant.
5
10
15
20
25
30
35
40
0
Col 2x X Col 4x Tsu 2x X Col 4x F1 X Col 4x
Avera
ge m
ea
n w
eig
ht
of
[F1
X C
ol
4x
] se
ed
s/si
liq
ue (μ
g)
5
10
15
20
25
30
35
40
0
Col 2x X Col 4x Tsu 2x X Col 4x F1 X Col 4x
Avera
ge m
ea
n w
eig
ht
of
[F1
X C
ol
4x
] se
ed
s/si
liq
ue (μ
g)
Figure 5.13: Average mean weight of mature seeds following interploidy
[F1XCol4x] crosses compared to control crosses [Tsu 2x X Col 4x] and [Col
2x X Col 4x]. n= 3-5 siliques.
Significant at P ≤ 0.001 with [Col 2x X Col 4x] interploidy cross.
Non-significant at P= 0.257 with [Tsu 2x X Col 4x] interploidy cross.
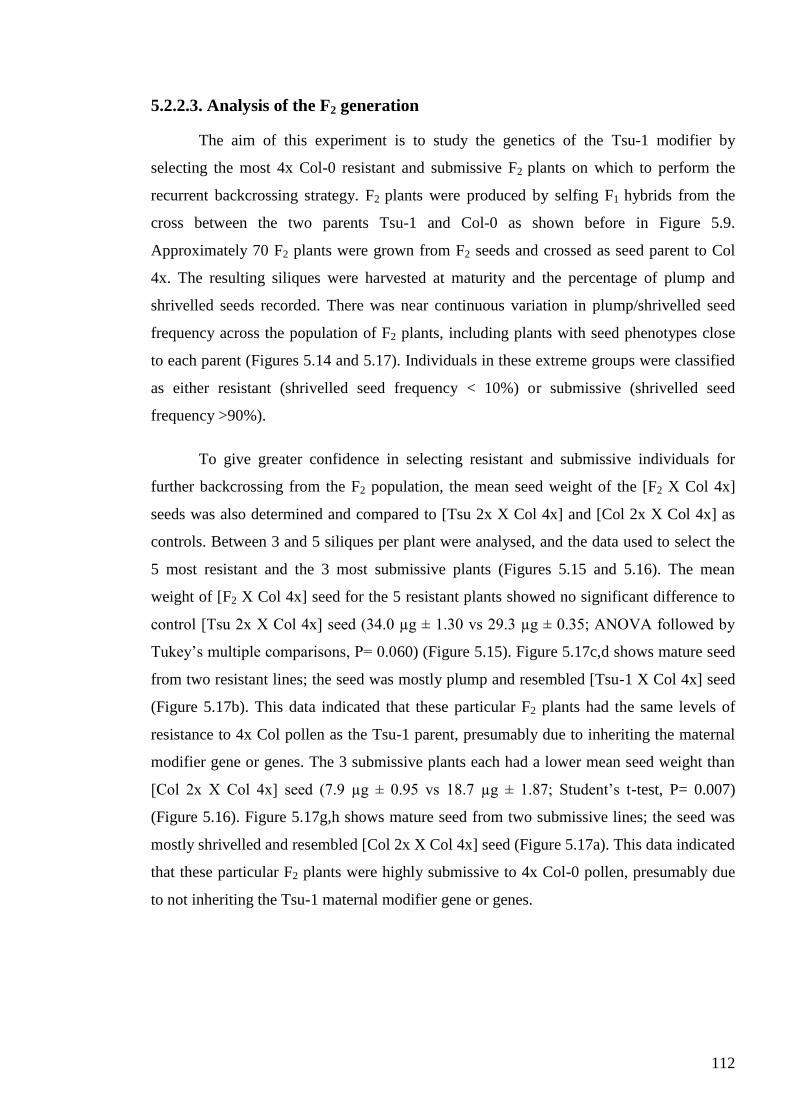
112
5.2.2.3. Analysis of the F2 generation
The aim of this experiment is to study the genetics of the Tsu-1 modifier by
selecting the most 4x Col-0 resistant and submissive F2 plants on which to perform the
recurrent backcrossing strategy. F2 plants were produced by selfing F1 hybrids from the
cross between the two parents Tsu-1 and Col-0 as shown before in Figure 5.9.
Approximately 70 F2 plants were grown from F2 seeds and crossed as seed parent to Col
4x. The resulting siliques were harvested at maturity and the percentage of plump and
shrivelled seeds recorded. There was near continuous variation in plump/shrivelled seed
frequency across the population of F2 plants, including plants with seed phenotypes close
to each parent (Figures 5.14 and 5.17). Individuals in these extreme groups were classified
as either resistant (shrivelled seed frequency < 10%) or submissive (shrivelled seed
frequency >90%).
To give greater confidence in selecting resistant and submissive individuals for
further backcrossing from the F2 population, the mean seed weight of the [F2 X Col 4x]
seeds was also determined and compared to [Tsu 2x X Col 4x] and [Col 2x X Col 4x] as
controls. Between 3 and 5 siliques per plant were analysed, and the data used to select the
5 most resistant and the 3 most submissive plants (Figures 5.15 and 5.16). The mean
weight of [F2 X Col 4x] seed for the 5 resistant plants showed no significant difference to
control [Tsu 2x X Col 4x] seed (34.0 µg ± 1.30 vs 29.3 µg ± 0.35; ANOVA followed by
Tukey‘s multiple comparisons, P= 0.060) (Figure 5.15). Figure 5.17c,d shows mature seed
from two resistant lines; the seed was mostly plump and resembled [Tsu-1 X Col 4x] seed
(Figure 5.17b). This data indicated that these particular F2 plants had the same levels of
resistance to 4x Col pollen as the Tsu-1 parent, presumably due to inheriting the maternal
modifier gene or genes. The 3 submissive plants each had a lower mean seed weight than
[Col 2x X Col 4x] seed (7.9 µg ± 0.95 vs 18.7 µg ± 1.87; Student‘s t-test, P= 0.007)
(Figure 5.16). Figure 5.17g,h shows mature seed from two submissive lines; the seed was
mostly shrivelled and resembled [Col 2x X Col 4x] seed (Figure 5.17a). This data indicated
that these particular F2 plants were highly submissive to 4x Col-0 pollen, presumably due
to not inheriting the Tsu-1 maternal modifier gene or genes.
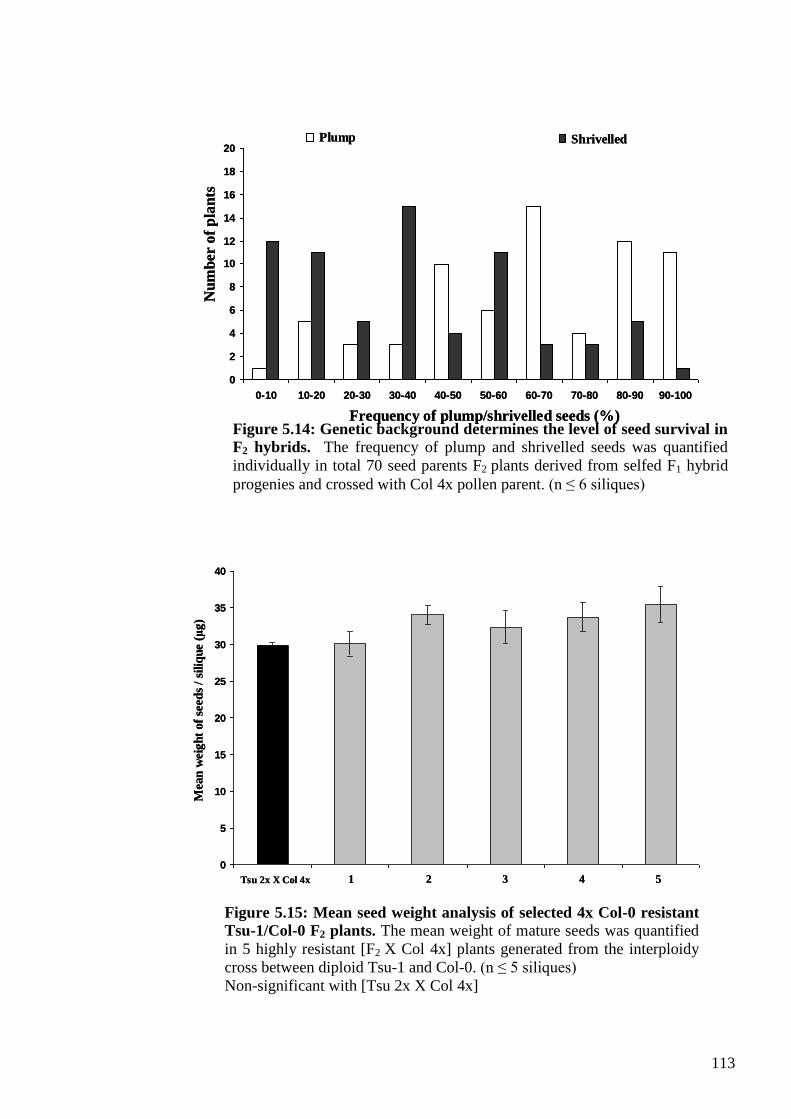
113
0
2
4
6
8
10
12
14
16
18
20
0-10 10-20 20-30 30-40 40-50 50-60 60-70 70-80 80-90 90-100
Nu
mb
er o
f p
lan
ts
Frequency of plump/shrivelled seeds (%)
Plump Shrivelled
0
2
4
6
8
10
12
14
16
18
20
0-10 10-20 20-30 30-40 40-50 50-60 60-70 70-80 80-90 90-100
Nu
mb
er o
f p
lan
ts
Frequency of plump/shrivelled seeds (%)
Plump Shrivelled
Tsu 2x X Col 4x 1 2 3 4 5
Mean
weig
ht
of
seed
s /
sili
qu
e (μ
g)
0
5
10
15
20
25
30
35
40
Tsu 2x X Col 4x 1 2 3 4 5
Mean
weig
ht
of
seed
s /
sili
qu
e (μ
g)
0
5
10
15
20
25
30
35
40
Figure 5.15: Mean seed weight analysis of selected 4x Col-0 resistant
Tsu-1/Col-0 F2 plants. The mean weight of mature seeds was quantified
in 5 highly resistant [F2 X Col 4x] plants generated from the interploidy
cross between diploid Tsu-1 and Col-0. (n ≤ 5 siliques)
Non-significant with [Tsu 2x X Col 4x]
Figure 5.14: Genetic background determines the level of seed survival in
F2 hybrids. The frequency of plump and shrivelled seeds was quantified
individually in total 70 seed parents F2 plants derived from selfed F1 hybrid
progenies and crossed with Col 4x pollen parent. (n ≤ 6 siliques)
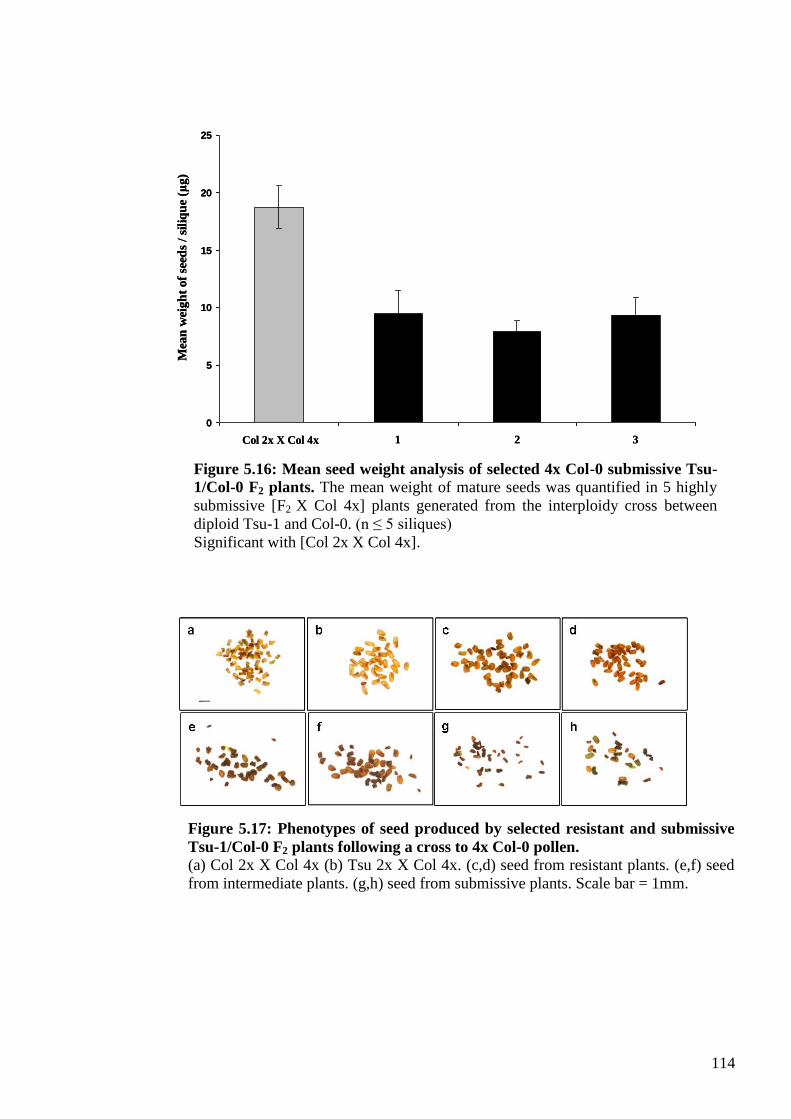
114
0
5
10
15
20
25
Col 2x X Col 4x 1 2 3
Mea
n w
eigh
t of
seed
s /
sili
qu
e (μ
g)
0
5
10
15
20
25
Col 2x X Col 4x 1 2 3
Mea
n w
eigh
t of
seed
s /
sili
qu
e (μ
g)
Figure 5.16: Mean seed weight analysis of selected 4x Col-0 submissive Tsu-
1/Col-0 F2 plants. The mean weight of mature seeds was quantified in 5 highly
submissive [F2 X Col 4x] plants generated from the interploidy cross between
diploid Tsu-1 and Col-0. (n ≤ 5 siliques)
Significant with [Col 2x X Col 4x].
Figure 5.17: Phenotypes of seed produced by selected resistant and submissive
Tsu-1/Col-0 F2 plants following a cross to 4x Col-0 pollen. (a) Col 2x X Col 4x (b) Tsu 2x X Col 4x. (c,d) seed from resistant plants. (e,f) seed
from intermediate plants. (g,h) seed from submissive plants. Scale bar = 1mm.
115
5.2.3. Mapping the maternal modifier trait
The next step in mapping the Tsu-1 modifier gene was to perform a series of
recurrent backcrosses starting from the selected highly resistant and submissive F2 plants
described in the previous section. The objective was to generate two BC3F3 mapping
populations: a highly resistant line produced by recurrent backcrossing to the submissive
parent (Col-0) and the other a highly submissive line produced by recurrent backcrossing
to the resistant parent (Tsu-1) (Figure 5.9). These plants would have the Tsu-1 and Col-0
alleles of the modifier locus/loci in a genetic background enriched for DNA of the parent
with the opposite modifier behaviour. The DNA of a resistant plant would consist of a
small amount of Tsu-1 DNA carrying the Tsu-1 modifier locus, and a relatively large
amount Col DNA, and visa versa for a submissive plant.
The selection of resistant or submissive plants at each round of backcrossing was
performed on F2 plants and was based on their performance in a test cross to 4x Col-0. The
principal performance criteria were, 1) mean seed weight - the highest value in the case of
backcrosses to Col-0, and the lowest value for backcrosses to Tsu-1 BC; 2) close
morphological similarity of the test seed to the control cross seed [Tsu 2x X Col 4x] or
[Col 2x X Col 4x]. F3 seed was collected from plants satisfying these criteria and used to
produce plants for the next round of backcrossing.
5.2.3.1. Identification of resistant BC1(Col-0)F1 and submissive BC1(Tsu-1 )F1
plants
The 5 highly resistant Tsu-1/Col-0 F2 plants were backcrossed to the Col-0 2x
(submissive donor) to generate BC1(Col-0)F1 seed (Figure 5.9). Subsequently, 10 seeds
from each BC1(Col-0)F1 plant were sown on soil; a total of 39 plants were produced (11
seed failed to germinate). These plants were used as seed parents in crosses with 4x Col-0
pollen and the mean weight of the resulting seeds determined (Table 5.2). There was
considerable variation for mean seed weight across the population of plants, with the
majority of values below that of the resistant parent (Tsu-1). One plant (number 12)
produced mostly large plump seed with a mean weight of 40.7 µg ± 2.0, compared to the
control value for [Tsu 2x x Col 4x] seed (29.9 ± 0.4) (Figure 5.18a , b). This plant met the
selection criteria and was entered into the next round of back crossing.
The 3 highly submissive Tsu-1/Col-0 F2 plants were backcrossed to the Tsu-1
(resistant donor) to generate BC1(Tsu-1)F1 seed (Figure 5.9). Again, 10 seed from each
116
BC1(Tsu-1)F1 plant were sown on soil; a total of 23 plants were produced (7 seed failed to
germinate). These plants were used as seed parents in crosses with 4x Col-0 pollen and the
mean weight of the resulting seeds determined (Table 5.3). The data revealed variation
across the plants, but with only a minority of plants that with a mean seed weight not
significantly different to the [Col 2x X Col 4x] control (P > 0.05), indicating a low
frequency inheritance of the modifier trait from the Col-0 parent or dominance of the Tsu-1
modifier. The lowest mean seed weight was 14.9 µg ± 1.1 (plant 20) which was
significantly lower than the [Col 2x X Col 4x] control cross (23.9 µg ± 1.5; Student‘s t-
test, P= 0.003) (Figure 5.18c, d). This plant met the selection criteria and was entered into
the next round of backcrossing.
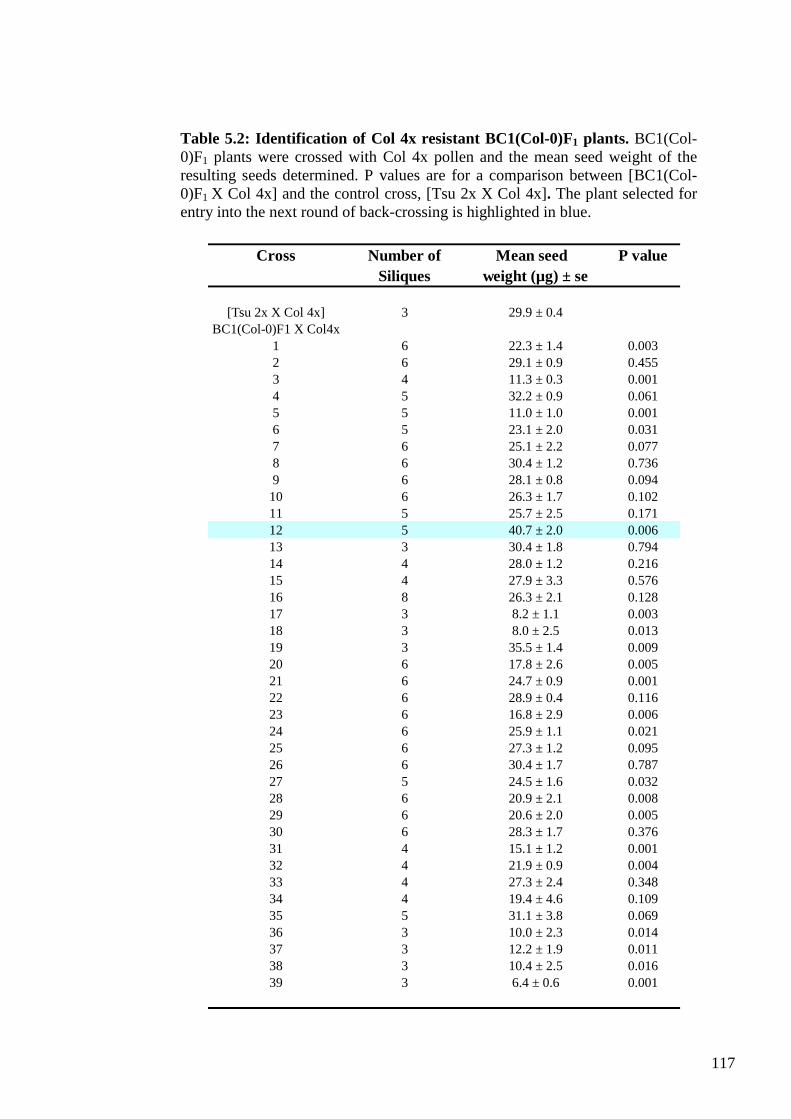
117
Cross Number of Mean seed P value
Siliques weight (µg) ± se
[Tsu 2x X Col 4x] 3 29.9 ± 0.4
BC1(Col-0)F1 X Col4x
1 6 22.3 ± 1.4 0.003
2 6 29.1 ± 0.9 0.455
3 4 11.3 ± 0.3 0.001
4 5 32.2 ± 0.9 0.061
5 5 11.0 ± 1.0 0.001
6 5 23.1 ± 2.0 0.031
7 6 25.1 ± 2.2 0.077
8 6 30.4 ± 1.2 0.736
9 6 28.1 ± 0.8 0.094
10 6 26.3 ± 1.7 0.102
11 5 25.7 ± 2.5 0.171
12 5 40.7 ± 2.0 0.006
13 3 30.4 ± 1.8 0.794
14 4 28.0 ± 1.2 0.216
15 4 27.9 ± 3.3 0.576
16 8 26.3 ± 2.1 0.128
17 3 8.2 ± 1.1 0.003
18 3 8.0 ± 2.5 0.013
19 3 35.5 ± 1.4 0.009
20 6 17.8 ± 2.6 0.005
21 6 24.7 ± 0.9 0.001
22 6 28.9 ± 0.4 0.116
23 6 16.8 ± 2.9 0.006
24 6 25.9 ± 1.1 0.021
25 6 27.3 ± 1.2 0.095
26 6 30.4 ± 1.7 0.787
27 5 24.5 ± 1.6 0.032
28 6 20.9 ± 2.1 0.008
29 6 20.6 ± 2.0 0.005
30 6 28.3 ± 1.7 0.376
31 4 15.1 ± 1.2 0.001
32 4 21.9 ± 0.9 0.004
33 4 27.3 ± 2.4 0.348
34 4 19.4 ± 4.6 0.109
35 5 31.1 ± 3.8 0.069
36 3 10.0 ± 2.3 0.014
37 3 12.2 ± 1.9 0.011
38 3 10.4 ± 2.5 0.016
39 3 6.4 ± 0.6 0.001
Table 5.2: Identification of Col 4x resistant BC1(Col-0)F1 plants. BC1(Col-
0)F1 plants were crossed with Col 4x pollen and the mean seed weight of the
resulting seeds determined. P values are for a comparison between [BC1(Col-
0)F1 X Col 4x] and the control cross, [Tsu 2x X Col 4x]. The plant selected for
entry into the next round of back-crossing is highlighted in blue.
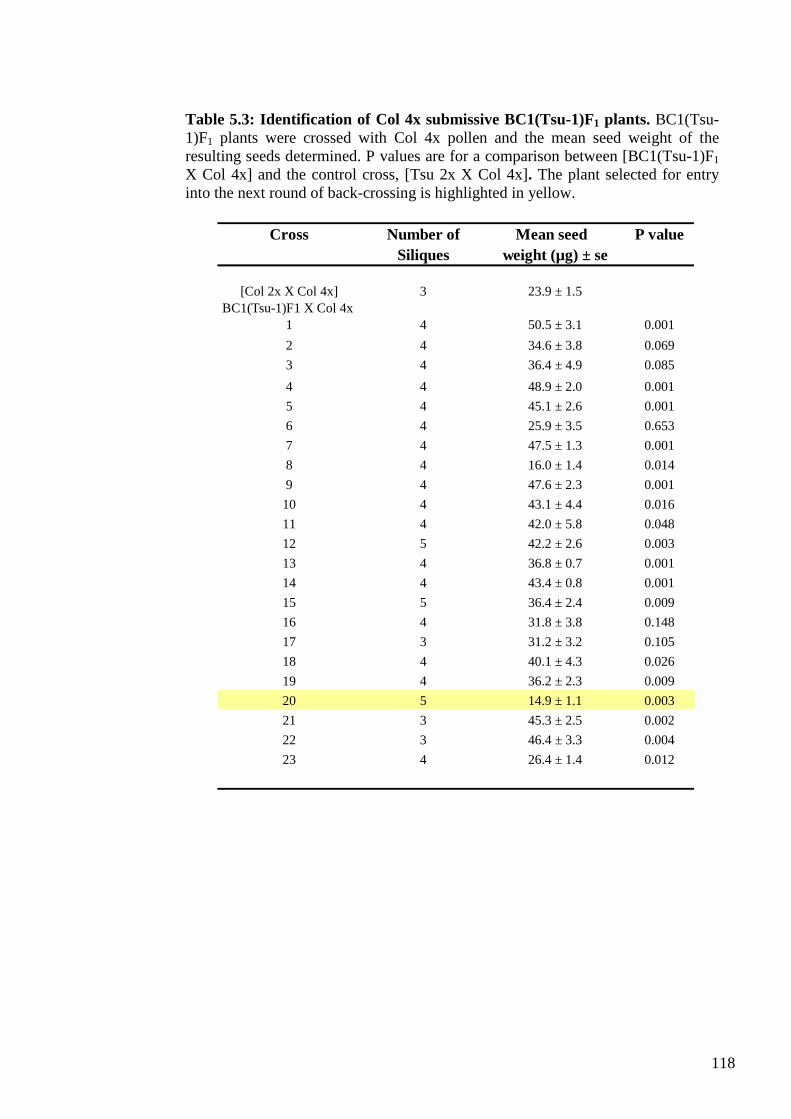
118
Cross Number of Mean seed P value
Siliques weight (µg) ± se
[Col 2x X Col 4x] 3 23.9 ± 1.5
BC1(Tsu-1)F1 X Col 4x
1 4 50.5 ± 3.1 0.001
2 4 34.6 ± 3.8 0.069
3 4 36.4 ± 4.9 0.085
4 4 48.9 ± 2.0 0.001
5 4 45.1 ± 2.6 0.001
6 4 25.9 ± 3.5 0.653
7 4 47.5 ± 1.3 0.001
8 4 16.0 ± 1.4 0.014
9 4 47.6 ± 2.3 0.001
10 4 43.1 ± 4.4 0.016
11 4 42.0 ± 5.8 0.048
12 5 42.2 ± 2.6 0.003
13 4 36.8 ± 0.7 0.001
14 4 43.4 ± 0.8 0.001
15 5 36.4 ± 2.4 0.009
16 4 31.8 ± 3.8 0.148
17 3 31.2 ± 3.2 0.105
18 4 40.1 ± 4.3 0.026
19 4 36.2 ± 2.3 0.009
20 5 14.9 ± 1.1 0.003
21 3 45.3 ± 2.5 0.002
22 3 46.4 ± 3.3 0.004
23 4 26.4 ± 1.4 0.012
Table 5.3: Identification of Col 4x submissive BC1(Tsu-1)F1 plants. BC1(Tsu-
1)F1 plants were crossed with Col 4x pollen and the mean seed weight of the
resulting seeds determined. P values are for a comparison between [BC1(Tsu-1)F1
X Col 4x] and the control cross, [Tsu 2x X Col 4x]. The plant selected for entry
into the next round of back-crossing is highlighted in yellow.
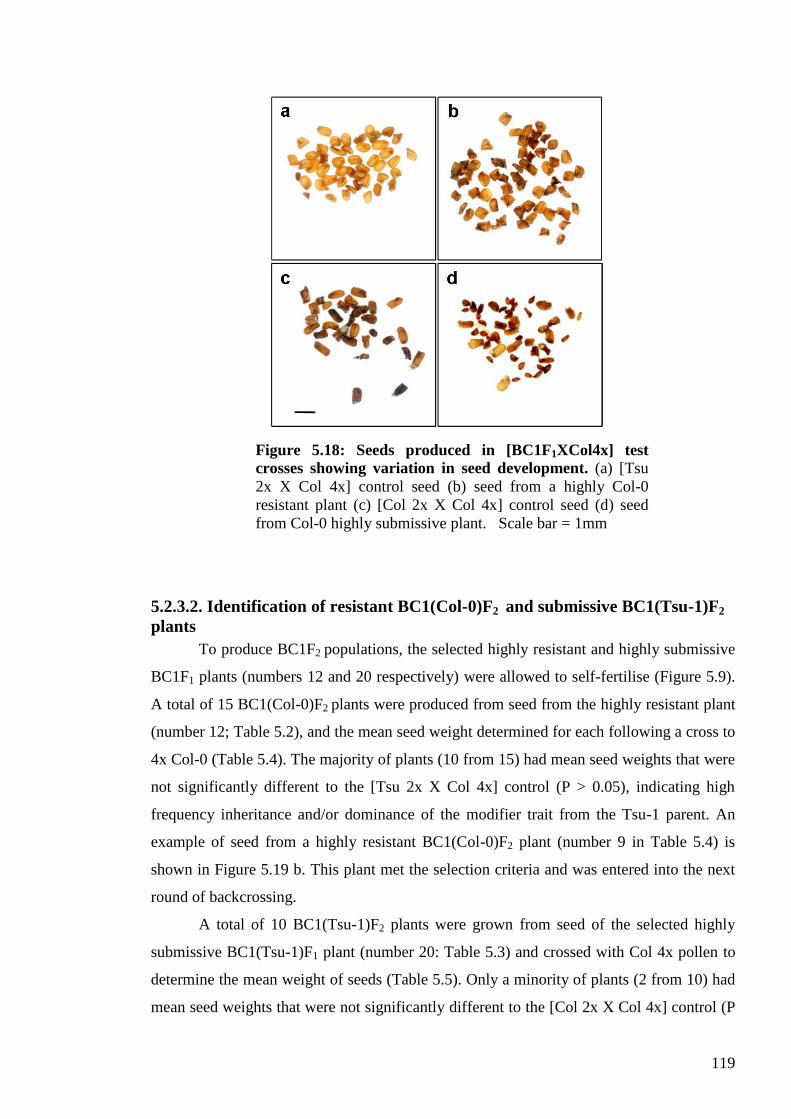
119
5.2.3.2. Identification of resistant BC1(Col-0)F2 and submissive BC1(Tsu-1)F2
plants
To produce BC1F2 populations, the selected highly resistant and highly submissive
BC1F1 plants (numbers 12 and 20 respectively) were allowed to self-fertilise (Figure 5.9).
A total of 15 BC1(Col-0)F2 plants were produced from seed from the highly resistant plant
(number 12; Table 5.2), and the mean seed weight determined for each following a cross to
4x Col-0 (Table 5.4). The majority of plants (10 from 15) had mean seed weights that were
not significantly different to the [Tsu 2x X Col 4x] control (P > 0.05), indicating high
frequency inheritance and/or dominance of the modifier trait from the Tsu-1 parent. An
example of seed from a highly resistant BC1(Col-0)F2 plant (number 9 in Table 5.4) is
shown in Figure 5.19 b. This plant met the selection criteria and was entered into the next
round of backcrossing.
A total of 10 BC1(Tsu-1)F2 plants were grown from seed of the selected highly
submissive BC1(Tsu-1)F1 plant (number 20: Table 5.3) and crossed with Col 4x pollen to
determine the mean weight of seeds (Table 5.5). Only a minority of plants (2 from 10) had
mean seed weights that were not significantly different to the [Col 2x X Col 4x] control (P
Figure 5.18: Seeds produced in [BC1F1XCol4x] test
crosses showing variation in seed development. (a) [Tsu
2x X Col 4x] control seed (b) seed from a highly Col-0
resistant plant (c) [Col 2x X Col 4x] control seed (d) seed
from Col-0 highly submissive plant. Scale bar = 1mm
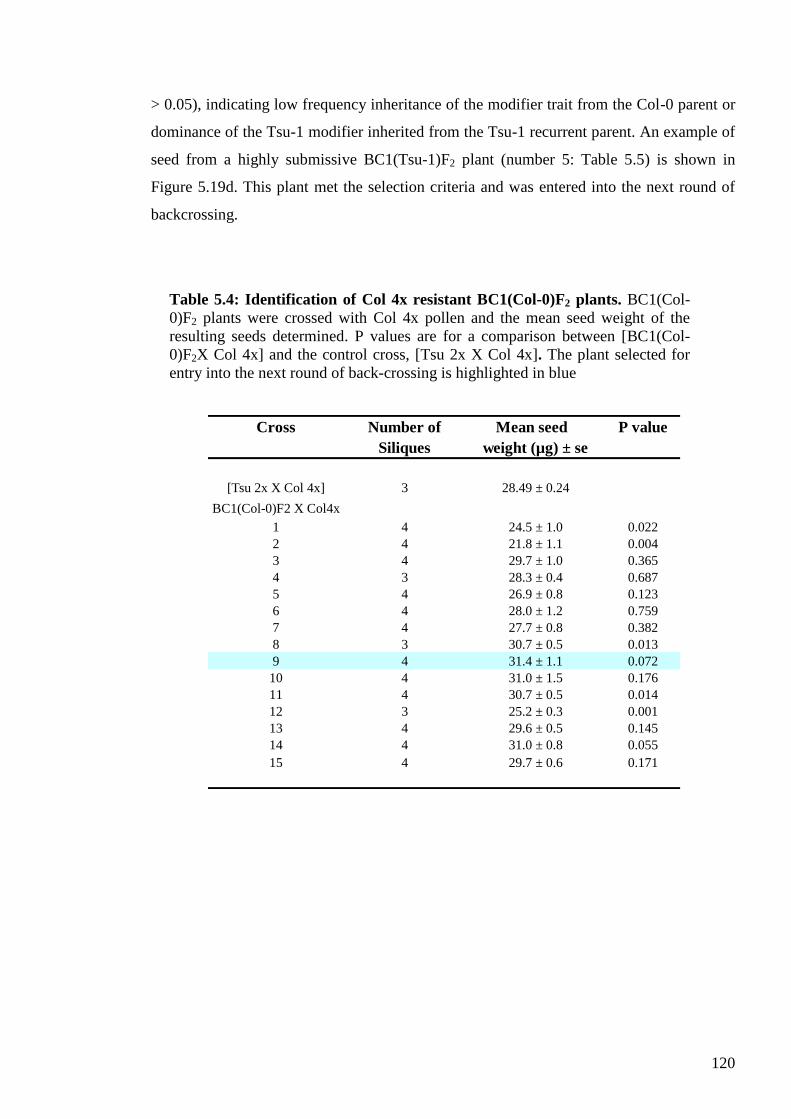
120
> 0.05), indicating low frequency inheritance of the modifier trait from the Col-0 parent or
dominance of the Tsu-1 modifier inherited from the Tsu-1 recurrent parent. An example of
seed from a highly submissive BC1(Tsu-1)F2 plant (number 5: Table 5.5) is shown in
Figure 5.19d. This plant met the selection criteria and was entered into the next round of
backcrossing.
Cross Number of Mean seed P value
Siliques weight (µg) ± se
[Tsu 2x X Col 4x] 3 28.49 ± 0.24
BC1(Col-0)F2 X Col4x
1 4 24.5 ± 1.0 0.022
2 4 21.8 ± 1.1 0.004
3 4 29.7 ± 1.0 0.365
4 3 28.3 ± 0.4 0.687
5 4 26.9 ± 0.8 0.123
6 4 28.0 ± 1.2 0.759
7 4 27.7 ± 0.8 0.382
8 3 30.7 ± 0.5 0.013
9 4 31.4 ± 1.1 0.072
10 4 31.0 ± 1.5 0.176
11 4 30.7 ± 0.5 0.014
12 3 25.2 ± 0.3 0.001
13 4 29.6 ± 0.5 0.145
14 4 31.0 ± 0.8 0.055
15 4 29.7 ± 0.6 0.171
Table 5.4: Identification of Col 4x resistant BC1(Col-0)F2 plants. BC1(Col-
0)F2 plants were crossed with Col 4x pollen and the mean seed weight of the
resulting seeds determined. P values are for a comparison between [BC1(Col-
0)F2X Col 4x] and the control cross, [Tsu 2x X Col 4x]. The plant selected for
entry into the next round of back-crossing is highlighted in blue
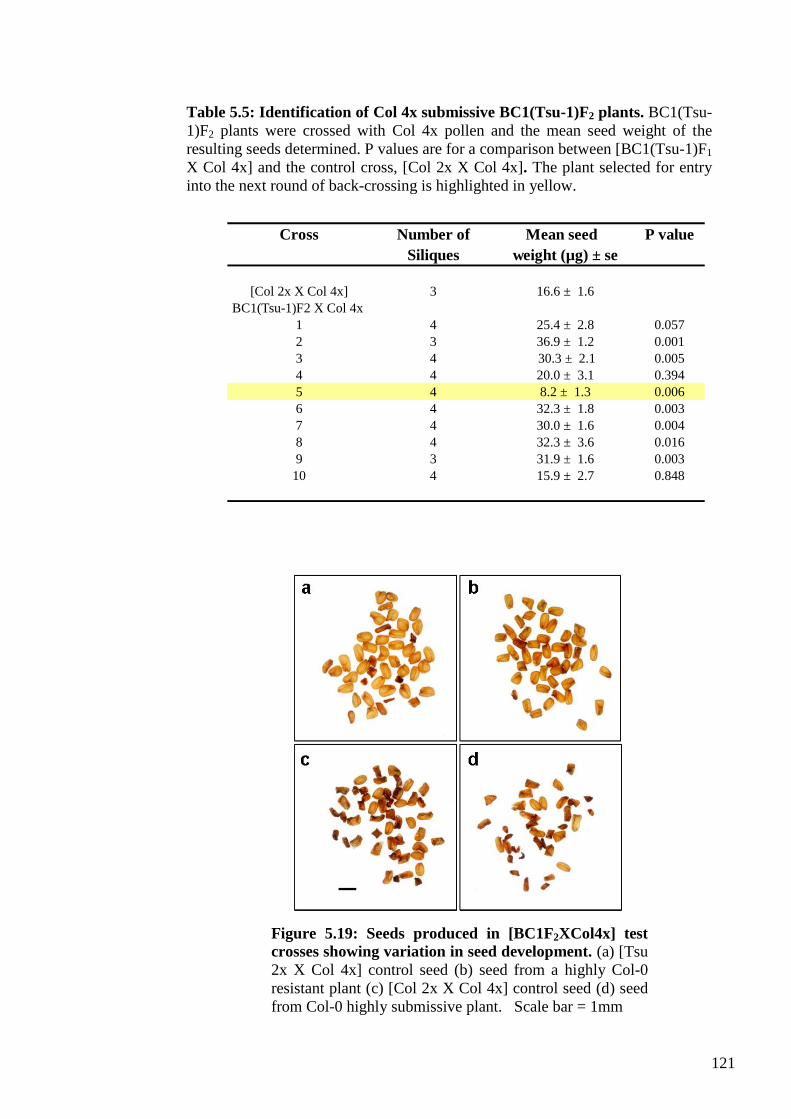
121
Cross Number of Mean seed P value
Siliques weight (µg) ± se
[Col 2x X Col 4x] 3 16.6 ± 1.6
BC1(Tsu-1)F2 X Col 4x
1 4 25.4 ± 2.8 0.057
2 3 36.9 ± 1.2 0.001
3 4 30.3 ± 2.1 0.005
4 4 20.0 ± 3.1 0.394
5 4 8.2 ± 1.3 0.006
6 4 32.3 ± 1.8 0.003
7 4 30.0 ± 1.6 0.004
8 4 32.3 ± 3.6 0.016
9 3 31.9 ± 1.6 0.003
10 4 15.9 ± 2.7 0.848
Figure 5.19: Seeds produced in [BC1F2XCol4x] test
crosses showing variation in seed development. (a) [Tsu
2x X Col 4x] control seed (b) seed from a highly Col-0
resistant plant (c) [Col 2x X Col 4x] control seed (d) seed
from Col-0 highly submissive plant. Scale bar = 1mm
Table 5.5: Identification of Col 4x submissive BC1(Tsu-1)F2 plants. BC1(Tsu-
1)F2 plants were crossed with Col 4x pollen and the mean seed weight of the
resulting seeds determined. P values are for a comparison between [BC1(Tsu-1)F1
X Col 4x] and the control cross, [Col 2x X Col 4x]. The plant selected for entry
into the next round of back-crossing is highlighted in yellow. Yellow colour shows the value of highly submissive BC1F2 plant
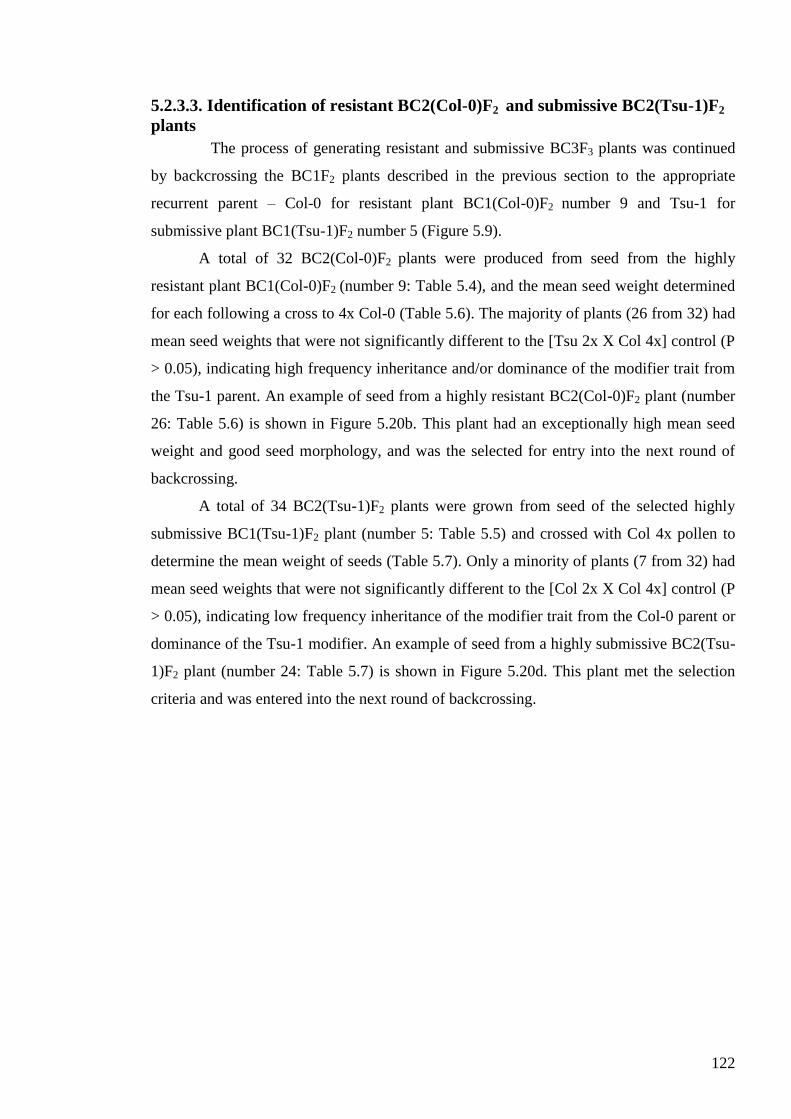
122
5.2.3.3. Identification of resistant BC2(Col-0)F2 and submissive BC2(Tsu-1)F2
plants
The process of generating resistant and submissive BC3F3 plants was continued
by backcrossing the BC1F2 plants described in the previous section to the appropriate
recurrent parent – Col-0 for resistant plant BC1(Col-0)F2 number 9 and Tsu-1 for
submissive plant BC1(Tsu-1)F2 number 5 (Figure 5.9).
A total of 32 BC2(Col-0)F2 plants were produced from seed from the highly
resistant plant BC1(Col-0)F2 (number 9: Table 5.4), and the mean seed weight determined
for each following a cross to 4x Col-0 (Table 5.6). The majority of plants (26 from 32) had
mean seed weights that were not significantly different to the [Tsu 2x X Col 4x] control (P
> 0.05), indicating high frequency inheritance and/or dominance of the modifier trait from
the Tsu-1 parent. An example of seed from a highly resistant BC2(Col-0)F2 plant (number
26: Table 5.6) is shown in Figure 5.20b. This plant had an exceptionally high mean seed
weight and good seed morphology, and was the selected for entry into the next round of
backcrossing.
A total of 34 BC2(Tsu-1)F2 plants were grown from seed of the selected highly
submissive BC1(Tsu-1)F2 plant (number 5: Table 5.5) and crossed with Col 4x pollen to
determine the mean weight of seeds (Table 5.7). Only a minority of plants (7 from 32) had
mean seed weights that were not significantly different to the [Col 2x X Col 4x] control (P
> 0.05), indicating low frequency inheritance of the modifier trait from the Col-0 parent or
dominance of the Tsu-1 modifier. An example of seed from a highly submissive BC2(Tsu-
1)F2 plant (number 24: Table 5.7) is shown in Figure 5.20d. This plant met the selection
criteria and was entered into the next round of backcrossing.
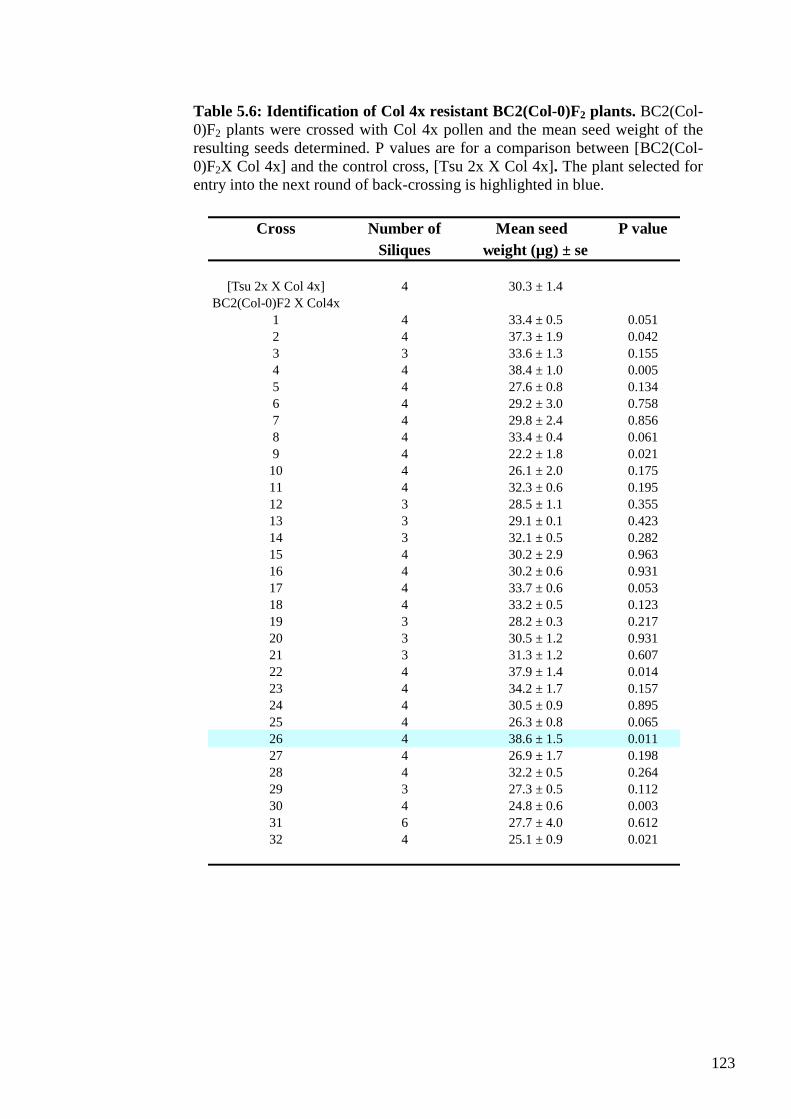
123
Cross Number of Mean seed P value
Siliques weight (µg) ± se
[Tsu 2x X Col 4x] 4 30.3 ± 1.4
BC2(Col-0)F2 X Col4x
1 4 33.4 ± 0.5 0.051
2 4 37.3 ± 1.9 0.042
3 3 33.6 ± 1.3 0.155
4 4 38.4 ± 1.0 0.005
5 4 27.6 ± 0.8 0.134
6 4 29.2 ± 3.0 0.758
7 4 29.8 ± 2.4 0.856
8 4 33.4 ± 0.4 0.061
9 4 22.2 ± 1.8 0.021
10 4 26.1 ± 2.0 0.175
11 4 32.3 ± 0.6 0.195
12 3 28.5 ± 1.1 0.355
13 3 29.1 ± 0.1 0.423
14 3 32.1 ± 0.5 0.282
15 4 30.2 ± 2.9 0.963
16 4 30.2 ± 0.6 0.931
17 4 33.7 ± 0.6 0.053
18 4 33.2 ± 0.5 0.123
19 3 28.2 ± 0.3 0.217
20 3 30.5 ± 1.2 0.931
21 3 31.3 ± 1.2 0.607
22 4 37.9 ± 1.4 0.014
23 4 34.2 ± 1.7 0.157
24 4 30.5 ± 0.9 0.895
25 4 26.3 ± 0.8 0.065
26 4 38.6 ± 1.5 0.011
27 4 26.9 ± 1.7 0.198
28 4 32.2 ± 0.5 0.264
29 3 27.3 ± 0.5 0.112
30 4 24.8 ± 0.6 0.003
31 6 27.7 ± 4.0 0.612
32 4 25.1 ± 0.9 0.021
Table 5.6: Identification of Col 4x resistant BC2(Col-0)F2 plants. BC2(Col-
0)F2 plants were crossed with Col 4x pollen and the mean seed weight of the
resulting seeds determined. P values are for a comparison between [BC2(Col-
0)F2X Col 4x] and the control cross, [Tsu 2x X Col 4x]. The plant selected for
entry into the next round of back-crossing is highlighted in blue.
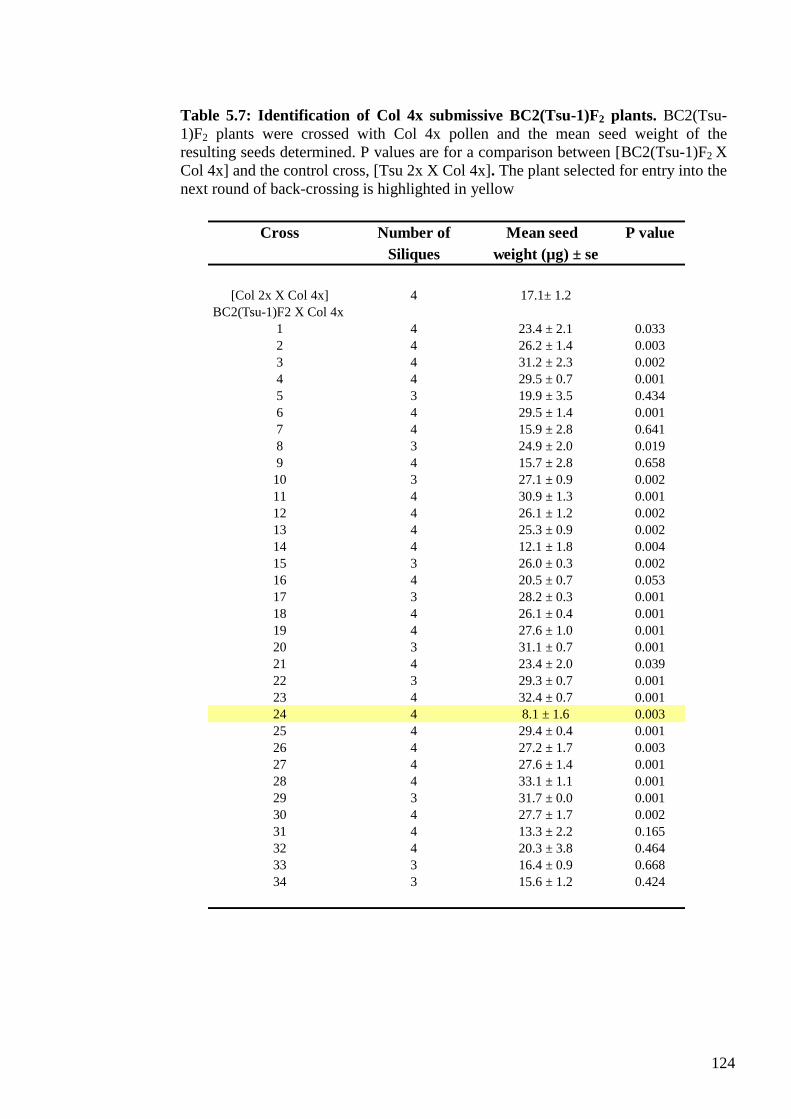
124
Cross Number of Mean seed P value
Siliques weight (µg) ± se
[Col 2x X Col 4x] 4 17.1± 1.2
BC2(Tsu-1)F2 X Col 4x
1 4 23.4 ± 2.1 0.033
2 4 26.2 ± 1.4 0.003
3 4 31.2 ± 2.3 0.002
4 4 29.5 ± 0.7 0.001
5 3 19.9 ± 3.5 0.434
6 4 29.5 ± 1.4 0.001
7 4 15.9 ± 2.8 0.641
8 3 24.9 ± 2.0 0.019
9 4 15.7 ± 2.8 0.658
10 3 27.1 ± 0.9 0.002
11 4 30.9 ± 1.3 0.001
12 4 26.1 ± 1.2 0.002
13 4 25.3 ± 0.9 0.002
14 4 12.1 ± 1.8 0.004
15 3 26.0 ± 0.3 0.002
16 4 20.5 ± 0.7 0.053
17 3 28.2 ± 0.3 0.001
18 4 26.1 ± 0.4 0.001
19 4 27.6 ± 1.0 0.001
20 3 31.1 ± 0.7 0.001
21 4 23.4 ± 2.0 0.039
22 3 29.3 ± 0.7 0.001
23 4 32.4 ± 0.7 0.001
24 4 8.1 ± 1.6 0.003
25 4 29.4 ± 0.4 0.001
26 4 27.2 ± 1.7 0.003
27 4 27.6 ± 1.4 0.001
28 4 33.1 ± 1.1 0.001
29 3 31.7 ± 0.0 0.001
30 4 27.7 ± 1.7 0.002
31 4 13.3 ± 2.2 0.165
32 4 20.3 ± 3.8 0.464
33 3 16.4 ± 0.9 0.668
34 3 15.6 ± 1.2 0.424
Table 5.7: Identification of Col 4x submissive BC2(Tsu-1)F2 plants. BC2(Tsu-
1)F2 plants were crossed with Col 4x pollen and the mean seed weight of the
resulting seeds determined. P values are for a comparison between [BC2(Tsu-1)F2 X
Col 4x] and the control cross, [Tsu 2x X Col 4x]. The plant selected for entry into the
next round of back-crossing is highlighted in yellow
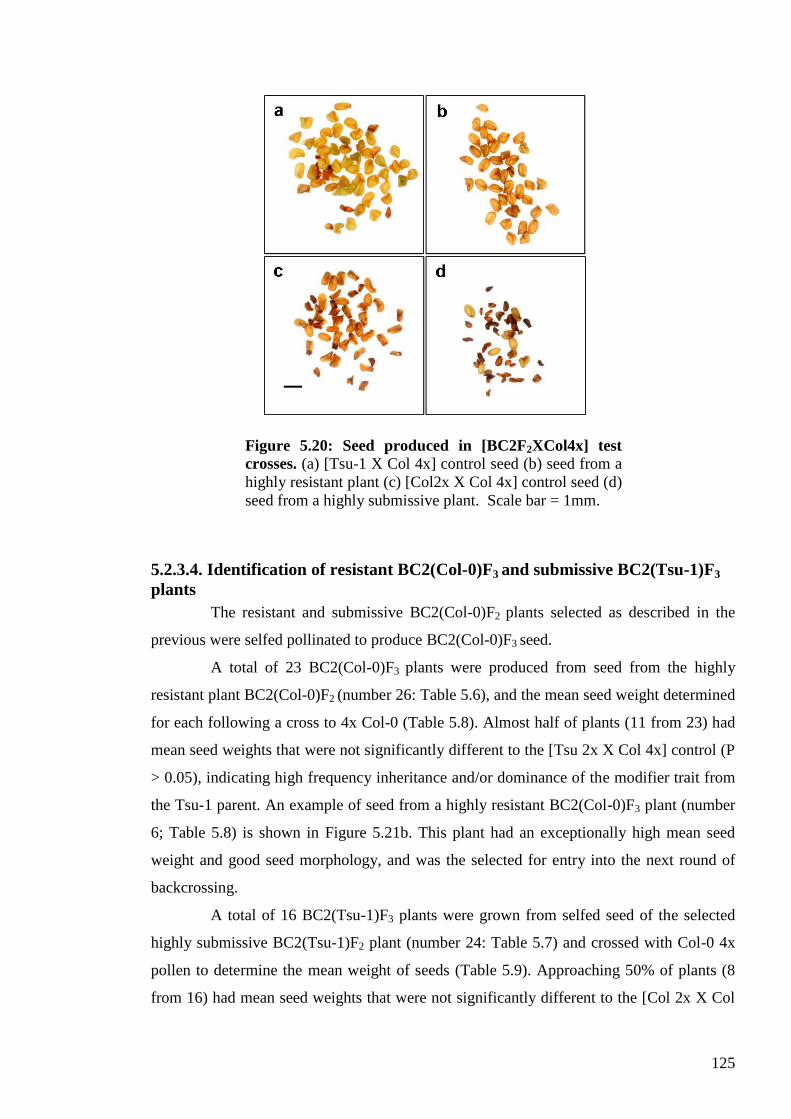
125
5.2.3.4. Identification of resistant BC2(Col-0)F3 and submissive BC2(Tsu-1)F3
plants
The resistant and submissive BC2(Col-0)F2 plants selected as described in the
previous were selfed pollinated to produce BC2(Col-0)F3 seed.
A total of 23 BC2(Col-0)F3 plants were produced from seed from the highly
resistant plant BC2(Col-0)F2 (number 26: Table 5.6), and the mean seed weight determined
for each following a cross to 4x Col-0 (Table 5.8). Almost half of plants (11 from 23) had
mean seed weights that were not significantly different to the [Tsu 2x X Col 4x] control (P
> 0.05), indicating high frequency inheritance and/or dominance of the modifier trait from
the Tsu-1 parent. An example of seed from a highly resistant BC2(Col-0)F3 plant (number
6; Table 5.8) is shown in Figure 5.21b. This plant had an exceptionally high mean seed
weight and good seed morphology, and was the selected for entry into the next round of
backcrossing.
A total of 16 BC2(Tsu-1)F3 plants were grown from selfed seed of the selected
highly submissive BC2(Tsu-1)F2 plant (number 24: Table 5.7) and crossed with Col-0 4x
pollen to determine the mean weight of seeds (Table 5.9). Approaching 50% of plants (8
from 16) had mean seed weights that were not significantly different to the [Col 2x X Col
Figure 5.20: Seed produced in [BC2F2XCol4x] test
crosses. (a) [Tsu-1 X Col 4x] control seed (b) seed from a
highly resistant plant (c) [Col2x X Col 4x] control seed (d)
seed from a highly submissive plant. Scale bar = 1mm.
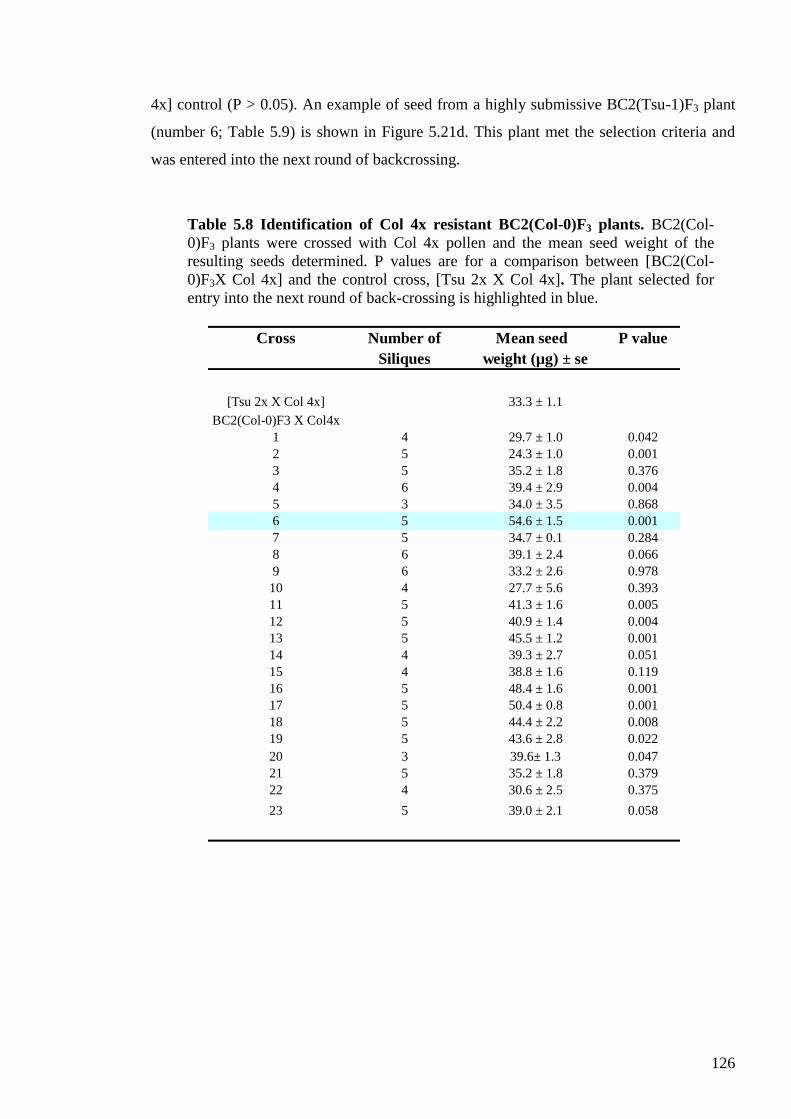
126
4x] control (P > 0.05). An example of seed from a highly submissive BC2(Tsu-1)F3 plant
(number 6; Table 5.9) is shown in Figure 5.21d. This plant met the selection criteria and
was entered into the next round of backcrossing.
Cross Number of Mean seed P value
Siliques weight (µg) ± se
[Tsu 2x X Col 4x] 33.3 ± 1.1
BC2(Col-0)F3 X Col4x
1 4 29.7 ± 1.0 0.042
2 5 24.3 ± 1.0 0.001
3 5 35.2 ± 1.8 0.376
4 6 39.4 ± 2.9 0.004
5 3 34.0 ± 3.5 0.868
6 5 54.6 ± 1.5 0.001
7 5 34.7 ± 0.1 0.284
8 6 39.1 ± 2.4 0.066
9 6 33.2 ± 2.6 0.978
10 4 27.7 ± 5.6 0.393
11 5 41.3 ± 1.6 0.005
12 5 40.9 ± 1.4 0.004
13 5 45.5 ± 1.2 0.001
14 4 39.3 ± 2.7 0.051
15 4 38.8 ± 1.6 0.119
16 5 48.4 ± 1.6 0.001
17 5 50.4 ± 0.8 0.001
18 5 44.4 ± 2.2 0.008
19 5 43.6 ± 2.8 0.022
20 3 39.6± 1.3 0.047
21 5 35.2 ± 1.8 0.379
22 4 30.6 ± 2.5 0.375
23 5 39.0 ± 2.1 0.058
Table 5.8 Identification of Col 4x resistant BC2(Col-0)F3 plants. BC2(Col-
0)F3 plants were crossed with Col 4x pollen and the mean seed weight of the
resulting seeds determined. P values are for a comparison between [BC2(Col-
0)F3X Col 4x] and the control cross, [Tsu 2x X Col 4x]. The plant selected for
entry into the next round of back-crossing is highlighted in blue.
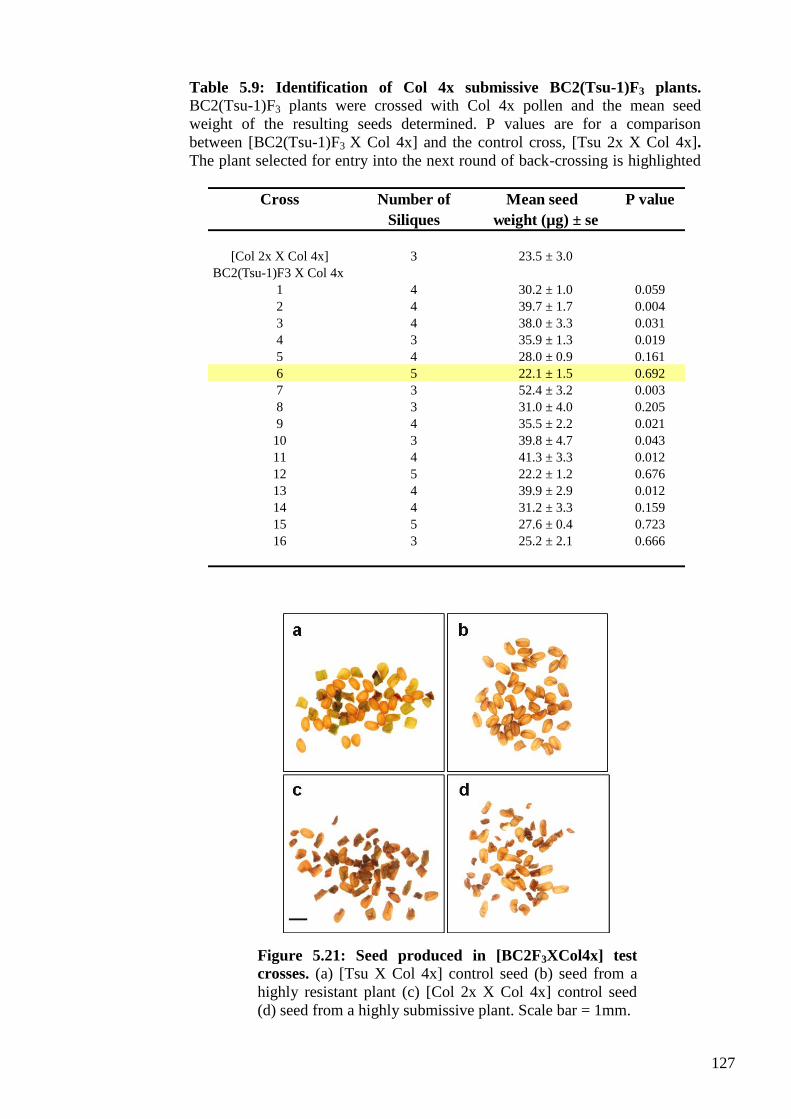
127
Cross Number of Mean seed P value
Siliques weight (µg) ± se
[Col 2x X Col 4x] 3 23.5 ± 3.0
BC2(Tsu-1)F3 X Col 4x
1 4 30.2 ± 1.0 0.059
2 4 39.7 ± 1.7 0.004
3 4 38.0 ± 3.3 0.031
4 3 35.9 ± 1.3 0.019
5 4 28.0 ± 0.9 0.161
6 5 22.1 ± 1.5 0.692
7 3 52.4 ± 3.2 0.003
8 3 31.0 ± 4.0 0.205
9 4 35.5 ± 2.2 0.021
10 3 39.8 ± 4.7 0.043
11 4 41.3 ± 3.3 0.012
12 5 22.2 ± 1.2 0.676
13 4 39.9 ± 2.9 0.012
14 4 31.2 ± 3.3 0.159
15 5 27.6 ± 0.4 0.723
16 3 25.2 ± 2.1 0.666
Table 5.9: Identification of Col 4x submissive BC2(Tsu-1)F3 plants. BC2(Tsu-1)F3 plants were crossed with Col 4x pollen and the mean seed
weight of the resulting seeds determined. P values are for a comparison
between [BC2(Tsu-1)F3 X Col 4x] and the control cross, [Tsu 2x X Col 4x].
The plant selected for entry into the next round of back-crossing is highlighted
in yellow.
Figure 5.21: Seed produced in [BC2F3XCol4x] test
crosses. (a) [Tsu X Col 4x] control seed (b) seed from a
highly resistant plant (c) [Col 2x X Col 4x] control seed
(d) seed from a highly submissive plant. Scale bar = 1mm.
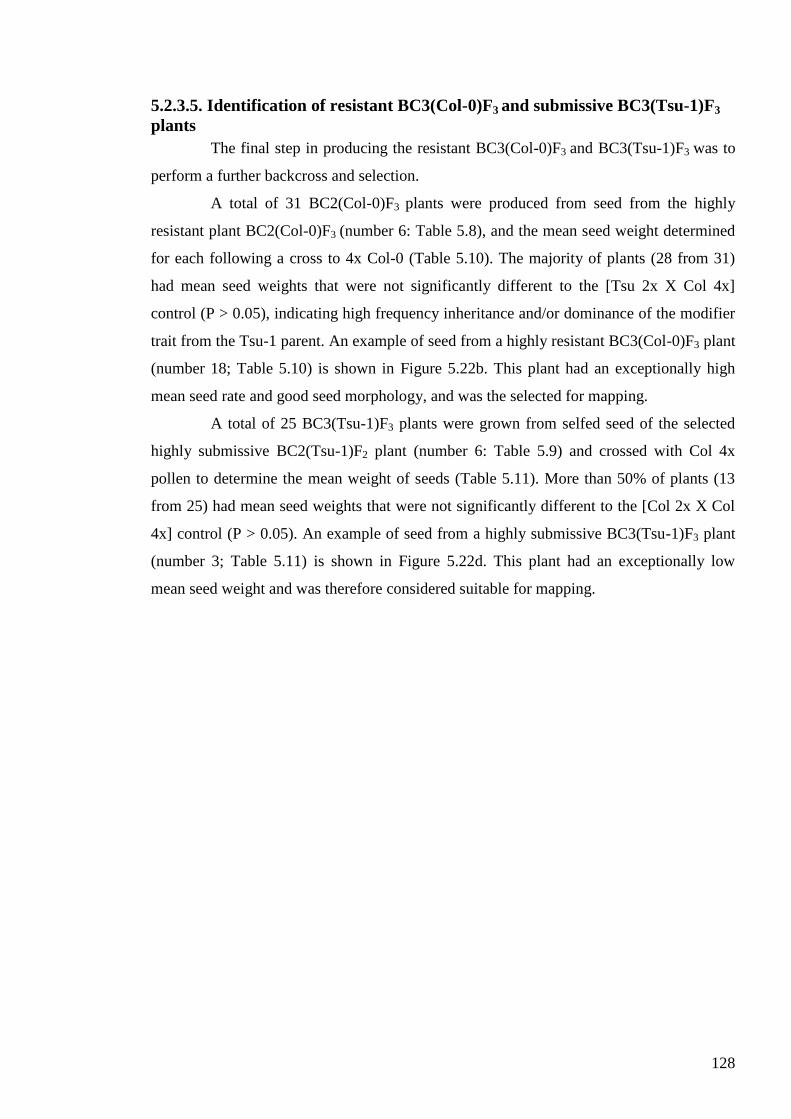
128
5.2.3.5. Identification of resistant BC3(Col-0)F3 and submissive BC3(Tsu-1)F3
plants
The final step in producing the resistant BC3(Col-0)F3 and BC3(Tsu-1)F3 was to
perform a further backcross and selection.
A total of 31 BC2(Col-0)F3 plants were produced from seed from the highly
resistant plant BC2(Col-0)F3 (number 6: Table 5.8), and the mean seed weight determined
for each following a cross to 4x Col-0 (Table 5.10). The majority of plants (28 from 31)
had mean seed weights that were not significantly different to the [Tsu 2x X Col 4x]
control (P > 0.05), indicating high frequency inheritance and/or dominance of the modifier
trait from the Tsu-1 parent. An example of seed from a highly resistant BC3(Col-0)F3 plant
(number 18; Table 5.10) is shown in Figure 5.22b. This plant had an exceptionally high
mean seed rate and good seed morphology, and was the selected for mapping.
A total of 25 BC3(Tsu-1)F3 plants were grown from selfed seed of the selected
highly submissive BC2(Tsu-1)F2 plant (number 6: Table 5.9) and crossed with Col 4x
pollen to determine the mean weight of seeds (Table 5.11). More than 50% of plants (13
from 25) had mean seed weights that were not significantly different to the [Col 2x X Col
4x] control (P > 0.05). An example of seed from a highly submissive BC3(Tsu-1)F3 plant
(number 3; Table 5.11) is shown in Figure 5.22d. This plant had an exceptionally low
mean seed weight and was therefore considered suitable for mapping.
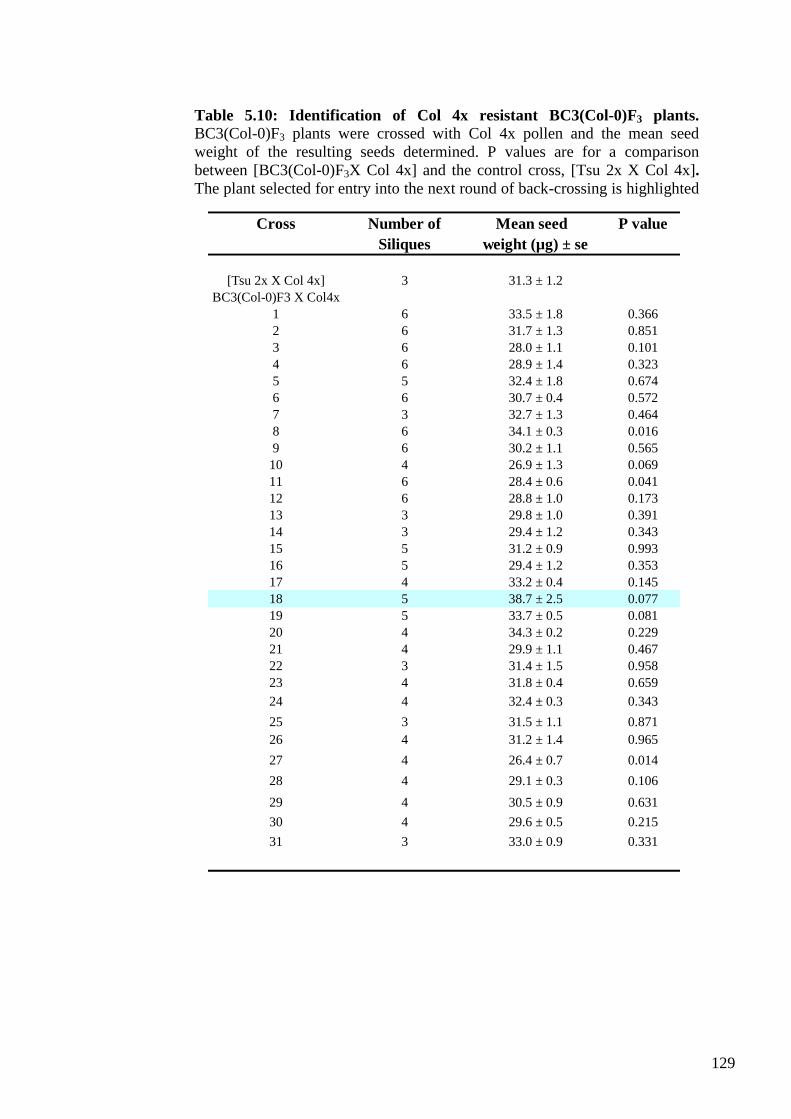
129
Cross Number of Mean seed P value
Siliques weight (µg) ± se
[Tsu 2x X Col 4x] 3 31.3 ± 1.2
BC3(Col-0)F3 X Col4x
1 6 33.5 ± 1.8 0.366
2 6 31.7 ± 1.3 0.851
3 6 28.0 ± 1.1 0.101
4 6 28.9 ± 1.4 0.323
5 5 32.4 ± 1.8 0.674
6 6 30.7 ± 0.4 0.572
7 3 32.7 ± 1.3 0.464
8 6 34.1 ± 0.3 0.016
9 6 30.2 ± 1.1 0.565
10 4 26.9 ± 1.3 0.069
11 6 28.4 ± 0.6 0.041
12 6 28.8 ± 1.0 0.173
13 3 29.8 ± 1.0 0.391
14 3 29.4 ± 1.2 0.343
15 5 31.2 ± 0.9 0.993
16 5 29.4 ± 1.2 0.353
17 4 33.2 ± 0.4 0.145
18 5 38.7 ± 2.5 0.077
19 5 33.7 ± 0.5 0.081
20 4 34.3 ± 0.2 0.229
21 4 29.9 ± 1.1 0.467
22 3 31.4 ± 1.5 0.958
23 4 31.8 ± 0.4 0.659
24 4 32.4 ± 0.3 0.343
25 3 31.5 ± 1.1 0.871
26 4 31.2 ± 1.4 0.965
27 4 26.4 ± 0.7 0.014
28 4 29.1 ± 0.3 0.106
29 4 30.5 ± 0.9 0.631
30 4 29.6 ± 0.5 0.215
31 3 33.0 ± 0.9 0.331
Table 5.10: Identification of Col 4x resistant BC3(Col-0)F3 plants. BC3(Col-0)F3 plants were crossed with Col 4x pollen and the mean seed
weight of the resulting seeds determined. P values are for a comparison
between [BC3(Col-0)F3X Col 4x] and the control cross, [Tsu 2x X Col 4x].
The plant selected for entry into the next round of back-crossing is highlighted
in blue.
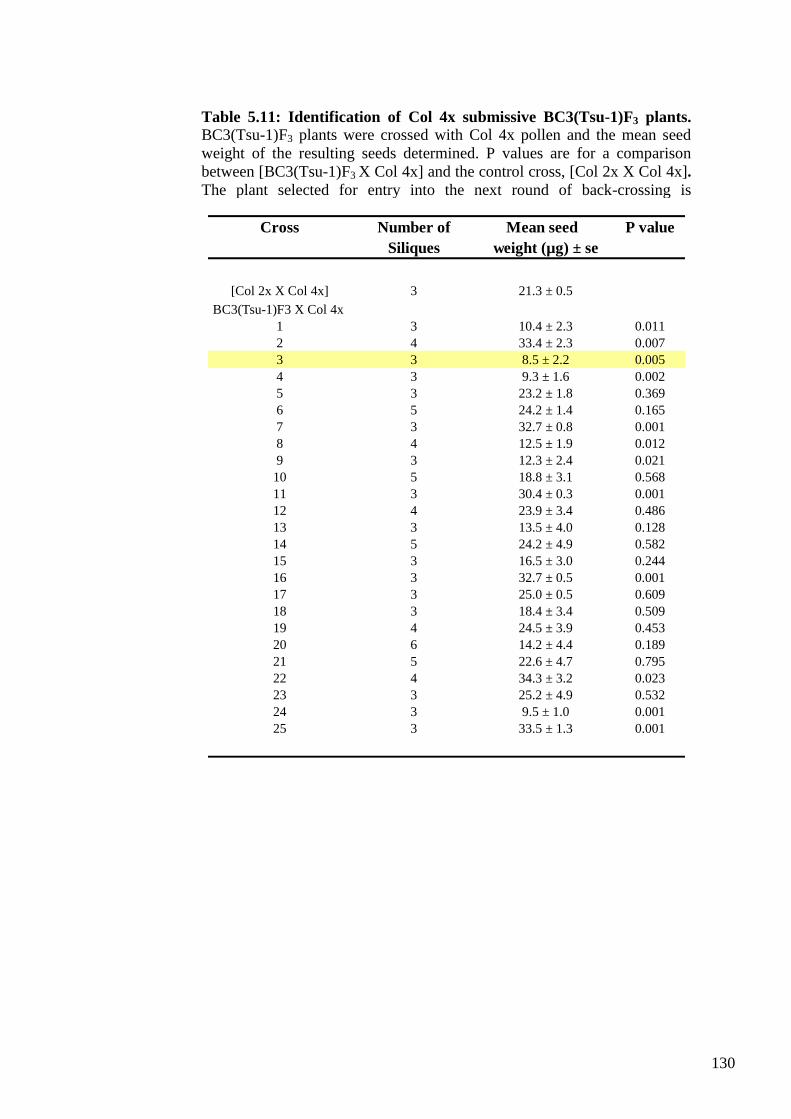
130
Cross Number of Mean seed P value
Siliques weight (µg) ± se
[Col 2x X Col 4x] 3 21.3 ± 0.5
BC3(Tsu-1)F3 X Col 4x
1 3 10.4 ± 2.3 0.011
2 4 33.4 ± 2.3 0.007
3 3 8.5 ± 2.2 0.005
4 3 9.3 ± 1.6 0.002
5 3 23.2 ± 1.8 0.369
6 5 24.2 ± 1.4 0.165
7 3 32.7 ± 0.8 0.001
8 4 12.5 ± 1.9 0.012
9 3 12.3 ± 2.4 0.021
10 5 18.8 ± 3.1 0.568
11 3 30.4 ± 0.3 0.001
12 4 23.9 ± 3.4 0.486
13 3 13.5 ± 4.0 0.128
14 5 24.2 ± 4.9 0.582
15 3 16.5 ± 3.0 0.244
16 3 32.7 ± 0.5 0.001
17 3 25.0 ± 0.5 0.609
18 3 18.4 ± 3.4 0.509
19 4 24.5 ± 3.9 0.453
20 6 14.2 ± 4.4 0.189
21 5 22.6 ± 4.7 0.795
22 4 34.3 ± 3.2 0.023
23 3 25.2 ± 4.9 0.532
24 3 9.5 ± 1.0 0.001
25 3 33.5 ± 1.3 0.001
Table 5.11: Identification of Col 4x submissive BC3(Tsu-1)F3 plants. BC3(Tsu-1)F3 plants were crossed with Col 4x pollen and the mean seed
weight of the resulting seeds determined. P values are for a comparison
between [BC3(Tsu-1)F3 X Col 4x] and the control cross, [Col 2x X Col 4x].
The plant selected for entry into the next round of back-crossing is
highlighted in yellow.
Yellow colour shows the value of highly submissive BC3F3 plant
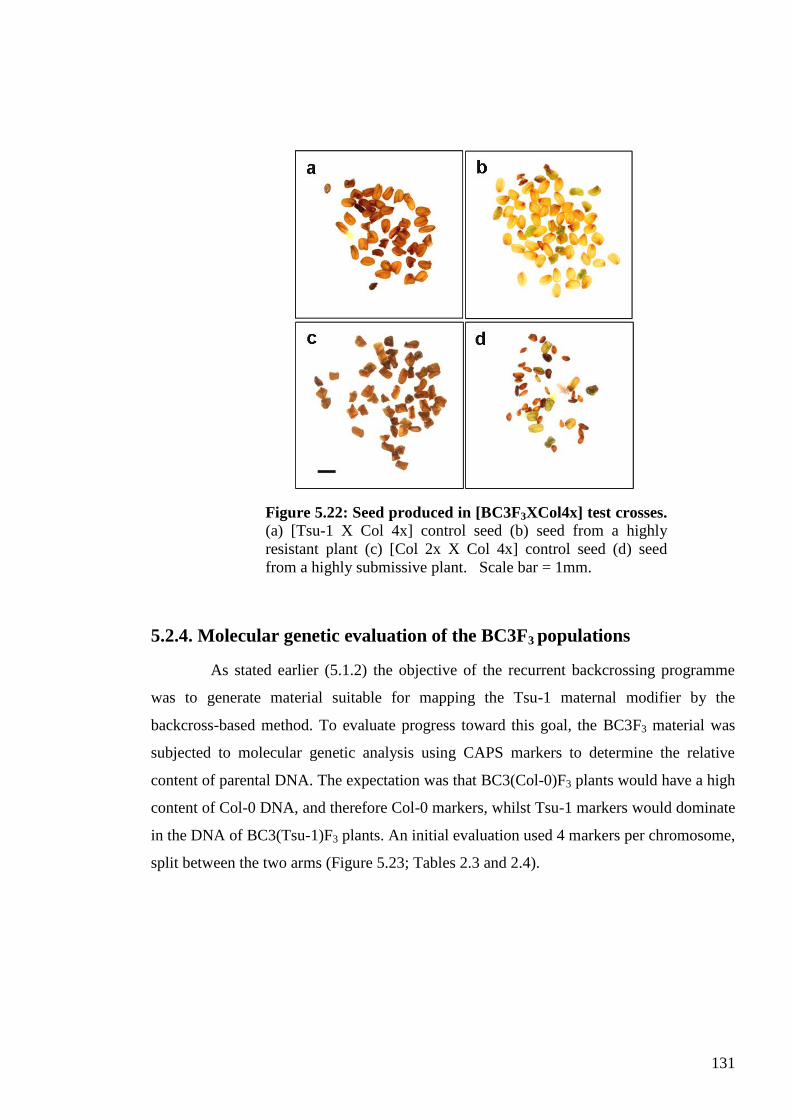
131
5.2.4. Molecular genetic evaluation of the BC3F3 populations
As stated earlier (5.1.2) the objective of the recurrent backcrossing programme
was to generate material suitable for mapping the Tsu-1 maternal modifier by the
backcross-based method. To evaluate progress toward this goal, the BC3F3 material was
subjected to molecular genetic analysis using CAPS markers to determine the relative
content of parental DNA. The expectation was that BC3(Col-0)F3 plants would have a high
content of Col-0 DNA, and therefore Col-0 markers, whilst Tsu-1 markers would dominate
in the DNA of BC3(Tsu-1)F3 plants. An initial evaluation used 4 markers per chromosome,
split between the two arms (Figure 5.23; Tables 2.3 and 2.4).
Figure 5.22: Seed produced in [BC3F3XCol4x] test crosses.
(a) [Tsu-1 X Col 4x] control seed (b) seed from a highly
resistant plant (c) [Col 2x X Col 4x] control seed (d) seed
from a highly submissive plant. Scale bar = 1mm.
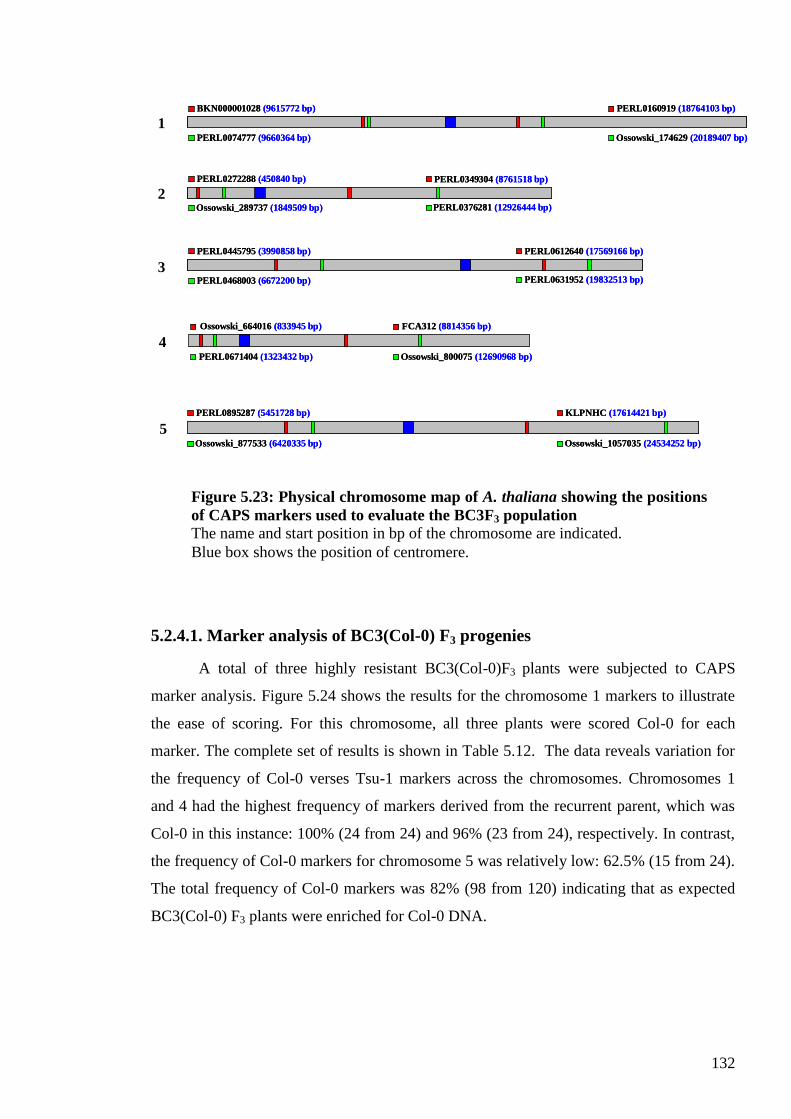
132
5.2.4.1. Marker analysis of BC3(Col-0) F3 progenies
A total of three highly resistant BC3(Col-0)F3 plants were subjected to CAPS
marker analysis. Figure 5.24 shows the results for the chromosome 1 markers to illustrate
the ease of scoring. For this chromosome, all three plants were scored Col-0 for each
marker. The complete set of results is shown in Table 5.12. The data reveals variation for
the frequency of Col-0 verses Tsu-1 markers across the chromosomes. Chromosomes 1
and 4 had the highest frequency of markers derived from the recurrent parent, which was
Col-0 in this instance: 100% (24 from 24) and 96% (23 from 24), respectively. In contrast,
the frequency of Col-0 markers for chromosome 5 was relatively low: 62.5% (15 from 24).
The total frequency of Col-0 markers was 82% (98 from 120) indicating that as expected
BC3(Col-0) F3 plants were enriched for Col-0 DNA.
BKN000001028 (9615772 bp)BKN000001028 (9615772 bp)
PERL0074777 (9660364 bp)PERL0074777 (9660364 bp)
PERL0160919 (18764103 bp)PERL0160919 (18764103 bp)
Ossowski_174629 (20189407 bp)Ossowski_174629 (20189407 bp)
PERL0272288 (450840 bp)PERL0272288 (450840 bp)
Ossowski_289737 (1849509 bp)Ossowski_289737 (1849509 bp)
PERL0349304 (8761518 bp)PERL0349304 (8761518 bp)
PERL0376281 (12926444 bp)PERL0376281 (12926444 bp)
PERL0468003 (6672200 bp)PERL0468003 (6672200 bp)
PERL0445795 (3990858 bp)PERL0445795 (3990858 bp) PERL0612640 (17569166 bp)PERL0612640 (17569166 bp)
PERL0631952 (19832513 bp)PERL0631952 (19832513 bp)
Ossowski_664016 (833945 bp)Ossowski_664016 (833945 bp)
PERL0671404 (1323432 bp)PERL0671404 (1323432 bp)
FCA312 (8814356 bp)FCA312 (8814356 bp)
Ossowski_800075 (12690968 bp)Ossowski_800075 (12690968 bp)
PERL0895287 (5451728 bp)PERL0895287 (5451728 bp)
Ossowski_877533 (6420335 bp)Ossowski_877533 (6420335 bp)
KLPNHC (17614421 bp)KLPNHC (17614421 bp)
Ossowski_1057035 (24534252 bp)Ossowski_1057035 (24534252 bp)
1
2
3
4
5
Figure 5.23: Physical chromosome map of A. thaliana showing the positions
of CAPS markers used to evaluate the BC3F3 population
The name and start position in bp of the chromosome are indicated.
Blue box shows the position of centromere.
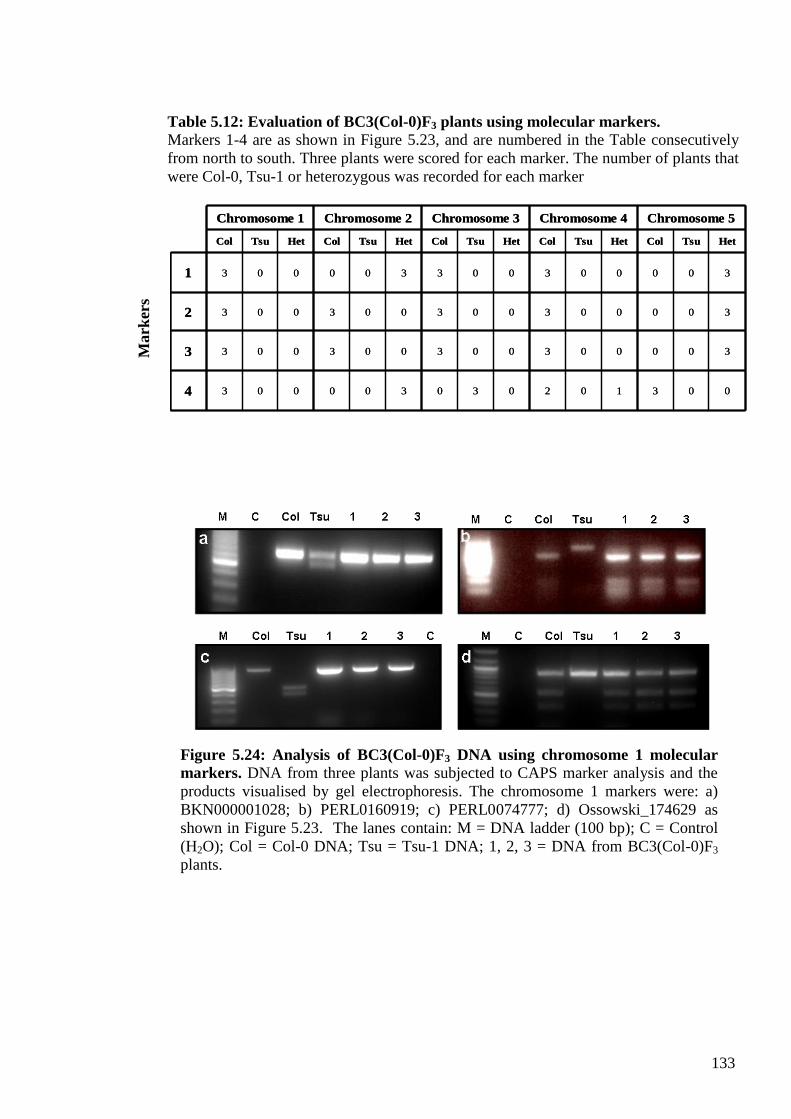
133
0031020303000034
3000030030030033
3000030030030032
3000030033000031
HetTsuColHetTsuColHetTsuColHetTsuColHetTsuCol
Chromosome 5Chromosome 4Chromosome 3Chromosome 2Chromosome 1
0031020303000034
3000030030030033
3000030030030032
3000030033000031
HetTsuColHetTsuColHetTsuColHetTsuColHetTsuCol
Chromosome 5Chromosome 4Chromosome 3Chromosome 2Chromosome 1
Figure 5.24: Analysis of BC3(Col-0)F3 DNA using chromosome 1 molecular
markers. DNA from three plants was subjected to CAPS marker analysis and the
products visualised by gel electrophoresis. The chromosome 1 markers were: a)
BKN000001028; b) PERL0160919; c) PERL0074777; d) Ossowski_174629 as
shown in Figure 5.23. The lanes contain: M = DNA ladder (100 bp); C = Control
(H2O); Col = Col-0 DNA; Tsu = Tsu-1 DNA; 1, 2, 3 = DNA from BC3(Col-0)F3
plants.
Mark
ers
Table 5.12: Evaluation of BC3(Col-0)F3 plants using molecular markers.
Markers 1-4 are as shown in Figure 5.23, and are numbered in the Table consecutively
from north to south. Three plants were scored for each marker. The number of plants that
were Col-0, Tsu-1 or heterozygous was recorded for each marker
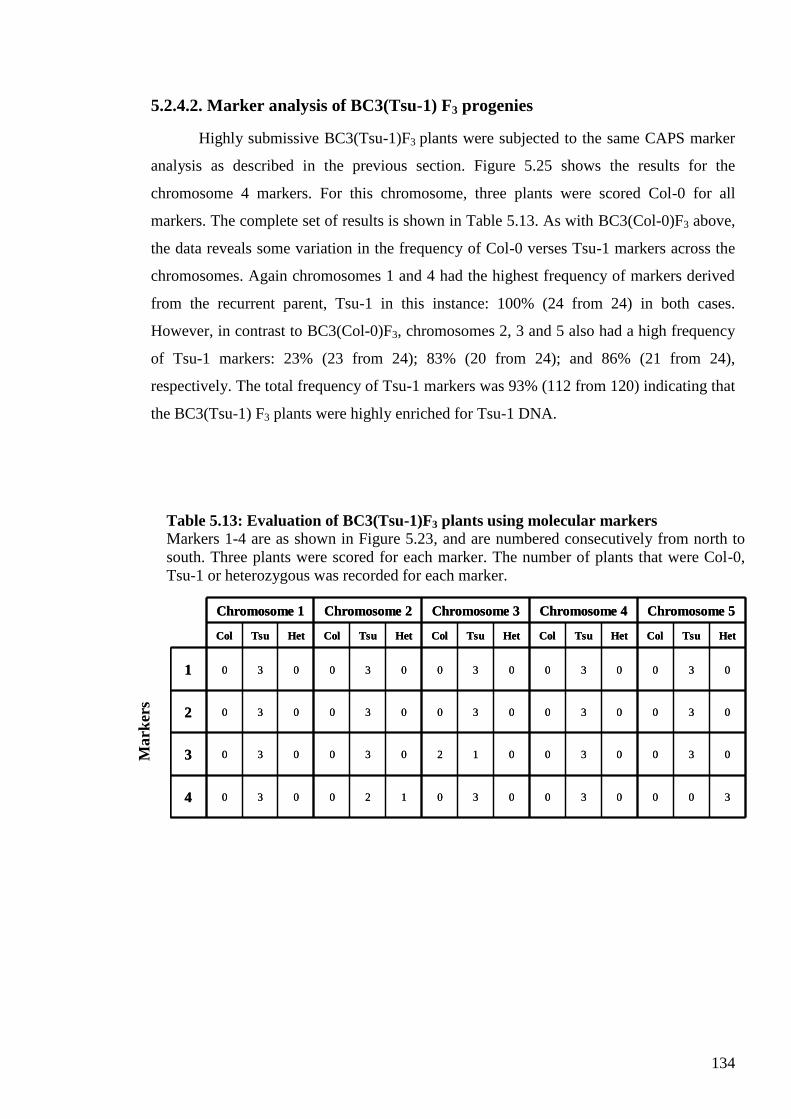
134
5.2.4.2. Marker analysis of BC3(Tsu-1) F3 progenies
Highly submissive BC3(Tsu-1)F3 plants were subjected to the same CAPS marker
analysis as described in the previous section. Figure 5.25 shows the results for the
chromosome 4 markers. For this chromosome, three plants were scored Col-0 for all
markers. The complete set of results is shown in Table 5.13. As with BC3(Col-0)F3 above,
the data reveals some variation in the frequency of Col-0 verses Tsu-1 markers across the
chromosomes. Again chromosomes 1 and 4 had the highest frequency of markers derived
from the recurrent parent, Tsu-1 in this instance: 100% (24 from 24) in both cases.
However, in contrast to BC3(Col-0)F3, chromosomes 2, 3 and 5 also had a high frequency
of Tsu-1 markers: 23% (23 from 24); 83% (20 from 24); and 86% (21 from 24),
respectively. The total frequency of Tsu-1 markers was 93% (112 from 120) indicating that
the BC3(Tsu-1) F3 plants were highly enriched for Tsu-1 DNA.
3000300301200304
0300300120300303
0300300300300302
0300300300300301
HetTsuColHetTsuColHetTsuColHetTsuColHetTsuCol
Chromosome 5Chromosome 4Chromosome 3Chromosome 2Chromosome 1
3000300301200304
0300300120300303
0300300300300302
0300300300300301
HetTsuColHetTsuColHetTsuColHetTsuColHetTsuCol
Chromosome 5Chromosome 4Chromosome 3Chromosome 2Chromosome 1
Table 5.13: Evaluation of BC3(Tsu-1)F3 plants using molecular markers
Markers 1-4 are as shown in Figure 5.23, and are numbered consecutively from north to
south. Three plants were scored for each marker. The number of plants that were Col-0,
Tsu-1 or heterozygous was recorded for each marker.
Mark
ers
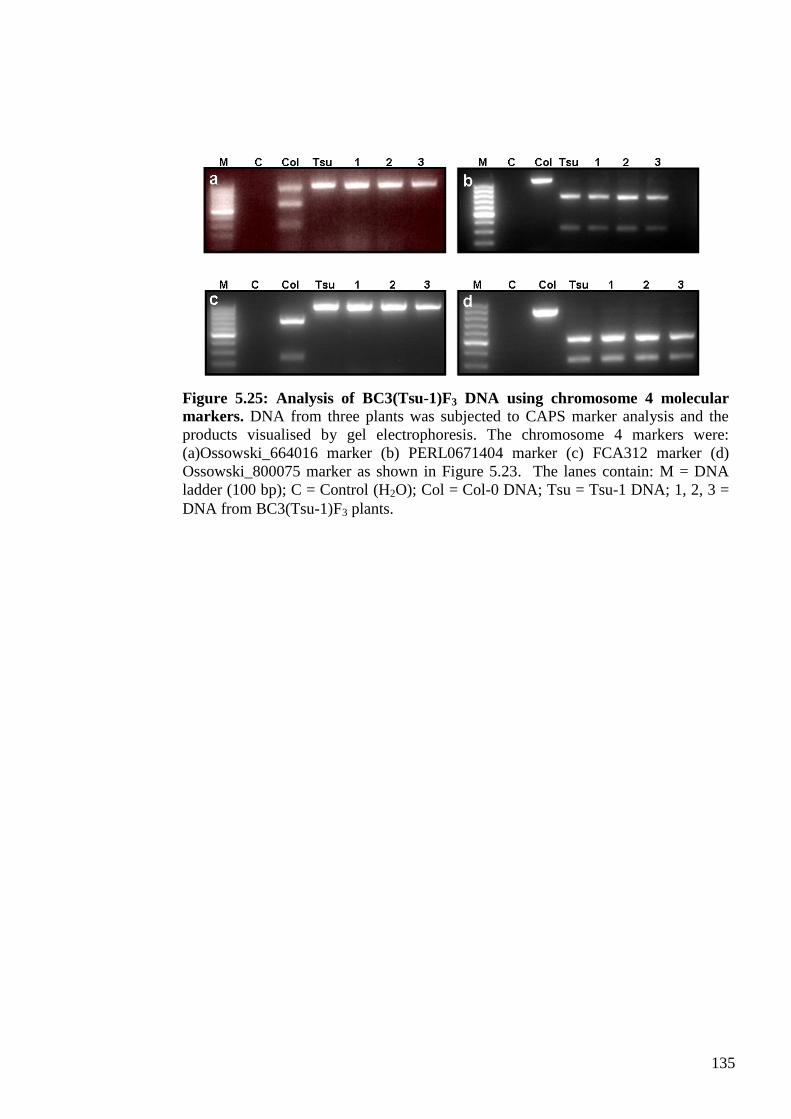
135
Figure 5.25: Analysis of BC3(Tsu-1)F3 DNA using chromosome 4 molecular
markers. DNA from three plants was subjected to CAPS marker analysis and the
products visualised by gel electrophoresis. The chromosome 4 markers were:
(a)Ossowski_664016 marker (b) PERL0671404 marker (c) FCA312 marker (d)
Ossowski_800075 marker as shown in Figure 5.23. The lanes contain: M = DNA
ladder (100 bp); C = Control (H2O); Col = Col-0 DNA; Tsu = Tsu-1 DNA; 1, 2, 3 =
DNA from BC3(Tsu-1)F3 plants.
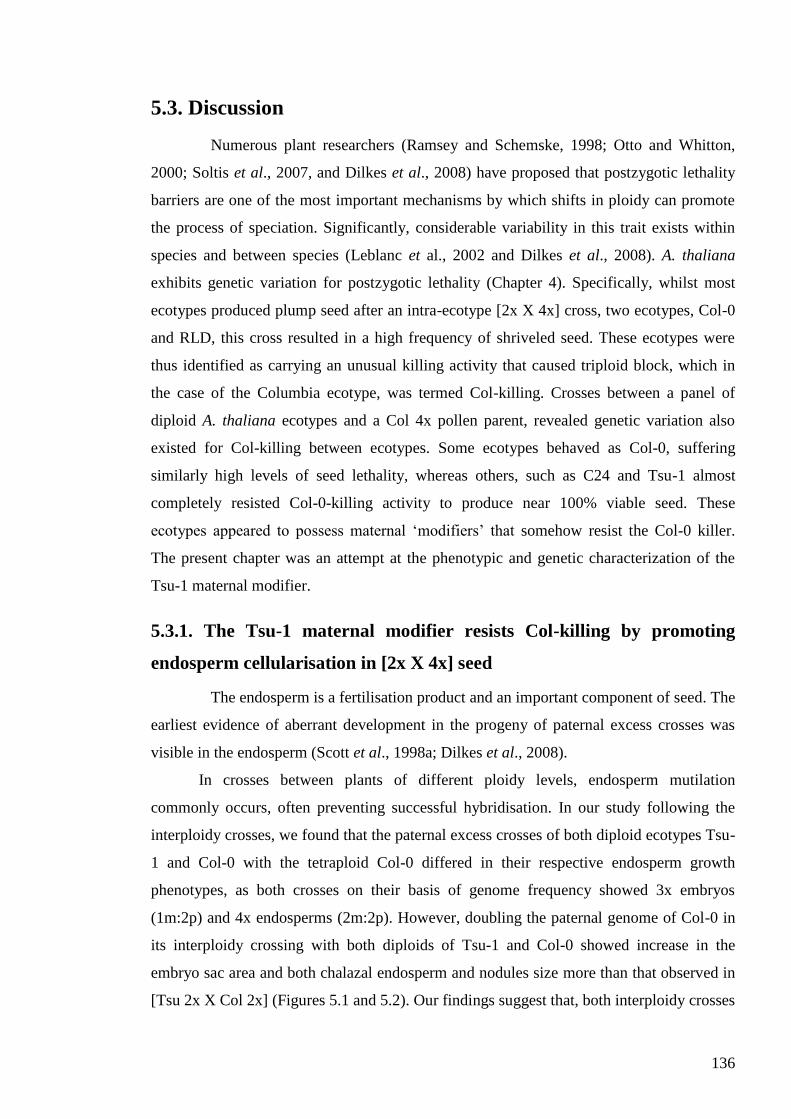
136
5.3. Discussion
Numerous plant researchers (Ramsey and Schemske, 1998; Otto and Whitton,
2000; Soltis et al., 2007, and Dilkes et al., 2008) have proposed that postzygotic lethality
barriers are one of the most important mechanisms by which shifts in ploidy can promote
the process of speciation. Significantly, considerable variability in this trait exists within
species and between species (Leblanc et al., 2002 and Dilkes et al., 2008). A. thaliana
exhibits genetic variation for postzygotic lethality (Chapter 4). Specifically, whilst most
ecotypes produced plump seed after an intra-ecotype [2x X 4x] cross, two ecotypes, Col-0
and RLD, this cross resulted in a high frequency of shriveled seed. These ecotypes were
thus identified as carrying an unusual killing activity that caused triploid block, which in
the case of the Columbia ecotype, was termed Col-killing. Crosses between a panel of
diploid A. thaliana ecotypes and a Col 4x pollen parent, revealed genetic variation also
existed for Col-killing between ecotypes. Some ecotypes behaved as Col-0, suffering
similarly high levels of seed lethality, whereas others, such as C24 and Tsu-1 almost
completely resisted Col-0-killing activity to produce near 100% viable seed. These
ecotypes appeared to possess maternal ‗modifiers‘ that somehow resist the Col-0 killer.
The present chapter was an attempt at the phenotypic and genetic characterization of the
Tsu-1 maternal modifier.
5.3.1. The Tsu-1 maternal modifier resists Col-killing by promoting
endosperm cellularisation in [2x X 4x] seed
The endosperm is a fertilisation product and an important component of seed. The
earliest evidence of aberrant development in the progeny of paternal excess crosses was
visible in the endosperm (Scott et al., 1998a; Dilkes et al., 2008).
In crosses between plants of different ploidy levels, endosperm mutilation
commonly occurs, often preventing successful hybridisation. In our study following the
interploidy crosses, we found that the paternal excess crosses of both diploid ecotypes Tsu-
1 and Col-0 with the tetraploid Col-0 differed in their respective endosperm growth
phenotypes, as both crosses on their basis of genome frequency showed 3x embryos
(1m:2p) and 4x endosperms (2m:2p). However, doubling the paternal genome of Col-0 in
its interploidy crossing with both diploids of Tsu-1 and Col-0 showed increase in the
embryo sac area and both chalazal endosperm and nodules size more than that observed in
[Tsu 2x X Col 2x] (Figures 5.1 and 5.2). Our findings suggest that, both interploidy crosses
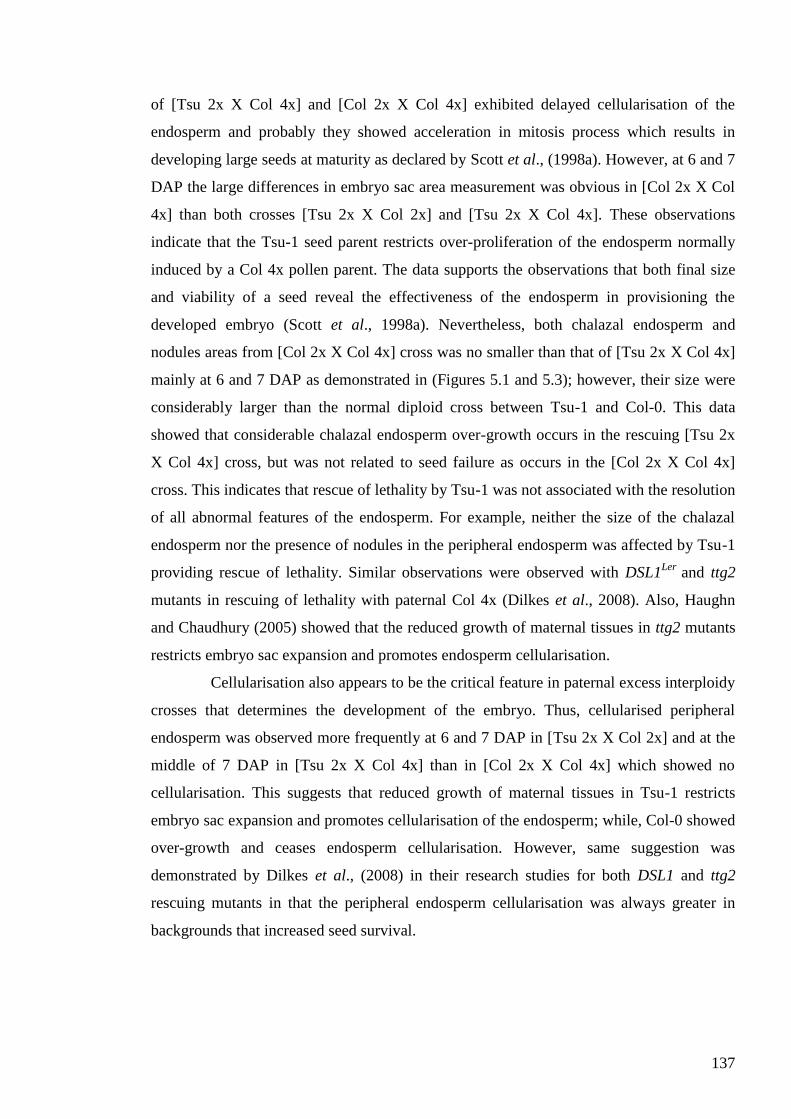
137
of [Tsu 2x X Col 4x] and [Col 2x X Col 4x] exhibited delayed cellularisation of the
endosperm and probably they showed acceleration in mitosis process which results in
developing large seeds at maturity as declared by Scott et al., (1998a). However, at 6 and 7
DAP the large differences in embryo sac area measurement was obvious in [Col 2x X Col
4x] than both crosses [Tsu 2x X Col 2x] and [Tsu 2x X Col 4x]. These observations
indicate that the Tsu-1 seed parent restricts over-proliferation of the endosperm normally
induced by a Col 4x pollen parent. The data supports the observations that both final size
and viability of a seed reveal the effectiveness of the endosperm in provisioning the
developed embryo (Scott et al., 1998a). Nevertheless, both chalazal endosperm and
nodules areas from [Col 2x X Col 4x] cross was no smaller than that of [Tsu 2x X Col 4x]
mainly at 6 and 7 DAP as demonstrated in (Figures 5.1 and 5.3); however, their size were
considerably larger than the normal diploid cross between Tsu-1 and Col-0. This data
showed that considerable chalazal endosperm over-growth occurs in the rescuing [Tsu 2x
X Col 4x] cross, but was not related to seed failure as occurs in the [Col 2x X Col 4x]
cross. This indicates that rescue of lethality by Tsu-1 was not associated with the resolution
of all abnormal features of the endosperm. For example, neither the size of the chalazal
endosperm nor the presence of nodules in the peripheral endosperm was affected by Tsu-1
providing rescue of lethality. Similar observations were observed with DSL1Ler
and ttg2
mutants in rescuing of lethality with paternal Col 4x (Dilkes et al., 2008). Also, Haughn
and Chaudhury (2005) showed that the reduced growth of maternal tissues in ttg2 mutants
restricts embryo sac expansion and promotes endosperm cellularisation.
Cellularisation also appears to be the critical feature in paternal excess interploidy
crosses that determines the development of the embryo. Thus, cellularised peripheral
endosperm was observed more frequently at 6 and 7 DAP in [Tsu 2x X Col 2x] and at the
middle of 7 DAP in [Tsu 2x X Col 4x] than in [Col 2x X Col 4x] which showed no
cellularisation. This suggests that reduced growth of maternal tissues in Tsu-1 restricts
embryo sac expansion and promotes cellularisation of the endosperm; while, Col-0 showed
over-growth and ceases endosperm cellularisation. However, same suggestion was
demonstrated by Dilkes et al., (2008) in their research studies for both DSL1 and ttg2
rescuing mutants in that the peripheral endosperm cellularisation was always greater in
backgrounds that increased seed survival.
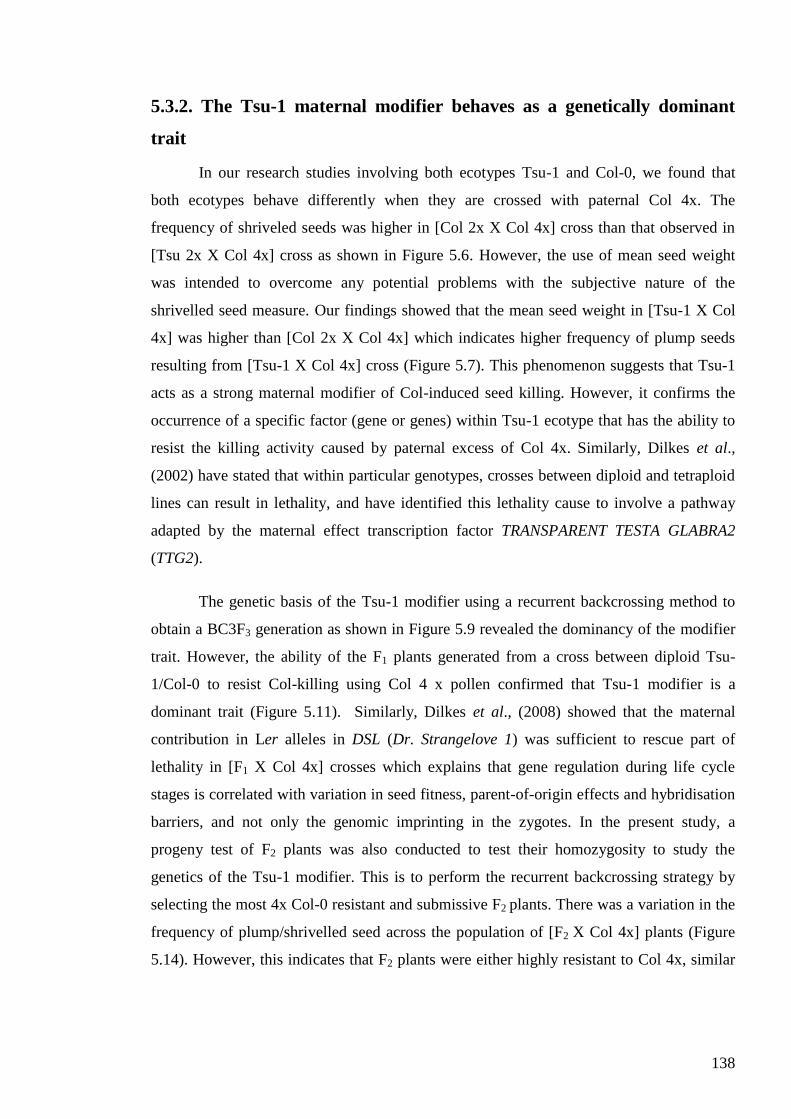
138
5.3.2. The Tsu-1 maternal modifier behaves as a genetically dominant
trait
In our research studies involving both ecotypes Tsu-1 and Col-0, we found that
both ecotypes behave differently when they are crossed with paternal Col 4x. The
frequency of shriveled seeds was higher in [Col 2x X Col 4x] cross than that observed in
[Tsu 2x X Col 4x] cross as shown in Figure 5.6. However, the use of mean seed weight
was intended to overcome any potential problems with the subjective nature of the
shrivelled seed measure. Our findings showed that the mean seed weight in [Tsu-1 X Col
4x] was higher than [Col 2x X Col 4x] which indicates higher frequency of plump seeds
resulting from [Tsu-1 X Col 4x] cross (Figure 5.7). This phenomenon suggests that Tsu-1
acts as a strong maternal modifier of Col-induced seed killing. However, it confirms the
occurrence of a specific factor (gene or genes) within Tsu-1 ecotype that has the ability to
resist the killing activity caused by paternal excess of Col 4x. Similarly, Dilkes et al.,
(2002) have stated that within particular genotypes, crosses between diploid and tetraploid
lines can result in lethality, and have identified this lethality cause to involve a pathway
adapted by the maternal effect transcription factor TRANSPARENT TESTA GLABRA2
(TTG2).
The genetic basis of the Tsu-1 modifier using a recurrent backcrossing method to
obtain a BC3F3 generation as shown in Figure 5.9 revealed the dominancy of the modifier
trait. However, the ability of the F1 plants generated from a cross between diploid Tsu-
1/Col-0 to resist Col-killing using Col 4 x pollen confirmed that Tsu-1 modifier is a
dominant trait (Figure 5.11). Similarly, Dilkes et al., (2008) showed that the maternal
contribution in Ler alleles in DSL (Dr. Strangelove 1) was sufficient to rescue part of
lethality in [F1 X Col 4x] crosses which explains that gene regulation during life cycle
stages is correlated with variation in seed fitness, parent-of-origin effects and hybridisation
barriers, and not only the genomic imprinting in the zygotes. In the present study, a
progeny test of F2 plants was also conducted to test their homozygosity to study the
genetics of the Tsu-1 modifier. This is to perform the recurrent backcrossing strategy by
selecting the most 4x Col-0 resistant and submissive F2 plants. There was a variation in the
frequency of plump/shrivelled seed across the population of [F2 X Col 4x] plants (Figure
5.14). However, this indicates that F2 plants were either highly resistant to Col 4x, similar
139
to Tsu-1; (Figure 5.15), or highly submissive to 4x Col-0 pollen, similar to Col-0; (Figure
5.16).
5.3.3. Recurrent backcrossing produces plants with potential for
mapping the Tsu-1 maternal modifier
The molecular back-cross (BC) breeding strategy being adapted should be able to
help in understanding the process of Tsu-1 maternal modifier mapping. Thus, the advanced
back-cross approach appeared to be an appropriate method to accelerate the process of
introgressing interested traits or genes into a selected material (Robin et al., 2003).
To map the Tsu-1 modifier gene, a number of recurrent backcrosses (BCs) were
applied using the highly resistant and submissive F2 plants. Thus, the backcrossing (BC)
method is widely recognized as a powerful tool to study different inherited traits as well as
QTLs (Butruille et al., 1999). In this study, we generated a number of BC3F3 plants
starting from highly resistant and highly submissive F2 population. Further analysis for
both highly resistant and submissive progenies was done through three successive BCs
(BC1, BC2, and BC3); however, the aim was to produce a resistant plant BC3(Col-0)F3
that would consist of a little amount of Tsu-1 DNA carrying the Tsu-1 modifier locus, and
a relatively large amount Col-0 DNA. On the other hand, the submissive plant BC3(Tsu-
1)F3 having a small amount of Col-0 DNA carrying the Col-0 modifier locus, and a
relatively large amount Tsu-1 DNA.
The molecular genetic analysis of BC3F3 plants using CAPS markers to determine
the relative content of parental DNA showed that the BC3(Col-0) F3 plants were Col-0
DNA as they displayed high frequency of Col-0 markers (82 %) (Table 5.12), while
BC3(Tsu-1) F3 plants were Tsu-1DNA background showing (93 %) high frequency of Tsu-
1 markers (Table 5.13). This method describes the efficiency of transferring a genetic or
multigenic character through back-cross breeding methods.
Similarly, several molecular mapping studies by many biologists have been applied
and adapted to different useful crop plants using back-crossed populations in order to
identify and map different traits. For instance, Robin et al., (2003) mapped the osmotic
adjustment trait associated with drought tolerance in rice from a number of different
(BC3F3) families using an advanced back-cross inbred lines via an indica donor, IR62266-
42-6-2, to introgress osmotic adjustment into a selected japonica cultivar, IR60080-46A.
Moreover, larger magnitudes of segregation distortion were observed in other back-crossed
140
inbred lines (BIL) populations for the reason that they involved interspecific crosses, and
because selection was practiced in favor of the recurrent parent (Fulton et al., 1997; Lin et
al., 1998; and Robin et al., 2003). Until recently the effectiveness of phenotypic selection
for different traits in the BC progenies remains the key to success for many molecular
mapping approaches.
5.4. Conclusion
The Tsu-1 ecotype is highly resistant to 4x Col-0 killing. A detailed examination of
seed development showed that Tsu-1 rescues Col-induced lethality despite not preventing
substantial endosperm over-growth. The basis of rescue was successful cellularisation of
the endosperm, as previously described for Ler- and ttg2-mediated rescue (Dilkes et al.,
2008). In preparation for mapping the Tsu-1 modifier locus a reliable phenotype scoring
was established based on mean seed weight. This measure was positively correlated with a
high frequency of plump seed and therefore presence of the Tsu-1 allele of the proposed
rescuing locus. Genetic analysis established that modifier trait was apparently dominant.
The mapping strategy adopted was to perform a series of recurrent backcrosses starting
from a pair of highly resistant and highly submissive F2 plants. Backcrossing produced
both a resistant BC3(Col-0)F3 and a submissive BC3(Tsu-1)F3 plants. Preliminary DNA
marker analysis established that the resistant BC3(Col-0)F3 was enriched for Col-0 DNA
and sensitive BC3(Tsu-1)F3 was enriched for Tsu-1 DNA. These populations will be useful
in identifying Tsu-1 maternal modifier genes.
.
141
Chapter 6
6. The genetics of the Col-0 killing trait
6.1. Introduction Most studies of plant hybridisation have been concerned with documenting its
occurrence in different plant groups. Thus, numerous studies have been performed on
crossing between plants, and substantial evidence has been gathered on the kinds and
strength of post-mating reproductive barriers in both closely and distantly related plant
species (Grant, 1981; Jackson, 1985; Rieseberg and Carney, 1998).
6.1.1. Hybridisation barriers control F1 lethality in the Col-0 ecotype
One of the most interesting aspects of speciation research is to understand the
molecular mechanisms underlying the lethality of F1 hybrids that occurs following crosses
between diverged parents. Whilst most post-mating barriers occur between species
(Rieseberg and Carney, 1998), crosses between diploid and tetraploid individuals of the
same species frequently result in the lethality of F1 hybrids; a process termed triploid block
(Köhler et al., 2010). Such postzygotic lethality is hypothesized to play an important role
in polyploidy speciation (Dilkes et al., 2008).
Chapter 4 describes an investigation of F1 lethality in interploidy crosses within A.
thaliana. In contrast to many other species, most ecotypes of A. thaliana that were tested
did not exhibit triploid block i.e. diploid-tetraploid interploidy crosses produced very low
levels of aborted seed. However, in contrast, the Columbia ecotype exhibited an unusual
paternal-only triploid block where the maternal excess cross, [Col 4x X Col 2x] produced
mostly viable seed whilst the reciprocal, paternal excess cross [Col 2x X Col 4x] resulted
in high levels of seed abortion (Dilkes et al., 2008). Columbia is therefore more
representative of other species in its interploidy crossing behaviour than the bulk A.
thaliana ecotypes.
A number of authors have hypothesized that F1 lethality barriers resulting from both
interploidy and interspecific crosses and changes in genome dosage could be controlled by
the same mechanisms (Johnston et al., 1980; Haig and Westoby, 1991; Bushell et al.,
2003, and Dilkes et al., 2008). One of these mechanisms is the variation in imprinted
genes, which is responsible for the postzygotic lethality in interploidy crosses (Lin 1984;
Haig and Westoby, 1991, and Dilkes et al., 2008). The interploidy and interspecific
142
barriers are proposed to be affected by genome dosage, multiple dosage-sensitive genetic
mechanisms, and inclusive of imprinting (Johnston et al., 1980; Haig and Westoby, 1989;
Haig and Westoby, 1991; von Wangenheim and Peterson, 2004; Dilkes and Comai, 2004,
and Dilkes et al., 2008). The identification of Columbia as having a typical interploidy
hybridisation barrier i.e. triploid block, at least on the paternal side, provided an
opportunity to investigate postzygotic lethality at the molecular genetic level, and thereby
provide evidence for or against the above mechanisms.
6.1.2. STAIRS and CSS lines: powerful genetic resources for functional
genomic studies in Arabidopsis
Many researchers found that different biological and ecological quantitative traits
in plants and animals are controlled by a serious of genes that shows continuous variation
in the progeny. These genes are known as quantitative trait loci (QTL). Many efforts have
been made to map such QTL because of their biological and agronomic importance
(Takahashi et al., 2001). The development of high-density linkage maps based on DNA
markers has facilitated the mapping of QTL to high resolution (Paterson et al., 1988;
Takahashi et al., 2001). However, the main problem in studying QTL remains providing
sufficient resolution to subsequently identify underlying candidate genes such as that in
rice and Arabidopsis (Zeng et al., 2007) and potato (Kloosterman, 2010).This problem is
mainly due to the relatively small effect of the allelic differences (their individual effects
on the phenotype are very small) compared to the large variation caused by other loci and
the environment.
Chromosome Substitution Strains (CSS) and Stepped Aligned Inbred Recombinant
Strains (STAIRS) are two associated genetic resources in A. thaliana that are useful in
mapping QTL (Koumproglou et al., 2002). The CSS lines are a series of five homozygous
strains (CSS1-5), in which one of the Col chromosome pairs has been replaced by the
corresponding Ler chromosome. For example, in CSS1 chromosome 1 is derived from Ler
and chromosomes 2-5 from Col. These strains allow genetic differences between Col and
Ler to be assigned easily to particular chromosomes which facilitates the QTL to be linked
in repulsion and not cancel out (Koumproglou et al., 2002). CSS lines have been used in
diverse species such as wheat (Law et al., 1983; 1987), rice (Wang et al., 2006; Zhu et al.,
2009) and the mouse (Nadeau et al., 2000; Singer et al., 2005; Burrage et al., 2010).
143
STAIRS are derived from each CSS line and are used to progress mapping toward
gene location. They consist of a large number of lines; each line consists of a homozygous
chromosome (known as single recombinant lines or SRLs) with a single crossover, such
that the chromosome will contain the donor genes at one end and the recipient genes at the
other end (Koumproglou et al., 2002). In fact, STAIRS allow genetic differences between
donor and recipient individuals to be allocated to particular regions within a chromosome.
SRLs are stacked chronologically for each chromosome in a step-like progression with
each successive line from both donor and recipient individuals. STAIRS with wide steps
allow rough gene mapping (5-10 cM), while narrower steps within that region allow gene
location to less than 1 cM. The major advantage of STAIRS is that they enable
comparisons of the phenotypes of numbers or pairs of lines in which the genetic
differences lie in short regions of one selected chromosome. Moreover, CSS lines and
STAIRS have a particular value in the analysis of QTLs, for candidate gene searching, and
for different gene expression studies.
6.1.3. Recombinant inbred lines (RILs) and their role in Arabidopsis
genomic studies
Many agriculturally important traits such as yield, quality and some forms of
disease resistances are controlled by QTL (Collard et al., 2005). Most QTL detection
experiments have been conducted starting with inbred lines including, backcross (BC),
advanced backcross, F2, recombinant inbred (RI) populations, intermated recombinant
inbred (IRI) populations, advanced intercross (AI) populations, advanced backcross
populations, double haploid (DH) populations (Winkler et al., 2003; Broman, 2005; Kao,
2006). A. thaliana recombinant inbred lines (RILs) can serve as powerful tools for genetic
mapping studies. The primary advantage of RI populations is that is that they can be used
indefinitely in mapping since each RIL is an inbred strain and can be easily propagated;
hence, these populations can be evaluated by different researchers, in different
environments, and at different times (Wu et al., 2003). Many researchers have used RILs
populations for mapping research a variety of plants including maize (Burr et al., 1988;
Burr and Burr, 1991; Carson et al., 1996; Austin and Lee, 1996), wheat (Snape et al.,
1985; Alonso-Blanco et al., 1998), rice (Nair et al., 1995; Tsunematsu et al., 1996, and
Cho et al., 2010), sunflower (Langar et al., 2003), soybean (Mansur et al., 1996; Choi et
al., 2010).
144
In A. thaliana RILs are generated from a cross between two different ecotypes. For
example, Col and Ler (Lister and Dean, 1993) and Col-0 and C24 (Törjek et al., 2006).
The process involves crossing the two inbred strains, followed by multiple rounds of
selfing and single seed decent to create a new inbred line whose genome is a mosaic of the
parental genome (Broman, 2005). Several A. thaliana RIL populations have been used for
QTL mapping and subsequent molecular identification of the responsible genes, including
those responsible for seed germination and seed longevity (Clerkx et al., 2004), flowering
time (Törjek et al., 2006), light response and flowering time (Balasubramanian et al.,
2009).
Broman (2005) stated that a panel of RILs has a number of genetic mapping
advantages: each strain can be genotyped once; phenotyping multiple individuals from
each strain can reduce measurement, individual, and environmental variability; the break
points in RILs are more dense than those that occur in any one meiosis thus greater
mapping resolution can be easily achieved.
6.1.4. QTL mapping analysis
Understanding the molecular genetic and biochemical basis of complex traits is
facilitated by identification of QTL and their underlying genes. Most genetic studies have
focused on dichotomous (rather than continuous traits), which are often due to mutation at
a single gene. However, many traits such as flowering time in different Arabidopsis
(Jonathan et al., 2005), osmotic adjustment in rice (Robin et al., 2003), etc; are quantitative
in nature and are affected by many genes and by environmental factors (Broman, 2001).
In A. thaliana, the search for QTL has been carried out in a restricted range of
ecotypes using mainly Recombinant Inbred Lines (RILs). There are many QTL studies
involving the Col-0 by Ler RILs, mainly focusing on flowering time (Koornneef et al.,
1998; Soppe et al., 2000; Werner et al., 2005) or traits related to flowering such as rosette
leaf number (Stratton, 1998) and short integument (Ray et al., 1996). Other traits include
germination rate (Vander-Schaar et al., 1997), floral characters (Juenger et al., 2000),
inflorescence architecture (Ungerer et al., 2002), leaf morphogenesis (Robles et al., 2001)
and trichome spacing and number (Larkin et al., 1996).
However, since Col and Ler are relatively closely related and would therefore not
be expected to show the most extensive polymorphism, other QTL studies have used
different ecotypes such as Warschau-1 (Wa-1) by Col-0 RIL to locate powdery mildew
disease-resistance loci (Schiff et al., 2001) and Bay-0 by Shahdara RIL to locate flowering
145
genes (Loudet et al., 2002). Furthermore, Bay-0 by Shahdara RIL as described by Loudet
et al., (2002) constitutes the largest population in size available in Arabidopsis. They have
analysed the genetic basis of variation in flowering time in Arabidopsis in two different
environments and identified QTL precisely with FRIGIDA and FLOWERING LOCUS C
genes. However, they also stated that Bay-0 by Shahdara RIL population represents a
powerful tool which is currently being used to undertake the genetic dissection of complex
metabolic pathways.
Broman (2001) stated that if two strains show phenotypic differences, despite being
raised in a common environment, the investigator should be confident that there is a
genetic basis for the difference between the two strains. One of the simplest methods to
identify the genes underlying such phenotypic differences is using backcrosses, but the
principal is the same for other methods including those using RILs. The statistical
approaches used in data analysis for different crosses are the same (Collard et al., 2005).
The statistical method logarithm of the odds (to the base 10) (LOD score) (Broman,
2005) is used for linkage analysis in humans, animals, and plant populations. A positive
LOD score indicates the presence of linkage, whereas a negative LOD score indicates that
linkage is less likely (Morton, 1990). The LOD score analysis is the simplest method to
analyse complex family pedigree in order to determine the linkage between Mendelian
traits or between trait and a marker or two markers.
The work described in this chapter was aimed at increasing our understanding of
the mechanism underlying the Col-killer trait by mapping and ultimately identifying the
gene or genes responsible. Gene mapping requires genetic variation for the trait between
genetically polymorphic parents, and a means to score the trait in a segregating population.
A difficulty with the Col-killer trait in this context is that its expression is restricted to a
tetraploid pollen parent, and then only when crossed to a diploid seed parent of either the
same ecotype, or one of number of submissive ecotypes (4.2.3.2). Thus any mapping
strategy would require the means to both generate a tetraploid population segregating for
the trait, and score a potentially large number of segregants for the trait using crosses to a
submissive diploid seed parent.
146
6.2. Results
6.2.1. Strategies for the genetic analysis of the Col-killer trait
Genetic variation for the Col-killer trait that was potentially useful in establishing a
mapping strategy was demonstrated in chapter 4. Crosses between maternal Col 2x and
Col 4x or Ler 4x pollen parents revealed dramatic ecotypic differences in the frequency of
shrivelled seeds among the progeny (4.2.3.1). The frequency of shrivelled seed in the [Col
2x X Col 4x] and [Col 2x X Ler 4x] crosses was 89.2% and 6.1%, respectively. Thus,
these two ecotypes appeared to have a high degree of genetic variation for the killer trait.
Since these ecotypes are also genetically polymorphic, a mapping strategy was developed
based on Col-0 and Ler parents.
As described previously (6.1.3), Recombinant Inbred Lines (RILs) have proved
highly effective in mapping genes where genetic variation exists for a trait between two
ecotypes of A. thaliana. The Lister-Dean RIL population was constructed from Col-0 and
Ler parents and was therefore potentially useful in mapping the Col-killer. Thus a mapping
strategy was developed using this genetic resource. Since a diploid pollen parent does not
express the killer trait, the approach envisaged was to produce tetraploid derivatives of
sufficient ‗core‘ RIL lines to rough map the trait, and score the 4x RILs in crosses to Col
2x. The A. thaliana CSS and STAIR lines (6.1.2) was a second genetic resource with
potential for mapping the killer trait, since these like the Lister-Dean RILs were developed
from Col and Ler parents. However, as described below only a limited attempt at their use
was made in the present work.
6.2.2. The Col-killer trait is expressed in tetraploid Col/Ler F1 hybrids
Since mapping of the Col-killer trait was to be conducted using a genetic resource
that had hybrid Col and Ler genomes, it was important to demonstrate that such a hybrid
was capable of expressing the trait. To do this, two F1 hybrids, Col/Ler 4x and Ler/Col 4x,
were made by crossing 4x Ler and 4x Col-0 plants in both directions and collecting the
resulting seed. F1 hybrids plants derived from this seed were then used as pollen parents in
crosses to 2x Col-0 seed parents and the frequency of plump and shrivelled seed
determined in the resulting siliques (Figures 6.1 and 6.2). Control crosses between Col-0
2x seed parents and both original 4x parents from Ler and Col-0 ecotypes were made at the
same time.
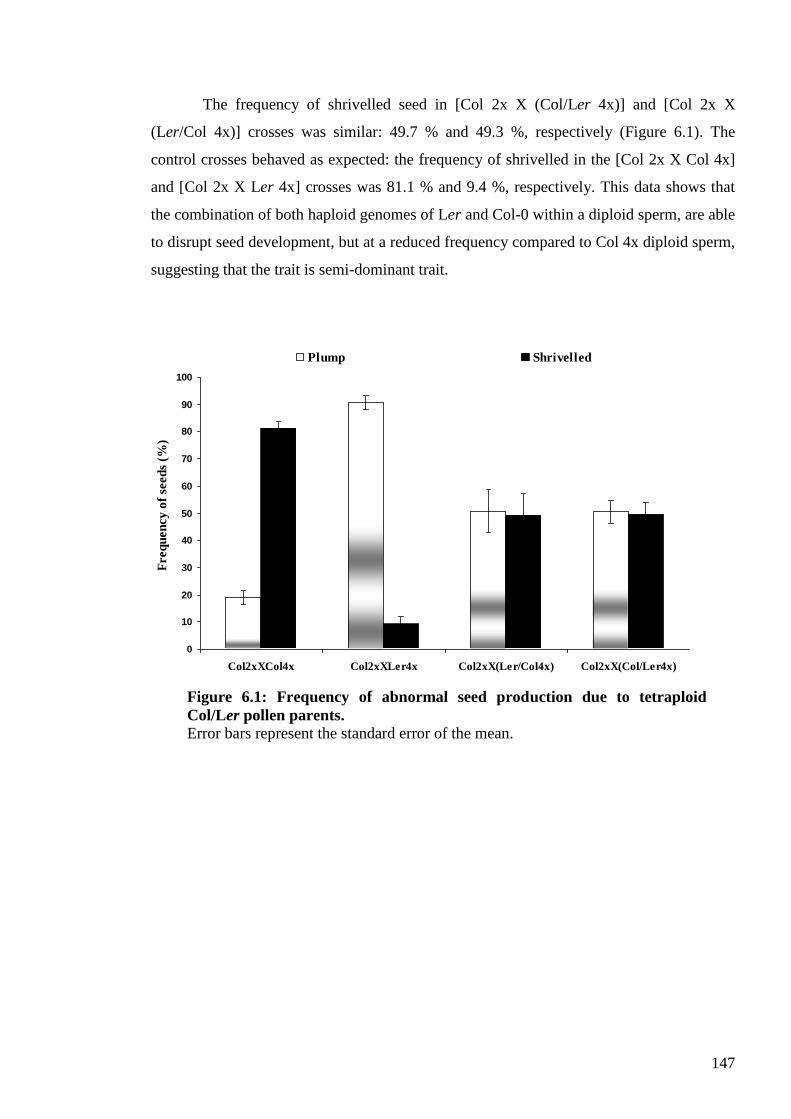
147
The frequency of shrivelled seed in [Col 2x X (Col/Ler 4x)] and [Col 2x X
(Ler/Col 4x)] crosses was similar: 49.7 % and 49.3 %, respectively (Figure 6.1). The
control crosses behaved as expected: the frequency of shrivelled in the [Col 2x X Col 4x]
and [Col 2x X Ler 4x] crosses was 81.1 % and 9.4 %, respectively. This data shows that
the combination of both haploid genomes of Ler and Col-0 within a diploid sperm, are able
to disrupt seed development, but at a reduced frequency compared to Col 4x diploid sperm,
suggesting that the trait is semi-dominant trait.
0
10
20
30
40
50
60
70
80
90
100
Col2xXCol4x Col2xXLer4x Col2xX(Ler/Col4x) Col2xX(Col/Ler4x)
Freq
uen
cy
of
seed
s (%
)
Plump Shrivelled
Figure 6.1: Frequency of abnormal seed production due to tetraploid
Col/Ler pollen parents.
Error bars represent the standard error of the mean.
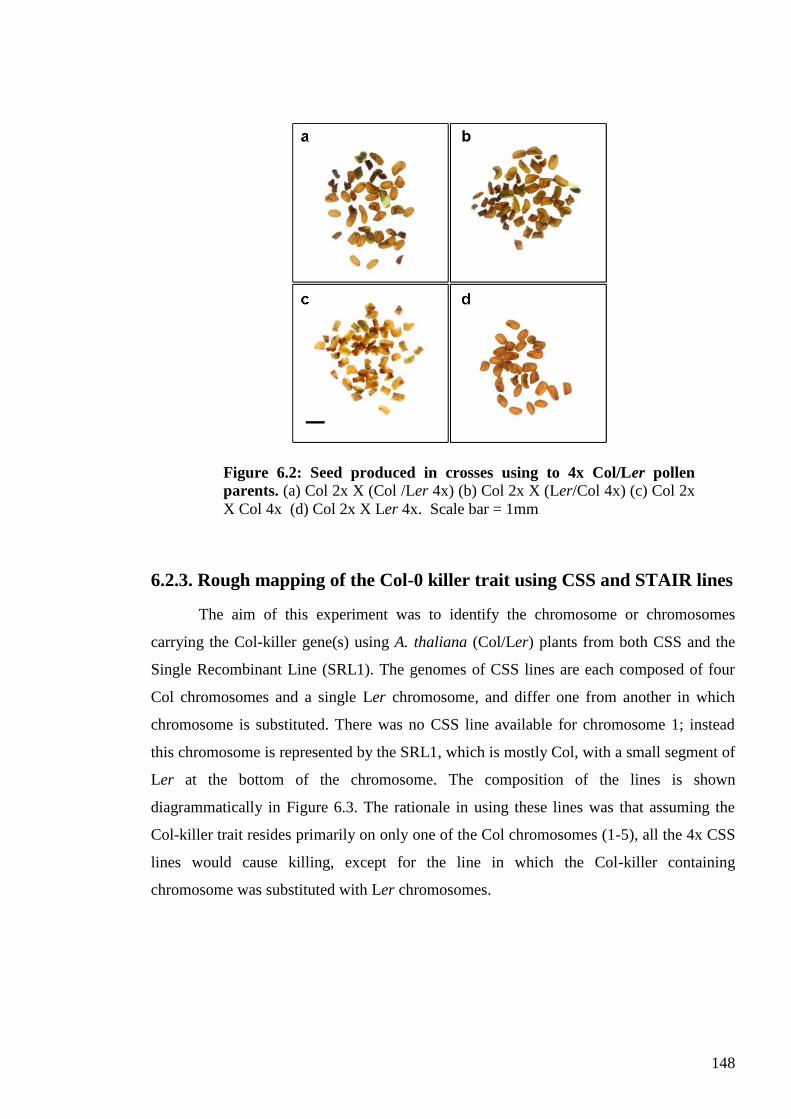
148
6.2.3. Rough mapping of the Col-0 killer trait using CSS and STAIR lines
The aim of this experiment was to identify the chromosome or chromosomes
carrying the Col-killer gene(s) using A. thaliana (Col/Ler) plants from both CSS and the
Single Recombinant Line (SRL1). The genomes of CSS lines are each composed of four
Col chromosomes and a single Ler chromosome, and differ one from another in which
chromosome is substituted. There was no CSS line available for chromosome 1; instead
this chromosome is represented by the SRL1, which is mostly Col, with a small segment of
Ler at the bottom of the chromosome. The composition of the lines is shown
diagrammatically in Figure 6.3. The rationale in using these lines was that assuming the
Col-killer trait resides primarily on only one of the Col chromosomes (1-5), all the 4x CSS
lines would cause killing, except for the line in which the Col-killer containing
chromosome was substituted with Ler chromosomes.
Figure 6.2: Seed produced in crosses using to 4x Col/Ler pollen
parents. (a) Col 2x X (Col /Ler 4x) (b) Col 2x X (Ler/Col 4x) (c) Col 2x
X Col 4x (d) Col 2x X Ler 4x. Scale bar = 1mm
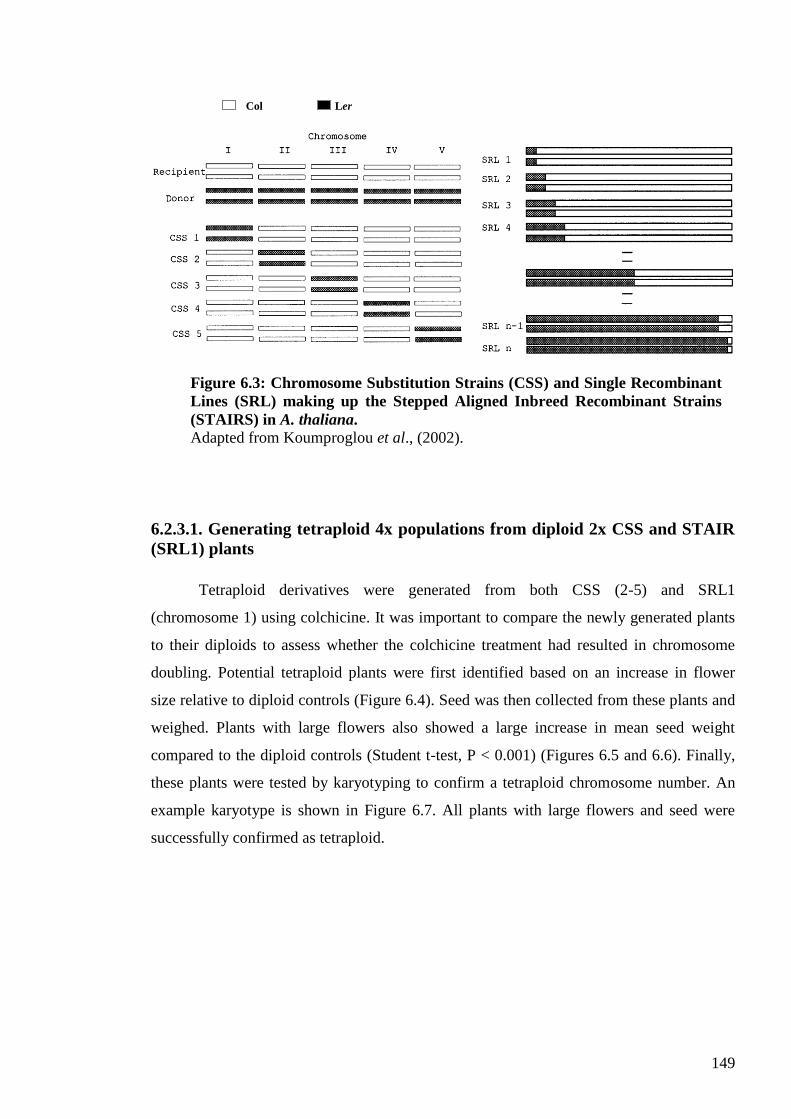
149
6.2.3.1. Generating tetraploid 4x populations from diploid 2x CSS and STAIR
(SRL1) plants
Tetraploid derivatives were generated from both CSS (2-5) and SRL1
(chromosome 1) using colchicine. It was important to compare the newly generated plants
to their diploids to assess whether the colchicine treatment had resulted in chromosome
doubling. Potential tetraploid plants were first identified based on an increase in flower
size relative to diploid controls (Figure 6.4). Seed was then collected from these plants and
weighed. Plants with large flowers also showed a large increase in mean seed weight
compared to the diploid controls (Student t-test, P < 0.001) (Figures 6.5 and 6.6). Finally,
these plants were tested by karyotyping to confirm a tetraploid chromosome number. An
example karyotype is shown in Figure 6.7. All plants with large flowers and seed were
successfully confirmed as tetraploid.
Ler Col
Figure 6.3: Chromosome Substitution Strains (CSS) and Single Recombinant
Lines (SRL) making up the Stepped Aligned Inbreed Recombinant Strains
(STAIRS) in A. thaliana.
Adapted from Koumproglou et al., (2002).
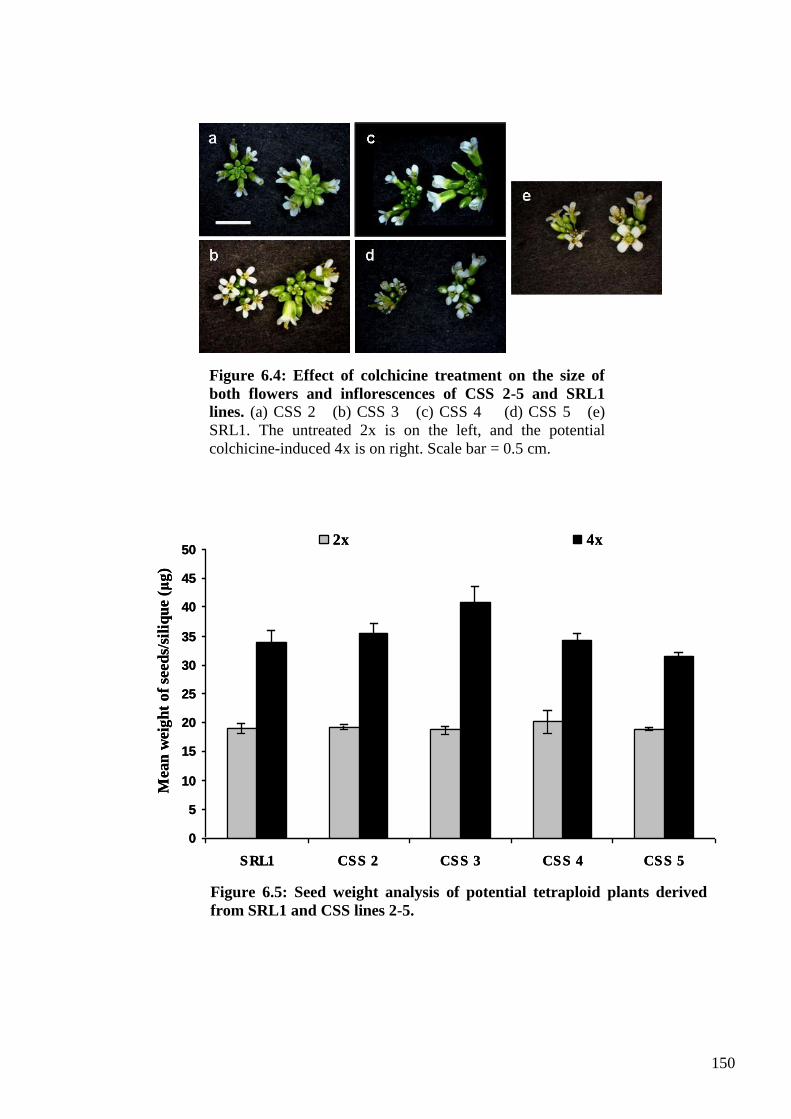
150
0
5
10
15
20
25
30
35
40
45
50
SRL1 CSS 2 CSS 3 CSS 4 CSS 5
2x 4x
Mean
weig
ht
of
seed
s/si
liq
ue (μ
g)
0
5
10
15
20
25
30
35
40
45
50
SRL1 CSS 2 CSS 3 CSS 4 CSS 5
2x 4x
Mean
weig
ht
of
seed
s/si
liq
ue (μ
g)
Figure 6.5: Seed weight analysis of potential tetraploid plants derived
from SRL1 and CSS lines 2-5.
Figure 6.4: Effect of colchicine treatment on the size of
both flowers and inflorescences of CSS 2-5 and SRL1
lines. (a) CSS 2 (b) CSS 3 (c) CSS 4 (d) CSS 5 (e)
SRL1. The untreated 2x is on the left, and the potential
colchicine-induced 4x is on right. Scale bar = 0.5 cm.
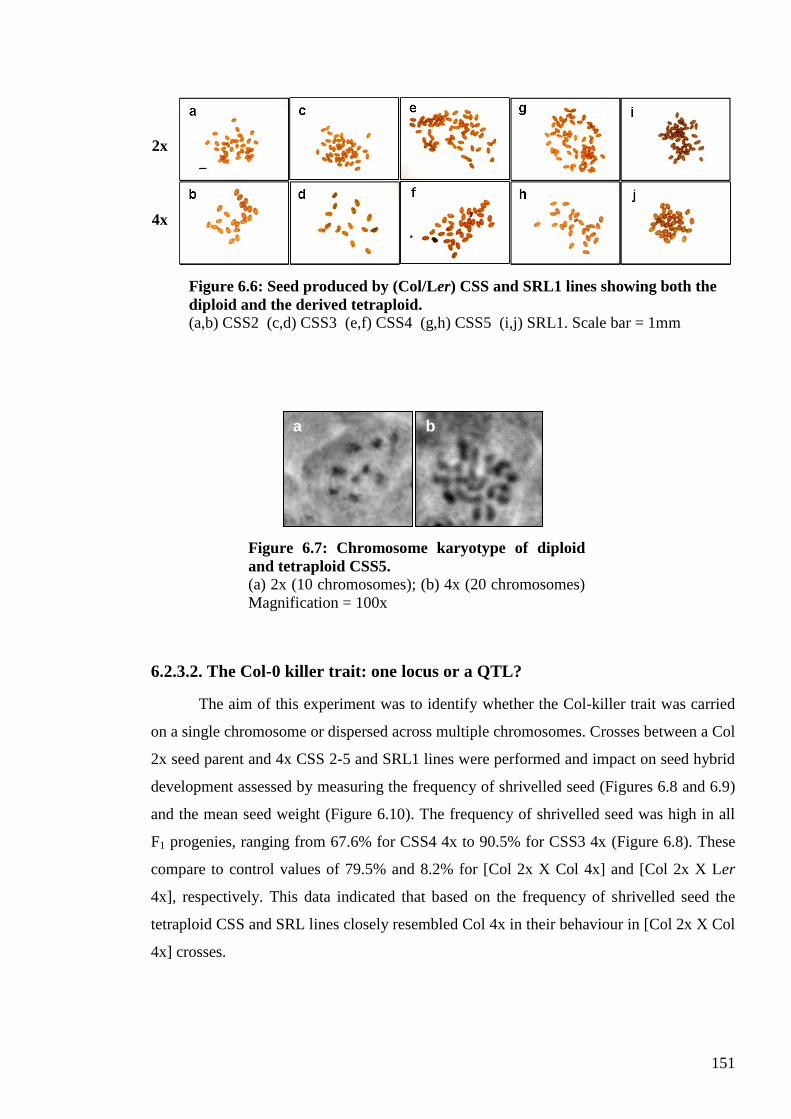
151
6.2.3.2. The Col-0 killer trait: one locus or a QTL?
The aim of this experiment was to identify whether the Col-killer trait was carried
on a single chromosome or dispersed across multiple chromosomes. Crosses between a Col
2x seed parent and 4x CSS 2-5 and SRL1 lines were performed and impact on seed hybrid
development assessed by measuring the frequency of shrivelled seed (Figures 6.8 and 6.9)
and the mean seed weight (Figure 6.10). The frequency of shrivelled seed was high in all
F1 progenies, ranging from 67.6% for CSS4 4x to 90.5% for CSS3 4x (Figure 6.8). These
compare to control values of 79.5% and 8.2% for [Col 2x X Col 4x] and [Col 2x X Ler
4x], respectively. This data indicated that based on the frequency of shrivelled seed the
tetraploid CSS and SRL lines closely resembled Col 4x in their behaviour in [Col 2x X Col
4x] crosses.
a b
Figure 6.7: Chromosome karyotype of diploid
and tetraploid CSS5.
(a) 2x (10 chromosomes); (b) 4x (20 chromosomes)
Magnification = 100x
Figure 6.6: Seed produced by (Col/Ler) CSS and SRL1 lines showing both the
diploid and the derived tetraploid.
(a,b) CSS2 (c,d) CSS3 (e,f) CSS4 (g,h) CSS5 (i,j) SRL1. Scale bar = 1mm
2x
4x
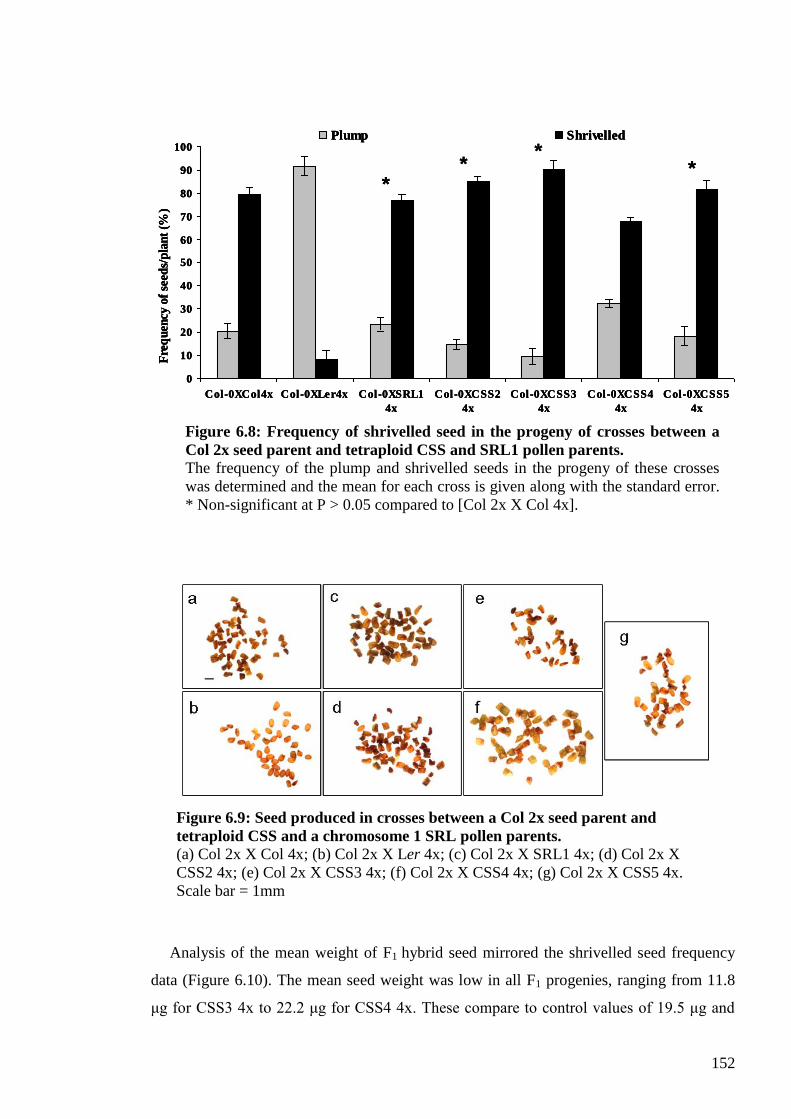
152
Analysis of the mean weight of F1 hybrid seed mirrored the shrivelled seed frequency
data (Figure 6.10). The mean seed weight was low in all F1 progenies, ranging from 11.8
μg for CSS3 4x to 22.2 μg for CSS4 4x. These compare to control values of 19.5 μg and
0
10
20
30
40
50
60
70
80
90
100
Col-0XCol4x Col-0XLer4x Col-0XSRL1
4x
Col-0XCSS2
4x
Col-0XCSS3
4x
Col-0XCSS4
4x
Col-0XCSS5
4x
Plump Shrivelled
Fre
qu
ency
of
seed
s/p
lan
t (%
)*
***
0
10
20
30
40
50
60
70
80
90
100
Col-0XCol4x Col-0XLer4x Col-0XSRL1
4x
Col-0XCSS2
4x
Col-0XCSS3
4x
Col-0XCSS4
4x
Col-0XCSS5
4x
Plump Shrivelled
Fre
qu
ency
of
seed
s/p
lan
t (%
)
0
10
20
30
40
50
60
70
80
90
100
Col-0XCol4x Col-0XLer4x Col-0XSRL1
4x
Col-0XCSS2
4x
Col-0XCSS3
4x
Col-0XCSS4
4x
Col-0XCSS5
4x
Plump Shrivelled
Fre
qu
ency
of
seed
s/p
lan
t (%
)*
***
Figure 6.8: Frequency of shrivelled seed in the progeny of crosses between a
Col 2x seed parent and tetraploid CSS and SRL1 pollen parents.
The frequency of the plump and shrivelled seeds in the progeny of these crosses
was determined and the mean for each cross is given along with the standard error.
* Non-significant at P > 0.05 compared to [Col 2x X Col 4x].
Figure 6.9: Seed produced in crosses between a Col 2x seed parent and
tetraploid CSS and a chromosome 1 SRL pollen parents.
(a) Col 2x X Col 4x; (b) Col 2x X Ler 4x; (c) Col 2x X SRL1 4x; (d) Col 2x X
CSS2 4x; (e) Col 2x X CSS3 4x; (f) Col 2x X CSS4 4x; (g) Col 2x X CSS5 4x.
Scale bar = 1mm
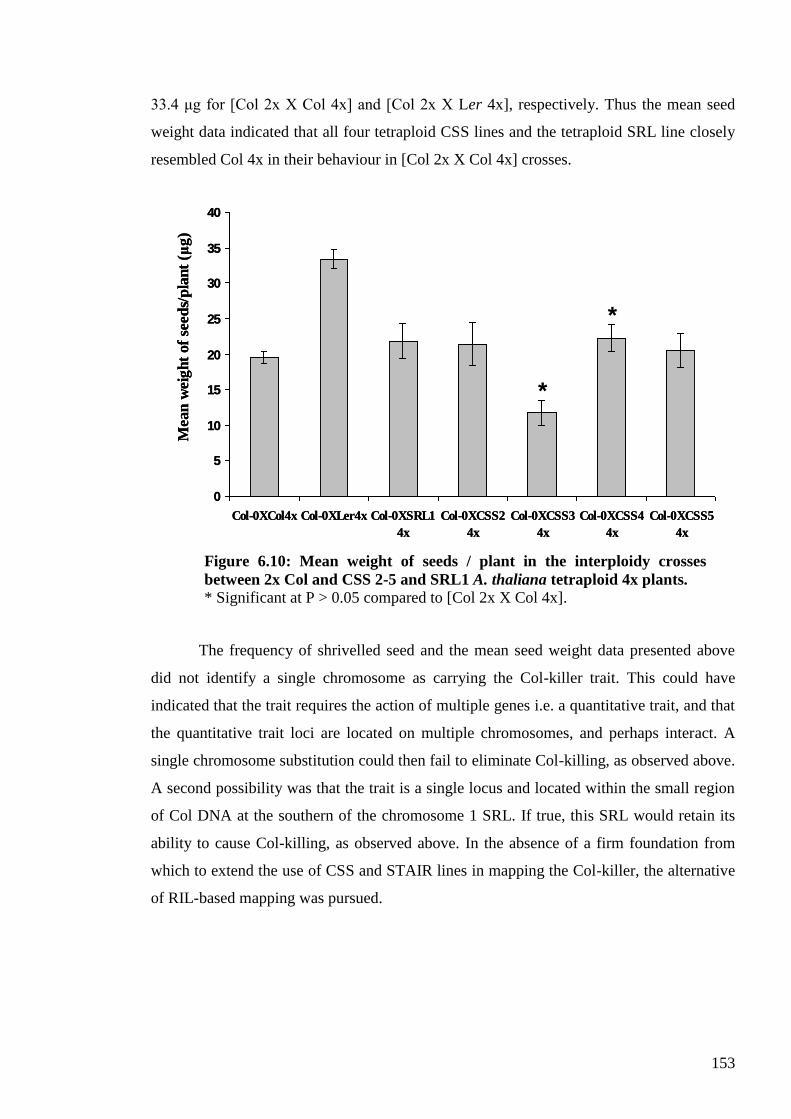
153
33.4 μg for [Col 2x X Col 4x] and [Col 2x X Ler 4x], respectively. Thus the mean seed
weight data indicated that all four tetraploid CSS lines and the tetraploid SRL line closely
resembled Col 4x in their behaviour in [Col 2x X Col 4x] crosses.
0
5
10
15
20
25
30
35
40
Col-0XCol4x Col-0XLer4x Col-0XSRL1
4x
Col-0XCSS2
4x
Col-0XCSS3
4x
Col-0XCSS4
4x
Col-0XCSS5
4x
Mean
weig
ht
of
seed
s/p
lan
t (μ
g)
0
5
10
15
20
25
30
35
40
Col-0XCol4x Col-0XLer4x Col-0XSRL1
4x
Col-0XCSS2
4x
Col-0XCSS3
4x
Col-0XCSS4
4x
Col-0XCSS5
4x
Mean
weig
ht
of
seed
s/p
lan
t (μ
g)
The frequency of shrivelled seed and the mean seed weight data presented above
did not identify a single chromosome as carrying the Col-killer trait. This could have
indicated that the trait requires the action of multiple genes i.e. a quantitative trait, and that
the quantitative trait loci are located on multiple chromosomes, and perhaps interact. A
single chromosome substitution could then fail to eliminate Col-killing, as observed above.
A second possibility was that the trait is a single locus and located within the small region
of Col DNA at the southern of the chromosome 1 SRL. If true, this SRL would retain its
ability to cause Col-killing, as observed above. In the absence of a firm foundation from
which to extend the use of CSS and STAIR lines in mapping the Col-killer, the alternative
of RIL-based mapping was pursued.
Figure 6.10: Mean weight of seeds / plant in the interploidy crosses
between 2x Col and CSS 2-5 and SRL1 A. thaliana tetraploid 4x plants.
* Significant at P > 0.05 compared to [Col 2x X Col 4x].
*
*
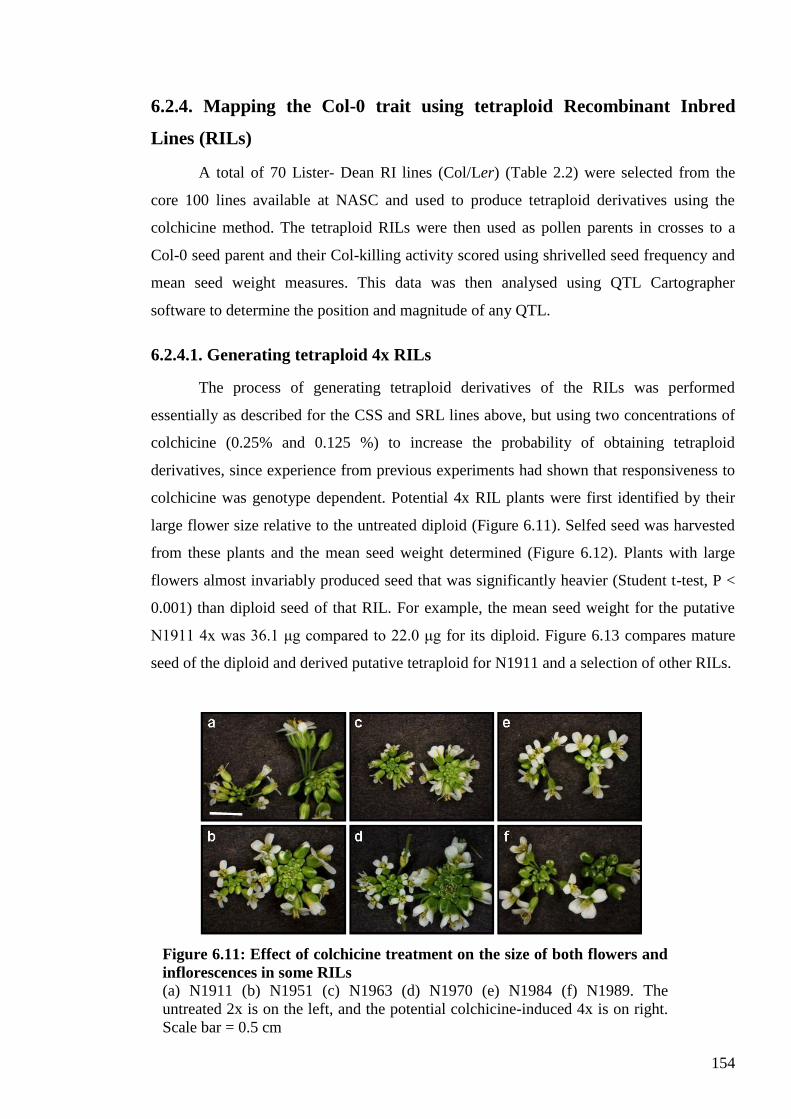
154
6.2.4. Mapping the Col-0 trait using tetraploid Recombinant Inbred
Lines (RILs)
A total of 70 Lister- Dean RI lines (Col/Ler) (Table 2.2) were selected from the
core 100 lines available at NASC and used to produce tetraploid derivatives using the
colchicine method. The tetraploid RILs were then used as pollen parents in crosses to a
Col-0 seed parent and their Col-killing activity scored using shrivelled seed frequency and
mean seed weight measures. This data was then analysed using QTL Cartographer
software to determine the position and magnitude of any QTL.
6.2.4.1. Generating tetraploid 4x RILs
The process of generating tetraploid derivatives of the RILs was performed
essentially as described for the CSS and SRL lines above, but using two concentrations of
colchicine (0.25% and 0.125 %) to increase the probability of obtaining tetraploid
derivatives, since experience from previous experiments had shown that responsiveness to
colchicine was genotype dependent. Potential 4x RIL plants were first identified by their
large flower size relative to the untreated diploid (Figure 6.11). Selfed seed was harvested
from these plants and the mean seed weight determined (Figure 6.12). Plants with large
flowers almost invariably produced seed that was significantly heavier (Student t-test, P <
0.001) than diploid seed of that RIL. For example, the mean seed weight for the putative
N1911 4x was 36.1 μg compared to 22.0 μg for its diploid. Figure 6.13 compares mature
seed of the diploid and derived putative tetraploid for N1911 and a selection of other RILs.
Figure 6.11: Effect of colchicine treatment on the size of both flowers and
inflorescences in some RILs
(a) N1911 (b) N1951 (c) N1963 (d) N1970 (e) N1984 (f) N1989. The
untreated 2x is on the left, and the potential colchicine-induced 4x is on right.
Scale bar = 0.5 cm
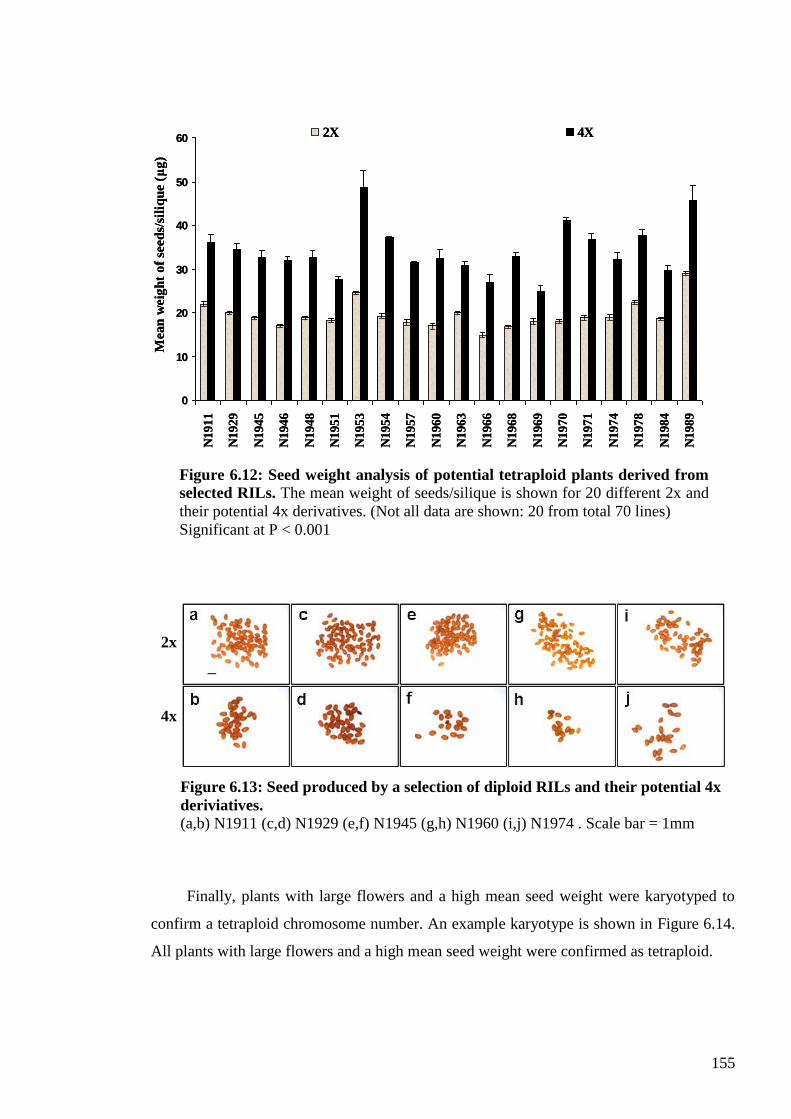
155
0
10
20
30
40
50
60
N1911
N1929
N1945
N1946
N1948
N1951
N1953
N1954
N1957
N1960
N1963
N1966
N1968
N1969
N1970
N1971
N1974
N1978
N1984
N1989
2X 4X
Mean
weig
ht
of
seed
s/si
liq
ue (μ
g)
0
10
20
30
40
50
60
N1911
N1929
N1945
N1946
N1948
N1951
N1953
N1954
N1957
N1960
N1963
N1966
N1968
N1969
N1970
N1971
N1974
N1978
N1984
N1989
2X 4X
Mean
weig
ht
of
seed
s/si
liq
ue (μ
g)
Finally, plants with large flowers and a high mean seed weight were karyotyped to
confirm a tetraploid chromosome number. An example karyotype is shown in Figure 6.14.
All plants with large flowers and a high mean seed weight were confirmed as tetraploid.
Figure 6.12: Seed weight analysis of potential tetraploid plants derived from
selected RILs. The mean weight of seeds/silique is shown for 20 different 2x and
their potential 4x derivatives. (Not all data are shown: 20 from total 70 lines)
Significant at P < 0.001
Figure 6.13: Seed produced by a selection of diploid RILs and their potential 4x
deriviatives.
(a,b) N1911 (c,d) N1929 (e,f) N1945 (g,h) N1960 (i,j) N1974 . Scale bar = 1mm
2x
4x
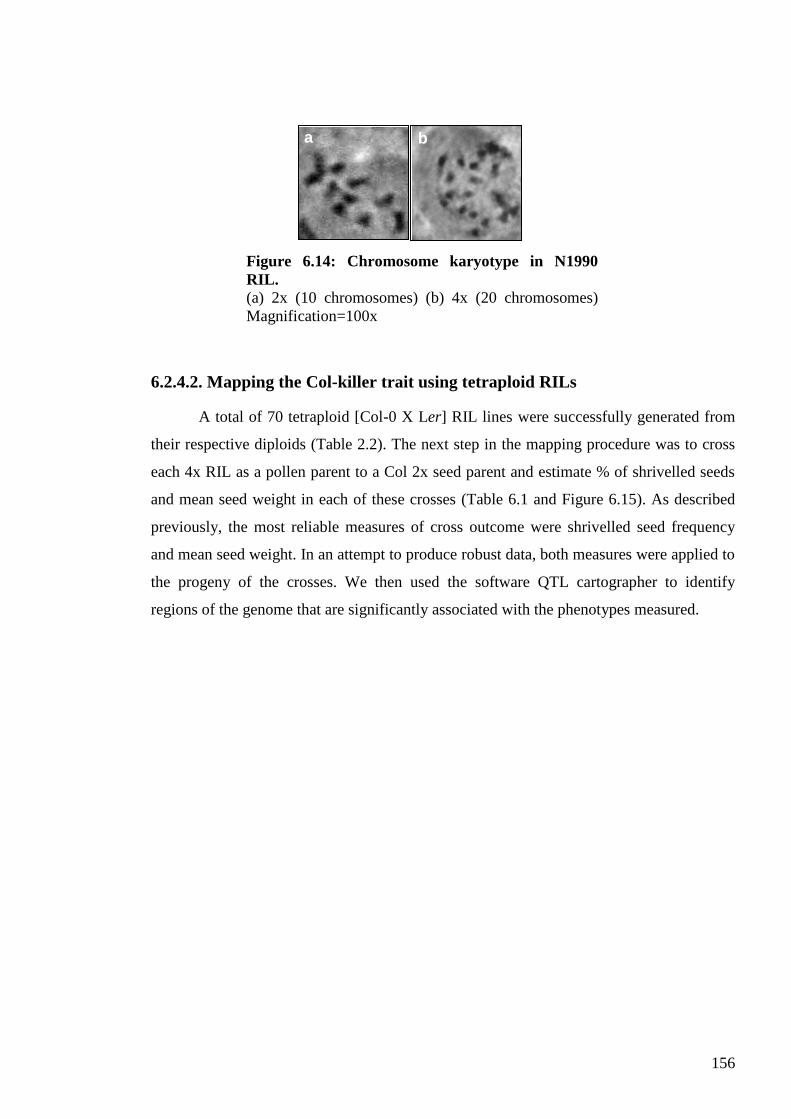
156
6.2.4.2. Mapping the Col-killer trait using tetraploid RILs
A total of 70 tetraploid [Col-0 X Ler] RIL lines were successfully generated from
their respective diploids (Table 2.2). The next step in the mapping procedure was to cross
each 4x RIL as a pollen parent to a Col 2x seed parent and estimate % of shrivelled seeds
and mean seed weight in each of these crosses (Table 6.1 and Figure 6.15). As described
previously, the most reliable measures of cross outcome were shrivelled seed frequency
and mean seed weight. In an attempt to produce robust data, both measures were applied to
the progeny of the crosses. We then used the software QTL cartographer to identify
regions of the genome that are significantly associated with the phenotypes measured.
a b
Figure 6.14: Chromosome karyotype in N1990
RIL. (a) 2x (10 chromosomes) (b) 4x (20 chromosomes)
Magnification=100x
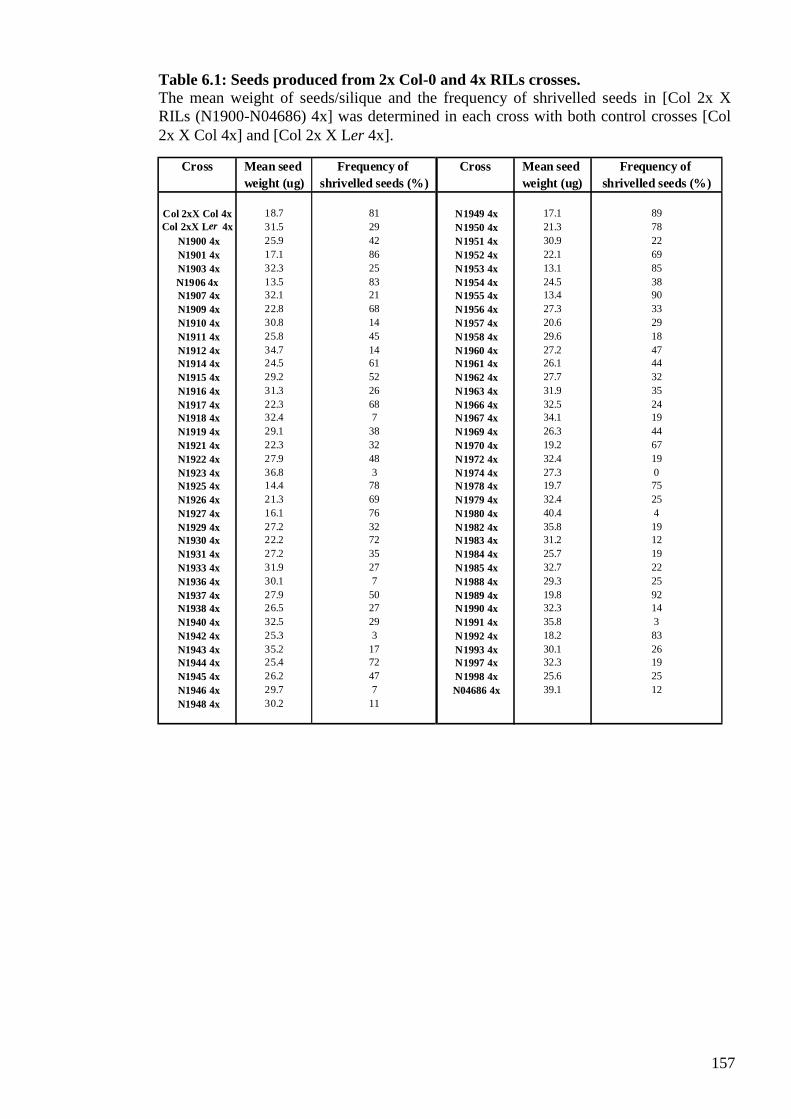
157
Cross Mean seed Frequency of Cross Mean seed Frequency of
weight (ug) shrivelled seeds (%) weight (ug) shrivelled seeds (%)
Col 2xX Col 4x 18.7 81 N1949 4x 17.1 89
Col 2xX Ler 4x 31.5 29 N1950 4x 21.3 78
N1900 4x 25.9 42 N1951 4x 30.9 22
N1901 4x 17.1 86 N1952 4x 22.1 69
N1903 4x 32.3 25 N1953 4x 13.1 85
N1906 4x 13.5 83 N1954 4x 24.5 38
N1907 4x 32.1 21 N1955 4x 13.4 90
N1909 4x 22.8 68 N1956 4x 27.3 33
N1910 4x 30.8 14 N1957 4x 20.6 29
N1911 4x 25.8 45 N1958 4x 29.6 18
N1912 4x 34.7 14 N1960 4x 27.2 47
N1914 4x 24.5 61 N1961 4x 26.1 44
N1915 4x 29.2 52 N1962 4x 27.7 32
N1916 4x 31.3 26 N1963 4x 31.9 35
N1917 4x 22.3 68 N1966 4x 32.5 24
N1918 4x 32.4 7 N1967 4x 34.1 19
N1919 4x 29.1 38 N1969 4x 26.3 44
N1921 4x 22.3 32 N1970 4x 19.2 67
N1922 4x 27.9 48 N1972 4x 32.4 19
N1923 4x 36.8 3 N1974 4x 27.3 0
N1925 4x 14.4 78 N1978 4x 19.7 75
N1926 4x 21.3 69 N1979 4x 32.4 25
N1927 4x 16.1 76 N1980 4x 40.4 4
N1929 4x 27.2 32 N1982 4x 35.8 19
N1930 4x 22.2 72 N1983 4x 31.2 12
N1931 4x 27.2 35 N1984 4x 25.7 19
N1933 4x 31.9 27 N1985 4x 32.7 22
N1936 4x 30.1 7 N1988 4x 29.3 25
N1937 4x 27.9 50 N1989 4x 19.8 92
N1938 4x 26.5 27 N1990 4x 32.3 14
N1940 4x 32.5 29 N1991 4x 35.8 3
N1942 4x 25.3 3 N1992 4x 18.2 83
N1943 4x 35.2 17 N1993 4x 30.1 26
N1944 4x 25.4 72 N1997 4x 32.3 19
N1945 4x 26.2 47 N1998 4x 25.6 25
N1946 4x 29.7 7 N04686 4x 39.1 12
N1948 4x 30.2 11
Table 6.1: Seeds produced from 2x Col-0 and 4x RILs crosses.
The mean weight of seeds/silique and the frequency of shrivelled seeds in [Col 2x X
RILs (N1900-N04686) 4x] was determined in each cross with both control crosses [Col
2x X Col 4x] and [Col 2x X Ler 4x].
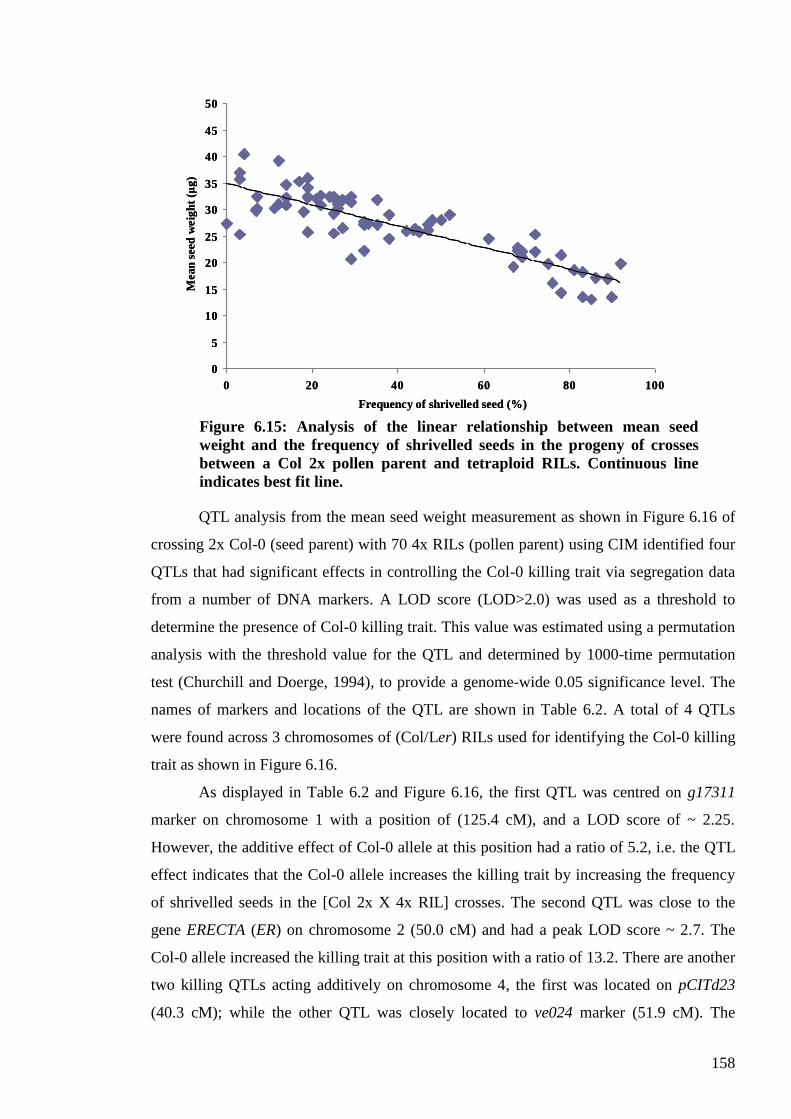
158
QTL analysis from the mean seed weight measurement as shown in Figure 6.16 of
crossing 2x Col-0 (seed parent) with 70 4x RILs (pollen parent) using CIM identified four
QTLs that had significant effects in controlling the Col-0 killing trait via segregation data
from a number of DNA markers. A LOD score (LOD>2.0) was used as a threshold to
determine the presence of Col-0 killing trait. This value was estimated using a permutation
analysis with the threshold value for the QTL and determined by 1000-time permutation
test (Churchill and Doerge, 1994), to provide a genome-wide 0.05 significance level. The
names of markers and locations of the QTL are shown in Table 6.2. A total of 4 QTLs
were found across 3 chromosomes of (Col/Ler) RILs used for identifying the Col-0 killing
trait as shown in Figure 6.16.
As displayed in Table 6.2 and Figure 6.16, the first QTL was centred on g17311
marker on chromosome 1 with a position of (125.4 cM), and a LOD score of ~ 2.25.
However, the additive effect of Col-0 allele at this position had a ratio of 5.2, i.e. the QTL
effect indicates that the Col-0 allele increases the killing trait by increasing the frequency
of shrivelled seeds in the [Col 2x X 4x RIL] crosses. The second QTL was close to the
gene ERECTA (ER) on chromosome 2 (50.0 cM) and had a peak LOD score ~ 2.7. The
Col-0 allele increased the killing trait at this position with a ratio of 13.2. There are another
two killing QTLs acting additively on chromosome 4, the first was located on pCITd23
(40.3 cM); while the other QTL was closely located to ve024 marker (51.9 cM). The
0
5
10
15
20
25
30
35
40
45
50
0 20 40 60 80 100
Frequency of shrivelled seed (%)
Mean
seed
weig
ht
(μg
)
0
5
10
15
20
25
30
35
40
45
50
0 20 40 60 80 100
Frequency of shrivelled seed (%)
Mean
seed
weig
ht
(μg
)
Figure 6.15: Analysis of the linear relationship between mean seed
weight and the frequency of shrivelled seeds in the progeny of crosses
between a Col 2x pollen parent and tetraploid RILs. Continuous line
indicates best fit line.
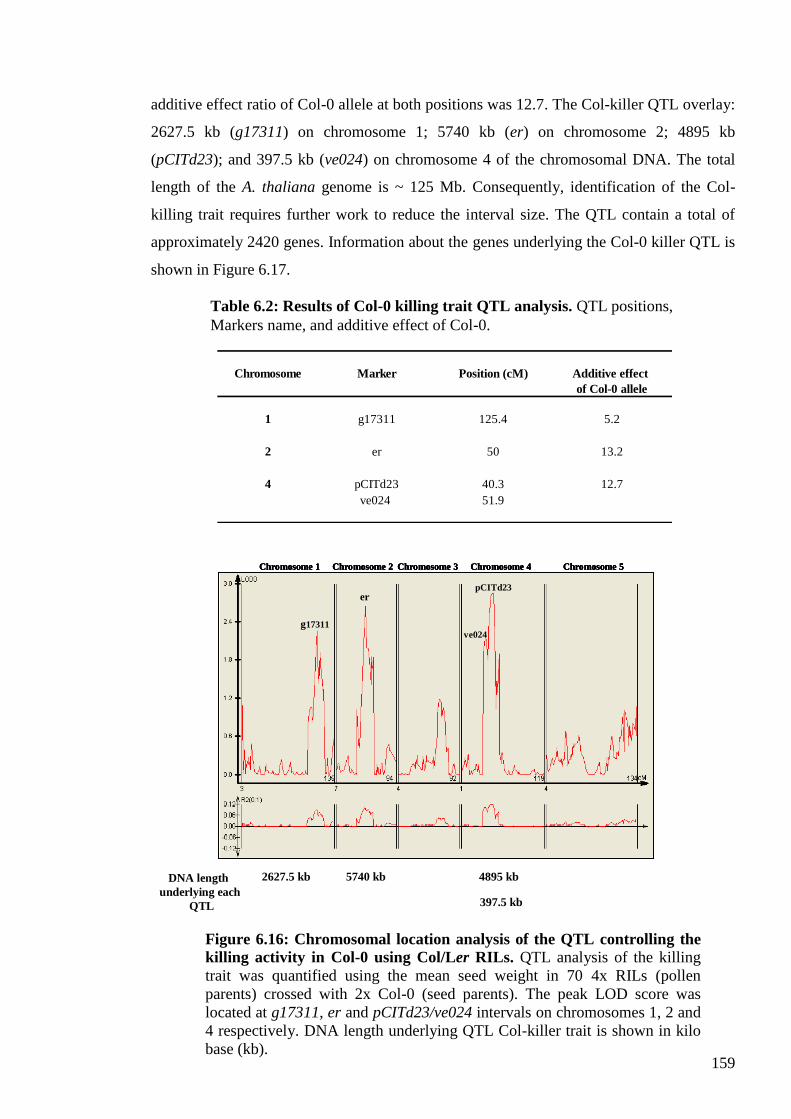
159
additive effect ratio of Col-0 allele at both positions was 12.7. The Col-killer QTL overlay:
2627.5 kb (g17311) on chromosome 1; 5740 kb (er) on chromosome 2; 4895 kb
(pCITd23); and 397.5 kb (ve024) on chromosome 4 of the chromosomal DNA. The total
length of the A. thaliana genome is ~ 125 Mb. Consequently, identification of the Col-
killing trait requires further work to reduce the interval size. The QTL contain a total of
approximately 2420 genes. Information about the genes underlying the Col-0 killer QTL is
shown in Figure 6.17.
er
g17311
Chromosome 1 Chromosome 2 Chromosome 3 Chromosome 4 Chromosome 5Chromosome 1 Chromosome 2 Chromosome 3 Chromosome 4 Chromosome 5
pCITd23
ve024
er
g17311
Chromosome 1 Chromosome 2 Chromosome 3 Chromosome 4 Chromosome 5Chromosome 1 Chromosome 2 Chromosome 3 Chromosome 4 Chromosome 5
pCITd23
ve024
2627.5 kb 5740 kb 4895 kb
397.5 kb
DNA length
underlying each
QTL
Chromosome Marker Position (cM) Additive effect
of Col-0 allele
1 g17311 125.4 5.2
2 er 50 13.2
4 pCITd23 40.3 12.7
ve024 51.9
Figure 6.16: Chromosomal location analysis of the QTL controlling the
killing activity in Col-0 using Col/Ler RILs. QTL analysis of the killing
trait was quantified using the mean seed weight in 70 4x RILs (pollen
parents) crossed with 2x Col-0 (seed parents). The peak LOD score was
located at g17311, er and pCITd23/ve024 intervals on chromosomes 1, 2 and
4 respectively. DNA length underlying QTL Col-killer trait is shown in kilo
base (kb).
Table 6.2: Results of Col-0 killing trait QTL analysis. QTL positions,
Markers name, and additive effect of Col-0.
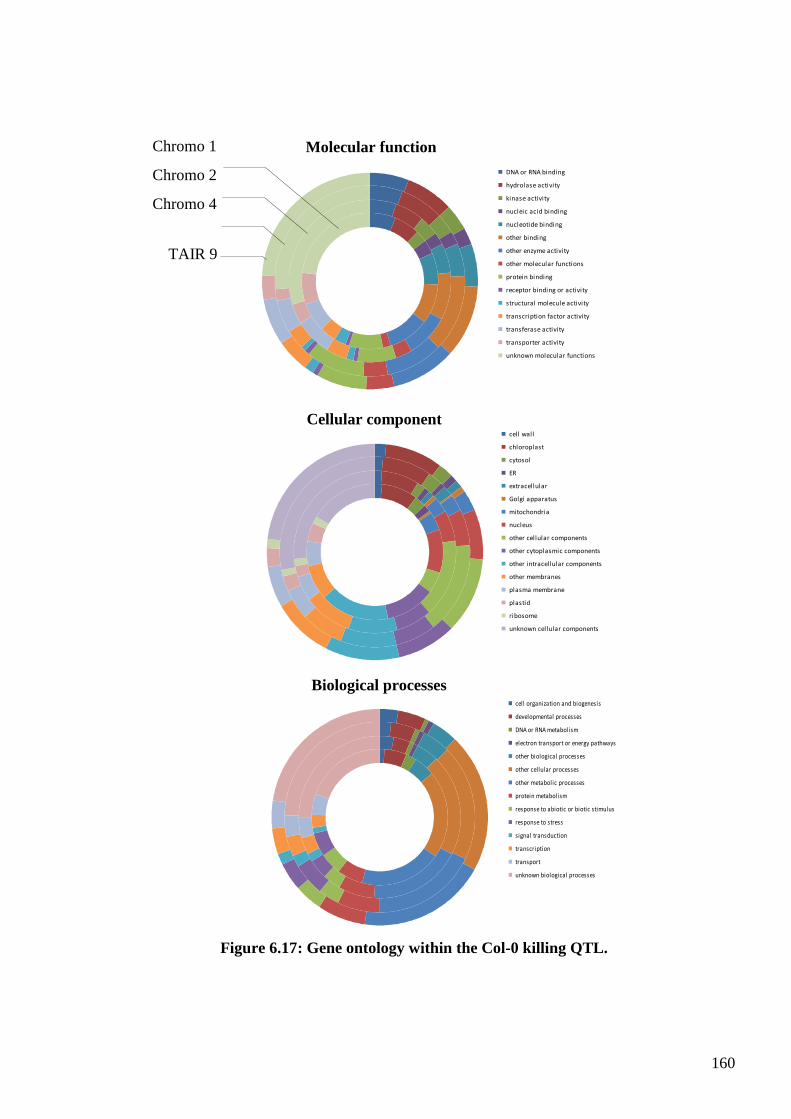
160
TAIR 9
Molecular function
cell wall
chloroplast
cytosol
ER
extracellular
Golgi apparatus
mitochondria
nucleus
other cellular components
other cytoplasmic components
other intracellular components
other membranes
plasma membrane
plastid
ribosome
unknown cellular components
Cellular component
Biological processes
cell organization and biogenesis
developmental processes
DNA or RNA metabolism
electron transport or energy pathways
other biological processes
other cellular processes
other metabolic processes
protein metabolism
response to abiotic or biotic stimulus
response to stress
signal transduction
transcription
transport
unknown biological processes
DNA or RNA binding
hydrolase activity
kinase activity
nucleic acid binding
nucleotide binding
other binding
other enzyme activity
other molecular functions
protein binding
receptor binding or activity
structural molecule activity
transcription factor activity
transferase activity
transporter activity
unknown molecular functions
Figure 6.17: Gene ontology within the Col-0 killing QTL.
Chromo 4
Chromo 2
Chromo 1
cell organization and biogenesis
developmental processes
DNA or RNA metabolism
electron transport or energy pathways
other biological processes
other cellular processes
other metabolic processes
protein metabolism
response to abiotic or biotic stimulus
response to stress
signal transduction
transcription
transport
unknown biological processes
cell wall
chloroplast
cytosol
ER
extracellular
Golgi apparatus
mitochondria
nucleus
other cellular components
other cytoplasmic components
other intracellular components
other membranes
plasma membrane
plastid
ribosome
unknown cellular components
DNA or RNA binding
hydrolase activity
kinase activity
nucleic acid binding
nucleotide binding
other binding
other enzyme activity
other molecular functions
protein binding
receptor binding or activity
structural molecule activity
transcription factor activity
transferase activity
transporter activity
unknown molecular functions
161
6.3. Discussion
The analysis of quantitative traits in recent years has widely focused round the use
of molecular markers to locate and measure the effects of the individual underlying genes,
quantitative trait loci or QTL (Tanksley, 1993; Kearsey and Farquhar, 1998; Kearsey et al.,
2003). The primary aim of the work reported in this chapter was to elucidate the QTL of
the killer trait caused by the A. thaliana Col-0 ecotype. It was important to study one of A.
thaliana traits that concerned as a hybridisation barrier for seed development, and thereby
identify the gene/genes responsible for seed abortion using different tools from molecular
genetics resources. However, the identification of QTL of the Col-0 killer trait could pave
the way to clone some related specific genes for crop improvement.
6.3.1. STAIRS, CSS and RIL are powerful tools in identifying the QTL of
Col-0 killer trait
The STAIRS have several advantages in locating a trait or several traits on a
chromosome. However, they provide a route to zoom in rapidly on a chromosome region
of interest so facilitating fine mapping. They benefit from several features: single
recombinants are more frequent and therefore cheaper to produce, the recombination
position is easily identified using them, there is no fear of complications due to secondary
substitution, and very small differential regions can be achieved with complete genome
coverage (Koumproglou et al., 2002). In this part of the research both CSS lines (2-5) and
the STAIRS (SRL1) were crossed as tetraploid pollen parents with maternal Col 2x to
identify the QTL of the Col-0 killer trait. The data from both frequency of shrivelled seeds
and mean seed weight measurements in Figure 6.4 showed that the diploid lines of both
STAIR (SRL1) and CSS (2-5) were successfully transformed into tetraploids after
subjecting these diploid strains to colchicine treatment. The experiment was carried out to
locate the Col-0 killer trait on the 5 A. thaliana chromosomes. However, the mean seed
weight measurement was more robust in identifying the QTL location on chromosomes 1,
2 and 4, thus the data showed slightly higher mean seed weight values for SRL1, CSS 2
and CSS 4 than the control [Col 2x X Col 4x] (Figures 6.8 and 6.10). Koumproglou et al.,
(2002) suggested that the set of whole chromosome substitution plus STAIRS will allow
rapid identification of a gene first to a chromosome and then to a particular region defined
by known and sequence linked markers. Furthermore, they recommended using STAIRS in
order to achieve finer mapping.
162
The recombinant inbred lines (RILs) used in this study provided a potentially
powerful tool for the genetic analysis of quantitative traits and have been a major impetus
to quantitative genetical research and breeding. Using both the frequency of shrivelled
seeds and mean seed weight measurements was necessary to identify new tetraploid
(Col/Ler) RIL populations. The tetraploid 4x RILs showed higher mean seed weight and
larger structures (e.g. flowers, inflorescence, etc) as demonstrated in both Figures 6.12 and
6.13. However, the tetraploidy was confirmed by subjecting young inflorescence
meristems to karyotyping (Figure 6.14). Taking advantage of RILs derived from crosses
between both ecotypes Col-0 and Ler (Lister and Dean, 1993), the QTL killer trait of Col-0
was mapped to QTL located on chromosomes 1, 2 and 4.
6.3.1.1. Advantages of RIL in QTL mapping
RILs are an important resource for investigation and genetic mapping for
quantitative and qualitative characters in many plant species. They also represent an
immortal segregating population allowing the inherent environmental error to be reduced
by replication and providing resourceful system for QTL analysis due to their high degree
of homozygosity (Borevitz et al., 2002; Törjek et al., 2006). An important advantage of
using the (Col/Ler) RILs is that after genotyping, the same population can be used for the
mapping of any number of traits for which the parents differ in order to reduce the costs
and effort required to identify positions of QTL (Törjek et al., 2006).
The accuracy of QTL mapping is still a problem because it depends on several
factors such as the heritability of the trait, the number of QTL involved, the distribution of
the QTL over the genome, the number of the marker loci and their distribution over the
genome and the population size (Bandaranayake et al., 2004; Knapp et al., 1990).
However, the precision of QTL position depends more on population size than the number
of markers and no remarkable expansion in accuracy is achieved with more than five well
markers for each chromosome (Kearsey and Pooni, 1998). Moreover, it is advisable to use
a mapping population of relatively large size and QTL of high heritabilities for consistent
estimation of QTL effect.
As demonstrated in chapter 4 the killing activity caused by the paternal 4x Col-0
ecotype played a major role in A. thaliana hybridisation barriers when crossed with other
diploid ecotypes (4.2.3.2). However, the results showed variation in F1 lethality from both
maternal Col-0 and Ler ecotypes when crossed with Col 4x pollen parent, thus indicating a
major difference in their resistance activity toward paternal Col 4x. The cross between [Col
163
2x X Col 4x] showed higher levels of shrivelled seeds (89.2 %) compared to [Ler 2x X Col
4x] cross (41.8 %). In the present work, a number of crosses was performed between Col
2x as seed parent with the newly generated 4x (Col/Ler) 70 RILs as pollen parents and
recorded different levels of lethality in [Col 2x X RIL (Col/Ler) 4x] to identify the
location of the QTL.
Perez-Vega et al., (2010) stated that in a regular genetic analysis, QTLs can be
identified only where the parents show apparent differences. However, it has been known
previously by (Dilkes et al., 2008) that apparent differences can be demonstrated in the
crosses between [Col2x X Col 4x] that result in dead seeds while [Ler 2x X Col 4x]
showed a higher frequency of viable seeds. The mean seed weight of the [Col 2x X RIL
4x] populations was significantly variable in their measurement analysis compared to
either [Col 2x X Col 4x] or [Ler 2x X Col 4x] and such difference could be due to the
segregation distortion. The data in Figure 6.15 showed a relation between the frequency of
shrivelled seeds and mean seed weight measurements in the crosses between Col 2x
maternal side with 70 tetraploid paternal 4x RILs which has an advantage in the statistical
determination of QTL underlying the Col-0 killing trait. The statistical analysis using CIM
showed that the QTL was significantly associated with the Col-0 killer trait. The marker
defining this QTL was g17311 (chromosome 1), er (chromosome 2), and both pCITd23
and ve024 (chromosome 4) (Table 6.2 and Figure 6.16). This information provides a
valuable starting point for map-based cloning of the genes underlying this trait.
These QTL overlay 2627.5 kb for g17311 in chromosome 1, 5740 kb for er in
chromosome 2, and 4895 kb, 397.5 kb for both pCITd23 and ve024 respectively in
chromosome 4 of chromosomal DNA; however, they contain a total of approximately 2420
genes. These regions are clearly still large, and further work is required to reduce the
interval size before identifying the Col-0 killing is possible.
Similarly, many recent studies have been applied to A. thaliana plant in order to
identify QTL using different RIL populations. For example, McKay et al., (2008) took
advantage from using 346 RIL developed from a cross between Kas-1 and Tsu-1 for
mapping QTL underlying natural variation and for dissecting the genetic basis of water-use
efficiency differences. Also, Lisec et al., (2009) identified QTL responsible for heterotic
metabolite in A. thaliana using 369 RIL from a cross between two mapping populations
Col-0 and C24 ecotypes. Recenly Pèrez-Vega et al., (2010) identified QTL controlling
phonological traits in common bean (Phaseolus vulgaris L.) using 104 RIL derived from
an inter-gene pool cross between Xana and Cornell 49242. The traits included such as days
164
to the start of flowering, days to end of flowering, days to harvest as green pod, and days to
maturity, seed size traits such as seed length, seed height, seed weight, and seed width, and
seed quality traits such as water absorption, and coat proportion. They also showed that
these QTL have high additive effects and greater explained variance, and are more
consistently detected across different environments. In maize (Zea mays L.), (Barriere et
al., 2010) also identified QTLs for cell wall digestibility traits such as increasing starch
content, lignin content, dry matter content, yield, and cell wall quality using 240 RILs
developed from early maize hybrid in a cross between F838 and F286.
In other crop plants such as rice, Cho et al., (2010) identified 49 QTLs associated
with six physical traits of cooked rice and seven chemical properties of rice grain using
164 RIL derived from a cross between Milyang23 and Gihobyeo. They also showed that
two from these QTL with the highest LOD scores provide a valuable starting point for
positional cloning of genes underlying these QTL.
6.4. Conclusion
In summary, the present study reports the identification of QTL for the killer trait
caused by the A. thaliana Col-0 ecotype. This kind of postzygotic hybridisation barrier
controls the lethality in the F1 progenies from the crosses between diploid and tetraploid
individuals of the same genotype. The data presented above demonstrated the usefulness of
both STAIRS and RILs for mapping this type of trait in A. thaliana. The large set of
tetraploid RIL populations used in this project could provide an excellent resource for
future resolution of the Col-0 killing QTL Identification of QTL of the Col-0 killer trait
would help in cloning some related specific genes for crop improvement.
.
.
165
Chapter 7
7. General Discussion
The aim of the work described in this thesis was to investigate the nature of
hybridisation barriers that occur in interploidy crosses between different A. thaliana
ecotypes. The postzygotic hybridisation barriers restrict gene flow and isolate populations
from one another. In interploidy, intra- and interecotype crosses of A. thaliana, the
maternal to paternal genomic ratio (2m:1p) in the endosperm is important in determining
the outcome of the cross as described by Scott et al., (1998a). Also, wide crosses and
interecotype hybridisations as shown in Chapter 5, have been used to investigate the
genetic basis of complex traits that differentiate varieties within a species in several plant
families (Bradshaw et al., 1995; Eubanks, 1997; Lin and Ritland, 1997; Nasrallah et al.,
2000).
7.1. Postzygotic hybridisation barriers and its consequences for
Arabidopsis crosses
A variety of mechanisms minimize gene flow between species and contribute to
their reproductive isolation (Rieseberg and Carney, 1998; Rieseberg and Blackman, 2010).
One class of mechanism termed a postzygotic hybridisation barrier acts within the seed
following fertilisation and causes seed death either through failure in endosperm or embryo
development (Haig and Westoby, 1991; Coyne and Orr, 1998; Rieseberg and Carney,
1998; Bushell et al., 2003) (Figure 1.1). In interspecific crosses, seed abortion could be
attributed to different factors such as: negative interaction between products of
evolutionarily diverged gene sequences, widespread changes to genome structure or gene
expression (Rieseberg and Carney, 1998; Bushell et al., 2003), and imbalances between the
effects of uniparentally expressed genes (genomic imprinting) (Haig and Westoby, 1991),
either because of ploidy imbalance or divergence in gene expression patterns (Bushell et
al., 2003). A potent postzygotic hybridisation barrier in many species occurs when
individuals of different ploidy e.g. diploids and tetraploids, are crossed. The failure of such
crosses to produce the expected triploid progeny led to this barrier being termed triploid
block. This lethality arises in the absence of any allelic diversity due to the difference in
the dosage of genomes provided by the parents. The strength of this reproductive isolation
166
can vary within species and between individuals of the same species. However, the genetic
basis of this barrier and the source of variation within and between species remain poorly
understood.
The work reported in Chapter 4 represents a preliminary investigation into the
genetic mechanisms responsible for variation in the lethality of interploidy crosses in A.
thaliana. The objective was to improve our understanding of this type of reproductive
isolation barrier, and ultimately identify the genes underpinning the phenomenon. In
contrast to many other species, A. thaliana apparently did not display triploid block,
although crosses between diploid and hexaploid plants did result in tetraploid block (Scott
et al., 1998a). A. thaliana would appear therefore a poor choice for studying ploidy based
postzygotic barriers. However, Dilkes et al., (2008) showed that for Col-0 [2x X 4x]
resulted in very high levels of seed lethality (Figure 4.1), although the reciprocal [4x X 2x]
remained non-abortive. Thus Col-0 possessed what can be described as an asymmetric
paternal-only postzygotic hybridisation barrier. Interestingly, Redei (1964) had much
earlier described a similar outcome for reciprocal crosses between an A. thaliana diploid
‗genotype‘ ‗W‘ and its autotetraploid ‗K-16‘. Redei confirmed the ‗W‘ genotype as the
Columbia ecotype in a personal communication to R. Scott, University of Bath.
The possession by Col-0 of such an extreme asymmetric postzygotic hybridisation
barrier, or ‗Col-0 syndrome‘, presented an opportunity to utilize A. thaliana to investigate
one important mechanism of reproductive isolation. Chapter 4 first addressed the question
of which of the two behaviors - no triploid block or paternal-only triploid block - or some
other permutation, is most representative of the A. thaliana species. The experimental
approach was to test the crossing behaviour of a total of 14 ecotypes and to use meiotic
mutants to investigate aspects of the Col paternal only triploid block.
The analyses presented in section 4.2.2 showed 1) that A. thaliana as a species
responds to moderate maternal genomic excess (4m:1p) in the endosperm by producing
relatively small but viable seed i.e. there is no maternal triploid block, 2) the majority of
ecotypes do not possess paternal triploid block either, although Col-0 is not unique since
RLD was discovered to also have a potent paternal triploid block. Thus genetic variation
for triploid block occurs in A. thaliana, but a larger number of ecotypes should be tested
before drawing firm conclusions about prevalence.
Why Col-0 and RLD should have a very similar type of triploid block was
puzzling. The question was therefore addressed as to whether the mechanism responsible
for the behaviour in the two ecotypes had a common underlying cause (4.2.4.1). Using 4x
167
Col-0/RLD F1 hybrids as pollen parents in [2x X 4x] crosses caused abnormal seed
development at the roughly the same frequency as the original 4x parents strongly
suggesting that the RLD and Col-0 syndromes are underpinned by a common genetic
mechanism. Despite extensive investigation nothing connecting the ancestry of the two
ecotypes could be found; we cannot say therefore whether their triploid block behaviour
arose in a common ancestor, or independently.
Chapter 4 also describes an attempt to better understand mechanistic basis the Col-
0 syndrome. Two scenarios were considered: 2x Col-0 is a ‗weak‘ mother or 4x Col-0 is a
‗strong‘ father. Crossing experiments (4.2.3) provided little support for the weak mother
idea, but there was evidence that 4x Col-0 can behave as a strong father: crosses to 4
ecotypes (C24, Per, Cvi and RLD) resulted in high levels (>70%) of abnormal seed, and a
further 2 ecotypes (Ler and Stw) produced moderate levels (>40%) of abnormal seed.
However, 50% (7 from 14) of the ecotypes tested produced very low levels of abnormal
seed. Thus, 4x Col-0 is not a universally aggressive pollen parent, but is highly aggressive
when paired with certain ecotypes.
The pairing of certain A. thaliana ecotypes has recently been shown to also result in
hybrid necrosis (Reviewed in Reiseberg and Blackman, 2010; see also Table 1.1). For
example, Bomblies et al. (2007) showed that an allele of an NB-LRR gene family member
(DANGEROUS MIX 1 (DM1)) triggers necrosis when combined with an allele from a
second locus (DM2) from another accession. Similarly, (Bikard et al., 2009) showed that
seed development is arrested in proportion of F1 progeny resulting from a cross between
Columbia-0 (Col) and Cape Verde Island (Cvi) ecotypes due to ecotype-specific
differential silencing of two HISTIDINOL-PHOSPHATE AMINO-TRANSFERASE genes,
HPA1 and HPA2. It is possible therefore that the ability of 4x Col-0 to lethally disrupt seed
development when paired with certain ecotypes but not others has a similar basis.
However, the most challenging feature of the Col-0 syndrome its asymmetry. Any
explanation of the syndrome must account for this asymmetry, and in particular that 1) a
diploid sperm is disruptive to seed development in a [2x X 4x] cross but not in a [4x X 4x]
cross, 2) a haploid sperm is not disruptive, and 3) diploid maternal gametes in Col-0 do not
maternalize seeds more than those of other ecotypes in [4x X 2x] crosses.
There are various potential ways in which asymmetry could arise more or less
directly upon polyploid formation including genomic rearrangements, epigenetic
alterations to DNA and changes in gene expression patterns (Song et al., 1995; Weiss and
Maluszynska, 2000; Comai et al., 2000; Kashkush et al., 2002; Osborne et al., 2003). An
168
attractive hypothesis is that the genomic changes that occur when Col-0 becomes tetraploid
could have different consequences for maternal and paternal gametes, and therefore
explain the behaviour of diploid gametes in Col-0 (and RLD). Mega- and micro-
gametogenesis are different in a several ways, including the number of mitoses prior to
gamete formation (Scott and Spielman, 2006), the extent of chromatin condensation
(Valencia, 1982), development of the surrounding sporophytic tissues (Grossniklaus and
Schneitz, 1998; Simao et al., 2007), molecular and genetic basis of cell specification and
differentiation (Grossniklaus and Schneitz, 1998). It is possible therefore that the
polyploidisation–induced alterations to DNA structure could impact the two genders of
gametes differently. What is observed is that 4x Col plants produce benign maternal
gametes but paternal gametes that cause massive, lethal, endosperm over-proliferation. The
paternal genomes in effect behave as if derived from a hexaploid pollen parent.
Lethal endosperm over-proliferation in [2x X 6x] crosses can be explained by the
supernumerary paternal chromosomes supplying an excess of genes that promote
endosperm proliferation (Scott and Spielman, 2006). How does a diploid sperm from a 4x
Col-0 plant apparently achieve the same level of growth promoter excess as a triploid
sperm from other ecotypes? Clearly, this must be achieved without access to additional
physical copies of paternally derived growth promoting genes. There are at least two
potential sources of extra growth promoting genes. The first is virtual – the paternally-
derived growth promoting genes are expressed at a higher level or for longer during
endosperm development. This might be achieved by an epigenetic change in the paternal
genome, due to the polyploidisation event, that enables the paternal chromatin to resist
attempts by the seed parent to reduce paternal expression. Furthermore, it is well known
that for many genes expression from the paternal genome is absent or very low during
early seed development (Vielle-Calzada et al., 2000). The silencing of the paternal genome
is probably related to the tight packaging of sperm chromatin involving specific histones
(Ueda and Tanaka, 1995; Xu et al., 1999) or changes in methylation levels of sperm DNA
as compared with DNA in the vegetative nucleus (Oakeley et al., 1997). Male-specific
polyploidization-induced changes to chromatin packing or genome methylation could
enable earlier or higher levels of paternal genome expression following fertilisation leading
to endosperm over-growth.
A second source of extra growth promoting genes is the maternal genome. Growth
promoting genes are hypothesized to be silent within the maternally-derived genome of the
endosperm (Scott et al., 1998a). A possibility is that the Col-0 derived paternal genome is
169
able to express factors that relieve maternal silencing of these genes. Similarly, paternal
repression of maternally-expressed growth inhibitor genes such as MEDEA (Grossniklaus
et al., 1998) would have the same effect.
Chapter 4 (4.3.4.) also addressed the interesting question of whether the Col-0
syndrome arises only in gametes derived from tetraploids or also appears when the
genomes of diploid Col-0 plants fail to undergo meiotic reduction. Experiments with the A.
thaliana (Col-0) mutants Atps-1 and jas-3 (d‘Erfurth et al., 2008; Erilova et al., 2009),
which produce unreduced male gametes, provided some useful insights. Both mutants
caused triploid block when used as pollen parents with a 2x Col-0 seed parent indicating
that diploid sperm formed by both non-reduction and chromosome-doubling in a tetraploid
are similarly disruptive to endosperm development. The data also showed that the
disruptive activity arises very rapidly in Atps-1, since there are only two mitoses between
meiosis II, when non-reduction occurs, and fertilisation.
7.2. The Tsu-1 maternal modifier of Col-killing
The work presented in Chapter 4 revealed that whilst certain ecotypes were highly
susceptible to 4x Col-0 killing, others such a Tsu-1 were highly resistant (4.2.1.). Dilkes et
al., (2008) had previously shown that Ler offers some resistance to Col-0 killing, and had
used this to identify a maternal modifier of Col-killing. We were therefore interested in
identifying additional and perhaps more potent maternal modifiers from Tsu-1 since this
ecotype had much higher levels of Col-killing resistance than Ler. This work is described
in Chapter 5.
The failure of seed development in Col-0 [2x X 4x] crosses is associated with
massive endosperm over-proliferation, both peripheral and chalazal, and a failure to
undergo cellularisation (Dilkes et al., 2008). However, the ttg2 maternal modifier
identified in Ler rescues lethality by promoting cellularisation, but has little effect on
reduce overall endosperm size. The Tsu-1 modifier was therefore investigated to determine
whether a similar mechanism operated. Diagnostic crosses showed like Ler the Tsu-1
modifier did not markedly reduce the size of the endosperm, but promoted successful
endosperm cellularisation.
To gain a better understanding of how modifiers function, an attempt was made in
the present work to map and the Tsu-1 modifier and identify the underlying gene or genes.
A backcross strategy was adopted and was successfully progressed to the BC3F3 (Figure
5.9). The Tsu-1 modifier appears to be a dominant trait, which simplified the mapping
170
procedure. The approach adopted was to produce two backcross populations: one with the
Tsu-1 allele of the modifier introgressed into the Col-0 background, and the other with the
Col-0 allele of the modifier introgressed into Tsu-1. This would generate a ‗rescuing‘ or 4x
Col-0 resistant line composed of mostly Col-0 DNA and a none-rescuing line composed
Tsu-1 DNA. Analysis using a small number of molecular markers spread across the 5 A.
thaliana chromosomes suggested that the approach progressing as expected. The lines
would then be used to either map the modifier locus using a conventional marker approach,
or alternatively to locate the modifier locus by DNA sequencing.
7.3. QTL mapping in plant breeding
The work described in Chapter 6 was aimed at increasing our understanding of the
mechanism underlying the Col-killer trait by mapping and ultimately identifying the gene
or genes responsible. The dramatically different behaviour of tetraploid Col-0 and Ler
pollen parents in crosses to a Col-0 seed parent mapping suggested a mapping strategy
based on Col and Ler parents. Recombinant Inbred Lines (RILs) have proved highly
effective in mapping genes where genetic variation exists for a trait between two ecotypes
of A. thaliana. The Lister-Dean RIL population was constructed from Col and Ler parents
and was therefore potentially useful in mapping the Col-killer. Thus a mapping strategy
was developed using this genetic resource. Since a diploid pollen parent does not express
the killer trait, the approach envisaged was to produce tetraploid derivatives of sufficient
‗core‘ RIL lines to rough map the trait, and score the 4x RILs in crosses to Col 2x. The
approach identified 4 QTL on three different chromosomes (one QTL in both 1 and 2
chromosomes, and 2 QTL on chromosome 4), which accounted for a large proportion of
the Col-0 killing activity. These QTL overlay a physical distance 2627.5 kb, 5740 kb and
4895 kb, 397.5 kb respectively of chromosomal DNA, and contain a total of approximately
2420 genes. These regions are clearly still large, and further work is required to reduce the
interval size before identifying the Col-0 killing is possible.
Quantitative genetic approaches have offered significant insights into phenotypic
evolution. Most ecologically important traits are quantitative, exhibiting a continuous
range of phenotypic variations. For example, plants in natural populations often show
quantitative variation in their resistance to damage by natural enemies (Weinig et al.,
2003). The quantitative traits in different organisms including plants and animals are
controlled by a number of genes that shows continuous variation in progeny.
171
QTL mapping has been used by many biologists to identify genes with the
assistance of DNA molecular markers. The use of DNA markers in plant breeding has
opened a new agricultural area called molecular breeding (Rafalski and Tingey, 1993).
Also, DNA markers will play an important role in enhancing global food production by
improving the efficiency of conventional plant breeding programs (Ortiz, 1998; Kasha,
1999). There are many factors that influence the detection of QTLs segregation in a
population (Asins, 2002). The main ones are genetic properties of QTL, which control the
traits, environmental effects, population size, and experimental error. However, QTL
mapping studies should be independently confirmed or verified due to the previous factors
described (Lander and Kruglyak, 1995). Furthermore, some modern studies proposed that
QTL effects and positions should be evaluated in independent populations, because QTL
mapping is based on typical population sizes in a low power of QTL detection and a large
bias of QTL effects (Utz et al., 2000). Unfortunately, due to constraints such as lack of
research funding and time, and possibly a lack of understanding of the need to confirm
results, QTL mapping studies are rarely confirmed. Most QTL analysis in plants involves
populations derived from pure lines as discussed in Chapter 6 and several approaches have
been developed to associate QTL with molecular markers in such populations (Kearsey
and Pooni, 1996). In some plants e.g. autogamous plants, QTL mapping studies mainly
make use of F2 or backcross progenies because they are the easiest and earliest to obtain
(Vanooijen, 1992; Asins, 2002).
In QTL plant breeding studies, some authors suggested that F2 is better than a
backcross since QTL with recessive alleles in a recurrent backcrossed parent could not be
detected, and when dominance is present QTL gives bias estimates of the effects because
additive and dominant effects are completely confounded in this design (Carbonell et al.,
1993). They also found that the degree of dominance in F2 progenies can be estimated, but
there are two inconveniences of F2 and backcross populations: the genotype cannot be
replicated as in double haploids (DHs) or RILs, and epistatic interactions could hardly be
studied. In fact, the concepts for detecting QTL were developed more than 75 years ago
(Sax, 1923). In recent years the availability of DNA markers and powerful biometric
methods has led to considerable progress in QTL mapping in plants. But due to rapid
developments in marker technology, statistical methodology for identifying quantitative
trait loci (QTLs) and the terminology used by molecular biologists, the utility of DNA
markers in plant breeding may not be clearly understood by non-molecular biologists
(Collard et al., 2005).
172
References
Abbott, R. J. (1992). Plant invasions, interspecific hybridization and the evolution of new
plant taxa. Trends in Ecology and Evolution 7(12): 401-405.
Adams, K. L., Wendel, J. F. (2005). Polyploidy and genome evolution in plants. Current
Opinion in Plant Biology 8(2): 135-141.
Agashe, B., Prasad, C. K., Siddiqi, I. (2002). Identification and analysis of DYAD: a
gene required for meiotic chromosome organisation and female meiotic progression
in Arabidopsis. Development 129(16): 3935-3943.
Alonso-Blanco, C., Blankestijn-de Vries, H., Hanhart, C. J., Koornneef, M. (1999).
Natural allelic variation at seed size loci in relation to other life history traits of
Arabidopsis thaliana. Proceedings of the National Academy of Sciences of the
United States of America 96(8): 4710-4717.
Alonso-Blanco, C., El-Assal, S. E. D., Coupland, G., Koornneef, M. (1998). Analysis of
natural allelic variation at flowering time loci in the Landsberg erecta and Cape
Verde islands ecotypes of Arabidopsis thaliana. Genetics 149(2): 749-764.
Anderson, E. (1936). Hybridization in American Tradescantias. Ann Missouri Bot Gard
23((3)): 511-525.
Arnold, M. L. (1998). Paradigm lost: Natural hybridization and evolution. American
Journal of Botany 85(6): 1.
Asins, M. J. (2002). Present and future of quantitative trait locus analysis in plant
breeding. Plant Breeding 121(4): 281-291.
Austin, D. F., Lee, M. (1996). Genetic resolution and verification of quantitative trait loci
for flowering and plant height with recombinant inbred lines of maize. Genome
39(5): 957-968.
Babu, R., Nair, S. K., Prasanna, B. M., Gupta, H. S. (2004). Integrating marker-assisted
selection in crop breeding - Prospects and challenges. Current Science 87(5): 607-
619.
Bailey, J. P. ,Stace, C. A. (1992). Chromosome-number, morphology, pairing, and DNA
values of species and hybrids in the genus fallopia (polygonaceae). Plant
Systematics and Evolution 180(1-2): 29-52.
Bailey, K. I., Obrien, W. D., Dunn, F. (1981). ultrasonically induced, invivo
morphological damage in mouse testicular tissue. Archives of Andrology 6(4): 301-
306.
Balasubramanian, S., Schwartz, C., Singh, A., Warthmann, N., Kim, M. C., Maloof,
J. N., Loudet, O., Trainer, G. T., Dabi, T., Borevitz, J. O., Chory, J., Weigel, D. (2009). QTL Mapping in New Arabidopsis thaliana Advanced Intercross-
Recombinant Inbred Lines. Plos One 4(2).
Bamberg, J. B. (1994). Allelism of endosperm balance number (EBN) in solanum acaule
bitt and other wild potato species. Theoretical and Applied Genetics 89(6): 682-
686.
Bandaranayake, C. K., Koumproglou, R., Wang, X. Y., Wilkes, T., Kearsey, M. J. (2004). QTL analysis of morphological and developmental traits in the Ler x Cvi
population of Arabidopsis thaliana - QTL analysis in Arabidopsis. Euphytica
137(3): 361-371.
Barriere, Y., Mechin, V., Denoue, D., Bauland, C., Laborde, J. (2010). QTL for Yield,
Earliness, and Cell Wall Quality Traits in Topcross Experiments of the F838 x
F286 Early Maize RIL Progeny. Crop Science 50(5): 1761-1772.
173
Basten, C.J., B.S. Weir, Z.-B. Zeng, (1994). Zmap-a QTL cartographer. In: J.S.G.C.
Smith, B.J. Benkel,W.F. Chesnais, J.P. Gibson, B.W. Kennedy and E.B. Burnside
(Eds.), Proceedings of the 5th World Congress on Genetics Applied to Livestock
Production: Computing Strategies and Software, Guelph, Ontario, Canada.
Published by the Organizing Committee, 5th World Congress on Genetics Applied
to Livestock Production.
Bell, C. J., Ecker, J. R. (1994). Assignment of 30 microsatellite loci to the linkage map of
Arabidopsis. Genomics 19(1): 137-144.
Berger, F. (1999). Endosperm development. Current Opinion in Plant Biology 2(1): 28-
32.
Berger, F. (2003). Endosperm: the crossroad of seed development. Current Opinion in
Plant Biology 6(1): 42-50.
Bikard, D., Patel, D., Le Mette, C., Giorgi, V., Camilleri, C., Bennett, M. J., Loudet,
O. (2009). Divergent Evolution of Duplicate Genes Leads to Genetic
Incompatibilities Within A-thaliana. Science 323(5914): 623-626.
Birchler, J. A. (1993). Dosage analysis of maize endosperm development. Annual Review
of Genetics 27: 181-204.
Birchler, J. A., Bhadra, U., Bhadra, M. P., Auger, D. L. (2001). Dosage-dependent gene
regulation in multicellular eukaryotes: Implications for dosage compensation,
aneuploid syndromes, and quantitative traits. Developmental Biology 234(2): 275-
288.
Blakeslee, A.F. (1921). Types of mutations and their possible significance in evolution.
Am. Nature 55: 254-267.
Blanc, G., Barakat, A., Guyot, R., Cooke, R., Delseny, I. (2000). Extensive duplication
and reshuffling in the arabidopsis genome. Plant Cell 12(7): 1093-1101.
Boisnard-Lorig, C., Colon-Carmona, A., Bauch, W., Hodge, S., Doerner, P.,
Bancharel, E., Dumas, C., Haseloff, J., Berger, F. (2001). Dynamic analyses of
the expression of the HISTONE :: YFP fusion protein in arabidopsis show that
syncytial endosperm is divided in mitotic domains. Plant Cell 13(3): 495-509.
Bomblies, K., Lempe, J., Epple, P., Warthmann, N., Lanz, C., Dangl, J. L., Weigel, D. (2007). Autoimmune response as a mechanism for a Dobzhansky-Muller-type
incompatibility syndrome in plants. Plos Biology 5: 1962-1972.
Bomblies, K. ,Weigel, D. (2007). Hybrid necrosis: autoimmunity as a potential gene-flow
barrier in plant species. Nature Reviews Genetics 8(5): 382-393.
Borevitz, J. O., Maloof, J. N., Lutes, J., Dabi, T., Redfern, J. L., Trainer, G. T.,
Werner, J. D., Asami, T., Berry, C. C., Weigel, D., Chory, J. (2002).
Quantitative trait loci controlling light and hormone response in two accessions of
Arabidopsis thaliana. Genetics 160(2): 683-696.
Bowers, J. E., Chapman, B. A., Rong, J. K., Paterson, A. H. (2003). Unravelling
angiosperm genome evolution by phylogenetic analysis of chromosomal
duplication events. Nature 422(6930): 433-438.
Bradshaw, H. D., Wilbert, S. M., Otto, K. G., Schemske, D. W. (1995). Genetic-
mapping of floral traits associated with reproductive isolation in monkeyflowers
(MIMULUS). Nature 376(6543): 762-765.
Braselton, J. P., Wilkinson, M. J., Clulow, S. A. (1996). Feulgen staining of intact plant
tissues for confocal microscopy. Biotechnic and Histochemistry 71(2): 84-87.
Bretagnolle, F., Thompson, J. D. (1995). Tansley review no-78 - gametes with the
somatic chromosome-number - mechanisms of their formation and role in the
evolution of autopolyploid plants. New Phytologist 129(1): 1-22.
174
Briggs, F. N., Allard, R. W. (1953). The current status of the backcross method of plant
breeding. Agronomy Journal 45(4): 131-138.
Brink, R. A., Cooper, D. C. (1947). The endosperm in seed development. Botanical
Review 13(8): 423-477.
Broman, K. W. (2001). Review of statistical methods for QTL mapping in experimental
crosses. Lab Animal 30(7): 44-52.
Broman, K. W. (2005). The genomes of recombinant inbred lines. Genetics 169(2): 1133-
1146.
Brown, R. C., Lemmon, B. E., Nguyen, H., Olsen, O. A. (1999). Development of
endosperm in Arabidopsis thaliana. Sexual Plant Reproduction 12(1): 32-42.
Burke, J. M., Arnold, M. L. (2001). Genetics and the fitness of hybrids. Annual Review of
Genetics 35: 31-52.
Burr, B. ,Burr, F. A. (1991). Recombinant inbreds for molecular mapping in maize -
theoretical and practical considerations. Trends in Genetics 7(2): 55-60.
Burr, B., Burr, F. A., Thompson, K. H., Albertson, M. C., Stuber, C. W. (1988). Gene-
mapping with recombinant inbreds in maize. Genetics 118(3): 519-526.
Burrage, L. C., Baskin-Hill, A. E., Sinasac, D. S., Singer, J. B., Croniger, C. M.,
Kirby, A., Kulbokas, E. J., Daly, M. J., Lander, E. S., Broman, K. W., Nadeau,
J. H. (2010). Genetic resistance to diet-induced obesity in chromosome substitution
strains of mice. Mammalian Genome 21(3-4): 115-129.
Burton, T. L., Husband, B. C. (2000). Fitness differences among diploids, tetraploids,
and their triploid progeny in Chamerion angustifolium: Mechanisms of inviability
and implications for polyploid evolution. Evolution 54(4): 1182-1191.
Bushell, C., Spielman, M., Scott, R. J. (2003). The basis of natural and artificial
postzygotic hybridization barriers in Arabidopsis species. Plant Cell 15(6): 1430-
1442.
Butruille, D. V., Guries, R. P., Osborn, T. C. (1999). Linkage analysis of molecular
markers and quantitative trait loci in populations of inbred backcross lines of
Brassica napus L. Genetics 153(2): 949-964.
Can, C., Ozaslan, M., Holub, E. B. (2003). Characterisation of RPP7 mutant lines of the
col-5 ecotype of Arabidopsis thaliana. Journal of Cell and Molecular Biology 2(1):
25-30.
Carbonell, E. A., Asins, M. J., Baselga, M., Balansard, E., Gerig, T. M. (1993). Power
studies in the estimation of genetic-parameters and the localization of quantitative
trait loci for backcross and doubled haploid populations. Theoretical and Applied
Genetics 86(4): 411-416.
Carneiro, A. M. D., Airey, D. C., Thompson, B., Zhu, C. B., Lu, L., Chesler, E. J.,
Erikson, K. M., Blakely, R. D. (2009). Functional coding variation in recombinant
inbred mouse lines reveals multiple serotonin transporter-associated phenotypes.
Proceedings of the National Academy of Sciences of the United States of America
106(6): 2047-2052.
Carputo, D., Frusciante, L., Peloquin, S. J. (2003). The role of 2n gametes and
endosperm balance number in the origin and evolution of polyploids in the tuber-
bearing solanums. Genetics 163(1): 287-294.
Carputo, D., Monti, L., Werner, J. E., Frusciante, L. (1999). Uses and usefulness of
endosperm balance number. Theoretical and Applied Genetics 98(3-4): 478-484.
Carson, M. L., Stuber, C. W., Senior, M. L. (1996). Identification of quantitative trait
loci (QTLs) for resistance to two foliar diseases in a mapping population of
recombinant inbred (RI) lines of maize. Phytopathology 86(11 SUPPL.): S59.
175
Chang, C., Bowman, J. L., Dejohn, A. W., Lander, E. S., Meyerowitz, E. M. (1988).
Restriction fragment length polymorphism linkage map for Arabidopsis-thaliana.
Proceedings of the National Academy of Sciences of the United States of America
85(18): 6856-6860.
Chaudhury, A. M., Ming, L., Miller, C., Craig, S., Dennis, E. S., Peacock, W. J. (1997). Fertilization-independent seed development in Arabidopsis thaliana.
Proceedings of the National Academy of Sciences of the United States of America
94(8): 4223-4228.
Cho, Y. G., Kang, H. J., Lee, Y. T., Jong, S. K., Eun, M. Y., McCouch, S. R. (2010).
Identification of quantitative trait loci for physical and chemical properties of rice
grain. Plant Biotechnology Reports 4(1): 61-73.
Choi, P., Mano, Y., Ishikawa, A., Odashima, M., Umezawa, T., Fujimura, T.,
Takahata, Y., Komatsuda, T. (2010). Identification of QTLs controlling somatic
embryogenesis using RI population of cultivar x weedy soybean. Plant
Biotechnology Reports 4(1): 23-27.
Churchill, G. A., Doerge, R. W. (1994). Empirical threshold values for quantitative trait
mapping. Genetics 138(3): 963-971.
Clarke, J. H., Dean, C. (1994). Mapping FRI, a locus controlling flowering time and
vernalization response in Arabidopsis-thaliana. Molecular and General Genetics
242(1): 81-89.
Clausen, R. E., Cameron, D. R. (1944). Inheritance in nicotiana tabacum. XVIII.
Monosomic analysis. Genetics 29(5): 447-477.
Clerkx, E. J. M., El-Lithy, M. E., Vierling, E., Ruys, G. J., Blankestijin-De Vries, H.,
Groot, S. P. C., Vreugdenhil, D., Koornneef, M. (2004). Analysis of natural
allelic variation of Arabidopsis seed germination and seed longevity traits between
the accessions Landsberg erecta and Shakdara, using a new recombinant inbred line
population. Plant Physiology 135(1): 432-443.
Collard, B. C. Y., Jahufer, M. Z. Z., Brouwer, J. B., Pang, E. C. K. (2005). An
introduction to markers, quantitative trait loci (QTL) mapping and marker-assisted
selection for crop improvement: The basic concepts. Euphytica 142(1-2): 169-196.
Comai, L., Tyagi, A. P., Winter, K., Holmes-Davis, R., Reynolds, S. H., Stevens, Y.,
Byers, B. (2000). Phenotypic instability and rapid gene silencing in newly formed
arabidopsis allotetraploids. Plant Cell 12(9): 1551-1567.
Compton, D. A. (2005). Commentary regulation of mitosis by poly(ADP-ribosyl)ation.
Biochem. J. 391: e5-e6.
Cooper, D. C. (1951). Caryopsis development following matings between diploid and
tetraploid strains of zea-mays. American Journal of Botany 38(9): 702-708.
Cooper, D. C., Brink, R. A. (1945). Seed collapse following matings between diploid and
tetrapolid races of Lycopersicon pimpinellifolium. Genetics 30(3): 302-303.
Costa, L. M., Gutierrez-Marcos, J. F., Dickinson, H. G. (2004). More than a yolk: the
short life and complex times of the plant endosperm. Trends in Plant Science 9(10):
507-514.
Coyne, J. A., Orr, H. A. (1998). The evolutionary genetics of speciation. Philosophical
Transactions of the Royal Society of London Series B-Biological Sciences
353(1366): 287-305.
Criqui, M. C., Genschik, P. (2002). Mitosis in plants: how far we have come at the
molecular level? Current Opinion in Plant Biology 5(6): 487-493.
Crossa Raynaud, P. (1977). Fruit varieties acclimation. Annales de l'Amelioration des
Plantes (Paris) 27(5): 497-508.
176
d'Erfurth, I., Jolivet, S., Froger, N., Catrice, O., Novatchkova, M., Mercier, R. (2009).
Turning Meiosis into Mitosis. Plos Biology 7(6).
d'Erfurth, I., Jolivet, S., Froger, N., Catrice, O., Novatchkova, M., Simon, M.,
Jenczewski, E., Mercier, R. (2008). Mutations in AtPS1(Arabidopsis thaliana
Parallel Spindle 1) Lead to the Production of Diploid Pollen Grains. Plos Genetics
4(11).
Datson, P. M., Murray, B. G., Hammett, K. R. W. (2006). Pollination systems,
hybridization barriers and meiotic chromosome behaviour in Nemesia hybrids.
Euphytica 151(2): 173-185.
Delhanty, J. D. A., Griffin, D. K., Handyside, A. H., Harper, J., Atkinson, G. H. G.,
Pieters, M., Winston, R. M. L. (1993). Detection of aneuploidy and chromosomal
mosaicism in human embryos during preimplantation sex determination by
fluorescent in-situ hybridization, (FISH). Human Molecular Genetics 2(8): 1183-
1185.
Deng, Y. M., Teng, N. J., Chen, S. M., Chen, F. D., Guan, Z. Y., Song, A. P., Chang,
Q. S. (2010). Reproductive barriers in the intergeneric hybridization between
Chrysanthemum grandiflorum (Ramat.) Kitam. and Ajania przewalskii Poljak.
(Asteraceae). Euphytica 174(1): 41-50. Dewitte, W., Murray, J. A. H. (2003). The plant cell cycle. Annual Review of Plant
Biology 54: 235-264.
Dilkes, B. P. ,Comai, L. (2004). A differential dosage hypothesis for parental effects in
seed development. Plant Cell 16: 3174-3180.
Dilkes, B. P., Dante, R. A., Coelho, C., Larkins, B. A. (2002). Genetic analyses of
endoreduplication in Zea mays endosperrn: Evidence of sporophytic and zygotic
maternal control. Genetics 160(3): 1163-1177.
Dilkes, B. P., Spielman, M., Weizbauer, R., Watson, B., Burkart-Waco, D., Scott, R.
J., Comai, L. (2008). The Maternally Expressed WRKY Transcription Factor
TTG2 Controls Lethality in Interploidy Crosses of Arabidopsis. Plos Biology 6(12):
2707-2720.
Doerge, R. W. (2002). Mapping and analysis of quantitative trait loci in experimental
populations. Nature Reviews Genetics 3(1): 43-52.
Edwards, K., Johnstone, C., Thompson, C. (1991). A simple and rapid method for the
preparation of plant genomic DNA for PCR analysis. Nucleic Acids Research, 19.
1349-1349.
Ehlenfeldt, M. K., Hanneman, R. E. (1988). Genetic-control of endosperm balance
number (EBN) - 3 additive loci in a threshold-like system. Theoretical and Applied
Genetics 75(6): 825-832.
Ehlenfeldt, M. K., Hanneman, R. E. (1992). Endosperm dosage relationships among
Lycopersicon species. Theoretical and Applied Genetics 83(3): 367-372.
El-Assal, S. E. D., Alonso-Blanco, C., Peeters, A. J. M., Raz, V., Koornneef, M. (2001).
A QTL for flowering time in Arabidopsis reveals a novel allele of CRY2. Nature
Genetics 29(4): 435-440.
Erilova, A., Brownfield, L., Exner, V., Rosa, M., Twell, D., Scheid, O. M., Hennig, L.,
Koehler, C. (2009). Imprinting of the Polycomb Group Gene MEDEA Serves as a
Ploidy Sensor in Arabidopsis. Plos Genetics 5(9).
Eubanks, M. W. (1997). Molecular analysis of crosses between Tripsacum dactyloides
and Zea diploperennis (Poaceae). Theoretical and Applied Genetics 94(6-7): 707-
712.
Feil, R., Berger, F. (2007). Convergent evolution of genomic imprinting in plants and
mammals. Trends in Genetics 23(4): 192-199.
177
Ferreira, A., da Silva, M. F., Silva, L., Cruz, C. D. (2006). Estimating the effects of
population size and type on the accuracy of genetic maps. Genetics and Molecular
Biology 29(1): 187-192.
Fu, X. L., Lu, Y. G., Liu, X. D. ,Li, J. Q. (2009). Crossability Barriers in the Interspecific
Hybridization between Oryza sativa and O. meyeriana. Journal of Integrative Plant
Biology 51(1): 21-28.
Fulton, T. M., BeckBunn, T., Emmatty, D., Eshed, Y., Lopez, J., Petiard, V., Uhlig, J.,
Zamir, D. ,Tanksley, S. D. (1997). QTL analysis of an advanced backcross of
Lycopersicon peruvianum to the cultivated tomato and comparisons with QTLs
found in other wild species. Theoretical and Applied Genetics 95(5-6): 881-894.
Garcia-Hernandez, M. , Reiser, L. (2002). Using information from public Arabidopsis
databases to aid research. In: Methods in Molecular Biology, vol. 323: Arabidopsis
Protocols, Second edition, J. Salinas and J.J. Sanchez-Serrano, Human Press Inc.,
Totowa, NJ.
Godwin, H. (2005). A screen to identify seed size genes in Arabidopsis thaliana.
Comparative Biochemistry and Physiology a-Molecular and Integrative Physiology
141(3): S291-S291.
Grant, V. (1994). Modes and origins of mechanical and ethological isolation in
angiosperms. Proceedings of the National Academy of Sciences of the United States
of America 91(1): 3-10.
Griffing, B. ,Scholl, R. L. (1991). Qualitative and quantitative genetic-studies of
Arabidopsis thaliana. Genetics 129(3): 605-609.
Griffiths, Anthony JF; Miller, Jeffrey H; Suzuki, David T; Lewontin, Richard C;
Gelbart, William M (2000). An Introduction to Genetic Analysis (7th ed.). New
York: W. H. Freeman. ISBN 978-0-7167-3520-5.
Grossniklaus, U. ,Schneitz, K. (1998). The molecular and genetic basis of ovule and
megagametophyte development. Seminars in Cell and Developmental Biology 9(2):
227-238.
Grossniklaus, U., Vielle-Calzada, J. P., Hoeppner, M. A. ,Gagliano, W. B. (1998).
Maternal control of embryogenesis by medea, a Polycomb group gene in
Arabidopsis. Science 280(5362): 446-450.
Gutierrez-Marcos, J. F., Pennington, P. D., Costa, L. M. ,Dickinson, H. G. (2003).
Imprinting in the endosperm: a possible role in preventing wide hybridization.
Philosophical Transactions of the Royal Society of London Series B-Biological
Sciences 358(1434): 1105-1111.
Haig, D. (1990). New perspectives on the angiosperm female gametophyte. Botanical
Review 56(3): 236-274.
Haig, D. ,Westoby, M. (1989). Parent-specific gene-expression and the triploid
endosperm. American Naturalist 134(1): 147-155.
Haig, D. ,Westoby, M. (1991). Genomic Imprinting in Endosperm - Its Effect on Seed
Development in Crosses between Species, and between Different Ploidies of the
Same Species, and Its Implications for the Evolution of Apomixis. Philosophical
Transactions of the Royal Society of London Series B-Biological Sciences
333(1266): 1-13.
Hakansson, A. (1952). Seed development after 2x, 4x crosses in Galeopsis pubescens.
Hereditas 38(4): 425-448.
Hakansson, A. (1953). Endosperm formation after 2x, 4x crosses in certain cereals,
especially in Hordeum vulgare. Hereditas 39(1-2): 57-64.
Hakansson, A. (1956). Seed development of Brassica oleracea and B-rapa after certain
reciprocal pollinations. Hereditas 42(3-4): 373-396.
178
Hakansson, A. ,Ellerstrom, S. (1950). Seed development after reciprocal crosses between
diploid and tetraploid rye. Hereditas 36(3): 256-296.
Hanks, S., Coleman, K., Summersgill, B., Messahel, B., Williamson, D., Pritchard-
Jones, K., Strefford, J., Swansbury, J., Plaja, A., Shipley, J. ,Rahman, N. (2006). Comparative genomic hybridization and BUB1B mutation analyses in
childhood cancers associated with mosaic variegated aneuploidy syndrome. Cancer
Letters 239(2): 234-238.
Hartwell, L., Hood, L., Goldberg, M., Reynolds, A., Silver, L. and Verse, R. (2004).
Genetics from genes to genomes. The McGraw-Hill Companies. New York, USA.
Hassold, T., Hunt, P. A. ,Sherman, S. (1993). Trisomy in humans: incidence, origin and
etiology. Current Opinion in Genetics and Development 3(3): 398-403.
Haughn, G. ,Chaudhury, A. (2005). Genetic analysis of seed coat development in
Arabidopsis. Trends in Plant Science 10(10): 472-477.
Hawkes, J. G. ,Jackson, M. T. (1992). Taxonomic and evolutionary implications of the
endosperm balance number hypothesis in potatoes. Theoretical and Applied
Genetics 84(1-2): 180-185.
Henry, I. M., Dilkes, B. P. ,Comai, L. (2006). Molecular karyotyping and aneuploidy
detection in Arabidopsis thaliana using quantitative fluorescent polymerase chain
reaction. Plant Journal 48(2): 307-319.
Henry, I. M., Dilkes, B. P. ,Comai, L. (2007). Genetic basis for dosage sensitivity in
Arabidopsis thaliana. Plos Genetics 3(4).
Henry, I. M., Dilkes, B. P., Young, K., Watson, B., Wu, H. ,Comai, L. (2005).
Aneuploidy and genetic variation in the Arabidopsis thaliana triploid response.
Genetics 170(4): 1979-1988.
Herr, J. M. (1999). Endosperm development in Arabidopsis thaliana (L.) Heynh. Acta
Biologica Cracoviensia Series Botanica 41: 103-109.
Howard, D. J. (1999). Conspecific sperm and pollen precedence and speciation. Annual
Review of Ecology and Systematics 30: 109-132.
Howard, H. W. (1939). The size of seeds in diploid and autotetraploid Brassica oleracea
L. Journal of Genetics 38(1/2): 325-340.
Jackson, R. C. (1985). Genomic differentiation and its effect on gene flow. Systematic
Botany 10(4): 391-404.
Jacobs, T. W. (1995). Cell-Cycle Control. Annual Review of Plant Physiology and Plant
Molecular Biology 46: 317-339.
Jansky, S. (2006). Overcoming hybridization barriers in potato. Plant Breeding 125(1): 1-
12.
Johnsson, H. (1945). The triploid progeny of the cross diploid x tetraploid Populus
tremula. Hereditas 31(3-4): 411-440.
Johnston, S. A., Dennijs, T. P. M., Peloquin, S. J., Hanneman, R. E. (1980). The
significance of genic balance to endosperm development in interspecific crosses.
Theoretical and Applied Genetics 57(1): 5-9.
Johnston, S. A. ,Hanneman, R. E. (1980). Support of the endosperm balance number
hypothesis utilizing some tuber-bearing Solanum species. American Potato Journal
57(1): 7-14.
Johnston, S. A. ,Hanneman, R. E. (1982). Manipulations of endosperm balance number
overcome crossing barriers between diploid Solanum species. Science 217(4558):
446-448.
Johnston, S. A. ,Hanneman, R. E. (1999). The nature of the genetic control of
Endosperm Balance Number based on aneuploid analysis of Datura. Sexual Plant
Reproduction 12(2): 71-75.
179
Jones, N., Ougham, H. ,Thomas, H. (1997). Markers and mapping: we are all geneticists
now. New Phytologist 137(1): 165-177.
Joos, H. J., MauchMani, B. ,Slusarenko, A. J. (1996). Molecular mapping of the
Arabidopsis locus RPP11 which conditions isolate-specific hypersensitive
resistance against downy mildew in ecotype RLD. Theoretical and Applied
Genetics 92(2): 281-284.
Josefsson, C., Dilkes, B. ,Comai, L. (2006). Parent-dependent loss of gene silencing
during interspecies hybridization. Current Biology 16(13): 1322-1328.
Juenger, T., Purugganan, M. ,Mackay, T. F. C. (2000). Quantitative trait loci for floral
morphology in Arabidopsis thaliana. Genetics 156(3): 1379-1392.
Juenger, T. E., Sen, S., Bray, E., Stahl, E., Wayne, T., McKay, J. ,Richards, J. H.
(2010). Exploring genetic and expression differences between physiologically
extreme ecotypes: comparative genomic hybridization and gene expression studies
of Kas-1 and Tsu-1 accessions of Arabidopsis thaliana. Plant Cell and
Environment 33(8): 1268-1284.
Kang, I. H., Steffen, J. G., Portereiko, M. F., Lloyd, A. ,Drews, G. N. (2008). The
AGL62 MADS domain protein regulates cellularization during endosperm
development in Arabidopsis. Plant Cell 20(3): 635-647.
Kao, C. H. (2006). Mapping quantitative trait loci using the experimental designs of
recombinant inbred populations. Genetics 174(3): 1373-1386.
Kasha, K.J. (1999). Biotechnology and world food supply. Genome 42: 642–645.
Kashkush, K., Feldman, M. ,Levy, A. A. (2002). Gene loss, silencing and activation in a
newly synthesized wheat allotetraploid. Genetics 160(4): 1651-1659.
Kato, A. ,Birchler, J. A. (2006). Induction of tetraploid derivatives of maize inbred lines
by nitrous oxide gas treatment. Journal of Heredity 97(1): 39-44.
Kearsey, M. J. ,Farquhar, A. G. L. (1998). QTL analysis in plants; where are we now?
Heredity 80: 137-142.
Kearsey, M.J. , Pooni, H.S. (1998). The Genetical Analysis of Quantitative Traits.
Stanley Thornes (Publishers) Ltd., U.K.
Kearsey, M. J., Pooni, H. S. ,Syed, N. H. (2003). Genetics of quantitative traits in
Arabidopsis thaliana. Heredity 91(5): 456-464.
Kinoshita, T., Yadegari, R., Harada, J. J., Goldberg, R. B. ,Fischer, R. L. (1999).
Imprinting of the MEDEA polycomb gene in the Arabidopsis endosperm. Plant
Cell 11(10): 1945-1952.
Kiyosue, T., Ohad, N., Yadegari, R., Hannon, M., Dinneny, J., Wells, D., Katz, A.,
Margossian, L., Harada, J. J., Goldberg, R. B. ,Fischer, R. L. (1999). Control of
fertilization-independent endosperm development by the MEDEA polycomb gene
Arabidopsis. Proceedings of the National Academy of Sciences of the United States
of America 96(7): 4186-4191.
Kloosterman, B., Oortwijn, M., Uitdewilligen, J., America, T., de Vos, R., Visser, R.
G. F. ,Bachem, C. W. B. (2010). From QTL to candidate gene: Genetical
genomics of simple and complex traits in potato using a pooling strategy. Bmc
Genomics 11.
Knapp, S. J., Bridges, W. C. ,Birkes, D. (1990). Mapping quantitative trait loci using
molecular marker linkage maps. Theoretical and Applied Genetics 79(5): 583-592.
Kobayashi, Y., Furuta, Y. ,Koyama, H. (2004). QTL analysis of Al-tolerance in
Arabidopsis thaliana RI lines derived from Cvi and Ler. Plant and Cell Physiology
45: S55-S55.
Kobayashi, Y. ,Koyama, H. (2002). QTL analysis of Al tolerance in recombinant inbred
lines of Arabidopsis thaliana. Plant and Cell Physiology 43(12): 1526-1533.
180
Köhler, C., Scheid, O. M. ,Erilova, A. (2010). The impact of the triploid block on the
origin and evolution of polyploid plants. Trends in Genetics 26(3): 142-148.
Konieczny, A. ,Ausubel, F. M. (1993). A procedure for mapping Arabidopsis mutations
using codominant ecotype-specific PCR-based markers. Plant Journal 4(2): 403-
410.
Koornneef, M. (1983). The use of telotrisomics for centromere mapping in Arabidopsis
thaliana (l) heynh. Genetica 62(1): 33-40.
Koornneef, M., Alonso-Blanco, C., Peeters, A. J. M. ,Soppe, W. (1998). Genetic control
of flowering time in arabidopsis. Annual Review of Plant Physiology and Plant
Molecular Biology 49: 345-370.
Koumproglou, R., Wilkes, T. M., Townson, P., Wang, X. Y., Beynon, J., Pooni, H. S.,
Newbury, H. J. ,Kearsey, M. J. (2002). STAIRS: a new genetic resource for
functional genomic studies of Arabidopsis. Plant Journal 31(3): 355-364.
Khush, G. (1973). Cytogenetics of aneuploids. New York-Academic Press.
Kwon, S. I., Koczan, J. M. ,Gassmann, W. (2004). Two Arabidopsis srfr (suppressor of
rps4-RLD) mutants exhibit avrRps4-specific disease resistance independent of
RPS4. Plant Journal 40(3): 366-375.
Lander, E. ,Kruglyak, L. (1995). Genetic dissection of complex traits - guidelines for
interpreting and reporting linkage results. Nature Genetics 11(3): 241-247.
Langar, K., Lorieux, M., Desmarais, E., Griveau, Y., Gentzbittel, L. ,Berville, A. (2003). Combined mapping of DALP and AFLP markers in cultivated sunflower
using F9 recombinant inbred lines. Theoretical and Applied Genetics 106(6): 1068-
1074.
Larkin, J. C., Young, N., Prigge, M. ,Marks, M. D. (1996). The control of trichome
spacing and number in Arabidopsis. Development 122(3): 997-1005.
Law, C. N., Snape, J. W. ,Worland, A. J. (1987). Aneuploidy in wheat and its uses in
genetic analysis. Lupton, F. G. H. (Ed.). Wheat Breeding: Its Scientific Basis.
Xiv+566p. Routledge, Chapman and Hall, Ltd.: New York, New York, USA;
London, England, Uk. Illus. Maps: 71-108.
Leblanc, O., Pointe, C. ,Hernandez, M. (2002). Cell cycle progression during endosperm
development in Zea mays depends on parental dosage effects. Plant Journal 32(6):
1057-1066.
Lee, C. B., Page, L. E., McClure, B. A. ,Holtsford, T. P. (2008). Post-pollination
hybridization barriers in Nicotiana section Alatae. Sexual Plant Reproduction
21(3): 183-195.
Lee, I., Aukerman, M. J., Gore, S. L., Lohman, K. N., Michaels, S. D., Weaver, L. M.,
John, M. C., Feldmann, K. A. ,Amasino, R. M. (1994). Isolation of
LUMINIDEPENDENS - a gene involved in the control of flowering time in
arabidopsis. Plant Cell 6(1): 75-83.
Leitch, I. J. ,Bennett, M. D. (1997). Polyploidy in angiosperms. Trends in Plant Science
2(12): 470-476.
Lesley, J. W. (1928). A cytological and genetical study of progenies of triploid tomatoes.
Genetics 13(1): 0001-0043.
Levan, A. (1942). The effect of chromosomal variation in sugar beets. Hereditas 28: 345-
399.
Lewis, R. S. ,Kernodle, S. P. (2009). A method for accelerated trait conversion in plant
breeding. Theoretical and Applied Genetics 118(8): 1499-1508.
Li, N. , Dickinson, H. G. (2010). Balance between maternal and paternal alleles sets the
timing of resource accumulation in the maize endosperm. Proceedings of the Royal
Society B-Biological Sciences 277(1678): 3-10.
181
Li, Z. K., Pinson, S. R. M., Paterson, A. H., Park, W. D. ,Stansel, J. W. (1997).
Genetics of hybrid sterility and hybrid breakdown in an intersubspecific rice (Oryza
sativa L) population. Genetics 145(4): 1139-1148.
Lightfoot, D. A., Kouznetsova, A., Mahdy, E., Wilbertz, J. ,Hoog, C. (2006). The fate
of mosaic aneuploid embryos during mouse development. Developmental Biology
289(2): 384-394.
Lin, B. Y. (1982). Association of endosperm reduction with parental imprinting in maize.
Genetics 100(3): 475-486.
Lin, B. Y. (1984). Ploidy barrier to endosperm development in maize. Genetics 107(1):
103-115.
Lin, J. Z. ,Ritland, K. (1997). Quantitative trait loci differentiating the outbreeding
Mimulus guttatus from the inbreeding M-platycalyx. Genetics 146(3): 1115-1121.
Lin, S. Y., Sasaki, T. ,Yano, M. (1998). Mapping quantitative trait loci controlling seed
dormancy and heading date in rice, Oryza sativa L., using backcross inbred lines.
Theoretical and Applied Genetics 96(8): 997-1003.
Lisec, J., Steinfath, M., Meyer, R. C., Selbig, J., Melchinger, A. E., Willmitzer, L.
,Altmann, T. (2009). Identification of heterotic metabolite QTL in Arabidopsis
thaliana RIL and IL populations. Plant Journal 59(5): 777-788.
Lister, C. ,Dean, C. (1993). Recombinant Inbred Lines for Mapping Rflp and Phenotypic
Markers in Arabidopsis-Thaliana. Plant Journal 4(4): 745-750.
Liu, B., Vega, J. M., Segal, G., Abbo, S., Rodova, H. ,Feldman, M. (1998). Rapid
genomic changes in newly synthesized amphiploids of Triticum and Aegilops. I.
Changes in low-copy noncoding DNA sequences. Genome 41(2): 272-277.
Lopes, M. A. ,Larkins, B. A. (1993). Endosperm origin, development, and function. Plant
Cell 5(10): 1383-1399.
Loudet, O., Chaillou, S., Camilleri, C., Bouchez, D. ,Daniel-Vedele, F. (2002). Bay-0 x
Shahdara recombinant inbred line population: a powerful tool for the genetic
dissection of complex traits in Arabidopsis. Theoretical and Applied Genetics
104(6-7): 1173-1184.
Lukowitz, W., Gillmor, C. S. ,Scheible, W. R. (2000). Positional cloning in arabidopsis.
Why it feels good to have a genome initiative working for you. Plant Physiology
123(3): 795-805.
Lutz, A. (1909). Contribuição para o conhecimento das espécies brasileiras do gênero
― Simulium‖. Memόrias do Instituto Oswaldo Cruz, Rio de Janeiro 2: 213-262.
Mable, B. K. ,Bogart, J. P. (1995). Hybridization between tetraploid and diploid species
of treefrogs (Genus Hyla). Journal of Heredity 86(6): 432-440.
Mansfield, S. G. ,Briarty, L. G. (1990a). Development of the free-nuclear endosperm in
Arabidopsis thaliana L. Arabidopsis Information Service (27): 53-64.
Mansfield, S. G. ,Briarty, L. G. (1990b). Endosperm cellularization in Arabidopsis
thaliana L. Arabidopsis Information Service (27): 65-72.
Mansur, L. M., Orf, J. H., Chase, K., Jarvik, T., Cregan, P. B. ,Lark, K. G. (1996).
Genetic mapping of agronomic traits using recombinant inbred lines of soybean.
Crop Science 36(5): 1327-1336.
Marks, G. E. (1966). Origin and significance of intraspecific polyploidy - experimental
evidence from Solanum chacoense. Evolution 20(4): 552.
Martin, N. H., Bouck, A. C. ,Arnold, M. L. (2005). Loci affecting long-term hybrid
survivorship in Louisiana irises: Implications for reproductive isolation and
introgression. Evolution 59(10): 2116-2124.
182
Masuelli, R. W. ,Camadro, E. L. (1997). Crossability relationships among wild potato
species with different ploidies and Endosperm Balance Numbers (EBN). Euphytica
94(2): 227-235.
Matzke, M. A., Mette, M. F., Kanno, T. ,Matzke, A. J. M. (2003). Does the intrinsic
instability of aneuploid genomes have a causal role in cancer? Trends in Genetics
19(5): 253-256.
McClintock, B. (1929). A cytological and genetical study of triploid maize. Genetics
14(2): 180-222.
McKay, J. K., Richards, J. H., Nemali, K. S., Sen, S., Mitchell-Olds, T., Boles, S.,
Stahl, E. A., Wayne, T. ,Juenger, T. E. (2008). Genetics of drought adaptation in
Arabidopsis thaliana ii. QTL analysis of a new mapping population, Kas-1 x Tsu-1.
Evolution 62(12): 3014-3026.
Meinke, D. W., Cherry, J. M., Dean, C., Rounsley, S. D. ,Koornneef, M. (1998).
Arabidopsis thaliana: A model plant for genome analysis. Science 282(5389): 662-
+.
Menasha, J., Levy, B., Hirschhorn, K. ,Kardon, N. B. (2005). Incidence and spectrum of
chromosome abnormalities in spontaneous abortions: New insights from a 12-year
study. Genetics in Medicine 7(4): 251-263.
Mercier, R., Vezon, D., Bullier, E., Motamayor, J. C., Sellier, A., Lefevre, F., Pelletier,
G. ,Horlow, C. (2001). SWITCH1 (SWI1): a novel protein required for the
establishment of sister chromatid cohesion and for bivalent formation at meiosis.
Genes and Development 15(14): 1859-1871.
Meyre, D., Leonardi, A., Brisson, G. ,Vartanian, N. (2001). Drought-adaptive
mechanisms involved in the escape/tolerance strategies of Arabidopsis Landsberg
erecta and Columbia ecotypes and their F1 reciprocal progeny. Journal of Plant
Physiology 158(9): 1145-1152.
Micale, M. A., Schran, D., Emch, S., Kurczynski, T. W., Rahman, N. ,Van Dyke, D. L.
(2007). Mosaic variegated aneuploidy without microcephaly: Implications for
cytogenetic diagnosis. American Journal of Medical Genetics Part A 143A(16):
1890-1893.
Milbocke.D ,Sink, K. (1969). Embryology of diploid by diploid and diploid by tetraploid
crosses in Poinsettia. Canadian Journal of Genetics and Cytology 11(3): 598.
MitchellOlds, T. (1996). Genetic constraints on life-history evolution: Quantitative-trait
loci influencing growth and flowering in Arabidopsis thaliana. Evolution 50(1):
140-145.
Mohan, M., Nair, S., Bhagwat, A., Krishna, T. G., Yano, M., Bhatia, C. R. ,Sasaki, T.
(1997). Genome mapping, molecular markers and marker-assisted selection in crop
plants. Molecular Breeding 3(2): 87-103.
Montalenti, G. (1978). Glossary of genetics and cytogenetics - Classical and Molecular -
Rieger,R, Michaelis,A, Green,MM. Scientia 113(1-4): 286-286.
Morton, N. E. (1990). Genetic-linkage and complex diseases- A comment. Genetic
Epidemiology 7(1): 33-34.
Mouradov, A., Cremer, F. ,Coupland, G. (2002). Control of flowering time: Interacting
pathways as a basis for diversity. Plant Cell 14: S111-S130.
Muller, H. J. (1925). Why Polyploidy is Rarer in Animals than in Plants. The American
Naturalist 59: 346-353
Muntzing, A. (1930). Outlines to a genetic monograph of the genus Galeopsis. With
special regard to the nature and inheritance of partial sterility. Hered Itas 13((2/3)):
185-341.
183
Nadeau, J. H., Singer, J. B., Matin, A. ,Lander, E. S. (2000). Analysing complex genetic
traits with chromosome substitution strains. Nature Genetics 24(3): 221-225.
Nair, S., Rao, U. P., Bennett, J. ,Mohan, M. (1995). Detection of a highly heterozygous
locus in recombinant inbred lines of rice and its possible involvement in heterosis.
Theoretical and Applied Genetics 91(6-7): 978-986.
Nasrallah, M. E., Yogeeswaran, K., Snyder, S. ,Nasrallah, J. B. (2000). Arabidopsis
species hybrids in the study of species differences and evolution of amphiploidy in
plants. Plant Physiology 124(4): 1605-1614.
Nowell, P. C. (1976). Clonal evolution of tumor-cell populations. Science 194(4260): 23-
28.
Nurse, P. (1990). Universal control mechanism regulating onset of M-phase. Nature
344(6266): 503-508.
Oakeley, E. J., Podesta, A. ,Jost, J. P. (1997). Developmental changes in DNA
methylation of the two tobacco pollen nuclei during maturation. Proceedings of the
National Academy of Sciences of the United States of America 94(21): 11721-
11725.
Ortiz, R. (1998). Critical role of plant biotechnology for the genetic improvement of food
crops: Perspectives for the next millennium. Electron J Biotechnol [online] 1(3):
Issue of August 15.
Osborn, T. C., Pires, J. C., Birchler, J. A., Auger, D. L., Chen, Z. J., Lee, H. S.,
Comai, L., Madlung, A., Doerge, R. W., Colot, V. ,Martienssen, R. A. (2003).
Understanding mechanisms of novel gene expression in polyploids. Trends in
Genetics 19(3): 141-147.
Otto, S. P. ,Whitton, J. (2000). Polyploid incidence and evolution. Annual Review of
Genetics 34: 401-437.
Papp, I., Iglesias, V. A., Moscone, E. A., Michalowski, S., Spiker, S., Park, Y. D.,
Matzke, M. A. ,Matzke, A. J. M. (1996). Structural instability of a transgene locus
in tobacco is associated with aneuploidy. Plant Journal 10(3): 469-478.
Parker, J. E., Szabo, V., Staskawicz, B. J., Lister, C., Dean, C., Daniels, M. J. ,Jones,
J. D. G. (1993). Phenotypic characterization and molecular mapping of the
Arabidopsis thaliana locus rpp5, determining disease resistance to Peronospora
parasitica. Plant Journal 4(5): 821-831.
Parrott, W. A. ,Smith, R. R. (1986). Evidence for the existence of endosperm balance
number in the true clovers (Trifolium spp). Canadian Journal of Genetics and
Cytology 28(4): 581-586.
Paterson A. H. (1996). Making genetic maps. In: Paterson AH (ed.) Genome mapping in
plants, San Diego, California: Academic Press, Austin, Texas, pp. 23–39.
Paterson, A. H., Lander, E. S., Hewitt, J. D., Peterson, S., Lincoln, S. E. ,Tanksley, S.
D. (1988). Resolution of quantitative traits into mendelian factors by using a
complete linkage map of restriction fragment length polymorphisms. Nature
335(6192): 721-726.
Patton, D. A., Franzmann, L. H. ,Meinke, D. W. (1991). Mapping genes essential for
embryo development in Arabidopsis thaliana. Molecular and General Genetics
227(3): 337-347.
Perez-Vega, E., Paneda, A., Rodriguez-Suarez, C., Campa, A., Giraldez, R. ,Ferreira,
J. J. (2010). Mapping of QTLs for morpho-agronomic and seed quality traits in a
RIL population of common bean (Phaseolus vulgaris L.). Theoretical and Applied
Genetics 120(7): 1367-1380.
Pihan, G. ,Doxsey, S. J. (2003). Mutations and aneuploidy: Co-conspirators in cancer?
Cancer Cell 4(2): 89-94.
184
Pines, J. (1999). Four-dimensional control of the cell cycle. Nature Cell Biology 1(3):
E73-E79.
Rafalski, J. A. ,Tingey, S. V. (1993). Genetic diagnostics in plant-breeding - RAPDS,
microsatellites and machines. Trends in Genetics 9(8): 275-280.
Ramsey, J. (2007). Unreduced gametes and neopolyploids in natural populations of
Achillea borealis (Asteraceae). Heredity 98(3): 143-150.
Ramsey, J. ,Schemske, D. W. (1998). Pathways, mechanisms, and rates of polyploid
formation in flowering plants. Annual Review of Ecology and Systematics 29: 467-
501.
Ravi, M., Marimuthu, M. P. A. ,Siddiqi, I. (2008). Gamete formation without meiosis in
Arabidopsis. Nature 451(7182): 1121-U1110.
Ray, A., Lang, J. D., Golden, T. ,Ray, S. (1996). SHORT INTEGUMENT (SIN1), a gene
required for ovule development in Arabidopsis, also controls flowering time.
Development 122(9): 2631-2638.
Redei, G. P. (1964). Megaspore selection in Arabidopsis thaliana. Genetics 50(2): 278.
Reiter, R. S., Williams, J. G. K., Feldmann, K. A., Rafalski, J. A., Tingey, S. V.
,Scolnik, P. A. (1992). Global and local genome mapping in Arabidopsis thaliana
by using recombinant inbred lines and random amplified polymorphic dnas.
Proceedings of the National Academy of Sciences of the United States of America
89(4): 1477-1481.
Repkova, J., Jungmannova, B. ,Jakesova, H. (2006). Identification of barriers to
interspecific crosses in the genus Trifolium. Euphytica 151(1): 39-48.
Ribaut, J. M. ,Hoisington, D. (1998). Marker-assisted selection: new tools and strategies.
Trends in Plant Science 3(6): 236-239.
Rick, C. M. ,Barton, D. W. (1954). Cytological and genetical identification of the primary
trisomics of the tomato. Genetics 39(5): 640-666.
Rick, C. M. ,Notani, N. K. (1961). Tolerance of extra chromosomes by primitive
tomatoes. Genetics 46(9): 1231.
Rieseberg, L. H. ,Blackman, B. K. (2010). Speciation genes in plants. Annals of Botany
106(3): 439-455.
Rieseberg, L. H. ,Carney, S. E. (1998). Plant hybridization. New Phytologist 140(4): 599-
624.
Robin, S., Pathan, M. S., Courtois, B., Lafitte, R., Carandang, S., Lanceras, S.,
Amante, M., Nguyen, H. T. ,Li, Z. (2003). Mapping osmotic adjustment in an
advanced back-cross inbred population of rice. Theoretical and Applied Genetics
107(7): 1288-1296.
Robles, P., Perez-Perez, J. M., Candela, H., Quesada, V., Barrero, J. M., Jover-Gil, S.,
Ponce, M. R. ,Micol, J. L. (2001). Genetic architecture of leaf morphogenesis in
Arabidopsis thaliana. International Journal of Developmental Biology 45: S61-
S62.
Samejima, I., Matsumoto, T., Nakaseko, Y., Beach, D. ,Yanagida, M. (1993).
Identification of 7 new cut genes involved in Schizosaccharomyces pombe mitosis.
Journal of Cell Science 105: 135-143.
Satina, S., Blakeslee, A. F. ,Avery, A. G. (1938). Chromosome behavior in triploid datura
III The seed. American Journal of Botany 25(8): 595-602.
Sax, K. (1923). Association of size differences with seed-coat pattern and pigmentation in
Phaseolus vulgaris. Genetics 8: 552—560.
Schiff, C. L., Wilson, I. W. ,Somerville, S. C. (2001). Polygenic powdery mildew disease
resistance in Arabidopsis thaliana: quantitative trait analysis of the accession
Warschau-1. Plant Pathology 50(6): 690-701.
185
Scott, R. J. ,Spielman, M. (2006). Genomic imprinting in plants and mammals: how life
history constrains convergence. Cytogenetic and Genome Research 113(1-4): 53-
67.
Scott, R. J., Spielman, M., Bailey, J. ,Dickinson, H. G. (1998a). Parent-of-origin effects
on seed development in Arabidopsis thaliana. Development 125(17): 3329-3341.
Scott, R. J., Vinkenoog, R., Spielman, M. ,Dickinson, H. G. (1998b). Medea: murder or
mistrial? Trends in Plant Science 3(12): 460-461.
Searle, I. ,Coupland, G. (2004). Induction of flowering by seasonal changes in
photoperiod. Embo Journal 23(6): 1217-1222.
Semagn, K., Bjornstad, A. ,Ndjiondjop, M. N. (2006). Principles, requirements and
prospects of genetic mapping in plants. African Journal of Biotechnology 5(25):
2569-2587.
Sharma, C. (1990). Chemically-induced aneuploidy in higher-plants. Mutagenesis 5(2):
105-125.
Simao, D. G., Scatena, V. L. ,Bouman, F. (2007). Anther development,
microsporogenesis and microgametogenesis in Heliconia (Heliconiaceae,
Zingiberales). Flora 202(2): 148-160.
Simpson, G. G. ,Dean, C. (2002). Flowering - Arabidopsis, the rosetta stone of flowering
time? Science 296(5566): 285-289.
Singer, J. B., Hill, A. E., Nadeau, J. H. ,Lander, E. S. (2005). Mapping quantitative trait
loci for anxiety in chromosome substitutions strains of mice. Genetics 169(2): 855-
862.
Snape, J. W., Flavell, R. B., Odell, M., Hughes, W. G. ,Payne, P. I. (1985).
Intrachromosomal mapping of the nucleolar organizer region relative to 3 marker
loci on chromosome-1B of wheat (Triticum aestivum). Theoretical and Applied
Genetics 69(3): 263-270.
Soltis, D. E., Soltis, P. S., Bennett, M. D. ,Leitch, I. J. (2003). Evolution of genome size
in the angiosperms. American Journal of Botany 90(11): 1596-1603.
Soltis, D. E., Soltis, P. S., Schemske, D. W., Hancock, J. F., Thompson, J. N.,
Husband, B. C. ,Judd, W. S. (2007). Autopolyploidy in angiosperms: have we
grossly underestimated the number of species? Taxon 56(1): 13-30.
Soltis, P. S. (2005). Ancient and recent polyploidy in angiosperms. New Phytologist
166(1): 5-8.
Song, K. M., Lu, P., Tang, K. L. ,Osborn, T. C. (1995). Rapid genome change in
synthetic polyploids of brassica and its implications for polyploid evolution.
Proceedings of the National Academy of Sciences of the United States of America
92(17): 7719-7723.
Soppe, W. J. J., Jacobsen, S. E., Alonso-Blanco, C., Jackson, J. P., Kakutani, T.,
Koornneef, M. ,Peeters, A. J. M. (2000). The late flowering phenotype of fwa
mutants is caused by gain-of-function epigenetic alleles of a homeodomain gene.
Molecular Cell 6(4): 791-802.
Spellman, P. T., Sherlock, G., Zhang, M. Q., Iyer, V. R., Anders, K., Eisen, M. B.,
Brown, P. O., Botstein, D. ,Futcher, B. (1998). Comprehensive identification of
cell cycle-regulated genes of the yeast Saccharomyces cerevisiae by microarray
hybridization. Molecular Biology of the Cell 9(12): 3273-3297.
Stebbins, G. L. (1958). The inviability, weakness, and sterility of interspecific hybrids.
Advances in Genetics Incorporating Molecular Genetic Medicine 9: 147-215.
Storchova, Z. ,Pellman, D. (2004). From polyploidy to aneuploidy, genome instability
and cancer. Nature Reviews Molecular Cell Biology 5(1): 45-54.
186
Stratton, D. A. (1998). Reaction norm functions and QTL-environment interactions for
flowering time in Arabidopsis thaliana. Heredity 81: 144-155.
Suijkerbuijk, S. J. E., van Osch, M. H. J., Bos, F. L., Hanks, S., Rahman, N. ,Kops, G.
(2010). Molecular Causes for BUBR1 Dysfunction in the Human Cancer
Predisposition Syndrome Mosaic Variegated Aneuploidy. Cancer Research 70(12):
4891-4900.
Taji, T., Seki, M., Yamaguchi-Shinozaki, K., Kamada, H., Giraudat, J. ,Shinozaki, K.
(1999). Mapping of 25 drought-inducible genes, RD and ERD, in Arabidopsis
thaliana. Plant and Cell Physiology 40(1): 119-123.
Takahashi, Y., Shomura, A., Sasaki, T. ,Yano, M. (2001). Hd6, a rice quantitative trait
locus involved in photoperiod sensitivity, encodes the alpha subunit of protein
kinase CK2. Proceedings of the National Academy of Sciences of the United States
of America 98(14): 7922-7927.
Tanksley, S. D. (1993). Mapping polygenes. Annual Review of Genetics 27: 205-233.
Thompson, W. P. (1930). Causes of difference in success of reciprocal interspecific
crosses. American Naturalist 64: 407-421.
Tiffin, P., Olson, M. S. ,Moyle, L. C. (2001). Asymmetrical crossing barriers in
angiosperms. Proceedings of the Royal Society of London Series B-Biological
Sciences 268(1469): 861-867.
Tock, Y., Ljubisavljevic, M., Thunberg, J., Windhorst, U., Inbar, G. F. ,Johansson, H.
(2002). Information-theoretic analysis of de-efferented single muscle spindles.
Biological Cybernetics 87(4): 241-248.
Törjek, O., Meyer, R. C., Zehnsdorf, M., Teltow, M., Strompen, G., Witucka-Wall,
H., Blacha, A. ,Altmann, T. (2008). Construction and analysis of 2 reciprocal
Arabidopsis introgression line populations. Journal of Heredity 99(4): 396-406.
Törjek, O., Witucka-Wall, H., Meyer, R. C., von Korff, M., Kusterer, B.,
Rautengarten, C. ,Altmann, T. (2006). Segregation distortion in Arabidopsis
C24/Col-0 and Col-0/C24 recombinant inbred line populations is due to reduced
fertility caused by epistatic interaction of two loci. Theoretical and Applied
Genetics 113(8): 1551-1561.
Tsunematsu, H., Yoshimura, A., Harushima, Y., Nagamura, Y., Kurata, N., Yano,
M., Sasaki, T. ,Iwata, N. (1996). RFLP framework map using recombinant inbred
lines in rice. Breeding Science 46(3): 279-284.
Ueda, K. ,Tanaka, I. (1995). The appearance of male gamete-specific histones gh2b and
gh3 during pollen development in Lilium longiflorum. Developmental Biology
169(1): 210-217.
Ungerer, M. C., Halldorsdottir, S. S., Modliszewski, J. L., Mackay, T. F. C.
,Purugganan, M. D. (2002). Quantitative trait loci for inflorescence development
in Arabidopsis thaliana. Genetics 160(3): 1133-1151.
Utz, H. F., Melchinger, A. E. ,Schon, C. C. (2000). Bias and sampling error of the
estimated proportion of genotypic variance explained by quantitative trait loci
determined from experimental data in maize using cross validation and validation
with independent samples. Genetics 154(4): 1839-1849.
Valencia, R. (1982). Levels of chromatin condensation and activity. Journal de
Physiologie (Paris) 78(7): 653-664.
VanderSchaar, W., AlonsoBlanco, C., LeonKloosterziel, K. M., Jansen, R. C.,
VanOoijen, J. W. ,Koornneef, M. (1997). QTL analysis of seed dormancy in
Arabidopsis using recombinant inbred lines and MQM mapping. Heredity 79: 190-
200.
187
Vanooijen, J. W. (1992). Accuracy of mapping quantitative trait loci in autogamous
species. Theoretical and Applied Genetics 84(7-8): 803-811.
Veitia, R. A. (2003). Nonlinear effects in macromolecular assembly and dosage
sensitivity. Journal of Theoretical Biology 220(1): 19-25.
Vickery, R. K. (1995). Speciation in mimulus, or, can a simple flower color mutant lead to
species divergence. Great Basin Naturalist 55(2): 177-180.
Vielle-Calzada, J. P., Baskar, R. ,Grossniklaus, U. (2000). Delayed activation of the
paternal genome during seed development. Nature 404(6773): 91-94.
Vinkenoog R, Spielman M, Adams S, Fischer RL, Dickinson HG, Scott RJ (2000).
Hypomethylation promotes autonomous endosperm development and rescues post-
fertilisation lethality in fie-mutants. Plant Cell 12:2271–2282.
von Wangenheim, K. H. ,Peterson, H. P. (2004). Aberrant endosperm development in
interploidy crosses reveals a timer of differentiation. Developmental Biology
270(2): 277-289.
Vos, P., Hogers, R., Bleeker, M., Reijans, M., Vandelee, T., Hornes, M., Frijters, A.,
Pot, J., Peleman, J., Kuiper, M. ,Zabeau, M. (1995). AFLP - a new technique for
dna-fingerprinting. Nucleic Acids Research 23(21): 4407-4414.
Voullaire, L., Slater, H., Williamson, R. ,Wilton, L. (2000). Chromosome analysis of
blastomeres from human embryos by using comparative genomic hybridization.
Human Genetics 106(2): 210-217.
Wan, J., Yamaguchi, Y., Kato, H. ,Ikehashi, H. (1996). Two new loci for hybrid sterility
in cultivated rice (Oryza sativa L). Theoretical and Applied Genetics 92(2): 183-
190.
Wang, J. K., Wan, X. Y., Crossa, J., Crouch, J., Weng, J. F., Zhai, H. Q. ,Wan, J. M.
(2006). QTL mapping of grain length in rice (Oryza sativa L.) using chromosome
segment substitution lines. Genetical Research 88(2): 93-104.
Wang, J. L., Tian, L., Madlung, A., Lee, H. S., Chen, M., Lee, J. J., Watson, B.,
Kagochi, T., Comai, L. ,Chen, Z. J. (2004). Stochastic and epigenetic changes of
gene expression in arabidopsis polyploids. Genetics 167(4): 1961-1973.
Warmke, H. E. and Blakeslee, A. (1940). The establishment of a 4N dioecious race in
Melandrium. Am. J. Bot. 27: 751-762.
Watkins, A. E. (1932). Hybrid sterility and incompatibility. Journal of Genetics 25(2):
125-162.
Weinig, C., Stinchcombe, J. R. ,Schmitt, J. (2003). QTL architecture of resistance and
tolerance traits in Arabidopsis thaliana in natural environments. Molecular Ecology
12(5): 1153-1163.
Weiss, H. ,Maluszynska, J. (2000). Chromosomal rearrangement in autotetraploid plants
of Arabidopsis thaliana. Hereditas 133(3): 255-261.
Werner, J. D., Borevitz, J. O., Uhlenhaut, N. H., Ecker, J. R., Chory, J. ,Weigel, D.
(2005). FRIGIDA-independent variation in flowering time of natural Arabidopsis
thaliana accessions. Genetics 170(3): 1197-1207.
Werth, C. R. ,Windham, M. D. (1991). A model for divergent, allopatric speciation of
polyploid pteridophytes resulting from silencing of duplicate-gene expression.
American Naturalist 137(4): 515-526.
Winge 0. (1917). The chromosomes: their number and general importance. Comptes
Rendus des Travaux du Laboratoire Carlesberg 13: 131-275.
Winkler, C. R., Jensen, N. M., Cooper, M., Podlich, D. W. ,Smith, O. S. (2003). On the
determination of recombination rates in intermated recombinant inbred populations.
Genetics 164(2): 741-745.
188
Woodell, S. R. J. ,Valentine, D. H. (1961). Studies in British Primulas. DC. Seed
incompatibility in diploid-autotetraploid crosses. New Phytologist 60(3): 282-294.
Wu, J. X., Jenkins, J. N., Zhu, J. ,McCarty, J. C. (2003). Comparisons of quantitative
trait locus mapping properties between two methods of recombinant inbred line
development. Euphytica 132(2): 159-166.
Xu, H. L., Swoboda, I., Bhalla, P. L. ,Singh, M. B. (1999). Male gametic cell-specific
expression of H2A and H3 histone genes. Plant Molecular Biology 39(3): 607-614.
Yamamoto, E., Takashi, T., Morinaka, Y., Lin, S. Y., Wu, J. Z., Matsumoto, T.,
Kitano, H., Matsuoka, M. ,Ashikari, M. (2010). Gain of deleterious function
causes an autoimmune response and Bateson-Dobzhansky-Muller incompatibility
in rice. Molecular Genetics and Genomics 283(4): 305-315.
Yanagida, M. (1989). Gene products required for chromosome separation. J Cell Sci
Suppl 12: 213-229.
Youssoufian, H. ,Pyeritz, R. E. (2002). Mechanisms and consequences of somatic
mosaicism in humans. Nature Reviews Genetics 3(10): 748-758.
Yurov, Y. B., Vorsanova, S. G., Iourov, I. Y., Demidova, I. A., Beresheva, A. K.,
Kravetz, V. S., Monakhov, V. V., Kolotii, A. D., Voinova-Ulas, V. Y.
,Gorbachevskaya, N. L. (2007). Unexplained autism is frequently associated with
low-level mosaic aneuploidy. Journal of Medical Genetics 44(8): 521-525.
Zeng, H. Z., Luo, L. J., Zhang, W. X., Zhou, J., Li, Z. F., Liu, H. Y., Zhu, T. S., Feng,
X. Q. ,Zhong, Y. (2007). PlantQTL-GE: a database system for identifying
candidate genes in rice and Arabidopsis by gene expression and QTL information.
Nucleic Acids Research 35: D879-D882.
Zhu, W. Y., Lin, J., Yang, D. W., Zhao, L., Zhang, Y. D., Zhu, Z., Chen, T. ,Wang, C.
L. (2009). Development of Chromosome Segment Substitution Lines Derived from
Backcross between Two Sequenced Rice Cultivars, Indica Recipient 93-11 and
Japonica Donor Nipponbare. Plant Molecular Biology Reporter 27(2): 126-131.