Embed Size (px)
Citation preview
Genetic Analysis of Genome-wide Variation in Human Gene ExpressionMorley M. et al. Nature 2004,430: 743-747.
Yen-Yi Ho
Outline
• Introduction
• Data
• Method: Linkage analysis
• Results
• Discussion
• Comments
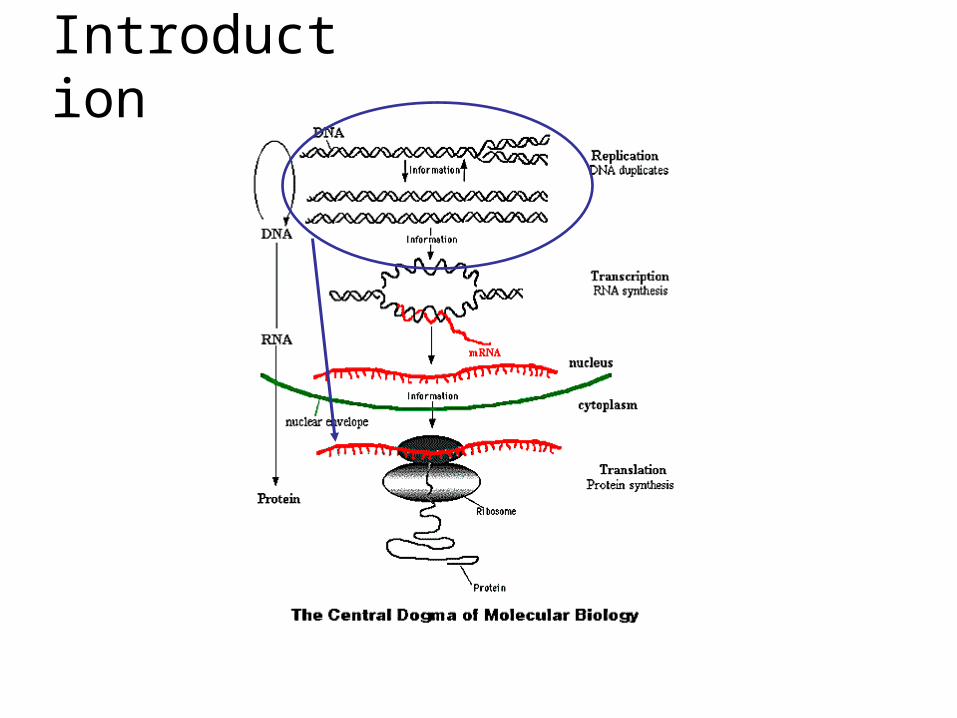
Introduction
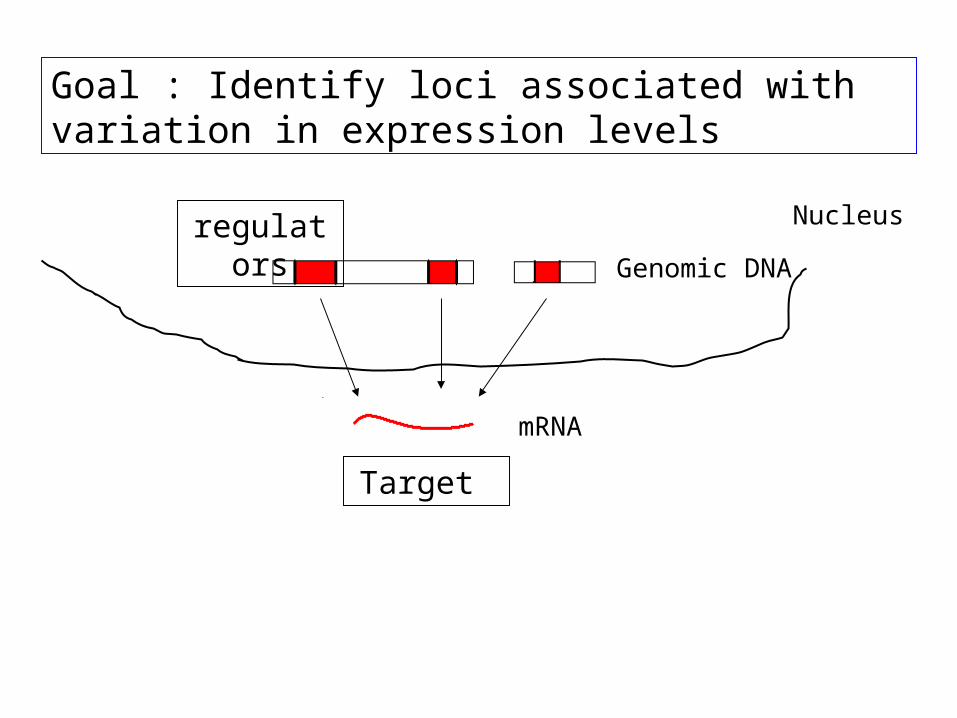
Goal : Identify loci associated with variation in expression levels
Genomic DNA
mRNA
Nucleus
mRNA
regulators
Target
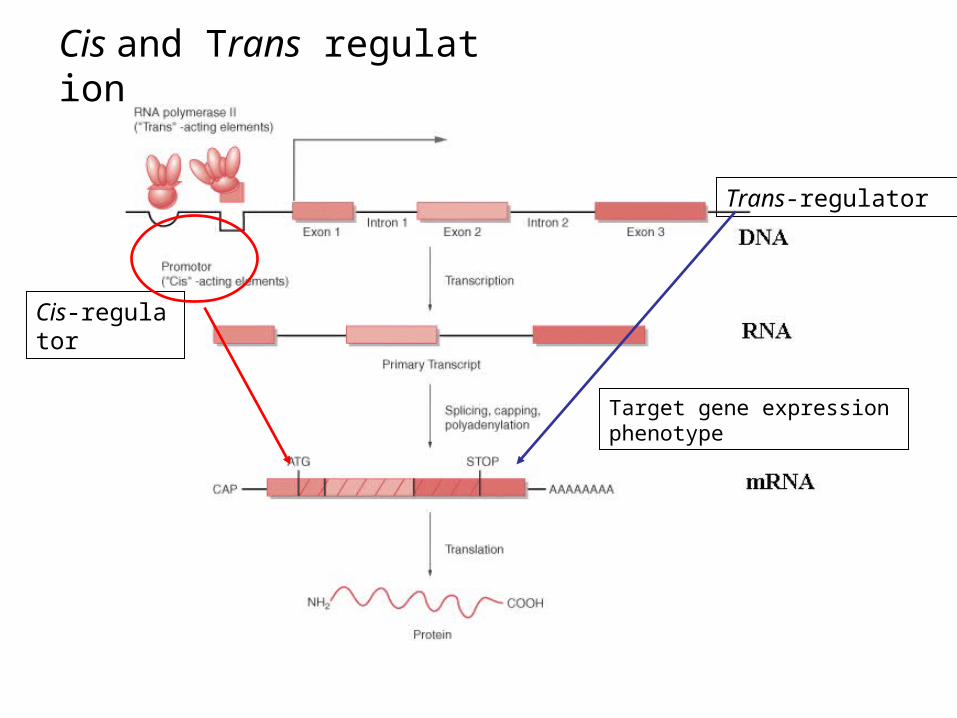
Cis and Trans regulation
Target gene expression phenotype
Cis-regulator
Trans-regulator
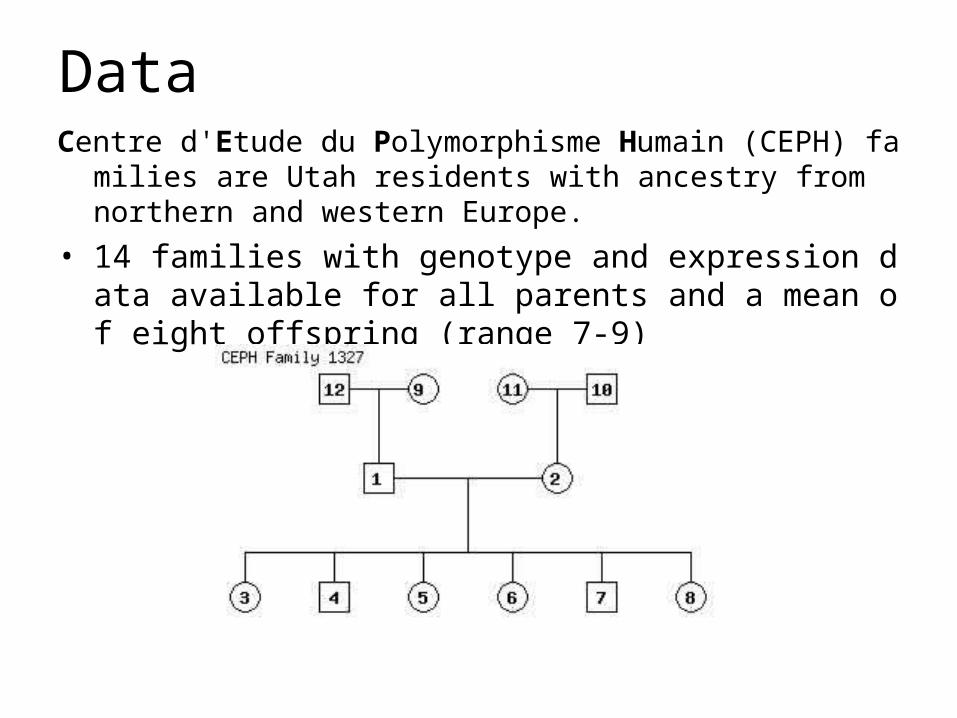
DataCentre d'Etude du Polymorphisme Humain (CEPH) families are
Utah residents with ancestry from northern and western Europe.
• 14 families with genotype and expression data available for all parents and a mean of eight offspring (range 7-9)
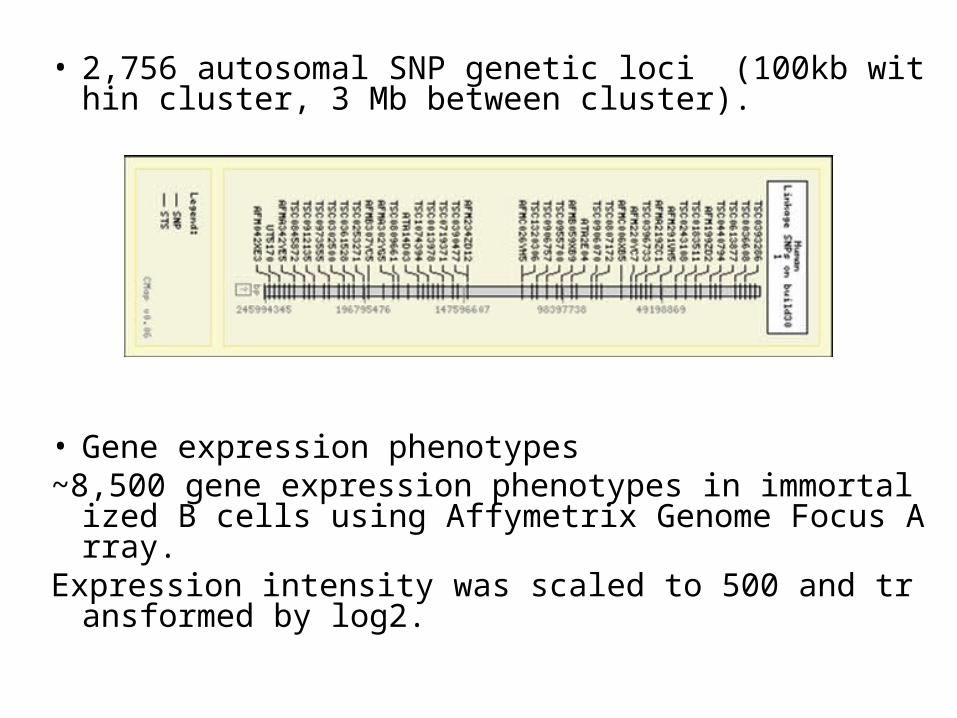
• 2,756 autosomal SNP genetic loci (100kb within cluster, 3 Mb between cluster).
• Gene expression phenotypes~8,500 gene expression phenotypes in immortalized
B cells using Affymetrix Genome Focus Array.Expression intensity was scaled to 500 and transfor
med by log2.
• 3,554 most variable expression phenotypes are selected (between > within variation).
• Using CEPH unrelated individuals (94 grandparents), two array replicates per individual was performed. The within individual variation was indicated by the mean of variance of array replicates.
A1 A2 A3 A4
A1 A3 A1 A4
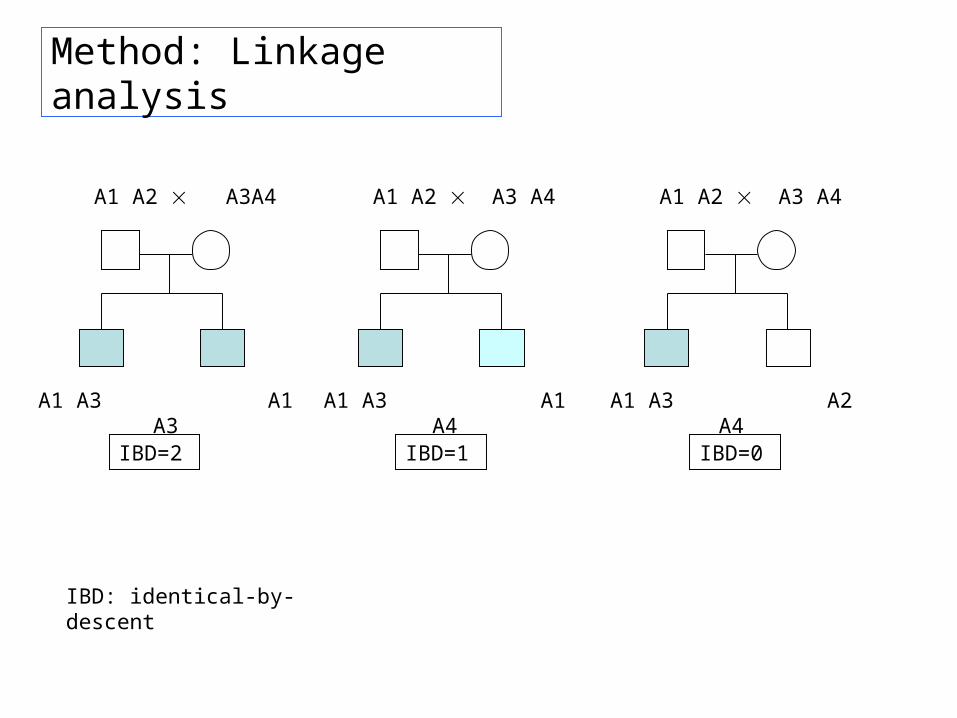
Method: Linkage analysis
A1 A2 A3 A4
A1 A3 A2 A4
A1 A2 A3A4
A1 A3 A1 A3
IBD=2 IBD=1 IBD=0
IBD: identical-by-descent
21 2( )i iY Y
21 2( )i iY Y
0 1 2
0 1 2
0 12, 1
1
2i1 2
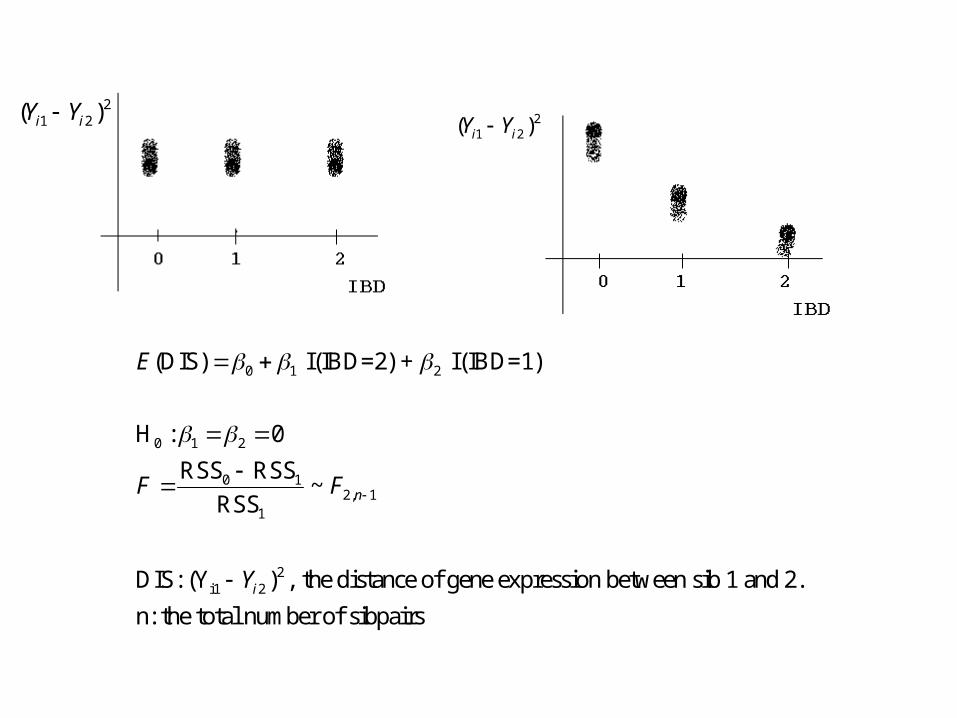
(DIS) I(IBD=2) + I(IBD=1)
H : 0
RSS RSS~
RSS
DIS: (Y ) , the distance of gene expression between sib 1 and 2.
n: the total number of sibpairs
n
i
E
F F
Y
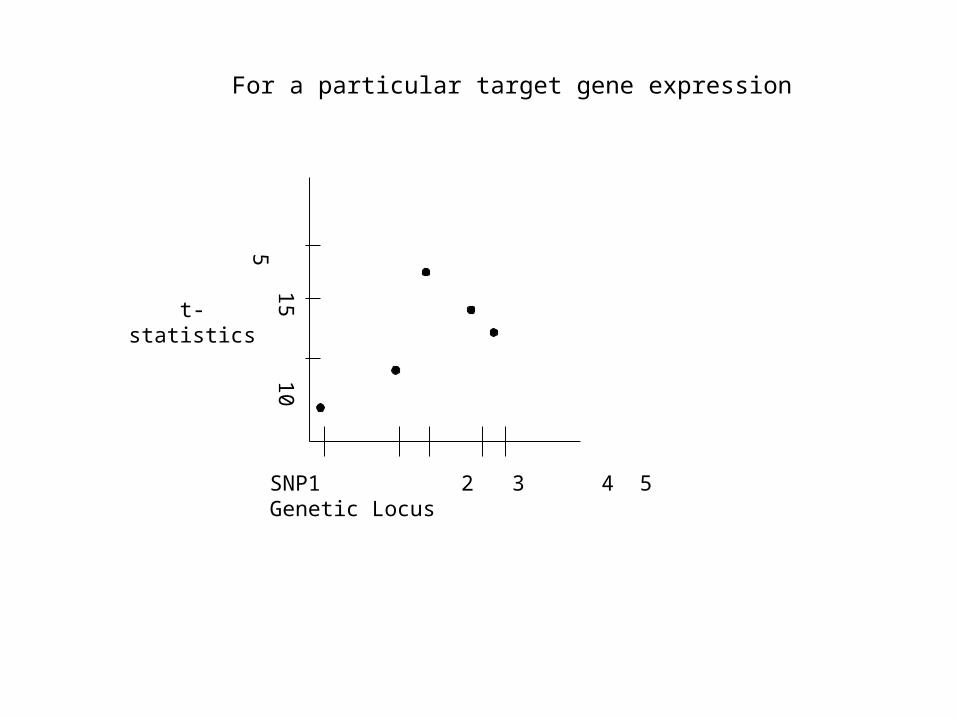
For a particular target gene expression
15 10 5
t-statistics
SNP1 2 3 4 5 Genetic Locus
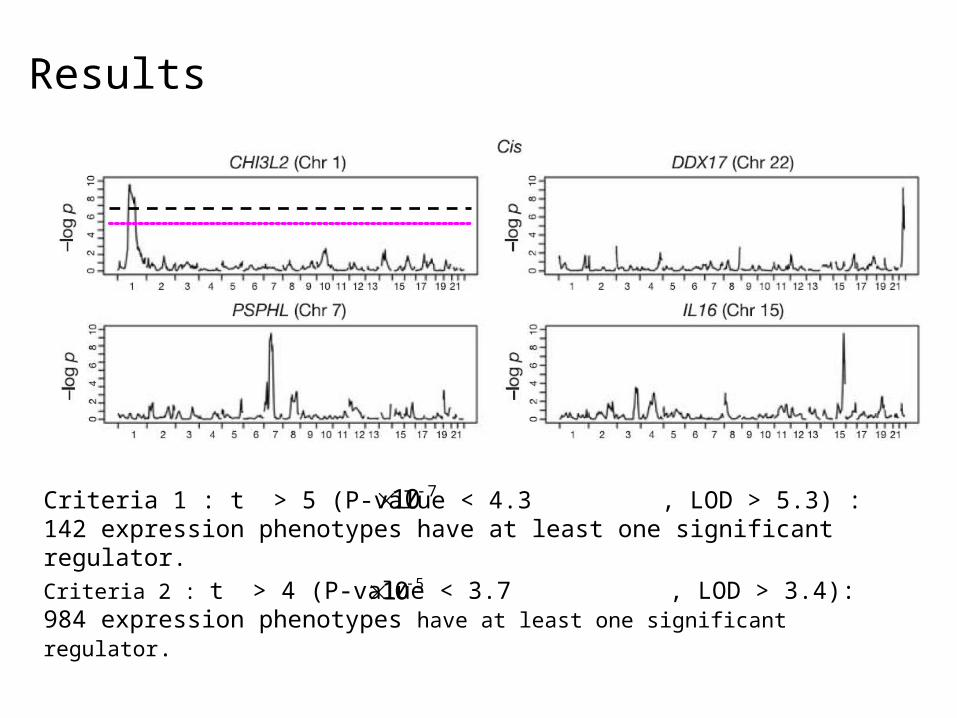
Results
Criteria 1 : t > 5 (P-value < 4.3 , LOD > 5.3) : 142 expression phenotypes have at least one significant regulator.
710
Criteria 2 : t > 4 (P-value < 3.7 , LOD > 3.4): 984 expression phenotypes have at least one significant regulator.
510
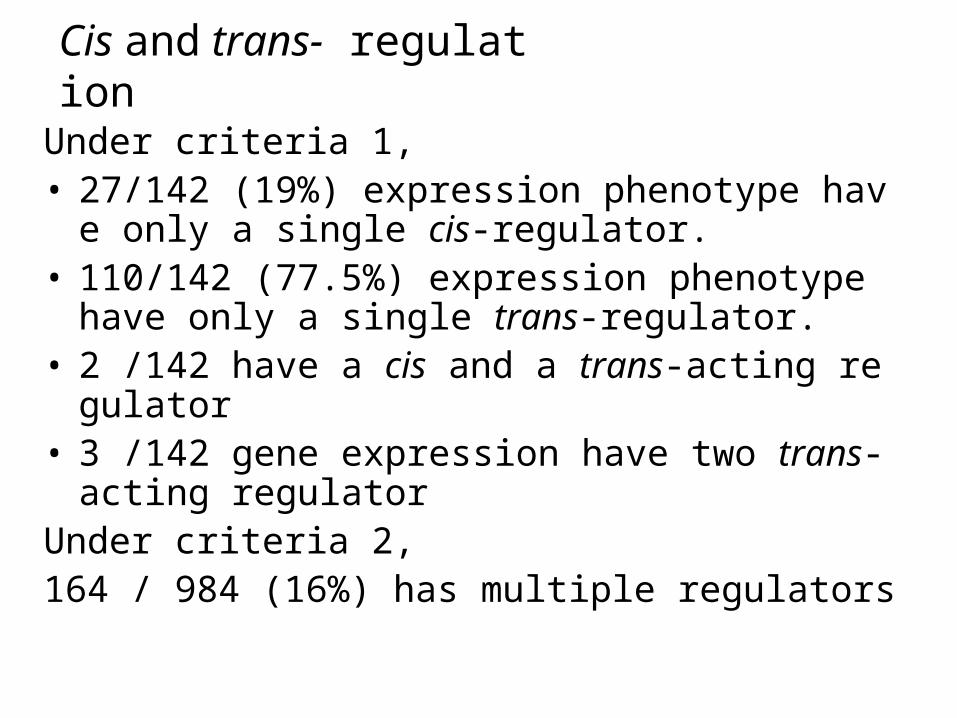
Under criteria 1,• 27/142 (19%) expression phenotype have only a
single cis-regulator.• 110/142 (77.5%) expression phenotype have onl
y a single trans-regulator.• 2 /142 have a cis and a trans-acting regulator• 3 /142 gene expression have two trans-acting reg
ulator Under criteria 2, 164 / 984 (16%) has multiple regulators
Cis and trans- regulation
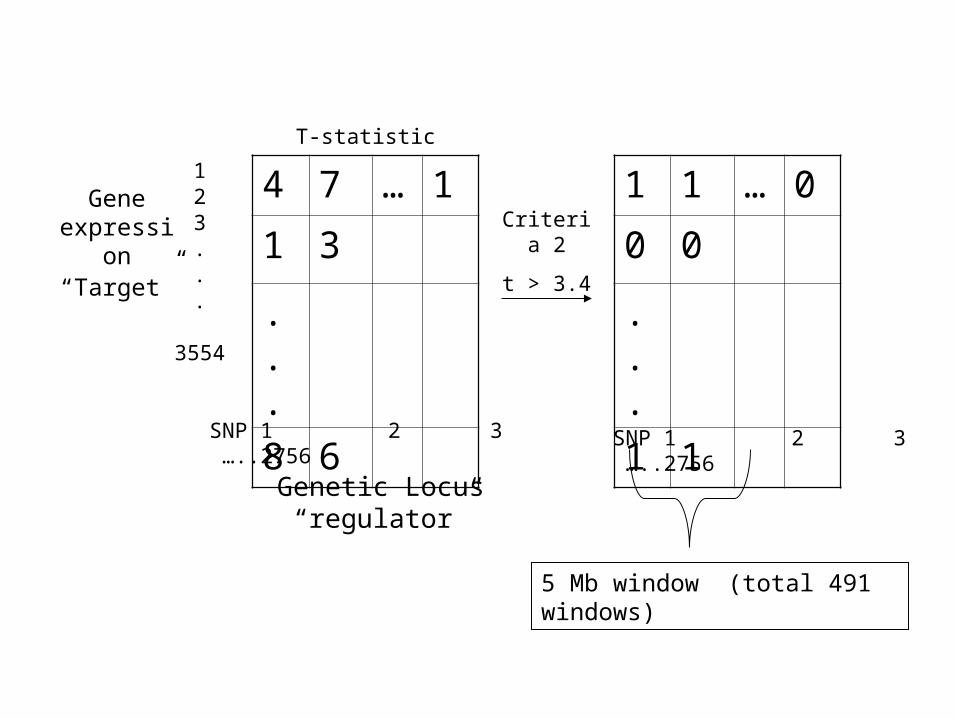
4 7 … 1
1 3
...
8 6
Gene expression “Target”
Genetic Locus “regulator”
123...
3554
SNP 1 2 3 …..2756
T-statistic
5 Mb window (total 491 windows)
1 1 … 0
0 0
...
1 1
SNP 1 2 3 …..2756
Criteria 2
t > 3.4
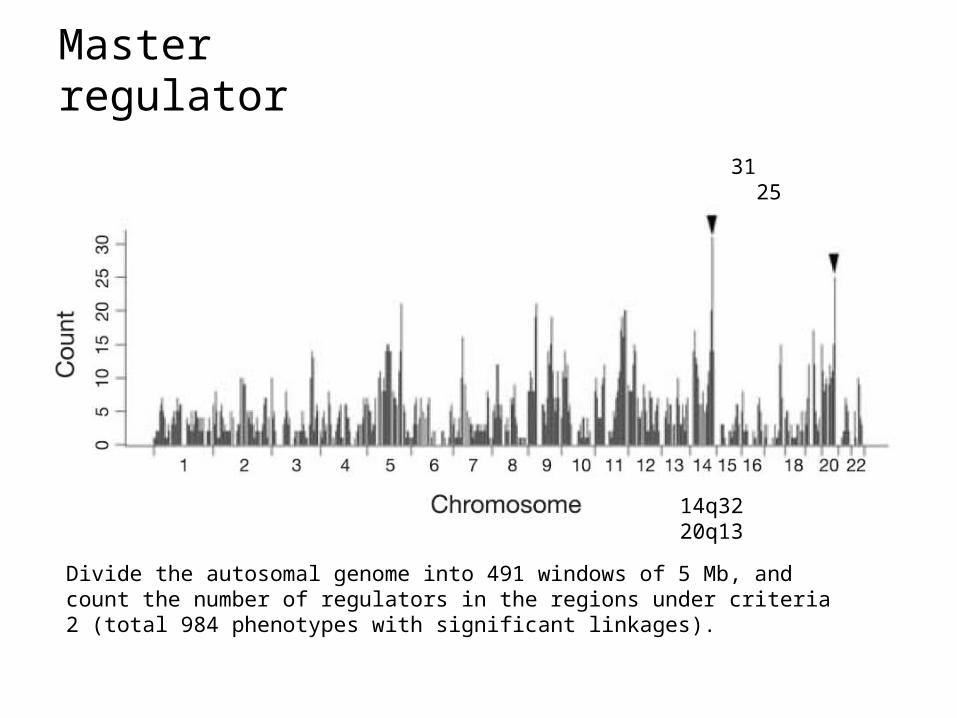
Master regulator
Divide the autosomal genome into 491 windows of 5 Mb, and count the number of regulators in the regions under criteria 2 (total 984 phenotypes with significant linkages).
31 25
14q32 20q13
Co-regulation
• Use the gene expression levels of 94 CEPH grandparents
• Hierarchical clustering was performed and group genes by the correlation of the 31 target gene expression levels
• Permutation test was used to determine the significant level of pair-wise correlation.
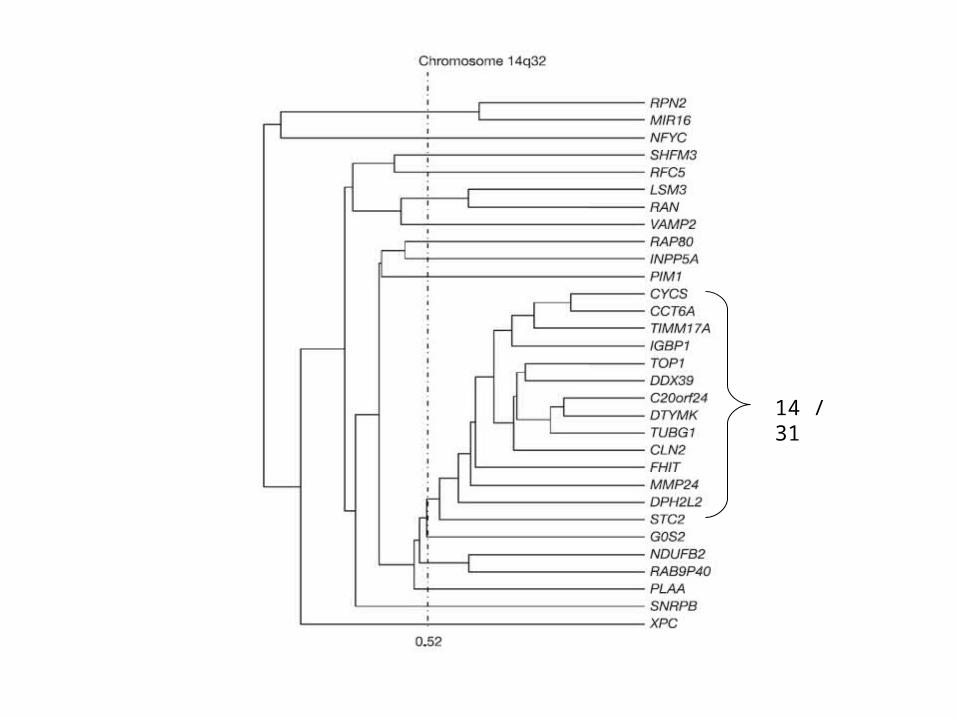
14 / 31
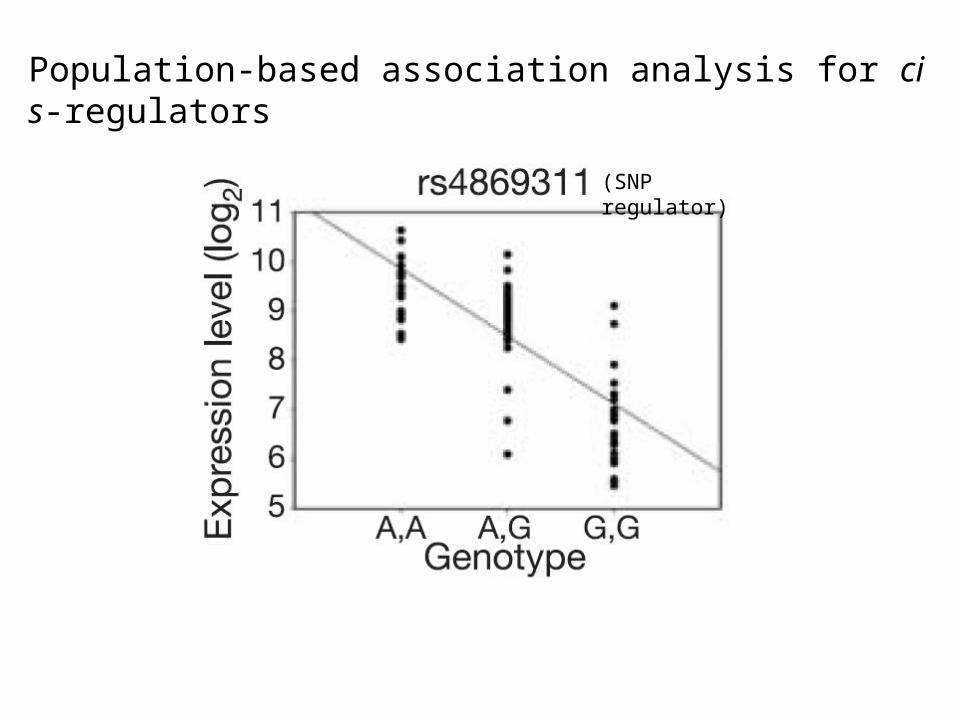
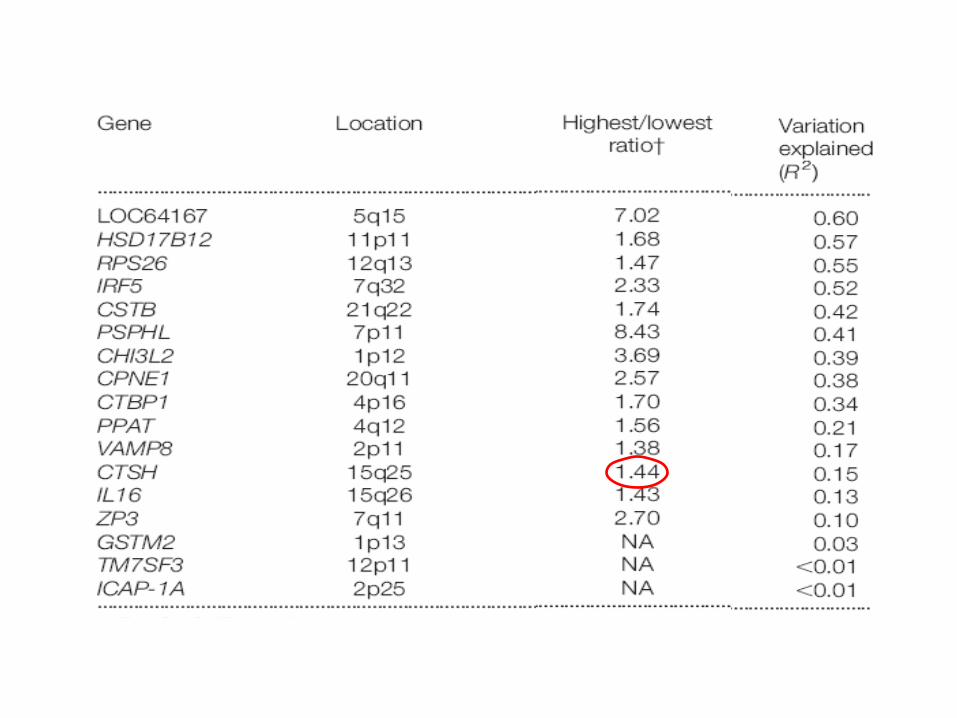
Population-based association analysis for cis-regulators
(SNP regulator)
Discussion• The study applied genome-wide mapping m
ethod to identify the chromosomal regions regulate to the gene expression phenotypes.
• This type of study has the potential to uncover complicated transcriptional control.
• Cis-, trans-acting and master regulators were discovered.
• The linkage results are reliable as verified by association study and qRT-PCR.
Comments
• In this study, gene expression measured in immortalized B cells may be very different from the expression of human B cells in the blood.
• Co-regulated genes and the pathways that connect genes are identified.
• We would be even more interested in utilizing the data to improve our understanding of human disease.
Genotype Gene expression Phenotype
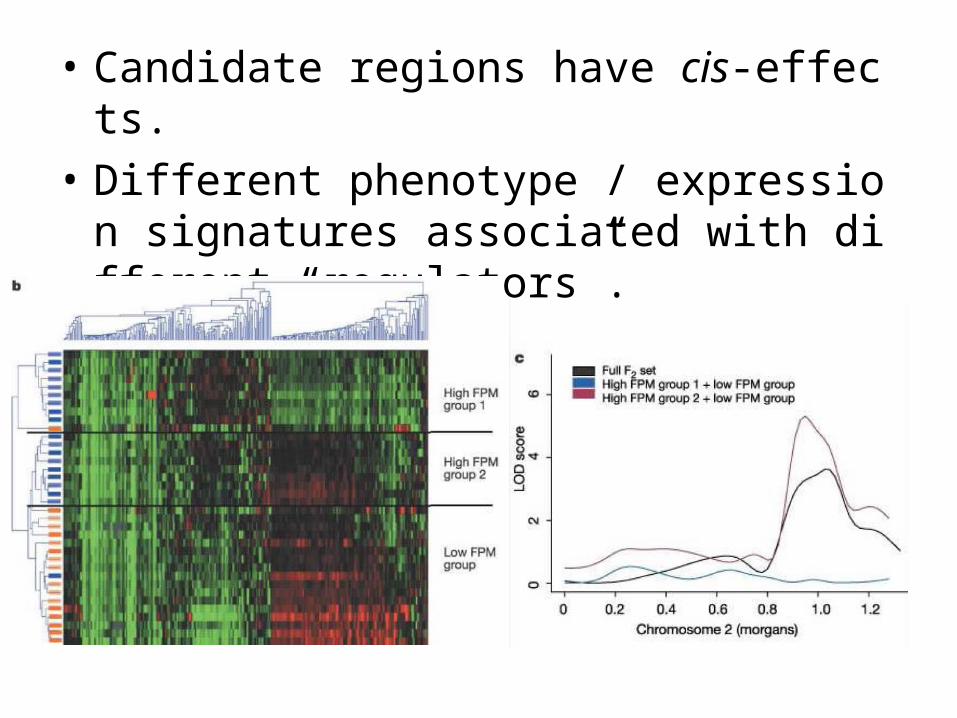
• Candidate regions have cis-effects.
• Different phenotype / expression signatures associated with different “regulators”.
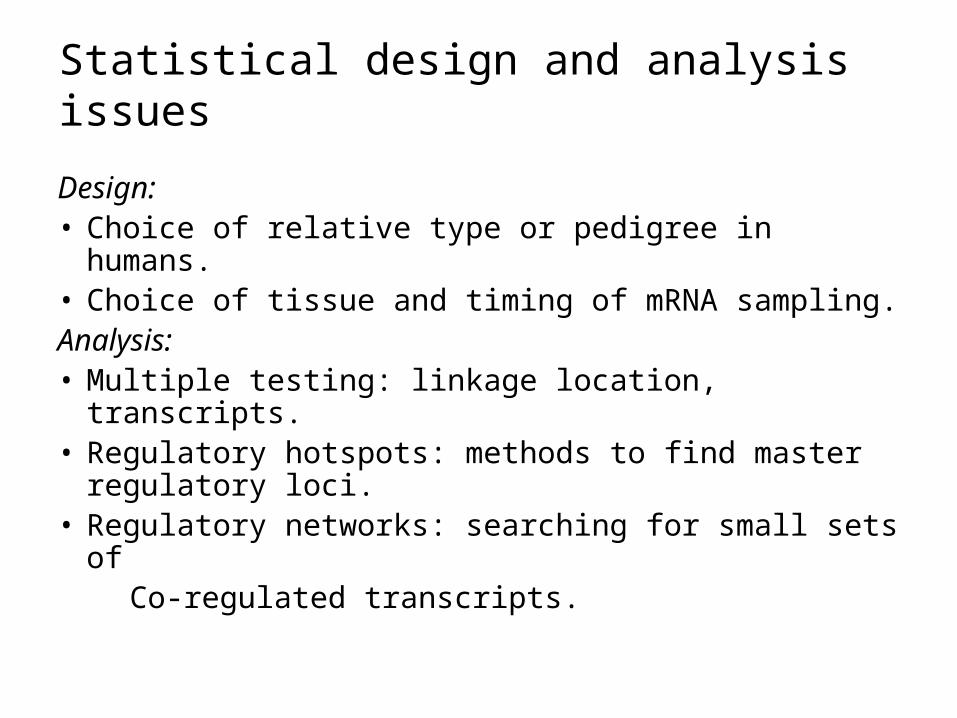
Statistical design and analysis issues
Design:• Choice of relative type or pedigree in humans.• Choice of tissue and timing of mRNA sampling.Analysis:• Multiple testing: linkage location, transcripts.• Regulatory hotspots: methods to find master
regulatory loci.• Regulatory networks: searching for small sets of Co-regulated transcripts.
Reference
1. Genetic analysis of genome-wide variation in human gene expression. Moley M., Molony C.M, Teresa M. Weber T.M. et al. Nature 430:743-747 (2004).
2. Genetics of gene expression surveyed in maize, mouse, and man. Schadt E.E., Monks S.A., Drake T.A. et al. Nature 422: 297-302 (2003).
3. Mapping expression in randomized rodent genomes. Broman K.W. Nature Genetics 37: 209-210 (2005).
4. Natural variation in human gene expression assessed in lymphoblastoid cells. Cheung V.G., Conlin L.K., Weber T.M. et al. Nature Genetics 33: 422-425 (2003).
5. Mapping determinants of human gene expression by regional and genome-wide association. Cheung V.G., Spielman R.S., Ewens K.G. et al. Nature 437: 1365-1369 (2005).
Question?