Embed Size (px)
Citation preview
&CHAPTER 10
Advanced Parametric LinkageAnalysis
SILKE SCHMIDT
The concept of linkage, introduced in Chapter 1, describes the tendency of two or
more loci on a chromosome to cosegregate within families. Linkage analysis
examines the joint inheritance of presumed underlying disease (trait) genotypes
and genotypes of markers whose position on a chromosome is known. If there is evi-
dence that the disease and the marker do not segregate independently, the unknown
disease locus must be within measurable distance of the known marker locus; that is,
the two loci are “linked” to each other. The parametric logarithm of the odds (LOD)
score is a likelihood-based statistical measure which quantifies the degree of linkage
in a pedigree. Note that the disease genotypes can only be inferred from the observed
phenotypes of family members. This inference requires the assumption of certain
parameters in a genetic model; hence the LOD score method described in this
chapter is called “parametric” or “model-based” linkage analysis.
There are four major advantages of model-based linkage analysis over other
methods described in this book:
(i) Statistically, it is a more powerful approach than any nonparametric method
if the genetic model assumed is approximately correct.
(ii) It utilizes every family member’s phenotypic and genotypic information.
(iii) It provides an estimate of the recombination fraction between marker and
disease locus.
(iv) It provides a statistical test for linkage and for genetic (locus) heterogeneity.
The genetic model used in parametric linkage analysis includes the following
components:
(i) the mode of inheritance (MOI) of the trait (e.g., autosomal dominant,
autosomal recessive, X-linked dominant, etc.);
255
Genetic Analysis of Complex Diseases, Second Edition, Edited by Jonathan L. Haines andMargaret Pericak-VanceCopyright # 2006 John Wiley & Sons, Inc.

(ii) the trait and marker allele frequencies;
(iii) the penetrance values for each possible disease genotype, that is, the prob-
abilities of expressing the disease phenotype given the genotype;
(iv) the mutation rate of marker loci; and
(v) sex specificity of recombination fractions.
In practice, model specification typically focuses on components (i)–(iii), while the
mutation rate is assumed to be zero and sex-averaged recombination fractions are
used. When the genetic model is unknown, as in most genetically complex traits,
the LOD score may still be calculated. However, the researcher needs to realize
that the LOD score depends not only on the recombination fraction between the
two loci of interest but also on all the assumed parameters of the genetic model.
Thus, a test of linkage using a parametric approach is a test of all the assumptions
of which linkage is only one, and failure to find linkage could be due to a misspeci-
fication in any of these parameters; it does not prove lack of linkage. Despite these
potential difficulties, LOD score analysis has been successfully applied to several
complex traits. It has been used to find single-gene effects in subsets of families,
such as in breast cancer (Hall et al., 1990; Easton et al., 1993) and Alzheimer’s
disease (AD; Pericak-Vance et al., 1991). It has also been applied, in conjunction
with nonparametric approaches, to detect more complex linkage signals, such as
in type II diabetes (Hanis et al., 1996) and inflammatory bowel disease (Hugot
et al., 1996). The purpose of this chapter is to give an overview of the principles
of LOD score analysis, to consider the consequences of assuming wrong model
parameters, and to provide practical recommendations for LOD score analysis
of complex phenotypes, for which it is almost impossible to correctly specify the
genetic model.
TWO-POINT ANALYSIS
Chapter 1 explained that the joint inheritance of two loci can be parameterized by
the recombination fraction u, which is a measure of the distance between the two
loci expressed as the number of expected crossovers during parental meioses. The
parameter u can take on any value between 0 and 12. The value 1
2corresponds to
“free recombination,” that is, the probability that loci on two completely indepen-
dent chromosomes recombine in the parental meiosis. The LOD score is simply a
ratio of the pedigree likelihood under linkage (u , 12) and under free recombination
(u ¼ 12), where likelihood is defined as the probability of the data as a function of an
unknown parameter (here u). A maximum-likelihood estimator (MLE) of u is
obtained by maximizing the likelihood ratio, that is, by making the actually observed
data the most likely to occur. The corresponding maximum log10-transformed like-
lihood ratio, Zmax(u), is called the maximum LOD score (Barnard, 1949). However,
the “odds” in linkage analysis are backward rather than forward odds, and “logar-
ithm of the likelihood ratio” is a less ambiguous description of the LOD score
256 ADVANCED PARAMETRIC LINKAGE ANALYSIS
(Elston, 1997). Formulas for LOD score computation in small pedigrees where
recombinant and nonrecombinant meioses can be directly counted were given in
Chapter 1 for both phase-known and phase-unknown cases. The overall LOD
score for a dataset can be obtained by summing LOD scores (at the same values
of u) from independent pedigrees and is usually reported at u ¼ 0, 0.01, 0.05, 0.1,
0.2, 0.3, 0.4.
Sequential testing methodology was originally used to derive the critical value of
the LOD score test statistic (Morton, 1955). Morton showed that, due to the low
prior probability that two loci anywhere on the genome are linked, a LOD score
greater than 3.0 is necessary to ensure that the posterior probability of true linkage
after declaring the test significant is at least 95%. Today, tests of linkage are gener-
ally not carried out in a sequential fashion. However, the rather stringent critical
value of 3.0, equivalent to the data being 1000 times more likely under linkage
(at the MLE of u) than under no linkage, has remained the classical threshold for
declaring significant linkage. The actual (exact) p-value associated with Z(u) ¼ 3
was shown to be at most 0.001 (Chotai, 1984). If a large number of informative
meioses are observed, likelihood ratio theory can be employed to show that the
asymptotic p-value based on a x2 [on one degree of freedom (df)] approximation
for 2� loge(10)� Z(u) � 4.6� Z(u) is 0.0001 (X2 ¼ 4.6� 3.0 ¼ 13.8). Analogous
to the critical value for declaring the presence of linkage, the threshold of 22.0
was derived as the critical value for significant evidence against linkage (Morton,
1955). An interval likely to contain the true value of u for a given dataset is
called a support interval in linkage analysis. This interval is conceptually similar
to a traditional confidence interval for an unknown parameter but is defined by
LOD score units. For example, if the MLE of u corresponds to a maximum LOD
score of Zmax(u ) ¼ 3.2, a one-unit support interval would contain all values of u
for which Z(u) is at least 2.2 (Ott, 1999, Chapter 4.4).
The classical threshold of 3.0 for establishing significant linkage was derived for
single-marker tests. In the context of a genome screen employing many (perhaps
300–500) microsatellite markers, some modifications are necessary; however,
there is no general agreement on the most appropriate approach. On the one hand,
the problem of multiple testing has to be considered, which would require an
increased critical value to control the overall false-positive rate. On the other
hand, any correction that ignores the correlations between tests at multiple closely
spaced markers (such as the Bonferroni correction) will be overly conservative,
thus negatively impacting the power of the analysis. A number of slightly different
schemes for declaring “suggestive,” “significant,” and “highly significant” linkage in
the context of a genome screen have been proposed (Thomson, 1994; Lander and
Kruglyak, 1995; Haines, 1998). The empirical LOD score thresholds proposed by
Haines (1998) are based on a multistaged approach to genome screening: A LOD
score of 1 (nominal p ¼ 0.016) from a single dataset at the initial screening stage
is considered “interesting” enough for inclusion in the follow-up stage; a LOD
score of 2 (p ¼ 0.001) is considered “very interesting”; and a LOD score of 3
(p ¼ 0.0001) would amount to declaring “provisional linkage,” awaiting confir-
mation from an independent dataset in order to be considered highly significant.
TWO-POINT ANALYSIS 257
More recently, simulation-based methods, which exploit the power and speed of
modern computers, have been proposed as an alternative to significance measures
based on asymptotic theory. For example, to determine the empirical significance
level associated with an observed maximum LOD score in a genome screen,
marker genotypes unlinked to any putative disease locus can be simulated for the
given pedigree structures and observed disease phenotypes using a program such
as SIMULATE (Terwilliger et al., 1993). The same LOD score analysis that was
performed on the original dataset is carried out in each replicate. The proportion
of replicates with a maximum LOD score equal to or greater than the one observed
in the real dataset then approximates the genomewide empirical significance level
(p-value). It is possible to compute the number of replicates required to obtain a suf-
ficiently accurate estimate of the true (but unknown) significance level for the above
situation (Ott, 1999, Chapter 9.7). Depending on the size of the dataset, the number
of markers, and the complexity of the analysis, this method of estimating p-values
may be quite time consuming even with fast computers. As an alternative to asses-
sing individual-marker LOD score significance, approaches for combining multiple
correlated p-values or test statistics across linked markers to identify a certain region
likely to harbor a disease gene have recently been proposed (Zaykin et al., 2002;
Hoh and Ott, 2000).
It is interesting to note that even an actually observed LOD score of 3.0 or greater
for a single pedigree in a region previously implicated as linked may have to be
interpreted with caution. An analysis of a large multigenerational pedigree segregat-
ing breast cancer was used to illustrate that it is possible to attain LOD scores of this
magnitude on the basis of very few observations when there is a lack, by chance, of
observed recombinations with certain markers. In this situation, the LOD score is
highly sensitive to further data, and the addition of a single recombinant individual
reduced a LOD score of 3.0 at u ¼ 0 to 1.72 at u ¼ 0.06 (Skolnick et al., 1984). This
emphasizes the importance of follow-up analysis, that is, of saturating a region
found to give preliminary evidence for linkage with a higher density of additional
markers.
Computationally, the calculation of the LOD score requires sophisticated
statistical-genetic software for all but the simplest cases. To specify a genetic
model, disease and marker allele frequencies, mode of inheritance, and probabilities
of (observed) phenotypes given (unobserved) disease genotypes (the so-called pene-
trance values) have to be determined. Individuals expressing the disease phenotype
due to factors other than the presumed susceptibility gene are called phenocopies.
The penetrance of phenocopies is sometimes referred to as the phenocopy rate,
but the same term is also used for the proportion of nongenetic cases among all
affected individuals and is therefore best avoided. In some simple cases, disease
genotypes can be inferred unambiguously from the observed phenotypes, as illus-
trated by the following example: Let D denote the disease allele and d the normal
allele. If the disease gene is fully penetrant, phenocopies do not exist, the mode
of inheritance is autosomal dominant, and the D allele is very rare so that the
probability of a DD genotype is negligible, an affected person must have genotype
Dd and an unaffected person must have genotype dd. When all family members
258 ADVANCED PARAMETRIC LINKAGE ANALYSIS
are genotyped and markers are informative, recombinant gametes can then be
directly counted (Chapter 1). With incomplete penetrance and presence of pheno-
copies, only genotype probabilities can be computed, and each possible genotype of
one pedigree member implies a range of possible genotypes for related members
within the constraints of Mendelian inheritance. The general form of the pedigree
likelihood function is
L(u) ¼X
g
Y
i
P(xijgi)Y
j
P(gj)Y
k
P(gkjgkm, gkf )
where g is a vector of genotypes of pedigree members; xi is the phenotype of the ith
individual, with i summing over all pedigree members, j over founders (individuals
without parents in the pedigree), and k over nonfounders; and gkm, gkf denote geno-
types of the kth individual’s mother and father, respectively. The algorithms
implemented in current software for the efficient computation of this function are
described below under Multipoint Analysis.
Example of LOD Score Calculation and Interpretation
We will illustrate LOD score calculation with the example of a linkage study of AD and
markers on chromosome 19q. We will use a dataset that includes pedigrees from the
original paper reporting linkage of AD to this chromosomal region (Pericak-Vance
et al., 1991), which subsequently led to the identification of the apolipoprotein E
(APOE) gene as a susceptibility gene for late-onset AD (Corder et al., 1993). Although
the mode of inheritance for AD is unknown, we assume an autosomal dominant model
allowing for phenocopies and incomplete penetrance in this example. The disease allele
frequency is assumed to be q ¼ 0.001, which corresponds to a carrier frequency of
approximately 0.2% [i.e., 2q(1 2 q)þ q 2 ¼ (2� 0.001� 0.999)þ 0.0012 ¼ 0.002
under Hardy–Weinberg equilibrium]. The population allele frequencies for the
marker, D19S246, were calculated from a representative set of unrelated Caucasian
individuals (164 chromosomes). The penetrance for gene carriers ( fDD, fDd) is assumed
to be 0.80, and the penetrance for noncarriers (phenocopy frequency, fdd) is assumed
to be 0.01. With these parameter choices, the proportion of nongenetic cases
among all affected individuals is approximately 86% [i.e., (0.01� 0.9992)/(0.01� 0.9992
þ 0.80� 0.002) ¼ 0.862]. For a single-gene disorder, the population
prevalence should approximately match the prevalence w derived from the assumed
disease allele frequency and penetrance values [e.g., w ¼ q2� fDDþ 2q(1 2 q) �
fDd þ (1 2 q)2� fdd]. However, for a complex and common disease such as AD,
with a prevalence of approximately 10% in adults over 75 years of age, it is not realistic
to try to achieve this relationship. More appropriate ways to analyze such complex
phenotypes with the genetic model-based LOD score approach are discussed later in
this chapter.
Table 10.1 presents the two-point linkage analysis for AD and marker D19S246
under the above dominant model. The highest LOD score is 1.57 at u ¼ 0.15. Using
the classical criterion for linkage [Zmax(u ) � 3.0], one could easily conclude that
TWO-POINT ANALYSIS 259

there is no significant evidence for linkage. We will use this example to examine
more closely the assumptions made in the analysis and their respective impact on
the observed result.
EFFECTS OF MISSPECIFIED MODEL PARAMETERSIN LOD SCORE ANALYSIS
The LOD score of 1.57 at u ¼ 0.15 was obtained using one particular genetic
model. For a genetically complex disorder that is likely influenced by multiple
susceptibility genes (i.e., is genetically heterogenous) as well as environmental
factors and possible gene–gene and gene–environment interaction, this single
assumed genetic model is certainly incorrect in at least some aspects. If the
assumed genetic model is wrong, both false-positive and false-negative evidence
TABLE 10.1. Two-Point Linkage Analysis for AD and D19S246
Pedigree u ¼ 0.00 u ¼ 0.05 u ¼ 0.10 u ¼ 0.15 u ¼ 0.20 u ¼ 0.30 u ¼ 0.40
401 0.016 0.013 0.010 0.008 0.006 0.002 0.001
701 20.972 20.445 20.242 20.129 20.062 20.004 0.003
736 1.010 0.893 0.773 0.651 0.527 0.282 0.081
757 0.297 0.301 0.286 0.258 0.218 0.123 0.035
763 0.225 0.191 0.158 0.126 0.096 0.045 0.012
794 20.473 20.224 20.092 20.016 0.026 0.045 0.021
820 0.058 0.108 0.133 0.141 0.135 0.094 0.035
911 0.039 0.030 0.023 0.017 0.012 0.005 0.001
1086 0.163 0.133 0.105 0.081 0.059 0.027 0.007
1207 20.568 20.196 20.063 20.003 0.023 0.025 0.008
1229 20.367 20.217 20.120 20.058 20.022 0.002 0.000
1396 0.230 0.194 0.160 0.128 0.097 0.046 0.012
1399 0.822 0.719 0.611 0.500 0.387 0.179 0.040
1491 0.046 0.056 0.069 0.081 0.086 0.080 0.053
1547 0.081 0.063 0.048 0.035 0.025 0.010 0.002
1592 0.029 0.022 0.017 0.012 0.008 0.003 0.001
1677 20.325 20.253 20.192 20.141 20.100 20.041 20.010
1682 0.321 0.317 0.297 0.266 0.224 0.127 0.038
1685 0.071 0.066 0.057 0.046 0.034 0.014 0.003
1725 20.201 20.168 20.135 20.105 20.078 20.035 20.009
1738 20.297 20.230 20.171 20.122 20.082 20.030 20.006
1743 20.272 20.223 20.180 20.140 20.105 20.048 20.012
1843 21.675 20.960 20.655 20.457 20.315 20.129 20.031
1971 0.014 0.011 0.008 0.006 0.004 0.002 0.001
1999 20.520 20.351 20.237 20.155 20.098 20.031 20.005
2043 0.219 0.190 0.160 0.131 0.103 0.051 0.014
2100 0.693 0.602 0.511 0.420 0.331 0.168 0.046
2120 20.011 20.009 20.007 20.006 20.004 20.002 20.001
Total 21.347 0.633 1.335 1.572 1.536 1.011 0.339
260 ADVANCED PARAMETRIC LINKAGE ANALYSIS

for linkage can be obtained, since the LOD score is a function of both the recom-
bination fraction and the genetic model. There are many factors that contribute to
the impact of misspecified genetic parameters on the LOD score, such as the true
underlying disease model, the nature of the misspecified parameters, the extent of
misspecification, and the pedigree structures. Results from theoretical calculations
and simulation studies generally agree that the power to detect linkage is highly
sensitive to mode of inheritance (particularly dominant vs. recessive), somewhat
sensitive to marker allele frequencies, slightly sensitive to penetrance, and not
very sensitive to disease allele frequency. However, the estimation of the recombi-
nation fraction may be strongly affected by an error in any genetic parameter
(Clerget-Darpoux et al., 1986).
To illustrate the impact of misspecified model parameters on the power to detect
linkage or the type I error (false-positive rate), computer simulations using the 28
AD families were performed. Keeping the actual pedigree structure and observed
disease phenotypes constant, the program SLINK (Weeks et al., 1990b) was used
to simulate disease and marker genotypes in 1000 replicates assuming either
complete linkage (u ¼ 0.0) or no linkage (u ¼ 0.5) between the disease and
marker locus. The disease locus was simulated under the model assumed above
for the analysis of the real data: autosomal dominant inheritance with a disease
allele frequency q ¼ 0.001, penetrances for gene carriers ( fDD, fDd) of 0.80 and
for phenocopies ( fdd) of 0.01. The marker was simulated using the actually observed
allele frequencies of marker D19S246 (12 alleles with frequencies 0.25, 0.02, 0.04,
0.02, 0.03, 0.18, 0.11, 0.06, 0.14, 0.11, 0.02, 0.02). Each replicate was analyzed
using the simulated model as well as 11 other models illustrating possible model
misspecification: three models with different disease allele frequencies, three
models with different penetrance ratios, three models with different modes of inheri-
tance, and two models with different marker allele frequencies. When one parameter
was evaluated, the other parameters were generally fixed at their “true” values used
in the simulating model; however, when the mode of inheritance was varied, we
included an analysis model where the disease allele frequency was adjusted to pro-
duce the same disease allele carrier frequency. The effect of misspecified model par-
ameters on the LOD score analysis was measured by the mean maximum LOD score
(Zmax) and mean estimated MLE (u) obtained from the 1000 replicates. The results at
u ¼ 0.0 reflect the impact on the power to detect linkage, and those at u ¼ 0.5 reflect
the impact on the type I error.
Impact of Misspecified Disease Allele Frequency
With a true disease allele frequency of 0.001, the data were analyzed using modified
frequencies of 0.01, 0.1, and 0.0001, corresponding to disease allele carrier frequen-
cies of 2%, 20%, and 0.02%, respectively (Table 10.2). This represents a wide vari-
ation of disease allele frequencies. In the absence of linkage, there is little variation
in the mean maximum LOD score (from 0.11 to 0.12). In the presence of complete
linkage, the mean Zmax decreases slightly when the disease allele frequency is either
underestimated or overestimated. In an autosomal dominant model, an increased
EFFECTS OF MISSPECIFIED MODEL PARAMETERS IN LOD SCORE ANALYSIS 261

disease allele frequency can either increase the probability of affected parents being
homozygous rather than heterozygous or increase the probability that the disease
allele is introduced into the pedigree through married-in individuals rather than a
single founder. However, within a reasonable range of plausible values (0.0001–
0.10), the impact of misspecifying the disease allele frequency on the LOD score
and on the estimated recombination fraction is generally small.
Impact of Misspecified Mode of Inheritance
In general, a misspecified mode of inheritance has a large impact on the LOD score
(Clerget-Darpoux et al., 1986). This effect is particularly serious when a dominant
disease locus is misspecified as recessive (Table 10.3). In our AD example, when we
vary the mode of inheritance, the mean maximum LOD score decreases from 11.78
to 1.64, the power to obtain Zmax � 3 decreases from 100 to 7.5%, and the MLE (u)
increases from 0.0 to 0.10 when the disease allele frequency remains at q ¼ 0.001.
When the disease allele frequency is adjusted (q ¼ 0.10) to obtain approximately
the same gene carrier frequency, the decreases in mean Zmax and power are less
TABLE 10.2. Impact of Misspecifying Disease Allele Frequency on LOD
Score Analysis
Generating Model: q ¼ 0.001, fDD ¼ fDd ¼ 0.80,
fdd ¼ 0.01
Analysis Model u ¼ 0.00 u ¼ 0.50
q fDD fDd fdd
Mean
Zmax
Mean
MLE (u)
Proportion
with
Zmax . 3.0 (%)
Mean
Zmax
Mean
MLE (u)
0.001 0.80 0.80 0.01 11.78 0.0 100 0.11 0.40
0.01 0.80 0.80 0.01 11.44 0.0 100 0.12 0.40
0.10 0.80 0.80 0.01 9.95 0.0 99.8 0.11 0.40
0.0001 0.80 0.80 0.01 11.55 0.0 100 0.11 0.40
TABLE 10.3. Impact of Misspecifying Mode of Inheritance on LOD
Score Analysis
Generating Model: q ¼ 0.001, fDD ¼ fDd ¼ 0.80, fdd ¼ 0.01
Analysis Model u ¼ 0.00 u ¼ 0.50
q fDD fDd fdd
Mean
Zmax
Mean
MLE (u)
Proportion with
Zmax . 3.0 (%)
Mean
Zmax
Mean
MLE (u)
0.001 0.80 0.80 0.01 11.78 0.0 100 0.11 0.40
0.001 0.80 0.01 0.01 1.64 0.1 7.5 0.11 0.40
0.10 0.80 0.01 0.01 3.94 0.1 75.2 0.11 0.40
0.001 0.80 0.40 0.01 9.75 0.0 99.9 0.12 0.40
262 ADVANCED PARAMETRIC LINKAGE ANALYSIS

pronounced (from 11.78 to 3.94 and from 100 to 75.2%, respectively) but still quite
drastic. An intuitive explanation for this observation is that half the time the random
transmission of alleles at the disease locus from an unaffected parent to affected off-
spring is scored as a recombination between the disease and marker locus, because
under a dominant model an unaffected parent does not carry the susceptibility allele,
but under a recessive model an unaffected parent may carry that allele. In addition,
under the recessive model an affected parent will be considered homozygous at the
disease locus and is thus uninformative for linkage. The impact of assuming an addi-
tive model when the true model is dominant is much less dramatic (Zmax decreases
from 11.78 to 9.75), demonstrating that the additive model can be viewed as a good
“compromise” between dominant and recessive models when the true mode of
inheritance is unknown. Table 10.3 shows that in the absence of linkage a mis-
specified mode of inheritance has little impact on the LOD score.
Impact of Misspecified Disease Penetrances
As long as incomplete penetrance is allowed in the genetic model, misspecifying the
exact values for the penetrance has a relatively small impact on the LOD score
whether there is linkage or no linkage (Table 10.4). As the ratio of penetrances
between disease allele carriers and non–disease allele carriers decreases (from 80
to 40 to 8 in Table 10.4), the mean Zmax also decreases (from 11.78 to 9.76 to
4.91, with a power decrease from 100 to 99.9 to 94.5%), since a low ratio decreases
the certainty of whether an affected individual is a disease allele carrier or an
unaffected individual a noncarrier. In the presence of linkage, most individuals
are nonrecombinants, which is why the low ratio results in a decrease in power.
When the penetrance of noncarriers is reduced to 0, Zmax decreases from 11.78 to
9.64. Thus, failure to allow for the presence of phenocopies is not detrimental as
long as there is incomplete penetrance, which permits multiple possible disease
genotypes to underlie the observed phenotype. When a Mendelian disorder is
analyzed, a nonzero phenocopy rate is sometimes interpreted as a “misdiagnosis par-
ameter,” to account for the fact that some family members are diagnosed as affected
with less certainty than others and thus may or may not be carriers of the gene that
TABLE 10.4. Impact of Misspecifying Disease Penetrance on LOD Score Analysis
Generating Model: q ¼ 0.001, fDD ¼ fDd ¼ 0.80, fdd ¼ 0.01
Analysis Model u ¼ 0.00 u ¼ 0.50
q fDD fDd fdd
Mean
Zmax
Mean
MLE (u)
Proportion with
Zmax . 3.0 (%)
Mean
Zmax
Mean
MLE (u)
0.001 0.80 0.80 0.01 11.78 0.0 100 0.11 0.40
0.001 0.80 0.80 0.10 4.91 0.0 94.5 0.10 0.40
0.001 0.80 0.80 0.00 9.64 0.1 99.8 0.12 0.40
0.001 0.40 0.40 0.01 9.76 0.0 99.9 0.12 0.40
EFFECTS OF MISSPECIFIED MODEL PARAMETERS IN LOD SCORE ANALYSIS 263
causes the familial aggregation. In general, in the presence of model uncertainty,
choosing a lower penetrance ratio by specifying both a nonzero penetrance of phe-
nocopies and incomplete penetrance for susceptible genotypes (a “weaker model”)
is sometimes recommended to make LOD score analysis less sensitive to misspeci-
fied model parameters (Risch and Giuffra, 1992).
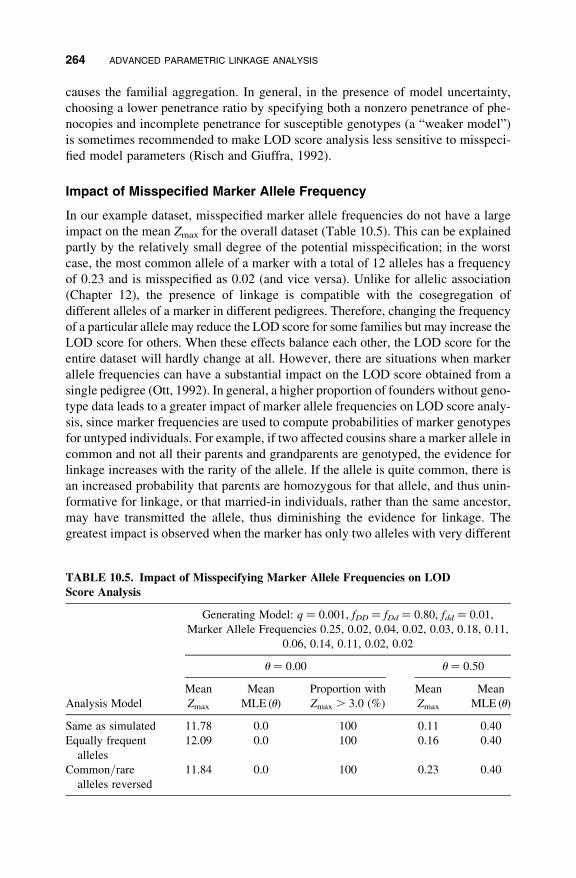
Impact of Misspecified Marker Allele Frequency
In our example dataset, misspecified marker allele frequencies do not have a large
impact on the mean Zmax for the overall dataset (Table 10.5). This can be explained
partly by the relatively small degree of the potential misspecification; in the worst
case, the most common allele of a marker with a total of 12 alleles has a frequency
of 0.23 and is misspecified as 0.02 (and vice versa). Unlike for allelic association
(Chapter 12), the presence of linkage is compatible with the cosegregation of
different alleles of a marker in different pedigrees. Therefore, changing the frequency
of a particular allele may reduce the LOD score for some families but may increase the
LOD score for others. When these effects balance each other, the LOD score for the
entire dataset will hardly change at all. However, there are situations when marker
allele frequencies can have a substantial impact on the LOD score obtained from a
single pedigree (Ott, 1992). In general, a higher proportion of founders without geno-
type data leads to a greater impact of marker allele frequencies on LOD score analy-
sis, since marker frequencies are used to compute probabilities of marker genotypes
for untyped individuals. For example, if two affected cousins share a marker allele in
common and not all their parents and grandparents are genotyped, the evidence for
linkage increases with the rarity of the allele. If the allele is quite common, there is
an increased probability that parents are homozygous for that allele, and thus unin-
formative for linkage, or that married-in individuals, rather than the same ancestor,
may have transmitted the allele, thus diminishing the evidence for linkage. The
greatest impact is observed when the marker has only two alleles with very different
TABLE 10.5. Impact of Misspecifying Marker Allele Frequencies on LOD
Score Analysis
Generating Model: q ¼ 0.001, fDD ¼ fDd ¼ 0.80, fdd ¼ 0.01,
Marker Allele Frequencies 0.25, 0.02, 0.04, 0.02, 0.03, 0.18, 0.11,
0.06, 0.14, 0.11, 0.02, 0.02
u ¼ 0.00 u ¼ 0.50
Analysis Model
Mean
Zmax
Mean
MLE (u)
Proportion with
Zmax . 3.0 (%)
Mean
Zmax
Mean
MLE (u)
Same as simulated 11.78 0.0 100 0.11 0.40
Equally frequent
alleles
12.09 0.0 100 0.16 0.40
Common/rare
alleles reversed
11.84 0.0 100 0.23 0.40
264 ADVANCED PARAMETRIC LINKAGE ANALYSIS
frequencies. In the presence of linkage between disease and marker, misspecifica-
tion of the rare allele as common would reduce linkage evidence, that is, produce
false-negative evidence against linkage. In the absence of linkage, misspecification
of the common allele as rare would lead to false-positive evidence for linkage. This
probably explains why, in the example dataset (Table 10.5), the mean Zmax score
under the null hypothesis of no linkage increased from 0.11 (marker alleles as
simulated) to 0.16 (equally frequent marker alleles) to 0.23 (most common alleles
misspecified as most rare and vice versa).
CONTROL OF SCORING ERRORS
Apart from misspecified model parameters, there are three types of scoring errors
that can affect the value of the LOD score: phenotype errors, genotype errors, and
misspecified relationships within a pedigree. Phenotype errors occur when an
affected individual is misclassified as unaffected or vice versa. Not much can be
done from an analysis perspective to minimize the probability of phenotype
errors, although their effect on the LOD score can be large. For example, when
full penetrance is assumed and an unaffected individual mistakenly classified as
affected shows an obligate recombination between a marker and a putative disease
locus, the LOD score for a single pedigree might drop from, for instance, 1.5 to 21
at u ¼ 0. Therefore, an accurate clinical diagnosis is of utmost importance for any
linkage analysis. The program VARYPHEN allows the user to carry out a sensitivity
analysis with respect to disease phenotypes. By setting the disease phenotype of
each family member in turn to “unknown” and repeating the linkage analysis, a
table of resulting changes in LOD scores and estimated u values is obtained. It is
then easy to see which individuals produce the largest changes and are thus the
most crucial in terms of diagnostic accuracy (Vieland et al., 1992). Genotype
errors, just like missing data, are unavoidable in any real dataset since a machine’s
or a technician’s interpretation of experimental results is an imperfect way of
measuring the true marker genotype. For most laboratories, an empirical value of
about 1% genotype error is probably a realistic estimate. The introduction of quality
control procedures in the genotyping laboratory (Rimmler et al., 1999) is extremely
useful for keeping the actual error rate as low as possible. Just like phenotype errors,
genotype errors may have an appreciable impact on the LOD score by introducing
false recombinants, thus decreasing the evidence for linkage. Several methods can
be used to identify genotypes likely to be erroneous after they have been submitted
for analysis. The first and most straightforward check is the identification of
Mendelian inconsistencies (e.g., the occurrence of an allele in the offspring that is
not found in the parents, the occurrence of more than four alleles in a sibship).
Software such as PEDCHECK (O’Connell and Weeks, 1998) can be used to identify
these inconsistencies, followed by rereading in the laboratory. Another, less
commonly employed possibility is to estimate identity-by-state sharing among
affected relative pairs using the affected pedigree member (APM) method (see
Chapter 11) and to reread any genotypes that display much less sharing than expected
CONTROL OF SCORING ERRORS 265
(Weeks et al., 2000). For densely spaced marker genotypes obtained during the fine-
mapping stage of a project, rather than the genome screen stage, some additional
error-checking approaches can be applied. The program SIMWALK2 (Sobel and
Lange, 1996) is often used to estimate the haplotype configurations of multiple
linked markers in a pedigree. As an extension of this haplotyping capability, a new
“mistyping” option has recently been added to the package and can be used to
detect excess recombination in small genomic regions, which typically indicates
likely genotype errors. The program SIBMED (Douglas et al., 2000) is particularly
suitable for error detection in affected sibpair data without parental genotypes,
where haplotyping is more difficult to carry out. It compares the multipoint prob-
ability of the sibpair data with the marker in question included versus excluded and
pinpoints marker–sibpair combinations with probability ratios that exceed a
simulation-based marker-specific threshold.
Seemingly erroneous genotypes in a pedigree may also be due to misspecified
relationships between pairs of individuals. A loss of power to detect linkage may
be caused by the inclusion of pairs who are less closely related than assumed. For
example, two putative full siblings may be unrelated in the case of unknown adop-
tion or sample switches or they may be half siblings in the case of false paternity.
False-positive evidence for linkage may be created by sample duplication or incor-
rect assignment of monozygotic (MZ) twins as full siblings. These types of problems
may not be detectable with Mendelian inconsistency checks, particularly if a sample
includes only sibpair data without parental genotypes. Once a large number of mar-
kers (�50) have been genotyped, software such as RELPAIR (Epstein et al., 2000;
Boehnke and Cox, 1997), RELATIVE (Goring and Ott, 1997), or PREST (McPeek
and Sun, 2000) can be used to compute the multipoint likelihood of the marker data
conditional on certain possible relationships (e.g., MZ twins, full siblings, half sib-
lings, unrelated pair for putative full sibpairs). By comparing the probability of the
marker data under the specified versus a different assumed genetic relationship
between various relative pairs, the most likely relationship of the pair can be
inferred. RELPAIR is able to consider all possible pairs of individuals in the
sample, not just those within families, and even allows for the presence of geno-
typing error. PREST can analyze inbred as well as outbred pedigrees.
GENETIC HETEROGENEITY
Every LOD score analysis should include an examination of the scores for each
pedigree. In our AD example, LOD scores ranged from –1.67 to 1.01 (at
u ¼ 0.0), raising the possibility that only some of the pedigrees may be linked to
the chromosome 19q13 locus. A complex disorder like AD is very likely to be
genetically heterogeneous. In general, genetic locus heterogeneity is said to exist
when two or more genes act independently to cause the same clinical disease
phenotype or to increase disease susceptibility (see Chapter 1). A study’s power
to detect linkage can be greatly improved either by increasing sample homogeneity
to start with (e.g., by examining only a clinical subtype of the disorder or only
266 ADVANCED PARAMETRIC LINKAGE ANALYSIS

patients with a particularly early age of onset) or by teasing out more homogeneous
subgroups that may exhibit a stronger linkage signal which is obscured by the hetero-
geneity in the overall dataset. This type of heterogeneity is likely a major reason for
the many failures to replicate linkage findings in complex disease. However, there are
many ways in which heterogeneity can be allowed for in the statistical analysis of
pedigree data, some of which are described below.
The null hypothesis of homogeneity can be formally tested using two different
approaches: the M-test (Morton, 1956; Ott, 1999) or its extension known as the
b-test (Risch, 1988) and the admixture test (Smith, 1963). When families can be pre-
assigned to several different groups based on certain disease characteristics, such as
age at onset, severity of disease, clinical features, or transmission pattern, the M-test
can be used to test for different recombination fractions in these k different groups of
families, where u1=u2= � � � uk. The first hypothesis (H1) of linkage and homo-
geneity specifies u1¼u2¼� � � uk , 0:5. Under the second hypothesis of heterogen-
eity (H2), u1=u2= � � � uk, the recombination fractions are potentially different in
the different groups of families and are estimated separately. Note that H1 is
obtained from H2 by restricting k 2 1 parameters (u2, . . . ,uk) to be the same as u1.
To test H1 against H2, one computes
X2 ¼ 2� ln(10)Xk
i¼1
Zi(ui)� Z(u )
!
where Zi(ui) is the maximum LOD score in each of the family groups and Z(u ) is the
maximum LOD score over all the pedigrees. Asymptotically, under the assumption
of homogeneity (H1), this statistic follows a x 2-distribution with k 2 1 df.
The M-test requires the estimation of a separate ui parameter in each of the k
groups of families. Alternatively, a Bayesian approach can be taken, in which the
u-values are assumed to follow a b-distribution with two parameters, which are esti-
mated from the posterior distribution of u given the observed data. This likelihood-
based test is known as the b-test and has been shown to be more powerful than the
M-test in many situations (Risch, 1988).
The admixture test (Smith, 1963) is used when families cannot be preassigned to
different groups based on clinical criteria. In the most commonly employed version
of this test, two types of families are assumed, with a denoting the proportion of type
I families and 12a the proportion of type II families. The recombination fraction
in type I families is equal to u1 and that in type II families is u2 ¼ 0.5. The null hypo-
thesis of no linkage and homogeneity is H0: a ¼ 0, u1 ¼ u2 ¼ 0.5. The hypothesis of
linkage and heterogeneity is H2: a , 1, u1 , 0.5, and the hypothesis of linkage and
homogeneity is obtained from H2 by a single restriction, H1: a ¼ 1, u1 , 0.5. Under
H2, the likelihood is maximized over a and u1. Under H1, the restricted hypothesis,
ur is obtained assuming homogeneity (a ¼ 1). The test of the hypothesis of homo-
geneity (H1 vs. H2) is carried out by calculating X 2 ¼ 2 [ln L (a, u1) 2 ln L (a ¼ 1,
ur)], which asymptotically has a x2-distribution with 1 df with probability 12
and is
equal to zero with probability 12. Thus, the p-value from a two-sided test has to be
GENETIC HETEROGENEITY 267
halved. Both the M-test and the admixture test can be carried out with the HOMOG
program package (Ott, 1986). A computer program to carry out the b-test is avail-
able from Dr. Neil Risch. In practice, the admixture test is used more frequently than
the M-test and b-test.
A problem with the admixture test concerns significance when the total LOD
score (under homogeneity) is less than 3.0, yet a test of homogeneity yields a
p-value below the conventional level of 0.05 or 0.01. Declaring the heterogeneity
significant would imply the presence of linkage in a subset of the families, even
though the usual criterion for significant linkage (Z � 3) is not met. The more con-
servative school of thought argues that an overall Z � 3 (p � 0.0001) is necessary to
reject the null hypothesis of no linkage and that the additional hypothesis of hetero-
geneity should only be tested if that hypothesis is rejected. A less stringent approach
tests linkage and homogeneity simultaneously. In this situation, an overall log-
likelihood ratio difference of 3.0 or more between homogeneity with no linkage
and heterogeneity with linkage is considered sufficient to declare significant hetero-
geneity and linkage in a subset of the families. For heterogeneity LOD (HLOD)
score, the numerator is maximized over both a and u and the denominator is the like-
lihood under H0: a ¼ 0, u ¼ 0.5. An asymptotic null distribution of the test statistic
X2 ¼ 4.6�HLOD, which tests for linkage while allowing for heterogeneity, has
been derived (Faraway, 1993). For our sample AD data, the admixture test does
not indicate the presence of locus heterogeneity. The HLOD is the same as the
previously obtained Zmax ¼ 1.57 at u ¼ 0.15 (a ¼ 1.0).
The power of these statistical tests of homogeneity is influenced by a number of
factors, including the distance between the linked marker and the disease locus and
the amount of linkage information provided by the individual families. A larger
recombination fraction between marker and disease gene reduces the power to
detect heterogeneity. Larger, more informative families will yield more power
than a series of smaller families in discriminating linked and unlinked groups.
The main advantage of the admixture test is that it does not require any prior know-
ledge about possible sources of heterogeneity. If there is a valid prior reason to
divide the dataset into more homogeneous subgroups, however, the admixture test
is less powerful than the M-test.
Various extensions of the simple admixture model described above have also
been implemented in the HOMOG package. For example, HOMOG2 assumes
that a disease is caused by either of two loci which are within a measurable distance
of each other on the same chromosome and thus are linked to the same marker. Two
recombination fractions are then estimated, together with the proportion of families
linked to the first locus a, assuming a proportion 12a to be linked to the second
locus. HOMOG3R can be used for a model assuming linkage to one disease locus
in some families, linkage to another locus, unlinked to the first (e.g., on a different
chromosome), in other families, and a third subset of families unlinked to either of
the two disease loci. It has been shown (Schork et al., 1993) that this approach is a
good approximation for two-locus linkage analysis, where simultaneous gene map-
ping of two disease loci is attempted. HOMOGM is the extension of this type of
model to an arbitrary number m of disease loci.
268 ADVANCED PARAMETRIC LINKAGE ANALYSIS
In summary, heterogeneity can be a major confounding factor in the
gene-mapping process. Once heterogeneity has been confirmed, one must ask
what criteria should be used to classify a family as “linked” for molecular follow-
up purposes. The parameter estimates from the HOMOG admixture test can be
used to calculate the estimated conditional (given marker observations) probability
that a family is of the linked type. Even though this is just a statistical estimate
derived from a particular set of data, such a probability may be useful to focus
laboratory time and effort on the families most likely to harbor a disease gene.
MULTIPOINT ANALYSIS
While data from a genome screen should always initially be analyzed by computing
two-point LOD scores, this approach can only extract a limited amount of infor-
mation from the data. Limitations are imposed both by missing genotypes due to
individuals unavailable for blood sampling or unwilling to participate in the study
and by individuals uninformative for linkage, that is, those who are homozygous
at the marker locus and thus transmit the same allele to their offspring regardless
of their underlying genotype at the disease locus. The probability of heterozygous
individuals is given by a marker’s heterozygosity value, defined as
H ¼ 1�X
i
p2i
where pi is the population frequency of the ith allele, for which estimates are used in
practice. Individuals uninformative at one marker locus may contribute linkage
information, and missing genotypes may sometimes be inferred if genotypes at
flanking markers are taken into account in the analysis, which is the purpose of
multipoint analysis.
Multipoint LOD score analysis is an extension of two-point analysis in which
linkage of a disease locus is tested not to just a single marker but to an entire
map of markers. The map-specific multipoint LOD score using the log10 transfor-
mation is most commonly used and is defined as
Z(x,f0) ¼ log10
L(x,f0)
L(x ¼ 1,f0)
� �
where L(x,f0) is the likelihood, under an assumed genetic model f0, that a disease
locus is located at a distance x on a fixed map consisting of several markers and
L(x ¼ 1,f0) is the likelihood that the disease locus is not on the map (correspond-
ing to u ¼ 0.5 in two-point analysis, i.e., no linkage). Usually Z(x) is evaluated at
several positions on the map from one end to the other. There are two major advan-
tages to multipoint LOD score analysis. First, as mentioned above, it provides an
opportunity to recover linkage information at an originally uninformative locus
via haplotype inference. Thus, the linkage results are less sensitive to uninformative
MULTIPOINT ANALYSIS 269
or missing genotypes at any single marker. In essence, multipoint analysis can extract
more of the total inheritance information from a pedigree. In one simulation study,
when a rare dominant disease gene was simulated in the middle of an 18-cM map
using a pedigree with two affected fourth cousins, a LOD score of 2.2 (91% of its
theoretical maximum) was obtained when 20 markers were analyzed simultaneously.
In contrast, the highest two-point LOD score was only 0.83 (34% of its theoretical
maximum), and even simultaneous six-marker analysis yielded, at most, a LOD
score of 1.74 (72% of the theoretical maximum) (Kruglyak et al., 1996).
Second, the multipoint LOD score approach can be very useful to pinpoint a dis-
ease gene location in the fine mapping of a Mendelian disorder. Any true recombi-
nant at some location x will contribute a strongly negative LOD score and will
decrease the possibility that this position contains a candidate locus. This signifi-
cantly narrows the region in which the disease locus can exist, thus helping to
better define the minimum candidate region. For a single pedigree, the information
conveyed by a multipoint LOD score curve mirrors the cosegregation of multi-
marker haplotypes with the disease phenotypes of pedigree members. Therefore,
the process of haplotyping, that is, the ordering of genotypes by parental origin
(see Chapter 1), can be considered a natural “by-product” of multipoint LOD
score analysis. In a given pedigree with evidence for linkage, haplotyping can
reveal the critical recombinants, that is, those affected individuals that share only
part of the disease-associated haplotype due to a recombination that shortens the
region of interest.
Another use of multipoint LOD score analysis for Mendelian disorders is exclu-
sion mapping, where “negative” information is used to exclude regions of the
genome from possibly harboring a disease gene. The classical criterion is to exclude
all regions with Z(x),22.0, but it is important to be aware of the effect of hetero-
geneity and misspecified model parameters on multipoint exclusion mapping. As in
two-point analysis, multipoint heterogeneity LOD scores can be computed with the
admixture test (e.g., using HOMOG). However, the interpretation of these tests in
the multipoint situation is less straightforward because the asymptotic properties
of multipoint LOD scores, which are generally multimodal, are not well charac-
terized and the x2 approximations are thus questionable. Rather than using
p-values, it may be preferable to simply report the observed likelihood ratio between
the hypotheses of no linkage and homogeneity versus linkage and heterogeneity. As
in two-point analysis, heterogeneity has a major impact on the power to correctly
detect linkage using multipoint analysis. With two-point LOD scores, heterogeneity,
if not taken into account in the analysis, or other types of model error leading to false
apparent recombinations can be partially absorbed by an inflated estimate of the
recombination fraction (Risch and Giuffra, 1992). However, in multipoint analysis,
the flanking markers prevent the recombination fraction from floating very far,
which makes multipoint LOD scores somewhat less robust with respect to genotype
and model errors than two-point LOD scores. A typical multipoint LOD score curve
in the presence of heterogeneity is shown in Figure 10.1. When heterogeneity is
ignored, the region holding the gene of interest is excluded (all families). When
heterogeneity is taken into account (linked families), the region is clearly identified.
270 ADVANCED PARAMETRIC LINKAGE ANALYSIS
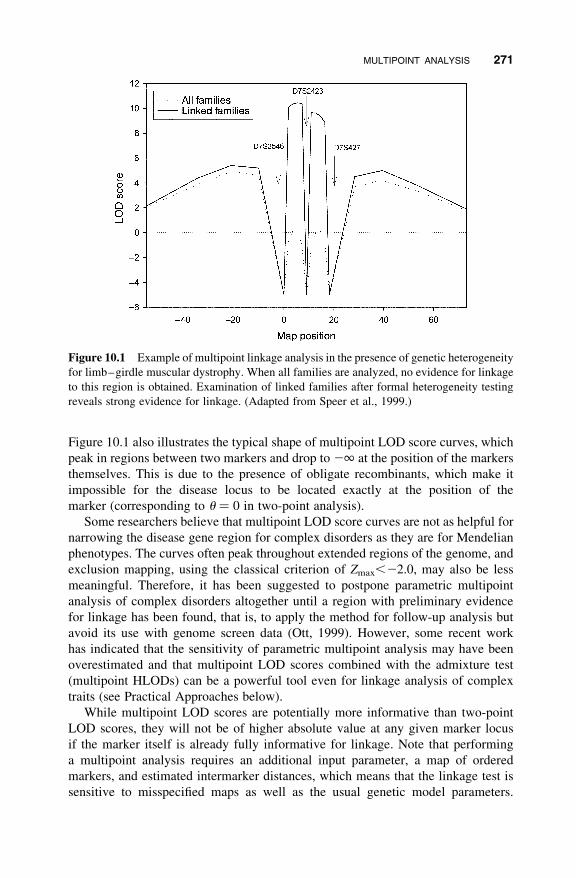
Figure 10.1 also illustrates the typical shape of multipoint LOD score curves, which
peak in regions between two markers and drop to 21 at the position of the markers
themselves. This is due to the presence of obligate recombinants, which make it
impossible for the disease locus to be located exactly at the position of the
marker (corresponding to u ¼ 0 in two-point analysis).
Some researchers believe that multipoint LOD score curves are not as helpful for
narrowing the disease gene region for complex disorders as they are for Mendelian
phenotypes. The curves often peak throughout extended regions of the genome, and
exclusion mapping, using the classical criterion of Zmax,22.0, may also be less
meaningful. Therefore, it has been suggested to postpone parametric multipoint
analysis of complex disorders altogether until a region with preliminary evidence
for linkage has been found, that is, to apply the method for follow-up analysis but
avoid its use with genome screen data (Ott, 1999). However, some recent work
has indicated that the sensitivity of parametric multipoint analysis may have been
overestimated and that multipoint LOD scores combined with the admixture test
(multipoint HLODs) can be a powerful tool even for linkage analysis of complex
traits (see Practical Approaches below).
While multipoint LOD scores are potentially more informative than two-point
LOD scores, they will not be of higher absolute value at any given marker locus
if the marker itself is already fully informative for linkage. Note that performing
a multipoint analysis requires an additional input parameter, a map of ordered
markers, and estimated intermarker distances, which means that the linkage test is
sensitive to misspecified maps as well as the usual genetic model parameters.
Figure 10.1 Example of multipoint linkage analysis in the presence of genetic heterogeneity
for limb–girdle muscular dystrophy. When all families are analyzed, no evidence for linkage
to this region is obtained. Examination of linked families after formal heterogeneity testing
reveals strong evidence for linkage. (Adapted from Speer et al., 1999.)
MULTIPOINT ANALYSIS 271
Recent efforts have greatly improved the resolution of these genetic maps, which are
based on observed recombination events between polymorphic markers and mini-
mize the required number of recombinations separating the markers to determine
the most likely (parsimonious) marker order. A dataset of 146 nuclear Icelandic
families containing 1257 meioses was used to develop maps of over 5000 poly-
morphic microsatellite markers, taking into account sequence information from the
physical maps that have been developed as part of the Human Genome Project
(Kong et al., 2002). Previously, the Marshfield maps, based on eight three-generation
Centre d’Etude du Polymorphisme Humain (CEPH) families containing 188
meioses, had been considered the most comprehensive mapping resource (Marshfield
Medical Research Foundation, http://research.marshfieldclinic.org/genetics/).
In multipoint linkage analysis, the computational complexity of pedigree
likelihoods of the form (10.1) is greatly magnified, since the joint inheritance of
many markers has to be traced through a pedigree to evaluate the LOD score at
each point along the marker map, and the number of possible genotypes for untyped
pedigree members increases exponentially. Two different algorithms were devel-
oped to recursively compute the likelihood terms: the Elston–Stewart “peeling”
algorithm (Elston and Stewart, 1971) was implemented in the first generally avail-
able software for pedigree likelihood computation (LIPED; Ott, 1974) and continues
to be the basis of the current packages FASTLINK (Cottingham et al., 1993), a faster
version of the original LINKAGE package (Lathrop et al., 1984), and VITESSE
(O’Connell and Weeks, 1995; O’Connell, 2001). The Elston–Stewart algorithm
scales linearly in the number of pedigree members and exponentially in the
number of markers and is thus typically used for large pedigrees and a moderate
number of markers (3–6, depending on the number of untyped pedigree members).
VITESSE is the program of choice for simple pedigrees without loops that descend
from one founder pair, while FASTLINK is able to handle inbred pedigrees and
those with multiple founder pairs.
The Lander–Green algorithm (Lander and Green, 1987) has been implemented
in the packages GENEHUNTER (Kruglyak et al., 1996; for GENEHUNTER-
PLUS, see Chapter 11), ALLEGRO (Gudbjartsson et al., 2000), and MERLIN
(Abecasis et al., 2002), of which MERLIN is superior to both of the other packages
in terms of computational speed. The algorithm scales exponentially in the number
of pedigree members and linearly in the number of markers and is thus ideally suited
for analyzing all the markers for an entire chromosome on small- to moderate-sized
pedigrees (in GENEHUNTER, 2n 2 f � 21, where n is the number of nonfounders
and f the number of founders; ALLEGRO and MERLIN are able to handle
somewhat larger pedigrees). These programs also implement various types of non-
parametric linkage tests (see Chapter 11) and provide other useful statistics of inter-
est, such as the information content of a pedigree and the overall dataset along the
marker map, which highlights regions where additional marker genotyping would be
most useful.
Another class of computational algorithms is the Markov chain Monte Carlo
(MCMC) type, which is a stochastic rather than an exact algorithm. SIMWALK2
(Sobel and Lange, 1996) can be used to compute a random-walk-based
272 ADVANCED PARAMETRIC LINKAGE ANALYSIS

approximation of the exact parametric LOD score computed by FASTLINK and
VITESSE and is able to analyze simultaneously a large number of markers on pedi-
grees that are too large for the Lander–Green algorithm. Some packages have begun
to implement so-called hybrid algorithms, where pedigrees amenable to exact analy-
sis with the Lander–Green algorithm are processed accordingly, while those too
large for exact LOD score computation are analyzed with a SIMWALK2-type
MCMC algorithm (SAGE, MERLIN). An excellent resource for downloading
most of these computer programs is a website maintained by the Rockefeller
University lab, http://linkage.rockefeller.edu, which provides links to all of the
program-specific URLs.
PRACTICAL APPROACHES FOR MODEL-BASED LINKAGEANALYSIS OF COMPLEX TRAITS
For complex traits, susceptibility genes are presumably more common and of more
modest effect than Mendelian disease genes, and they are likely to act in concert
with multiple other genes and/or environmental factors. Thus, any assumed
single-gene mechanism (genetic model) for parametric LOD score analysis is
almost certainly incorrect. It has been shown that analysis under a single wrong
model [i.e., calculation of “wrod” (wrong LOD) scores] does not inflate the type I
error rate of the LOD score method (Williamson and Amos, 1990). However,
analyzing the data under multiple models and estimating unknown parameters by
maximizing the LOD score over model parameters does lead to grossly inflated
significance levels (Weeks et al., 1990a). The question then remains as to how
one should choose the model parameters if a parametric LOD score analysis is to
be applied to complex trait data.
Traditionally, genetic model parameters have been estimated via segregation analy-
sis. This is a statistically sophisticated technique for estimating the most likely mode of
inheritance for a trait from pedigree data that have been collected in a systematic
fashion, ideally in such a way that a correction for ascertainment bias can be applied
(Khoury et al., 1993). A properly performed segregation analysis of a large dataset can
be quite useful for the linkage analyst since it provides maximum-likelihood estimates
of the MOI, disease allele frequency and penetrance for susceptible and nonsusceptible
genotypes. Due to the improbability of single-gene mechanisms, this type of analysis is
only rarely attempted for complex traits, although it has been carried out successfully,
for example, to locate highly penetrant genes for early-onset breast cancer (Claus et al.,
1991; Easton et al., 1993). Here, the segregation analysis also included the estimation
of an age-dependent penetrance function for the gene of interest. Since the ratio of gen-
etic and nongenetic cases is often variable across different age groups, with younger
cases typically more likely to be genetic than older cases, the concept of liability
classes can be used to flexibly model age-at-onset distributions in parametric linkage
analysis, as illustrated by the breast cancer example (Easton et al., 1993; Terwilliger
and Ott, 1994). For Mendelian diseases, phenocopies are typically assumed to
be absent and age-dependent penetrance is often modeled by assuming a normal
PRACTICAL APPROACHES FOR MODEL-BASED LINKAGE ANALYSIS 273
age-of-onset distribution with mean and variance estimated from the pedigree data at
hand (see Ott, 1999, Chapter 7.5, for more detail).
A much simpler alternative to segregation analysis is to estimate model para-
meters by making use of epidemiological information (Terwilliger and Ott, 1994).
If estimates of population prevalence and the proportion of nongenetic cases
among all affected individuals in the population are available, the penetrance for
a single-locus model can be determined for an assumed disease allele frequency,
because the following relationship between prevalence w, penetrance of susceptible
genotypes f, penetrance of phenocopies fp, and disease allele frequency q should
hold for a dominant disease:
w ¼ ½q2 þ 2q(1� q)� f þ (1� q)2 fp
(an analogous expression holds for recessive traits). While it may seem appealing to
use such existing information about disease epidemiology, some guesswork clearly
remains and, again, any single-gene mechanism is unlikely to accurately capture the
true complex trait etiology. Some other practical applications of parametric LOD
score analysis for complex disorders are briefly described below.
Affecteds-Only Analysis
The idea of the affecteds-only (“low-penetrance”) analysis is to discard the pheno-
typic information from unaffected individuals since their phenotype may be due to
incomplete penetrance of a single gene, a missing copy of a second susceptibility
gene, absence of an environmental trigger, or similar complicating factors. How-
ever, one would nevertheless like to incorporate their genotypic information. A cum-
bersome way of setting up an affecteds-only analysis would be to recode all
unaffected people as “unknown.” Fortunately, the same effect can be achieved
much more efficiently by simply changing the genetic model parameters. Having
phenotype “unknown” essentially means that all three possible disease genotypes
(DD, Dd, dd) are equally likely to produce the observed phenotype. The
implementation of liability classes in LINKAGE and any other programs is such
that, for an affected person, the specified penetrance value is interpreted as the prob-
ability of being affected given the individual’s genotype. For an unaffected person,
1 minus the penetrance value is used for this probability. Thus, if phenocopies are
assumed to be absent ( fp ¼ 0), it is sufficient to assign very low penetrance
values f (e.g., 0.0001) to affected individuals so that, for unaffected individuals,
1 2 fp ¼ 1 2 0 � 1 2 0.0001 ¼ 1 2 f, making all three disease genotypes essen-
tially equally likely. Dominant and recessive MOIs only differ by whether the hetero-
zygous disease genotype has penetrance 0 (recessive) or 0.0001 (dominant). The
disease allele is commonly assumed to have a frequency of, say, 0.001 for a “generic”
dominant and 0.20 for a recessive model. If allowance for phenocopies is desired, the
penetrance for nonsusceptible genotypes could be adjusted, relative to the value of
0.0001 for susceptible genotypes, to maintain a penetrance ratio compatible
274 ADVANCED PARAMETRIC LINKAGE ANALYSIS
with epidemiological data (Terwilliger and Ott, 1994). Typically, however, pheno-
copies are assumed to be absent in this type of analysis. Note that the occurrence
of phenocopies is essentially a form of heterogeneity (Durner et al., 1996). For our
AD data example, an affecteds-only analysis produces Zmax ¼ 3.83 at u ¼ 0.10
under a dominant model and Zmax ¼ 1.93 at u ¼ 0.05 under a recessive model.
Maximized Maximum LOD Score
Some authors suggest computing a maximized maximum LOD score (MMLS,
Greenberg et al., 1998; also called “mod score,” Clerget-Darpoux et al., 1986;
Hodge and Elston, 1994). They also assume the absence of phenocopies, but
rather than using very low penetrance values to discard the phenotypic information
provided by unaffected individuals, they recommend the computation of LOD
scores under two “simple,” single-locus models, one dominant and one recessive,
each with 50% penetrance f and with disease allele frequency q ¼
1�ffiffiffiffiffiffiffiffiffiffiffiffiffiffiffiffiffiffiffi(1� w=f )p
for the dominant and q ¼ffiffiffiffiffiffiffiffiw=fp
for the recessive model, where w
denotes the population prevalence (Durner et al., 1999). Then, the maximum of
the two LOD scores is corrected for maximization over two models by subtracting
0.3 (Hodge et al., 1997). The MMLS thus corrected was shown to be approximately
x 2-distributed (with 1 df ) under the null hypothesis of no linkage, which allows the
computation of p-values. It was shown that the MMLS has good power to detect
linkage of a complex trait for a variety of simulated pedigree structures and genetic
models and can, in fact, be more powerful than a test based on identical-by-descent
(IBD) sharing in affected sibpairs or on the GENEHUNTER nonparametric NPL
score for affected relative pairs (see Chapter 11; Durner et al., 1999; Abreu et al.,
1999). It is informative to report the actual maximum LOD scores under both domi-
nant and recessive models rather than only the MMLS after the correction for maxi-
mization over the two models has been applied. Of course, just like the LOD scores
from the simple genetic models defined above, affecteds-only LOD scores can also
be computed under both a dominant and recessive model. The correction factor is
likely to be very similar to the one suggested for the simple models, although the
corresponding formal investigations have not been carried out. For our AD data
example, a simple dominant model with 50% penetrance and w ¼ 0.10 (hence,
q ¼ 0.106) produces Zmax ¼ 2.30 at u ¼ 0.05, and the corresponding recessive
model (with q ¼ 0.447) produces Zmax ¼ 1.18 at u ¼ 0.05.
Heterogeneity LOD
Regardless of whether LOD scores were computed initially based on simple genetic
models or an affecteds-only approach, there is a fairly large body of evidence sup-
porting the subsequent calculation of HLOD scores to detect linkage of complex
traits, even when the assumed heterogeneity model is incorrect. Most of the relevant
studies have been briefly summarized and reviewed (Hodge et al., 2002). In essence,
it was shown that the two-point HLOD is a robust and powerful tool to detect linkage
even when the assumptions of the HLOD analysis are violated and the obtained
PRACTICAL APPROACHES FOR MODEL-BASED LINKAGE ANALYSIS 275
estimate of the actual proportion of linked families (a) is strongly biased. In addition,
one does not pay much of a price in type I error by using HLODs (Abreu et al., 2002).
The statistical properties of the multipoint HLOD have not yet been investigated in as
much detail, but there is some indication that results may be similar to those reported
for two-point LOD scores (Greenberg and Abreu, 2001). This would imply that ear-
lier conclusions (Risch and Giuffra, 1992) about the greatly increased sensitivity of
multipoint LOD scores to misspecified model parameters may have been too pessi-
mistic. Based on a recent study (Greenberg and Abreu, 2001), it appears that a stron-
ger correction than subtracting 0.3 from the two-point MMLS (Hodge et al., 1997)
may be needed to appropriately correct for LOD score maximization over two gen-
etic models (dominant and recessive) in multipoint analysis, but more work is needed
to arrive at definitive recommendations. For the AD data, the two-point HLODs are
3.82 (a ¼ 1.0) and 1.98 (a ¼ 0.85) with affecteds-only LOD scores from the dominant
and recessive model and 2.30 (a ¼ 1.0) and 1.24 (a ¼ 0.75) with the LOD scores from
the simple models, respectively.
MFLINK
Some researchers have proposed to maximize, not the LOD score, but, indepen-
dently, the likelihood of the data under linkage and nonlinkage (numerator and
denominator of the likelihood ratio) over a limited set of transmission models con-
strained to produce the correct population prevalence, including dominant and reces-
sive models (Curtis and Sham, 1995). The likelihood under linkage is also
maximized over admixture, that is, the proportion of families linked. The authors
showed that this test statistic is well behaved under the null hypothesis, that it has
good power to detect linkage when it is present, and that its multipoint version is
quite robust to errors in the assumed models. The method has been implemented
in the software MFLINK.
In practice, the affecteds-only MMLS and HLOD approaches are probably used
most frequently for two-point model-based linkage analysis of complex traits,
although the MFLINK method certainly has some appeal from a statistical perspec-
tive. Multipoint model-based analysis of complex disorders at the initial genome
screen stage appears to be applied somewhat less frequently than the corresponding
nonparametric approaches popularized by GENEHUNTER. For follow-up analysis
of regions with positive linkage signals at the genome screen stage, a multipoint
HLOD analysis, assuming both a dominant and recessive model and using either
simple genetic models that take into account the population prevalence or the
affecteds-only approach, can be recommended. However, possible statistical pro-
blems associated with the unknown distribution of multipoint LOD scores should
be kept in mind. It is important to evaluate multipoint LOD scores at locations
outside the fixed map, which is equivalent to allowing for overestimation of the
recombination fraction in the two-point analysis. Multipoint analysis is then essen-
tially the same as testing for linkage to a (potentially more informative) haplotype of
markers. A large collaborative study of prostate cancer provides a good example of a
parametric multipoint follow-up analysis based on models derived from segregation
276 ADVANCED PARAMETRIC LINKAGE ANALYSIS
analysis as well as epidemiological information and implemented through the con-
cept of liability classes (Xu, 2000).
In summary, two-point analysis under two single-locus models (dominant and
recessive) can be a powerful way to analyze complex phenotypes. Multipoint para-
metric LOD scores should be interpreted with more caution and should probably
never be the only multipoint analysis method applied to complex disorders. How-
ever, recent work indicates that the multipoint HLOD can have more power than
the NPL score under a variety of generating models (Greenberg and Abreu, 2001)
and may be more robust to misspecified model parameters than previously estimated.
Extensions of the parametric LOD score method for jointly analyzing two disease
loci have also been proposed and implemented (TLINKAGE; Schork et al., 1993).
However, these types of additional complexities are probably better addressed
with nonparametric methods based on allele-sharing statistics (Chapter 11).
SUMMARY
Parametric LOD score analysis has been the workhorse of disease gene mapping for
many years. It is still the most powerful method of linkage analysis if it is possible to
specify the genetic model parameters with reasonable accuracy. For two-point
analysis, incorrect specification, particularly of the mode of inheritance, can lead
to a dramatic loss of power, as illustrated with simulation studies of AD pedigrees.
This has led to the recommendation of computing LOD scores under both a
dominant and recessive model. If the maximum over the two models is used as
the summary measure of linkage, an appropriate correction for this additional maxi-
mization has been derived. Multipoint analysis is potentially able to extract a much
greater amount of linkage information from a set of pedigrees but may be more
vulnerable than two-point analysis in terms of misspecified model parameters. In
practice, model-based multipoint analysis should be complemented by appropriate
nonparametric approaches. Despite the difficulty of specifying an approximately
correct genetic model, numerous investigations have shown that parametric LOD
scores remain a valid and useful tool for modern-day linkage analysis of complex
traits.
REFERENCES
Abecasis GR, Cherny SS, Cookson WO, Cardon LR (2002): Merlin—Rapid analysis of dense
genetic maps using sparse gene flow trees. Nat Genet 30:97–101.
Abreu PC, Greenberg DA, Hodge SE (1999): Direct power comparisons between simple LOD
scores and NPL scores for linkage analysis in complex diseases. Am J Hum Genet
65:847–857.
Abreu PC, Hodge SE, Greenberg DA (2002): Quantification of type I error probabilities for
heterogeneity LOD scores. Genet Epidemiol 22:156–169.
REFERENCES 277

Barnard GA (1949): Statistical inference. J R Stat Soc B B11:115–139.
Boehnke M, Cox NJ (1997): Accurate inference of relationships in sib-pair linkage studies.
Am J Hum Genet 61:423–429.
Chotai J (1984): On the LOD score method in linkage analysis. Ann Hum Genet
48 (Pt 4):359–378.
Claus EB, Risch N, Thompson WD (1991): Genetic analysis of breast cancer in the cancer and
steroid hormone study. Am J Hum Genet 48:232–242.
Clerget-Darpoux F, Bonaiti-Pellie C, Hochez J (1986): Effects of misspecifying genetic
parameters in LOD score analysis. Biometrics 42:393–399.
Corder EH, Saunders AM, Strittmatter WJ, Schmechel DE, Gaskell PC, Small GW, Roses
AD, Haines JL, Pericak-Vance MA (1993): Gene dose of apolipoprotein E type 4 allele
and the risk of Alzheimer’s disease in late onset families. Science 261:921–923.
Cottingham RW, Idury RM, Schaffer AA (1993): Faster sequential genetic linkage
computations. Am J Hum Genet 53:252–263.
Curtis D, Sham PC (1995): Model-free linkage analysis using likelihoods. Am J Hum Genet
57:703–716.
Douglas JA, Boehnke M, Lange K (2000): A multipoint method for detecting genotyping
errors and mutations in sibling-pair linkage data. Am J Hum Genet 66:1287–1297.
Durner M, Greenberg DA, Hodge SE (1996): Phenocopies versus genetic heterogeneity: Can
we use phenocopy frequencies in linkage analysis to compensate for heterogeneity? Hum
Hered 46:265–273.
Durner M, Vieland VJ, Greenberg DA (1999): Further evidence for the increased
power of LOD scores compared with nonparametric methods. Am J Hum Genet
64:281–289.
Easton DF, Bishop DT, Ford D, Crockford GP, Breast Cancer Linkage Consortium (1993):
Genetic linkage analysis in familial breast and ovarian cancer: Results from 214 families.
Am J Hum Genet 52:678–701.
Elston RC (1997): Algorithms and inferences: The challenge of multifactorial disease. Am J
Hum Genet 60:255–262.
Elston RC, Stewart J (1971): A general model for the genetic analysis of pedigree data. Hum
Hered 21:523–542.
Epstein MP, Duren WL, Boehnke M (2000): Improved inference of relationship for pairs of
individuals. Am J Hum Genet 67:1219–1231.
Faraway JJ (1993): Distribution of the admixture test for the detection of linkage under
heterogeneity. Genet Epidemiol 10:75–83.
Goring HH, Ott J (1997): Relationship estimation in affected sib pair analysis of late-onset
diseases. Eur J Hum Genet 5:69–77.
Greenberg DA, Abreu PC (2001): Determining trait locus position from multipoint analysis:
Accuracy and power of three different statistics. Genet Epidemiol 21:299–314.
Gudbjartsson DF, Jonasson K, Frigge ML, Kong A (2000): Allegro, a new computer
program for multipoint linkage analysis. Nat Genet 25:12–13.
Haines JL (1998): Genomic screening. In: Haines JL, Pericak-Vance MA, eds. Approaches to
Gene Mapping in Complex Human Diseases. New York: Wiley-Liss.
Haines JL, Terwedow HA, Burgess K, Pericak-Vance MA, Rimmler JB, Martin ER,
Oksenberg JR, Lincoln R, Zhang DY, Banatao DR, Gatto N, Goodkin DE, Hauser SL
278 ADVANCED PARAMETRIC LINKAGE ANALYSIS
(1998): Linkage of the MHC to familial multiple sclerosis suggests genetic heterogeneity.
The Multiple Sclerosis Genetics Group. Hum Mol Genet 7:1229–1234.
Hall JM, Lee MK, Newman B, Morrow JE, Anderson LA, Huey B, King MC (1990): Linkage
of early-onset familial breast cancer to chromosome 17q21. Science 250:1684–1689.
Hanis CL, Boerwinkle E, Chakraborty R, Ellsworth DL, Concannon P, Stirling B, Morrison
VA, et al (1996): A genome-wide search for human non-insulin-dependent (type 2)
diabetes genes reveals a major susceptibility locus on chromosome 2. Nat Genet
13:161–166.
Hodge SE, Abreu PC, Greenberg DA (1997): Magnitude of type I error when single-locus
linkage analysis is maximized over models: A simulation study. Am J Hum Genet
60:217–227.
Hodge SE, Vieland VJ, Greenberg DA (2002): HLODs remain powerful tools for detection of
linkage in the presence of genetic heterogeneity. Am J Hum Genet 70:556–559.
Hoh J, Ott J (2000): Scan statistics to scan markers for susceptibility genes. Proc Natl Acad
Sci USA 97:9615–9617.
Hugot JP, Laurent-Puig P, Gower-Rrousseau C, Olson JM, Lee JC, Beaugerie L, Naom I,
Dupas J-L, Van Gossum A, Groupe d’Etude Therapeutique des Affections Inflammatoires
Digestives, Orholm M, Bonaiti-Pellie C, Weissenback J, Mathew CJ, Lennard-Jones JE,
Cortot A, Colombel JF, Thomas G (1996): Mapping of a susceptibility locus for
Crohn’s disease on chromosome 16. Nature 379:821–823.
Khoury MJ, Beaty TH, Cohen BH (1993): Fundamentals of Genetic Epidemiology.
New York: Oxford University Press.
Kong A, Gudbjartsson DF, Sainz J, Jonsdottir GM, Gudjonsson SA, Richardsson B,
Sigurdardottir S, Barnard J, Hallbeck B, Masson G, Shlien A, Palsson ST, Frigge ML,
Thorgeirsson TE, Gulcher JR, Stefansson K (2002): A high-resolution recombination
map of the human genome. Nat Genet 31:241–247.
Kruglyak L, Daly MJ, Reeve-Daly MP, Lander ES (1996): Parametric and nonparametric
linkage analysis: A unified multipoint approach. Am J Hum Genet 58:1347–1363.
Lander E, Kruglyak L (1995): Genetic dissection of complex traits: Guidelines for interpret-
ing and reporting linkage results. Nat Genet 11:241–247.
Lander ES, Green P (1987): Construction of multilocus genetic linkage maps in humans. Proc
Natl Acad Sci USA 84:2363–2367.
Lathrop GM, Lalouel JM, Julier C, Ott J (1984): Strategies for multilocus linkage analysis in
humans. Proc Natl Acad Sci USA 81:3443–3446.
McPeek MS, Sun L (2000): Statistical tests for detection of misspecified relationships by use
of genome-screen data. Am J Hum Genet 66:1076–1094.
Morton NE (1955): Sequential tests for the detection of linkage. Am J Hum Genet 7:277–318.
Morton NE (1956): The detection and estimation of linkage between the genes for ellipto-
cytosis and the Rh blood type. Am J Hum Genet 8:80–96.
O’Connell JR (2001): Rapid multipoint linkage analysis via inheritance vectors in the Elston–
Stewart algorithm. Hum Hered 51:226–240.
O’Connell JR, Weeks DE (1995): The VITESSE algorithm for rapid exact multilocus linkage
analysis via genotype set-recoding and fuzzy inheritance. Nat Genet 11:402–408.
O’Connell JR, Weeks DE (1998): PedCheck: A program for identification of genotype incom-
patibilities in linkage analysis. Am J Hum Genet 63:259–266.
REFERENCES 279
Ott J (1974): Estimation of the recombination fraction in human pedigrees: Efficient
computation of the likelihood for human linkage studies. Am J Hum Genet 26:588–597.
Ott J (1986): The number of families required to detect or exclude linkage heterogeneity. Am
J Hum Genet 39:159–165.
Ott J (1992): Strategies for characterizing highly polymorphic markers in human gene map-
ping. Am J Hum Genet 51:283–290.
Ott J (1999): Analysis of Human Genetic Linkage, 3rd ed. Baltimore, MD: Johns Hopkins
University Press.
Pericak-Vance MA, Bebout JL, Gaskell PC, Yamaoka LH, Hung WY, Alberts MJ, Walker
AP, Bartlett RJ, Haynes CS, Welsh KA, Earl NL, Heyman A, Clark CM, Roses AD
(1991): Linkage studies in familial Alzheimer’s disease: Evidence for chromosome 19
linkage. Am J Hum Genet 48:1034–1050.
Rimmler JB, Haynes CS, McDowell JG, Stajich JE, Adams CS, Slotterbeck BD, Rogala AR,
West SG, Gilbert JR, Hauser ER, Vance JM, Pericak-Vance MA (1999): DataTracker:
Comprehensive software for data quality control protocols in complex disease studies.
Am J Hum Genet 65(Suppl):A442.
Risch N (1988): A new statistical test for linkage heterogeneity. Am J Hum Genet 42:353–364.
Risch N, Giuffra L (1992): Model misspecification and multipoint linkage analysis. Hum
Hered 42:77–92.
Schork NJ, Boehnke M, Terwilliger JD, Ott J (1993): Two trait locus linkage analysis: A
powerful strategy for mapping complex genetic traits. Am J Hum Genet 53:1127–1136.
Skolnick MH, Thompson EA, Bishop DT, Cannon LA (1984): Possible linkage of a breast
cancer-susceptibility locus to the ABO locus: Sensitivity of LOD scores to a single new
recombinant observation. Genet Epidemiol 1:363–373.
Smith CAB (1963): Testing for heterogeneity of recombination fractions values in human
genetics. Ann Hum Genet 27:175–182.
Sobel E, Lange K (1996): Descent graphs in pedigree analysis: Applications to haplotyping,
location scores and marker-sharing statistics. Am J Hum Genet 58:1323–1337.
Terwilliger, JD, Ott, J (1994): Handbook of Human Genetic Linkage. Baltimore, MD: Johns
Hopkins University Press.
Terwilliger JD, Speer MC, Ott J (1993): A chromosome based method for rapid computer
simulation in human genetic linkage analysis. Genet Epidemiol 10:217–224.
Thomson G (1994): Identifying complex disease genes: Progress and paradigms. Nat Genet
8:108–110.
Vieland VJ, Hodge SE, Greenberg DA (1992): Adequacy of single-locus approximations for
linkage analyses of oligogenic traits. Genet Epidemiol 9:45–59.
Weeks DE, Conley YP, Mah TS, Paul TO, Morse L, Ngo-Chang J, Dailey JP, Ferrell RE,
Gorin MB (2000): A full genome scan for age-related maculopathy. Hum Mol Genet
9:1329–1349.
Weeks DE, Lehner T, Squires-Wheeler E, Kaufmann C, Ott J (1990a): Measuring the inflation
of the LOD score due to its maximization over model parameter values in human linkage
analysis. Genet Epidemiol 7:237–243.
Weeks DE, Ott J, Lathrop GM (1990b): SLINK: A general simulation program for linkage
analysis. Am J Hum Genet 47:A204.
280 ADVANCED PARAMETRIC LINKAGE ANALYSIS

Williamson JA, Amos CI (1990): On the asymptotic behavior of the estimate of the recombi-
nation fraction under the null hypothesis of no linkage when the model is misspecified.
Genet Epidemiol 7:309–318.
Xu J (2000): Combined analysis of hereditary prostate cancer linkage to 1q24-25: Results
from 772 hereditary prostate cancer families from the International Consortium for Pros-
tate Cancer Genetics. Am J Hum Genet 66:945–957.
Zaykin DV, Westfall PH, Young SS, KarnoubPL, Wagner MJ, Ehm MG (2002):
Missing p, haplotypes, and multiple r: Testing association of statistically inferred haplo-
types with discrete and continuous traits in samples of unrelated individuals. Hum
Hered 53:79–91.
REFERENCES 281