Embed Size (px)
Citation preview
1
GENETIC ANALYSIS FOR DESIRABLE ATTRIBUTES IN POPCORN
BY
MUHAMMAD NOOR
A dissertation submitted to The University of Agriculture, Peshawar
in partial fulfillment of the requirements for the degree of
DOCTOR OF PHILOSOPHY (Ph. D) IN AGRICULTURE
(PLANT BREEDING AND GENETICS)
DEPARTMENT OF PLANT BREEDING AND GENETICS
FACULTY OF CROP PRODUCTION SCIENCES
THE UNIVERSITY OF AGRICULTURE
PESHAWAR, PAKISTAN
DECEMBER, 2015
2

3
4
5

6
7
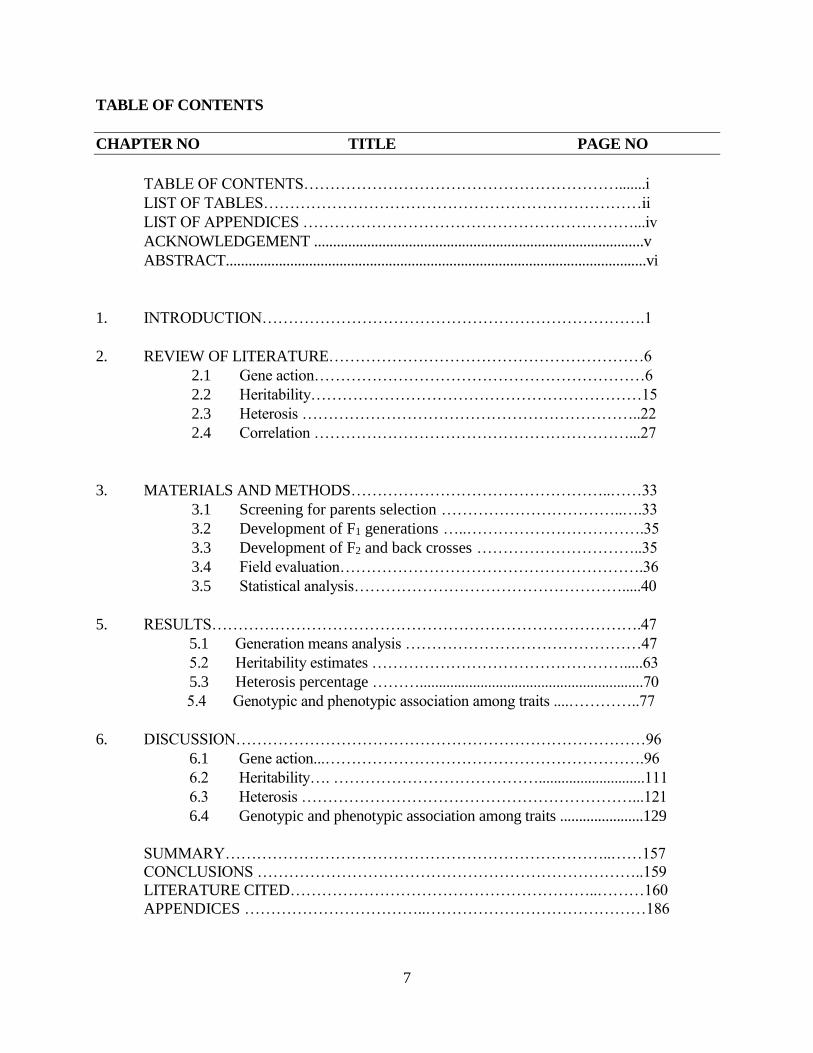
TABLE OF CONTENTS
CHAPTER NO TITLE PAGE NO
TABLE OF CONTENTS…………………………………………………….......i
LIST OF TABLES………………………………………………………………ii
LIST OF APPENDICES ………………………………………………………...iv
ACKNOWLEDGEMENT .......................................................................................v
ABSTRACT...............................................................................................................vi
1. INTRODUCTION……………………………………………………………….1
2. REVIEW OF LITERATURE……………………………………………………6
2.1 Gene action………………………………………………………6
2.2 Heritability………………………………………………………15
2.3 Heterosis ………………………………………………………..22
2.4 Correlation ……………………………………………………...27
3. MATERIALS AND METHODS…………………………………………..……33
3.1 Screening for parents selection ……………………………..….33
3.2 Development of F1 generations …..…………………………….35
3.3 Development of F2 and back crosses …………………………..35
3.4 Field evaluation………………………………………………….36
3.5 Statistical analysis…………………………………………….....40
5. RESULTS……………………………………………………………………….47
5.1 Generation means analysis ………………………………………47
5.2 Heritability estimates ………………………………………….....63
5.3 Heterosis percentage ………...........................................................70
5.4 Genotypic and phenotypic association among traits ....…………..77
6. DISCUSSION……………………………………………………………………96
6.1 Gene action...…………………………………………………….96
6.2 Heritability…. …………………………………............................111
6.3 Heterosis ………………………………………………………...121
6.4 Genotypic and phenotypic association among traits ......................129
SUMMARY………………………………………………………………..……157
CONCLUSIONS ………………………………………………………………..159
LITERATURE CITED…………………………………………………..………160
APPENDICES ……………………………..……………………………………186

8
________________________________________________________________
9
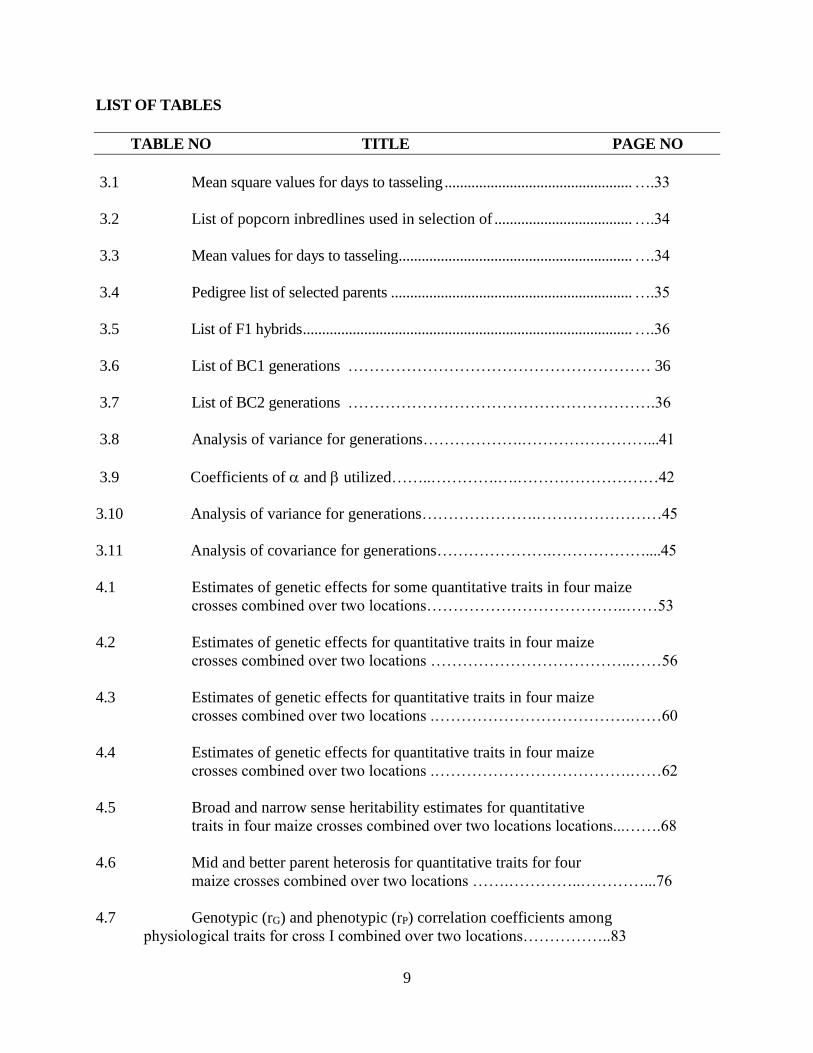
LIST OF TABLES
TABLE NO TITLE PAGE NO
3.1 Mean square values for days to tasseling ................................................. ….33
3.2 List of popcorn inbredlines used in selection of .................................... ….34
3.3 Mean values for days to tasseling ............................................................. ….34
3.4 Pedigree list of selected parents ............................................................... ….35
3.5 List of F1 hybrids ...................................................................................... ….36
3.6 List of BC1 generations ………………………………………………… 36
3.7 List of BC2 generations ………………………………………………….36
3.8 Analysis of variance for generations……………….……………………...41
3.9 Coefficients of and utilized……..………….….………………………42
3.10 Analysis of variance for generations………………….……………………45
3.11 Analysis of covariance for generations………………….………………....45
4.1 Estimates of genetic effects for some quantitative traits in four maize
crosses combined over two locations………………………………..……53
4.2 Estimates of genetic effects for quantitative traits in four maize
crosses combined over two locations ………………………………..……56
4.3 Estimates of genetic effects for quantitative traits in four maize
crosses combined over two locations .……………………………….……60
4.4 Estimates of genetic effects for quantitative traits in four maize
crosses combined over two locations .……………………………….……62
4.5 Broad and narrow sense heritability estimates for quantitative
traits in four maize crosses combined over two locations locations...…….68
4.6 Mid and better parent heterosis for quantitative traits for four
maize crosses combined over two locations …….…………..…………...76
4.7 Genotypic (rG) and phenotypic (rP) correlation coefficients among
physiological traits for cross I combined over two locations……………..83
10
4.8 Genotypic (rG) and phenotypic (rP) correlation coefficients among
physiological traits for cross II combined over two locations……………86
4.9 Genotypic (rG) and phenotypic (rP) correlation coefficients among
physiological traits for cross III combined over two locations…………...89
4.10 Genotypic (rG) and phenotypic (rP) correlation coefficients among
physiological traits for cross IV combined over two locations…………...92
11
LIST OF APPENDICES
APPENDIX NO TITLE PAGE NO
1 Combined analysis of variance for generation means
for days to tasseling, anthesis and silking ………...……..…..186
2 Combined analysis of variance for generation means
for days to maturity, plant height and ear height ……………...186
3. Combined analysis of variance for generation means
for fresh ear weight, ear length and ear diameter ………….…..187
4. Combined analysis of variance for generation
means for kernel rows ear -1, grains row-1 and
grains ear-1 ...................................................................................187
5. Combined analysis of variance for generation means for
100-grain weight, grain yield and biological
yield ……………………………………………...……….…..188
6. Combined analysis of variance for generation means
for harvest index, expansion volume, % unpopped
grains and % shelling ………………………………………..188
7. Generation means from combined analysis for days
to tasseling, anthesis, silking and maturity over two
locations …………………………………………..…………189
8. Generation means from combined analysis for
plant height, ear height and ear weight over two
locations ………………………………………………….….189
9. Generation means from combined analysis for grain yield,
ear length and ear diameter over two locations …………..….190
10. Generation means from combined analysis for
kernel rows ear-1, grains row-1 and grains ear-1………………190
11. Generation means from combined analysis for
100-grain weight, harvest index and % shelling
over two locations …………………………………….……..191
12. Generation means from combined analysis for
expansion volume, % unpopped grains and biological
yield over two locations ……………………………………….191
12
ACKNOWLEDGEMENTS
I really have no words to express my deepest sense of gratitude to almighty “ALLAH”,
the most merciful, the most beneficent and the unique source of all knowledge and wisdom
endowed to every mankind, who bestowed upon me the courage to complete this project and to
contribute to the noble field of knowledge. Cordial gratitude and countless salutations to be upon
the Holy Prophet “ Hazrat Muhammad (S.A.W)” , the most perfect among and ever born on the
earth, who is forever a torch of guidance and knowledge for human beings as a whole.
It was an honor for me to have Professor Dr. Hidayat-ur-Rahman as my major supervisor.
His advice, friendship, understanding, helpful suggestions and support during my scholastic life
were invaluable for the development of my study and research programs.
I wish to express my deepest gratitude and profound regards to my honorable co-
supervisor Dr. Muhammad Iqbal for providing plant material, encouragements, helpful
suggestions, friendship, guidance and outstanding support throughout my research on his station.
I would like to express great appreciation and my special acknowledgments to have Dr.
Iftikhar Hussain Khalil and Dr. Sajjid Ali. Their guidance, support and valuable suggestions
were very useful for the development of my studies.
The author also feels highly privileged to express heartfelt thanks to Prof. Dr. Fida
Mohammad, Chairman Department of Plant Breeding and Genetics for his kind cooperation and
encouragement throughout my study.
I am highly indebted to Mr. Muhammad Ramiz, Institute of Biotechnology and Genetic
Engineering (IBGE), The University of Agriculture, Peshawar for his cooperation and helpful
guidance in molecular analysis and interpretation of obtained results of my study.
I am very much thankful to my friends and contemporaries especially Muhammad Yasir,
Hamid ur Rahman, Dr. Farhan Ali, Irfan Ahmed Shah and Ihteram Ullah for their moral support,
cooperation, encouragement and unlimited prayers throughout my Ph. D.
Finally, my special and cordial gratitude to all of my relatives and my family members
especially to my farther for their sacrifices, understandings, patience and being a constant source
of prayers and inspiration that enabled me to achieve this really difficult task.
Muhammad Noor
13
GENETIC ANALYSIS FOR DESIRABLE ATTRIBUTES IN POPCORN
Muhammad Noor and Hidayat ur Rahman
Department of Plant Breeding and Genetics
The University of Agriculture, Peshawar
December, 2015
ABSTRACT
Quantification of genetic attributes including gene action, heterotic behavior, heritability
estimates, phenotypic and genotypic associations are important statistical tools in progressive
breeding programs. The genetic material includes eight diverse popcorn inbred lines in which
four were selected on the basis of phenotypic variation. Two of the four parents were developed
from indigenous popcorn material, while the other two were of exotic (Bangladesh). Parental
inbred lines were crossed to get four F1 crosses. These F1 crosses were selfed to generate F2 and
back crossed with their female and male parents to obtained, BC1 and BC2, respectively. In such
way total genetic material synthesized in this study include four each of parents, F1s, F2s, BC1s
and BC2s. These generations were evaluated at two locations i.e. Cereal Crops Research Institute
(CCRI), Pirsabak, Nowshehra and The University of Agriculture (UOA), Peshawar. At both
locations the experimental material was replicated thrice in randomized complete block design.
Data recorded were analyzed using combined analysis of variance. Combined analysis of
variance in all four crosses, revealed non-significant genotype × location interactions in days to
tasseling, silking, anthesis, ear length, fresh ear weight, kernel rows ear-1, grains row-1, grains
ear-1 and % unpopped grains, while rest traits exhibited significant genotype × location
interactions in some crosses. Significant genotype × location interactions were observed for ear
diameter in all crosses.
Generation mean analysis indicated that in all crosses dominant gene action was
predominantly important in the inheritance of both days to tasseling, anthesis and silking. The
additive gene effect was found to be negative in these crosses but significant except PS-Pop-29-
2-1 x BD- Pop-2-1-2 for anthesis. The digenic non-allelic epistasis of additive x dominance and
dominance x dominance was considered the major contributing factor in the inheritance of days
to anthesis in cross PS-1 x BD-2 and PS-2 x BD-2. Duplicate type of epistasis was observed in
cross PS-1 × BD-1 for days to anthesis and silking, while complementary epistasis was observed
in cross PS-1 x BD-2. Similarly, dominant gene actions were positive and significant in all
crosses except, PS-2 × BD-1 (-9.16) for plant and ear height. Duplicate type of epistasis was
observed for ear height in both cross PS-1 × BD-1 and PS-1 × BD-2, while in cross PS-2 × BD-1
and PS-2 × BD-2 complementary epistasis was found. On the basis of these results, it can be
concluded that crosses in which additive gene effects were high, could be improved effectively
in subsequent generations. For grain yield and related traits dominant gene action was positively
significant in all crosses, indicating that the parental populations could be effectively utilized in
hybrid development programs.
Broad sense heritability estimates for all the studied characters varied from moderate to
high level, while narrow sense heritability ranged from low to high in all crosses. Maximum
broad sense heritability estimates for days to tasseling (0.76 and 0.76) and anthesis (0.84 and
0.83) were observed in crosses PS-1 × BD-2 and PS-2 × BD-2, respectively. Maximum narrow
sense heritability estimates for days to anthesis (0.67 and 0.57) and silking (0.67 and 0.58) were
14
observed in cross PS-1 × BD-2 and PS-2 × BD-2, respectively. High broad sense (0.82) and
narrow sense (0.62) heritability estimates calculated for grain yield were observed in cross PS-2
× BD-1 and Cross PS-1 × BD-1, respectively. Grain yield related attributes exhibited high broad
sense heritability, while narrow sense heritability estimates for these traits varied from moderate
to high levels, which indicate greater contribution of the genetic portion in the inheritance.
Quality parameter, expansion volume revealed maximum broad sense heritability of 0.76 and
narrow sense heritability of 0.50 for cross PS-1 × BD-1 and PS-2 × BD-1, respectively.
Heterotic levels both, mid parent and better parent were negative for flowering characters
in all crosses. Maximum negative mid- and better parent heterosis of -7.15 and -3.77 for days to
tasseling was observed in cross PS-1 × BD-1 and PS-2 × BD-1, respectively. In cross PS-2 ×
BD-1, maximum negative mid- and better parent heterosis were observed for days to anthesis (-
6.74 and -3.65) and silking (-6.48 and -3.40). Heterotic levels both, mid parent and better parent
were positive and high in magnitude for grain yield and all related attributes. Cross PS-1 × BD-2,
exhibited maximum mid- (80.73) and better (62.74) heterotic values for grain yield. Maximum
mid- and better parent heterotic values are indication of dominance gene actions in all four
crosses.
Genetic and phenotypic association of flowering characteristics with grain yield were
negative in nature, while yield related attributes were positively correlated with grain yield.
Grain yield was positively correlated with plant height, while negatively correlated with ear
height in two crosses. Quality trait of expansion volume was negatively associated with grain
yield.
Based on our results, it would be wise to use those parents in hybrid crosses which
exhibited both additive and dominant gene actions coupled with high narrow sense heritability
estimates and having strong relationship along with high heterotic levels for most of the grain
yield related traits. Although all the F1 hybrids were superior but the PS-2 x BD-2 was
outstanding for grain yield. Therefore, this cross can be recommended for commercial
cultivation. Both popping expansion and percent of unpopped grains was positively and
significantly controlled by dominant genes in two of the four crosses, while in the other two
crosses dominant gene actions were negative in nature.
15
Chapter 1
INTRODUCTION
Maize (Zea mays L.) is one of the most important cereal crops in the world and is
classified as extremely diverse crop genetically due to its cross pollinated nature. It is grown at
an altitude from sea level to about 3300 meters above the sea level and from 500N to 400S
latitude as a multipurpose crop in temperate, sub-tropical and tropical regions of the world.
Maize is a cross pollinated crop under natural conditions, where 95% of the grains are the result
of pollen from the nearby plants and the remaining kernels are produced by self-pollination.
Maize behaves in a protandrous way, a phenomenon in which the pollen shedding normally
begins one to three days prior to the emergence of silks (Ali et al., 2011). Maize is a good source
of nutrients and plays a key role in the economy of several countries. It also serves as an
industrial grain crop with variety of products throughout the world (White and Johnson, 2003).
Plant breeding is an art and science of changing and improving the genetic pattern of crop
plants in relation to their economic use with the application of different selection techniques.
When the genetic variability is high the process of selection becomes easy to identify genotypes
with superior attributes. In case of limited variation the breeders usually use diverse technical
approaches to increase the level of variability. Controlled pollination approach is the basic source
of creating variability i.e., cross pollinated species is more variable than self pollinated species.
The differentiation of two maize inbred lines at genetic level is surpasses the difference between
chimpanzee and human being (Yan et al., 2010). The development of maize plants structure and
stature depends upon the genetic variability being present within the 10 chromosomes. Exploring
the genetic potential of this crop is mainly focused to solve the bottlenecks in the field of
genetics and breeding (Ali et al., 2013). Therefore, knowledge of genes involved in determining
different traits is crucial to manipulate maize germplasm in the desirable direction and overcome
the problem of food security (Ali and Yan, 2012). A great diversity in morphology and
physiology of maize is resulted in the process of selection. Based on endosperm and glume
characteristics maize is grouped into seven types including dent, flint, flour, sweet, waxy, pop
and pod corn (Acquaah, 2007). These groups are based on quality, quantity and pattern of the
endosperm composition in kernels, except for pod corn which has primitive characteristics.
Mutation at a single locus may alter the composition of endosperm, as in the case of floury (fl)
versus flint (FI), sugary (su) versus starchy (Su), waxy (wx) versus non-waxy (Wx).
16
Popcorn (Zea mays evertaSturt.) or popping corn puffs up upon exposure to heat because
its kernels have a hard moisture-sealed hull and a dense starchy interior. Popcorn has a
distinguished characteristic of large flake formation after kernel popping due to heat. Popcorn
popularity, as a snack food for consumers has increased over the passage of time in developing
countries. Grain yield, popping intensity and popping volume are considered as important
attributes of popcorn. Popcorn needs similar growth requirements as provided to dent corn, with
less adaptability to environmental extremes (Ziegler, 2001).The kernel shape, structure and size
of popcorn make it different from standard grain quality maize. Popcorn is further grouped in
two types: rice-shaped and pearl-shaped popping maize kernels (Acquaah, 2007). Like other
members of family poaceae, the kernel of popcorn contains three major structural parts:
endosperm, germ and pericarp. Pericarp in popcorn grain acts as an outer covering and protective
coat enclosing the kernel and directly takes part in the popping action. During the kernels heat
treatment of popcorn, the pericarp behaves as a vessel under a pressure. The hard moisture-
sealed hull of kernels allows pressure to build inside and explosive “pop” results. Popping of
popcorn kernel occur when inner kernel temperature reach about 177oC. At high temperature the
present moisture in the kernel transforms into steam and provides the force that expands the
grain and breaks the pericarp. The optimum grain moisture content at popping varies over
genotypes, but usually ranges from 12% to 15% (Hoseney et al., 1983). In popcorn the
endosperm has both hard (corneous) and soft (floury) endosperm/starch. Hard endosperm
consists of compact polygonal starch granules, without inter granular spaces. Popcorn, which is
consumed as freshly popped corn, is a relatively minor crop compared to dent corn. The progress
curve of improvement in popcorn for agronomic traits, through selection is slower than that of
standard grain quality maize. The popping expansion or expansion volume of popcorn is the
most important and principal quality parameter, that smake it different from other types of maize.
According to Acquaah (2007), popping expansion is controlled by some dominant genes, and a
greater number of recessive genes, are also involved in the inheritance of other properties, like
flake shape and tenderness and pericarp dispersion at popping.
In cross pollinated species selfing causes inbreeding depression but once inbred lines
become stable and then crossed with genetically diverse inbreds, the result is the expression of
increased hybrid vigor/heterosis. Former researchers remarked genetically effective
improvement, as a result of synthesis, evaluation, selection and recombination of genetically
17
variable families/inbred lines used in maize breeding programs. Pixely et al. (2006) proposed
that superior and genetically improved maize cultivars must engross several desirable traits, at
the same time they also addressed that searching of desirable parents for hybrid combination is a
complicated, tedious and lengthy process. According to Ziegler (2001) breeding strategies used
for development of hybrid popcorn are similar to those used in other corn types. He also
mentioned that although improvement in popcorn agronomic traits is very slow but still breeders
have to keep in mind other important traits like, quality characters including, popping expansion,
freedom from hulls and objectionable flavors, and tenderness of the flakes. Grain yield per unit
area in popcorn is less than that of dent corn yield because the grain is usually small as compared
to the kernel of normal maize. Furthermore, the girth of popcorn compared to normal maize is
less.
Planning and execution of a breeding program requires information on the genetic
systems controlling the character of interest, so that the expected gain can be maximized with
selection process (Viana et al., 1999). An effective breeding program mainly depends on the
knowledge about type of gene action involved in the expression of a specific character. Among
genetic effects, dominance gene action results in hybrid vigor of F1 population over the parents..
Similarly additive gene action indicates an average effect of all loci for a trait so selection in
early generations would be effective in bringing about advantageous changes in character
(Edwards et al., 1976). Such information about genetic variances, levels of dominance, and other
non-additive genetic effects provide a base for better understanding of the gene action involved
in the expression of heterosis (Wolf and Hallauer, 1977).
Besides, other biometrical techniques generation mean analysis (GMA) provide efficient
information about estimation of different genetic effects controlling a trait. It also helps in
calculating the degree of dominance and level of additive effects (Mather and Jinks, 1982). The
genetic information obtained through generation mean analysis play a vital role in designing a
breeding method for the improvement of a desired trait. Gamble (1962) indicated that estimation
of genetic effects always help the plant breeders to decide an effective breeding procedure.
According to Hallauer and Miranda (1988) genetic information obtained through generation
mean analysis or other breeding methodologies, not only provide information about the way in
which genes act and interact with each other but also could be efficiently utilized in breeding
programs.
18
The total genetic variance can be sub-divided into additive, dominance and epistatic
variance (Suzuki et al., 1981). Hallauer and Miranda (1988) estimated epistatic genetic effects in
maize hybrids using (i) triple-test crosses, (ii) making comparison of single, three-way and
double cross hybrids, or (iii) measuring variance components. The original generation means
analysis, proposed by Hayman (1958), measures the different generations derived from a cross
between two pure lines. Lamkey et al., (1995) suggested that epistasis plays a significant role in
elite maize hybrids production. Darrah and Hallauer (1972) observed that dominance effects
were several times larger than additive effects for all crosses in a maize diallel. The relative
magnitude of dominance gene effects was greater than the additive gene effects in the seedling
root characteristics in maize (Rahman et al., 1994). McConnell and Gardner (1979) detected
epistatic gene effects for grain yield in cold tolerant maize while additive and dominance gene
effects contributed significantly to the variation observed for germination and seedling vigor.
Wolf and Hallauer (1977) reported that an epistatic effect could contribute to the expression of
heterosis for specific hybrids. In the study of Darrah and Hallauer (1972), the additive by
additive and dominance by dominance effects for yield components (ear length, ear diameter and
number of kernel per row) were greater than plant height and ear height. Hallauer (1990)
reported that since inbreeding is conducted simultaneously with hybrid evaluations, favorable
epistatic gene combinations can ultimately be fixed in the inbred lines. Epistasis could also
explain why it has been difficult to develop improved recoveries from some maize inbreds
(Melchinger and Gumber, 1988; Lamkey et al., 1995). It seems that epistasis for complex traits,
such as yield, must exist, but realistic estimates of additive by additive epistasis have not been
obtainable. Other studies, however, have shown that epistatic effects are important for the
specific combination of inbred lines (Wolf and Hallauer, 1977; Lamkey et al., 1995; Chen et al.,
1996; Hinze and Lamkey, 2003). Hence, either the genetic models used are inadequate or
epistasis variance is small relative to the total genetic variance of the maize population (Hallauer
and Miranda, 1988). Biometric methods that use mean comparison rather than variance
component estimation (for example, generation mean analysis and triple test cross) have
regularly indicated that epistatic effects are important for grain yield in maize (Eta-Ndu and
Openshaw, 1999).
Due to cross pollinated nature breeding maize for specific traits require great attention of
plant breeders for commercial seed production. To achieve the objectives, an effective selection
19
for specific traits along with some evaluation procedures like: the determination of popping
expansion and flake qualities in popcorn; determination of sugar content and other properties
important for sweet maize; the determination of the oil content in the high-oil types of maize, etc
are mandatory. This study was conducted with the following objectives to;
i. elucidate the pattern of inheritance for yield and yield associated traits in two
groups of maize (popcorn) with diverse origin.
ii. measure the magnitude of various genetic effects in these maize populations.
iii. quantify the magnitude of mid- parent, better-parent heterosis for studied traits.
iv. measure broad and narrow sense heritability estimates for studied characters.
v. measure the phenotypic and genotypic correlations among various parameters.
20
Chapter 2
REVIEW OF LITERATURE
Manifestation of some important genetic parameters including, genetic effects, genetic
and phenotypic correlations, broad and narrow-sense heritability and heterosis of quantitative
characteristics are very essential for a sound and successful breeding program. Several types of
analytical techniques are used for estimation of different genetic attributes among which
generation means analysis is a powerful tool for the estimation of additive, dominance and
epistatic effects in quantitatively inherited traits. Plant breeders are always in search for the
exploitation of additive gene action in a quantitatively inherited trait. Their aim is to improve the
genetic ability of crop plants with high heritability. Narrow sense heritability with high additive
genetic correlation of positive nature is extremely important for long term improvement in maize
populations. Commendable research work on maize for these genetic parameters has been
conducted by several researchers to explore the phenomenon of gene action and serve as foot
marks for future research.
2.1 Gene action
A plant breeder must know about the magnitude and behavior of genetic components for
quantitative characters due to their key role in understanding the inheritance of quantitative traits.
Quantitative traits are usually considered to be controlled by multiple genes and are considerably
influenced with the interaction of environment. Generation mean analysis can be utilized to study
the pattern and magnitude of genetic variation present in a breeding population as well as to
obtain valuable preliminary information about the genetic mechanism involved in the expression
of a trait. The major role in designing a breeding method for the improvement of desired traits is
directly linked with the genetic effects obtained though generation mean analysis and other
biometrical techniques. A number of researchers have studied the mode of gene action in maize
through the pattern of diallel crossing techniques, but studies on the inheritance pattern of genes
through generation mean analysis in maize are meager. Information about gene action in maize
through generation mean analysis is albeit dearth throughout the world.
21
An insight into the magnitude of variability present in a crop species is of utmost
importance as it provides the basis for effective selection. The total variation i.e., phenotypic
variation, present in a population arises due to genotypic and environmental effects. Phenotypic
variability is the observable variation present in a population for a character. Such variability
includes both genotypic and environmental components of variation. Due to a variable nature of
environmental conditions variation can be seen in phenotypic portion of variability under
different environments. In contrast genotypic variability remains approximately same under
changed environments because of the genetic components. It can be said that such portion of
variability is of the main concern of a plant breeder; because it is heritable and can therefore, in
principle, be manipulated in a breeding program. Fisher (1918) divided genetic variance into
three components: additive, dominance and epistatic variance. Additive variance refers to that
portion of genetic variance, which is produced by the deviations due to average effects of the
alleles of the genes at all segregating loci. Dominance variance arises due to the deviation from
the additive scheme of gene action resulting from intra-allelic interaction that is dominance.
Epistatic variance arises due to deviations as a consequence of inter allelic interactions. Hayman
and Mather (1955) further divided the epistatic variance into three components: additive x
additive, additive × dominance and dominance × dominance interactions. While, Wright (1980)
suggested partitioning of genetic variance into: additive and non-additive components and non-
additive component was further divided into dominance and epistatic components, of which only
the additive component contributes to genetic advance under selection. The variability present in
a breeding population can be assessed by three ways. i) by using simple measures of variability:
these measures include the range, variance, standard deviation, standard error and coefficient of
variation. ii) estimating the various components of variance. This involves the crossing of a
number of genotype or strains in a definite fashion and evaluation of progeny thus obtained in
replicated trials. Diallel, partial diallel, line × tester, generation means analyses are used to
estimate the components of genetic variance. e) by studying the genetic diversity within a
population.
Pípolo et al. (2003) assessed nine popcorn genotypes for genetic diversity through
multivariate techniques. The nine genotypes were divided into two groups by the Tocher method
using the generalized Mahalanobis distances. For selecting progressive parents data were
recorded on agronomic traits including popping expansion, popcorn size and grain mass per
22
plant. After using the divergence and these trait scores as criteria for crossing, they
recommended the crosses between genotype 9 (group II) and genotypes 8, 3, 7, and 5 (group I).
Dvojkovic et al. (2004) quantified estimates of gene effects on grain yield components in
two wheat crosses. Eight generations (P1, P2, F1, F2, BC1.1, BC1.2, RBC1.1 and RBC1.2) were
raised and subjected to generation mean analysis for detecting the nature of gene effects in
different traits. In one cross digenic epistatic model was found adequate for grain weight while
additive gene effects in second cross. They expected genetic advance in further segregating
generations in crosses where additive effects with digenic epistasis more accompanied with high
narrow-sense heritability.
Ravikant et al. (2006) planted six generations of maize i.e., P1, P2, F1, F2, BC1 and BC2 to
learn the magnitude and nature of different genetic effects involved in the inheritance of yield
and yield contributing traits using generation means analysis techniques. It was revealed from
their study that most of the characters were controlled by additive type of gene action. They
further added that shelling percentage, grain yield plant-1 and some other traits were governed by
duplicate epistatic genetic effects. Sofi et al. (2006) investigated six generations in maize crosses
(P1, P2, F1, F2, BC1 and BC2) to determine type of gene action and interaction and linkage
relationship between genes for yield and its components through generation means analysis.
They found preponderance of dominant gene actions in the expression of studied traits except,
for days to 50% husk browning (maturity) and 100-grain weight which exhibited the prevalence
of additive type of gene action. Sofi and Rather (2006) studied inheritance of various plant
parameters during evaluation of different maize crosses along with parental lines and testers,
using line x tester analysis procedures. They depicted predominance of non-additive gene action
for most of the traits studied.
Azizi et al. (2006) studied the genetic effects grain yield and other traits through
generation mean analysis in maize inbred lines B73, Mo17 and K74/1 planted at three population
densities. Both additive and dominance effects as well as epistatic some interaction recovered for
most of the trait studied. However, dominant genetic effects were more pronounced than
additive. In both crosses epistasis interactions affected the expression of studied traits under
planting densities.
23
Rangel et al. (2007) evaluated 10 popcorn populations for combining ability and genetic
variability of superior hybrids in a circulant diallel scheme. An experiment was conducted at four
different environments for effects on grain yield, plant height and popping expansion (PE). They
reported that evaluation of treatments at multiple locations fully expressed the present genetic
variability in the studied material. High additive effects were observed for PE and the dominance
effects for grain yield and plant height. UNB2U-C1 × Angela and Braskalb× Angela, showed
high grain yield and popping expansion among the combinations. The predicted mean PE and
GY were highest for hybrid UNB2U-C1 × Angela and the composite formed by these parents
(26.54 mL g-1 and 1,446.09 kg ha-1, respectively).
Miranda et al. (2008) characterized the Brazilian popcorn varieties for genetic variability
and heterotic groups. Ten hybrid combinations, i.e. five parents and five check treatments were
arranged in a randomized complete block design with four replicates at two locations. Both
additive and non-additive effects were reported in the inheritance of grain yield, plant height, ear
height, and husk cover, while only additive effects for popping expansion. Hybrid combinations
between the local variety (Branco) and F2 populations (IAC 112 and Zelia) resulted in the third
and fourth highest values for popping expansion. Based on the genetic variability present in
Brazilian popcorn, effective exploitation of additive and non-additive effects was suggested for
grain yield improvement.
Wattoo et al. (2009) studied the genetic analysis of grain yield and quality traits in maize.
Grain yield was narrated as a complex phenomenon in heterozygous crops like maize, and
phenotypic selection cannot directly improve the characters unless dissected by genetic analysis.
Variance/Co-variance graphs revealed that flowering, plant height and yield traits were
controlled by over dominance type of gene action, while quality traits like protein and oil
contents were under the control of partial dominance with additive type of gene action.
Iqbal et al. (2010) detected epistasis for plant height and leaf area palnt-1 in maize while
using generation mean analysis. Significant dominance effects with their high magnitude were
obtained in all crosses for both traits. All crosses in the study also indicated significant additive ×
dominance effects for leaf area. Significant additive × additive effects were also present in some
crosses for the two traits. The presence of complementary and duplicate gene interactions for leaf
24
area and duplicate gene actions in plant height in most crosses compelled them to propose a
slower improvement through selection.
Haq et al. (2010) determined genetic parameters of yield and other quantitative traits.
Analysis of variance showed that inbred lines differed significantly from each other for all traits.
Non-additive genetic effects were obvious in the inheritance study of plant height, flowering and
yield characters. Directional dominance was observed for all the characters under study. They
proposed the exploitation of heterotic effects due to the over-dominance gene action for all the
studied characters.
Ishfaq (2011) studied the genetic base of flowering traits in maize crop using progenies
(F1, F2, BC1, BC2) from a cross between cytoplasmic male sterile A-line I-401(A) and restorer
line I-318(R). He observed that inheritance of grain yield was controlled by additive, dominant
and epistasis genetic effects while, maturity traits were governed by dominance genes only. In
his study duplicate type of gene actions was predominant over complementary type of digenic
non-allelic interaction. Out of inter-allelic interactions dominance × dominance types were more
pronounced than additive × additive and additive × dominance interaction. He suggested
exploitation of heterosis breeding or recurrent selection due to non-adequacy of simple additive-
dominance model for maturity and grain yield.
Zare et al. (2011) observed over-dominance gene effects for days from silking to
physiological maturity, days from anthesis to physiological maturity, plant height, kernel depth,
number of rows per ear and grain yield. Keeping in mind the obtained results reciprocal recurrent
selection was suggested for days from emergence to physiological maturity and number of
kernels per row, having complete dominance. Ear leaf area and ear length were controlled by
partial dominance, indicating that additive gene effects were more important than non-additive
gene effects for controlling the inheritance of these traits.
Vieira et al. (2011) crossed the popcorn inbred lines in a partial circulant diallel mating
scheme and evaluated for grain yield, popping expansion and resistance to southern rust
(Pucciniapolysora, Pp). Significant general combining ability (GCA) effects were obtained for
grain yield, popping expansion and partial resistance to Pp. Based on predominant additive gene
effects they recommended recurrent selection for their popcorn population improvement.
However, none of lines had outstanding grain yield and popping expansion. Specific combining
25
ability (SCA) was detected for grain yield. The P9.24 × P8.6 might be promising for GY, if
exploited using inter-population breeding methods. They recommended the line P8.5 to form
breeding populations against resistance to Pp.
Khodarahmpour (2011a) studied the genetic effects using Hayman-Jinks method. She
observed significant effects for both “a and b” gene effects for all traits in maize germplasm used
in her study. From her study she recorded that grain yield and plant characters were under
control of dominance gene effects while, over dominance and complete dominance for grain
diameter. Similarly additive gene action with partial dominance were observed for ASI, grain
filling period, grain numbers per row, grain number per ear, grain row number in ear, ear
diameter, grain depth, 1000 grain weight and hektolitr weight traits.
Khodarahmpour (2011b) studied the genetic control of grain yield and other related traits
in maize inbred lines using partial diallel fashion under normal and stressed conditions. She
estimated non-additive genetic effects for grain yield and hektolitrweight under both
environments. Similarly she also observed over-dominance and dominant effects other traits.
Ahmet and Kapar (2011) evaluated 18 hybrid genotypes and four commercial popcorn
cultivars at Black Sea Research Institute in Samsun (Turkey) using complete block design during
2006 and 2008. Significant variation were observed among the genotypes for grain yield,
tasseling time, plant height, grain moisture at harvest, percentage of unpopped kernels and
popping volume. Based on their results they selected the genotypes, TCM-05-01, TCM-05-02,
TCM-05-03, TCM-05-04, TCM-05-05, TCM-05-06, TCM-05-09, TCM-05-10, and TCM-05-12
for multi-location yield testing.
Sher et al. (2012) studied the genetic components of flowering characters in subtropical
maize. They evaluated their material comprising six generations viz. P1, P2, F1, F2, BC1 and
BC2in a randomized complete block design with three replications across two years. They
observed that the inheritance of days to pollen shedding silking, maturity and anthesis silking
interval were under the genetic control of both dominant gene action and epistatic interactions.
They concluded that the obtained dominance nature of genetic control can be effectively utilized
in maize breeding programs for the improvement of studied characters.
Khodarahmpour (2011a) studied the genetic effects using Hayman-Jinks method. She
observed significant effects for both “a and b” gene effects for all traits in maize germplasm used
26
in her study. From her study she recorded that grain yield and plant characters were under
control of dominance gene effects while, over dominance and complete dominance for grain
diameter. Similarly additive gene action with partial dominance were observed for ASI, grain
filling period, grain numbers per row, grain number per ear, grain row number in ear, ear
diameter, grain depth, 1000 grain weight and hektolitr weight traits.
Mousa (2014) evaluated a set of twenty three maize genotypes at two locations for
combining ability estimates according to Griffing (1956) Method-4 Model-1. Significant
genotypes x location were observed for majority of the traits. Although both additive and non-
additive gene action were involved in the inheritance of most of traits, however, non-additive
gene action was predominant than the additive gene action. Based on superior performance he
recommended lines P3 and P5 for developing maize hybrids.
According to Dorri et al. (2014) the major important factors involved in selecting
breeding methods and genetic improvement are relative amount of genetic variability and
presence of non-allelic interactions. Generation mean analysis was used for the inheritance study
of grain yield and some agronomic traits. They reported that dominance variance was more
important than additive variance for most of the traits including ear length, number of kernels per
row, kernel depth, 1000 grain weight and days to anthesis. Due to predominant role of dominant
genes they justified production of hybrid varieties in maize.
Chandal and Mankotia (2014) evaluated local CIMMYT germplasm for combining
ability analysis through test cross performance. They obtained negatively significant GCA results
for plant and ear height in four inbred lines while, positive and significant GCA effects were
observed for grain yield and related attributes like, ear diameter, ear length and number of rows
ear-1. The presence of higher general combining ability variance components (σ²GCA) than that
of SCA variance (σ²SCA) for ear length and grain yield indicated involvement of additive gene
action in the inheritance of these traits. They reported that for ear diameter and number of
rows/ear plant height and ear height were under control of non-additive gene actions indicating
their importance over additive gene action in the inheritance of these traits. Environmental
effects on non-additive type of gene actions were supposed to be more than additive effects.
Haq et al. (2014) explained the inheritance pattern and its relative magnitude of genetic
effects for flowering characters using generation mean analysis in maize. Non-additive effects
27
and epistatic interactions were found responsible in governing the inheritance of days to tasseling
and silking. Two and three of the six crosses exhibited that both additive and non-additive
genetic effects were equally controlling inheritance of days to tasseling and silking, respectively.
They also reported duplicate type of epistasis while having significant value with opposite sign
of h and l. They proposed utilization of inbred lines in hybrid breeding program due to
preponderance of dominant gene action for flowering traits.
Sabolu et al. (2014) studied the inheritance of quality traits of eggplant using generation
mean analysis. Using six populations, P1, P2, F1, F2, B1 and B2 significant digenic interactions
were observed for all the characters in majority of crosses studied. Both additive and dominance
genes were responsible in the inheritance of anthocyanin content, glycol alkaloid content, dry
matter content and reducing sugars in some of the crosses. In heritability estimates high broad
sense heritability was reported in most of the crosses for all the quality traits expressing low
magnitude of dominance and environmental variances. After observing duplicate type of
epistasis for many quality traits they suggested mild selection intensity in the earlier and intense
in the later generations because it marks the progress through selection. They emphasized on
exploitation of additive variance for the improvement of eggplant because it makes possible to
select better individuals at gametic level.
Entringer et al. (2014) explained the implications of climate change on leaf curling in
maize. The data was analyzed according to generation mean analysis in which mean and
variances were estimated by the weighted least square method. They found that leaf curling was
under control of additive gene effects that favor selection and exhibit minimal influence from the
environment.
Hussain et al. (2014) conducted a study on genetic analysis for various morphological
traits in maize using a complete diallel fashion under irrigated and drought conditions. Genetic
analysis of maturity, plant and yield related traits exhibited that over-dominance type of
inheritance under both normal and drought conditions. Heterosis breeding was emphasized for
yield and related traits having over-dominance nature of inheritance.
Akhshi et al. (2014) declared that base of efficient breeding procedure is knowledge of
the genetic system controlling a trait. They determined the genetic effects for yield and its
components in two common bean crosses. They reported the adequacy of six parameter genetic
28
model by obtaining significant difference for scaling tests (A, B, C, and D) in both crosses. They
proposed exploitation of heterosis for seed yield as the non-additive genetic effects were
predominant in nature.
Khan et al. (2014) estimated genetic components for various traits in maize under normal
and water stressed conditions. Positive effects of dominance and additive × additive were
achieved for cell membrane thermo stability, stomatal frequency and leaf water potential while
[d] additive effects for leaf water potential under normal conditions. They suggested
development of synthetic variety based on traits having additive and additive × additive
interaction while, hybrid development for traits with dominance genetic effects. They concluded
that based on genetic effects grain yield may be increased under drought conditions in relation
with stomata frequency, stomata size, cell membrane thermo stability, leaf water potential and
excised leaf water loss.
Haddadia et al. (2014) studied the genetic constitution of some agronomic traits in maize
using half diallel mating design. They reported both additive and non-additive gene actions for
plant height, days to silking, ear height, thousand kernel weight, kernel rows ear-1,ear length, leaf
number and grain yield. However, additive genetic effects were of great importance in traits like
days to silking, kernel weight, kernel rows, ear length and ear height due to their high narrow
sense heritability and low degree of dominance.
Hussain et al. (2015) conducted an experiment in full diallel fashion involving eight
maize inbred lines. They observed that quality traits i.e., protein, tryptophan and lysine
percentage were controlled by additive effects with partial-dominance under both normal and
drought stress conditions. Based on the presence of additive gene action and high narrow sense
heritability they proposed an early generation selection for improvement of these traits.
Wannows et al. (2015) conducted an experiment for the inheritance of different traits in
two yellow maize hybrids during three consecutive growing seasons. They revealed that
additive–dominance model as well as non-allelic gene interactions were adequate to explain the
genetic inheritance of most studied traits. Duplicate type of digenic non-allelic actions in most
studied traits for the two crosses were observed. In their studied traits most were under control of
additive and non-additive gene actions, while dominant genes were also found responsible in
some traits. They suggested intensive selection through later generation for improvement of
29
those characters. High heterosis and low narrow sense heritability in most cases were indicative
of dominance of non-additive gene actions.
2.2 Heritability
In crop improvement, the genetic component of variation is very important since only
this component is transmitted to the next generation and therefore responds to selection.
The extent of the contribution of genotype to the phenotypic variation for a trait in a population
is ordinarily expressed as the ratio of genetic variance to the total variance, i.e. phenotypic
variance, for the trait. This ratio is known as heritability. Thus heritability denotes the proportion
of phenotypic variance that is due to genotype, i.e. heritable. Heritability can be estimated by
three different methods: i) from analysis of variance table of a trial consisting of a large number
of genotypes, ii) By estimating the genotypic variance and environmental variance from the
variances of F2, P1, P2 and F1 generations of a cross, and iii) the parent-offspring regression upon
doubling provides an estimate of heritability. Heritability estimated by these three methods is
known as broad sense heritability and it is valid for homozygous lines or homozygous
population. However, when we are dealing with segregating generations, the genetic variance
consists of additive and dominance components (assuming there is no epistasis). Since in cross-
pollinated crops we develop homozygous lines, the dominance component will not contribute to
the phenotype of homozygous lines derived from a population. Consequently, in such cases, only
the additive component of the genetic variance is relevant. Therefore, for segregating
generations, the ratio of additive component of variance to the total phenotypic variance is a
more appropriate estimate of heritability and it is referred as narrow sense heritability.
Twenty one maize genotypes were evaluated by Debnath and Khan (1991) to study
heritability and genetic advance for flowering traits and yield components in maize. They
observed high heritability estimates for days to silk, plant height, ear height and 1000-grain
weight, moderate levels for ear diameter and number of kernels row-1, and low estimates of
heritability for ear length, kernel rows ear-1 and grain yield.
30
Rodrigues and Chaves (2002) studied genetic parameters while, evaluating one hundred
ninety two half-sib families popcorn populations in a randomized complete block design
with two replications at two locations. Sufficient genetic variability was found for grain yield,
poorly husked ear and broken plants evaluated traits, indicating further exploitation of the
material in maize breeding program. High heritability estimate were observed for popping
expansion than for grain yield, the predicted genetic gain for the latter was superior to
popping expansion because of the higher magnitude of the genetic standard deviation for grain
yield. They expected the release of first popcorn variety with yellow grains in the fifth recurrent
cycle for Rio de Janeiro State.
Mahmood et al. (2004) calculated genetic variability, heritability and genetic advance for
flowering, plant and yield characters. Low to high estimates of broad sense heritability were
observed for different plant characters under study. Highest broad sense heritability estimates
were found in grain yield plant per plant and plant height. High heritability estimates for studied
characters indicated that they were under control of additive genetic effects. They guessed a fast
genetic improvement in studied germplasm.
Twenty diverse maize cultivars obtained from various locations within the Ekiti State
were evaluated at Teaching and Research Farm, University of Ado-Ekiti, Nigeria for various
plant traits (Salami et al., 2007). Low levels of heritability in broad sense were estimated for
days to mid anthesis, days to mid silking, plant height and grain yield. From these low levels of
heritability they noticed that perhaps the heritability estimates would have been improved if the
evaluation had been conducted in multiple environments.
Lorenzana and Bernardo (2008) tested maize test crosses of 119 intermated B73 × Mo17
recombinant inbreds in organic and conventional systems at both Waseca and Lamberton, MN,
in 2006. Low heritability was exhibited under organic production system for grain yield and
higher heritability for root lodging, stay green character and ear height. They suggested
screening of conventional inbreds and hybrids for their performance under organic systems.
Abadi et al. (2011) pointed out the importance of combining abilities and genetic effects
in maize hybrid breeding. Test crosses of S6 generation were evaluated in a randomized complete
31
block design with three replicates. Additive genetic variance was found to be substantially higher
than dominance genetic variance for all of the traits except, days to physiological maturity. From
obtained results it was indicated that additive gene effects were predominant than dominance
effects in controlling forage yield and some other agronomic traits. As additive genetic effects
were prominent therefore, narrow sense heritability estimates closely resembled the broad sense
heritability estimates except for phenological characters. According to them prevalence of
additive genetic effects and medium to high narrow sense heritability selection would be
favorable for yield improvement.
Olakojo and Olaoye (2011) estimated correlation and heritability of agronomic characters
under artificially infested maize inbred lines with Strigalutea. Moderate to high heritability
estimates were observed for striga emergence count and striga syndrome rating. Similarly low
heritability estimates were obtained for tolerance index, days to tasseling, days to silking, kernel
rows per cob and grain yield. Genetic and phenotypic correlation coefficients of striga
emergence count with other agronomic traits were positively significant. They confirmed that
estimates of heritability and correlation were of prime importance in yield improvement under
stress environments.
Idris and Abuali (2011) assessed genetic variability for vegetative, yield and yield
components in maize. Significant differences were found for plant height, stem diameter, kernel
rows per cob and ear length in first season while, for days to flowering and 100-seed weight in
second season. Maximum heritability estimates were reported for stem diameter and days to
flowering in first and second growing season, respectively. They proposed manipulation of
present genetic diversity of tested populations for further improvement in maize breeding.
S1 lines of maize were evaluated at two locations to study heritability estimates of
maturity and morphological traits (Ali et al., 2012). In this study significant differences were
revealed for all the traits except maturity. Moderate heritability was calculated for maturity traits
while, high heritability for plant characters.
Mhike et al. (2012) studied the genetic control of grain yield and related traits under
irrigated and water stressed environments. High heritability estimates were calculated for grain
32
yield, anthesis silking interval, ears per plant and leaf senescence under drought were higher than
in well irrigated conditions. There was a general decline in heritability from per plot values to
across environment values in all traits except, for anthesis silking interval, ears per plant and leaf
senescence under drought. According to them a real picture of superior hybrids could be
achieved through selection across environments.
Bello et al. (2012) addressed the importance of knowledge regarding magnitude of
genetic variability, heritability and genetic gains in selection for grain yield and related traits.
They reported high heritability estimates and genetic advance for grain yield, number of grains
per ear, ear weight, plant and ear heights. Keeping the evidence of additive gene effects for
studied traits early generation selection was proposed for effective selection and improvement
for studied traits.
Ullah et al. (2013) conducted a trial of half sib families derived from a maize variety
Sarhad White. Maximum broad sense heritability were estimated for plant height, moisture
content and kernel weight while, minimum estimates were observed for days to silking, anthesis
and anthesis silking interval. They suggested use of these half-sib families as source for
improvement of maize germplasm.
Khanmohammadi et al. (2013) measured the performance of maize hybrids using grain
yield, yield components and some of morphological traits. High heritability estimates observed
for grains rows per ear, number of inflorescence branches and days to peak period compared to
other traits. Traits having high heritability could be effectively utilized in breeding programs for
maize improvement. They observed highest direct effect of stem diameter on grain yield and
lowest due to the seed depth.
Noor et al. (2013) evaluated half-sib families through recurrent selection program at two
growing seasons. High broad sense heritability estimates were calculated for grain yield, kernel
rows per ear and ear length in first season while, in second season moderate heritability estimates
were observed for all traits except grain yield. The observed response of grain yield calculated in
first season was greater than the expected one. They validated selection for high grain yield
through its positive value of gain per cycle.
33
Berilli et al. (2013) intimated response to selection by evaluating 242 full-sib families
obtained from CIMMYT and Piranao populations. Although they observed no genotype x
environment interactions still there was a considerable amount of genotypic variability and
heritability. According to them high heritability estimates and correlation coefficient were
important genetic parameters for selection and applying a suitable breeding method.
Shukla et al. (2014) estimated heritability for some yield attributing traits. They observed
a considerable amount of diversity in evaluated germplasm for the studied traits. Heritability
estimates in broad sense ranged from low to high for traits they studied. Low heritability
estimates were calculated for kernel rows per ear and prop root while moderate heritability was
reported for ear length. Maximum genetic improvement was expected to be achieved through
direct selection scheme when heritability and genetic advance were of high magnitude in maize
germplasm.
Sharma et al. (2014) assessed different genetic components including heritability, genetic
variability and genetic advance for grain yield and kernel quality. High heritability and genetic
advance were calculated for most of the traits. They proposed that characters like test weight,
grain yield per plant, grains per cob, cob length, grains per row and harvest index should be
utilized in selection programs for improving maize yield.
Nataraj et al. (2014) estimated broad sense heritability, genetic variability and genetic
advance in 39 inbreds of maize. Data were recorded on twelve quantitative traits viz., days to
tasseling, silking, plant and ear height, ear length, ear diameter, ear weight without husk, ear
weight with husk, number of kernel rows per ear, number of kernels per row, 100-grain weight
and grain yield per plant. High broad sense heritability estimates and genetic advance were found
for grain yield per plant, ear height, plant height, number of kernels per row, number of kernel
rows per ear, ear length, 100 grain weight, ear weight with husk and without husk. Due to high
values of heritability genetic advance and genotypic covariance effective selection was expected
for grain yield improvement.
Aminu et al. (2014) investigated heritability estimates and association of different
agronomic traits in a study conducted at two locations. High heritability estimates were observed
34
for days to tasseling, silking, dehusked cobs and grain yield in combined analysis across
locations. However, they revealed moderate heritability estimates for anthesis silking interval,
plant height, weight of cobs and 100 seed weight, respectively. Heritability estimates and
correlations coefficients were proposed to be best genetic parameters for yield improvement and
selection for drought tolerant genotypes.
Ishaq et al. (2014) estimated heritability estimates and expected responses of maturity
and yield related traits in half-sib families of maize. A variable range of heritability estimates
ranging from low too high was observed for studied traits including days to tasseling, silking,
anthesis, plant and ear height, kernels per row, grain yield, 1000 kernel weight and kernels per
ear. High expected responses were accounted for grain yield 1000 kernel weight, plant and ear
height. They presumed the presence of greater genetic differences among the evaluated half-sib
families.
Kumar et al. (2014a) determined genetic variation, broad sense heritability estimates and
genetic advance in maize genotypes. High broad sense heritability estimates were calculated for
grain yield per plant, plant height, ear height, grains per row and 100-kernel weight whereas,
high to moderate heritability estimates were observed for days to tasseling, silking, maturity,
shelling percentage, ear length, ear girth and number of kernel rows per ear. They suggested that
high heritability accompanied with high to moderate genotypic and phenotypic coefficient of
variation and genetic advance is an indication of additive gene effect due to which selection at
early stages would be effective.
Tengan et al. (2014) obtained high broad sense heritability estimates for cob length, cob
diameter, kernel rows per ear, plant and ear height. Similarly they obtained moderate to low
narrow sense heritability estimates for plant height (24%), ear height (34%) and cob length (4%).
Based on obtained results they suggested that selection should be made in suitable segregating
generations to fully exploit the expression of genes for different traits.
Hussain et al (2015) evaluated eight maize inbred lines and their hybrids in full-diallel
fashion under normal and drought stressed conditions. The inheritance of protein, tryptophan and
lysine percentage was controled additively with partial-dominance under both normal and
35
drought stress conditions. Based on high narrow heritability and additive gene action, they
suggested improvement in maize through early generation selection.
Mukambi et al. (2015) assessed the performance of maize across 17 environments under
Striga-infested and Striga-free conditions. Significant difference and high heritability estimates
were observed among genotypes for grain yield and days to silking in both Striga-infested and
Striga-free conditions. They proposed use of IR OPVs for Striga control and benefiting farmers
with high grain yield.
Abadassi (2015) discussed agronomic traits including earliness, reduced plant and ear
heights, resistance to stalk and root lodging, resistance to diseases, weeds and pests, drought
tolerance, excellent husk cover, high and stable grain yield, high harvest index and appropriate
grain quality of maize for utilizing in breeding programs. A variable range of heritability
estimates from low to moderate and high level was calculated for studied traits. They
emphasized on improvement of tropical maize populations for those traits using suitable
breeding methods.
Kruijer et al. (2015) estimated heritability estimates in maize using high-density markers.
In their methodology the main problem was that software assume a single phenotypic value per
genotype, which they solve using mixed models at individual plant or plot level. In their
heritability estimates they obtained very large standard errors which were biologically
unrealistic. They suggested that mixed models at individual plant or plot level were more
realistic with least standard errors and increased genomic predictions.
Abadassi (2015) emphasized on agronomic characters for grain yield improvement of
maize in tropical zone. These traits included earliness, reduced plant and ear heights, resistance
to stalk and root lodging, resistance to diseases, weeds and pests, drought tolerance, excellent
husk cover, high and stable grain yield, high harvest index and appropriate grain quality. Both
additive and dominance as well as epistatic gene effects were obvious for studied traits. A
considerable variation in heritability estimates was observed for different traits in population,
environment and computation method.
36
2.3 Heterosis
Heterosis, or hybrid vigor, is the increased performance of hybrid progeny compared to
their inbred parents (East, 1908; Shull, 1908). Heterosis is manifested as increased size, growth
rate, and other parameters in the F1 generation in crosses between inbred lines (Tollenaar et al.,
2004). Exploitation of heterosis is largely responsible for the tremendous increase in maize yield
in the United States between the1930’s and the 1970’s (Duvick, 2001). Despite the importance of
heterosis, the molecular basis of this phenomenon is unclear (Birchler et al., 2003; Springer and
Stupar, 2007).
In crosses between broad base maize populations by Rezende and Souza (2000), a much
lower expression of heterosis was indicated for grain yield, 6.05%, 7.38%, 8.50% and 8.80%,
respectively. Sheoran et al. (2000) evaluated six generations (P1, P2, F1, F2, BC1 and BC2) of a
cross between two diverse parents in Pearl millet for plant height, girth and length of ear head,
1000-grain weight, days to flowering and grain yield. Positive and significant heterobeltiosis was
found for all traits they studied except, for days to flowering.
Kara (2001) evaluated 18 F1 maize hybrids along with three male testers and six female
inbred lines in line x tester approach for yield and yield components. It was observed that
average heterosis was positive and significant for all the parameters except for days to tasselling.
It was further noticed that hybrids yielded 79.8% above than that of parents yield. Mickelson et
al. (2001) evaluated nine maize populations and their diallel crosses at five Mexico, Zimbabwe
and U.S. locations and observed low to moderate levels of high parent heterosis for grain yield.
Eight inbred lines from diverse geographical regions of India were crossed in all possible
pairs, and F1s were evaluated for yield and yield components in a replicated trial in two
environments (Mohammadi et al., 2002). High heterotic values were observed for yield
compared to its components (100 grain weight and number of kernels ear-1). It further revealed
the importance of over dominance gene action in maize for the expression of heterosis for yield
and its components.
37
To determine heterotic effects for grain yield in maize Koirala and Gurung (2002) studied
7 x 7 population diallel crosses and observed high parent heterosis for grain yield in maize of -
17.8% to 23.9% among population crosses.
Rodrigues and Chaves (2002) investigated heterosis in high quality protein maize
populations of distinct grain type groups. The germplasm was assessed for agronomic traits and
resistance to some leaf diseases in a partial diallel grown at four environments. Significant
genetic effects were observed for mid parent heterosis of grain yield. They recommended the BR
473 and CMS 52 flint populations, the CMS 474 and ZQP 103 dent populations for an inter-
group reciprocal recurrent selection program, while the dent type CMS 474, ZQP 103 and ZQP
101 populations and the flint type BR 473, CMS 455C, CMS 453, CMS 52, CMS 455 and CMS
458 were recommended to form composites.
Dickert and Tracy (2002) crossed six open pollinated varieties of sweet corn in a diallel
fashion to study heterosis and moderate levels of mid-parent heterosis in plant height (9.0%), ear
height (8.6%), ear length (12.9%) and 100-grain weight (10.0%). Very small heterosis was
observed for days to silking indicating that none of the hybrids exhibited earliness than earliest
parental lines.
Rasmussen (2003) intermated twelve improved maize populations including 8 US. Corn
Belt populations and 4 adapted exotic populations and evaluated for both cultivar and among
crosses agronomic performance. High mid-parent heterosis occurred in the BSSS (R) C14 (Reid
yellow dent) x BSCBI (R) C14 (Landcaster Sure crop) cross (73%) with an average yield of 7.53
ha-1.
Tollenaar et al. (2004) evaluated twelve F1 maize hybrids and their 7 parental inbred lines
for grain yield and its component processes, dry matter accumulation (DMA) at maturity, and the
partition of DMA to the grain (i.e., harvest index), as well as in terms of the physiological
processes under lying those two components. High mid parent heterosis was observed for dry
matter accumulation (DMA) and grain yield. Moderate levels of heterosis from 53-58% were
exhibited, respectively by harvest index and dry matter accumulation (DMA) at 14 leaf stage.
They further noticed that days to silking, days to maturity and ear m-2 showed negative heterosis
38
of low levels, whereas heterosis in 1000 kernel weight, however, was of low level but with
positive magnitude.
Soengas et al. (2006) crossed 10 flint maize varieties with two testers (flint and dent) in a
diallel mating design. The objective of their study was focused on developing hybrids to exploit
heterosis between flint and dent germplasm in the Atlantic Coast of Europe. They observed that
two varieties, Gallego and Norteno when crossed with flint inbred line EP42, exhibited
intermediate variety heterosis for adaptive traits like days to silking and kernel moisture at
harvest.
Pajic et al. (2006) started a strategy for selection and improvement of white grain
popcorn. Eight selected populations were evaluated for combining ability and heterosis of plant
height, ear height, grain yield and popping expansion in northwest region of Paraná. The base
populations, the F1 and five controls were evaluated in Maringá, state of Paraná, across two
years. Very low heterosis was calculated for popping expansion and suggested intra-population
selection in BRS Angela and SC 002, to raise the values of popping expansion up to commercial
levels. Similarly for reduction in plant an ear height they proposed and intense inter-population
selection.
During evaluation of F1 crosses derived from four genetically diverse maize inbred lines,
Uzarowska et al. (2007) observed substantial mid-parent heterosis (MPH) for plant height
ranging from 37.9% to 56.4% in the field and 11.1% to 39.5% under controlled green house
conditions.
Springer and Stupar (2007) reviewed the allelic variation in maize and its effect on
heterosis. It has been documented that intraspecific comparisons of sequence and expression
levels in maize has high level of allelic variation, which includes variation for the content of
genic fragments, variation in repetitive elements surrounding genes, and variation in gene
expression levels. The combination of allelic variants provides a more comprehensive suite of
alleles in the hybrid that may be involved in novel allelic interactions. They proposed that it is
still ambiguous that how the combined allelic variation and interactions in a hybrid give rise to
heterotic phenotypes.
39
Pajic et al. (2008) studied popping volume and yield of popcorn inbred lines in diallel
matting system. Analysis of variance of genetic components for popping volume indicated that
the additive as well as dominant components significantly affected the inheritance of this trait in
popcorn. Both additive and non-additive gene effects were found responsive for grain yield in
their study. They suggested that it is difficult to obtain superior genotypes for both traits but it is
possible to develop genotypes with good popping volume and satisfactory yield.
Flint-Garcia et al. (2009) generated about three hundred hybrid genotypes by crossing the
inbred lines from an association mapping panel to a common inbred line, B73. Heterotic effects
were calculated for seventeen phenotypic traits at multiple environments, and found better-parent
heterosis in majority of hybrids. They suggested that the genetic basis of heterosis is trait-
dependent due to weak correlations between the levels of heterosis for different traits.
Vieira et al. (2009) evaluated hybrids and self’s of six popcorn populations. Highly
significant effects were obvious for treatments, varieties and mean heterosis for plant and ear
heights and for the others traits.
Iqbal et al. (2010) meditated heterosis for morphological traits in maize crosses between
inbred lines of contrasting maturities and plant heights across two years. Significant better-parent
heterosis were observed in all the crosses, similarly mid-parent heterosis was also significant for
all traits in all crosses except one cross. They suggested Pop9804xFRW4 as the best hybrid
combination for early maturity and high fodder yield.
Dhasarathan et al. (2012) evaluated twenty one baby corn single cross hybrids along with
their parents for the exploitation of heterosis and heritability. High heterotic effects were
observed for plant height, number of baby corn per plant, baby corn weight, baby corn yield per
plot, reducing sugars and non-reducing sugars. For most of the traits they found high heritability
coupled with genetic advance, indicating a substantial amount of genetic variation in this
population of hybrids. They recommended the hybrids FDM 7 x FDM 14 due to its high genetic
potential and heterosis for certain important characteristics of baby corn.
Aghaei et al. (2012) studied the effect of water deficiency on morphological traits and
average heterosis, in maize hybrids and their parental lines at Agricultural and Natural Resources
40
Research Center of Moghan. Significant differences across environment were exhibited among
genotypes for all the traits. Highest amount of heterosis for grain yield and yield components in
both conditions was observed for single cross 704 (SC704) derived from a cross between MO17
and B73 inbred lines. They proposed SC704 as a suitable hybrid for Moghan region and water
limited conditions.
Shahrokhi and Khorasani (2013) evaluated six generations (P1, P2, F1, F2, BC1 and BC2)
of an early mature hybrid, SC.400 (KE72012 (P1) × K1263/1(P2)), and a late mature hybrid,
SC.704 (B73 (P1) × MO17 (P2)) maize (Zea mays L.), in a RCBD with three replications in
saline and normal environments. The results showed significant differences between generations
both in normal and saline conditions. They observed higher forage yield (88.106 and 60.734
ton/ha in normal and saline conditions, respectively) for the ’BC1 SC.704’ generation (B73 ×
SC.704).
Hussain and Ali (2014) conducted a maize trial to study heterosis and gene action for
days to tasseling, silking, flag leaf area, plant height, number ofrows per ear, number of grains
per row, grain weight and grain yield in two sowing dates. Hybrids were found to have more
genetic variability as compared to their parents. Studied characters were shown to be effected by
over-dominance effects of some genes. Highest heterosis was exhibited by the three hybrid
combinations viz. 1×6, 2×6, 3×4, 3×5 and 3×7 for most of the studied characters at both sowing
dates.
Jain and Bharadwaj (2014) highlighted the importance of degree and direction of hybrid
vigor for its commercial exploitation in quality protein maize. A marked variation was shown in
the expression of standard heterosis for yield and its related characters. Significant and positive
standard heterosis was manifested for grain yield in three crosses. Similarly highest heterotic
effect among the yield components was recorded for number of cobs per plant, followed by cob
length, grain rows per cob and cob weight, respectively. Selection of best parents was found to
be the most important criteria for developing high yielding quality protein maize hybrids.
41
2.4 Correlation
Correlation is an important genetic parameter which is extensively exploited in maize
breeding programs. The expression of a character in a plant is the consequences of a chain of
inter relationships between two or more variables, either directly or through other events.
Correlation studies pave the way to know the associations prevailing between highly heritable
characters with most economic characters. Correlation coefficient analysis helps to determine the
nature and degree of relation between any two measurable characters. Phenotypic correlation
reflects the observed relationship, while genotypic correlations underline the true relationship
among the characters. Knowledge on these will be of immense help in the selection of suitable
plant types.
Sujiprihati et al. (2003) evaluated single crosses derived from (12 × 12) half diallel
crosses in maize inbred lines and observed positive and significant correlation of grain yield
combined and or individual location analysis with plant and ear height, ear weight, ear length,
ear diameter, number of kernels row-1 and 100-grain weight while it was positive but non-
significant with kernel rows ear-1 and shelling percentage. The relationship of yield was
significant but negative with maturity characteristics (days to tasselling, days to silking and days
to maturity). Plant height and ear height showed highly significant and positive correlation with
almost all the characters studied. They also added that flowering characteristics were negatively
correlated with ear characteristics and shelling percentage. The relationship among ear
characteristics remained positive.
Rafique et al. (2004) studied the correlation of grain yield and its components in 49 maize
hybrids and 14 parental lines. Kernels per row was highly positively correlated with grain yield,
followed by plant height, ear height, length and its diameter. They found high heritability
estimates for all parameters showing heritable variation among genotypes. Heritability for
kernels per row, plant height and grain yield per plant was higher than the other characters.
Highly positive and significant association between days to tasseling and silking was
found while evaluating 47 diverse maize genotypes collected from CIMMYT (Sumathi et al.,
2005). These flowering characteristics were positively and significantly related with plant height
42
and 100- seed weight, while with grain yield, number of rows ear-1, number of kernels row-1 and
number of kernels ear-1, the relationship recorded was negative. They observed positive and
significant relationship of ear weight with kernel rows ear-1, kernels row-1 and grain yield while
with 100-seed weight it was significant but negative. Furthermore, the relationship of grain yield
plant-1 was significant and positive with all the yield associated traits except with 100-seed
weight which was significant but negative in nature.
Malik et al. (2005) disclosed the genetic correlation among grain yield and some
quantitative characters. They revealed a positive genetic correlation of grain yield with plant and
ear heights, leaves per plant, leaf length, width and area, ear weight and kernels per row.
Likewise, negative correlation of days to silking & tasselling and grain moisture content at
harvest was observed with grain yield. Due to a strong positive correlation among plant height,
leaf area, leaves per plant, ear weight, kernels per row and grain yield they suggested utilization
of these traits for improving maize grain yield.
Arnhold et al. (2006) studied the genetic correlations of the popping expansion, hundred
kernel weight, grain production and proportion of ears attacked by pests and diseases. They
evaluated 106 families of popcorn and observed a positive association between popping
expansion and grain production. They reported that ears with high pest incidence were positively
associated with grain disease damages. Based on their obtained results, they proposed
simultaneous selection for yield and popping expansion due to the presence positive correlation
between them.
Zaidi et al. (2007) studied association between line per se and hybrids performance under
excessive soil moisture stress in tropical maize. Across moisture regimes, they observed that all
morpho-physiological traits including plant height, days to 50% anthesis, days to 50% silking
and plant maturity had positive and significant correlation with mid parent traits.
Iqbal et al. (2009) unveiled the genetic and phenotypic correlations among physiological
traits in maize. Six generations viz. P1, P2, F1, F2, BC1 and BC2, derived from 4 maize inbred
lines were used in this study of association. They reported negative non-significant correlation of
leaf area with days to flowering and maturity. Significant association of plant height with days to
43
flowering and maturity was reported, while flowering and maturity traits were positively and
significantly correlated. Based on the results they suggested selection of lines with broader
leaves, early flowering and maturity for fodder purposes.
Bocanski et al. (2009) proposed that due to complex inheritance and low heritability of
grain yield and other economic traits in maize, it is of prime importance to have knowledge of
both genotypic and phenotypic coefficients of correlation. They studied the relationship between
grain yield and morphological traits while, conducting an experiment on eight inbred lines and
their hybrids and observed genetic and phenotypic correlations between grain yield and other
studied traits, except between grain yield and number of kernel row. Genotypic and phenotypic
coefficient of correlation between ear length and cob weight were found highly significant.
A trial conducted by Rafiq et al. (2010) revealed significant genetic correlation among
yield characters like ear diameter, ear length, hundred grain weight, kernel rows per ear and
grains per row in maize. Based on results of path analysis, they reported that highest direct effect
on grain yield was exhibited by hundred grain weight followed by kernel rows per ear, grains per
row, ear length and ear diameter. They reported that most of the traits had positive indirect
effects on hundred grain weight, grains per row and kernel rows per ear.
Ngugi et al. (2013) evaluated maize germplasm in drought stress conditions of Kenya in
an alpha lattice design of three replications. Anthesis silking interval (ASI) was found negatively
correlated with grain yield stress tolerance index, geometric mean productivity, mean
productivity and yield stress index. ASI was significantly positively correlated with stress
susceptible index. They extended the probability of combining high yielding, early maturing and
drought tolerant maize for arid and semi-arid areas of Kenya.
Khalili et al. (2013) studied the effect of drought stress on association of grain yield and
related traits in maize. Highest correlation of grain yield was found with kernel rows per ear and
grains per ear both under control stress conditions. They also found a positive and significant
association of harvest index, kernel rows per ear, grains per ear, grains per row and 100 grains
weight with yield under stress. The genetic correlations between grain yield and related traits
was partitioned. Grain yield was effected positively by biological yield, grains per ear and 100
44
grains weight while, plant height, harvest index, grains per row and kernel rows per ear showed
negative direct effect on grain yield. Biological yield and plant height showed a highest and
lowest direct effect, respectively. They suggested that hundred grains weight, grains per ear
should be used as target traits for improvement of maize grain yield under drought stress.
Direct and indirect effects of both genetic and phenotypic association among yield
attributes were investigated by Munawar et al. (2013) through path analysis. They obtained
positively significant genetic and phenotypic correlation of grain yield with cob position, rows
per cob and grains per row. Positive direct effects of cob height, number of grains per row, stem
diameter and cob girth were reported on grain yield while, cob position showed negative direct
effect on grain yield. They proposed that cob position, kernel rows per cob and grains per cob
might be exploited as reliable criteria for improving grain yield.
Positive and significant correlation of grain yield with flag leaf area, ear diameter,
number of kernel rows per ear, number of kernels per ear row and 100-grain weight was found
both at genetic and phenotypic levels Zeeshan et al. (2013). They found that traits showing
significant positive correlation with grain yield, like flag leaf area, ear diameter, number of
kernel rows per ear, number of kernels per ear row and 100-grain weight, were also having
positive direct effects on the grain yield. From such results they indicated that direct selection
for these traits will be responsive for the improvement in grain yield per plant. They obtained
negative direct effects of plant height, number of leaves per plant and grain on grain yield.
Amini et al. (2013) studied the association of grain yield and its components in maize
using six generations. High genetic associations were obvious than phenotypic for most of the
traits studied. A positive correlation of grain yield was observed with plant height and yield
components while, negatively significant correlation were also found among ear seed weight and
seed yield through large negative indirect effects on other yield components.
Kwaga (2014) studied correlation of grain yield with other characters in a field trial
conducted at Mubi, Nigeria. Associations of grain yield with plant height, cob length, cob
diameter and 100 grains weight were positive while, negative correlation was calculated between
yield and days to tasseling.
45
Azam et al. (2014) conducted an experiment to study correlation and path coefficient
analysis of yield and some other traits in maize. Positive and significant correlation of yield per
plant was observed with cob diameter and grains per row. Contrastingly negative correlation of
yield per plant was also found with ear height and days to mid-tasseling. Highest direct and
positive effect was observed for rows per cob. They suggested that being directly correlated cob
diameter, rows per cob, grains per row and ear height should be kept in mind for an effective
selection.
Bekele and Rao (2014) estimated heritability, genetic advance and correlation in maize
under rainfed conditions in two growing seasons. Along with a negative and significant genetic
association between grain yield and oil content high heritability estimates were calculated for
plant height, ear height, number of seeds per row, 100 seed weight, protein content and grain
yield. They proposed that characters like plant height, grain yield per plot and protein content
should be used for effective selection based on their high genetic advance coupled with high
heritability.
Dugje et al. (2014) evaluated the performance of multi-stress tolerant maize varieties in
Nigeria over two growing seasons. Positive and significant correlation was reported between
maturity and plant characters while, ears per plant was negatively correlated with ear weight.
Similarly grain yield was positively correlated with ears per plant, flowering traits, and ear
height. They viewed that selection criteria used by farmers of the acceptance of any variety
include Striga tolerance, nutrient value, drought tolerance, flour value, good taste, high yield and
early maturity.
According to Kumar et al. (2014b) maize grain yield per plot was positively associated
with plant and ear height, ear length, ear girth, kernels per row, kernel rows per ear, hundred
kernel weight, days to maturity and shelling percentage. They observed negative association of
grain yield with days to tasseling and silking. They reported that largest direct effect on grain
yield at phenotypic level was due to 100-kernel weight followed by number of kernels per row
and ear girth while, days to tasseling, silking and maturity revealed a negative direct effect on
grain yield.
46
Nzuve et al. (2014) determined the genetic control of inheritance of grain yield and
related agronomic traits in maize F1 hybrids along with their parents at three locations in Kenya.
Positive correlation of grain yield was found with ear and plant height, indicating better grain
yield for taller plants compared to stunt one. Taller plants were suggested to have high dry matter
accumulation due to which they produced better yield. They proposed development of
composites and synthetics exploiting positively related traits in further breeding programs for
resource constrained maize farmers.
Abdullah et al. (2015) compared morphological characters in an experiment on maize
crop planted in two consecutive seasons. Correlation analysis revealed that grain yield was in
strong correlation with 100 grains weight, number of grains per ear and number of grains per row
in both years.
Ohunakin and Abedisi (2015) studied partitioning of assimilates in relation to grain yield.
They recorded data on phenology (percentage emergence, days to anthesis, days to silking and
days to grain harvest); plant characters (plant height, number of leaves, leaf area and stem girth);
total nitrogen uptake and yield (plant wet weight, plant dry matter, cob weight and total seed
weight). The association of paired parameters was calculated, and it was found that intra-
parameter correlations from plant growth, phenology and yield as well as paired inter-parameter
correlations between plant growth and yield were positively correlated. Negative correlation was
found between phenology and growth parameters, and between phenology and yield characters.
Bello (2015) studied genetic components, heterosis and correlation among different traits
in maize. Positively significant correlations were reported between grain yield with maturity,
Plant and yield related traits. It indicated that these traits could be used indirectly for the
improvement of grain yield. They calculated 19.4% regression coefficient for all agronomic
characters contributing to grain yield of maize. They confirmed that genetic parameters like
genotypic and phenotypic correlation coefficients, combining abilities, heterosis and regression
analyses were suitable models for yield improvement in maize breeding.
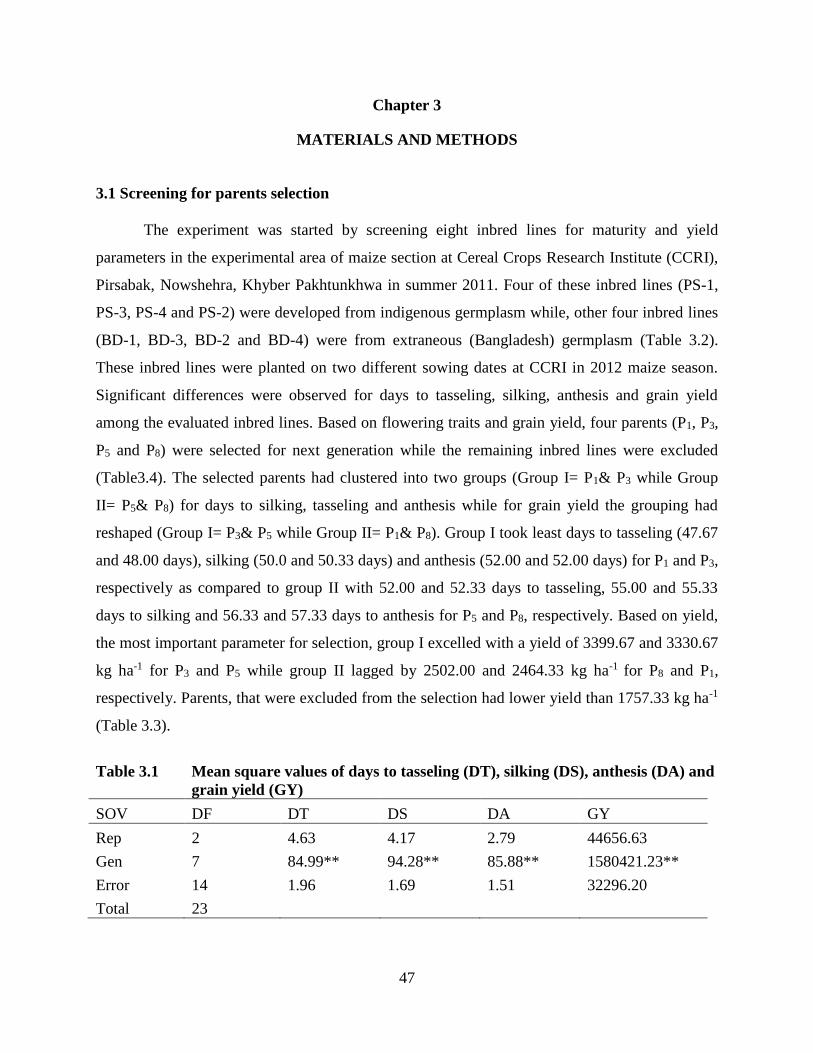
47
Chapter 3
MATERIALS AND METHODS
3.1 Screening for parents selection
The experiment was started by screening eight inbred lines for maturity and yield
parameters in the experimental area of maize section at Cereal Crops Research Institute (CCRI),
Pirsabak, Nowshehra, Khyber Pakhtunkhwa in summer 2011. Four of these inbred lines (PS-1,
PS-3, PS-4 and PS-2) were developed from indigenous germplasm while, other four inbred lines
(BD-1, BD-3, BD-2 and BD-4) were from extraneous (Bangladesh) germplasm (Table 3.2).
These inbred lines were planted on two different sowing dates at CCRI in 2012 maize season.
Significant differences were observed for days to tasseling, silking, anthesis and grain yield
among the evaluated inbred lines. Based on flowering traits and grain yield, four parents (P1, P3,
P5 and P8) were selected for next generation while the remaining inbred lines were excluded
(Table3.4). The selected parents had clustered into two groups (Group I= P1& P3 while Group
II= P5& P8) for days to silking, tasseling and anthesis while for grain yield the grouping had
reshaped (Group I= P3& P5 while Group II= P1& P8). Group I took least days to tasseling (47.67
and 48.00 days), silking (50.0 and 50.33 days) and anthesis (52.00 and 52.00 days) for P1 and P3,
respectively as compared to group II with 52.00 and 52.33 days to tasseling, 55.00 and 55.33
days to silking and 56.33 and 57.33 days to anthesis for P5 and P8, respectively. Based on yield,
the most important parameter for selection, group I excelled with a yield of 3399.67 and 3330.67
kg ha-1 for P3 and P5 while group II lagged by 2502.00 and 2464.33 kg ha-1 for P8 and P1,
respectively. Parents, that were excluded from the selection had lower yield than 1757.33 kg ha-1
(Table 3.3).
Table 3.1 Mean square values of days to tasseling (DT), silking (DS), anthesis (DA) and
grain yield (GY)
SOV DF DT DS DA GY
Rep 2 4.63 4.17 2.79 44656.63
Gen 7 84.99** 94.28** 85.88** 1580421.23**
Error 14 1.96 1.69 1.51 32296.20
Total 23
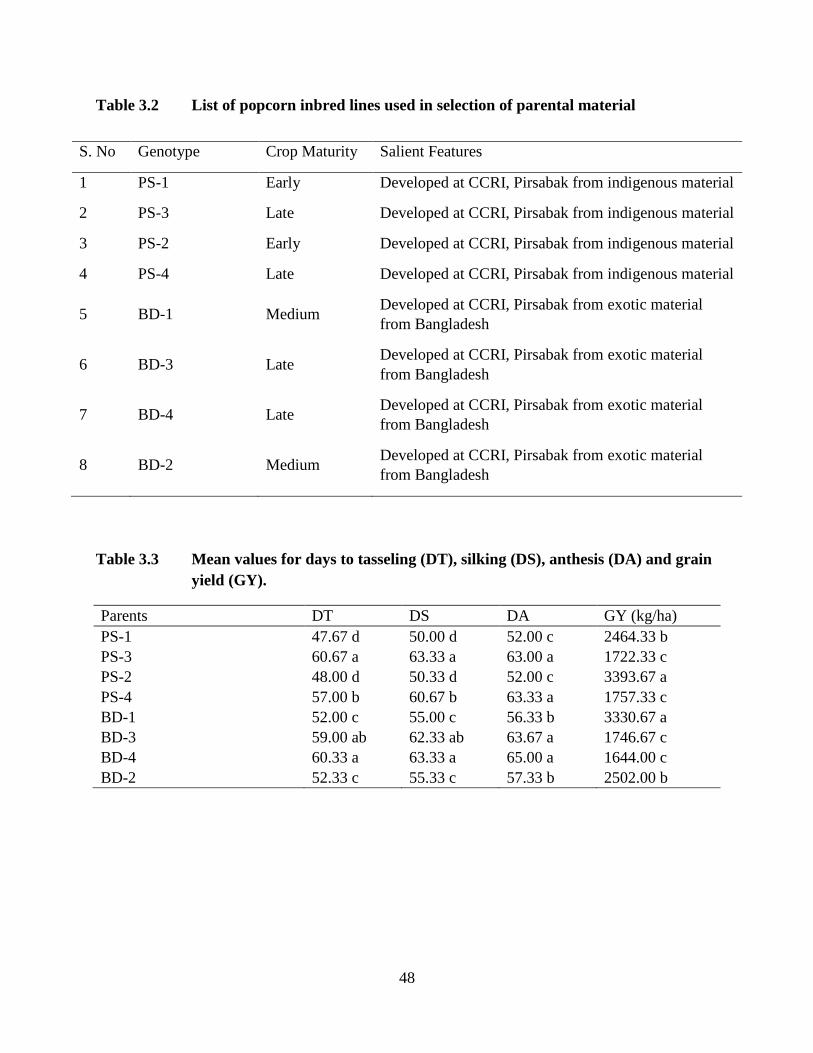
48
Table 3.2 List of popcorn inbred lines used in selection of parental material
S. No Genotype Crop Maturity Salient Features
1 PS-1 Early Developed at CCRI, Pirsabak from indigenous material
2 PS-3 Late Developed at CCRI, Pirsabak from indigenous material
3 PS-2 Early Developed at CCRI, Pirsabak from indigenous material
4 PS-4 Late Developed at CCRI, Pirsabak from indigenous material
5 BD-1 Medium Developed at CCRI, Pirsabak from exotic material
from Bangladesh
6 BD-3 Late Developed at CCRI, Pirsabak from exotic material
from Bangladesh
7 BD-4 Late Developed at CCRI, Pirsabak from exotic material
from Bangladesh
8 BD-2 Medium Developed at CCRI, Pirsabak from exotic material
from Bangladesh
Table 3.3 Mean values for days to tasseling (DT), silking (DS), anthesis (DA) and grain
yield (GY).
Parents DT DS DA GY (kg/ha)
PS-1 47.67 d 50.00 d 52.00 c 2464.33 b
PS-3 60.67 a 63.33 a 63.00 a 1722.33 c
PS-2 48.00 d 50.33 d 52.00 c 3393.67 a
PS-4 57.00 b 60.67 b 63.33 a 1757.33 c
BD-1 52.00 c 55.00 c 56.33 b 3330.67 a
BD-3 59.00 ab 62.33 ab 63.67 a 1746.67 c
BD-4 60.33 a 63.33 a 65.00 a 1644.00 c
BD-2 52.33 c 55.33 c 57.33 b 2502.00 b
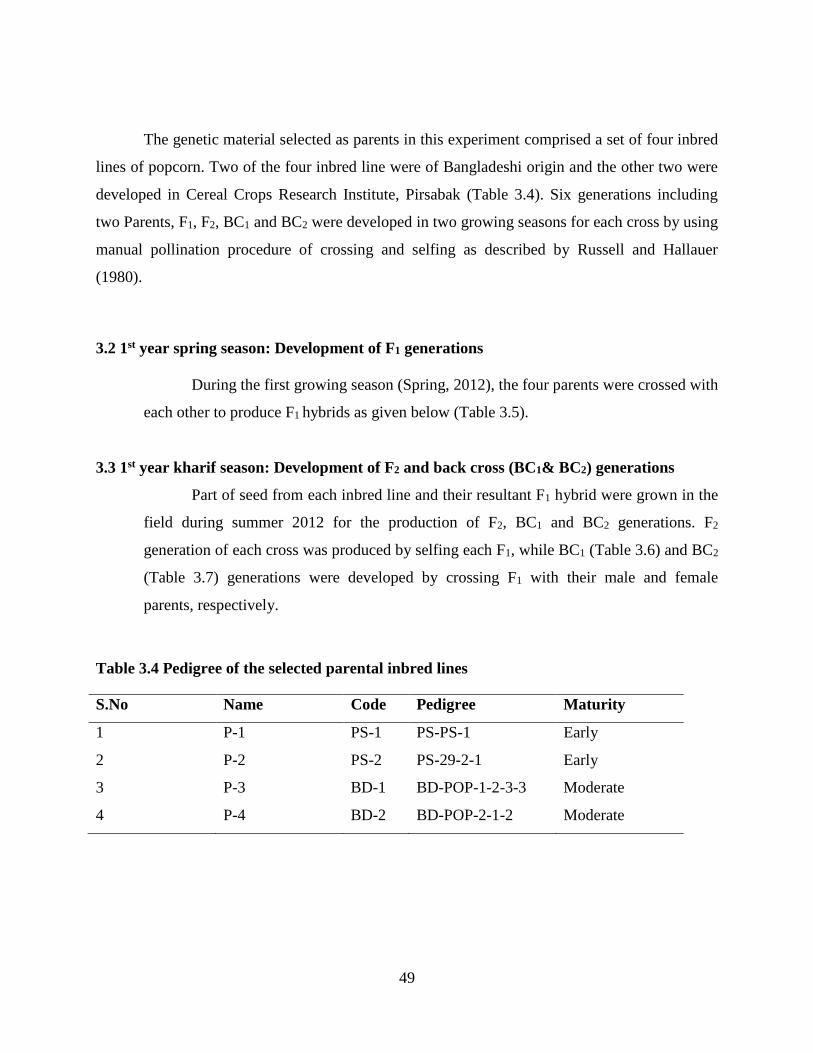
49
The genetic material selected as parents in this experiment comprised a set of four inbred
lines of popcorn. Two of the four inbred line were of Bangladeshi origin and the other two were
developed in Cereal Crops Research Institute, Pirsabak (Table 3.4). Six generations including
two Parents, F1, F2, BC1 and BC2 were developed in two growing seasons for each cross by using
manual pollination procedure of crossing and selfing as described by Russell and Hallauer
(1980).
3.2 1st year spring season: Development of F1 generations
During the first growing season (Spring, 2012), the four parents were crossed with
each other to produce F1 hybrids as given below (Table 3.5).
3.3 1st year kharif season: Development of F2 and back cross (BC1& BC2) generations
Part of seed from each inbred line and their resultant F1 hybrid were grown in the
field during summer 2012 for the production of F2, BC1 and BC2 generations. F2
generation of each cross was produced by selfing each F1, while BC1 (Table 3.6) and BC2
(Table 3.7) generations were developed by crossing F1 with their male and female
parents, respectively.
Table 3.4 Pedigree of the selected parental inbred lines
S.No Name Code Pedigree Maturity
1 P-1 PS-1 PS-PS-1 Early
2 P-2 PS-2 PS-29-2-1 Early
3 P-3 BD-1 BD-POP-1-2-3-3 Moderate
4 P-4 BD-2 BD-POP-2-1-2 Moderate
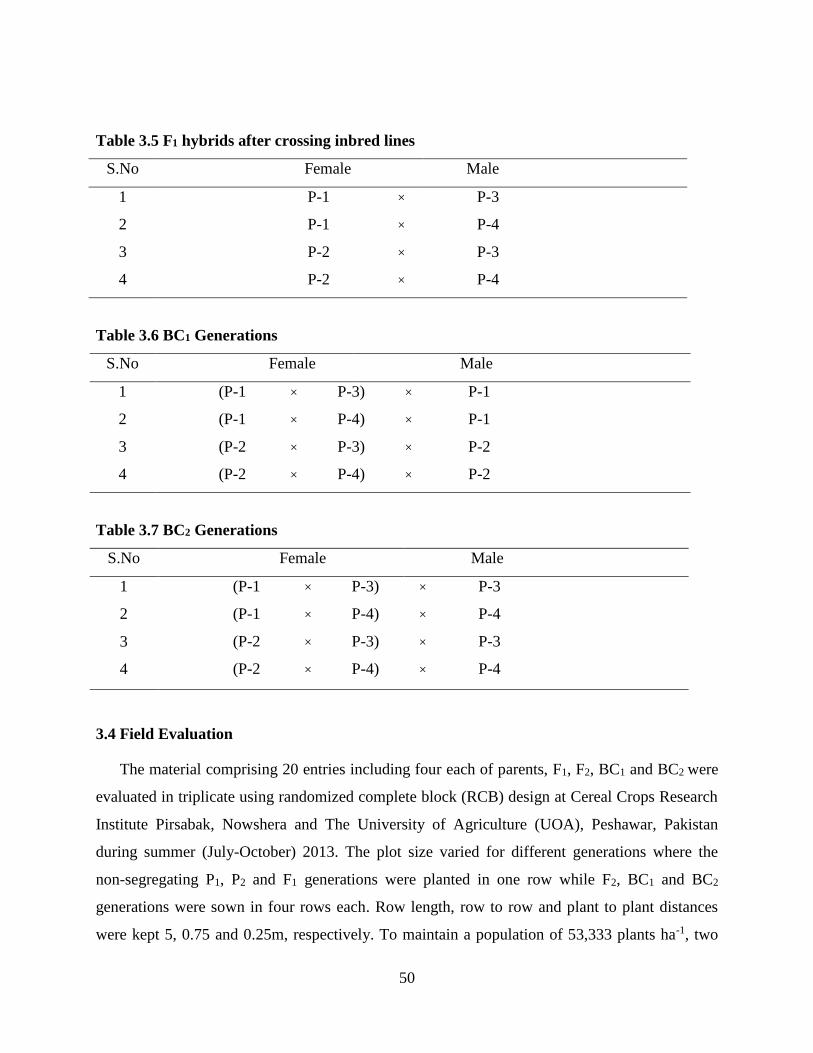
50
Table 3.5 F1 hybrids after crossing inbred lines
S.No Female Male
1 P-1 × P-3
P-1 × P-4
P-2 × P-3
P-2 × P-4
2
3
4
Table 3.6 BC1 Generations
S.No Female Male
1 (P-1 × P-3) × P-1
2 (P-1 × P-4) × P-1
(P-2 × P-3) × P-2
(P-2 × P-4) × P-2
3
4
Table 3.7 BC2 Generations
S.No Female Male
1 (P-1 × P-3) × P-3
(P-1 × P-4) × P-4
(P-2 × P-3) × P-3
(P-2 × P-4) × P-4
2
3
4
3.4 Field Evaluation
The material comprising 20 entries including four each of parents, F1, F2, BC1 and BC2 were
evaluated in triplicate using randomized complete block (RCB) design at Cereal Crops Research
Institute Pirsabak, Nowshera and The University of Agriculture (UOA), Peshawar, Pakistan
during summer (July-October) 2013. The plot size varied for different generations where the
non-segregating P1, P2 and F1 generations were planted in one row while F2, BC1 and BC2
generations were sown in four rows each. Row length, row to row and plant to plant distances
were kept 5, 0.75 and 0.25m, respectively. To maintain a population of 53,333 plants ha-1, two
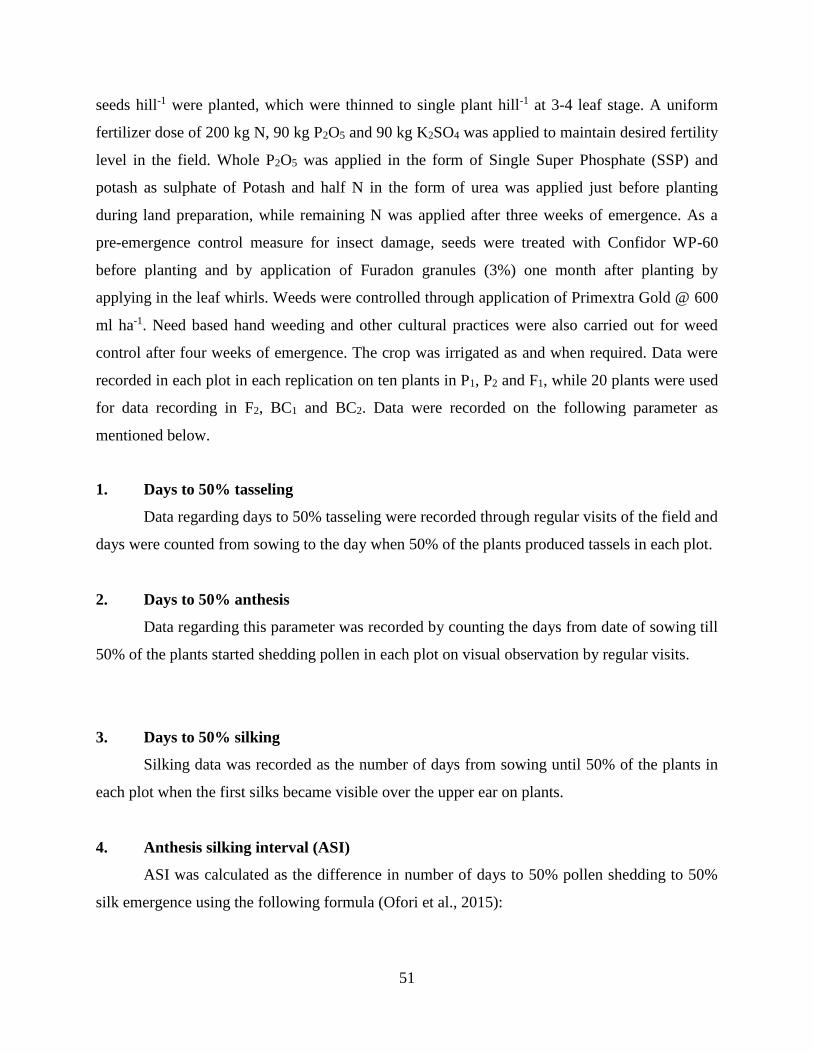
51
seeds hill-1 were planted, which were thinned to single plant hill-1 at 3-4 leaf stage. A uniform
fertilizer dose of 200 kg N, 90 kg P2O5 and 90 kg K2SO4 was applied to maintain desired fertility
level in the field. Whole P2O5 was applied in the form of Single Super Phosphate (SSP) and
potash as sulphate of Potash and half N in the form of urea was applied just before planting
during land preparation, while remaining N was applied after three weeks of emergence. As a
pre-emergence control measure for insect damage, seeds were treated with Confidor WP-60
before planting and by application of Furadon granules (3%) one month after planting by
applying in the leaf whirls. Weeds were controlled through application of Primextra Gold @ 600
ml ha-1. Need based hand weeding and other cultural practices were also carried out for weed
control after four weeks of emergence. The crop was irrigated as and when required. Data were
recorded in each plot in each replication on ten plants in P1, P2 and F1, while 20 plants were used
for data recording in F2, BC1 and BC2. Data were recorded on the following parameter as
mentioned below.
1. Days to 50% tasseling
Data regarding days to 50% tasseling were recorded through regular visits of the field and
days were counted from sowing to the day when 50% of the plants produced tassels in each plot.
2. Days to 50% anthesis
Data regarding this parameter was recorded by counting the days from date of sowing till
50% of the plants started shedding pollen in each plot on visual observation by regular visits.
3. Days to 50% silking
Silking data was recorded as the number of days from sowing until 50% of the plants in
each plot when the first silks became visible over the upper ear on plants.
4. Anthesis silking interval (ASI)
ASI was calculated as the difference in number of days to 50% pollen shedding to 50%
silk emergence using the following formula (Ofori et al., 2015):

52
anthesis 50% toDays- silking 50% toDays = ASI
5. Plant height (cm)
Plant height was recorded on ten randomly selected plants in each plot of P1, P2 and F1
with the help of measuring rod as the distance in cm from base of the plant to node of flag leaf,
while twenty plants were taken into consideration in F2, BC1 and BC2.
6. Ear height (cm)
Ear height was measured in cm through measuring rod from ground level to node bearing
the upper most ear. Ten randomly selected plants were averaged for each plot in P1, P2 and F1,
while twenty plants in F2, BC1 and BC2.
7. Days to maturity
Days to maturity were recorded as the number of days from planting to maturity when a
black layer was observed in the grains of the mid portion of the ear.
8. Fresh ear weight at harvest (g)
Ear weight was taken at harvest by weighing the individual ear in grams with the help of
weighing balance.
9. Grain moisture at harvest (%)
Moisture content of grains was determined at the time of harvest by grain moisture tester
after shelling of the middle rows in randomly selected ears.
10. Shelling percentage
Grains from 10 randomly selected ears of each treatment were shelled after drying and shelling
percentage was calculated following John (1991).
100cobs) of Weight + grains of(Weight
grains ofWeight =(%) Shelling
11. Ear diameter (cm)
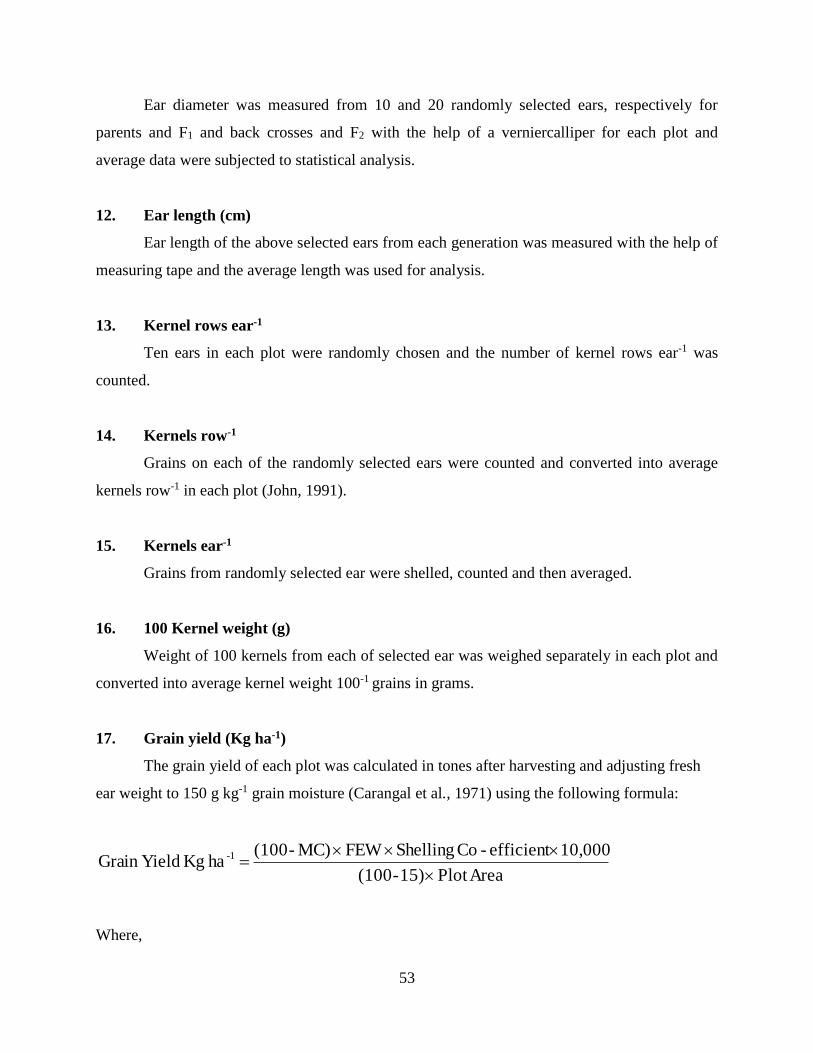
53
Ear diameter was measured from 10 and 20 randomly selected ears, respectively for
parents and F1 and back crosses and F2 with the help of a verniercalliper for each plot and
average data were subjected to statistical analysis.
12. Ear length (cm)
Ear length of the above selected ears from each generation was measured with the help of
measuring tape and the average length was used for analysis.
13. Kernel rows ear-1
Ten ears in each plot were randomly chosen and the number of kernel rows ear-1 was
counted.
14. Kernels row-1
Grains on each of the randomly selected ears were counted and converted into average
kernels row-1 in each plot (John, 1991).
15. Kernels ear-1
Grains from randomly selected ear were shelled, counted and then averaged.
16. 100 Kernel weight (g)
Weight of 100 kernels from each of selected ear was weighed separately in each plot and
converted into average kernel weight 100-1 grains in grams.
17. Grain yield (Kg ha-1)
The grain yield of each plot was calculated in tones after harvesting and adjusting fresh
ear weight to 150 g kg-1 grain moisture (Carangal et al., 1971) using the following formula:
AreaPlot 15) - (100
10,000 efficient -Co Shelling FEW MC)-(100 ha Kg YieldGrain 1
-
Where,
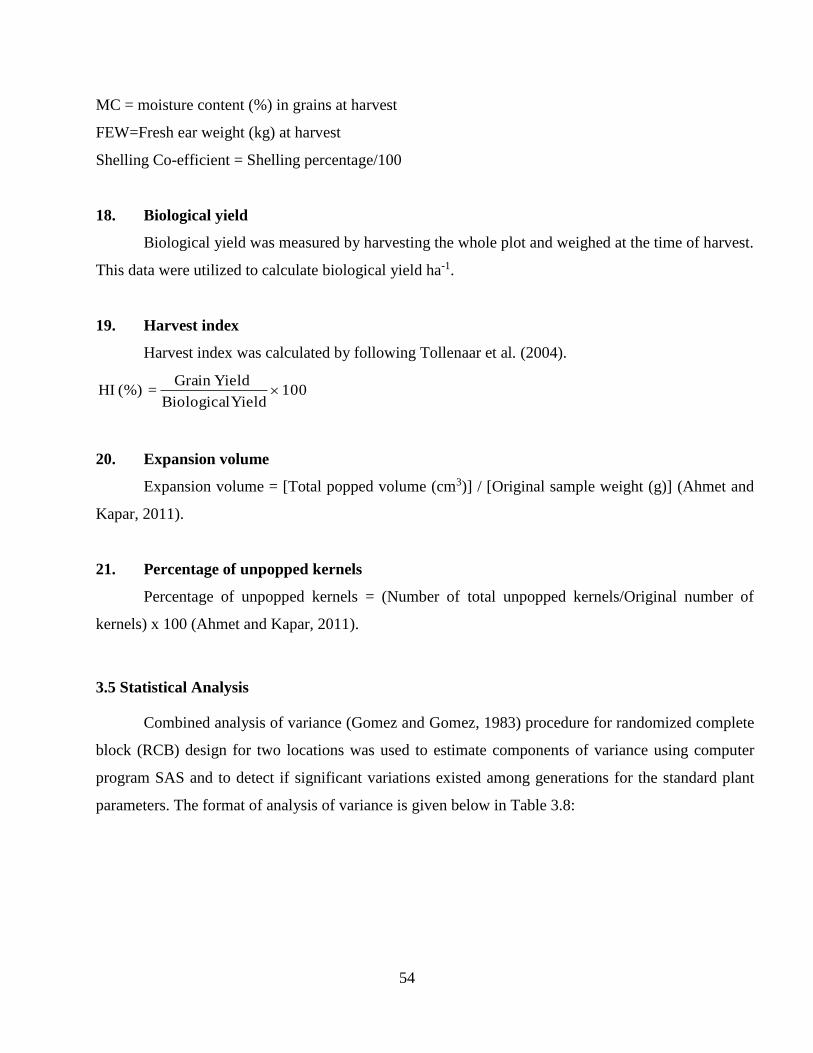
54
MC = moisture content (%) in grains at harvest
FEW=Fresh ear weight (kg) at harvest
Shelling Co-efficient = Shelling percentage/100
18. Biological yield
Biological yield was measured by harvesting the whole plot and weighed at the time of harvest.
This data were utilized to calculate biological yield ha-1.
19. Harvest index
Harvest index was calculated by following Tollenaar et al. (2004).
100Yield Biological
YieldGrain = (%) HI
20. Expansion volume
Expansion volume = [Total popped volume (cm3)] / [Original sample weight (g)] (Ahmet and
Kapar, 2011).
21. Percentage of unpopped kernels
Percentage of unpopped kernels = (Number of total unpopped kernels/Original number of
kernels) x 100 (Ahmet and Kapar, 2011).
3.5 Statistical Analysis
Combined analysis of variance (Gomez and Gomez, 1983) procedure for randomized complete
block (RCB) design for two locations was used to estimate components of variance using computer
program SAS and to detect if significant variations existed among generations for the standard plant
parameters. The format of analysis of variance is given below in Table 3.8:
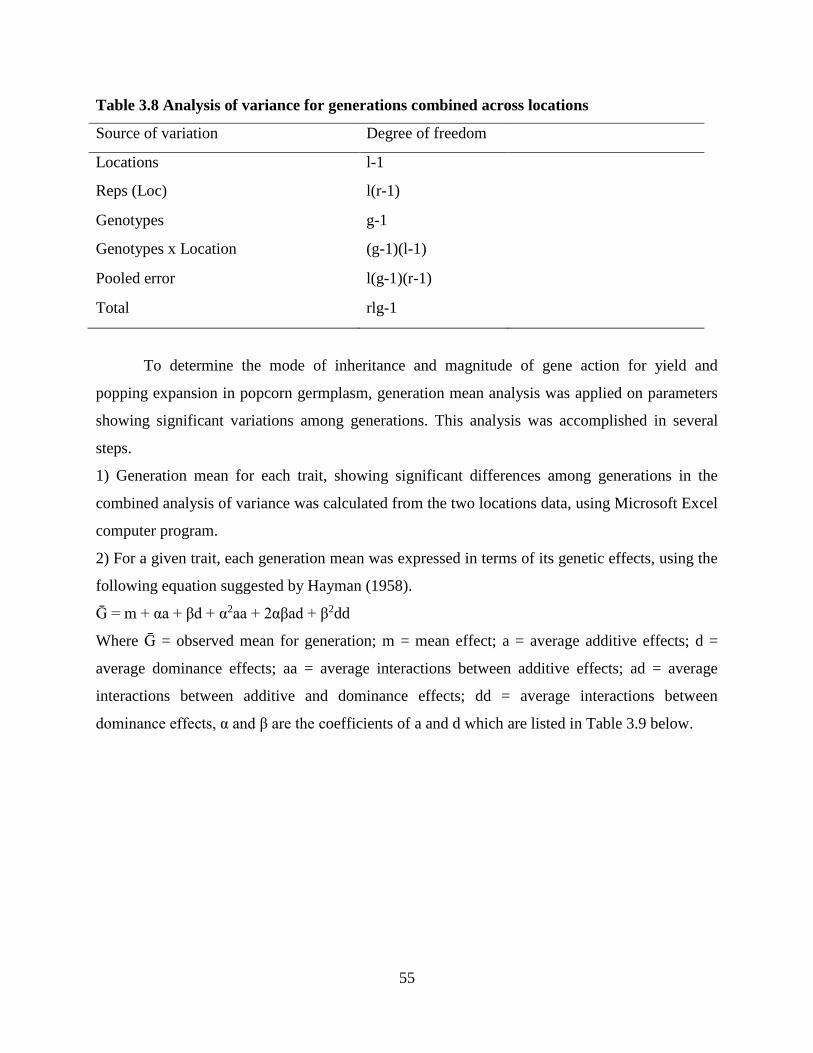
55
Table 3.8 Analysis of variance for generations combined across locations
Source of variation Degree of freedom
Locations l-1
Reps (Loc) l(r-1)
Genotypes g-1
Genotypes x Location (g-1)(l-1)
Pooled error l(g-1)(r-1)
Total rlg-1
To determine the mode of inheritance and magnitude of gene action for yield and
popping expansion in popcorn germplasm, generation mean analysis was applied on parameters
showing significant variations among generations. This analysis was accomplished in several
steps.
1) Generation mean for each trait, showing significant differences among generations in the
combined analysis of variance was calculated from the two locations data, using Microsoft Excel
computer program.
2) For a given trait, each generation mean was expressed in terms of its genetic effects, using the
following equation suggested by Hayman (1958).
Ḡ = m + αa + βd + α2aa + 2αβad + β2dd
Where Ḡ = observed mean for generation; m = mean effect; a = average additive effects; d =
average dominance effects; aa = average interactions between additive effects; ad = average
interactions between additive and dominance effects; dd = average interactions between
dominance effects, α and β are the coefficients of a and d which are listed in Table 3.9 below.
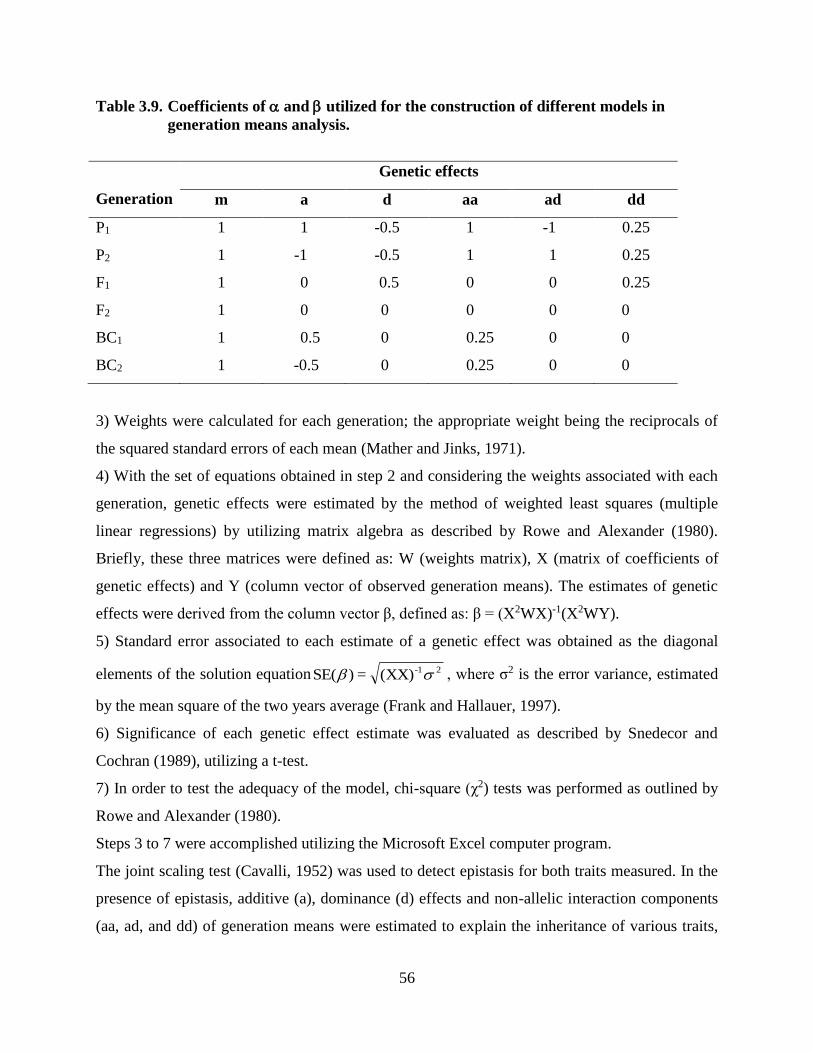
56
Table 3.9. Coefficients of and utilized for the construction of different models in
generation means analysis.
Generation
Genetic effects
m a d aa ad dd
P1 1 1 -0.5 1 -1 0.25
P2 1 -1 -0.5 1 1 0.25
F1 1 0 0.5 0 0 0.25
F2 1 0 0 0 0 0
BC1 1 0.5 0 0.25 0 0
BC2 1 -0.5 0 0.25 0 0
3) Weights were calculated for each generation; the appropriate weight being the reciprocals of
the squared standard errors of each mean (Mather and Jinks, 1971).
4) With the set of equations obtained in step 2 and considering the weights associated with each
generation, genetic effects were estimated by the method of weighted least squares (multiple
linear regressions) by utilizing matrix algebra as described by Rowe and Alexander (1980).
Briefly, these three matrices were defined as: W (weights matrix), X (matrix of coefficients of
genetic effects) and Y (column vector of observed generation means). The estimates of genetic
effects were derived from the column vector β, defined as: β = (X2WX)-1(X2WY).
5) Standard error associated to each estimate of a genetic effect was obtained as the diagonal
elements of the solution equation 2-1(XX) = )SE( , where σ2 is the error variance, estimated
by the mean square of the two years average (Frank and Hallauer, 1997).
6) Significance of each genetic effect estimate was evaluated as described by Snedecor and
Cochran (1989), utilizing a t-test.
7) In order to test the adequacy of the model, chi-square (χ2) tests was performed as outlined by
Rowe and Alexander (1980).
Steps 3 to 7 were accomplished utilizing the Microsoft Excel computer program.
The joint scaling test (Cavalli, 1952) was used to detect epistasis for both traits measured. In the
presence of epistasis, additive (a), dominance (d) effects and non-allelic interaction components
(aa, ad, and dd) of generation means were estimated to explain the inheritance of various traits,
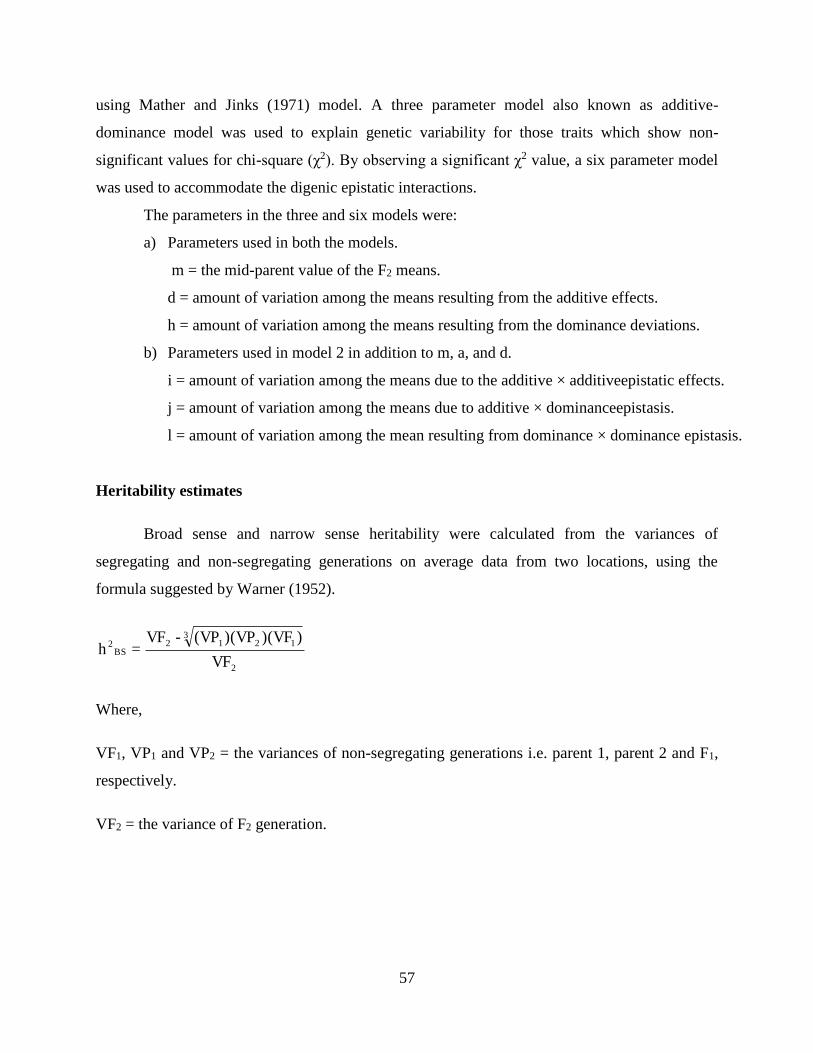
57
using Mather and Jinks (1971) model. A three parameter model also known as additive-
dominance model was used to explain genetic variability for those traits which show non-
significant values for chi-square (χ2). By observing a significant χ2 value, a six parameter model
was used to accommodate the digenic epistatic interactions.
The parameters in the three and six models were:
a) Parameters used in both the models.
m = the mid-parent value of the F2 means.
d = amount of variation among the means resulting from the additive effects.
h = amount of variation among the means resulting from the dominance deviations.
b) Parameters used in model 2 in addition to m, a, and d.
i = amount of variation among the means due to the additive × additiveepistatic effects.
j = amount of variation among the means due to additive × dominanceepistasis.
l = amount of variation among the mean resulting from dominance × dominance epistasis.
Heritability estimates
Broad sense and narrow sense heritability were calculated from the variances of
segregating and non-segregating generations on average data from two locations, using the
formula suggested by Warner (1952).
2
31212
BS2
VF
))(VF)(VP(VP-VF=h
Where,
VF1, VP1 and VP2 = the variances of non-segregating generations i.e. parent 1, parent 2 and F1,
respectively.
VF2 = the variance of F2 generation.
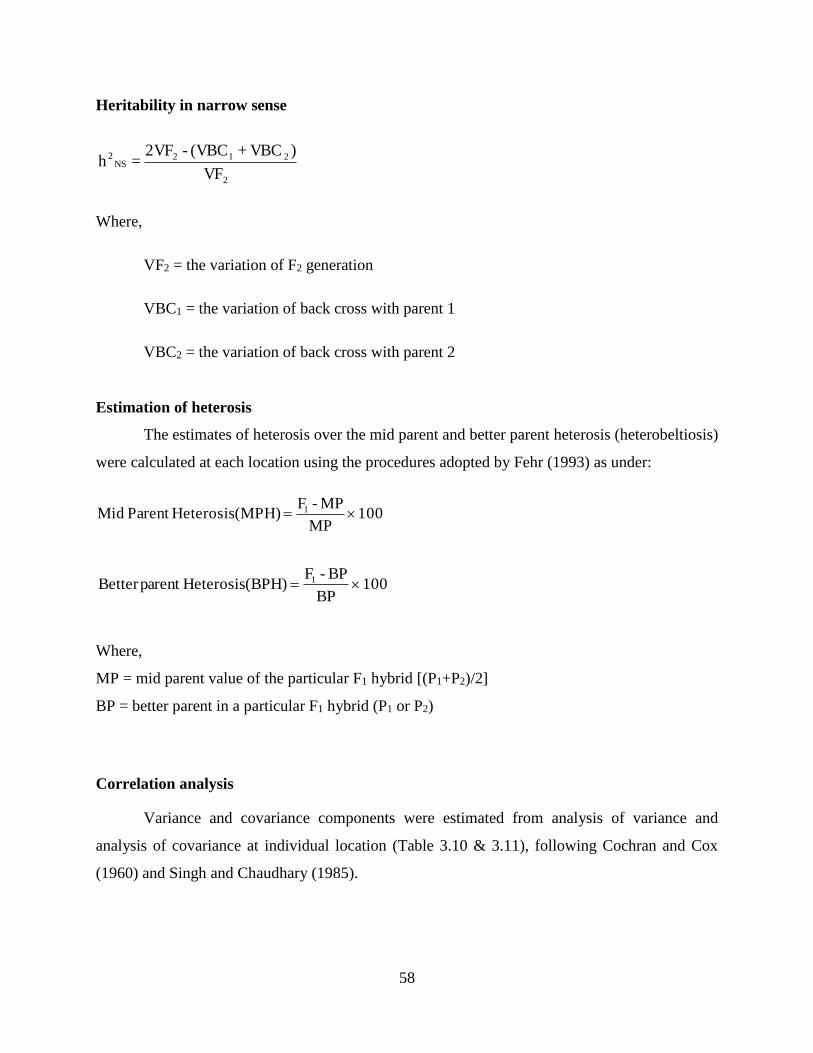
58
Heritability in narrow sense
VF
)VBC + (VBC -2VF = h
2
212NS
2
Where,
VF2 = the variation of F2 generation
VBC1 = the variation of back cross with parent 1
VBC2 = the variation of back cross with parent 2
Estimation of heterosis
The estimates of heterosis over the mid parent and better parent heterosis (heterobeltiosis)
were calculated at each location using the procedures adopted by Fehr (1993) as under:
100BP
BP - F(BPH) Heterosisparent Better 1
Where,
MP = mid parent value of the particular F1 hybrid [(P1+P2)/2]
BP = better parent in a particular F1 hybrid (P1 or P2)
Correlation analysis
Variance and covariance components were estimated from analysis of variance and
analysis of covariance at individual location (Table 3.10 & 3.11), following Cochran and Cox
(1960) and Singh and Chaudhary (1985).
100MP
MP - F(MPH) HeterosisParent Mid 1
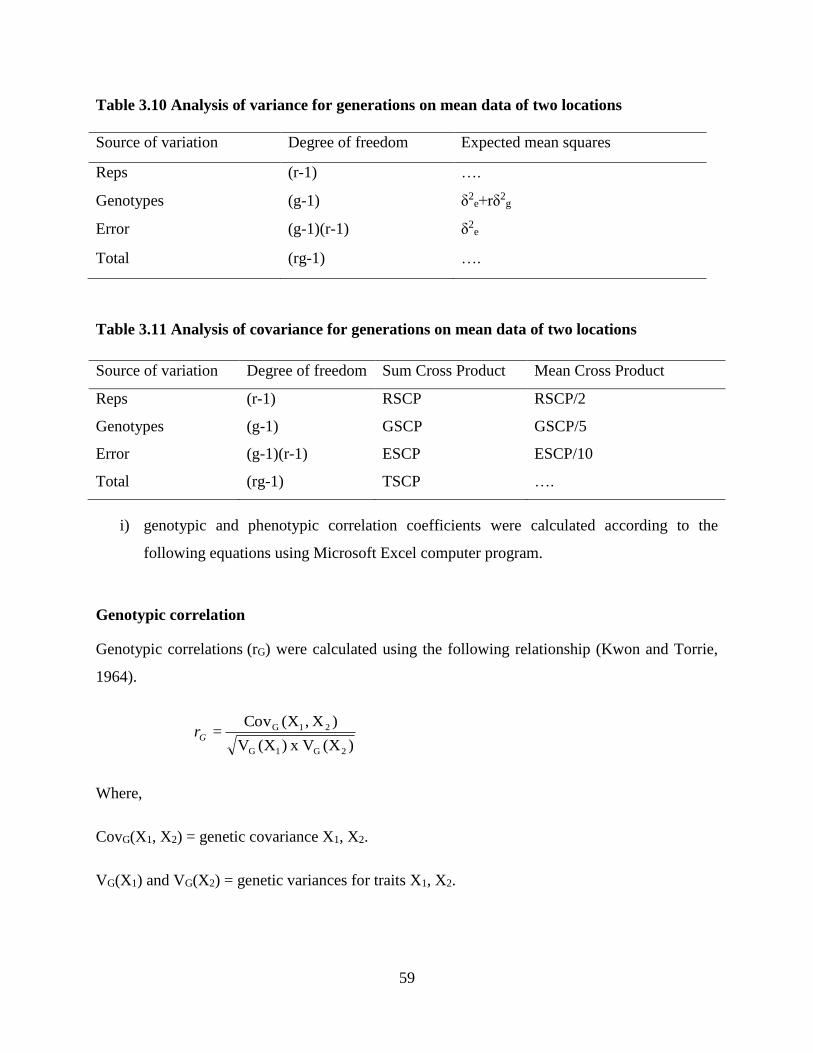
59
Table 3.10 Analysis of variance for generations on mean data of two locations
Source of variation Degree of freedom Expected mean squares
Reps (r-1) ….
Genotypes (g-1) δ2e+rδ2
g
Error (g-1)(r-1) δ2e
Total (rg-1) ….
Table 3.11 Analysis of covariance for generations on mean data of two locations
Source of variation Degree of freedom Sum Cross Product Mean Cross Product
Reps (r-1) RSCP RSCP/2
Genotypes (g-1) GSCP GSCP/5
Error (g-1)(r-1) ESCP ESCP/10
Total (rg-1) TSCP ….
i) genotypic and phenotypic correlation coefficients were calculated according to the
following equations using Microsoft Excel computer program.
Genotypic correlation
Genotypic correlations (rG) were calculated using the following relationship (Kwon and Torrie,
1964).
)(XV x )(XV
)X ,(XCov =
2G1G
21G
Gr
Where,
CovG(X1, X2) = genetic covariance X1, X2.
VG(X1) and VG(X2) = genetic variances for traits X1, X2.
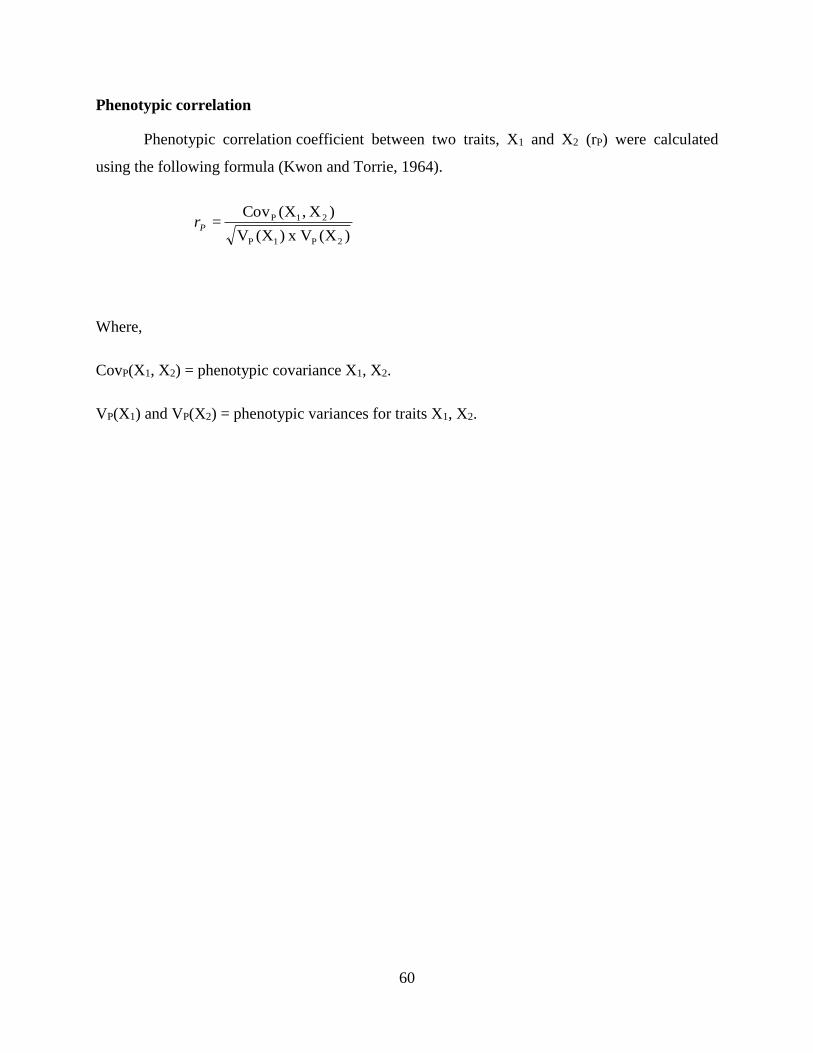
60
Phenotypic correlation
Phenotypic correlation coefficient between two traits, X1 and X2 (rP) were calculated
using the following formula (Kwon and Torrie, 1964).
)(XV x )(XV
)X ,(XCov =
2P1P
21PPr
Where,
CovP(X1, X2) = phenotypic covariance X1, X2.
VP(X1) and VP(X2) = phenotypic variances for traits X1, X2.
61
Chapter 4
RESULTS
4.1 Generation mean analysis
Combined analysis of variance in all four crosses, revealed non-significant differences for
genotype × location interactions in days to tasseling, silking, anthesis, ear length, fresh ear
weight, kernel rows ear-1, grains row-1, grains ear-1 and % unpopped grains. Similarly,
genotype × location interactions in cross PS-1 × BD-1, were found significant in days to
maturity, expansion volume and ear diameter. In cross, PS-1 × BD-2 genotype × location
interaction was found significant for ear height, ear diameter, grain yield, biological yield,
harvest index, % shelling and expansion volume. Plant height, days to maturity, ear diameter,
100-grain weight, grain yield, % shelling and harvest index, exposed significant differences
among genotype × location interactions in PS-2 × BD-1. Like-wise, significant differences
among genotype × location interactions were observed for plant height, days to maturity, ear
diameter, grain yield, harvest index, % shelling and expansion volume in cross PS-2 × BD-2.
Mean data over locations was used for generation mean analysis in those traits, which exhibited
non-significant genotype × location interactions in respective crosses. Similarly, genetic effects
were studied at individual location in all other crosses, where genotype × location interactions
were significant for specific traits (Appendices 1-6).
Generation mean analysis was applied after observing significant differences among the
generations in combined analysis of variance as suggested by Gomez and Gomez (1983).
Significant differences were observed among various generations for all the plant traits studied.
The joint scaling test (Cavalli, 1952) was used to detect epistasis. In the presence of epistasis, the
additive (d) and the dominance (h) effects and non-allelic interaction components (additive ×
additive (i), additive × dominance (j) and dominance × dominance (l)) of generation means were
estimated according to Hayman (1958). The chi square (2) value was significant according to
joint scaling test (Cavalli, 1952) for all the traits in all four crosses studied, except for days to
tasseling and silking in cross III (PS-2 × BD-1) and grains per ear and 100 grain weight in cross I
(PS-1 × BD-1) which were not significant, showing the adequacy of three parameter model. The
significant value of chi square for all the plant traits in all crosses indicated that the three
parameter model did not adequately explain the genetic variability for these traits. The
62
inadequacy of the model also indicated the presence of epistasis (non-allelic interaction), which
is also inferred from the generation means. As the three parameter model did not satisfactorily
explain the genetic variability for all these traits, therefore, a six parameter model was applied to
accommodate epistatic interactions. Results obtained on different plant parameters given in
chapter 4 section 4.1 are briefly discussed in this section in the light of available literature and
research findings of the previous research workers.
4.1.1 Days to 50% tasseling
Six parameter model was adequate to explain the inheritance pattern of days to 50%
tasseling since 2 estimates were found significant for all the crosses except, PS-2 × BD-1 (Table
4.1). The dominance gene action and digenic non-allelic epistasis of additive × dominance were
found to be involved in governing the inheritance of days to tasseling in all crosses except, PS-2
× BD-1, having adequacy of three parameter model only. Similarly complementary type of non-
allelic interaction was observed for cross PS-1 × BD-2. The digenic non-allelic epistasis of
additive × dominance was considered the major contributor in the inheritance of this trait. In both
crosses (PS-1 × BD-2 and PS-2 × BD-2) additive gene action with negative magnitude was
found responsible for controlling days to tasseling.
4.1.2 Days to 50% anthesis
The significance of 2 estimates for all crosses revealed that six parameter model was
adequate to explain the inheritance pattern of days to 50% anthesis (Table 4.1). Additive and
dominance as well as additive × additive and dominance × dominance digenic non-allelic gene
interactions were important in governing the inheritance of days to anthesis in cross PS-1 x BD-
1. The presence of opposite and significant signs of h (dominance) and l (dominance ×
dominance) resulted in duplicate type of non-allelic interaction for the days to 50% anthesis in
cross PS-1 × BD-1, while h and l with similar and significant signs resulted in complementary
duplicate type of non-allelic interaction in cross PS-1 × BD-2. The digenic non-allelic epistasis
of dominance × dominance was considered the major contributing factor in the inheritance of
this trait in these two crosses. Similarly additive gene action as well as additive × dominance and
dominance × dominance type of non-allelic gene action with negative magnitude were found
responsible for controlling the inheritance of anthesis in cross PS-2 × BD-2. Similarly this trait
63
was controlled by dominance gene action with additive × dominance type of non-allelic
interaction in cross PS-2 × BD-1. Negative and significant values of h (dominance) showed a
major role of dominant gene action in the inheritance of this trait in all crosses except, PS-2 ×
BD-2.
4.1.3 Days to 50% silking
Results of generation mean analysis for flowering characters including days to 50%
silking are presented in Table 4.1. The best fit model indicated that both additive and non-
additive gene actions were responsible for the manifestation of days to 50% silking in all crosses,
except, PS-2 × BD-1. Analysis indicated that along with additive and dominance, duplicate type
of non-allelic gene action was found controlling days to silking in PS-1 × BD-1. Significant
value of d (additive), h (dominance), i (additive x additive) and l (dominance × dominance) in
this cross exhibited the involvement of both heritable and non-heritable gene actions. Similarly
in cross PS-1 × BD-2, a complementary duplicate type of non-allelic interaction with both
additive and dominance gene action was found to be responsible for controlling days to 50%
silking. In cross PS-2 × BD-2 along with dispersed type of digenic interaction, additive and
dominant type of gene action was prominent in the inheritance of days to silking.
4.1.4 Plant height
Six parameters model was adequate to explain the genetic constitution of plant height for
all crosses (Table 4.1). Highly significant value of 2 for plant height showed involvement of
both allelic and non-allelic gene actions for this trait. The inheritance pattern of plant height, also
involved duplicate type of epistasis in both crosses PS-1 × BD-2 and PS-2 × BD-1 since the
values of h and l were significant with opposite signs. Positive value of d (additive) and h
(dominance) in all crosses except, PS-2 × BD-2 at CCRI and PS-2 × BD-1 at UOA indicated
predominant role of additive and dominant gene action in the inheritance of plant height in these
crosses, respectively. Similarly in crosses, PS-1 × BD-1 significant and similar sign of h
(dominance) and l (dominance × dominance) revealed the involvement of complementary type of
di-genic non-allelic interaction for plant height. Positive and higher magnitude of h in all crosses,
except PS-2 × BD-1 at UOA entailed preponderant role of dominant gene action in the
inheritance of this trait. Additive × additive(i) interaction in both crosses PS-2 × BD-1 and PS-2
64
× BD-2 at UOA and CCRI were negative and significant except, PS-2 × BD-1 exhibited positive
and significant additive × additive(i) interaction at CCRI. Moreover, in non-allelic gene actions,
presence of i (additive × additive), j (additive × dominance) and l (dominance × dominance) with
both positive and negative but significant magnitude indicated that all the three types of digenic
non-allelic interactions played a leading role in the inheritance of this parameter.
4.1.5 Ear height
Estimates of genetic components and 2 values for ear height are presented Table 4.1.
The significant values of 2 revealed adequacy of six parameter model for the inheritance study
of ear height. From significant 2 value, both fixable and non-fixable gene interactions are
evident in the inheritance of this trait. Additive effects in cross PS-1 × BD-2 at both locations
were negative and non-significant for ear height, while, dominant effects were positive and
significant. It can be concluded from significant values of h (dominance) and l (dominance ×
dominance) with similar signs that digenic non-allelic interaction of complementary type
explained the inheritance of this trait in two crosses i.e. PS-2 × BD-1 and PS-2 × BD-2. The
presence of positive and significant values of d (additive) and h (dominance) in these two
crosses, disclosed the involvement of both additive and dominant gene actions in the inheritance
of ear height. Similarly in PS-1 × BD-1 and PS-1 × BD-2 dominance and duplicate type of non-
allelic gene action were found responsible in controlling inheritance of ear height. The
significant magnitudes of i (additive × additive), j (additive × dominance) and l (dominance ×
dominance) in all crosses except PS-2 × BD-1 and PS-2 × BD-2 indicated that digenic non-
allelic interactions also play governing role in the inheritance of this trait. Duplicate type of
digenic interaction was observed in cross PS-1 × BD-2 at UOA.
4.1.6 Ear weight
From estimates of genetic components presented in Table 4.1 after observing significant
values of 2 it is unveiled that six parameter model was found adequate for the interpretation of
inheritance of ear weight. It also disclosed that both heritable and non-heritable gene action were
responsible for the control of this trait. A dispersed type of non-allelic gene action was observed
in cross PS-1 × BD-1, with non-significant effects of both additive and dominance gene actions.
65
In cross PS-1 × BD-2, negative and positive significant nature of additive and dominance gene
actions as well as duplicate type of non-allelic gene actions were found as controlling factors in
the inheritance of ear weight. Similarly in cross PS-2 × BD-1 and PS-2 × BD-2, additive and
dominance gene action with positive magnitudes and complementary non-allelic interactions
were responsive agents for the inheritance of ear weight.
4.1.7 Grain yield
Gene actions presented in Table 4.2 revealed that six parameter model of both additive
and non-additive gen actions was adequate to explain the inheritance of grain yield. From the
table it is clear that 2 was significant for all the studied crosses. A dominance genetic effect of
positive and significant magnitude was found responsive in controlling inheritance of grain yield
in all crosses both at UOA and CCRI. Likewise additive gene action of negative sign was
observed in cross PS-1 × BD-1. Additive gene action was negative and non-significant in cross
PS-1 × BD-2 at CCRI, while negative but significant at UOA. PS-2 × BD-1 and PS-2 × BD-2
exhibited positive effects of additive effects at UOA and CCRI. Both complementary and
duplicate type of non-allelic gene action was observed to be involved in the inheritance of grain
yield. Significant values of additive and dominance gene actions as well as additive × additive
and dominance × dominance type of epistasis in cross PS-1 × BD-1, PS-2 × BD-1 and PS-2 ×
BD-2 revealed that the trait was under a complex control. In cross PS-1 × BD-1, with negative
and positive magnitudes of additive and dominance gene actions, complementary type of
epistasis was also observed. Similarly in cross PS-2 × BD-1 and PS-2 × BD-2, where the same
female (PS-2) parent was utilized both additive and dominance of positive magnitudes and
duplicate type of non-allelic gene actions were found responsible for controlling grain yield in
both UOA and CCRI.
4.1.8 Ear length
Generation mean analysis of ear length revealed significant 2 values in all four crosses
which indicate that six parameter model was adequate to explain the inheritance of this trait
(Table 4.2). In all crosses, dominant gene effects were positive and predominant. Additive gene
action of significant nature with positive and negative signs was observed in PS-1 × BD-2 and
PS-2 × BD-1. In cross PS-1 × BD-1, the effect of additive genes was negative with non-
66
significant nature, while dominance and dominance × dominance effects were significant with
positive and negative magnitude in nature, respectively. In cross PS-1 × BD-1 and PS-2 × BD-1
duplicate type of non-allelic interaction was found predominant in the inheritance study.
Additive × additive gene action was positive and significant in all the crosses except, PS-2 × BD-
2. In cross PS-2 × BD-1 and PS-1 × BD-2 additive × dominance effect was found negatively
significant. Similarly in cross PS-1 × BD-2 and PS-1 × BD-1, dominance × dominance was
predominant with negative magnitude.
4.1.9 Ear diameter
The genetic analysis revealed that complex six parameter model was adequate to explain
the inheritance pattern of ear diameter in all four crosses at both locations (Table 4.2). Additive
genetic effects were found positive and significant in cross PS-1 × BD-2 and PS-2 × BD-1 at
UOA, and cross PS-2 × BD-2 in CCRI. Dominant genetic effects were found positive and
significant except PS-1 × BD-2 at UOA. Dominant effects were predominant in all the crosses.
Among the non-allelic interactions, dominance × dominance interactions were non-significant in
all crosses at both locations, while additive × additive interactions were positively significant in
all crosses at CCRI, except PS-1 × BD-1. Genetic analysis for the inheritance of ear diameter
revealed that additive × dominance effects were significant in all crosses except PS-1 × BD-2
and PS-2 × BD-2. A dispersed duplicate type of non-allelic interaction was observed in all four
crosses at both locations.
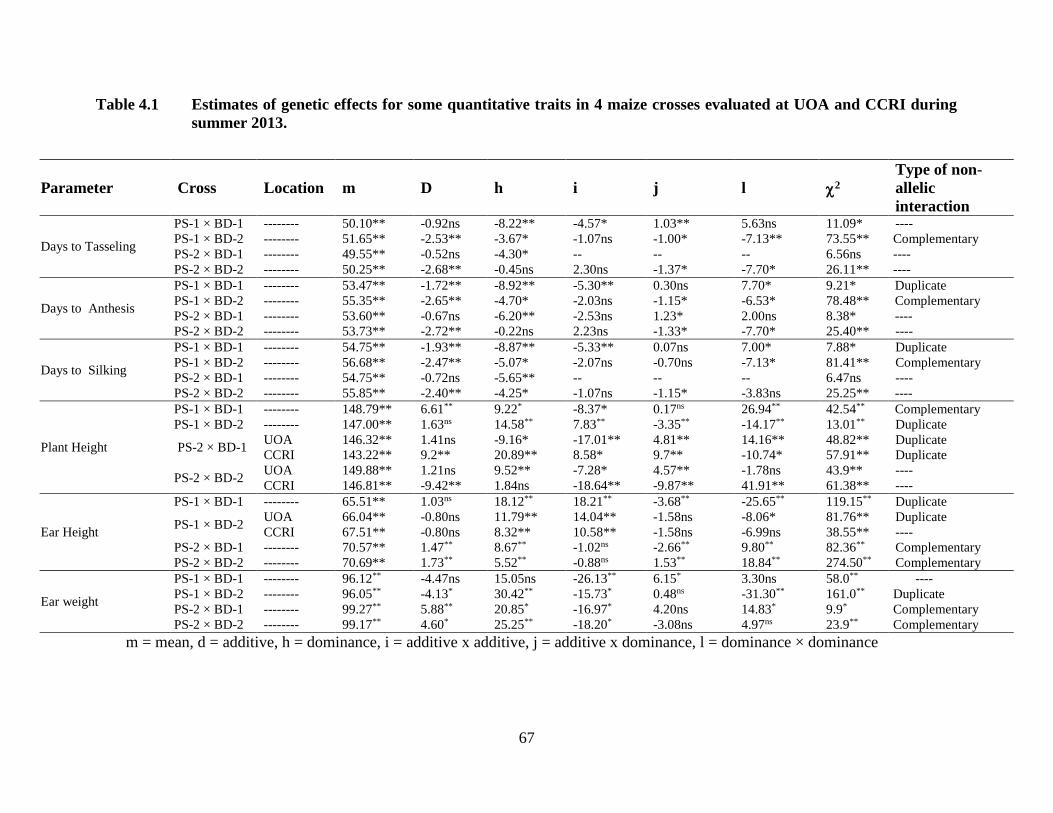
67
Table 4.1 Estimates of genetic effects for some quantitative traits in 4 maize crosses evaluated at UOA and CCRI during
summer 2013.
m = mean, d = additive, h = dominance, i = additive x additive, j = additive x dominance, l = dominance × dominance
Parameter Cross Location m D h i j l 2
Type of non-
allelic
interaction
Days to Tasseling
PS-1 × BD-1 -------- 50.10** -0.92ns -8.22** -4.57* 1.03** 5.63ns 11.09* ----
PS-1 × BD-2 -------- 51.65** -2.53** -3.67* -1.07ns -1.00* -7.13** 73.55** Complementary
PS-2 × BD-1 -------- 49.55** -0.52ns -4.30* -- -- -- 6.56ns ----
PS-2 × BD-2 -------- 50.25** -2.68** -0.45ns 2.30ns -1.37* -7.70* 26.11** ----
Days to Anthesis
PS-1 × BD-1 -------- 53.47** -1.72** -8.92** -5.30** 0.30ns 7.70* 9.21* Duplicate
PS-1 × BD-2 -------- 55.35** -2.65** -4.70* -2.03ns -1.15* -6.53* 78.48** Complementary
PS-2 × BD-1 -------- 53.60** -0.67ns -6.20** -2.53ns 1.23* 2.00ns 8.38* ----
PS-2 × BD-2 -------- 53.73** -2.72** -0.22ns 2.23ns -1.33* -7.70* 25.40** ----
Days to Silking
PS-1 × BD-1 -------- 54.75** -1.93** -8.87** -5.33** 0.07ns 7.00* 7.88* Duplicate
PS-1 × BD-2 -------- 56.68** -2.47** -5.07* -2.07ns -0.70ns -7.13* 81.41** Complementary
PS-2 × BD-1 -------- 54.75** -0.72ns -5.65** -- -- -- 6.47ns ----
PS-2 × BD-2 -------- 55.85** -2.40** -4.25* -1.07ns -1.15* -3.83ns 25.25** ----
Plant Height
PS-1 × BD-1 -------- 148.79** 6.61** 9.22* -8.37* 0.17ns 26.94** 42.54** Complementary
PS-1 × BD-2 -------- 147.00** 1.63ns 14.58** 7.83** -3.35** -14.17** 13.01** Duplicate
PS-2 × BD-1 UOA 146.32** 1.41ns -9.16* -17.01** 4.81** 14.16** 48.82** Duplicate
CCRI 143.22** 9.2** 20.89** 8.58* 9.7** -10.74* 57.91** Duplicate
PS-2 × BD-2 UOA 149.88** 1.21ns 9.52** -7.28* 4.57** -1.78ns 43.9** ----
CCRI 146.81** -9.42** 1.84ns -18.64** -9.87** 41.91** 61.38** ----
Ear Height
PS-1 × BD-1 -------- 65.51** 1.03ns 18.12** 18.21** -3.68** -25.65** 119.15** Duplicate
PS-1 × BD-2 UOA 66.04** -0.80ns 11.79** 14.04** -1.58ns -8.06* 81.76** Duplicate
CCRI 67.51** -0.80ns 8.32** 10.58** -1.58ns -6.99ns 38.55** ----
PS-2 × BD-1 -------- 70.57** 1.47** 8.67** -1.02ns -2.66** 9.80** 82.36** Complementary
PS-2 × BD-2 -------- 70.69** 1.73** 5.52** -0.88ns 1.53** 18.84** 274.50** Complementary
Ear weight
PS-1 × BD-1 -------- 96.12** -4.47ns 15.05ns -26.13** 6.15* 3.30ns 58.0** ----
PS-1 × BD-2 -------- 96.05** -4.13* 30.42** -15.73* 0.48ns -31.30** 161.0** Duplicate
PS-2 × BD-1 -------- 99.27** 5.88** 20.85* -16.97* 4.20ns 14.83* 9.9* Complementary
PS-2 × BD-2 -------- 99.17** 4.60* 25.25** -18.20* -3.08ns 4.97ns 23.9** Complementary
68
4.1.10 Kernel rows ear-1
Estimates of genetic components and 2 values for kernel rows ear-1 presented in Table
4.2 revealed adequacy of six parameter model for the inheritance study of kernel rows ear-1.
Adequacy of six parameter model indicated the presence of both fixable and non-fixable gene
interactions in the inheritance of this trait. Additive genetic effects were positive and significant
in all crosses except, PS-1 × BD-1. Dominance and additive × additive effects were found
positive and significant in both cross PS-1 × BD-1 and PS-1 × BD-2, while dominance ×
dominance epistatic interaction was negatively significant which exhibited involvement of
duplicate type of non-allelic interaction in the inheritance of kernel rows ear-1. Additive ×
additive epistasis was significant in all crosses except, PS-1 × BD-2. Similarly additive ×
dominance (j) non-allelic interaction was non-significant in all crosses except, PS-2 × BD-2 in
which j was negative and significant.
4.1.11 Grains rows-1
Genetic estimates obtained through generation mean analysis revealed that six parameter
model was adequate in the inheritance of grains row-1 (Table 4.2). Additive genetic effects were
negatively significant in two crosses viz. PS-1 × BD-1 and PS-1 × BD-2, positively significant in
cross PS-2 × BD-1 and PS-2 × BD-2. Dominant effects were predominant with positive and
significant nature in all crosses. Maximum dominant effect was observed in cross PS-1 × BD-2
and PS-2 × BD-2. Additive × additive gene actions were positive and significant in cross PS-1 ×
BD-2 and PS-2 × BD-2 while, negatively significant in cross PS-1 × BD-1. Likewise, additive x
dominant effects were non-significant in all four crosses except, PS-1 × BD-1. Presence of
significant dominance and dominance × dominance nature resulted in complementary duplicate
type non-allelic interaction in cross PS-1 × BD-1, while duplicate type epistasis was observed in
cross PS-1 × BD-2 and PS-2 × BD-1.
4.1.12 Grains ear-1
Six parameters model was adequate to explain the inheritance pattern of grain ear-1 since
2 estimates were found significant for all crosses, except PS-1 × BD-1 (Table 4.2). Due to non-
significant value of 2 three parameter model was adequate for inheritance study of grains ear-1.
69
Significant effects of additive and dominance effects were observed with negative and positive
nature in cross PS-1 × BD-1, respectively. All epistatic effects in cross PS-1 × BD-1 were non-
significant. Dominant as well as dominant × dominant gene actions were significant with
opposite signs in cross PS-1 × BD-2 which resulted in duplicate type of non-allelic interaction.
Both additive and dominant effects were positive and significant in cross PS-2 × BD-1 and PS-2
× BD-2. Complementary type of epistasis was observed in cross PS-2 × BD-1. Additive ×
dominance effects were non-significant in all crosses.
4.1.13 Hundred grain weight
Genetic estimates obtained through generation mean analysis revealed that six parameter
model was adequate to explain the inheritance pattern of hundred grain weight since 2 estimates
were found significant for all crosses, except PS-1 × BD-1 (Table 4.3). The inheritance of
hundred grain weight seems to be controlled by major genes in the form of additive and
dominance gene effects in cross PS-1 × BD-1 as six parameters model was found inadequate
hence 2 value was non-significant. In cross PS-1 × BD-2 additive as well as additive ×
dominance effects were positive and significant with dispersed type of non-allelic interaction at
CCRI. Dominant genetic effects were negative in three crosses (PS-1 × BD-2, PS-2 × BD-1 and
PS-2 × BD-2) at CCRI. A complementary type of epistasis was observed in cross PS-2 × BD-2
as both dominant and dominant × dominant gene actions were positive and significant at CCRI.
Additive gene action along with additive × dominance effects were negatively significant in
cross PS-2 × BD-2 at UOA. In cross PS-1 × BD-2 at CCRI, both dominant and dominant ×
dominant gene actions were positive and significant which resulted in duplicate type of non-
allelic digenic interactions.
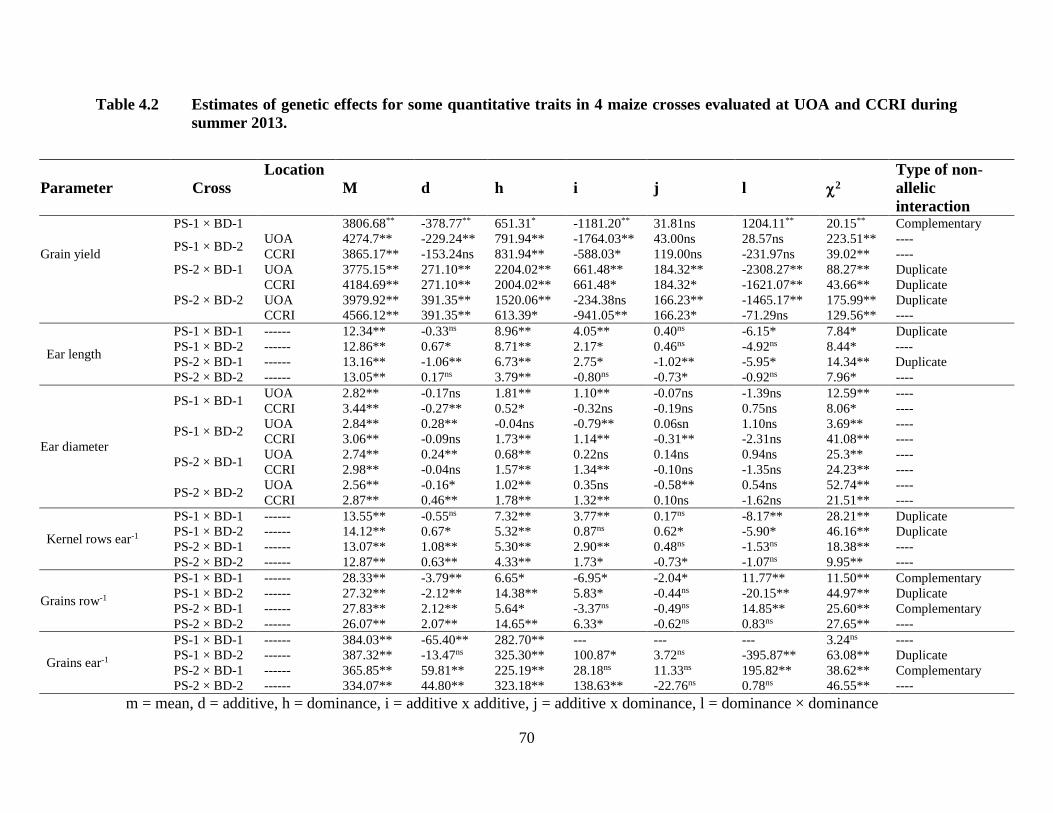
70
Table 4.2 Estimates of genetic effects for some quantitative traits in 4 maize crosses evaluated at UOA and CCRI during
summer 2013.
m = mean, d = additive, h = dominance, i = additive x additive, j = additive x dominance, l = dominance × dominance
Parameter Cross
Location
M d h i j l 2
Type of non-
allelic
interaction
Grain yield
PS-1 × BD-1 3806.68** -378.77** 651.31* -1181.20** 31.81ns 1204.11** 20.15** Complementary
PS-1 × BD-2 UOA 4274.7** -229.24** 791.94** -1764.03** 43.00ns 28.57ns 223.51** ----
CCRI 3865.17** -153.24ns 831.94** -588.03* 119.00ns -231.97ns 39.02** ----
PS-2 × BD-1 UOA 3775.15** 271.10** 2204.02** 661.48** 184.32** -2308.27** 88.27** Duplicate
CCRI 4184.69** 271.10** 2004.02** 661.48* 184.32* -1621.07** 43.66** Duplicate
PS-2 × BD-2 UOA 3979.92** 391.35** 1520.06** -234.38ns 166.23** -1465.17** 175.99** Duplicate
CCRI 4566.12** 391.35** 613.39* -941.05** 166.23* -71.29ns 129.56** ----
Ear length
PS-1 × BD-1 ------ 12.34** -0.33ns 8.96** 4.05** 0.40ns -6.15* 7.84* Duplicate
PS-1 × BD-2 ------ 12.86** 0.67* 8.71** 2.17* 0.46ns -4.92ns 8.44* ----
PS-2 × BD-1 ------ 13.16** -1.06** 6.73** 2.75* -1.02** -5.95* 14.34** Duplicate
PS-2 × BD-2 ------ 13.05** 0.17ns 3.79** -0.80ns -0.73* -0.92ns 7.96* ----
Ear diameter
PS-1 × BD-1 UOA 2.82** -0.17ns 1.81** 1.10** -0.07ns -1.39ns 12.59** ----
CCRI 3.44** -0.27** 0.52* -0.32ns -0.19ns 0.75ns 8.06* ----
PS-1 × BD-2 UOA 2.84** 0.28** -0.04ns -0.79** 0.06sn 1.10ns 3.69** ----
CCRI 3.06** -0.09ns 1.73** 1.14** -0.31** -2.31ns 41.08** ----
PS-2 × BD-1 UOA 2.74** 0.24** 0.68** 0.22ns 0.14ns 0.94ns 25.3** ----
CCRI 2.98** -0.04ns 1.57** 1.34** -0.10ns -1.35ns 24.23** ----
PS-2 × BD-2 UOA 2.56** -0.16* 1.02** 0.35ns -0.58** 0.54ns 52.74** ----
CCRI 2.87** 0.46** 1.78** 1.32** 0.10ns -1.62ns 21.51** ----
Kernel rows ear-1
PS-1 × BD-1 ------ 13.55** -0.55ns 7.32** 3.77** 0.17ns -8.17** 28.21** Duplicate
PS-1 × BD-2 ------ 14.12** 0.67* 5.32** 0.87ns 0.62* -5.90* 46.16** Duplicate
PS-2 × BD-1 ------ 13.07** 1.08** 5.30** 2.90** 0.48ns -1.53ns 18.38** ----
PS-2 × BD-2 ------ 12.87** 0.63** 4.33** 1.73* -0.73* -1.07ns 9.95** ----
Grains row-1
PS-1 × BD-1 ------ 28.33** -3.79** 6.65* -6.95* -2.04* 11.77** 11.50** Complementary
PS-1 × BD-2 ------ 27.32** -2.12** 14.38** 5.83* -0.44ns -20.15** 44.97** Duplicate
PS-2 × BD-1 ------ 27.83** 2.12** 5.64* -3.37ns -0.49ns 14.85** 25.60** Complementary
PS-2 × BD-2 ------ 26.07** 2.07** 14.65** 6.33* -0.62ns 0.83ns 27.65** ----
Grains ear-1
PS-1 × BD-1 ------ 384.03** -65.40** 282.70** --- --- --- 3.24ns ----
PS-1 × BD-2 ------ 387.32** -13.47ns 325.30** 100.87* 3.72ns -395.87** 63.08** Duplicate
PS-2 × BD-1 ------ 365.85** 59.81** 225.19** 28.18ns 11.33ns 195.82** 38.62** Complementary
PS-2 × BD-2 ------ 334.07** 44.80** 323.18** 138.63** -22.76ns 0.78ns 46.55** ----
71
4.1.14 Expansion volume
Generation mean analysis of expansion volume revealed that six parameter model was
adequate for the inheritance study of all crosses (Table 4.3). The 2 value obtained for expansion
volume were significant in all crosses both across locations and individual locations. Dominant
gene actions were negatively significant in both crosses PS-1 × BD-1 and PS-1 × BD-2 at both
locations. Similarly dominant effects at CCRI and UOA were positively significant in cross PS-2
× BD-2. In cross PS-2 × BD-1 along with both major gene effects (additive and dominant)
dominant × dominant digenic non-allelic interactions were positive and significant. Both
dominance effects and additive × dominance epistasis were negatively significant in cross PS-1 ×
BD-1 and PS-1 × BD-2 at both locations. In cross PS-1 × BD-2 both additive and dominant gene
actions were negatively significant while, epistatic interactions additive x dominant and
dominant × dominant were found negatively and positively significant at UOA and CCRI,
respectively. Due to presence of significant dominant effects and dominant × dominant epistasis
with contrasting signs resulted in duplicate type of non-allelic interaction for expansion volume
in all crosses except, PS-2 × BD-1. In cross PS-2 × BD-1 additive and dominant as well as all
three epistatic interactions were positive and significant. Complementary type of non-allelic
interaction was observed in cross PS-2 × BD-1.
4.1.15 Percentage of unpopped grains
Six parameter model was adequate to explain the inheritance pattern of percentage of
unpopped grains since 2 estimates were significant in all four crosses (Table 4.3). Additive
effects for percentage of unpopped grains were positively significant in two of the four crosses
while, non-significant with positive and negative magnitudes in the other two crosses. In cross
PS-1 × BD-1, both dominant and additive × additive epistasis were negative and significant
while, additive × dominance and dominance × dominance non-allelic interactions were non-
significant with positive and negative magnitudes, respectively. Additive genetic effects were
positively significant in cross PS-1 × BD-2 and PS-2 × BD-1. Similarly in cross PS-1 × BD-2
effect of dominant genes on percentage of unpopped grains was negative and non-significant,
while additive x dominant and dominant × dominant epistatic effects were positively significant
and negatively significant, respectively. Both additive × additive and dominant × dominant
epistasis were negative and non-significant in cross PS-2 × BD-1. In cross PS-2 × BD-2 both
72
dominant and additive × additive gene actions were negatively significant. Both additive x
dominant and dominant × dominant non-allelic interactions were positively significant in the
same cross. Presence of significant dominant and dominant × dominant effects with opposite
magnitudes resulted in duplicate type of diallelic interaction in cross PS-2 × BD-2.
4.1.16 Days to maturity
It is disclosed from estimates of genetic components and 2 values that six parameters
model of complex genetic nature was found adequate for the interpretation of inheritance (Table
4.4). It is obvious that both heritable and non-heritable gene actions were responsible in the
control of maturity. Major gene effects in the form of additive effects were negatively and non-
significant in all crosses at both UOA and CCRI except, in cross PS-2 × BD-2 where the said
effect was negative but significant at both locations. Similarly dominant gene actions were
negatively significant in all crosses with predominant magnitude. Dominant gene effects were
also found negative but of significant nature in cross PS-1 × BD-1 both at UOA and CCRI, while
at UOA this effect was negatively non-significant in cross PS-2 × BD-1 and PS-2 × BD-2. In
epistatic effects, additive × additive effects were found negative and non-significant in three
crosses at both locations. Non-allelic interaction of additive x dominant were positively
significant at CCRI in both crosses, PS-1 × BD-1 and PS-2 × BD-1, on other-hand such epistatic
effects were positive but non-significant in cross PS-2 × BD-2 at both locations. Dominant ×
dominant non-allelic interactions were negative and non-significant in three of the four crosses
which resulted in a dispersed type digenic interaction in them at both UOA and CCRI.
Significant and opposite values of dominant effect and dominant × dominant epistasis in cross
PS-2 × BD-2 at CCRI resulted in duplicate type of digenic non-allelic interaction.
4.1.17 Biological yield
Generation mean analysis of biological yield presented in Table 4.4 unveiled that six
parameter was adequate for the inheritance study. From Table 4.4 it is clear that 2 values
calculated were significant for all crosses. As genotype × location interactions were non-
significant in all crosses except, PS-1 × BD-2 where, genetic effects were calculated at individual
location. Additive gene actions for biological yield were negative and non-significant in cross
PS-1 × BD-2 at both locations, while in both crosses, PS-2 × BD-1 and PS-2 × BD-2 these
73
effects were positively significant. Similarly major gene effects of dominant genes were
positively significant in all crosses. Additive × additive epistatic effects were negative and
significant in all crosses except, PS-1 × BD-2. Similarly additive × dominance gene effects were
positively significant in two crosses (PS-1 × BD-1 and PS-2 × BD-1) while, negative and non-
significant in cross PS-2 × BD-2. Dominance × dominance effects for biological yield were non-
significant in all crosses, except PS-1 × BD-2. Duplicate type of digenic non-allelic interactions
were observed in cross PS-1 × BD-2 both at UOA and CCRI.
4.1.18 Harvest index
Six parameter model was adequate to explain the inheritance pattern of harvest index
since 2 estimates were significant in all four crosses (Table 4.4). Additive genetic effects for
harvest index were positively significant in both crosses PS-2 × BD-1 and PS-2 × BD-2 at UOA,
while negative and significant in cross PS-1 × BD-1. Dominant gene effects were positively
significant at UOA in both crosses, PS-1 × BD-2 and PS-2 × BD-1, while at CCRI such effects
were negatively and positively significant in cross PS-2 × BD-2 and cross PS-2 × BD-2,
respectively. Additive × additive epistatic interactions were found negative and significant in all
crosses except, PS-2 × BD-1 where they were positively significant at both locations. Dominant
× dominant epistasis, of both positive and negative magnitudes were observed in all crosses.
Presence of significant dominant and dominant × dominant gene actions with positive magnitude
resulted in a complementary type of non-allelic gene action in cross PS-1 × BD-1. Both
dominant and dominant × dominant gene actions were significant with opposite magnitudes in
cross PS-1 × BD-2 at both, UOA and CCRI. Similarly pattern of inheritance for major genes
(dominant) and minor genes (dominant × dominant) was also observed in cross PS-2 × BD-1 at
both locations. A duplicate type digenic non-allelic interaction was observed in cross PS-2 × BD-
1. Both additive × additive and dominant × dominant epistasis were negative and significant,
while dominance and additive gene effects were positively significant which give a duplicate
type of epistasis in cross PS-2 × BD-2 at CCRI.
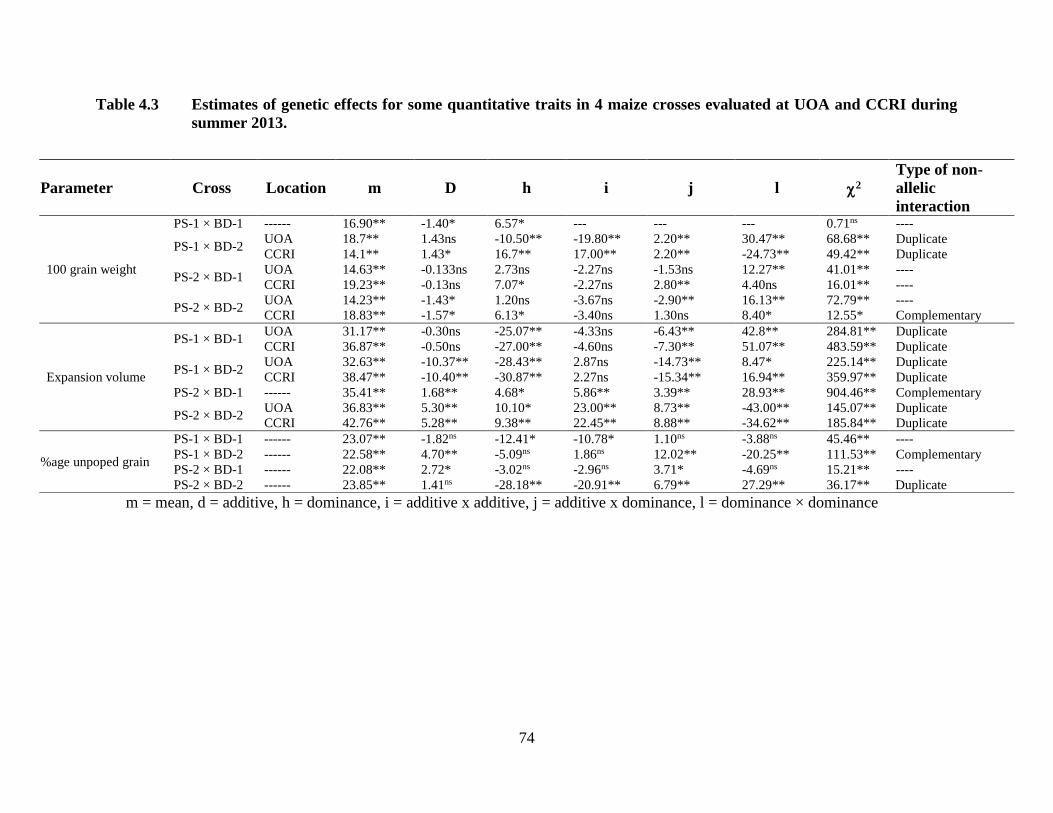
74
Table 4.3 Estimates of genetic effects for some quantitative traits in 4 maize crosses evaluated at UOA and CCRI during
summer 2013.
m = mean, d = additive, h = dominance, i = additive x additive, j = additive x dominance, l = dominance × dominance
Parameter Cross Location m D h i j l 2
Type of non-
allelic
interaction
100 grain weight
PS-1 × BD-1 ------ 16.90** -1.40* 6.57* --- --- --- 0.71ns ----
PS-1 × BD-2 UOA 18.7** 1.43ns -10.50** -19.80** 2.20** 30.47** 68.68** Duplicate
CCRI 14.1** 1.43* 16.7** 17.00** 2.20** -24.73** 49.42** Duplicate
PS-2 × BD-1 UOA 14.63** -0.133ns 2.73ns -2.27ns -1.53ns 12.27** 41.01** ----
CCRI 19.23** -0.13ns 7.07* -2.27ns 2.80** 4.40ns 16.01** ----
PS-2 × BD-2 UOA 14.23** -1.43* 1.20ns -3.67ns -2.90** 16.13** 72.79** ----
CCRI 18.83** -1.57* 6.13* -3.40ns 1.30ns 8.40* 12.55* Complementary
Expansion volume
PS-1 × BD-1 UOA 31.17** -0.30ns -25.07** -4.33ns -6.43** 42.8** 284.81** Duplicate
CCRI 36.87** -0.50ns -27.00** -4.60ns -7.30** 51.07** 483.59** Duplicate
PS-1 × BD-2 UOA 32.63** -10.37** -28.43** 2.87ns -14.73** 8.47* 225.14** Duplicate
CCRI 38.47** -10.40** -30.87** 2.27ns -15.34** 16.94** 359.97** Duplicate
PS-2 × BD-1 ------ 35.41** 1.68** 4.68* 5.86** 3.39** 28.93** 904.46** Complementary
PS-2 × BD-2 UOA 36.83** 5.30** 10.10* 23.00** 8.73** -43.00** 145.07** Duplicate
CCRI 42.76** 5.28** 9.38** 22.45** 8.88** -34.62** 185.84** Duplicate
%age unpoped grain
PS-1 × BD-1 ------ 23.07** -1.82ns -12.41* -10.78* 1.10ns -3.88ns 45.46** ----
PS-1 × BD-2 ------ 22.58** 4.70** -5.09ns 1.86ns 12.02** -20.25** 111.53** Complementary
PS-2 × BD-1 ------ 22.08** 2.72* -3.02ns -2.96ns 3.71* -4.69ns 15.21** ----
PS-2 × BD-2 ------ 23.85** 1.41ns -28.18** -20.91** 6.79** 27.29** 36.17** Duplicate
75
4.1.19 Percent shelling
Generation mean analysis of percent shelling revealed significant 2 values in all four
crosses which indicate that six parameter model of complex genetic nature was adequate to
explain the inheritance of this trait both at both locations, except in cross PS-2 × BD-1 at UOA
(Table 4.4). In cross PS-2 × BD-1 at UOA only major genes (additive and dominant) were found
to be involved in the inheritance of percent shelling. In all crosses dominant gene effects were
positive and significant while, effects due to additive genes were negative and non-significant in
all crosses at UOA and CCRI. Similarly, additive × additive gene actions were positively
significant in three crosses at both locations except, PS-1 × BD-2 at UOA. Additive × dominance
effects were positive in all crosses except, PS-2 × BD-2, where it was negative and non-
significant. Dominant × dominant non-allelic interactions were negatively significant in all
crosses except PS-1 × BD-2 at CCRI. Significant and opposite signs of dominant gene action and
dominant × dominant epistasis for percent shelling depicted a duplicate type of digenic non-
allelic interaction in three crosses except, PS-1 × BD-2 at CCRI.
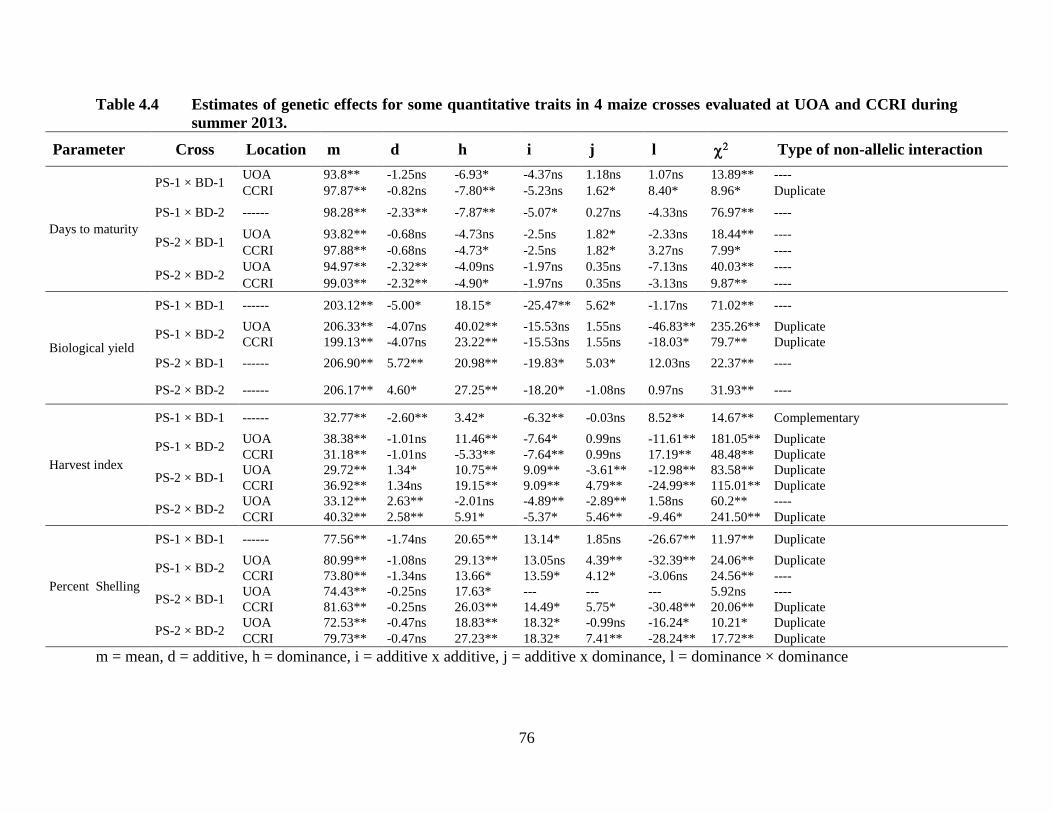
76
Table 4.4 Estimates of genetic effects for some quantitative traits in 4 maize crosses evaluated at UOA and CCRI during
summer 2013.
Parameter Cross Location m d h i j l Type of non-allelic interaction
Days to maturity
PS-1 × BD-1 UOA 93.8** -1.25ns -6.93* -4.37ns 1.18ns 1.07ns 13.89** ----
CCRI 97.87** -0.82ns -7.80** -5.23ns 1.62* 8.40* 8.96* Duplicate
PS-1 × BD-2 ------ 98.28** -2.33** -7.87** -5.07* 0.27ns -4.33ns 76.97** ----
PS-2 × BD-1 UOA 93.82** -0.68ns -4.73ns -2.5ns 1.82* -2.33ns 18.44** ----
CCRI 97.88** -0.68ns -4.73* -2.5ns 1.82* 3.27ns 7.99* ----
PS-2 × BD-2 UOA 94.97** -2.32** -4.09ns -1.97ns 0.35ns -7.13ns 40.03** ----
CCRI 99.03** -2.32** -4.90* -1.97ns 0.35ns -3.13ns 9.87** ----
Biological yield
PS-1 × BD-1 ------ 203.12** -5.00* 18.15* -25.47** 5.62* -1.17ns 71.02** ----
PS-1 × BD-2 UOA 206.33** -4.07ns 40.02** -15.53ns 1.55ns -46.83** 235.26** Duplicate
CCRI 199.13** -4.07ns 23.22** -15.53ns 1.55ns -18.03* 79.7** Duplicate
PS-2 × BD-1 ------ 206.90** 5.72** 20.98** -19.83* 5.03* 12.03ns 22.37** ----
PS-2 × BD-2 ------ 206.17** 4.60* 27.25** -18.20* -1.08ns 0.97ns 31.93** ----
Harvest index
PS-1 × BD-1 ------ 32.77** -2.60** 3.42* -6.32** -0.03ns 8.52** 14.67** Complementary
PS-1 × BD-2 UOA 38.38** -1.01ns 11.46** -7.64* 0.99ns -11.61** 181.05** Duplicate
CCRI 31.18** -1.01ns -5.33** -7.64** 0.99ns 17.19** 48.48** Duplicate
PS-2 × BD-1 UOA 29.72** 1.34* 10.75** 9.09** -3.61** -12.98** 83.58** Duplicate
CCRI 36.92** 1.34ns 19.15** 9.09** 4.79** -24.99** 115.01** Duplicate
PS-2 × BD-2 UOA 33.12** 2.63** -2.01ns -4.89** -2.89** 1.58ns 60.2** ----
CCRI 40.32** 2.58** 5.91* -5.37* 5.46** -9.46* 241.50** Duplicate
Percent Shelling
PS-1 × BD-1 ------ 77.56** -1.74ns 20.65** 13.14* 1.85ns -26.67** 11.97** Duplicate
PS-1 × BD-2 UOA 80.99** -1.08ns 29.13** 13.05ns 4.39** -32.39** 24.06** Duplicate
CCRI 73.80** -1.34ns 13.66* 13.59* 4.12* -3.06ns 24.56** ----
PS-2 × BD-1 UOA 74.43** -0.25ns 17.63* --- --- --- 5.92ns ----
CCRI 81.63** -0.25ns 26.03** 14.49* 5.75* -30.48** 20.06** Duplicate
PS-2 × BD-2 UOA 72.53** -0.47ns 18.83** 18.32* -0.99ns -16.24* 10.21* Duplicate
CCRI 79.73** -0.47ns 27.23** 18.32* 7.41** -28.24** 17.72** Duplicate
m = mean, d = additive, h = dominance, i = additive x additive, j = additive x dominance, l = dominance × dominance
77
4.2 Heritability
The heredity and environmental factors are the two important factors effecting the genetic
composition and individual performance in the population. The genetic and environmental
variations are used in the estimation of heritability. Heritability estimates are used as a helping
tool in choosing a suitable breeding method, prediction of direct and correlated response to
selection, as well as in the estimation of genetic gain. This section include explanation about the
broad and narrow sense heritability estimates for four maize crosses (Cross-I = PS-1 × BD-1,
Cross-II = PS-1 × BD-2, Cross-III = PS-2 × BD-1, Cross-IV = PS-2 × BD-2) derived from two
contrasting groups of inbred lines, with two inbreds in each group.
4.2.1 Days to 50% tasseling
It is exhibited from Table 4.5 that high broad sense heritability estimates were exhibited
by all four crosses for days to tasseling. Heritability estimates for tasseling ranged from 0.69 to
0.76. High broad sense heritability estimate (0.76) was observed for both PS-1 × BD-2 and PS-2
× BD-2, followed by cross PS-2 × BD-1 and PS-1 × BD-1 with h2BS of 0.75 and 0.69,
respectively. Moderate narrow sense heritability estimates were observed in four crosses for days
to tasseling. Narrow sense heritability ranged from 0.38 to 0.69 for cross PS-2 × BD-2 and PS-1
× BD-1, respectively.
4.2.2 Days to 50% anthesis
Heritability estimates presented in Table 4.5 revealed high level of broad sense
heritability for days to 50% anthesis among the four crosses. Broad sense heritability estimate
ranged from 0.81 to 0.84 for cross PS-2 × BD-1 and PS-1 × BD-2, respectively. Similarly narrow
sense heritability estimates ranged from 0.46 to 0.67. Maximum narrow sense heritability of 0.67
was calculated for the cross PS-1 × BD-2, while minimum (0.46) was observed for cross PS-2 ×
BD-1.
4.2.3 Days to 50% silking
Heritability estimates for days to 50% silking are presented in Table 4.5. Maximum broad
sense heritability estimate of 0.81 was reported for cross PS-1 × BD-1 and PS-1 × BD-2,
followed by 0.79 for PS-2 × BD-1, while minimum broad sense heritability of 0.75 was reported
78
for PS-2 × BD-2. Narrow sense heritability estimates ranged from 0.44 to 0.67 for cross PS-2 ×
BD-1 and PS-1 × BD-2, respectively.
4.2.4 Plant height
Estimates of heritability for plant height are provided in Table 4.5. High level of broad
sense heritability was observed for plant height in all four crosses. Broad sense heritability varied
from 0.73 to 0.84. Maximum broad sense heritability of 0.84 was found for cross PS-1 x BD-1,
followed by PS-2 × BD-2 with h2BS of 0.84. The narrow sense heritability estimates showed a
range of 0.52 to 0.69 for cross PS-1 × BD-1 and PS-2 × BD-1, respectively for this parameter.
Narrow sense heritability of 0.55 and 0.54 was observed for cross PS-1 × BD-2 and PS-2 × BD-
2, respectively.
4.2.5 Ear height
Broad sense heritability estimates in all four crosses were high for ear height, ranging
from 0.80 to 0.85 (Table 4.5) in cross PS-1 × BD-2 and PS-2 × BD-2, respectively. Similarly
narrow sense heritability estimates ranged from moderate to high for ear height. Maximum
(0.74) estimate of narrow sense heritability was observed for the cross PS-2 × BD-2 while,
minimum (0.43) estimates of heritability in narrow sense was noticed in the cross PS-1 × BD-2
for this trait.
4.2.6 Ear weight
Both broad sense and narrow sense heritability estimates for ear weight are provided in
Table 4.5. High broad sense heritability estimates were observed in all four crosses for ear
weight, ranging from 0.77 to 0.81 (Table 4.5) in cross PS-1 × BD-2 and PS-2 × BD-2,
respectively. Broad sense heritability estimate of 0.79 was observed for both PS-1 × BD-1 and
PS-2 × BD-1. Moderate level of narrow sense heritability estimates were calculated for ear
weight. Maximum (0.52) estimate of narrow sense heritability was observed for the cross PS-2 ×
BD-1 while, minimum (0.41) estimates of heritability in narrow sense was calculated for both
PS-1 × BD-1 and PS-2 × BD-2 crosses for ear weight parameter.
79
4.2.7 Grain yield
Broad and narrow sense heritability estimates for grain yield are provided in Table 4.5.
High level of broad sense heritability was calculated for grain yield in all four crosses. The range
of broad sense heritability for grain yield was 0.69 to 0.82. Maximum broad sense heritability of
0.82 was found for cross PS-2 × BD-1, followed by cross PS-2 × BD-2 with h2BS of 0.79.
Similarly narrow sense heritability estimates varied from moderate to high range. Maximum
(0.62) narrow sense heritability was reported for cross PS-1 × BD-1, followed by PS-2 × BD-1
with h2NS 0.58. Likewise, minimum narrow sense heritability estimates 0f 0.41 and 0.45 were
observed for PS-1 × BD-2 and PS-2 × BD-2, respectively.
4.2.8 Ear length
High estimates of both broad and narrow sense heritability were calculated for ear length
(Table 4.5). Broad sense heritability estimates in all four crosses varied from 0.71 to 0.76. High
values of h2BS was observed in cross PS-2 × BD-1 while, cross PS-1 × BD-2 exhibited low
heritability in broad sense. Moderate narrow sense heritability estimates was calculated for ear
length. Maximum (0.59) estimate of narrow sense heritability was observed for the cross PS-2 ×
BD-1 while, minimum (0.40) estimates of heritability in narrow sense was noticed in the cross
PS-2 × BD-2 for this trait.
4.2.9 Ear diameter
Both broad sense and narrow sense heritability estimates for ear diameter are presented in
Table 4.5. High broad sense heritability estimates were observed in all four crosses for ear
weight, ranging from 0.72 to 0.77 in cross PS-2 × BD-2 and PS-2 × BD-1, respectively. Broad
sense heritability estimate of 0.76 was observed for both PS-1 × BD-2. Moderate to high level of
narrow sense heritability estimates were calculated for ear diameter. Maximum (0.63) estimate of
narrow sense heritability was observed for the cross PS-1 × BD-2 while, minimum (0.47)
estimates of heritability in narrow sense was calculated for PS-2 × BD-2 crosses in ear weight.
4.2.10 Grains row-1
Broad and narrow sense heritability estimates for grains row-1 are provided in Table 4.5.
High level of broad sense heritability was calculated for grains row-1 in all four crosses. The
80
range of broad sense heritability for this parameter was 0.66 to 0.71. Maximum broad sense
heritability of 0.71 was found for cross PS-1 × BD-2, followed by cross PS-2 × BD-1 with h2BS
of 0.69. Similarly narrow sense heritability estimates varied from moderate to high range.
Maximum (0.63) narrow sense heritability was reported for cross PS-2 × BD-2, followed by PS-
1 × BD-2 with h2NS 0.61. Likewise, minimum narrow sense heritability estimate of 0.45 was
observed for grains row-1 in cross PS-1 × BD-1.
4.2.11 Grains ear-1
Heritability estimates presented in Table 4.5 revealed high level of broad sense
heritability for grains ear-1 in all four crosses. Broad sense heritability varied from 0.70 to 0.82.
Maximum broad sense heritability of 0.82 was found for cross PS-1 × BD-2, followed by PS-1 x
BD-1 with h2BS of 0.81. The narrow sense heritability estimates showed a range of 0.34 to 0.57
for cross PS-2 × BD-2, PS-1 × BD-1 and PS-1 × BD-2, respectively for this parameter. High
narrow sense heritability of 0.57 was observed for cross PS-1 × BD-1 and PS-1 × BD-2 followed
by PS-2 × BD-1 and PS-2 × BD-2 with 0.61 and 0.34, respectively.
4.2.12 Hundred grain weight
Broad and narrow sense heritability estimates are demonstrated in Table 4.5. It is
obvious from the table that high broad sense heritability estimates were reported in all four
crosses for hundred grain weight. Broad sense heritability estimates for hundred grain weight
ranged from 0.86 to 0.89. High broad sense heritability estimate (0.89) was observed for cross
PS-2 × BD-1, followed by cross PS-2 × BD-2, PS-1 × BD-1 and PS-1 × BD-2 with h2BS of 0.88,
0.87 and 0.86, respectively. Moderate to high narrow sense heritability estimates were observed
in all four crosses for hundred grain weight. Narrow sense heritability ranged from 0.45 to 0.71
for cross PS-1 x BD-1 and PS-2 × BD-1, respectively.
4.2.13 Percent shelling
Heritability estimates of percent shelling presented in Table 4.5 revealed high level of
broad sense heritability for percent shelling in the four crosses. Broad sense heritability estimates
varied from 0.70 to 0.75. Maximum h2BS for percent shelling was observed in cross PS-1 × BD-
1, followed by cross PS-2 × BD-1 with 0.73. Minimum narrow sense heritability of 0.70 was
81
calculated for cross PS-2 × BD-2. Similarly narrow sense heritability estimates occurred in
moderate range. Maximum narrow sense heritability of 0.56 was calculated for cross PS-1 × BD-
2, while minimum (0.46) was observed for cross PS-1 × BD-1.
4.2.14 Expansion volume
Broad and narrow sense heritability estimates for expansion volume are provided in
Table 4.5. High levels of broad sense heritability were calculated for expansion volume in all
four crosses. The range of broad sense heritability for expansion volume was 0.64 to 0.76.
Maximum broad sense heritability of 0.76 was found for cross PS-1 x BD-1, followed by cross
PS-2 × BD-1 with h2BS of 0.68. Minimum broad sense heritability of 0.64 was reported for
expansion volume in PS-1 × BD-2. Similarly estimates of narrow sense heritability were of
moderate level for expansion volume. Maximum (0.50) narrow sense heritability was reported
for cross PS-1 × BD-2, followed by PS-2 × BD-2 with h2NS 0.49. Likewise, minimum narrow
sense heritability estimate of 0.41 was observed for both PS-1 × BD-1 and PS-2 × BD-1.
4.2.15 Percent unpopped grains
Heritability estimates presented in Table 4.5 revealed high level of broad sense
heritability for percent unpopped grains in all four crosses. Broad sense heritability varied from
0.83 to 0.87. Maximum broad sense heritability of 0.87 was found for cross PS-2 × BD-1,
followed by PS-1 × BD-2 with h2BS of 0.86. Minimum (0.83) h2
BS was calculated for cross PS-1
x BD-1. The narrow sense heritability estimates showed a range of 0.50 to 0.74 for cross PS-2 ×
BD-2 and PS-1 × BD-2, respectively for this parameter. High narrow sense heritability of 0.72
was observed for cross PS-2 × BD-1, followed by PS-1 × BD-1 with 0.51.
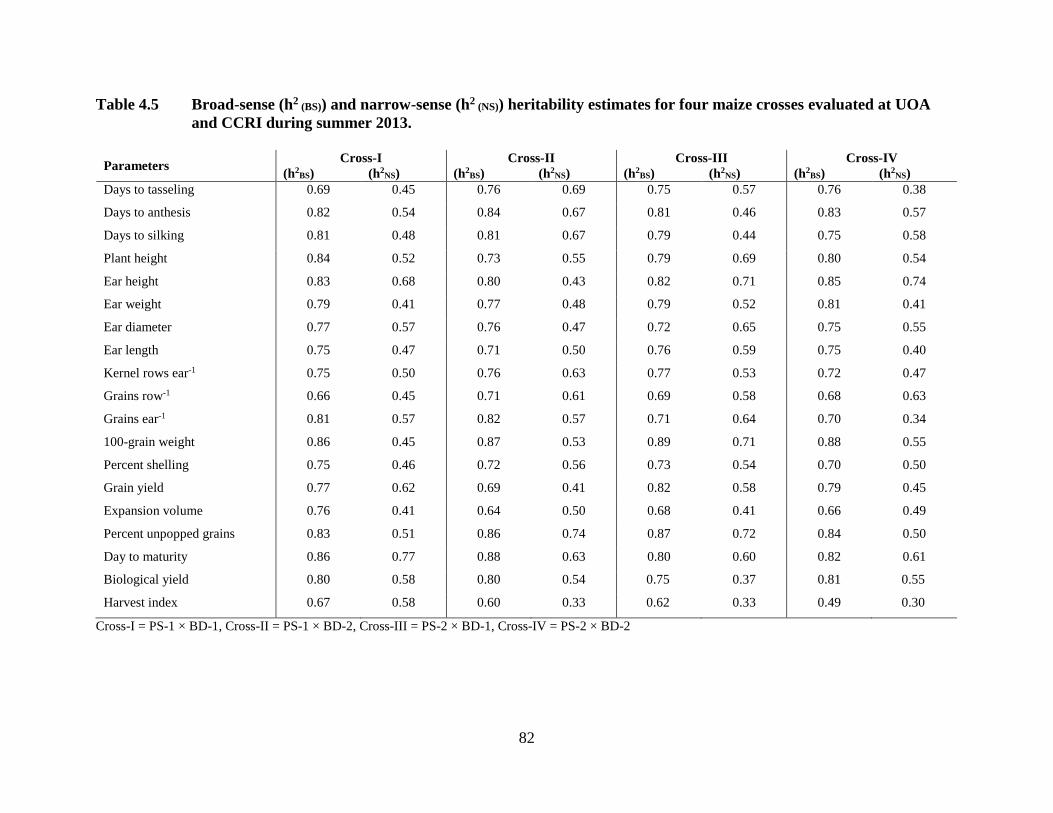
82
Table 4.5 Broad-sense (h2 (BS)) and narrow-sense (h2
(NS)) heritability estimates for four maize crosses evaluated at UOA
and CCRI during summer 2013.
Parameters Cross-I Cross-II Cross-III Cross-IV
(h2BS) (h2
NS) (h2BS) (h2
NS) (h2BS) (h2
NS) (h2BS) (h2
NS)
Days to tasseling 0.69 0.45 0.76 0.69 0.75 0.57 0.76 0.38
Days to anthesis 0.82 0.54 0.84 0.67 0.81 0.46 0.83 0.57
Days to silking 0.81 0.48 0.81 0.67 0.79 0.44 0.75 0.58
Plant height 0.84 0.52 0.73 0.55 0.79 0.69 0.80 0.54
Ear height 0.83 0.68 0.80 0.43 0.82 0.71 0.85 0.74
Ear weight 0.79 0.41 0.77 0.48 0.79 0.52 0.81 0.41
Ear diameter 0.77 0.57 0.76 0.47 0.72 0.65 0.75 0.55
Ear length 0.75 0.47 0.71 0.50 0.76 0.59 0.75 0.40
Kernel rows ear-1 0.75 0.50 0.76 0.63 0.77 0.53 0.72 0.47
Grains row-1 0.66 0.45 0.71 0.61 0.69 0.58 0.68 0.63
Grains ear-1 0.81 0.57 0.82 0.57 0.71 0.64 0.70 0.34
100-grain weight 0.86 0.45 0.87 0.53 0.89 0.71 0.88 0.55
Percent shelling 0.75 0.46 0.72 0.56 0.73 0.54 0.70 0.50
Grain yield 0.77 0.62 0.69 0.41 0.82 0.58 0.79 0.45
Expansion volume 0.76 0.41 0.64 0.50 0.68 0.41 0.66 0.49
Percent unpopped grains 0.83 0.51 0.86 0.74 0.87 0.72 0.84 0.50
Day to maturity 0.86 0.77 0.88 0.63 0.80 0.60 0.82 0.61
Biological yield 0.80 0.58 0.80 0.54 0.75 0.37 0.81 0.55
Harvest index 0.67 0.58 0.60 0.33 0.62 0.33 0.49 0.30
Cross-I = PS-1 × BD-1, Cross-II = PS-1 × BD-2, Cross-III = PS-2 × BD-1, Cross-IV = PS-2 × BD-2
83
4.2.16 Days to maturity
Broad and narrow sense heritability estimates for days to maturity are provided in Table
4.5. High levels of broad sense heritability were calculated for days to maturity in all four
crosses. Broad sense heritability varied from 0.80 to 0.88 for days to maturity. Maximum broad
sense heritability of 0.99 was found for cross PS-1 × BD-2, followed by cross PS-1 × BD-1 with
h2BS of 0.86. Minimum broad sense heritability of 0.80 was observed for days to maturity in
cross PS-2 × BD-1. Similarly narrow sense heritability estimates varied from moderate to high
range. Maximum (0.77) narrow sense heritability was noticed for cross PS-1 × BD-1, followed
by PS-1 × BD-2 with h2NS 0.63. Likewise, minimum narrow sense heritability estimates of 0.60
were observed for PS-2 × BD-1.
4.2.17 Biological yield
Broad and narrow sense heritability estimates for biological yield are provided in Table
4.5. High levels of broad sense heritability were calculated for biological yield in all four crosses.
The range of broad sense heritability for biological yield was 0.75 to 0.81. Maximum broad
sense heritability of 0.81 was found for cross PS-2 × BD-2, followed by cross PS-1 × BD-1 and
PS-1 × BD-2 with h2BS of 0.80. Minimum broad sense heritability of 0.75 was reported for
biological yield in cross PS-2 × BD-1. Similarly estimates of narrow sense heritability were of
moderate level for biological yield. Maximum (0.58) narrow sense heritability was reported for
cross PS-1 × BD-1, followed by PS-2 × BD-2 with h2NS 0.55. Likewise, minimum narrow sense
heritability estimate of 0.37 was observed in cross PS-2 × BD-1.
4.2.18 Harvest index
Broad and narrow sense heritability estimates for harvest index are provided in Table 4.5.
Moderate to high levels of broad sense heritability were calculated for harvest index in all four
crosses. Broad sense heritability estimates for harvest index varied from 0.49 to 0.67. Maximum
broad sense heritability of 0.67 was found for cross PS-1 x BD-1, followed by cross PS-2 × BD-
1 and PS-1 × BD-2 with h2BS of 0.62 and 0.60, respectively. Minimum broad sense heritability of
0.49 was reported for harvest index in cross PS-2 × BD-2. Similarly estimates of narrow sense
heritability were low to moderate level for harvest index. Maximum (0.58) narrow sense
heritability was reported for cross PS-1 × BD-1, followed by PS-1 × BD-2 and PS-1 × BD-1 with
84
h2NS 0.33. Likewise, minimum narrow sense heritability estimate of 0.30 was observed in cross
PS-2 × BD-2.
4.2.19 kernel rows ear-1
Broad and narrow sense heritability estimates for kernel rows ear-1 are provided in Table
4.5. High levels of broad sense heritability were calculated for kernel rows ear-1 in all four
crosses. Broad sense heritability varied from 0.72 to 0.77 for kernel rows ear-1. Maximum broad
sense heritability of 0.77 was found in cross PS-2 × BD-1while, minimum broad sense
heritability of 0.72 was observed in cross PS-2 × BD-2. Similarly narrow sense heritability
estimates varied from moderate to high range. Maximum (0.63) narrow sense heritability was
reported for cross PS-1 × BD-2, followed by PS-2 × BD-1 with h2NS 0.53. Likewise, minimum
narrow sense heritability estimate of 0.47 was observed for PS-2 × BD-2.
4.3 Heterosis
Heterosis also known as hybrid vigor, has been the subject of intense research and
speculation for well over a century however, the basic mechanisms that cause or contribute to
heterosis remain unclear (Coors and Pandey, 1999). Being the lack of understanding, plant
breeders have quite successfully exploited heterosis to increase the vigor of many domesticated
species (Springer and Stupar, 2007). In maize, highly heterozygous crop the heterosis is reported
to cause an increase in yield by 15 % per year (Duvick, 1999). Maize breeders have been looking
for the possibility of predicting heterosis between inbred lines of maize based on physiological,
morphological, molecular marker and biochemical data during the past decades (Smith and
Smith, 1989; Smith et al., 1990 and Ramesh et al., 1995). The results obtained from four maize
crosses (PS-1 × BD-1, PS-1 × BD-2, PS-2 × BD-1 and PS-2 × BD-2) are explained here in detail
to elucidate heterotic pattern for 20 different plant parameters of quantitative nature.
4.3.1 Days to 50% tasseling
Negative nature of mid and better-parent heterosis for days to tasseling was observed
(Table 4.6). Mid-parent showed that maximum heterosis (-7.15 %) of negative nature for days to
50% tasseling was observed in cross PS-1 × BD-1 while, minimum mid-parent heterosis of -5.13
was displayed for the cross PS-1 × BD-2. Similarly, better-parent heterosis for days to tasseling
85
ranged from -3.77 to -2.17%. Maximum better-parent heterosis was calculated for cross PS-2 ×
BD-1, followed by cross PS-1 × BD-1 with negative heterosis of -3.46. Minimum better-parent
heterosis of -2.17 was exhibited by cross PS-1 × BD-2.
4.3.2Days to anthesis
Heterosis magnitudes of both mid and better-parent for days to 50% anthesis are
presented in Table 4.6. Maximum (-6.74 %) mid-parent heterosis of negative nature was
observed for days to 50% anthesis in cross PS-2 × BD-1 while, minimum mid-parent heterosis of
-4.67 was exhibited by the cross PS-2 × BD-2. Maximum (-3.65) better-parent heterosis of
negative magnitude for days to anthesis was expressed by cross PS-2 × BD-1, followed by PS-1
× BD-1 with -3.05. Minimum (-2.22 %) better-parent heterosis was calculated for cross PS-1 ×
BD-2.
4.3.3Days to 50% silking
Negative heterosis of both mid and better-parent was exhibited in all the studied crosses
(Table 4.6) for days to 50% silking. Mid-parent heterosis ranged from -6.48 to -5.07 for the
crosses PS-2 × BD-1 and PS-2 × BD-2, respectively. Better-parent heterosis was of negative
nature with a variant pattern. The maximum better-parent heterosis of -2.46 % was observed for
cross PS-1 × BD-1 while, minimum level of -2.30 was obvious for cross PS-1 × BD-2 with
respect to the parameter of days to silk.
4.3.4 Plant height
Mid-parent heterosis varied from 4.69 to 12.34 % for plant height (Table 4.6). The
maximum mid-parent heterosis of 12.34 % was exhibited in cross PS-1 × BD-1, followed by PS-
2 × BD-2 with mid-parent heterosis of 11.99 %. The least mid-parent heterosis (4.69 %) was
manifested for cross PS-1 × BD-2. The better-parent heterosis with maximum magnitude of
17.66 % was expressed in the cross PS-1 × BD-1, for the parameter of plant height. Similarly the
minimum better-parent heterosis (8.44 %) was recorded for PS-1 × BD-2.
86
4.3.5 Ear height
Both negative and positive magnitudes of mid-parent heterosis were calculated for ear
height. Mid-parent heterosis varied from -0.13 to 14.31 % (Table 4.6). It was indicated that
maximum mid-parent heterosis of 14.31 % was exhibited by the cross PS-2 × BD-1, followed by
cross PS-2 × BD-2 with magnitude of 7.84 % having the same female parent (PS-2). The better-
parent heterosis observed in the present study revealed that maximum better-parent heterosis of
21.75 % was observed for the cross PS-2 × BD-1 while, minimum (-2.07 %) better-parent
heterosis of negative magnitude was exhibited by the cross PS-1 × BD-2 for ear height.
4.3.6 Ear weight
The mid and better parent heterosis values regarding ear weight are provided in Table
4.6. The maximum mid-parent heterosis of 80.56 % was calculated for cross PS-1 × BD-2,
followed by cross PS-1 × BD-1, PS-2 × BD-2 and PS-2 × BD-1 with 65.08, 62.44 and 50.3 %,
respectively. Similarly better parent heterosis for ear weight ranged from 67.10 to 41.36 % for
the cross PS-1 × BD-2 and PS-1 × BD-1, respectively.
4.3.7 Grain yield
Heterotic values for grain yield are presented in Table 4.6. It is revealed from the table
that maximum values of both mid and better-parent heterosis values were calculated for the
crosses having PS-1 as female parent. Maximum mid parent heterosis of 80.73 % was reported
for cross PS-1 × BD-2, followed by PS-1 × BD-1, PS-2 × BD-2 and PS-2 × BD-1 with mid-
parent heterosis of 70.46, 55.90 and 46.56 %, respectively. Better-parent heterosis for grain
yield varied from 62.74 to 42.57 %. Maximum better-parent heterosis of 62.74 % was exhibited
by cross PS-1 × BD-2, followed by 47.21 % for cross PS-1 × BD-1. The minimum better parent
heterosis of 42.57 % was calculated for the cross PS-2 × BD-1.
4.3.8 Days to maturity
Both mid and better-parent heterotic values for days to maturity are presented in Table
4.6. Maximum (-2.91 %) mid-parent heterosis of negative nature was observed for days to
maturity in cross PS-1 × BD-2, followed by -2.68, -2.33 and -2.22 in cross PS-1 × BD-1, cross
87
PS-2 × BD-1 and PS-2 × BD-2, respectively. Similarly better-parent heterosis of maximum (0.57
%) magnitude for days to maturity was expressed by cross PS-2 × BD-2, followed by PS-1 ×
BD-1 with 0.29 %. Minimum (-0.14 %) better-parent heterosis was calculated for cross PS-1 ×
BD-1.
4.3.9 Ear diameter
Positive heterosis of both mid and better-parent was exhibited in all the studied crosses
(Table 4.6) for ear diameter. Mid-parent heterosis ranged from 11.28 to 26.52 for the crosses PS-
1 × BD-2 and PS-2 × BD-1, respectively. Better-parent heterosis was of positive nature and
varied from 16.86 to 5.45 % for ear diameter. The maximum better-parent heterosis of 16.86 %
was observed for cross PS-1 × BD-1 while, minimum level of 5.45 was obvious for cross PS-2 ×
BD-2 with respect to the parameter of ear diameter.
4.3.10 Ear length
Heterotic values for yield related trait, ear length are presented in Table 4.6. It is revealed
from the table that maximum values of both mid and better-parent heterosis values were
calculated for the crosses having PS-1 as female parent and BD-2 as male parent. Maximum mid
and better-parent heterosis of 69.28 and 65.63 % were reported for cross PS-1 × BD-2, followed
by PS-1 × BD-1 with 47.31 and 37.69 % mid and better-parent heterosis, respectively. In better-
parent heterosis, minimum 33.59 % for ear diameter was observed for cross PS-2 × BD-2. Mid
parent heterosis of 45.34 and 35.95 % was calculated for cross PS-2 × BD-2 and PS-2 × BD-1,
respectively. Minimum better parent heterosis of 33.59 % was calculated for the cross PS-2 ×
BD-2.
4.3.11 Kernel rows per ear
Like other yield related traits both mid and better-parent heterosis were of positive nature
for kernel rows ear-1 are presented in Table 4.6. Maximum (41.01 %) mid-parent heterosis with
was observed for kernel rows ear-1 in cross PS-1 × BD-2, followed by 30.56, 21.37 and 18.56 in
cross PS-1 × BD-1, cross PS-2 × BD-2 and PS-2 × BD-1, respectively. Similarly in better-parent
heterosis maximum (40.37 %) magnitude for kernel rows ear-1 was expressed by cross PS-1 ×
88
BD-2, followed by PS-1 × BD-1 with 22.97 %. Minimum (9.11 %) better-parent heterosis was
calculated for cross PS-2 × BD-2.
4.3.12 Grains row-1
Like other yield related traits both mid and better-parent heterosis for kernel rows ear-1
were of positive nature as presented in Table 4.6. Maximum (41.01 %) mid-parent heterosis with
was observed for kernel rows ear-1 in cross PS-1 × BD-2, followed by 30.56, 21.37 and 18.56 in
cross PS-1 × BD-1, cross PS-2 × BD-2 and PS-2 × BD-1, respectively. Similarly in better-parent
heterosis, maximum (40.37 %) magnitude for kernel rows ear-1 was expressed by cross PS-1 ×
BD-2, followed by PS-1 × BD-1 with 22.97 %. Minimum (9.11 %) better-parent heterosis was
calculated for cross PS-2 × BD-2.
4.3.13 Grains ear-1
The mid-parent heterosis varied from 59.28 to 113.86 % for grain ear-1 (Table 4.6). The
maximum mid-parent heterosis of 113.86 % was exhibited in cross PS-1 × BD-1, followed by
PS-1 × BD-2 and PS-2 × BD-1 with mid-parent heterosis of 99.06 and 59.59. The least mid-
parent heterosis (59.28 %) was manifested for cross PS-2 × BD-2. Better-parent heterosis with
maximum magnitude of 86.35 % was expressed in the cross PS-1 × BD-1, for grains ear-1.
Similarly the minimum better-parent heterosis (30.88 %) was recorded for PS-2 × BD-2.
4.3.14 Hundred grain weight
Both mid and better-parent heterosis calculated for 100 grain weight were of positive
nature. Mid-parent heterosis for 100 grain weight varied from 31.76 to 50.12 % (Table 4.6). It
was indicated that maximum (50.12 %) mid-parent heterosis was exhibited by the cross PS-2 ×
BD-1, followed by cross PS-2 × BD-2 with magnitude of 49.41 % having the same female parent
(PS-2). This heterotic study revealed that maximum better-parent heterosis 57.14 % was
observed for the cross PS-2 × BD-2 while, minimum (31.86 %) better-parent heterosis of
positive nature was exhibited by the cross PS-1 × BD-1 for 100 grain weight.
89
4.3.15 Expansion volume
The mid and better parent heterosis values regarding expansion volume are provided in
Table 4.6. Both types of heterosis were of negative nature for expansion volume in all cross. The
maximum (-57.33 %) mid-parent heterosis of negative magnitude was calculated for expansion
volume in cross PS-1 × BD-2, followed by cross PS-1 × BD-1, PS-2 × BD-2 and PS-2 × BD-1
with -39.68, -26.99 and -2.56 %, respectively. Similarly better parent heterosis for ear weight
ranged from -60.59 to -6.03 % for the cross PS-1 × BD-2 and PS-1 × BD-1, respectively.
4.3.16 Percent unpopped grains
Heterotic values for percent unpopped grains are presented in Table 4.6. It is revealed
from the table that for percent unpopped grain maximum values of both mid and better-parent
heterosis values were calculated for the crosses having PS-1 as female parent. Maximum mid
parent heterosis of -31.72 % was reported for cross PS-1 × BD-2, followed by PS-2 × BD-2, PS-
1 × BD-1 and PS-2 × BD-2 with mid-parent heterosis -30.46, -9.28 and -0.31 %, respectively.
Better-parent heterosis for percent unpopped grains varied from -10.21 to 8.85 %. Maximum
better-parent heterosis of (-10.21 %) with negative magnitude was exhibited by cross PS-2 ×
BD-2, followed by cross PS-1 × BD-1 with 8.85 %. The minimum better parent heterosis of 2.25
% was calculated for the cross PS-1 × BD-2.
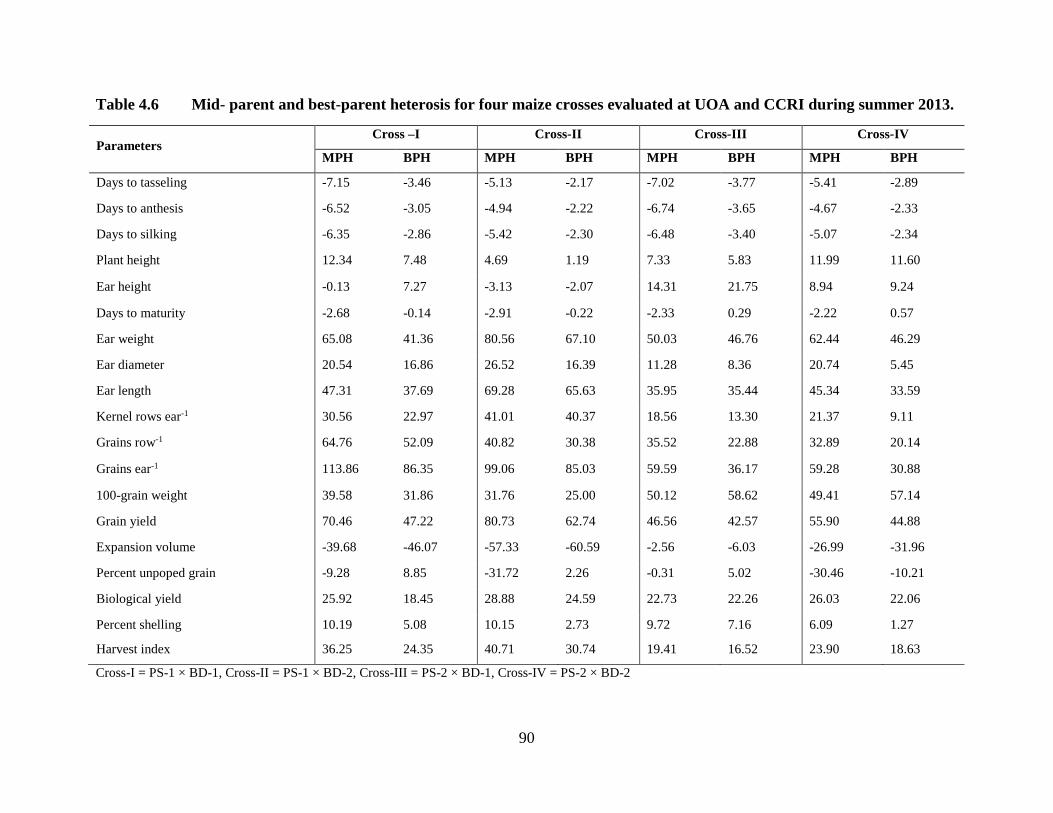
90
Table 4.6 Mid- parent and best-parent heterosis for four maize crosses evaluated at UOA and CCRI during summer 2013.
Parameters Cross –I Cross-II Cross-III Cross-IV
MPH BPH MPH BPH MPH BPH MPH BPH
Days to tasseling -7.15 -3.46 -5.13 -2.17 -7.02 -3.77 -5.41 -2.89
Days to anthesis -6.52 -3.05 -4.94 -2.22 -6.74 -3.65 -4.67 -2.33
Days to silking -6.35 -2.86 -5.42 -2.30 -6.48 -3.40 -5.07 -2.34
Plant height 12.34 7.48 4.69 1.19 7.33 5.83 11.99 11.60
Ear height -0.13 7.27 -3.13 -2.07 14.31 21.75 8.94 9.24
Days to maturity -2.68 -0.14 -2.91 -0.22 -2.33 0.29 -2.22 0.57
Ear weight 65.08 41.36 80.56 67.10 50.03 46.76 62.44 46.29
Ear diameter 20.54 16.86 26.52 16.39 11.28 8.36 20.74 5.45
Ear length 47.31 37.69 69.28 65.63 35.95 35.44 45.34 33.59
Kernel rows ear-1 30.56 22.97 41.01 40.37 18.56 13.30 21.37 9.11
Grains row-1 64.76 52.09 40.82 30.38 35.52 22.88 32.89 20.14
Grains ear-1 113.86 86.35 99.06 85.03 59.59 36.17 59.28 30.88
100-grain weight 39.58 31.86 31.76 25.00 50.12 58.62 49.41 57.14
Grain yield 70.46 47.22 80.73 62.74 46.56 42.57 55.90 44.88
Expansion volume -39.68 -46.07 -57.33 -60.59 -2.56 -6.03 -26.99 -31.96
Percent unpoped grain -9.28 8.85 -31.72 2.26 -0.31 5.02 -30.46 -10.21
Biological yield 25.92 18.45 28.88 24.59 22.73 22.26 26.03 22.06
Percent shelling 10.19 5.08 10.15 2.73 9.72 7.16 6.09 1.27
Harvest index 36.25 24.35 40.71 30.74 19.41 16.52 23.90 18.63
Cross-I = PS-1 × BD-1, Cross-II = PS-1 × BD-2, Cross-III = PS-2 × BD-1, Cross-IV = PS-2 × BD-2
91
4.3.17 Biological yield
Like other yield related traits both mid and better-parent heterosis were of positive
magnitudes for biological yield (Table 4.6). Maximum (28.88 %) mid-parent heterosis was
observed in cross PS-1 × BD-2 for biological yield, followed by cross PS-2 × BD-2, cross PS-1 ×
BD-1 and PS-2 × BD-1 with 26.03, 25.92 and 22.73, respectively. Similarly in better-parent
heterosis maximum (24.59 %) magnitude for biological yield was expressed by cross PS-1 ×
BD-2 while, minimum (18.45 %) better-parent heterosis was calculated for cross PS-1 × BD-1.
4.3.18 Percent shelling
The mid-parent heterosis varied from 10.19 to 6.09 % for percent shelling (Table 4.6).
The maximum mid-parent heterosis of 10.19 % was exhibited in cross PS-1 × BD-1, followed by
PS-1 × BD-2 and PS-2 × BD-1 with mid-parent heterosis of 10.15 and 9.72, respectively. The
least mid-parent heterosis (6.09 %) was manifested for cross PS-2 × BD-2. Similarly better-
parent heterosis with maximum magnitude of 7.16 % was expressed in the cross PS-2 × BD-1,
for percent shelling. Likewise, minimum better-parent heterosis (1.27 %) was recorded for PS-2
× BD-2.
4.3.19 Harvest index
Both mid and better-parent heterosis of positive magnitude were observed for harvest
index (Table 4.6). Mid-parent heterosis for harvest index varied from 36.25 to 40.71 %. It was
indicated that maximum (40.71 %) mid-parent heterosis was exhibited by the cross PS-1 × BD-2,
followed by cross PS-1 x BD-1 with magnitude of 36.25 % having the same female parent (PS-
1). Heterotic study revealed that maximum better-parent heterosis of 30.74 % was observed for
the cross PS-1 × BD-2 while, minimum (16.52 %) better-parent heterosis of positive magnitude
was exhibited by the cross PS-2 × BD-1 for harvest index.
4.4Genotypic and phenotypic association among traits
The genetic and phenotypic correlation coefficients among quantitative parameters
determine the efficiency of a breeding program. The knowledge of correlation provide assistance
in the choice of direct or indirect selection (Joshi, 2005; Bocanski et al., 2009).Genetic and
92
phenotypic coefficients results obtained in the present study among different flowering, plant,
yield associated and popping characters for four maize crosses i.e., PS-1 × BD-1, PS-1 × BD-2,
PS-2 × BD-1 and PS-2 × BD-2 derived from two diverse groups of contrasting inbred lines are
presented in Table 4.7 through Table 4.10.
4.4.1 Days to tasseling
Positive and significant correlations were observed among the flowering characters both
at genetic and phenotypic level (Table 4.7-4.10). In three crosses i.e., PS-1 × BD-1, PS-1 × BD-2
and PS-2 × BD-2, the magnitude of genetic correlation of days to tasseling was negatively non-
significant with ear weight and grain yield, except PS-2 × BD-1 with magnitude of -0.82 for each
ear weight and grain yield with tasseling (Table 4.9). In cross PS-2 × BD-1 negative and
significant correlation of days to tasseling with ear weight and grain yield with values of -0.78
and -0.79 at phenotypic level (Table 4.9). Similarly in cross PS-2 × BD-2, the phenotypic
association of days to tasseling was of negative nature with significant magnitude (rp= -0.62 and
rP= -0.56). The genotypic correlation of days to tasseling was found negatively significant with
plant height only in two of the four crosses i.e., PS-1 × BD-1 (rg= -0.92) and PS-2 × BD-1 (rg = -
0.93). Genetic correlation was negatively non-significant with all other characters except
expansion volume and number of unpopped grains. Phenotypic correlation of days to tasseling
with ear diameter, ear length, kernels per row, and number of grains per cob in cross. Likewise in
cross PS-1 × BD-2 phenotypic correlation of days tasseling with ear diameter and unpopped
grains was negatively and positively significant, respectively. Genetic correlation of days to
tasseling with grains per row and grains per ear was negatively significant in both cross PS-2 ×
BD-1 and PS-2 × BD-2. In cross PS-2 × BD-1 days to tasseling was significantly correlated with
kernels per row and harvest index at genetic level. Phenotypic correlation of days to tasseling
with ear diameter, ear length, kernel rows, grains per row, grain per cob biological yield and
harvest index was found negatively significant in both crosses i.e. PS-2 × BD-1 and PS-2 × BD-2
days to tasseling was non-significantly correlated with ear height in all the crosses, except PS-1 ×
BD-1 with rg = -0.98. Phenotypic association of days to tasseling with plant height was of
negative nature with significant magnitude in all the crosses. Tasseling was negatively and
significantly correlated at phenotypic level with ear height in the three crosses i.e. PS-1 × BD-1,
PS-2 × BD-1 and PS-2 × BD-2 with magnitudes of -0.65, -0.91 and -0.70, respectively.
93
4.4.2 Days to anthesis
Positive and significant correlation was calculated among days to anthesis, silking and
maturity both at genetic and phenotypic level in all crosses (Table 4.7-4.10). Days to anthesis,
number of kernel rows, grains per row and grains per cob were negatively and significantly
correlated at genetic level in cross PS-2 × BD-1 and PS-2 × BD-2. Negatively significant genetic
correlation (rg= -0.84) was observed between days to anthesis and ear diameter in cross PS-2 ×
BD-2. Days to anthesis was negatively and non-significantly correlated with ear weight and grain
yield in all crosses at genetic level. Negatively significant genetic correlation was observed
between days to anthesis and plant height in both crosses i.e. PS-1 × BD-1 (rg = -0.90) and PS-2
× BD-1 (-0.89). In both cross PS-2 × BD-1 and PS-2 × BD-2 phenotypic correlation of days to
anthesis with ear diameter, ear length, kernel rows, grains per row, grains per cob biological
yield and harvest index was negatively significant. A phenotypic correlation of negative nature
with significant magnitude was observed between days to anthesis, plant and ear height in all
four crosses, except PS-1 × BD-2. Negatively phenotypic association of days to anthesis with ear
weight and grain yield was exhibited in both crosses PS-2 × BD-1 (rp = -0.75, -0.76) and PS-2 ×
BD-2 (rp = -0.60, -0.55) having the same female parent. The other two crosses having PS-1 as
female parent showed also negative association but with non-significant magnitude at phenotypic
level among days to anthesis, ear weight and grain yield. Days to anthesis was found positively
and significantly correlated with percent unpopped grains in all crosses except PS-2 × BD-1.
Phenotypic correlation (rp = 0.52) of days to anthesis was positively significant with expansion
volume in cross PS-2 × BD-2.
4.4.3 Days to silking
Association between days to silking and maturity was positively significant both at
genetic and phenotypic level in all crosses (Table 4.7-4.10). Negative and significant association
was calculated between days to silking and plant height in cross PS-1 × BD-1 and PS-2 × BD-1
both, having BD-1 as male parent. Days to silking was negatively but non-significantly
correlated with ear weight and grain yield at genetic level. Phenotypic correlation of days to
silking with plant height, ear height, ear weight and grain yield was negatively significant in
cross PS-2 × BD-1 (rp = -0.78, -0.93, -0.73 and -0.73) and PS-2 × BD-2 (-0.51, -0.71, -0.56 and -
0.48). Similarly in cross PS-1 × BD-1, phenotypic association of days to silking with plant and
94
ear height was negative and significant, while in cross PS-1 × BD-2 only plant height was
negatively but significantly correlated with silking. Genetic correlation of days to silking with
kernel rows, grains per row and grains per cob was negatively significant in both crosses PS-2 ×
BD-1 and PS-2 × BD-2. Ear diameter was also found negatively correlated (-0.93) with days to
silking at genetic level in cross PS-2 × BD-2. Both ear weight and grain yield were negatively
but non-significantly correlated with days to silking in cross PS-1 × BD-1 and PS-1 × BD-2.
Phenotypic correlation of days to silking with ear length and unpopped grains was significantly
negative in cross PS-1 × BD-1. Likewise, phenotypic association of days to silking with percent
unpopped grains was positively significant in all crosses except, PS-2 × BD-1. In cross PS-2 ×
BD-1 and PS-2 × BD-2, days to silking was negatively associated with ear diameter, ear length,
kernel rows, grains per row and grains per cob at phenotypic level. Similarly expansion volume
was positively correlated with days to silking in cross PS-2 × BD-2.
4.4.4 Plant height
Genetic correlation of plant height with days to maturity was negative and non-significant
in all crosses except, PS-1 × BD-1 (Table 4.7). Plant height was positively and significantly
correlated with ear weight and grain yield at genotypic level in both crosses i.e. PS-2 × BD-1and
PS-2 × BD-2 with magnitude of (0.97 & 0.89) and (0.97 & 0.96), respectively. Similarly, genetic
correlation between plant and ear height was positive but non-significant in all crosses, except
PS-2 × BD-2 (rg = 0.90). Phenotypic correlation ranging from 0.46 to 0.91 between plant height
and grain yield was of significant nature in all the crosses except, PS-1 × BD-2, where a positive
but non-significant correlation of 0.41 was observed. Genetic association of plant height with all
other traits was positively non-significant except, expansion volume and unpopped grains. In
cross PS-1 × BD-1 phenotypic association of plant height with ear length, grains per row, grains
per cob and hundred grain weight was significant (rp = 0.54, 0.52, 0.52 and 0.48). Plant height
and unpopped grains were negatively correlated at phenotypic level in all crosses except, PS-2 ×
BD-2. Positively significant phenotypic correlation of plant height with ear height and ear weight
is obvious from Table 4.9 in cross PS-2 × BD-1and PS-2 × BD-2. Similarly in cross PS-1 × BD-
2 also showed positive and significant correlation of 0.46 between plant height and ear weight at
phenotypic level. Phenotypic association of plant height with ear characters was positively
significant in cross PS-1 × BD-2 while, negatively significant with unpopped grains (rp = -0.67).
95
Genetic correlation of plant height and ear diameter (rg = 0.94) was positively significant in cross
PS-1 × BD-2. Correlation of plant height with ear characteristics, hundred grain weight and
biological yield was positively significant at genotypic level both in cross PS-2 × BD-1 and PS-2
× BD-2. Genetic correlation of plant height with kernels per row and harvest index was also
found positively significant in cross PS-2 × BD-1 and PS-2 × BD-2, respectively. Phenotypic
correlation of plant height with ear length, kernel rows, grains per row, grains per cob, hundred
grain weight, biological yield and harvest index was positively significant in both cross PS-2 ×
BD-1 and PS-2 × BD-2. Plant height was negatively and significantly correlated with expansion
volume and unpopped grains in cross PS-2 × BD-2.
4.4.5 Ear height
Genetic correlation of ear height with days to maturity was negatively significant (rg = -
0.84, -0.90) in cross PS-1 × BD-1 and PS-2 × BD-1 while, in the other two crosses the
association was negative but non-significant (Table 4.7-4.10). Genetic correlation of ear height
with ear weight was non-significant in all the crosses, while positively significant in cross PS-2 ×
BD-2 at phenotypic level. Likewise, phenotypic correlation of ear height with ear weight and
grain yield was positive and significant in cross PS-1 × BD-2 (rp =0.77, 0.71) while, negatively
significant in cross PS-2 × BD-1 (rp = -0.75, -0.74). Genetic association among ear height, kernel
rows, grains per row and grains per cob was positively significant in cross PS-2 × BD-1. Similar
association was also calculated for ear height with grains per row and hundred grain weight in
cross PS-2 × BD-2. Phenotypic correlation of ear height with days to maturity was negative but
significant in all crosses except, PS-1 × BD-2. Correlation between ear height and unpopped
grains was also negative but significant in cross PS-1 × BD-1 at phenotypic level. Phenotypic
correlation of ear height with ear length, kernel rows, grains per row and grains per cob was
significant but of negative nature in cross PS-1 × BD-2 while, positively significant in both cross
PS-2 × BD-1 and PS-2 × BD-2. In cross PS-2 × BD-1 positively significant correlation was
observed among ear height, ear diameter, biological yield and harvest index. Phenotypic
correlation of ear height with biological yield and harvest index was negative but significant in
cross PS-1 × BD-2 while, positively correlated with expansion volume in the same cross. In
contrast association of ear height and expansion volume (rp = -0.51) was negatively significant in
96
cross PS-2 × BD-2. Phenotypic correlation of ear height with unpopped grains was negatively
significant (rp = 0.56) in cross PS-1 × BD-1.
4.4.6 Ear weight
Ear weight was positively and significantly correlated with ear characteristics, grain
yield, biological yield and harvest index in all crosses at genetic level. Genetic correlation of ear
weight with expansion volume was negatively significant in all crosses except, PS-2 × BD-1
where the association was only negative in nature (Table 4.9). Phenotypic association of ear
weight with percent shelling was positive and significant in three of the four crosses. High
magnitude of positive and significant correlation was observed in all the crosses between ear
weight and grain yield both at genetic (rg = 0.98, 0.99, 0.96 and 0.99, respectively) and
phenotypic (rp = 0.98, 0.99, 0.95 and 0.97, respectively) level. Likewise phenotypic association
of ear weight with expansion volume was negatively significant in all crosses except PS-2 × BD-
1. Ear weight was significantly correlated (rp = -0.66) with unpopped grain in cross PS-2 × BD-2
at phenotypic level. Correlation of ear weight with yield related traits ranged from 0.68 to 0.99.
Highly positive and significant correlation of ear weight was observed with ear length, ear
diameter, kernel rows, grains per row, grains per cob, biological yield and harvest index in all
four studied crosses at phenotypic level.
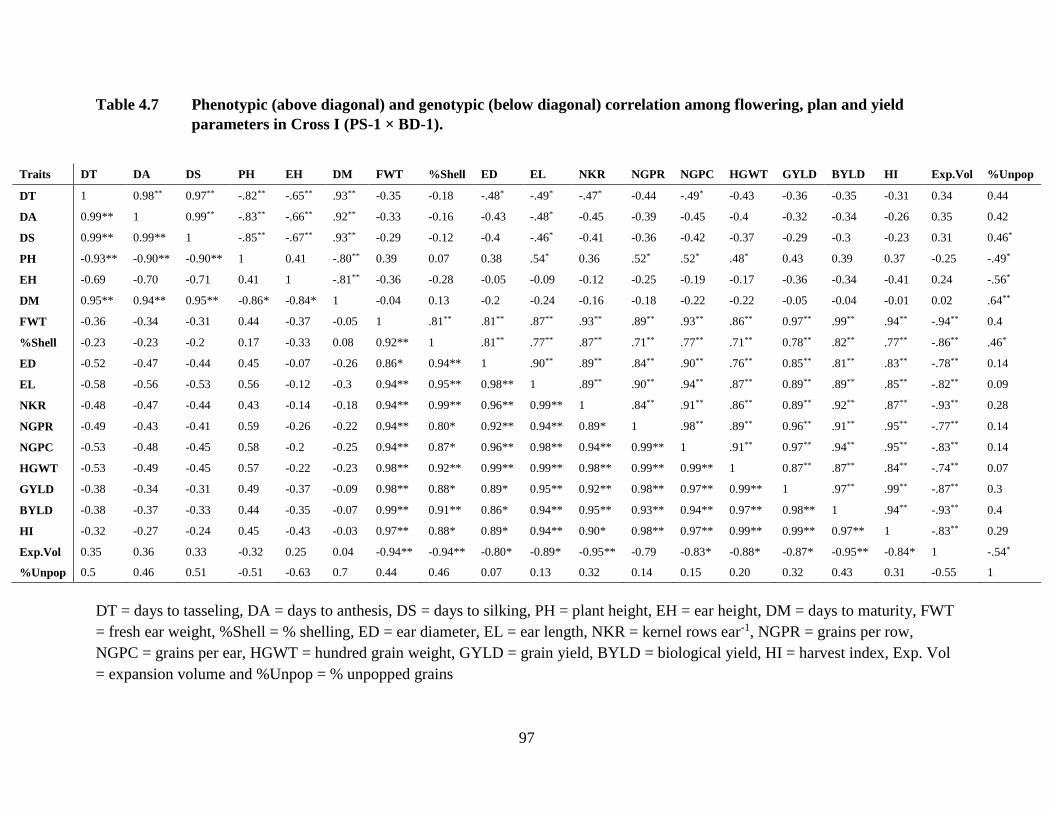
97
Table 4.7 Phenotypic (above diagonal) and genotypic (below diagonal) correlation among flowering, plan and yield
parameters in Cross I (PS-1 × BD-1).
Traits DT DA DS PH EH DM FWT %Shell ED EL NKR NGPR NGPC HGWT GYLD BYLD HI Exp.Vol %Unpop
DT 1 0.98** 0.97** -.82** -.65** .93** -0.35 -0.18 -.48* -.49* -.47* -0.44 -.49* -0.43 -0.36 -0.35 -0.31 0.34 0.44
DA 0.99** 1 0.99** -.83** -.66** .92** -0.33 -0.16 -0.43 -.48* -0.45 -0.39 -0.45 -0.4 -0.32 -0.34 -0.26 0.35 0.42
DS 0.99** 0.99** 1 -.85** -.67** .93** -0.29 -0.12 -0.4 -.46* -0.41 -0.36 -0.42 -0.37 -0.29 -0.3 -0.23 0.31 0.46*
PH -0.93** -0.90** -0.90** 1 0.41 -.80** 0.39 0.07 0.38 .54* 0.36 .52* .52* .48* 0.43 0.39 0.37 -0.25 -.49*
EH -0.69 -0.70 -0.71 0.41 1 -.81** -0.36 -0.28 -0.05 -0.09 -0.12 -0.25 -0.19 -0.17 -0.36 -0.34 -0.41 0.24 -.56*
DM 0.95** 0.94** 0.95** -0.86* -0.84* 1 -0.04 0.13 -0.2 -0.24 -0.16 -0.18 -0.22 -0.22 -0.05 -0.04 -0.01 0.02 .64**
FWT -0.36 -0.34 -0.31 0.44 -0.37 -0.05 1 .81** .81** .87** .93** .89** .93** .86** 0.97** .99** .94** -.94** 0.4
%Shell -0.23 -0.23 -0.2 0.17 -0.33 0.08 0.92** 1 .81** .77** .87** .71** .77** .71** 0.78** .82** .77** -.86** .46*
ED -0.52 -0.47 -0.44 0.45 -0.07 -0.26 0.86* 0.94** 1 .90** .89** .84** .90** .76** 0.85** .81** .83** -.78** 0.14
EL -0.58 -0.56 -0.53 0.56 -0.12 -0.3 0.94** 0.95** 0.98** 1 .89** .90** .94** .87** 0.89** .89** .85** -.82** 0.09
NKR -0.48 -0.47 -0.44 0.43 -0.14 -0.18 0.94** 0.99** 0.96** 0.99** 1 .84** .91** .86** 0.89** .92** .87** -.93** 0.28
NGPR -0.49 -0.43 -0.41 0.59 -0.26 -0.22 0.94** 0.80* 0.92** 0.94** 0.89* 1 .98** .89** 0.96** .91** .95** -.77** 0.14
NGPC -0.53 -0.48 -0.45 0.58 -0.2 -0.25 0.94** 0.87* 0.96** 0.98** 0.94** 0.99** 1 .91** 0.97** .94** .95** -.83** 0.14
HGWT -0.53 -0.49 -0.45 0.57 -0.22 -0.23 0.98** 0.92** 0.99** 0.99** 0.98** 0.99** 0.99** 1 0.87** .87** .84** -.74** 0.07
GYLD -0.38 -0.34 -0.31 0.49 -0.37 -0.09 0.98** 0.88* 0.89* 0.95** 0.92** 0.98** 0.97** 0.99** 1 .97** .99** -.87** 0.3
BYLD -0.38 -0.37 -0.33 0.44 -0.35 -0.07 0.99** 0.91** 0.86* 0.94** 0.95** 0.93** 0.94** 0.97** 0.98** 1 .94** -.93** 0.4
HI -0.32 -0.27 -0.24 0.45 -0.43 -0.03 0.97** 0.88* 0.89* 0.94** 0.90* 0.98** 0.97** 0.99** 0.99** 0.97** 1 -.83** 0.29
Exp.Vol 0.35 0.36 0.33 -0.32 0.25 0.04 -0.94** -0.94** -0.80* -0.89* -0.95** -0.79 -0.83* -0.88* -0.87* -0.95** -0.84* 1 -.54*
%Unpop 0.5 0.46 0.51 -0.51 -0.63 0.7 0.44 0.46 0.07 0.13 0.32 0.14 0.15 0.20 0.32 0.43 0.31 -0.55 1
DT = days to tasseling, DA = days to anthesis, DS = days to silking, PH = plant height, EH = ear height, DM = days to maturity, FWT
= fresh ear weight, %Shell = % shelling, ED = ear diameter, EL = ear length, NKR = kernel rows ear-1, NGPR = grains per row,
NGPC = grains per ear, HGWT = hundred grain weight, GYLD = grain yield, BYLD = biological yield, HI = harvest index, Exp. Vol
= expansion volume and %Unpop = % unpopped grains
98
4.4.7 Days to maturity
Genetic correlation of days to maturity was negatively non-significant in nature with all
traits except, percent shelling, expansion volume and unpopped grains in cross PS-1 × BD-1
(Table 4.7). In cross PS-1 × BD-2 genetic association of days to maturity with percent unpopped
grains was positively significant (0.80) in nature while, positive but non-significantly correlated
with percent shelling, grains per row, grains per cob, grain yield, biological yield, harvest index
and popping expansion. Phenotypic correlation of days to maturity was non-significant with
most of the studied traits except, expansion volume in cross PS-1 × BD-1 and PS-1 × BD-2.
Genetic correlation of days to maturity was negatively significant with grains per row and grains
per cob in cross PS-2 × BD-1 while positively non-significant with expansion volume and
unpopped grains. Similarly in cross PS-2 × BD-2 genetic correlation of days to maturity was also
negative and significant with ear diameter, kernel rows, grains per row and grains per cob.
Phenotypic correlation of days to maturity was negatively significant with ear diameter, kernel
rows, grains per row and grains per cob in both crosses PS-2 × BD-1and PS-2 × BD-2. Days to
maturity was positively and significantly correlated with unpopped grains at phenotypic level in
cross PS-2 × BD-2.
4.4.8 Percent shelling
Both genetic and phenotypic associations are presented in Table 4.7-4.10. Shelling
percentage was positive and significantly correlated with ear diameter, ear length, kernel rows,
grains per row, grains per cob, hundred grain weight, grain yield, biological yield and harvest
index at genetic level while, genetic correlation with expansion volume was negatively
significant in cross PS-1 × BD-1. In both cross PS-2 × BD-2 and PS-1 × BD-2, genetic
correlation of shelling percentage with all other traits was positive but non-significant except,
expansion volume in both crosses and unpopped grains in later one. Genetic correlation was
positively significant among shelling percentage, ear length, hundred grain weight, grain yield,
biological yield and harvest index in cross PS-2 × BD-1. Like all other crosses genetic
association between shelling percentage and expansion volume was negative and non-significant.
Phenotypic correlation of shelling percentage with expansion volume was negative but
significant in two crosses (PS-1 × BD-1 and PS-1 × BD-2) while, negative but non-significant in
other two crosses (PS-2 × BD-1 and PS-2 × BD-2). Phenotypically shelling percentage was
99
positively and significantly correlated with ear diameter, ear length, number of kernel rows,
grains per row, grains per cob, hundred grain weight, grain yield, biological yield, harvest index
and unpopped grains in cross PS-1 × BD-1. Similar positive and significant correlation of
shelling percentage with yield, yield related and ear related traits was observed in cross PS-1 ×
BD-2. In cross PS-2 × BD-2 phenotypic correlation of shelling percentage with other traits was
non-significant. Positive and significant correlation was observed among shelling percentage, ear
length, hundred grain weight, grain yield, biological yield, harvest index and percent unpopped
grains in cross PS-2 × BD-1.
4.4.9 Ear diameter
The genetic correlation of ear diameter in cross PS-1 × BD-1 with ear length, kernel
rows, grains per row, grains per cob, hundred grain weight, grain yield, biological yield and
harvest index was significantly positive as 0.98, 0.96, 0.92, 0.96, 0.98, 89, 0.86 and 0.89,
respectively Table 4.7-4.10. Ear diameter and expansion volume were negatively significant (rg =
-0.80) at genetic level in cross PS-1 × BD-1. Both in cross PS-2 × BD-1 and PS-2 × BD-2
genetic correlation of ear diameter with kernel rows, grains per row and grains per cob were
positively significant (rg = 0.94, 0.91, 0.92 and 0. 97, 0.98, 0.96). In cross PS-2 × BD-2 ear
diameter and unpopped grains were negatively and significantly correlated with each other,
similar negative association with non-significant nature between these traits was also observed in
cross PS-2 × BD-1. Genetic association among ear diameter, ear length, kernel rows and grains
per cob was positively significant in cross PS-1 × BD-2. Phenotypic correlation in both cross PS-
1 × BD-1 and PS-1 × BD-2 of ear diameter was positively significant with traits except,
expansion volume where that association was negative and significant. Ear diameter and percent
unpopped grains were negatively significant at phenotypic level (rp = -0.54) in cross PS-1 × BD-
2. In cross PS-2 × BD-1 ear diameter was positively and significantly correlated with kernel
rows, grains per row, grains per cob and hundred grain weight while, negatively associated with
unpopped grains. Similarly in cross PS-2 × BD-2 phenotypic correlation among ear diameter, ear
length, kernel rows, grains per row, grains per cob, grain yield, biological yield and harvest index
was positively significant. Both expansion volume and percent unpopped grains were negatively
correlated (rp = -0.62, -0.89) with ear diameter in cross PS-2 × BD-1.
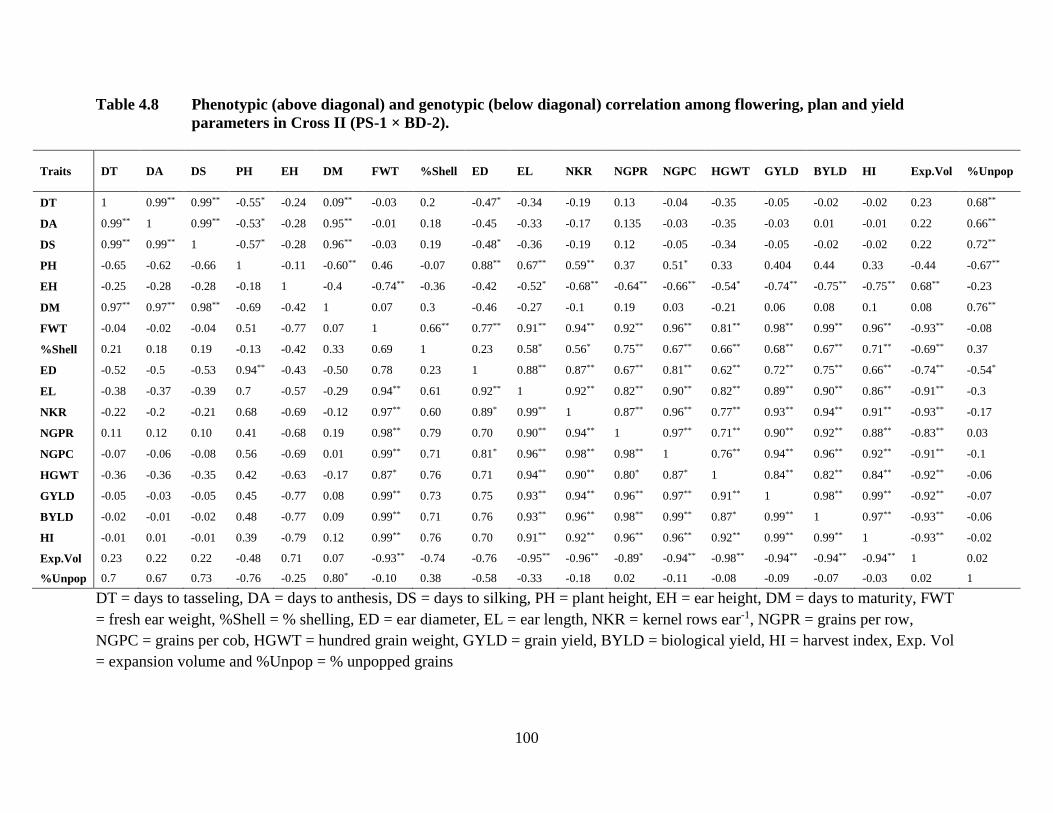
100
Table 4.8 Phenotypic (above diagonal) and genotypic (below diagonal) correlation among flowering, plan and yield
parameters in Cross II (PS-1 × BD-2).
Traits DT DA DS PH EH DM FWT %Shell ED EL NKR NGPR NGPC HGWT GYLD BYLD HI Exp.Vol %Unpop
DT 1 0.99** 0.99** -0.55* -0.24 0.09** -0.03 0.2 -0.47* -0.34 -0.19 0.13 -0.04 -0.35 -0.05 -0.02 -0.02 0.23 0.68**
DA 0.99** 1 0.99** -0.53* -0.28 0.95** -0.01 0.18 -0.45 -0.33 -0.17 0.135 -0.03 -0.35 -0.03 0.01 -0.01 0.22 0.66**
DS 0.99** 0.99** 1 -0.57* -0.28 0.96** -0.03 0.19 -0.48* -0.36 -0.19 0.12 -0.05 -0.34 -0.05 -0.02 -0.02 0.22 0.72**
PH -0.65 -0.62 -0.66 1 -0.11 -0.60** 0.46 -0.07 0.88** 0.67** 0.59** 0.37 0.51* 0.33 0.404 0.44 0.33 -0.44 -0.67**
EH -0.25 -0.28 -0.28 -0.18 1 -0.4 -0.74** -0.36 -0.42 -0.52* -0.68** -0.64** -0.66** -0.54* -0.74** -0.75** -0.75** 0.68** -0.23
DM 0.97** 0.97** 0.98** -0.69 -0.42 1 0.07 0.3 -0.46 -0.27 -0.1 0.19 0.03 -0.21 0.06 0.08 0.1 0.08 0.76**
FWT -0.04 -0.02 -0.04 0.51 -0.77 0.07 1 0.66** 0.77** 0.91** 0.94** 0.92** 0.96** 0.81** 0.98** 0.99** 0.96** -0.93** -0.08
%Shell 0.21 0.18 0.19 -0.13 -0.42 0.33 0.69 1 0.23 0.58* 0.56* 0.75** 0.67** 0.66** 0.68** 0.67** 0.71** -0.69** 0.37
ED -0.52 -0.5 -0.53 0.94** -0.43 -0.50 0.78 0.23 1 0.88** 0.87** 0.67** 0.81** 0.62** 0.72** 0.75** 0.66** -0.74** -0.54*
EL -0.38 -0.37 -0.39 0.7 -0.57 -0.29 0.94** 0.61 0.92** 1 0.92** 0.82** 0.90** 0.82** 0.89** 0.90** 0.86** -0.91** -0.3
NKR -0.22 -0.2 -0.21 0.68 -0.69 -0.12 0.97** 0.60 0.89* 0.99** 1 0.87** 0.96** 0.77** 0.93** 0.94** 0.91** -0.93** -0.17
NGPR 0.11 0.12 0.10 0.41 -0.68 0.19 0.98** 0.79 0.70 0.90** 0.94** 1 0.97** 0.71** 0.90** 0.92** 0.88** -0.83** 0.03
NGPC -0.07 -0.06 -0.08 0.56 -0.69 0.01 0.99** 0.71 0.81* 0.96** 0.98** 0.98** 1 0.76** 0.94** 0.96** 0.92** -0.91** -0.1
HGWT -0.36 -0.36 -0.35 0.42 -0.63 -0.17 0.87* 0.76 0.71 0.94** 0.90** 0.80* 0.87* 1 0.84** 0.82** 0.84** -0.92** -0.06
GYLD -0.05 -0.03 -0.05 0.45 -0.77 0.08 0.99** 0.73 0.75 0.93** 0.94** 0.96** 0.97** 0.91** 1 0.98** 0.99** -0.92** -0.07
BYLD -0.02 -0.01 -0.02 0.48 -0.77 0.09 0.99** 0.71 0.76 0.93** 0.96** 0.98** 0.99** 0.87* 0.99** 1 0.97** -0.93** -0.06
HI -0.01 0.01 -0.01 0.39 -0.79 0.12 0.99** 0.76 0.70 0.91** 0.92** 0.96** 0.96** 0.92** 0.99** 0.99** 1 -0.93** -0.02
Exp.Vol 0.23 0.22 0.22 -0.48 0.71 0.07 -0.93** -0.74 -0.76 -0.95** -0.96** -0.89* -0.94** -0.98** -0.94** -0.94** -0.94** 1 0.02
%Unpop 0.7 0.67 0.73 -0.76 -0.25 0.80* -0.10 0.38 -0.58 -0.33 -0.18 0.02 -0.11 -0.08 -0.09 -0.07 -0.03 0.02 1
DT = days to tasseling, DA = days to anthesis, DS = days to silking, PH = plant height, EH = ear height, DM = days to maturity, FWT
= fresh ear weight, %Shell = % shelling, ED = ear diameter, EL = ear length, NKR = kernel rows ear-1, NGPR = grains per row,
NGPC = grains per cob, HGWT = hundred grain weight, GYLD = grain yield, BYLD = biological yield, HI = harvest index, Exp. Vol
= expansion volume and %Unpop = % unpopped grains
101
4.4.10 Ear length
Both the genetic and phenotypic correlations are presented in Table 4.7-4.10 for four
studied crosses. Genetic correlation of ear length was positively high and significant with
number of kernel rows, grains per row, grains per cob, hundred grain weight, grain yield,
biological yield and harvest index in cross PS-1 × BD-1 and PS-1 × BD-2, while negative and
significant correlation was obvious between ear length and expansion volume in the same two
crosses. Similarly phenotypic correlation of ear length with other traits was also of the same
pattern in these two crosses (PS-1 × BD-1 and PS-1 × BD-2). Phenotypic correlation of ear
length with percent unpopped grains was negative and non-significant in both crosses (PS-1 ×
BD-1 and PS-1 × BD-2). Genetic correlation of ear length was positively significant with
hundred grain weight, grain yield, biological yield and harvest index in cross PS-2 × BD-1.
Similarly phenotypic correlation in cross PS-2 × BD-1 was also positive and significant among
ear length, kernel rows, grains per row, grains per cob, hundred grin weight, grain yield,
biological yield and harvest index. Both genotypic and phenotypic correlations of ear length with
kernel rows, grains per row, grains per cob, grain yield, biological yield and harvest index were
positively significant in cross PS-2 × BD-2 while, negatively and significantly correlated with
expansion volume. Phenotypic correlation of ear length with percent unpopped grains was also
negatively significant in cross PS-2 × BD-2.
4.4.11 Kernel rows-1
Associations, both at genetic and phenotypic level among number of kernel rows, number
of grains per row, number of grains per cob, hundred grain weight, grain yield, biological yield
and harvest index were positively high and significant in cross PS-1 × BD-1 and PS-1 × BD-2
(Table 4.7-4.10). Genetic and phenotypic association between number of kernel rows and
expansion volume were negatively significant in both these crosses PS-1 × BD-1 and PS-1 ×
BD-2, having female parent in common. In cross PS-2 × BD-1 genetic correlation of number of
kernel rows was positively significant only with number of grains per row and number of grains
per row while, phenotypic correlation was positively significant with all yield related traits
except, expansion volume and unpopped grains. Genetic correlation of number of kernel rows
with number of grains per row, number of grains per cob and biological yield was quite high
with positive and significant nature in cross PS-2 × BD-2. Genetic and phenotypic correlations
102
between number of kernel rows and percent unpopped grains were negatively significant in cross
PS-2 × BD-2. Number of kernel rows per ear was also negatively and significantly correlated
with expansion volume in cross PS-2 × BD-2 at phenotypic level while, positively and
significantly correlated with number of grains per row, number of grains per cob, hundred grain
weight, grain yield, biological yield and harvest index in the same cross.
4.4.12 Grains row-1
Genetic correlation of number of grains per row was positive and significant with number
of grains per cob, hundred grain weight, grain yield, biological yield and harvest index in cross
PS-1 × BD-1 and PS-1 × BD-2 (Table 4.7-4.10). Number of grains per row was negatively and
significantly correlated with expansion volume in cross PS-1 × BD-2 while, genetic correlation
between same traits in cross PS-1 × BD-1 was negative but non-significant. Similarly phenotypic
association among number of grains per row, grains per cob, hundred grain weight, grain yield,
biological yield and harvest index was high and positively significant in both cross PS-1 × BD-1
and PS-1 × BD-2. Number of grains per row was negatively and non-significantly correlated
with expansion volume in both cross PS-1 × BD-1 and PS-1 × BD-2. Genetic association of
number of grains per row with number of grains per cob and biological yield in cross PS-2 ×
BD-1 and PS-2 × BD-2 was positive and significant in nature. Phenotypic correlation among
number of grains per row, number of grains per cob, hundred grain weight, grain yield,
biological yield and harvest index was positive in magnitude and significant in nature in both
cross PS-2 × BD-1 and PS-2 × BD-2. Genetic correlation of grains per row and percent
unpopped grains was negatively significant while, phenotypic correlation among number of
grains per row, expansion volume and percent unpopped grains was also negative and significant
in cross PS-2 × BD-2.
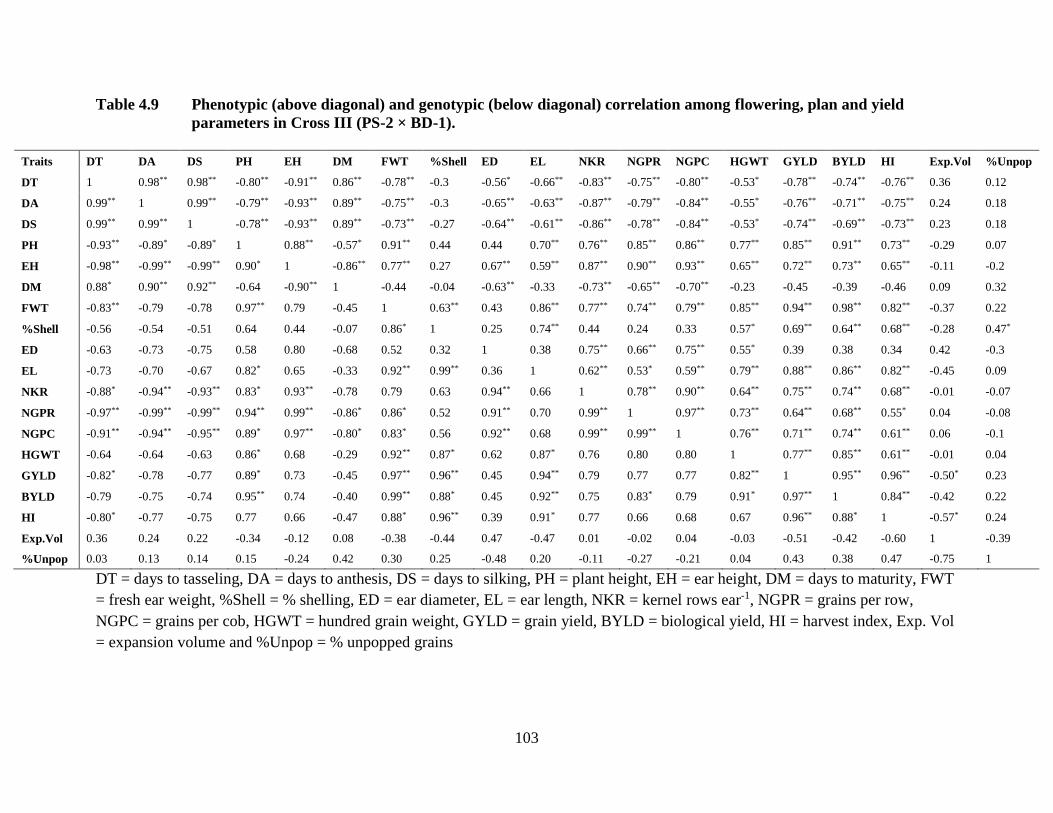
103
Table 4.9 Phenotypic (above diagonal) and genotypic (below diagonal) correlation among flowering, plan and yield
parameters in Cross III (PS-2 × BD-1).
Traits DT DA DS PH EH DM FWT %Shell ED EL NKR NGPR NGPC HGWT GYLD BYLD HI Exp.Vol %Unpop
DT 1 0.98** 0.98** -0.80** -0.91** 0.86** -0.78** -0.3 -0.56* -0.66** -0.83** -0.75** -0.80** -0.53* -0.78** -0.74** -0.76** 0.36 0.12
DA 0.99** 1 0.99** -0.79** -0.93** 0.89** -0.75** -0.3 -0.65** -0.63** -0.87** -0.79** -0.84** -0.55* -0.76** -0.71** -0.75** 0.24 0.18
DS 0.99** 0.99** 1 -0.78** -0.93** 0.89** -0.73** -0.27 -0.64** -0.61** -0.86** -0.78** -0.84** -0.53* -0.74** -0.69** -0.73** 0.23 0.18
PH -0.93** -0.89* -0.89* 1 0.88** -0.57* 0.91** 0.44 0.44 0.70** 0.76** 0.85** 0.86** 0.77** 0.85** 0.91** 0.73** -0.29 0.07
EH -0.98** -0.99** -0.99** 0.90* 1 -0.86** 0.77** 0.27 0.67** 0.59** 0.87** 0.90** 0.93** 0.65** 0.72** 0.73** 0.65** -0.11 -0.2
DM 0.88* 0.90** 0.92** -0.64 -0.90** 1 -0.44 -0.04 -0.63** -0.33 -0.73** -0.65** -0.70** -0.23 -0.45 -0.39 -0.46 0.09 0.32
FWT -0.83** -0.79 -0.78 0.97** 0.79 -0.45 1 0.63** 0.43 0.86** 0.77** 0.74** 0.79** 0.85** 0.94** 0.98** 0.82** -0.37 0.22
%Shell -0.56 -0.54 -0.51 0.64 0.44 -0.07 0.86* 1 0.25 0.74** 0.44 0.24 0.33 0.57* 0.69** 0.64** 0.68** -0.28 0.47*
ED -0.63 -0.73 -0.75 0.58 0.80 -0.68 0.52 0.32 1 0.38 0.75** 0.66** 0.75** 0.55* 0.39 0.38 0.34 0.42 -0.3
EL -0.73 -0.70 -0.67 0.82* 0.65 -0.33 0.92** 0.99** 0.36 1 0.62** 0.53* 0.59** 0.79** 0.88** 0.86** 0.82** -0.45 0.09
NKR -0.88* -0.94** -0.93** 0.83* 0.93** -0.78 0.79 0.63 0.94** 0.66 1 0.78** 0.90** 0.64** 0.75** 0.74** 0.68** -0.01 -0.07
NGPR -0.97** -0.99** -0.99** 0.94** 0.99** -0.86* 0.86* 0.52 0.91** 0.70 0.99** 1 0.97** 0.73** 0.64** 0.68** 0.55* 0.04 -0.08
NGPC -0.91** -0.94** -0.95** 0.89* 0.97** -0.80* 0.83* 0.56 0.92** 0.68 0.99** 0.99** 1 0.76** 0.71** 0.74** 0.61** 0.06 -0.1
HGWT -0.64 -0.64 -0.63 0.86* 0.68 -0.29 0.92** 0.87* 0.62 0.87* 0.76 0.80 0.80 1 0.77** 0.85** 0.61** -0.01 0.04
GYLD -0.82* -0.78 -0.77 0.89* 0.73 -0.45 0.97** 0.96** 0.45 0.94** 0.79 0.77 0.77 0.82** 1 0.95** 0.96** -0.50* 0.23
BYLD -0.79 -0.75 -0.74 0.95** 0.74 -0.40 0.99** 0.88* 0.45 0.92** 0.75 0.83* 0.79 0.91* 0.97** 1 0.84** -0.42 0.22
HI -0.80* -0.77 -0.75 0.77 0.66 -0.47 0.88* 0.96** 0.39 0.91* 0.77 0.66 0.68 0.67 0.96** 0.88* 1 -0.57* 0.24
Exp.Vol 0.36 0.24 0.22 -0.34 -0.12 0.08 -0.38 -0.44 0.47 -0.47 0.01 -0.02 0.04 -0.03 -0.51 -0.42 -0.60 1 -0.39
%Unpop 0.03 0.13 0.14 0.15 -0.24 0.42 0.30 0.25 -0.48 0.20 -0.11 -0.27 -0.21 0.04 0.43 0.38 0.47 -0.75 1
DT = days to tasseling, DA = days to anthesis, DS = days to silking, PH = plant height, EH = ear height, DM = days to maturity, FWT
= fresh ear weight, %Shell = % shelling, ED = ear diameter, EL = ear length, NKR = kernel rows ear-1, NGPR = grains per row,
NGPC = grains per cob, HGWT = hundred grain weight, GYLD = grain yield, BYLD = biological yield, HI = harvest index, Exp. Vol
= expansion volume and %Unpop = % unpopped grains
104
4.4.13 Grains ear-1
Genetic correlation of grains per cob was positive and significant in nature with hundred
grain weight, grain yield, biological yield and harvest index in cross PS-1 × BD-1. Number of
grains per cob and expansion were negatively and significantly correlated with each other at
genetic level in cross PS-1 × BD-1 (Table 4.9). Phenotypic correlation among number of grains
per cob, hundred grain weight, grain yield, biological yield and harvest index in cross PS-1 ×
BD-2 was highly positive in magnitude with significant nature, phenotypic association between
number of grains per cob and expansion volume was negative and significant in the same cross.
Genetically grains per cob was positively and significantly correlated with ear weight, ear
diameter, ear length, number of kernel rows and number of grains per row in three of the four
crosses. Number of grains per cob was found to have a negatively significant correlation with
days to tasseling, silking, anthesis and maturity both at genetic and phenotypic level in cross PS-
2 × BD-1 and PS-2 × BD-2. Genetic correlation of number of grains per cob was non-significant
with yield, yield related traits, expansion volume and percent unpopped grains in cross PS-2 ×
BD-1. Similarly in cross PS-2 × BD-2 genetic and phenotypic correlations between number of
grains per cob and percent unpopped grains was negatively significant. Phenotypic correlation
among number of grains per cob, hundred grain weight, grain yield, biological yield and harvest
index was positive and significant in nature in cross PS-2 × BD-2.
4.4.14 Hundred grain weight
Association of hundred grain weight with all other studied traits in four crosses is
presented in Tables 5.4.1-4.9. Genetic correlation of hundred grain weight was positive and
significant with grain yield, biological yield and harvest index in cross PS-1 × BD-1 and PS-1 ×
BD-2. Similar genetic correlation of hundred grain weight was also exhibited with fresh ear
weigh, percent shelling, ear diameter, ear length, number of kernel rows, number of grains per
row and number of grains per cob in cross PS-1 × BD-1. Hundred grain weight was positively
and significantly correlated with grain yield, biological yield, harvest index, grains per row,
grains per cob, number of kernel rows, ear length, ear diameter, percent shelling and fresh weight
in cross PS-1 × BD-1. Genetic association of hundred grain weight with ear weight, ear length,
number of kernel rows, number of grains per row and number of grains per cob was also found
positive and significant in cross PS-1 × BD-2. Phenotypic correlation of hundred grain weight
105
was negatively significant in nature with days to maturity and expansion volume in cross PS-1 ×
BD-2. In cross PS-2 × BD-1 genetic correlation among hundred grain weight, grain yield and
biological yield was positively significant in nature. Phenotypic association in both cross PS-2 ×
BD-1 and PS-2 × BD-2 was positive and significant among hundred grain weight, grain yield,
biological yield and harvest index.
4.4.15 Grain yield
Genetic and phenotypic correlation of grain yield with biological yield and harvest index
was positive and significant in all crosses (Table 4.7-4.10). Grain yield was negatively and
significantly correlated with expansion volume in all crosses except, PS-2 × BD-1 and PS-2 ×
BD-2 where the association was although negative in magnitude but non-significant in nature.
Similarly phenotypic association between grain yield and expansion volume was negatively
significant in all crosses. In cross PS-2 × BD-2 phenotypic association between grain yield and
percent unpopped grains was negatively significant. Genetic correlation among grain yield, fresh
ear weight, percent shelling, ear diameter, ear length, number of kernel rows, number of grains
per row, number of grains per cob and hundred grain weight was positive and significant in cross
PS-1 × BD-1. Same pattern of genetic correlation was also manifested among grain yield, fresh
ear weight, ear length, number of kernel rows, number of grains per row, number of grains per
cob and hundred grain weight in cross PS-1 × BD-2. Positive and significant correlation was
present among grain yield, fresh ear weight, percent shelling, ear diameter, ear length, number of
kernel rows, number of grains per row, number of grains per cob and hundred grain weight in
cross PS-1 × BD-2. Both genetic and phenotypic correlation of grain yield with days to tasseling,
silking and anthesis was negative in nature in all crosses. Genetic and phenotypic association of
grain yield with other grain yield related traits was positive.
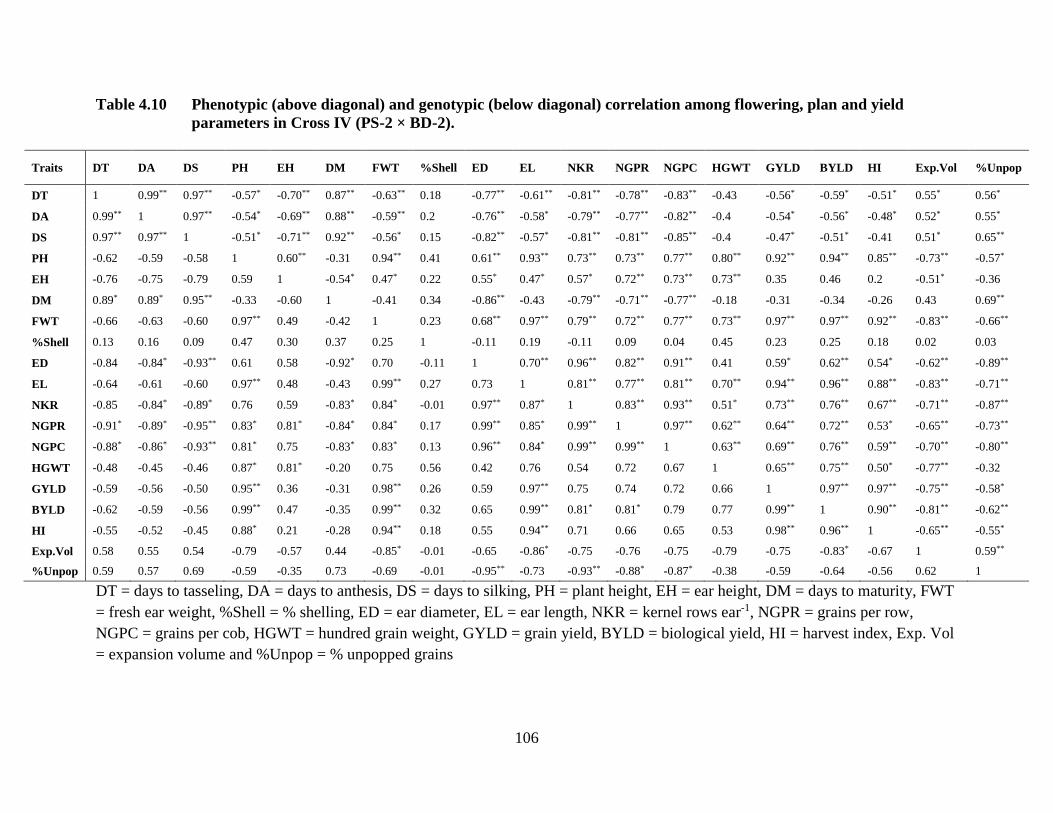
106
Table 4.10 Phenotypic (above diagonal) and genotypic (below diagonal) correlation among flowering, plan and yield
parameters in Cross IV (PS-2 × BD-2).
Traits DT DA DS PH EH DM FWT %Shell ED EL NKR NGPR NGPC HGWT GYLD BYLD HI Exp.Vol %Unpop
DT 1 0.99** 0.97** -0.57* -0.70** 0.87** -0.63** 0.18 -0.77** -0.61** -0.81** -0.78** -0.83** -0.43 -0.56* -0.59* -0.51* 0.55* 0.56*
DA 0.99** 1 0.97** -0.54* -0.69** 0.88** -0.59** 0.2 -0.76** -0.58* -0.79** -0.77** -0.82** -0.4 -0.54* -0.56* -0.48* 0.52* 0.55*
DS 0.97** 0.97** 1 -0.51* -0.71** 0.92** -0.56* 0.15 -0.82** -0.57* -0.81** -0.81** -0.85** -0.4 -0.47* -0.51* -0.41 0.51* 0.65**
PH -0.62 -0.59 -0.58 1 0.60** -0.31 0.94** 0.41 0.61** 0.93** 0.73** 0.73** 0.77** 0.80** 0.92** 0.94** 0.85** -0.73** -0.57*
EH -0.76 -0.75 -0.79 0.59 1 -0.54* 0.47* 0.22 0.55* 0.47* 0.57* 0.72** 0.73** 0.73** 0.35 0.46 0.2 -0.51* -0.36
DM 0.89* 0.89* 0.95** -0.33 -0.60 1 -0.41 0.34 -0.86** -0.43 -0.79** -0.71** -0.77** -0.18 -0.31 -0.34 -0.26 0.43 0.69**
FWT -0.66 -0.63 -0.60 0.97** 0.49 -0.42 1 0.23 0.68** 0.97** 0.79** 0.72** 0.77** 0.73** 0.97** 0.97** 0.92** -0.83** -0.66**
%Shell 0.13 0.16 0.09 0.47 0.30 0.37 0.25 1 -0.11 0.19 -0.11 0.09 0.04 0.45 0.23 0.25 0.18 0.02 0.03
ED -0.84 -0.84* -0.93** 0.61 0.58 -0.92* 0.70 -0.11 1 0.70** 0.96** 0.82** 0.91** 0.41 0.59* 0.62** 0.54* -0.62** -0.89**
EL -0.64 -0.61 -0.60 0.97** 0.48 -0.43 0.99** 0.27 0.73 1 0.81** 0.77** 0.81** 0.70** 0.94** 0.96** 0.88** -0.83** -0.71**
NKR -0.85 -0.84* -0.89* 0.76 0.59 -0.83* 0.84* -0.01 0.97** 0.87* 1 0.83** 0.93** 0.51* 0.73** 0.76** 0.67** -0.71** -0.87**
NGPR -0.91* -0.89* -0.95** 0.83* 0.81* -0.84* 0.84* 0.17 0.99** 0.85* 0.99** 1 0.97** 0.62** 0.64** 0.72** 0.53* -0.65** -0.73**
NGPC -0.88* -0.86* -0.93** 0.81* 0.75 -0.83* 0.83* 0.13 0.96** 0.84* 0.99** 0.99** 1 0.63** 0.69** 0.76** 0.59** -0.70** -0.80**
HGWT -0.48 -0.45 -0.46 0.87* 0.81* -0.20 0.75 0.56 0.42 0.76 0.54 0.72 0.67 1 0.65** 0.75** 0.50* -0.77** -0.32
GYLD -0.59 -0.56 -0.50 0.95** 0.36 -0.31 0.98** 0.26 0.59 0.97** 0.75 0.74 0.72 0.66 1 0.97** 0.97** -0.75** -0.58*
BYLD -0.62 -0.59 -0.56 0.99** 0.47 -0.35 0.99** 0.32 0.65 0.99** 0.81* 0.81* 0.79 0.77 0.99** 1 0.90** -0.81** -0.62**
HI -0.55 -0.52 -0.45 0.88* 0.21 -0.28 0.94** 0.18 0.55 0.94** 0.71 0.66 0.65 0.53 0.98** 0.96** 1 -0.65** -0.55*
Exp.Vol 0.58 0.55 0.54 -0.79 -0.57 0.44 -0.85* -0.01 -0.65 -0.86* -0.75 -0.76 -0.75 -0.79 -0.75 -0.83* -0.67 1 0.59**
%Unpop 0.59 0.57 0.69 -0.59 -0.35 0.73 -0.69 -0.01 -0.95** -0.73 -0.93** -0.88* -0.87* -0.38 -0.59 -0.64 -0.56 0.62 1
DT = days to tasseling, DA = days to anthesis, DS = days to silking, PH = plant height, EH = ear height, DM = days to maturity, FWT
= fresh ear weight, %Shell = % shelling, ED = ear diameter, EL = ear length, NKR = kernel rows ear-1, NGPR = grains per row,
NGPC = grains per cob, HGWT = hundred grain weight, GYLD = grain yield, BYLD = biological yield, HI = harvest index, Exp. Vol
= expansion volume and %Unpop = % unpopped grains
107
4.4.16 Biological yield
The association of biological yield was positive and significant with harvest index in all
crosses at genetic level (Table 4.7-4.10). Genetic correlation of biological yield with expansion
volume was negatively significant in all crosses except, PS-2 × BD-1 where the association was
also negative but non-significant in nature. Phenotypic correlation of biological yield with
harvest index was positively significant in four studied crosses while, negative and significant
with expansion volume in all crosses except, cross PS-2 × BD-1. In cross PS-2 × BD-2
phenotypic correlation between biological yield and percent unpopped grains was also negatively
significant. Phenotypic correlation of biological yield was positively significant with fresh ear
weight, ear diameter, eat length, number of kernel rows, number of grains per row, number of
grains per cob, hundred grain weight, grain yield and biological yield in all crosses. Phenotypic
correlation among biological yield, days to tasseling, silking and anthesis was negatively
significant in both cross PS-2 × BD-1 and PS-2 × BD-2 while, in other two crosses the
association was although negative but non-significant in nature.
4.4.17 Harvest index
The genetic association of harvest index with expansion volume was negative and
significant in both cross PS-1 × BD-1 and PS-1 × BD-2, having female parent in common.
Similarly the genetic correlation of harvest index with percent unpopped grains in all crosses was
negative but non-significant in nature (Table 4.7-4.10). Phenotypic correlation of harvest index
and expansion volume was negative and significant in all crosses while, negative and non-
significant with percent unpopped grains. Phenotypic and genotypic correlation of harvest index
and maturity traits was negative in nature in all crosses while, positive with yield related traits.
Genetic association of harvest index with fresh ear weight, ear length, number of kernel rows,
number of grains per row, number of grains per cob, hundred grain weight, grain yield and
biological yield was positive and significant in cross PS-1 × BD-1 and PS-1 × BD-2. Similarly in
cross PS-2 × BD-1 and PS-2 × BD-2 genetic association among harvest index, fresh ear weight,
ear length, grain yield and biological yield was positive and significant. Phenotypic association
of harvest index with yield related traits like fresh ear weight, percent shelling, ear diameter, ear
length, hundred grain weight, grain yield and biological yield was positive and significant in all
crosses.
108
4.4.18 Expansion volume
Both genetic and phenotypic associations of expansion volume with all other studied
characters are presented in Table 4.7-4.10. Genetic correlation of expansion volume was
negatively significant with fresh ear weight, percent shelling, ear diameter, ear length, number of
kernel rows, number of grains per cob, hundred grain weight, grain yield, biological yield and
harvest index in cross PS-1 × BD-1. Similarly, negative and significant pattern of genetic
correlation was also observed in cross PS-1 × BD-2 expansion volume and all yield related traits
except percent shelling and ear diameter where the association was negative but non-significant.
In cross PS-2 × BD-1, genetic correlation of expansion volume with all other traits was non-
significant in nature while, phenotypic correlation of expansion volume with grain yield and
harvest index was negative and non-significant in the same cross. In cross PS-2 × BD-2, genetic
correlation of expansion volume with fresh ear weight, ear length and biological yield was
negative and significant in nature. Phenotypic correlation among all yield related traits and
expansion volume was negative and significant in all crosses except, PS-2 × BD-1. Although
both genetic and phenotypic correlations of expansion volume with days to tasseling, silking and
anthesis were positive, but only significant in cross PS-2 × BD-2 at phenotypic level.
4.4.19 Percent unpopped grains
A variable nature of genetic correlation of percent unpopped grains was observed with
yield and related traits in all crosses (Table 4.7-4.10). Genetic correlation of percent unpopped
grains was non-significant with all studied traits in all crosses except, PS-2 × BD-2. In cross PS-
2 × BD-2 genetic association among percent unpopped grains, ear diameter, number of kernel
rows per ear, number of grains per row and number of grains per cob was negative and
significant in nature (Table 4.7-4.10). Phenotypic correlation of percent unpopped grains was
non-significant with all studied characters except, percent shelling (rp = 0.47) in cross PS-2 ×
BD-1. In cross PS-1 × BD-1 phenotypic correlation of percent unpopped grains was negative and
significant with plant height, ear height and expansion volume while, positively significant with
days to silking (rp = 0.46) and maturity (rp = 0.64). Positive and significant correlation was
observed among unpopped grains, days to tasseling, silking, anthesis and maturity at phenotypic
level in cross PS-1 × BD-2 and PS-2 × BD-2. Phenotypic association of unpopped grains with
plant height, fresh ear weight, ear diameter, ear length, number of kernel rows, number of grains
109
per row, number of grains per cob, biological yield and harvest index was negative and
significant in nature.
110
Chapter 5
DISCUSSION
5.1 Gene action
Generation mean analysis is a genetic model developed to measure the genetic estimates
including additive, dominance and epistasis effects in breeding populations (Kearsey and Pooni,
2004). Though generation mean analysis is useful in measuring the genetic effects quantitative
traits but, its ability to calculate the epistatic genetic effects including additive × additive (aa),
dominance × dominance (dd) and additive × dominance (ad) effects make it superior over other
methods (Singh and Singh, 1992). Generation mean analysis makes the breeder able to choose an
appropriate breeding method by disclosing information of additive, dominance and epistasis
effects. Along with genetic information of a trait plant breeder is also interested to have
knowledge genetic and environmental variations, because selection mainly depends on additive
genetic variance, influence of the environment and interaction between genotype and
environment. It is the information obtained through generation mean analysis which allows the
breeder to optimize their breeding programs (Melchinger et al., 1986). The choice of selection
and breeding procedures for genetic improvement of maize or any other crop depends largely on
the knowledge of type of gene action for different characters in the plant materials under
investigation. Mather and Jinks (1982) developed generation mean analysis to determine the
genetic effects for polygenic traits. Breeding for improved varieties requires a thorough
understanding of the genetic mechanisms governing yield and yield components (Unay et al.,
2004). The present study was therefore, designed to estimate the magnitude of different genetic
effects (additive, dominance and epistatic) in six generations (P1, P2, F1, F2, BC1 and BC2),
derived from four maize inbred lines of divergent nature. The results are explained for different
plant parameters according to the following analysis procedure for three parameter and six
parameter models.
5.1.1 Days to 50% tasseling
111
As explained in results that six parameter model was adequate to explain the inheritance
pattern of days to 50% tasseling, showing that the trait is not only controlled by additive and
dominance gene actions but also some contribution from the epistasis as well. Similar results of
epistasis involvement in days to tasseling were also observed by Dawod et al. (2012) and
Hemalatha et al. (2014), who revealed that inheritance of tasseling in maize was controlled by
simple as well as complex gene actions. This indicates that improvement of studied trait will be
more difficult as compared to more simple models (additive-dominance and digenic epistatic
model) of inheritance. Such pattern of gene action is least favorable from a breeder’s point of
view, suggesting that revised breeding strategy is needed due to complexity of gene effects
occurring in these generations (Kathiria and Sherma, 1996). The dominant gene action and
digenic non-allelic epistasis of additive × dominance were found to be involved in governing the
inheritance of days to tasseling in all crosses except, PS-2 × BD-1, having adequacy of three
parameter model only. Dominant values in these three crosses were negative in nature but higher
in magnitude than additive. This shows that dominant genes have a pre-dominant role in the
inheritance so selection should be delayed to the later generations till the dominant gene effect is
diminished. About the dominance gene involvement, our results are in line with Saleem et al.
(2002) and Kumar et al. (2005) who also stated that for days to tasselling in maize, dominance
(incomplete to over dominance) effects played major role in its inheritance. Similarly
complementary type of non-allelic interaction was observed for cross PS-1 × BD-2. The digenic
non-allelic epistasis of additive × dominance was considered the major contributor in the
inheritance of this trait. In both crosses i.e. PS-1 × BD-2 and PS-2 × BD-2, additive gene action
with negative magnitude was found responsible for controlling days to tasseling. Presence of
additive gene action with negative pattern for days to tasseling in maize exhibited that this trait
can be fixed through selection in early generations producing an F1 hybrids with reduced days to
tasseling if dominance is of least value. Similar results of fixable gene action for tasseling were
also reported by Prakash and Ganguli (2004) and Atanaw et al. (2006), who revealed that
additive type of gene action was involved in the control of days to tasseling in their maize
germplasm. Moradi (2014) also reported similar results of both additive and dominance gene
actions for controlling the inheritance of days to tasseling in maize.
5.1.2 Days to 50 % anthesis
112
A greater genetic diversity in the parents involved in the studied crosses was inferred
from 2 estimates. It is revealed that six model of complex inheritance was adequate to explain
the inheritance pattern of days to 50% anthesis rather than simple additive-dominance model.
Negative and significant magnitude of both additive and dominance gene actions in cross PS-1 ×
BD-1 was indicative of these type of gene actions in the inheritance of days to anthesis. The role
of dominance was pre-dominant due to its higher value than additive, showing that selection
should be delayed to later generations. Similarly in the same cross additive × additive and
dominance × dominance digenic non-allelic interactions were important in governing the
inheritance of days to anthesis. Azizi et al. (2006) also reported negative and significant effect of
dominance gene action for days to anthesis in cross B73 x Mo17. Presence of both dominance
and additive × additive epistasis will be helpful in promoting earliness in this material. Dorri et
al. (2014) reported a major role of dominant genes in the inheritance of days to anthesis. Similar
results of gene action for days to 50 % anthesis were also observed by Sujiprihati et al. (2003)
and Singh and Roy (2007), who reported that non-additive epistasis was among the most
important gene action for days to mid anthesis in maize. The presence of opposite and significant
signs of h (dominance) and l (dominance × dominance) resulted in duplicate type of non-allelic
interaction for the days to 50% anthesis in cross PS-1 × BD-1, while h and l with similar and
significant signs resulted in complementary duplicate type of non-allelic interaction in cross PS-1
× BD-2. From the presence of opposite signs of h and l, it is concluded that no complementary
type of interaction was present in the genetic control of this trait. The digenic non-allelic
epistasis of dominance × dominance was considered the major contributors in the inheritance of
this trait in these two crosses. In cross PS-2 × BD-2, additive gene action as well as additive ×
dominance and dominance × dominance type of non-allelic gene action with negative magnitude
were found responsible for controlling the inheritance of anthesis. Mhike et al. (2011) also
observed a predominant role of non-additive genes for days to anthesis in their study. Similarly
in cross PS-2 × BD-1, this trait was controlled by dominance gene action with additive x
dominant type of non-allelic interaction. This shows that with greater magnitude of dominant
genes selection needs to be delayed till later generations. In the same cross significance of j
(additive x dominance) exhibited that improvement for this trait is not expected through selfing,
because among the digenic interactions, additive × additive type is more fixable and more useful
for plant breeders (Farshadfar et al., 2001; Sharifi, 2005). Negative and significant values of h
113
(dominance) showed a major role of dominant gene action in the inheritance of this trait in all the
crosses except, PS-2 × BD-2.
5.1.3 Days to 50 % silking
As revealed from the best fit model, both additive and non-additive gene actions were
responsible for controlling the inheritance of days to 50% silking in all crosses, except, PS-2 ×
BD-1. This shows that inheritance of silking can be explained only by simple additive-
dominance model in cross PS-2 × BD-1. Our findings are in consonance with Ishfaq (2011),
based on generation mean analysis results for reproductive and yield characters in maize.
Although both additive and dominance gene action were found significant in cross PS-1 × BD-1
but the magnitude of dominance was higher than additive genes, showing that trait can be
exploited for hybrid production effectively. Dominance nature of inheritance for days to silking
have been reported by some earlier breeders like Saleem et al. (2002) and Kumar et al. (2005).
Haq et al. (2010) also revealed both additive and non-additive gene actions for days to silking,
while studying gene action of different quantitative traits in maize. In non-allelic, duplicate type
of gene action was observed in cross PS-1 × BD-1. Duplicate type of epistasis generally delay
the improvement through selection and hence, a higher magnitude of h (dominance) and l
(dominance × dominance) type of interaction effects would not be expected (Sabolu et al., 2014).
Since none of signs of (h) were similar to the (l) type of epistasis, it could be envisaged that no
complementary type of interaction was present in the genetic control of the studied traits. It also
indicated that selection should be delayed to latter generations of until a reasonable level of gene
fixation is attained. Significant value of d (additive), h (dominance), i (additive × additive) and l
(dominance × dominance) in the cross PS-1 × BD-1 exhibited the involvement of both heritable
and non-heritable gene actions. Complementary duplicate type of non-allelic interaction with
both additive and dominance gene actions was found to be responsible for controlling days to
50% silking in cross PS-1 × BD-2. In cross PS-2 × BD-2 along with dispersed type of digenic
interaction, additive and dominant type of gene actions were predominant in the inheritance of
days to silking. Shahrokhi et al. (2013) observed that epistasis plays a considerable role in the
inheritance of days to anthesis in maize. Such type of gene actions combined with some
dominance can be effectively utilized in hybrid breeding.
114
5.1.4 Plant height
In all crosses six parameter model of complex genetics was sufficient to explain the
genetic constitution of plant height, which disclosed the involvement of both allelic and non-
allelic gene actions for this trait. A duplicate type of non-allelic interaction in crosses PS-1 ×
BD-2 and PS-2 × BD-2 was found controlling the genetic control of plant height, suggesting that
it will increase the variation between generations and in the segregating populations. Presence of
duplicate type non-allelic gene action represents that selection intensity makes progress from
earlier to late generations. In such situation it is advisable to use breeding methods that deal
effectively with non-allelic interactions. In this regard genetic improvement could be achieved
through restricted recurrent selection of intermating among desirable segregates, followed by
selection or diallel selective mating or multiple crosses or biparental mating in early segregating
generations. Positive value of d (additive) and h (dominance) along with, additive × additive
gene effects in most of the crosses indicated predominant role of dominant gene action in the
inheritance of plant height. Our results match with some of the findings in literature including
those of Singh and Roy (2007), Iqbal et al. (2010) and Zare et al. (2011) who also reported
additive and additive × additive effects for plant height. Presence of additive genes explain that
selection based on this trait can be fixed easily in coming generation, similarly existence of
dominance genetic effects will be helpful in hybrid breeding program. These findings are in line
with Hallauer and Miranda (1988), Kumar et al. (2005). Likewise, a complementary type of non-
allelic gene action was involved in cross PS-1 × BD-1 with significant and similar sign of h
(dominance) and l (dominance × dominance) for plant height. Moreover, in non-allelic gene
actions, presence of i (additive × additive), j (additive × dominance) and l (dominance ×
dominance) with both positively significant and negatively significant magnitude indicating that
all the three types of digenic non-allelic interactions played a leading role in the inheritance of
this parameter. Mousa (2004), Leon et al. (2005) and Iqbal et al. (2010) also detected similar
results of non-additive nature of plant height while studying inheritance of maize germplasm
through generation mean analysis.
5.1.5 Ear height
Like other important traits ear height has been reported to be one of the most important
selection criteria in most breeding programs especially the root and stock lodging (Esechie et al.,
115
2004; Olawuyi et al., 2013). For yield purpose, high ear position could be susceptible to both
root and stock lodging, therefore selection for lower ear position is preferred in maize (Salami et
al., 2007).Both fixable and non-fixable gene actions were found to be responsible for controlling
the inheritance of ear height in all the crosses. This presence of epistasis is an indicative of great
genetic diversity among the parents for ear height while, the additive and dominance effects
reflects that selection in this material will be effective as well as it can be used in hybrid
programs. Similar findings regarding the predominant role of non-additive genetic effects were
also reported by Rezaei and Roohi (2004) and Alam et al. (2008) for ear height. In contrast to our
findings Zare et al. (2011) and Wannows et al. (2015) reported that only additive and dominance
genes were controlling inheritance for ear height. It can be concluded from significant values of
h (dominance) and l (dominance × dominance) with similar signs that digenic non-allelic
interaction of complementary type explained the inheritance of this trait in two crosses of PS-2 ×
BD-1 and PS-2 × BD-2. The presence of positive and significant values of d (additive) and h
(dominance) in these two crosses, disclosed the involvement of both additive and dominant gene
actions in the inheritance of ear height. Similarly in PS-1 × BD-1 and PS-1 × BD-2 dominance
and duplicate type of non-allelic gene action were found responsible in controlling inheritance of
ear height. It means that improvement will be low through selection because a higher magnitude
would not be expected for dominance (h) as well as dominance × dominance (l). Our results of
duplicate type non-allelic gene action are in line with Ishfaq (2011) and Wannows et al. (2015)
studies of determining genetic effects for some quantitative traits in maize. The significant
magnitudes of i (additive x additive), j (additive x dominance) and l (dominance × dominance) in
all crosses except PS-2 × BD-1 and PS-2 × BD-2 indicated that digenic non-allelic interactions
also play governing role in the inheritance of this trait.
5.1.6 Ear weight
Both additive and dominance effects were found prominent in controlling inheritance of
ear weight. The role of dominance was more comparing to additive gene actions in all the
crosses. Similarly, in digenic effects additive × additive was more predominant. This shows that
effective role of both additive (d) and additive × additive (i) can be successfully utilized for the
improvement of ear weight through selection. Ojo et al. (2006) also reported similar results of
additive effects for ear weight in their study. Likewise in crosses where dominance and dominance ×
116
dominance genetic effects are prevailing, could be utilized in hybrid programs efficiently.
Mendes-Moreira et al. (2015) also reported the prevalence of digenic effects in the inheritance of
ear weight at harvest in the QTL analysis of PB260 × PB266 progeny. A dispersed type of non-
allelic gene action was observed in cross PS-1 × BD-1 with non-significant effects of both
additive and dominance gene actions. In cross PS-1 × BD-2, negative and positive significant
nature of additive and dominance gene actions as well as duplicate type of non-allelic gene
actions were found in the inheritance of ear weight. Similarly in cross PS-2 × BD-1 and PS-2 ×
BD-2, additive and dominance gene action with positive magnitudes, and complementary non-
allelic interactions were preponderant for the inheritance of ear weight. Similar findings
regarding the presence of non-additive effects for ear weight in maize were also reported by
Sujiprihati et al. (2003).
5.1.7 Grain yield
The presence of both additive and non-additive gene effects revealed the complex genetic
nature of grain yield. Along with additive and dominance gene actions, all types of epistasis were
also observed, showing presence of greater genetic diversity among the parents involved in the
crosses. Presence of such genetic diversity is of prime importance for traits like yield and it must
be exploited by plant breeders to achieve their goals (Idahosa et al., 2010). According to Iqbal et
al. (2009) selection of desirable parents and information about the nature and magnitude of gene
action for a quantitative trait is of paramount importance for a plant breeder. In all crosses due to
higher magnitude, dominant genes were having predominant effects for grain yield, whereas,
additive gene action and additive × additive type of epistasis, was also found having its
proportion in the inheritance of this trait. Due to fixable nature of selection from additive effects,
gain from selection could be possible for grain yield. Wannows et al. (2010) also observed
similar results of additive effects for grain yield while studying genetic variability through path
coefficient analysis in maize. Our results corroborates the findings of Ojo et al. (2007), Musila et
al. (2010) and Ofori et al. (2015) who also observed additive gene action for grain yield in maize
and proposed that simple selection would be effective to make desirable improvement in the
studied genotypes for grain yield. Similarly due to predominance of additive gene to non-
additive gene, Mhike et al. (2011) hinted the possibility of exploring early testing of genotypes.
Crosses dominant nature of inheritance, could be judiciously utilized for hybrid development in
117
maize breeding programs. Kanagarasu et al. (2010) reported that dominance effects were
controlling inheritance of grain yield. The predominant nature of non-additive gene effects in the
inheritance of grain yield were also reported by previous reviewers like, Mhike et al. (2011),
Abuali et al. (2012) and Dawod et al. (2012). Similarly Khalil et al. (2010) also observed that
along with non-additive effects additive gene action was responsible in controlling the
inheritance of grain yield.
5.1.8 Days to maturity
High grain yield and early maturity are two important parameters for efficient and
economically viable maize hybrids. Both allelic and non-allelic interactions were found involved
in the inheritance days to maturity in all crosses as 2 values obtained were significant. It is
obvious that both heritable and non-heritable gene action were responsible in the control of this
trait. Both additive and dominant gene action were negatively significant in all crosses except,
PS-2 × BD-1 in which said effect was non-significant. Negative sign of both additive and
dominant genetic effects indicated that maturity will be earlier if selection is made for it.
Dominant gene effects in all crosses were negative and higher in magnitude than the additive one
which reveal that these parents can be efficiently utilized in hybrid breeding programs aiming at
reduced maturity. In maize crop with excessive water requirements at critical stages, earliness in
maturity offers opportunity to utilize cropping season where the short rainy period can be
efficiently used for maize cultivation (Ofori et al., 2015). Similar results of negative but
significant additive genetic effects were also obtained by Sofi et al. (2006), Singh and Roy
(2007), Shahrokhi et al. (2013), Hemalatha et al. (2014) and Ahamed et al. (2015). Presence of
additive genes explain that selection based on early maturity can be realized easily in coming
generation. Similarly existence of dominance genetic effects will also be helpful in hybrid
breeding program. Our findings of negative dominance effects for days to maturity are in
concord with that of Ishfaq (2011) and Shahrokhi et al. (2013). Dispersed types of non-allelic
interactions were observed in all four crosses. In epistatic effects, additive × additive and
additive x dominant effects were significant with negative and positive in two of the four crosses,
respectively. Presence of non-allelic interaction is an indication of greater genetic diversity in the
parental lines and also have a role in the inheritance of this trait. Therefore, methods which
118
exploits non-additive gene effects and take care of non-allelic interactions like restricted
recurrent selection would be promising for improvement of maturity in this germplasm. Our
results of di-genic interactions are in line with that obtained by Ishfaq (2011) and Shahrokhi et
al. (2013).
5.1.9 Ear length
Being an important yield component, ear length was revealed to be controlled by a
combination of additive and non-additive gene actions. In all crosses, dominant gene effects
were positive and predominant over other allelic and non-allelic interactions. Based on
prominent dominant gene action, ear length could be considered as important character in the
selection of inbred lines for development of maize hybrids. Similar results of dominant genetic
effects have been reported by Hallauer and Miranda (1988), Dorri et al. (2014) and Wannows et
al. (2015). Like dominant genes, additive gene action also exerted a role in the inheritance of ear
length in two of the four crosses which is an indication of improvement for this trait. Our results
of additive effects for ear length are in conformity with Zare et al (2011), Chandal & Mankotia
(2014) and Alamerew & Warsi (2015). Non-allelic interaction of dominance × dominance was
higher in magnitude with negative nature than other epistatic interactions. Similarly additive ×
additive interactions were positively significant in three crosses, which resulted in a duplicate
type of non-allelic interaction in two crosses. Similar results of greater genetic diversity in maize
inbred lines for ear length have also been reviewed by Ali et al. (2007) and Singh and Roy
(2007) and Wannows et al. (2015).
5.1.10 Ear diameter
Generation mean analysis of ear diameter revealed that both additive and non-additive
gene actions were involved in the inheritance of this trait. This indicates that both selection of
inbred lines in early generations and their exploitation in hybrid breeding program will lead to
the production of useful hybrids. Additive effects observed in all the crosses were positively
significant except, PS-1 × BD-1. This indicates that selection based on ear diameter will be
effective in early generations. Our results are corroborated by Singhal et al. (2006), Kumar et al.
(2011), Haddadi et al. (2012) and Nataraj et al. (2014). Muraya et al. (2006) also suggested the
existence of both additive and non-additive gene action for ear diameter. Positively significant
119
and predominant nature of dominant gene actions observed in all crosses can be effectively
utilized in hybrid breeding programs. Zivanovic et al. (2010) also reported involvement of
dominant genes in the inheritance of ear diameter. Epistatic interactions including additive ×
additive and additive x dominant were found to have a significant role in the control of ear
diameter, while dominance × dominance epistatic interactions were negative and non-significant
in all crosses. A dispersed duplicate type of non-allelic interaction was observed in all four
crosses. Similar findings of non-allelic interactions for ear diameter were also confirmed by
Sujiprihati et al. (2003), Kumar et al. (2006), Ali et al. (2007) and Singh and Roy (2007).
5.1.11 Kernel rows ear-1
As reported in results that along with additive and dominant gene action, epistatic
interaction, additive x additive, additive × dominanceand dominance × dominance were found to
have major contribution in the inheritance of kernel rows per ear. Similar results of equal
involvement of additive and dominant genes in the inheritance of kernel rows per ear have been
reported by Hallauer and Miranda (1988). Other researchers like Mousa (2004), Prakash and
Ganguli (2004), Bujak (2006) and Srdic et al. (2007), Nataraj et al. (2014) also suggested
exploitation of additive genes for improvement of kernel rows per ear. The contribution of
dominant genes was higher than additive and epistatic genes which indicate that kernel rows per
ear could be efficiently utilized in hybrids development. In literature similar results can be
viewed from Saleem et al. (2002), Kumar et al. (2005), Shahrokhi et al. (2013) and Ofori et al.
(2015). Dominance and additive × additive effects were found positive and significant in two of
the four crosses which represent that they could be handled in hybrid programs. Significant
presence of dominance and dominance × dominance epistatic interaction with opposite signs
exhibited involvement of duplicate type of digenic interactions in the inheritance of kernel rows
per ear. Such results of duplicate genes will slower improvement through selection for kernel
rows per ear. Our results of non-allelic interactions are were in agreement with that reported by
Saeed et al. (2000), Vidal-Martinez et al. (2001), Sujiprihati et al. (2003), Kumar et al. (2006),
Srdic et al. (2007) and Singh & Roy (2007) in their maize populations.
5.1.12 Grains row-1
120
Generation mean analysis revealed that grains per row was not only controlled by
additive and dominance gene actions but had some contribution from the non-allelic interactions
as well. Similar results of both additive and dominance effects for grains per row were also
observed by Rezaei and Roohi (2004), Zare et al. (2011) and Wannow et al. (2015), who
revealed that inheritance of grains per row was controlled by simple as well as complex gene
actions. This indicates that improvement of this trait will be more difficult as compared to those
controlled by simple genetic model of inheritance. Such situation of inheritance is least favorable
from a breeder’s point of view, and suggests a revised breeding strategy for such traits of
complex genetic inheritance (Kathiria and Sherma, 1996 and Hussain et al., 2014). Presence of
additive and dominant gene actions for grains per row demonstrated that this trait can be fixed
through selection of inbred lines in early generations producing F1 hybrids having more number
of grains per row. Our results of additive gene involvement are in line with Perez-Velasquez et
al. (1996), Wasif (2008), Zivanovic et al., (2010), Ahamed et al. (2015). The dominance gene
action and digenic non-allelic epistasis of additive × dominance were found to be involved in
governing the inheritance of grains per row. Dominant effects were higher in magnitude than
additive effects. This represent that dominant genes has a pre-dominant role in the inheritance so
selection should be delayed to the later generations till the dominant gene effect is diminished to
considerable extent. Similarly, inbred lines with prominent dominant genes could be efficiently
used in hybrid development. Our results of dominant nature of genes for grains per row are in
line with Saeed et al. (2000), Malik et al. (2004), Srdic et al. (2007), Dawod et al. (2012),
Abualiet al. (2012), who suggested that dominant (incomplete to over-dominance) effects played
major role in its inheritance. Both complementary and duplicate type of non-allelic interactions
were observed for grains per row. Equal importance of additive and epistatic genetic effects for
grains per row was also reported by Debnath et al. (1989), Hamid et al. (1995), Kumar et al.
(1998), Wannow et al. (2015) and Ofori et al. (2015). Beside the additive and dominance genetic
effects, non-allelic interactions also contributed significantly to genetic variations for grains per
row. In such situations when additive, dominance and epistatic interactions are operating, an
appropriate breeding method should be adopted that can effectively exploit these three types of
gene effects simultaneously.
5.1.13 Grains ear-1
121
Genetic variability observed through generation mean analysis exhibited that not only
additive and dominant genetic effects but also non-allelic interactions were found responsible in
the inheritance of grains per ear. Presence of dominance genes exhibited that the trait could be
efficiently utilized in hybrid breeding programs for high grain yield, while the additive nature of
trait represent a potential for improvement of grains per ear. Our results about dominantly
control of grains per ear are in similarity with that reported by Darrah and Hallauer (1972),
Khodarahmpour et al. (2011a) and Nzuve (2014). A prevalence of duplicate type non-allelic
interactions in the inheritance control of grains per ear suggest that variation between generations
and in the segregation populations would be increased. Presence of duplicate type non-allelic
gene action represents that selection intensity makes progress from earlier to late generations. In
such situation it is advisable to use breeding methods that deal effectively with non-allelic
interactions. In this regard genetic improvement could be achieved through restricted recurrent
selection of intermating among desirable segregates, followed by selection or diallel selective
mating or multiple crosses or biparental mating in early segregating generations. Likewise, a
complementary type of non-allelic gene action was involved with significant and similar sign of
h (dominance) and l (dominance × dominance) for grains per ear. Moreover, in non-allelic gene
actions presence of i (additive x additive), j (additive × dominance) and l (dominance ×
dominance) with both positive significant and negative significant magnitude indicated that all
the three types of digenic non-allelic interactions played a leading role in the inheritance of this
parameter. Azizi et al. (2006) and Haq et al. (2010) also detected similar results of non-additive
nature of grains per ear while, studying inheritance of various parameters in maize germplasm
through generation mean analysis. The results of additive and non-additive genetic effects
observed in this study are in agreement with Bujak et al. (2006), Ali et al. (2007), Alam et al.
(2008), Khodarahmpour et al. (2011b) and Aslam et al. (2015) who also reported similar genetic
effects responsible in controlling the inheritance of number of grains per ear in maize.
5.1.14 Hundred grain weight
Generation mean analysis revealed that both additive and non-additive genes were
involved in the inheritance of hundred grain weight in three of the four crosses while, in a single
cross simple additive dominant model of inheritance was operative. Among the non-allelic
interactions a complementary type of epistasis was also observed in which both dominant and
122
dominant × dominant gene action were positively significant. Presence of significant additive
effects with negative magnitude indicate that selection in early generations will reduce grain
weight, while with positive magnitude selection would be efficient for increased grain weight.
Similar results for significant contribution of additive genes to the inheritance of hundred grain
weight are in line with Chen et al. (1996), Mahmood et al. (2004), Amer (2004), Sofi et al.
(2006) and Aslam et al. (2015). Hence, dominance effects of hundred grain weight could be
utilized in hybrid development. Non-allelic interactions present in the studied material exhibited
considerable amount of genetic diversity in the parents. Non-additive epistatic interactions were
positive and prominent over the additive epistasis. Same results of predominant effects from
dominant genes for hundred grain weight were also reported by Azizi et al. (2006), Akbar et al.
(2008), Fan et al. (2009), Khodarahmpour (2011b), Hussain et al. (2014) and Dorri et al. (2014)
while, evaluating their maize germplasm under desired objectives. Alamerw and Warsi (2015)
reported both positive and negative effects of dominant genes for hundred kernel weight in their
experiment of combining ability of yield related traits in maize. Mousa (2004), Prakash and
Ganguli (2004), Azizi et al. (2006) and Ali et al. (2007) also reported some contribution of non-
allelic interactions for hundred grain weight in their experiments.
5.1.15 Biological yield
As an important contributor to economic yield, biological yield is of great importance for
plant breeders aiming at high grain yield. Biological yield represents weight of net
photosynthates and in maize, it includes both the cob and stover weights. Both additive and
dominant genes as well as epistatic interactions were found operative in the inheritance of
biological yield. As indicated the effect of dominant genes was higher to that of additive,
representing predominant role in biological yield. Similar results of inheritance control through
additive gene action were also reported by Jatav et al. (2014) for biological yield in wheat crop.
The dominant genetic effects could be successfully exploited for biological yield in hybrids
development. Similarly the positive natured additive effects could be significantly utilized in the
development of synthetic varieties following an effective selection in early generations.
Dominance effects for biological yield in wheat were also observed by Kumar et al. (2011), Jain
and Sastry (2012) and Jaiswal et al. (2013). The genetic diversity in the parental populations
revealed through non-allelic interactions could also be used in the synthetic variety development
123
if epistasis is of fixable type, otherwise it could be utilized in hybrid breeding programs for
increased biological yield. One of the previous researcher, Mehla et al. (2000) has also
experienced the involvement of epistasis in the inheritance of biological yield.
5.1.16 Harvest index
A complex genetic nature of harvest index was obvious through generation mean
analysis. Although additive and dominant gene effects as well as non-allelic interactions were
involved in controlling harvest index but dominant genes were prominent. Non-allelic
interactions are indicative of greater genetic diversity in the parental material. The desired
additive effects could be efficiently utilized in selection of superior parents for obtaining a
significant gain from selection. Moradi (2014) reported both additive and dominant effects for
harvest index while, determining genetic variances and heritability estimates in maize. Seboka et
al. (2009), Saeed et al. (2010) and Singh et al. (2013) also reported that harvest index was
controlled by both additive and non-additive effects in wheat. The dominant genetic effects of
positive magnitude need to be exploited in hybrid development programs for high grain yield.
Our results of dominant inheritance of harvest index are confirmed by Jain and Sastry (2012) in
wheat crop. The non-allelic interaction dominance × dominance and dominant genetic effects
were significant with similar signs which disclosed the complimentary type of gene action.
Similarly significant and opposite signs of these components indicated duplicate gene action.
The crosses having complimentary type of epistasis could be exploited through heterosis
breeding for harvest index, while in duplicate epistasis bi-parental meeting and recurrent
selection would be most beneficial. Similar results of additive, dominance and epistatic effects
were also reported by Mahdy (1988), Pandey et al. (1999) and Shekhawat et al. (2000) for
harvest index in wheat.
5.1.17 Percent shelling
The most important contributor to the inheritance of shelling percentage was dominant
gene action although some of the non-allelic interactions like additive × additive and dominance
× dominance also played their role. This indicates that these inbred parents could be effectively
exploited for superior hybrids. Similar results of non-additive effects for shelling percentage
were reported by Mathuret al. (1998), Sujiprihati et al. (2003), Sah et al. (2014) and Pérez-López
et al. (2014). Niyonzima et al. (2015) reported that inheritance of percent shelling was under
124
control of additive, dominance and epistatic gene actions. In all crosses, additive × additive and
dominant × dominant non-allelic interactions were significantly positive and negative,
respectively. Such occurrence of non-allelic interactions represented duplicate type of digenic
interactions which is an indication of greater genetic diversity. The fixable heritable epistasis
could be effectively used in the selection of superior inbred lines. Our results of duplicate
epistasis for shelling percentage in maize are corroborated by previous researchers like Ravikant
et al. (2006). Similar results of epistatic effects for percent shelling were also reported by
Niyonzima et al. (2015) in their maize populations.
5.1.18 Expansion volume
High grain yield and popping expansion are the two importance strategies in hybrid
development programs of popcorn. Expansion volume is a quality trait of great importance to
consumers, as unpopped kernels are sold by weight and popcorn flakes are sold by volume
(Shimoni et al., 2002; Borras, 2006). All the three type of gene actions including additive,
dominance and epistasis were found responsible in the inheritance of expansion volume of maize
grain. This indicated that the trait was under a complex genetic mechanism. The additive portion
of genetic control was comparatively low than that of dominance one, indicating its
predominance. Such dominant genes could be effectively utilized in hybrid breeding. On the
other hand, the additive portion need to be exploited in the selection of superior inbred parent as
it represents fixable variation. Pinto et al. (2001), Andrade et al. (2002), Rangel et al. (2008) and
Silva et al. (2010), Jele et al. (2014) and Cabrel et al. (2015) also reported similar results of both
additive and non-additive genetic effects for expansion volume with a high proportion from
additive genes. In non-allelic interactions, duplicate type of digenic inheritance was prominent.
Lu et al. (2003) and Pinto et al. (2004) also obtained additive component as controlling factor in
the inheritance of expansion volume, while studying the genetic mechanism and heritability of
grain yield and expansion volume in popcorn top crosses. Based on their studies previous
researchers like Pajic and Babic (1991), Pereira and Amaral (2001) and Miranda et al. (2008)
also emphasized on early generation selection of superior inbred lines for popping expansion
volume.
125
5.1.19 Percentage of unpopped grains
Number of unpopped grains and grain moisture content at popping are the main
indicators for popcorn expansion. A desired popcorn variety should have a low number of non-
popping kernels and grain moisture content between 13 and 14.5 % at the time of popping
(Ziegler, 2001). Consumers prefer popping expansion and less number of unpopped grains in
soft popcorn (Aguiar et al., 2008, Rangel et al., 2008, Freitas Jr. et al., 2009 and Munhoz et al.,
2009). Both additive and dominant genes were found responsible in the genetic control of
percent unpopped grains with a greater contribution from dominant genes. In most of the crosses
the negatively significant values of dominant genetic effects represented that they will reduce the
number of unpopped grains. A similar trend of both additive and non-additive genetic effects
with a greater portion from additive effects was observed by Jele et al. (2014). The additive
genetic components of percent unpopped grains need to be used in the identification of parents
with reduced unpopped grains which could be exploited in hybrid breeding scheme for their
desired dominant gene. Among the epistatic interactions dominant × dominant gene action were
important revealing the importance of dominance gene to be utilized in hybrid development
effectively. Both complementary and duplicate type of digenic interactions were involved in the
inheritance of percent unpopped grains. Presence of duplicate type non-allelic gene action
represents that selection intensity makes progress from earlier to late generations. In such
situation it is advisable to use breeding methods that deal effectively with non-allelic
interactions. In this regard genetic improvement could be achieved through restricted recurrent
selection of intermating among desirable segregates, followed by selection or diallel selective
mating or multiple crosses or biparental mating in early segregating generations.
5.2 Heritability
Heritability estimates are of tremendous importance as they influence the choice of
procedures for selection of genotypes by plant breeders. Based on heritability, plant breeders
decide which method would be most effective to improve a character and to predict gain from
selection as well as determine the relative importance of genetic effects (Falconer and Mackay,
1997). The concept of heritability is important for breeders since it is an important factor in the
rate of genetic change possible in a trait (Wilcox, 1992). Selection of character with high
heritability results into a meaningful gain from selection. Selections for quantitative characters
126
like grain yield in maize produce very little or no gain. The failure of yield response to selection
is most likely due to low heritability of this trait. Low heritability makes it very difficult to
identify the superior genotypes. Therefore, the superiority of plants selected on the basis of
phenotype would be due to factors other than their genotype. This would limit the progress under
selection. Heritability of a character provides reliable information about the inheritance of that
trait into the next generation, so helps in making desirable selection. The higher the heritability,
the simpler and less time consuming the selection procedure and the greater will be the genetic
improvement (Allard, 1960). Heritability in broad-sense (h2BS) is the ratio of total genetic
variance to the phenotypic variance, while the ratio of additive genetic variance to the
phenotypic variance is termed as narrow sense heritability usually denoted as h2NS (Sujiprihati et
al., 2003). Plant breeders can exploit the narrow sense heritability in an efficient way for
selection because of its additive genetic constitution (Falconer and Mackay, 1997). High estimate
of narrow sense heritability for a trait indicates that the character investigated is simply inherited,
while low estimate shows that the character is less heritable because high number of genes are
involved in the control of that character (Suzuki et al., 1981).Characters with high heritability
(narrow sense) can easily be fixed with simple selection resulting in quick progress, as they
would be under additive genetic effects. According to Fehr (1993) the presence of additive
genetic effects for a trait could be exploited in selection due to its fixable variation. Fry (2004)
reported that heritability of a trait approaches its maximum in successive generations following
hybridization. Heritability estimates of both types i.e., broad sense (h2BS) and narrow sense
(h2NS), are discussed here for the studies of plant parameters in four maize crosses to elucidate
the pattern of heritability and to compare the results obtained in the present study with those
reported by earlier researchers.
5.2.1 Days to 50% tasseling
High heritability estimates of broad sense were observed for days to 50% tasseling in all
the four crosses, showing that selection in these crosses for this trait will be effective due to high
genetic variances. Our result of high broad sense heritability were in line with those observed by
Bello et al. (2012), Sharma et al. (2014), Moradi (2014) and Al-Falahy (2015) while, Abdelmula
and Sabeil (2007), Nigussie& Saleh (2007) and Bekele & Rao (2014) reported moderate
heritability of broad sense in their studies for days to tasseling in maize. Narrow sense
127
heritability estimates ranged from moderate to high in all four studied crosses for days to
tasseling. This exhibit that parents could be easily utilized for both direct selection and hybrid
development. Similar results of low narrow sense heritability were also observed by Moradi
(2014), while Al-Falahy (2015) calculated moderate estimates for days to tasseling.
5.2.2 Days to 50% anthesis
High estimates of broad sense heritability were calculated for days to anthesis in all four
crosses. On the other hand, moderate level of narrow sense heritability was estimated for days to
anthesis in three of the four crosses, while high level of narrow sense heritability was calculated
for only one cross. As moderate to high level of narrow sense heritability is indication of the
predominant role of additive gene action which means that these parents can be effectively
utilized for enhancing early maturity through selection. High heritability estimate is an indication
of relative small environmental effect on phenotype as well as a close resemblance between
genotype and the phenotype. High broad sense heritability was also estimated by Majidi et al.
(2009) and Shukla et al. (2014) for days to anthesis in maize. In contrast low broad sense
heritability estimates were observed by Bello et al. (2012), Bekele& Rao (2014) and Dorri et al.
(2014) for days to anthesis. Our results of high and low estimates of narrow sense heritability are
in line with Majidi et al. (2009) and Dorri et al. (2014), respectively.
5.2.3 Days to 50% silking
Days to silking showed high broad sense heritability estimates in all the four crosses,
while narrow sense heritability ranged from moderate to high in these crosses for this maturity
character. Due to high estimates of heritability phenotype will be a clear picture of genotype and
hence selection will be more effective for earliness in silking. Earlier researchers like Beyene
(2005), Sumathi et al. (2005), Nigussie & Saleh (2005) and Bello et al. (2012) also observed high
broad sense heritability estimates for days to silking in their studies while estimating heritability
and other genetic parameters in maize. Moderate to high narrow sense heritability can easily be
utilized for promoting earliness in these germplasm. Our high heritability estimates for broad
sense and moderate for narrow sense are in conformity with those of Abadi et al. (2011).
5.2.4 Plant height
128
Broad sense heritability estimates calculated for plant height in all four crosses were of
high magnitude, while narrow sense heritability estimated for plant height were of moderate
level. Estimates of both broad and narrow sense heritabilities indicated that plant height was least
affected by environment. This represent that selection in these genotypes for plant height would
be meaningful in further breeding approaches. Similar results of high heritability have been
reported by Mehmood et al. (2004), Sumathi et al., (2005), Tengan et al. (2012), Nataraj et al.
2014 and Shukla et al. (2014). Majidi et al. (2009) and Abadi et al. (2011) observed high
estimates for both broad and narrow sense heritability in their studies, while Tengan et al. (2012)
also reported low narrow sense heritability.
5.2.5 Ear height
Estimates of broad sense heritability were high for ear height in all the crosses, whereas
heritability estimates in narrow sense were also high in most crosses while, in one cross
moderate level of heritability (h2NS) was calculated. High levels of heritability shows that ear
height was least affected by environment, which provide the evidence that ear height was the
under control of additive genetic effects. Similarly crosses with moderate heritability estimates is
indicative of smaller environmental influence which suggests that improvement of this trait in
this material could be made easily through selection. The present results about high heritability
got support from Sumathi et al. (2005), Lorenzana and Bernardo (2008), Shukla et al. (2014), Al-
Falahy (2015). Abadi et al. (2011) also reported high estimates of both broad and narrow sense
heritability for ear height.
5.2.6 Ear weight
Broad sense heritability estimates observed for ear weight were high in magnitude in all
four crosses. High heritability is an indication of predominant role of genetic effects compared to
environmental one. Based on high role from genetic portion, improvement in ear weight and
ultimately grain yield could be made easily through selection. Heritability estimates of narrow
sense were of moderate level in all crosses. Similar results of high broad sense heritability were
also reported by El-Badawy (2012), Gnanamurthy et al. (2013) and Nzuve et al. (2014). In
129
contrast Berilli et al. (2013) observed moderate broad sense heritability for ear weight. These
findings exhibit that additive gene action is responsible for controlling ear weight, which also
manifests that selection in early generations would be fruitful. Similar results of moderate
heritability in narrow sense have also been reported by Sujiprihati et al. (2003). Azizi et al.
(2006) and El-Badawy (2012) reported low and high estimates of narrow sense heritability for
ear weight in their study.
5.2.7 Grain yield
All the four crosses disclosed high estimates of heritability in broad sense for grain yield.
On other hand moderate heritability in narrow sense was estimated for three of the four crosses
while, only one cross exhibited high level of narrow sense heritability for grain yield. Such
presence of high heritability estimates evoke the existence of enough amount of
genetic variability for improvement of this trait and also indicates that
grain yield is more amenable to selection and could be improved easily. Similar
results of high heritability for grain yield were also reported by previous researchers like Ali et
al. (2012), Bello et al. (2012), El-Badawy (2012), Noor et al. (2013), Hussain and Hassan (2014),
Hussain and Ali (2014), Shukla et al. (2014), Al-Naggar et al. (2015) and Mukambi et al. (2015).
Our findings of heritability in narrow sense with moderate levels observed for most of the
crosses in this study are in consensus with those of Presterl et al. (2003), Abdelmullah and Sabiel
(2007), Majidi et al. (2009), El-Badawy (2012) and Hussain and Ali (2014). Azizi et al (2006)
also reported narrow sense heritability of low to moderate level in a study of gene action for two
crosses. Dorri et al. (2014) also reported high narrow sense heritability for grain yield.
Inconsistently low estimates of narrow sense heritability were reported by some early researchers
like Lorenzana& Bernardo (2008), Zare et al. (2011), Hussain et al. (2014) and Al-Naggar et al.
(2015).
5.2.8 Ear diameter
High broad sense heritability estimates calculated for ear diameter projects low
environmental influence with high genetic effects on this trait. On the other hand narrow sense
heritabilities were of moderate to high level. As moderate to high level of narrow sense
130
heritability is indication of predominant role of additive gene action which means that these
parents can be effectively utilized in recurrent selection programs for enhancing ear diameter.
Moderate level of narrow sense heritability is also an indication of influence of both genetic and
environmental factor on ear diameter. High heritability estimate is an indication of relative small
environmental effect on phenotype as well as a close resemblance between genotype and the
phenotype. Similar results of high broad sense and moderate narrow sense heritability were also
reported by Nigussie and Saleh (2007), Rafiq et al. (2010), Kashiani et al. (2010), Shukla et al.
(2014) and Sharma et al. (2014). Low narrow sense heritability estimates were reported by
Tengan et al. (2012) for ear diameter.
5.2.9 Ear length
Broad sense heritability estimates calculated for ear length were representing greater
portion of genetic components including both additive and non-additive. Such genetic effects
could be utilized in hybrid development if the gene actions are non-additive in nature otherwise,
effectively exploited in the selection of superior inbred parents for future breeding programs.
Estimates of narrow sense heritability were moderate in magnitude exhibiting that both genetic
and environmental factors are affecting ear length. Similar results of heritability estimates have
been reported by Nigussie and Saleh (2007), Rafiq et al. (2010), Kashiani et al. (2010), Sharma
et al. (2014) and Ishaq et al. (2014). In contrast to our findings Idris and Abuali (2011) and
Shukla et al. (2014) revealed moderate broad sense heritability estimates for ear length. Similarly
low narrow heritability estimates have been reported by Tengan et al. (2012) for ear length.
5.2.10 Kernel rows ear-1
Broad sense heritability estimates observed for kernel rows per ear were high in
magnitude in all four crosses. High heritability is an indication of predominant role of genetic
effects compared to environmental one. Based on high role from genetic portion improvement in
kernel rows per ear could be made easily through selection as well as using desired selected
parents in hybrid breeding programs. Heritability estimates of narrow sense varied from
moderate to high level for this trait. Similar results of high broad sense heritability were also
reported by Alake et al. (2008), Tengan et al. (2012) and Nataraj et al. (2014) while, Noor et al.
131
(2013) revealed moderate estimates of broad sense heritability. Olakojo and Olaoye (2011),
Shahrokhi et al. (2013) and Shukla et al. (2014) calculated low broad sense heritability estimates
for kernel rows per ear while, evaluating their maize germplasm. Nigussie and Saleh (2007)
reported negative heritability for kernel rows per ear, indicating very low contribution of genetic
effects. Our findings of moderate narrow sense heritability estimates for kernel rows per ear were
in conformity to those of Moradi (2014). Our results of moderate to high narrow sense
heritability were contrary to Amer et al. (2004) and Tengan et al. (2012) who reported low
positive and high negative estimates for kernel rows per ear, respectively. Similarly Shahrokhi et
al. (2013) also observed low narrow sense heritability for kernel rows per ear.
5.2.11 Grains row-1
All the crosses exhibited high estimates of heritability in broad sense for grains per row.
Likewise moderate heritability in narrow sense was estimated for three of the four crosses while,
only one cross exhibited low level of narrow sense heritability for this trait. Such presence of
high heritability estimates evoke the existence of enough amount of genetic variability for
improvement of this trait and also indicates that grains per row is more amenable to selection and
could be improved easily. Similar results of high heritability for grains per row were in
consensus to that reported by previous researchers like Moradi (2014, Aslam et al. (2015) and
Wannows et al. (2015). Shahrokhi et al. (2013) and Dorri et al. (2014) reported moderate broad
sense heritability estimates in their experiments on maize crop. Our findings of heritability in
narrow sense with moderate levels observed for most of the crosses in this study were in
consensus with those of Moradi (2014), Aslam et al. (2015) and Wannows et al. (2015).
Inconsistently low estimates of narrow sense heritability for grains per row were reported by
some early researchers like Shahrokhi et al. (2013), Hussain and Ali (2014) and Dorri et al.
(2014).
5.2.12 Grains ear-1
Like other grain characters high broad sense heritability estimates were calculated for
grains per ear. Moderate heritability in narrow sense was estimated for two of the four crosses
while, other two crosses exhibited low and high estimates of narrow sense heritability for this
132
trait. Presence of such high heritability estimates indicated sufficient amount of genetic
variability for improvement of grains per ear and also revealed that grains per ear was more
accessible to selection and could be improved easily. Our reports of high broad sense heritability
are corroborated with Bello et al. (2012), Anshuman et al. (2013), Rezaei et al. (2005), Aslam et
al. (2015) and Rahman et al. (2015). Khodarahmpour (2011a) reported moderate heritability
estimates for grains per ear. Our findings of heritability in narrow sense with moderate levels
observed for most of the crosses in this study were in consensus with those of Moradi (2014) and
Aslam et al. (2015). Rezaei et al. (2005) and Khodarahmpour (2011b) reported low estimates of
narrow sense heritability contradicted our reported results.
5.2.13 Hundred grain weight
Hundred grain weight showed high broad sense heritability estimates in all four crosses,
while narrow sense heritability ranged from moderate to high for this trait. Due to high estimates
of heritability phenotype will be a clear picture of genotype and hence selection will be more
effective for hundred grain weight. Earlier researchers like Chohan et al. (2012), Moradi (2014),
Hussain et al. (2014) and Wannows et al. (2015) also experienced high broad sense heritability
estimates for hundred grain weight in their studies while estimating heritability and other genetic
parameters in maize crop. Moderate to high narrow sense heritability can easily be utilized for
improving hundred grain weight in their studied germplasm. Our results of high to moderate
heritability estimates of narrow sense are in conformity with Moradi (2014) and Wannows et al.
(2015). Hussain et al. (2014) calculated low narrow sense heritability estimates for hundred grain
weight both under normal and stressed conditions.
5.2.14 Percent shelling
High broad sense heritability estimates calculated for percent shelling was a
manifestation that a greater portion of genetic components (additive and non-additive) were
affecting this trait. Such genetic effects could be utilized in hybrid development if the gene
actions are non-additive in nature otherwise, could be effectively exploited in the selection of
superior inbred parents for future breeding programs. Estimates of narrow sense heritability were
moderate in magnitude exhibiting that both genetic and environmental factors are affecting
133
percent shelling. Our results of broad sense heritability estimates were in consensus with that
reported by Hussain et al. (2014) and Atta & Marsi (2015). In contrast to our findings, Idris &
Abuali (2011) and Shukla et al. (2014) revealed moderate broad sense heritability estimates for
ear length. Similarly moderate narrow heritability estimates for percent shelling were also
reported by Hussain et al. (2014).
5.2.15 Days to maturity
Early and medium-maturing maize hybrids and open pollinated varieties are desirable in
the areas where early and cold autumn affect the production due to early autumn cold stress.
Heritability estimates of both broad and narrow sense for days to maturity were high in
magnitude indicating a predominant role of additive gene action which means that these parents
can be effectively utilized for enhancing early maturity through selection. High heritability
estimate is an indication of relatively small environmental effect on phenotype as well as a close
resemblance between genotype and the phenotype. Our results of high heritability estimates were
also in conformity with those of Dorri et al. (2014), Sharma et al. (2014) and Kumar et al.
(2014a) for days to maturity in maize. In contrast to our findings Khanmohammadi et al. (2013)
and Tesfaye et al. (2014) reported low broad sense heritability for days to maturity.
5.2.16 Biological yield
High broad sense heritability estimates were operative in all crosses of the present study
for biological yield. Narrow sense heritability was of moderate level in all crosses. Such presence
of high heritability estimates revealed the existence of enough amount of genetic variability for
improvement of this trait and also indicates that biological yield could be improved easily
through selection. A minimal difference in high magnitude of both broad and narrow sense
heritabilities, revealed predominancy of additive genetic effects over dominance genetic effects
for this trait. Our results of high broad sense heritability estimates similar to previous researchers
including, Aastiveit and Aastiveit (1990), Kanapeckas et al. (2005) and Majidi et al. (2009).
Abadi et al. (2011) reported moderate level of h2BS for biological yield. Our findings of moderate
narrow sense heritability are in consensus with those of Piano et al. (2008), Majidi et al. (2009)
and Abadi et al. (2011).
134
5.2.17 Harvest index
High broad sense heritability estimates calculated for harvest index revealed low
environmental influence with high genetic effects on this trait. Heritability estimates of narrow
sense reported for harvest index were of moderate level, indicating a predominant role of
additive gene action which means that studied germplasm could be passed through recurrent
selection programs for enhancing harvest index. Moderate level of narrow sense heritability is
also an indication of influence of both genetic and environmental factors on this trait. Such
results of high heritability estimates are indication of relative small environmental effect on
phenotype as well as a close resemblance between genotype and the phenotype. Similar results
of high broad sense and moderate narrow sense heritability were in consensus with reports of
previous scientists including Chohan et al. (2012), Moradi (2014) and Moradi et al. (2014).
5.2.18 Expansion volume
In popcorn breeding, not only yield and agronomic traits are important, but quality
characters like, popcorn texture and softness are also considered. Farmers are interested in high
yields and other features of normal maize, whereas consumers care about a high expansion
volume, which improves the popcorn texture and softness (Miranda et al., 2008). Broad sense
heritability estimates calculated for expansion volume were of high level in all crosses evaluated
in this study, while narrow sense heritability estimates were of moderate level. As moderate to
high level of narrow sense heritability is indication of predominant role of additive gene action
which means that these parents can be effectively utilized for enhancing early maturity through
selection. This is because there would be a close correspondence between the genotype and the
phenotype due to the relatively small contribution of the environment to the phenotype. Our high
broad sense heritability results were in consistency with that estimated by Ribeiro et al. (2012),
Freitas et al. (2014) and pinto et al. (2014) for expansion volume in maize. In contrast, low and
moderate broad sense heritability estimates for expansion volume were observed by Amaral Jr et
al. (2010) and Rodovalho et al. (2014), respectively. Our results of high and low estimates of
narrow sense heritability are also supported by Majidi et al. (2009) and Dorri et al. (2014),
respectively.
135
5.2.19 Percentage of unpopped grains
Broad sense heritability estimates observed for percent unpopped grains were high in
magnitude in all crosses. High heritability is an indication of predominant role of genetic effects
compared to environmental one. Based on high role from genetic portion, improvement in
percent unpopped grains could be made easily through selection. Heritability estimates of narrow
sense were of moderate to high level. Similar results of high broad sense heritability were also
reported by Jele et al. (2014). These findings exhibit that additive gene action was responsible
for controlling percent unpopped grains, which also shows that selection in early generations
would be fruitful.
5.3 Heterosis
The phenomenon of heterosis or hybrid vigor has been extensively used in cross
pollinated crops like maize, where mating of two homozygous inbred lines results in an F1 hybrid
which is more productive than its parents. In these crops, heterosis is widely exploited as a basic
tool for improved production in the form of F1 hybrids. According to Valerio et al. (2009) using
best parent combination in hybrid program we can expect elite F1 hybrids. Superiority, of hybrids
over pure line mid-parents and better-parents is associated with manifestation of heterotic effects
of major yield traits (Alghamdi, 2009). Heterosis of both nature, mid-parent and better-parent is
an important parameter for plant breeders especially while dealing with cross pollinated crops
like maize. Generally, heterosis has been studied in populations with different genetic
backgrounds, which confound the relationships among heterosis, dominance and gene frequency.
It is the heterotic studies that provide a base for fully exploiting the valuable hybrid
combinations in breeding programs and their commercial utilization. Therefore, any breeding
material that lacks the sufficient amount of inbuilt hybrid vigor as a prerequisite can’t develop
successful hybrid varieties. It is due to heterotic studies that hybrid maize production has been
successfully used by growers around the world. Being a complex quantitative character grain
yield and its components were reported by previous research scientists to have a variable range
of heterotic values in various F1 maize populations. Both mid-parents and better parent heterotic
effects were investigated for 20 plant parameters in four maize crosses in the present study.
These results are discussed in the following paragraphs in light of observations of the previous
investigators.
136
5.3.1 Days to 50% tasseling
Heterotic study revealed that negative values were calculated for both mid parent and
better parent heterosis. Being an important trait of maturity such observed reduction in days to
tasseling is desirable for developing early maize hybrids. Negative heterosis in all the crosses
represents that parental lines used in the study could be effectively utilized in hybrid breeding
programs for development of hybrid with early maturity. Similar results of negative heterosis
were also reported by Aminu et al. (2014), Kumar et al. (2014c), Solalinde et al (2014) and Al-
Falahy (2015) for days to tasseling in their used maize germplasm.
5.3.2 Days to 50% anthesis
All the crosses studied revealed negative magnitude of both mid and better parent
heterosis for days to 50% anthesis. Negative nature of both mid and better parent heterosis for
day to anthesis exhibited that in all the crosses maturity has been decreased which is a prime
objective in areas where maize crop has short growing season with multiple cropping system.
Such negative heterosis along with dominance genetic effects of this germplasm could be
successfully exploited for hybrid development with early maturity. Similar findings of negative
heterosis for days to anthesis has been reported by Malik et al. (2004), Ali et al. (2013) and
Solalinde et al (2014).
5.3.3 Days to 50% silking
Like other maturity characters mid parent and better parent heterosis for days to silking
were negative in nature in all crosses. Negative values of heterosis in all the crosses represent a
decline in the total days to silking and hence early maturity. It is obvious from such negative
heterosis in days to silking that these inbred lines can be significantly used in formation of early
maturing hybrids in future maize breeding programs. Our results of negative heterosis for days to
silking were in consensus to the findings of some earliest researchers including Iqbal et al.
(2010), Ali et al. (2013), Hussain and Ali (2014) and Al-Falahy (2015).
5.3.4 Plant height
137
Both mid parent and better parent heterosis observed for plant height in the studied
crosses were positive in nature ranging from low to moderate in magnitude. This represents that
dominant and dominant × dominant gene action are involved in the inheritance of plant height.
Due to dominant control of the trait these parental lines could be effectively utilized in maize
hybrid breeding programs for short stature hybrids. Our findings of positive heterosis for plant
height are in conformity with Iqbal et al. (2010), Amanullah et al. (2011), Ali et al. (2012),
Aminu et al. (2014) and Ofori et al. (2015) in their studies. Amanullah et al. (2011) and Ali et al.
(2012) also reported positive hetrobeltiosis for plant height in their heterotic studies.
5.3.5 Ear height
In the heterotic study low level with negative nature of both mid parent and better parent
heterosis were exhibited by two of the four crosses, while, the other two crosses revealed
moderate levels of heterosis both as mid parent and better parent for ear height. Negative
heterosis for ear height represents that inbred lines would be used to develop hybrids with
reduced ear height which is desired for reducing incidence of stem and root lodging, and also in
stress condition. The positive magnitude of heterosis for ear height is expected due to dominance
and non-fixable epistasis. Similar results of heterosis with positive and negative magnitudes are
in harmony with the findings reported by Amanullah et al. (2011), Ali et al. (2012), Aminu et al.
(2014) and Ofori et al. (2015).
5.3.6 Ear weight
High heterotic values of positive mid and better parent were observed for ear weight in
all the crosses under study. Such high heterosis in the present study for ear weight might be due
to the presence of high genetic diverse inbred lines used as parents. To fully exploit the heterosis,
these inbred lines can be utilized effectively in the hybridization program for the improvement of
grain yield and related traits. These results of high heritably for ear weight are in agreement with
those reported by Saleh et al. (2002),Kustanto et al (2012), Aminu et al. (2014) and Jain
&Bharadwaj (2014) in most of their crosses.
5.3.7 Grain yield
138
Although being a complex character of many contributing traits, high mid parent and
better parent heterosis was observed for grain yield. This study represents that inbred lines used
as parents in these crosses were having high genetic diversity. It also explains that inheritance of
grain yield was under control of dominance, over dominance and dominance type of non-allelic
interactions along with some pleotropic effects of various alleles in the hybrid combinations of
diverse inbred lines. As a premium goal of all breeding programs the high nature of heterosis for
grain yield could be effectively exploited in the production of maize hybrids with improved grain
yield. As an ideal crop for hybrid breeding maize has the ability to play an important role in the
food security due to its high yield potential and greater genetic diversity. It has been reported that
in future maize crop will be the main source of staple food and no other staple crop exhibits
enough hybrid vigor like maize (Ali et al., 2012). Similar results of high mid and better parent
heterosis have been reported by several researchers in their heterotic studies for grain yield Ali et
al. (2013), Kumar et al. (2014c) and Solalinde et al. (2014). In contrast Bekele et al.
(2013), Ali et al. (2014), Ofori et al. (2015) and Shadlou et al. (2015) observed negative
heterosis for grain yield in most of their maize crosses.
5.3.8 Days to maturity
Mid parent heterosis observed for days to maturity in all crosses were negative in nature
ranging from -2.91 to -2.22 days in magnitude. Best parent heterosis was of positive and negative
nature with low values each in two crosses. This represents that dominant and dominant ×
dominant gene actions are involved in the inheritance of days to maturity. Due to dominant
control of the trait, these parental lines could be effectively utilized in maize hybrid breeding
programs for early maturing hybrids. Negative heterosis indicated the earliness of resultant
popcorn hybrids developed in this study. Earliness is desirable because of reasonable efficiency
under multiple cropping system, drought stress and land use efficiency. Our findings of negative
heterosis are similar to Appunu et al. (2007), Jabeen et al. (2007), Reddy et al. (2011), Jawaharlal
et al. (2012) and Jain and Baharadwaj (2014) in their studies for some of the crosses.
5.3.9 Ear diameter
Both mid and better parent heterotic values were positive in nature and of high magnitude
for ear diameter in all crosses used in this study. These findings disclosed that inbreds used in
139
this study as parents in these crosses were having high genetic diversity. It also explains that
inheritance of ear length was under control of dominance, over dominance and dominance type
of non-allelic interactions along with some pleotropic effects of various alleles in the hybrid
combinations of diverse inbred lines. To fully exploit the heterosis these inbred lines should be
utilized effectively in the hybridization program for the improvement of ear diameter and other
yield related traits. These results of high heterosis for ear length were in agreement with those
reported by Bekele and Rao (2013), Kapoor et al. (2014), Kumar et al. (2014c) and Ofori et al.
(2015) in most of their crosses.
5.3.10Ear length
Both mid and better parent heterotic values were positive in nature with high magnitude
for ear diameter in all crosses used in this study. These findings disclosed that inbred parents
used in this study as parents in these crosses were having high genetic diversity. It also explains
that inheritance of ear length was under control of dominance, over dominance and dominance
type of non-allelic interactions along with some pleotropic effects of various alleles in the hybrid
combinations of diverse inbred lines. To fully exploit the heterosis, these inbred lines should be
utilized effectively in the hybridization program for the improvement of ear diameter and other
yield related traits. These results of high heterosis for ear length were in agreement with those
reported by Kapoor et al. (2014), Ali et al. (2014), and Ofori et al. (2015). In contrast Bekele&
Rao (2013) and Ofori et al. (2015) obtained negative heterosis in some of their crosses.
5.3.11 Hundred grain weight
Being an important yield related trait hundred grain weight revealed high values for both
mid and better heterosis. High heterotic values were due to presence of non-additive gene action
in the form of dominance, dominance × dominance and some-what additive × dominance for
hundred grain weight. The better exploitation of the non-additive gene actions should be hybrid
development with increased grain weight. Similar results of positive heterosis were also reported
by Yosuf et al. (2014), Kumar et al. (2014c) and Ofori et al. (2015).
5.3.12 Kernel rows ear-1
140
In all crosses mid parent heterosis was positive in nature with high magnitude except PS-
2 × BD-1 in which its value was of moderate level. Similarly better parent heterosis calculated
for all crosses was positive in nature. Such presence of high heterotic values both for mid and
better parent indicated that non-additive gene action in the form of dominance and dominance ×
dominance for kernel rows per ear were involved in the genetic control this trait. These non-
additive gene actions could be efficiently utilized in the hybrid development with an increase in
kernel rows per ear. Our results of positive heterosis were supported by Aghaei et al. (2012),
Hussain (2013), Guerrero et al. (2014) and Ofori et al. (2015) who also found similar results of
positive heterosis for kernel rows per ear in their studies for some of the crosses. Guerrero et al.
(2014) and Kumar et al. (2014c) reported negative heterosis for kernel rows per ear.
5.3.13 Kernels row-1
Kernel per row is an important component of maize grain yield. Both mid and better
parent heterosis were positive with high magnitudes. Such presence of high heterotic values both
for mid and better parent indicated that non-additive gene action in the form of dominance and
dominance × dominance for kernel rows per ear were involved in the genetic control this trait.
These non-additive gene actions could be efficiently utilized in the hybrid development with
increased kernel rows per ear. Our results of positive heterosis are similar to Muraya et al.
(2006), Jain et al. (2014), Kumar et al. (2014c), Shadlo et al. (2015) and Ofori et al. (2015)
observing similar results of positive heterosis for kernels per row in their studies.
5.3.14 Kernels ear-1
Kernels per ear is an important grain yield parameter in maize. In all crosses mid parent
heterosis was positive in nature with high magnitude. Similarly better parent heterosis calculated
for all crosses was also high with positive nature. Such presence of high heterotic values both for
mid and better parent indicated that non-additive gene action in the form of dominance and
dominance × dominance for kernels per ear were involved in the genetic control this trait. These
non-additive gene actions could be efficiently utilized in the hybrid development with an
increase in kernels per ear. Our results of positive heterosis were confirmed by Amanullah et al.
(2011), who also observed positive mid and better parent heterosis in their study. The present
141
results of mid and better parent heterosis are also corroborated by some previous researchers
including Tollenaar et al. (2004), Frascaroli et al. (2007) and Alam et al. (2008). They observed a
varying level of heterotic values for kernels per ear in F1 hybrids.
5.3.15 Biological yield
Both mid parent and better parent heterosis observed for biological yield in the studied
crosses were positive in nature with high magnitude. Such results of high heterosis is an
indication of greater genetic diversity among the parental inbred lines and non-allelic control in
the inheritance of biological yield. Due to dominant control of this trait these parental lines could
be effectively utilized in maize hybrid breeding programs for short stature hybrids. Our findings
of positive heterosis for biological yield are corroborated by Hussain et al. (2004) and Iqbal
(2009).
5.3.16 Percent shelling
Like other grain yield related traits both mid and better parent heterotic values were
positive for percent shelling in all crosses used in this study. These findings disclosed a greater
genetic diversity among the inbred lines used as parents in these crosses. It also explains that
inheritance of percent shelling was under control of dominance, over dominance and dominance
type of non-allelic interactions along with some pleotropic effects of various alleles in the hybrid
combinations of diverse inbred lines. To fully exploit the dominant gene effects of percent
shelling, these inbred lines should be utilized in heterosis breeding program for the improvement
of grain yield and related traits. These results of positive heterosis for percent shelling were in
agreement with those reported by Jawaharlal et al. (2012), Abdel-Moneam et al. (2014) and
Kumar et al. (2014c).
5.3.17 Harvest index
Both mid parent and better parent heterosis observed for harvest index in the studied
crosses were positive in nature with high magnitude. Such results of high heterosis is an
indication of greater genetic diversity among the parental inbred lines and non-allelic control in
the inheritance of harvest index. To fully exploit the heterosis these inbred lines should be
utilized effectively in the hybridization program for the improvement of grain yield and other
142
yield related traits. These results of positive heterosis for harvest index were in close conformity
with those reported by Tollenaar et al. (2004), Kapoor et al. (2014).
5.3.18 Popping volume
Popcorn expansion volume mainly rely on percent of unpopped grains and grain moisture
content at harvest. Ideal popcorn varieties should have low number of unpopped grains and grain
moisture of 13 to 14.5% at the time of popping (Ziegler, 2001). Being an important trait, popping
volume revealed high values for both at mid and better heterosis. High heterotic values were due
to presence of non-additive gene action in the form of dominance, dominance × dominance and
some-what additive × dominance for popping volume. The better exploitation of the non-additive
gene actions should be aimed at hybrid development with increased popping volume. Similar
results of positive heterosis were reported by Rangel et al. (2008) who also found similar results
of negative heterosis for popping volume while, estimating genetic parameters through diallel
analysis in popcorn. Miranda et al. (2008) also experienced reduced heterosis for popping
volume in Brazilian popcorn populations in relation to commercial cultivars.
5.3.19 Percent unpopped grains
Being an important quality character in popcorn, percent unpopped grains revealed
negative values of mid parent heterosis. Better parent heterosis was positive in all crosses except
one for percent unpopped grains. Negative heterotic values were indication of non-additive gene
action in the form of dominance and dominance × dominance with a negative impact on the
inheritance of unpopped grains. Such negative non-additive genes could be effectively utilized in
reducing the number of unpopped grains of popcorn hybrids. Our results of negative heterosis for
percent unpopped grains are also supported by Jele et al. (2014).
5.4 Genotypic and phenotypic association among traits
The correlation coefficients provide sufficient information about the level of relationship
and help plant breeders to exploit these information in an efficient way (Bocanski et al., 2009;
Nagabhushan et al., 2011). According to Hallauer and Miranda (1995) genetic correlation among
quantitative characters is due to pleiotropy and/or linkage disequilibrium. Correlation
analysis in plant breeding is mainly used to quantify the mutual relationship
143
between various plant characters and identify the component characters on
which selection can be based for genetic improvement in yield (Singh and
Narayanan, 1993). For plant breeder the genotypic correlation coefficient is
more important because it represents the heritable association between two
variables (Falconer and Mackey, 1997). Correlation among traits generally indicate two
important factors viz. genetic (pleiotropic effects, linked genes) and environmental factors. As
indicated phenotypic correlation is measured from the phenotype and is the result of genetic as
well as environmental factors, while genetic correlations is the result of genetic factors (additive)
and provide crucial information about effective selection (Bocanski, et al., 2009). As
phenotypic correlation includes both phenotypic and environmental effects,
therefore significant phenotypic correlations without significant genotypic
correlation practical implications value. The reason of association among traits is an
essential tool for breeders to decide strategy for future breeding programs. Therefore, plausible
physiological, ecological, biochemical, molecular or genetic reasons of genotypic and
phenotypic associations among physiological traits and grain yield traits are discussed in detail in
the following paragraphs.
5.4.1 Genetic and phenotypic association among physiological traits
5.4.1.1 Day to 50 % tasseling
Both genetic and phenotypic association among days to tasseling, silking and anthesis
was positive and significant in all crosses. Such a positive significant association among
flowering traits is an indication for direct selection of promoting early maturity in maize crops.
Similar results of positive correlation were also reported by Abdulkhaleq and Tawfiq (2014),
Bekeleand Rao (2014), Azam et al. (2014) and Halidu et al. (2015).
Genetic association of days to tasseling with plant height was negative in all crosses
while, negatively significant in only two of the four crosses. Similarly phenotypic association
among days to tasseling, plant and ear height was negatively significant in all crosses. The
presence of positive relationships among these traits is an indication that desirable genes
controlling their inheritance could be effectively exploited in further breeding programs for
varietal improvement (Sujiprihati et al., 2003). Presence of genetic correlations indicated that the
144
association among flowering traits is a true association as they exclude the environmental
variances. Our results of negative association between days to tasseling and plant height are
supported by Abdulkhaleq and Tawfiq (2014), who also observed negative association between
days to tasseling and plant height in maize in their study. Bekele and Rao (2014), Azam et al.
(2014) and Halidu et al. (2015) also reported negative association both at genetic and phenotypic
level of days to tasseling with plant height and ear height in their study under striga infested
environment. Contrasting results of positive association between days to tasseling and ear height
were observed by Abdulkhaleq and Tawfiq (2014) and Halidu et al. (2015) under striga free
environment.
Days to tasseling was positively and significantly correlated with days to maturity in all
crosses at both genetic and phenotypic level. Based on observed association one can say that
delay in tasseling is directly correlated with maturity, therefore a similar response could be found
from selection. Genetic correlation indicated that the association is a true one as it excludes the
environmental variances. Positive correlation also indicated that the genes controlling these traits
are highly linked or they might be under pleiotropic effects of some genes (Bocanski et al.,
2009). Our results of positive association between days to tasseling and maturity traits are in line
with that reported by Bekele and Rao (2014). They also observed significant association of
positive nature between days to tasseling and days to maturity.
5.4.1.2 Day to 50 % anthesis
In all crosses both genetic and phenotypic correlations between days to anthesis and
silking were positively significant. Such a positive significant association between flowering
traits is an indication of direct selection of early flowering in maize crop. Similar results of
positive correlation were also reported by Nzuve et al. (2014), Kinfe et al. (2015), Halidu et al.
(2015) and Mehri (2015). Genetic association between days to anthesis and plant height was
negative in all crosses but significant in only two of the four crosses. The presence of positive
relationships among these traits is an indication that desirable genes controlling their inheritance
could be effectively exploited in further breeding programs for varietal improvement (Sujiprihati
et al., 2003). Phenotypic correlation of days to anthesis with plant height was also negatively
significant in all crosses. Both genetic and phenotypic correlations of days to anthesis with ear
height were negative in nature in all crosses. Our results of negative association between days to
145
anthesis, plant height and ear height are also confirmed by Oloyede-Kamiyo (2015), Halidu et al.
(2015) and Mehri (2015) who also reported negative association of days to anthesis with plant
and ear height in maize. Similarly our non-significant correlation of days to anthesis with plant
and ear height are also supported by Oloyede-Kamiyo (2015) who, observed positive association
between these traits. On other hand, contrasting results of positively significant association
between these traits were reported by Kinfe et al. (2015) while, dealing with different breeding
populations of maize crop. Days to anthesis was positively and significantly associated with days
to maturity in all crosses both at genetic and phenotypic level. Based on observed association one
can say that delay in any of these flowering characters is directly correlated with maturity,
therefore a similar response could be found from selection. It also indicates that selection based
on such genetic association would be inherited in the next generation. Or results of positive
association between days to anthesis and maturity traits are in line with that reported by Kinfe et
al. (2015). They also observed significant association of positive nature between days to silking
and days to maturity.
5.4.1.3 Day to 50 % silking
In all crosses both genetic and phenotypic correlations between days to silking and
anthesis were positive and significant in all crosses. Such a positive significant association
between traits is an indication for direct selection of early flowering in maize. Such positive
relationships among these traits is an indication that desirable genes controlling their inheritance
could be effectively exploited in further breeding programs for varietal improvement (Sujiprihati
et al., 2003). Similar results of positive correlation between flowering traits were also reported
by Bekele and Rao (2014), Azam et al. (2014), Halidu et al. (2015), Kinfe et al. (2015) and
Mehri (2015) in their maize populations.
Genetic association between days to silking and plant height was also negative in all
crosses but significant only for two of the four crosses. Similarly genotypic association between
days to silking and ear height was negative in all crosses but significant in one cross only.
Phenotypic correlation of both days to silking and anthesis with plant and ear height was
negatively significant in all crosses. Our results of negative association of days to silking with
plant and ear height are also supported by Bekele and Rao (2014), Halidu et al. (2015) and Mehri
(2015) who also found significant negative association between days to silking and plant height
146
in maize. Negative but non-significant genetic correlation between days to silking and plant
height was also reported by Halidu et al. (2015). Similarly our results of non-significant
correlation are also supported by Abdelmula and Sabiel (2007), Sumathi et al. (2005) and
Haliduet al. (2015) who, observed positive association between these traits. On the other hand,
contrasting results of positively significant association between these traits were reported by
Beyene (2005), Sumathi et al. (2005) and Kinfe et al. (2015) while dealing with different
breeding maize populations.
Days to silking and anthesis were positively and significantly associated with days to
maturity in all crosses both at genetic and phenotypic level. Based on observed association one
can say that delay in any of these flowering characters is directly correlated with maturity,
therefore a similar response of positive or negative magnitude could be found based on selection
criteria. Our results of positive association between days to silking and maturity traits were in
line with that reported by Bekele& Rao (2014) and Kinfe et al. (2015). They also observed
significant association of positive nature between days to silking and days to maturity both at
genetic and phenotypic level.
5.4.1.4 Day to maturity
As maturity is an important character being extensively utilized in maize breeding
programs. Days to maturity was positively and significantly correlated with flowering characters
in all crosses both at genetic and phenotypic level. Such results of positive association between
maturity and flowering characters is an indication that desirable genes controlling maturity
inheritance could be effectively exploited in further breeding programs for varietal improvement
(Sujiprihati et al., 2003). Presence of both genetic and phenotypic correlations indicated that
environmental effect was not too much on these traits. Similarly genetic correlation of days to
maturity with plant and ear height was negative in all crosses but only one cross and two crosses
in this relation reached to a significant level for plant and ear height, respectively. Days to
maturity was negatively and significantly correlated in three of crosses with plant and ear height
at phenotypic level. Such a negative association represented that delay in maturity was inversely
correlated with plant and ear height. These negative correlations have also been reported by
earlier scientists like Bekele and Rao (2014) and Kinfe et al. (2015). Shukla and Mishra (2013)
reported a contrasting relationship of days to maturity with plant and ear height.
147
5.4.1.5 Plant height
Plant and ear height were positively and significantly correlated in three of the four
crosses in which only one cross showed significant level of genetic correlation, while in one
cross the genetic association between plant height and ear height was negatively non-significant.
Phenotypic correlation of plant height was negative and significant with all flowering traits
including days to tasseling, silking and anthesis. Sujiprihati et al. (2003) also reported similar
results of positive relationships between plant and ear height, and suggested its exploitation in
varietal improvement programs. The association of plant and ear height at genetic and
phenotypic level implies the presence of a strong genetic relationship (Zeeshan et al., 2013).
Bekele and Rao (2014), Azam et al. (2014), Oloyede-Kamiyo (2015) and Kinfe et al. (2015)
findings, also support our results of positive and significant correlation between plant and ear
height both at genetic and phenotypic level.
5.4.2 Association among flowering and plant characters
5.4.2.1 Days to 50% tasseling
Days to tasseling was positively and significantly correlated with days to anthesis and
silking both at genetic and phenotypic level in all the crosses, showing that early tasseling will
result into early anthesis as well as silking. These results of high association among these
flowering attributes both at genetic and phenotypic level are in line with that reported by Bekele
and Rao et al. (2014). Genetic and phenotypic association of days to tasseling with plant and ear
height was found negative in all the crosses. Phenotypic correlation of days to tasseling with
plant and ear height was significant while, at genetic level it was significant with plant and ear
height only in two and one crosses, respectively. Such negative relation of tasseling with plant
and ear height might be due to the diversion of nutrient to pollen and grain formation, the
potential sink that might deplete supply to others and thus cause a reduction in both plant and ear
height. Azam et al. (2014), Bekele and Rao et al. (2014) and Kwaga (2014) also obtained similar
results of negative and significant correlations for these traits in their studies. Azam et al. (2014)
also reported negative genetic and phenotypic correlation of non-significant nature of days
148
tasseling with plant and ear height. In contrast positive correlations of days to tasseling with
plant and ear height were also observed by Dugje et al. (2014). Days to tasseling was negatively
correlated with ear weight and grain yield. The nature of correlation among days to tasseling, ear
weight and grain yield was significant only in one cross at genetic level and two crosses at
phenotypic level. Delay in tasseling will reduce the time allocated for grain formation and filling
which results into an antagonistic relation among tasseling, ear weight and grain yield. Such a
negative association between flowering and yield characters is the main cause of reduced yield in
late flowering varieties in maize. Our results of negative relationship among these traits were in
consistence with that reported by Azam et al. (2014) and Kwaga (2014). Dugje et al. (2014)
observed positive and significant correlation between days to tasseling and grain yield.
5.4.2.2 Days to 50% anthesis
Days to anthesis was positively and significantly correlated with days to silking both at
genetic and phenotypic level in all four crosses. This indicates that positive association among
maturity characters is genetically controlled in all the studied crosses. In such case selection for
early male flower initiation will also lead to early female flowering. Similar results of positive
association at genetic and phenotypic level were also observed by some early researchers
including Nzuve et al (2014) and Ohunakin & Adebisi (2015). Genetic association of days to
anthesis with plant and ear height was negatively significant in two crosses for plant height and
one cross for ear height, while phenotypic association was negative and significant in all crosses.
These observations exhibit that early silking would result into the partitioning of photosynthates
for plant growth as well as grain formation and due to such competition reduction in plant and
ear height occur. These negative associations of days to anthesis with plant and ear height are
genetically controlled only in two and one crosses, respectively. Such a negative association of
flowering with plant characters was also reported by Bello et al. (2014). Nzuve et al. (2014)
observed completely opposite results of positive and significant association at genetic and
phenotypic level for days to anthesis, plant and ear height. Bello et al. (2014) also reported
positive correlation between days to anthesis and plant height. Negative and significant
phenotypic correlation was found among days to anthesis and ear weight and grain yield in two
of the four crosses, while genetic correlation was negative but non-significant in all the four
crosses. From the results it is clear that the negative association of days to anthesis with ear
149
weight and grain yield was mostly affected by environment with low genetic control. Similar
results of negative and significant correlation among days to anthesis, cob weight and grain yield
has been reported by Ohunakin and Adebisi (2015) and Richard et al. (2015). Inconsistent
reports of positively significant, genetic and phenotypic association of days to anthesis with ear
weigh and grain yield have been reported by Bello et al. (2014) and Nzuve et al. (2014).
5.4.2.3 Days to 50% silking
Days to silking was negatively and significantly correlated with plant and ear height at
phenotypic level in all the crosses, except one for ear height with non-significant correlation.
Similarly genetic correlation between days to silking and plant height was negatively significant
in two of the four crosses, while days to silking was negatively and significantly correlated at
genetic level only in one cross. In one single cross non-significant association of negative nature
was observed between days to silking and ear height. Such negative associations of days to
silking with plant and ear height may be due to the portioning of dry matter yield and might be
an indication for stunted plant growth due to late maturity. Similar finding of negative
correlations were also reported by earlier scientists like, Bekele and Rao et al. (2014), Hadidi et
al. (2014) and Kumar et al. (2014b). Azam et al. (2014) also reported similar results of negative
correlation both at genetic and phenotypic level but with non-significant nature. Dugje et al.
(2014) findings about association of days to silking, plant and ear height were inconsistent to our
reports. Phenotypically days to silking was negatively and significantly correlated with ear
weight and grain yield only in two crosses. Likewise genetic correlation of days to silking with
ear weight and grain yield was negative but non-significant in all the crosses. It is indicated from
these results that early silking provide more time for the transportation of photosynthates to grain
formation due to which earliness in silking was related to high grain weight and grain yield.
Dugje et al. (2014) also reported negative but significant correlation between days to silking and
ear weight, while their findings regarding correlation of days to silking and grain yield were
quite opposite to our results. Our results of negative non-significant correlation both at genetic
and phenotypic level were in line with that reported by Azam et al. (2014), Bekele and Rao et al.
(2014), Kumar et al. (2014b).
5.4.2.4 Plant height
150
Plant height was positively and significantly correlated at phenotypic level with ear
height in two of the four crosses, while in one cross it couldn’t reach significance level. Negative
phenotypic correlation was also observed in one cross but it was non-significant in nature.
Similarly genetic correlation of positive and significant nature was found only in one cross
between plant and ear height. This shows that correlation between plant and ear height is
environmentally influenced in most of the crosses. Positive association of plant height with ear
height was also reported by Azam et al. (2014), Kumar et al. (2014b) and Rahman et al. (2015).
Negative association between plant and ear height, reported by Bello et al. (2014) was in
agreement to that observed in one of our cross. Positive and significant correlation of plant
height both at genetic and phenotypic level was obvious with ear weight and grain yield in two
and three crosses, respectively. Due to the positive and significant nature of correlation, the
parental inbred line could be used for improvement of these traits. Positive and significant
association means taller plants will give high grain yield and should be utilized in selection for
yield improvement. From such findings of positive correlations among plant height, ear height,
ear weight and grain yield we can conclude that selection for any of these correlated traits, may
lead to selecting high yielding inbred lines. Our results of positive association between plant
height and grain yield are also supported by Malik et al. (2005), Bello et al. (2014), Kumar et al.
(2014b) and Rahman et al. (2015). In contrast, Azam et al. (2014) reported negative genetic and
phenotypic correlation between plant height and grain yield with non-significant nature.
5.4.2.5 Ear height
Strong positive phenotypic correlation was recorded between ear height and ear weight in
two crosses, while opposite results of negatively significant correlation were observed between
the same traits in another single cross. Genetic correlations of ear height with ear weight and
grain yield were non-significant in all the crosses with positive and negative magnitudes equally.
Non-significant nature of association represents that influence of environmental effect was
comparatively high than genetic effects. Positive and negative significant association between
ear height and grain yield was reported in one cross each. Our results of positive correlation were
in close conformity with that of Malik et al. (2005), Bekele and Rao (2014) and Kumar et al.
(2014b), while results of negative correlation are supported by Azam et al. (2014).
151
5.4.3 Genetic and phenotypic association among physiological and yield related traits
5.4.3.1 Days to 50 % tasseling
Genetic correlation of days to tasseling was negative with all grain yield related traits in
two of the four studied crosses except, number of grains per row. Although association of days to
tasseling with fresh ear weight was negative in all crosses at genetic level but in only one cross it
reached to significance level. Similarly phenotypic correlation between these traits was also
negative and significant in two crosses only. Based on the results obtained it can be assumed
that, transportation of metabolic assimilates was high and was for longer time in the later
reproductive stages compared to earlier stages due to which grain formation and grain filling
received maximum in early flowering plant. Shukla and Mishra (2013) reported positive
association of days to tasseling with ear weight in their maize germplasm.
Genetic association of days to tasseling with number of kernel rows, number of grains per
row and number of grains per cob was negative and significant in two crosses. Phenotypic
correlation of days to tasseling with number of kernel rows per ear was negatively significant in
nature in three crosses while, this association of days to tasseling with grains per row and grains
per cob was negative and significant in two crosses only. A positive and non-significant
association was also observed between tasseling and grains per row in a cross. Such results of
negative association indicated that early tasseling will promote number of kernel rows, grain per
row and grains per cob in maize crop. Similar negative association of days to flowering with
number of kernels in maize has been observed by Dhliwayo (2008).
Genetic correlation of days to tasseling with grain yield and harvest index was negatively
significant in one cross only. On the other-hand phenotypic correlation of these traits was also
negative in all crosses but significant in two crosses. The presence of such negative and
significant relationship indicated that early maturing genotypes will produce high yield and this
association will also be inherited in some cross. It means that in production of high yielding
hybrids, days to flowering will be effectively utilized via indirect selection. Shukla and Mishra
(2013) reported positive association of days to tasseling with grain yield. Both genetic and
phenotypic correlations of days to tasseling and harvest index were found negative by Shukla
and Mishra (2013).
152
The genetic correlation between days to tasseling and biological yield was negative and
non-significant in all crosses. Phenotypic correlation between days to tasseling and biological
yield was of negative nature in all crosses but significant in two crosses only. Such a negative
association of days to tasseling with grain, biological yield and its related attributes indicate that
delay in maturity will lead to a reduction in biological yield. Negative association of days to
tasseling with biological yield indicated that in late flowering genotypes, the biological yield will
be low resulting a low grain yield. Association of days to tasseling with hundred grain weight
was negative both at genetic and phenotypic level, while significant at phenotypic level in a
cross. Shukla and Mishra (2013) reported positive association of days to tasseling with biological
yield.
5.4.3.2 Days to 50 % anthesis
The genetic and phenotypic correlations of days to anthesis were negatively significant
with yield and related traits in all crosses except, number of grains per row in a cross where the
phenotypic association was positively non-significant. In first two crosses having common
female parent the association of days to anthesis was negative and non-significant in nature with
all yield related traits both at genetic and phenotypic level. Similarly anthesis was significantly
associated at phenotypic level with ear length in 1st cross. Shukla and Mishra (2013) reported
positive association of days to tasseling with grain yield and ear length.
Days to anthesis was negatively and significantly correlated with ear diameter only in one
cross. Similarly the phenotypic correlation between days to anthesis and ear diameter was also
negative and significant in all crosses. Such results of negative association indicated that
transportation of assimilates occurred more frequently and for longer time in the later
reproductive stages compared to earlier stages due to which earliness in anthesis was related to
high ear diameter. Our findings of negative correlation are contradictory to the findings of
Shukla and Mishra (2013) regarding association of days to anthesis and ear diameter.
The genetic correlation of days to anthesis with number of kernel rows per ear and
number of grains per row was significant with high negative magnitude in two crosses, while
such association of negative and significant nature was also observed between days to anthesis
and number of grains per cob in one cross only. At phenotypic level, the association among days
to anthesis, number of kernel rows, number of grains per row and number of grains per cob was
153
negative and significant in two of the four crosses, only one cross revealed a positive non-
significant correlation between days to anthesis and number of grains per row. Such results of
negative association have also been cited by Dhliwayo (2008).
Association both genetic and phenotypic was negative and non-significant between days
to anthesis and hundred grain weight except, in a cross where the association was significant. As
the relation was negative, therefore early anthesis will provide extended time for grain filling due
to which grain weight will be high. Similar results of negative association between days to
anthesis and hundred grain weight were also reported by Dhliwayo (2008).
5.4.3.3 Days to 50 % silking
Genetic correlation of days to silking was negative and non-significant with yield and all
its related characters in first two crosses. The phenotypic correlation of days to anthesis was
negative and significant with fresh ear weight in two crosses while, the genetic correlation was
negative in all crosses but could not reach to significance level. The positive and non-significant
correlation between days to silking and ear weight was reported by Shukla and Mishra (2013).
Days to mid silking showed negative association of non-significant nature with shelling
percentage both at genotypic and phenotypic levels in two crosses, while association between
these traits was positive and non-significant in other two crosses. These results were in line with
the results obtained by Sujiprihati et al. (2003). They have also reported negative relationship
between these traits but their results were significant which might be due to differences in the
climatic conditions in the testing sites as well as in the genetic make-up of the material studied.
The phenotypic association of days to silking with ear diameter and ear length was
negative and significant in all crosses except one where the association was negative in nature.
Similarly genetic correlation between days to silking and ear diameter was of negative
magnitude in all crosses but only one cross revealed significant nature of that association. These
findings indicated that long ears size is inversely correlated to the silking days. In later
reproductive stages transportation of assimilates is too frequent and for longer time than early
stages due to which earliness in silking resulted in longer ears. Similar results of negative
correlation were also reported by Sujiprihati et al. (2003), who also reported significant
association of negative nature between days to silking and ear length in their study on maize. In
154
contrast positive and significant association has been reported in literature for these two traits by
Beyene (2005) and Shukla and Mishra (2013).
Both genetic and phenotypic correlations of days to silking were negative with cob
characters like kernel rows per ear, number of grains per row and number of grains per cob in all
crosses. The association of days to silking with number of kernel rows, number of grains per row
and number of grains per cob was negative and significant in two of the four crosses at genetic
level. Similarly phenotypic correlation of kernel rows per ear, grains per row and days to silking
were negative and significant in three of the four studied crosses. Phenotypic correlation of days
to silking was positive and non-significant in a cross. Our results of negative association are also
confirmed by Sujiprihati et al. (2003) and Dhliwayo (2008). Sumathi et al. (2005) and Shukla
and Mishra (2013) observed non-significant relationship of negative nature between days to
silking and number of kernel rows ear-1 in their studies on maize.
Genetic association of days to anthesis and hundred grain yield was negative and non-
significant in all crosses. Similarly phenotypic correlation between these traits was also negative
in all crosses but only one cross reached to a significant level. Non-significant positive
association between these traits are in close conformity with the results reported by Sujiprihati et
al. (2003) and Beyene (2005), while Sumathi et al. (2005) reported positive association between
days to silking and 100-grain weight with significant magnitude.
Days to mid silking was negatively and non-significantly correlated with grain yield,
biological yield and harvest index at genetic level in all crosses. Similarly phenotypic association
among these traits was also negative in nature in which only two crosses reached to a significant
level. Similar reports of negative association between days to silking and grain yield have also
been cited by Umakanth et al. ( 2000), Sujiprihati et al. (2003), Sumathi et al. (2005), Sadek et
al. (2006) and Abdelmula and Sabiel (2007).
5.4.3.4 Days to maturity
Maturity is an important character being utilized in breeding programs of maize. Genetic
and phenotypic association of maturity and all yield related characters was negative and non-
significant in nature in first cross. In second cross correlation of days to maturity was positive
and non-significant with fresh ear weight, grains per row, grains per cob, grain yield, biological
155
yield and harvest index both at genetic and phenotypic level. Shukla and Mishra (2013) observed
positive correlation of days to maturity with grain yield attributes.
In third cross genetic correlation of days to maturity was of negative and non-significant
nature with fresh ear weight, ear diameter, ear length, number of kernel rows, hundred grain
weight, grain yield, biological yield and harvest index. Such association of days to maturity was
negatively and significantly correlated with number of grains per row and number of grains per
cob. Phenotypic association of days to maturity was negative and significant with ear diameter,
number of kernel rows, number of grains per row and number of grains per cob in the same
cross. Association of days to maturity with grain yield, biological yield and harvest index was
although negative but non-significant in nature. Both genetic and phenotypic correlations of
maturity with ear diameter, number of kernel rows, grains per row and grains per cob were
negative and significant in forth cross. Similarly phenotypic and genetic association of days to
maturity with grain yield, biological yield and harvest index was although negative but non-
significant in nature. Shukla and Mishra (2013) also confirmed non-significant association of
days to maturity and ear weight, ear length, ear diameter and grain yield at genetic level.
5.4.3.5 Plant height
Both genetic and phenotypic correlations of plant height with fresh ear weight were
positive in all crosses in which two reached to a significant level. This indicated that selection for
plant height would also increase fresh ear weight. In such association, plants of high stature
would probably have more number of leaves that will trap more sun light and lead to an
increased amount of photosynthates in plant. Our results of positive association between plant
height and ear weight were in line with that reported by Shukla and Mishra (2013). Dhliwayo
(2008) reported contrary results between plant height and kernel weight of negative correlation
both at genetic and phenotypic level.
Genetic correlation of plant height and ear diameter was positive in all crosses in which
only one cross revealed significant level. Similarly phenotypic correlation of plant height and ear
diameter was positively significant in two of the four crosses. The genetic association of ear
length and plant height was positively significant in two crosses while, in other two crosses the
relationship was positive and non-significant. Correlation between plant height and ear length
was positive and significant in all crosses at phenotypic level. Shukla and Mishra (2013), Kumar
156
et al. (2014b) and Haddadi et al. (2014) also reported positive association of plant height with
these yield related traits.
Genetic and phenotypic correlation of plant height and number of kernel rows per ear was
positive in nature in all crosses. Positive and significant association both at genetic and
phenotypic level between plant height and kernel rows was found only in one and three cross,
respectively. Such results indicated that an increase in plant height will cause an increase in ear
kernel rows. Similar results of positive correlation between plant height and kernel rows have
been reported by Kumar et al. (2014b) and Abdullah et al. (2015) in their trial during 2011.
Genetic correlations of plant height with number of grains per row and number of grains
per cob were positive and significant in two of the four crosses. Similarly phenotypic correlation
of plant height with number of grains per cob was positively significant in all crosses while, with
number of grains per row the association was positively significant in three crosses. From such
results we can predict that if we are making selection for plant height ultimately we are selecting
genotypes with high grains per row and grains per cob as well. We could say that in high plants
the ability of trapping sunlight will be more compared to the dwarf one, that’s why they perform
better in yield characters also. Our results of positive association were in also in close conformity
with that reported by Kumar et al. (2014b) and Abdullah et al. (2015).
Phenotypic correlation of plant height with hundred grain weight was positive and
significant in three crosses while, the genetic association between these traits was although
positive in all crosses but significance level was achieved by only two of them. Such results
indicated that association of plant height and hundred grain weight is positive which will lead to
the selection of genotypes superior both in plant height and grain weight. Our results of positive
association were in contrast with that reported by Kumar et al. (2014b), Haddadi et al. (2014)
and Abdullah et al. (2015).
Both genetic and phenotypic correlations of plant height with grain yield and biological
yield were positive and significant in two crosses. The association of these characters was
positive in all crosses indicating an increase in plant height will not only increase biological yield
but grain yield will also be enhanced. Haddadi et al. (2014) and Abdulla et al. (2015) reported
both positive and negative association of grain yield and plant height in their trials conducted in
two different seasons. Kumar et al. (2014b) also obtained positively significant association of
plant height with grain yield.
157
Genetic correlation of plant height with harvest index was positive and significant in one
of the four crosses. Similarly the phenotypic correlation was also positive between plant height
and harvest index. Shukla and Mishra (2013) reported negative association between plant height
and harvest index.
5.4.3.6 Ear height
The genetic and phenotypic associations of ear height and fresh ear weight were positive
in two crosses while, other two crosses expressed negative and non-significant association
between these traits. Association of ear height and fresh ear weight was positive and significant
only at phenotypic level in two crosses. This indicated that selection for ear height would also
increase fresh ear weight in case of positive association. In contrary there will be a reduction in
fresh ear weight if selection is practiced for higher ear height. Similar results of positive but non-
significant correlation have been reported by Haddadi et al. (2014).
Genetic correlation of ear height with both ear diameter and ear length was non-
significant but positive and negative in nature, respectively in two crosses each. Similarly
phenotypic correlation of ear height with ear diameter and ear length was positively significant in
two of the four crosses. In two crosses, phenotypic association of these traits was negative in
nature. Presence of such contrasting results of ear height with yield related traits that while
making selection on this relation we must be too curios. Kumar et al. (2014b) and Haddadi et al.
(2014) also reported similar results of positive association of ear height with ear length and ear
diameter.
Genetic and phenotypic correlation of ear height and number of kernel rows per ear was
positive and significant in only one cross. Two of the four crosses revealed negative and non-
significant correlation between ear height and kernel rows. Phenotypic correlation between ear
height and kernel rows per ear was positive and significant in two crosses while, one cross
represented negative and significant association between these traits. Such results indicated that
an increase in ear height will cause an increase in ear kernel rows in two crosses while, a
concomitant decrease in number of kernel rows in other two crosses. Similar results of positive
correlation between ear height and kernel rows have been reported by Shukla and Mishra (2013),
Kumar et al. (2014b) and Haddadi et al. (2014).
158
Genetic correlation of ear height with number of grains per row was positive and
significant in two of the four crosses. Likewise genetic correlation between ear height and
number of grains per cob was positively significant only in one cross. Similarly in other two
crosses such genetic correlation was negative. Phenotypic correlation of ear height with number
of grains per row and number of grains per cob was positively significant in three crosses. From
such results it is concluded that in case of positive correlation if we are making selection for ear
height, ultimately we are selecting for higher grains per row and higher grains per cob as well,
otherwise the results will be opposite in negative association. We could say that in plants with
low or medium ear height the performance will be better in yield characters. Our results of
positive association were in also in close conformity with that reported by Shukla and Mishra
(2013) and Kumar et al. (2014b).
Genetic correlation of ear height with hundred grain weight was positive and significant
in only one cross while, two crosses expressed negative association at genetic level. Phenotypic
correlation of ear height and hundred grain weight was positive and significant in two crosses
while, negative and significant in one cross. Such results indicated that association of ear height
and hundred grain weight is positive which will lead to the selection of genotypes superior in
both with higher ear height and grain weight. Similarly in case of negative association the
hundred grain weight will reduce if selection is made for ear height. Such negative results might
be due to easy lodging of plants with high ear height compared to optimum one. Our results of
positive association were in also in close conformity with that reported by Kumar et al. (2014b)
and Haddadi et al. (2014).
Phenotypic correlation of ear height with grain yield, biological yield and harvest index
was negative and of significant nature in one cross, while positively significant in other single
cross. One cross each represented negative non-significant and positive non-significant
correlation of ear height with these three traits. The genetic correlation association of ear height
was positive and non-significant in two crosses. The positive association of these characters in
some crosses indicated that an increase in ear height will not only increase biological yield but
grain yield as well. Similarly in case of negative association the plant with high ear height would
produce low grain and biological yield. Our results of association among plant height, grain
yield, biological yield and harvest index were in line with that reported by Kumar et al. (2014b)
and Haddadi et al. (2014).

159
160
5.4.4 Genetic and phenotypic association of physiological traits with popping characters
5.4.4.1 Flowering characters
Genetic correlation of days to tasseling, silking and anthesis was positively and non-
significantly correlated with expansion volume. Similarly phenotypic correlation of expansion
volume was also positive with days to tasseling, silking and anthesis in all crosses but one cross
revealed significant level of that association. Our results of positive correlation between
expansion volume and flowering character were confirmed by Dhliwayo (2008).
Genetic correlation of days to tasseling, silking and anthesis was positively and non-
significantly correlated with percent unpopped grains. Similarly phenotypic correlation of
percent unpopped grains was positive with days to silking in three crosses while, days to
tasseling and anthesis were positively and significantly correlated with unpopped grains in two
crosses only.
5.4.4.2 Plant characters
Genetic correlation between plant height and expansion volume was negative and non-
significant in all crosses. Similarly phenotypic correlation of expansion volume and plant height
was also negative in all crosses but only one cross revealed significant level of this relation.
Genetic correlation between ear height and expansion volume was negatively non-significant and
positively non-significant in two crosses each. Phenotypic association was negatively and
positively significant in one cross each. Our results of negative correlation between plant
characters and expansion volume were in line with Dhliwayo (2008).
Genetic correlation between plant height and percent unpopped grains was negative and
non-significant in three of the four crosses. Similarly phenotypic correlation of percent unpopped
grains and plant height was also negative but significant in three crosses. Genetic correlation
between ear height and percent unpopped grains was negatively non-significant all crosses.
Similarly phenotypic association between ear height and percent unpopped grains was also
negative in all crosses but significant level was obvious in only one cross.
5.4.4.3 Days to maturity
161
Both genetic and phenotypic associations of days to maturity and expansion were positive
and non-significant in all crosses, while genetic correlation of days to maturity with percent
unpopped grains was positive in all crosses but only one cross attained significant level of this
correlation. Phenotypic correlation between days to maturity and percent unpopped grains was
positively significant in three crosses. Results indicated that as the days to maturity increase the
number of unpopped grains will be high. Such positive association between these traits is also
supported by Dhliwayo (2008).
5.4.5 Genetic and phenotypic association among yield related traits
5.4.5.1 Fresh ear weight
The genetic correlation of fresh ear weight and percent shelling was positive and
significant in two crosses. Likewise the phenotypic correlation of fresh ear weight and percent
shelling was positively significant in three crosses. Such a positive correlation between these
traits could be effectively utilized in improvement of grain yield. Our results of positive
association between fresh ear weight and percent shelling were reported by Shukla and Mishra
(2013).
The genetic correlation of fresh ear weight with ear diameter was although positive in all
crosses but significant in only one cross. Likewise the phenotypic correlation of fresh ear weight
and ear diameter was positively significant in three crosses. Such a positive correlation between
ear diameter and ear weight is an indication of improved grain yield. Our results of positive
association between ear weight and ear diameter were in close conformity with that reported by
Shukla and Mishra (2013).
Both genetic and phenotypic correlations between fresh ear weight and ear length were
highly positive and significant in all crosses. Such a strongly positive relationship between these
important yield related traits would certainly improve the yield to its maximum level. Such a
positive correlation between fresh ear weight and ear length was also reported by some previous
researchers like Shukla and Mishra (2013).
Both genetic and phenotypic correlation of fresh ear weight with all cob characters like
number of kernel rows per ear, number of grains per row and number of grains per cob was
positive and significant in all crosses. Significantly positive association of these important yield
characters indicated that selection for any one of them will increase grain yield. Such results of
162
positive correlation among these traits have also been reported by some previous researchers like
Dhliwayo (2008).
Both genetic and phenotypic correlation of fresh ear weight with grain yield, biological
yield and harvest index was highly positive and significant in all crosses. Significantly positive
association of these important yield and yield related traits indicated that while making selection
based on fresh ear weight will increase grain yield as well. This also suggested that indirect
selection would be fruitful for increasing grain yield. Positive and significant association of fresh
ear weight with grain yield have also been reported by Henfy (2011) and Oktem (2008).
5.4.5.2 Percent shelling
The association of percent shelling with ear diameter was positively significant only in
one cross, while one cross exhibited negative and non-significant correlation both at genetic and
phenotypic level. Such association of shelling percentage with ear diameter was also reported by
Kumar et al. (2014b).
Association between percent shelling and ear length was positively significant at genetic
level in two crosses, while in other crosses, this association was positive but non-significant in
nature. Phenotypic correlation of percent shelling with ear length was positively significant in
three crosses. Such association of shelling percentage with ear diameter was also reported by
Kumar et al. (2014b).
Genetic association of percent shelling with number of kernel rows, number of grains per
row and number of grains per cob was positively significant in one cross only. In one cross both
genetic and phenotypic correlation between percent shelling and number of kernel rows was
negative and non-significant. Similarly phenotypic correlation of percent shelling with number of
kernel rows, number of grains per row and number of grains per cob was positively significant in
two crosses. Such association of shelling percentage with ear diameter was also reported by
Kumar et al. (2014b).
Correlation of percent shelling with yield and related traits was positive in all crosses.
Genetic correlation of percent shelling with hundred grain weight, grain yield, biological yield
and harvest index was positively significant in two of the four crosses. Phenotypic correlation of
percent shelling with hundred grain weight, grain yield, biological yield and harvest index was
163
found positive and significant in three crosses. Positive and significant association between grain
yield and shelling percentage have been reported by Kumar et al. (2014b).
5.4.5.3 Ear diameter
Genetic association of ear diameter with ear length was positive in all crosses in which
only two crosses achieved a significant level. Similarly phenotypic correlation of ear diameter
with ear length was positively significant in three crosses. Our results of positive were in
consensus with that reported by Kumar et al. (2014b).
Both genetic and phenotypic correlation of ear diameter and number of kernel rows,
number of grains per row and number of grains per cob were positive and significant in all
crosses. This indicated that an increase in ear diameter will also increase kernel rows, grain per
row and grains per cob which are important grain yield characters. Our results of positive
association are in line with that reported by Kumar et al. (2014b).
Association between ear diameter with grain yield, biological yield and harvest index was
positively significant at genetic level in one cross, while in other crosses this association of ear
diameter with these traits was positive but non-significant in nature. Phenotypic correlation of
ear diameter with grain yield, biological yield and harvest index was also positive in all crosses
in which three crosses attained significant level. It is obvious from the results that making
selection for ear diameter will also have a positive impact on grain yield. Similar results were
also obtained by some earlier researchers like Broccoli &Burak (2004) and Kumar et al. (2014b).
5.4.5.4 Ear length
Genetic association of ear length with number of kernel rows was positively significant in
three of the four studied crosses. Similarly phenotypic correlation of ear length with number of
kernel rows was positively significant in all crosses. Positive and significant association between
these grain yield characters indicated that selection practiced for improvement of one character
will not only have direct impact on other but also will be heritable in nature. Our results of
positive were in consensus with that reported by Kumar et al. (2014b). Seyedzavar et al. (2015)
obtained negative correlation between ear length and number of kernel rows per ear.
Genetic correlation of ear length with number of grains per row and number of grains per
cob were positive and significant in three of the four crosses. Similarly phenotypic correlation of
164
ear length with grains per row and grains per cob were positively significant in all crosses. This
indicated that an increase in ear length will also increase grain per row and grains per cob which
are important grain yield characters. Our results of positive association were in consensus with
that reported by Kumar et al. (2014b) and Seyedzavar et al. (2015).
Association between ear length with grain yield biological yield and harvest index was
positively significant at genetic level in one cross only, while in other crosses thus association of
ear length with these traits was positive but non-significant in nature. Phenotypic correlation of
ear length with grain yield, biological yield and harvest index was also positive and significant in
all crosses. Such a positive association of ear length with grain yield is of utmost importance
because selection made on such association will improve grain yield to a significant level.
Similar results of positive association have been reported in literature including Broccoli and
Burak (2004), Kumar et al. (2014b) and Seyedzavar et al. (2015).
5.4.5.5 Kernel rows ear-1
Genetic association of number of kernel rows per ear with number of grains per row and
number of grains per cob was high and positively significant with number of grains per row and
number of grains per cob in all crosses. Similarly phenotypic correlation of kernel rows per ear
with number of grains per row and number of grains per cob was also positively significant in all
crosses. Such a positive and significant association of kernel rows per ear, grain per row and
grains per cob could be effectively utilized in selection process for improved grain yield. Our
results of positive association were in consensus with that reported by Kumar et al. (2014b),
Seyedzavar et al. (2015) and Abdullah et al. (2015). Erazo-barradas (2009) also observed
positively significant association between number of kernel rows and grains per row.
The genetic association of kernel rows per ear with hundred grain weight was positively
significant in two of the four studied crosses. Similarly phenotypic correlation between number
of kernel rows per ear and hundred grain weight was positively significant in all crosses. Our
results of positive correlation were confirmed by Seyedzavar et al. (2015) and Abdullah et al.
(2015). Kumar et al. (2014b) obtained negative and non-significant association between kernel
rows and hundred grain weight both at genetic and phenotypic level.
Genetic association of number of kernel rows per ear with grain yield and harvest index
was positively significant in all crosses, while with biological yield genetic association was
165
positive and significant in three crosses. Similarly phenotypic correlation of kernel rows per ear
with grain yield, biological yield and harvest index was also positively significant in all crosses.
Such a positive and significant association of kernel rows per ear grain yield, biological yield and
harvest index could be effectively utilized in selection process for improved grain yield.
Mohammadi et al. (2003), Jamshidian et al. (2013),Kumar et al. (2014b), Seyedzavar et al.
(2015) and Abdullah et al. (2015) also reported results of positive and significant association
between grain yield and number of kernel rows per ear.
5.4.5.6 Grains row-1
Both the genetic and phenotypic associations of number of grains per row was positively
significant with grains per cob in all crosses. Similarly genetic correlation of grains per row was
positive and significant with hundred grain weight in three crosses while, phenotypic correlation
was positive and significant in four crosses. Similar results have also been cited in literature by
some previous researchers like Seyedzavar et al. (2015) and Abdullah et al. (2015).
Number of grains per row was positively correlated with grain yield in all crosses, in
which only two crosses exhibited a significant at genetic level. Phenotypic correlation of grains
per row was positively and significantly correlated with all crosses. Such a positive association
indicated that grains per row would significantly affect grain yield in a desired direction. Mohan
et al. (2002), Kumar et al. (2014b), Seyedzavar et al. (2015) and Abdullah et al. (2015) also
reported similar results between these traits.
Both the genetic and phenotypic correlations of number of grains per row were positively
and significantly correlated with biological yield in all crosses. These results indicated that as a
part of plant, an increase in grains per row will also increase biological yield. According to
obtained results one can predict an inherited positive selection for both number of grains per row
and biological yield. Our results of positive association between biological yield and number of
grains per row were also in consistence with that reported by Shukla and Mishra (2013).
The association at genetic level between number of grains per row and harvest index was
positive in all crosses, in which only two crosses exhibited significance at genetic level.
Similarly phenotypic correlation of grains per row was positively and significantly correlated
with harvest index in all crosses. Such a positive association indicated that grains per row would
166
significantly affect grain yield as harvest index has grain yield in its numerator. Similar results of
positive association between these characters have been reported by Shukla and Mishra (2013).
5.4.5.7 Grains ear-1
The genetic correlation of grains per cob with hundred grain weight was positively
significant in three crosses. Likewise phenotypic correlation of number of grains per cob with
hundred grain weight was also positive and significant in all crosses. It is obvious from the
results obtained that indirect selection will be practiced for improving grain yield through
hundred grain weight. Similar results of grains per cob and hundred grain weight were also
reported by Shukla and Mishra (2013). In contrast Dhliwayo (2008) reported negative correlation
between number of kernels and kernel weight.
Phenotypic correlation of number of grains per cob with grain yield was positive and
significant in two of the four studied crosses. The genetic correlation of grains per cob was
positive and significant with grain yield in two crosses. Such a positive association indicated that
grains per cob would significantly affect grain yield. Ghassemi-Golezan and Tajbakhsh (2012)
also reported similar results between these traits.
Both the genetic and phenotypic correlations of number of grains per cob were positively
correlated with biological yield in all crosses. The genetic and phenotypic associations of grains
per cob with biological yield were found significant in two and four crosses, respectively. These
results indicated that as a part of plant, an increase in grains per cob ultimately cause an increase
in biological yield. Our results of positive association between grains per cob and biological
yield were also in consistence with that reported by Ghassemi-Golezan and Tajbakhsh (2012).
The genetic association between number of grains per cob and harvest index was
positively significant in two crosses. Similarly phenotypic correlation of grains per cob was
positively and significantly correlated with harvest index in all crosses. Such a positive
association indicated that grains per cob would significantly affect grain yield as mathematical
formula of harvest index has grain yield in its numerator. Similar results of positive association
between these characters have been reported by Ghassemi-Golezan and Tajbakhsh (2012).
5.4.5.8 Hundred grain weight
167
Genetic association of hundred grain weight and grain yield was positive and significant
in three crosses while, one cross exhibited positive non-significant correlation. The phenotypic
correlation of hundred grain weight and grain yield was also positive and significant in all
crosses. Such a positive association is of prime importance for improving grain yield. Our results
of positive association between grain yield and hundred grain weight are supported by
Venugopalet al. (2003), Khayatnezhadet al. (2010), Ghassemi-Golezan and Tajbakhsh (2012),
Kumar et al. (2014b) and Seyedzavar et al. (2015).
The genetic correlation of hundred grain weight with biological yield was positive in all
crosses while, significant level was achieved by three crosses. The phenotypic correlation of
hundred grain weight and biological yield was positive and significant in all crosses. The results
obtained indicated that selection for hundred grain weight will also increase biological yield.
Similar results of positive association between hundred grain weight and biological yield have
been reported by Shukla and Mishra (2013). In contrast to our results Ghassemi-Golezan and
Tajbakhsh (2012) obtained negative and non-significant correlation between grain weight and
biological yield.
Both genetic and phenotypic correlation between hundred grain weight and harvest index
were positive in nature. Genetic association between hundred grain weight and harvest index was
positive and significant in three crosses while, one cross exhibited positive non-significant
correlation. The phenotypic correlation of hundred grain weight and harvest index was also
positive and significant in all crosses. Positive association of hundred grain weight and harvest
index represented that increase in grain weight will increase grain yield, which is a numerator
component in the mathematical formula of harvest index. Our results of positive association
between hundred grain weight and harvest index have been in conformity with Ghassemi-
Golezan and Tajbakhsh (2012).
5.4.5.9 Grain yield
Both genetic and phenotypic correlations of grain yield were positive and significant in
all crosses. An increase in biological yield indicates a robust and vegetatively progressive crop.
In such case the photosynthetic activities will be at maximum level. Results of positive
association between grain yield and biological yield has been reported in literature including
Ghassemi-Golezan and Tajbakhsh (2012), Seyedzavar et al. (2015).
168
Genetic association of grain yield with harvest index was positive and significant in all
crosses. Similarly the phenotypic correlation of grain yield and harvest index was also positive
and significant in four studied crosses. Positive association of grain yield and harvest index
represented that increase in grain yield will increase harvest index as well, because harvest index
has grain yield as numerator component in its calculation. Our results of positive association
between grain yield and harvest index have been similar to those reported by Mousavi et al.
(2013). In contrast to our results, Ghassemi-Golezan and Tajbakhsh (2012) reported negative and
non-significant association between grain yield and harvest index.
5.4.5.10 Biological yield
Both genetic and phenotypic correlations between biological yield and harvest index
were positive and significant in all crosses. Positive association of biological yield and harvest
index represented that increase in biological yield will increase harvest index also. Our results of
positive association between hundred grain weight and harvest index have been reported by
Mousavi et al. (2013). Contrarily negative and significant association between biological yield
and harvest index were reported by Ghassemi-Golezan and Tajbakhsh (2012).
5.4.5.11 Harvest index
Association of harvest index and maturity characters was negative in nature. Ghassemi-
Golezan and Tajbakhsh (2012) also reported similar results of negative association between har
vest index and days to grain filling. Genetic correlation of harvest index was positively
correlated with all grain yield related traits. Similarly phenotypic correlation was also positively
correlated with grain yield characters in all crosses. As harvest index is calculated from grain
yield and biological yield, therefore, in increase in harvest index indicate increase in grain yield.
Similar results of positive association have been reported by Mousavi et al. (2013) and
Ghassemi-Golezan &Tajbakhsh (2012).
5.4.6 Genetic and phenotypic associations among yield and popping characters
Both genetic and phenotypic correlations of fresh ear weight and expansion volume were
negatively correlated with expansion volume in three crosses, the forth cross exhibited negative
169
and non-significant association between these traits. Such negative association represented that
an increase in fresh ear weight will reduce expansion volume or popping volume. Similar results
of negative association were also obtained by Dhliwayo (2008). Genetic correlation of fresh ear
weight with percent unpopped grains was positive and non-significant in two crosses, while in
other two crosses that association was negatively non-significant. Likewise, phenotypic
correlation of fresh ear weight and unpopped grains was negative and significant in only one
cross. In two other crosses phenotypic association of unpopped grains and fresh ear weight was
positive and non-significant. The results indicated that when we have maximum fresh ear weight
the unpopped grains will be reduced. Dhliwayo (2008) and also revealed same type of
relationship between ear weight and expansion volume.
Genetic correlation of shelling percentage with expansion volume was negative in three
of the four crosses in which only one cross attained a significant level. Phenotypic correlation of
shelling percentage and expansion volume was also negative and non-significant in two crosses.
Phenotypic correlation of shelling percentage and unpopped grains was positive in all crosses,
only two crosses revealed a significant level. Genetic correlation of shelling percentage and
harvest index was non-significant in all crosses.
Ear diameter was negatively and significantly correlated with expansion volume in one
cross at significant level. Similarly phenotypic correlation between ear diameter and expansion
volume was negative and significantly correlated in three crosses. Our results are corroborated
with that reported by Broccoli and Burak (2004). Ear diameter was negatively and significantly
correlated with unpopped grains at genetic level. Similarly phenotypic correlation of ear
diameter was also negatively and significantly correlated with unpopped grains in two crosses
only. In one cross both genetic and phenotypic associations between ear diameter and unpopped
grains were positively correlated. Our results of positive association ear diameter and expansion
volume are also confirmed by Broccoli and Burak (2004).
Both genetic and phenotypic correlations of ear length were negative and significant with
expansion volume in three of the four studied crosses. This indicated that an increase in ear
length will decrease the expansion volume. Our results of negative associations were also
reported by Broccoli and Burak (2004). Genetic correlation of ear length was negatively and
positively, non-significant with unpopped grains in two crosses each. Similarly phenotypic
correlation of ear length was also negatively and significantly correlated with unpopped grains in
170
one cross only. Similar results of association between ear length and unpopped grains have been
reported by Broccoli and Burak (2004).
Genetic correlation of expansion volume was negatively significant with number of
kernel rows and number of grains per cob while, one cross exhibited negatively significant
association between expansion volume and number of grains per row. Phenotypic correlation of
expansion volume with number of kernel rows, number of grains per row and number of grains
per cob was negatively significant in two of the four crosses. Similar results of negative
association indicated that expansion volume will decrease kernel rows, number of grains per row
and grains per cob. Our results of negative correlation between expansion volume and grains per
row are also corroborated by Jele et al. (2014).
The genetic association of hundred grain weight and expansion volume was negative in
all crosses but was significant in only two crosses. Phenotypic correlation of hundred grain
weight and expansion volume was negatively significant in three crosses. From these results it
can be concluded that selection practiced for hundred grain weight will reduce expansion
volume. Similar results have been cited in literature by Dhliwayo (2008).
Grain yield and biological yield were found negatively correlated with expansion volume
both at genetic and phenotypic level. Genetic correlation of expansion volume with grain yield
was found negatively significant in two crosses, and in three crosses with biological yield.
Phenotypic correlation of grain yield and biological yield with expansion volume was found
negatively significant in four and three crosses, respectively. It is obvious from the results that
selection both for grain and biological yield will affect expansion volume negatively. Our results
of negative association have been reported by Broccoli and Burak (2004), Arnhold et al. (2006)
and Mora & Scapim (2007). Both genetic and phenotypic correlations of percent unpopped
grains with grain yield and biological yield were positive and non-significant in two crosses.
Phenotypic correlation of percent unpopped grains with grain and biological yield was negatively
significant only in one cross. It can be guessed that both traits are controlled by distinct genes.
Genetic correlation of harvest index with expansion volume was negative and significant
in two of the four studied crosses while, phenotypic correlation between these traits was
negatively significant in all crosses. Harvest index and percent unpopped grains were non-
significantly correlated in all crosses. Phenotypic correlation of unpopped grains and harvest
index was negative and significant only in one cross.
171
5.4.7 Genetic and phenotypic associations among popping characters
Genetic correlation of expansion volume with percent unpopped grains was positive in
two crosses while, negative in other two crosses. Similarly phenotypic correlation of expansion
volume and unpopped grains was also positive and negative in two crosses each. Positively
significant phenotypic correlation was obtained in one cross only while negative significant
association was also observed in one cross. These results indicated that expansion volume and
percent unpopped grains are negatively correlated in which one can obtain less number of
unpopped grain for high expansion volume. Similar results of negative and significant
association between expansion volume and number of unpopped grains have also been reported
by Jele et al. (2014).
172
SUMMARY
This study was conducted at Cereal Crops Research Institute Pirsabak, Nowshera and
The Agriculture University Peshawar, Pakistan. The plant material used in this experiment
comprised a set of four inbred lines of popcorn. Two of the four inbred line were of Bangladeshi
origin and the other two were developed in Cereal Crops Research Institute, Pirsabak. Six
generations including two Parents, F1, F2, BC1 and BC2 were developed in two growing seasons
for each cross by using manual pollination procedure of crossing and selfing. Quantification of
genetic attributes including gene action, heterotic behavior, heritability estimates, phenotypic and
genotypic associations among quantitative parameters are important statistical tools in maize
breeding programs. Parental germplasm used in this study was synthesized from two diverse
popcorn populations. Total genetic materials used in this study included four parents, F1s, F2s,
BC1s and BC2s. These generations were evaluated at two locations i.e. Cereal Crops Research
Institute (CCRI), Pirsabak, Nowshehra and The University of Agriculture, Peshawar. At both
locations the experimental material was replicated thrice in randomized complete block design.
The results indicated that in all crosses dominant gene action was predominantly important in the
inheritance of both days to anthesis and silking. In the studied crosses, additive gene effect was
found negative but significant except, in cross PS-2 × BD-2 for anthesis. The digenic non-allelic
epistasis of additive × dominance and dominance × dominance was considered the major
contributor in the inheritance of days to anthesis in cross PS-1 × BD-2 and PS-2 × BD-2.
Duplicate type of epistasis was observed in cross PS-1 x BD-1 for days to anthesis and silking,
while complementary epistasis was observed in cross PS-1 × BD-2. Similarly for plant and ear
height, dominant gene action was positive and significant in all crosses except, PS-2 × BD-1for
plant height. Duplicate type of epistasis was observed for ear height in two crosses (PS-1 x BD-1
and PS-1 × BD-2), while in cross PS-2 × BD-1 and PS-2 × BD-2 complementary epistasis was
found. It is concluded that crosses with high additive gene effects, could be improved effectively
for studied characters in subsequent generations. For grain yield and related traits dominant gene
action was positively significant in all crosses, indicating that the parental populations could be
effectively utilized in hybrid development programs. Both popping expansion and percent of
unpopped grains was positively and significantly controlled by dominant genes in two of the four
173
crosses, while in the other two crosses dominant gene actions were negative in nature. Broad
sense heritability estimates for grain yield and related attributes were high in all crosses, while
narrow sense heritability estimates for these traits varied from moderate to high levels, which
indicate greater contribution of the genetic portion in the inheritance. Heterotic levels, both mid
parent and better parent were positive and high in magnitude for grain yield and all related
attributes. Both genetic and phenotypic association among yield related attributes were positive
in nature. Based on obtained results it would be wise to use those parents in hybrid crosses which
exhibited both additive and dominant gene actions coupled with high narrow sense heritability
estimates and having strong relationship along with high heterotic levels for most of the grain
yield related traits. Although all the F1 hybrids were superior but PS-2 × BD-2 was outstanding
for grain yield and can therefore be recommended for commercial cultivation.
174
CONCLUSION
Keeping in view our objectives, the following conclusions were drawn from this study. Both
additive and dominance gene effects were observed for 100-grain weight and grain yield, grains
per row, ear diameter. Maturity characters were under control of dominance gene actions and
epistasis of non-allelic digenic interactions. Yield contributing traits were seen under the control
of dominance gene actions. Additive, dominance and epistasis of digenic non-allelic interactions
were equally responsible in controlling the inheritance of plant and ear characters.
High estimates of broad sense heritability were observed for all the traits studied except
harvest index which showed moderate levels of heritability in broad sense. Narrow sense
heritability calculated for most of the traits was in moderate range.
Ear weight, number of grains ear-1, grain yield, grain yield efficiency and biological yield
exhibited high levels of both mid-parent and better parent heterosis. Moderate levels of mid-
parent and better heterosis were observed in leaf area, leaf area index, plant height, ear height,
ear length, number of grains row-1 and 100-grain weight. Low levels of both mid-parent and
better parent heterosis were manifested for days to 50% pollen shedding and silk, days to
maturity, ear diameter, kernel rows ear-1, shelling percentage and harvest index in most crosses.
Among physiological traits, association of days to silking and maturity was negative in
magnitude. Mid silking was positively correlated with days to maturity and similar association
was observed between plant height and ear height. Grain yield and related traits were found
negatively correlated with flowering traits. Similarly grain yield related traits were positively and
significantly associated with each other.
175
LITERATURE CITED
Aastiveit, A.H. and K. Aastiveit. 1990. Theory and application of open pollination and polycross
in forage grass. Theor. Appl. Genet. 79:618–624.
Abadassi, J. 2015. Maize agronomic traits needed in tropical zone. Int. J. Sci. Env. Tech. 4(2):
371–392.
Abadi, J.M., S.K. Khorasani, B.S. Sar, S. Movafeg and M. Golbashy. 2011. Estimation of
combining ability and gene effects in forage maize (Zea mays L.) using line × tester
crosses. J. Plant Phys. Breed. 1(1): 57-67.
Abdel-Moneam, M.A., M.S. Sultan, S.M.G. Salama and A.M. El Oraby. 2014. Evaluation of
combining ability and heterosis for yield and its component traits of five maize
inbredlines under normal and stress nitrogen fertilization. Asian J. Crop Sci. 6(2): 142-
149.
Abdelmula, A.A. and S.A.I. Sabie. 2007. Genotypic and differential responses of growth and
yield of some maize (Zea mays L.) genotypes to drought stress. Conference on
international agriculture research for development, October 9-11, 2007. University of
Kassel-Witzenhausen and University of Gottingen.
Abdulkhaleq, D.A. and S.I. Tawfiq. 2014. Correlation and path coefficient analysis of yield and
agronomic characters among some maize genotypes and their F1 hybrids in a diallel
cross. J. Zankoy Sulaimani. Special issue 16: 1-8.
Abdullah, A.R., J.O. Ahmed and S.Q. Mahmood. 2015. Comparisons of six hybrids corn (Zea
mays L.) in terms of yield and its components in Sulaimania. American-Eurasian J.
Agric. Env. Sci. 15(5): 848-852.
Abuali, I.A., A.A. Abdelmulla, M.M. Khalafalla, A.E. Idris and A.M. Osman. 2012. Combining
ability and heterosis for yield and yield components in maize (Zea mays L.). Aust. J.
Basic and Appl. Sci. 6, 36-41.
Acquaah, G. 2007. Principles of plant genetics and breeding. Blackwell Publishing 350 Main
Street, Malden, MA 02148-5020, USA. Pp. 485.
176
Aghaei, Sh., S. Aharizad, M.R. Shiri and S.A. Mohammadi. 2012. Average heterosis of maize
hybrids under terminal water stress at Moghan region. Annals Bio. Res. 3(12): 5462-
5465.
Aguiar, C.G., I. Schuster, A.T. Amaral Jr., C.A. Scapim and E.S.N. Vieira. 2008. Heterotic
groups in tropical maize germplasm by test crosses and simple sequence repeat markers.
Genet. Mol. Res. 7(4): 1233-1244.
Ahamed, H.M., S. Malook, I. Ali, M.U. Ali, Z. Aslam, B. Farid, A. Mumtaz and M. Ahsan.
2015. Assessment of gene action to develop drought tolerance maize inbred lines. Am-
Euras. J. Agric. & Environ. Sci., 15 (3): 454-461.
Ahmet, O.Z. and H. Kapar. 2011. Determination of grain yield, some yield and quality traits of
promising hybrid popcorn genotypes. Turkish J. Field Crops 16(2): 233-238.
Akbar, M., M. Saleem, F.M. Azhar, M.Y. Ashraf and R. Ahmad. 2008. Combining ability
analysis in maize under normal and high temperature conditions. J. Agri. Res. 46(1): 27-
38.
Akhshi, N., K. Cheghamirza, F. Nazarian-Firouzabadi and H. Ahmadi. 2014. Generation mean
analysis for yield components in common bean. Iranian J. Plant Physio. 4(3): 1079-1085.
Alake, C.O., D.K. Ojo, O.A. Oduwaye, and M.A. Adekoya. 2008. Genetic variability and
correlation studies in yield and yield related characters of tropical maize (Zea mays L.).
ASSET–Series A: Agri. Env. 8(1/2): 14-27.
Alam, A.K.M.M., S. Ahmed, M. Begum and M.K. Sultan.2008. Heterosis and combining ability
for grain yield and its contributing characters in maize. Bangladesh J. Agri. Res. 33(3):
375-379.
Alamerew, S. and M.Z.K. Warsi. 2015. Hetrosis and combining ability of sub-tropical maize
inbred lines. African Crop Sci. J. 23 (2): 123–133.
Al-Falahy, M.A.H. 2015. Estimation combining ability, heterosis and some genetic parameters
across four environments using full diallel cross method. Int. J. Pure Appl. Sci. Technol.,
26(1): 34-44.
Alghamdi, S.S. 2009. Heterosis and combining ability in a diallel cross of eight faba bean (Vicia
faba L.) genotypes. Asian J. Crop Sci., 1: 66–76.
177
Ali, A. H. Rahman, L. Shah, K.A. Shah, S. Rehman. 2014. Heterosis for grain yield and its
attributing components in maize variety Azam using line × tester analysis method. Acad.
J. Agri. Res. 2(11): 225-230.
Ali, F. and J. Yan. 2012. Disease resistance in maize and the role of molecular breeding in
defending against global threat. J. Integrative Plant Bio. 54(3): 134-151.
Ali, F., Durrishahwar, M. Muneer, W. Hassan, H. Rahman, M. Noor, T. Shah, I. Ullah, M. Iqbal,
K. Afridi and H. Ullah. 2012. Heritability estimates for maturity and morphological traits
based on testcross progeny performance of maize. J. Agri. Bio. Sci. 7(5): 317-324.
Ali, F., K. R. Zahid, F. Shah, R. Gul, Q. Pan, Hira,G. Mustafa, Y. Jamal, H. Khan, H. Ullah. 2013.
Heterosis and early generation testing is a pivotal method for production of hybrid. Aus.
J. Crop Sci. 7(11): 1728-1736.
Ali, F., M. Muneer, H. Rahman, M. Noor, Durrishahwar, S. Shaukat and J. Yan. 2011.
Heritability estimates for yield and related traits based on testcross progeny performance
of resistant maize inbred lines. J. Food Agri. Env. 9(3&4): 438-443.
Ali, F., M. Muneer, J. Xu, Durrishahwar, H. Rahman, Y. Lu, W. Hassan, H. Ullah, M. Noor, I.
Ullah and J. Yan. 2012. Accumulation of desirable alleles for southern leaf blight (SLB)
in maize (Zea mays L.) underthe epiphytotic of Helminthosporium maydis. Aus. J. Crop
Sci. 6(8): 1283-1289.
Ali, G., A.C. Rather, A. Ishfaq, S.A. Dar, S.A. Wani and M.N. Khan. 2007. Gene action for grain
yield and its attributes in maize (Zea mays L.). Int. J. Agric. Sci., 3(2): 278.
Allard, R.W. 1960. Principles of plant breeding. John Willy and Sons Inc., USA.
Al-Naggar, A.M.M., R. Shabana, M.M.M. Atta, T.H. Al-Khalil. 2015. Response of genetic
parameters of low-N tolerance adaptive traits to decreasing soil-N rate in maize (Zea
mays L.). App. Sci. Report. 9(2): 110-122.
Amanullah, S. Jehan, M. Mansoor and M.A. Khan. 2011. Heterosis studies in diallel crosses of
maize. Sarhad J. Agric. 27(2): 207-211.
Amaral, Jr. A.T., S.P. Freitas Jr, R.M. Rangel, G.F. Pena, R.M. Ribeiro, R.C. Morais and A.R.
Schuelter. 2010. Improvement of popcorn population using selection indices from fourth
cycle of recurrent selection program carried out in two different environments. Genet.
Mol. Res. 9(1): 340-347.
178
Amer, E. A. 2004. Combining ability of new white inbred lines of maize with three testers tested
over two locations. Annals Agri. Sci. Moshtohor, 42(2): 461-474.
Amini, Z., M. Khodambashi, S. Houshmand. 2013. Correlation and path coefficient analysis of
seed yield related traits in maize. Int. J. Agri. Crop Sci. 5(19): 2217-2220.
Aminu, D., Y.M. Garba and A.S. Muhammad. 2014. Combining ability and heterosis for
phenologic and agronomic traits in maize (Zea mays L.) under drought conditions in the
Northern Guinea Savanna of Borno State, Nigeria. Afri. J. Biot. 13(24): 2400-2406.
Andrade, R.A., C.D.C Cruz, C.A. Scapim, L. Silverio, R.J.B. Pinto and A. Tonet. 2002. Análise
dialélica da capacidade combinatória de variedades de milho pipoca. Acta Sci. Agron. 24:
1197-1204.
Anshuman, V., N.N. Dixit, Dipika, S.K. Sharma and S. Marker. 2013. Studies on heritability and
genetic advance estimates in maize genotypes. Biosci. Discov. 4: 165-168.
Appunu, C., E. Satyanarayana and N.T. Rao. 2007. Heterosis for grain yield and its components
in maize (Zea mays L.). J. Res., Angrau 70(3): 257-263.
Arnhold, E., F. Mora and A. Deitos. 2006. Genetic correlations in S4 families of popcorn (Zea
mays L.). Cien. Inv. Agr. 33(2): 105-110.
Aslam, M., M. Ikram, M.A. Maqbool and W. Akbar. 2015. Assessment of genetic components
for different traits in maize (Zea mays L.). J. Agric. Res. 53(1): 1-10.
Atanaw, A., M. C. Wali, P. M. Salimath and R. C. Jagadeesha. 2006. Combining ability,
heterosis and per se performance in maize maturity components. Karnataka J. Agric. Sci.,
19(2): 268-271.
Atta, M.M.M. and M.I. Marsi. 2015. Genotypic variation among maize S1 families of Giza-2
population under water stress conditions. American-Eurasian J. Agric. Env. Sci. 15(5):
878-885.
Azam, M.G., U. Sarker, Maniruzzam and B.R. Banik. 2014. Genetic variability of yield and its
contributing characters on CIMMYT maize inbreds under drought stress. Bangladesh J.
Agri. Res. 39(3): 419-426.
Azizi, F., A.M. Rezai and G. Saeidi. 2006. Generation mean analysis to estimate genetic
parameters for different traits in two crosses of corn inbred lines at three planting
densities. J. Agric. Sci. Technol. 8: 153-169.
179
Bekele, A. and T.N. Rao. 2014. Estimates of heritability, genetic advance and correlation study
for yield and it’s attributes in maize (Zea mays L.). J. Plant Sci. 2(1): 1-4.
Bello, O. B., S.A. Ige, M.A. Azeez, M.S. Afolabi, S.Y. Abdulmaliq and J. Mahamood. 2012.
Heritability and genetic advance for grain yield and its component characters in maize
(Zea mays L.). Int. J. Plant Res. 2(5): 138-145.
Bello, O. Bashir., Olawuyi., O. Joseph., A. Malik., S. Yussuf., S. Ayodele., M. Jimoh., Azeez.,
M. Adewuyi., Afolabi and M. Segun. 2014. Grain yield potential and adaptation of early
and intermediate maize genotypes in the Nigeria guinea savanna. Sarhad J. Agric. 30(1):
53-66.
Bello, O.B. 2015. Gene action, heterosis, correlation and regression estimates in developing
hybrid cultivars in maize. “Management of land use systems for enhanced food security:
conflicts, controversies and resolutions”. Tropentag, September 16-18, 2015, Berlin,
Germany.
Berilli, A.P.C.G., M.G. Pereira, R. dos S. Trindade, F.R. da Costa and K.S. da Cunha. 2013.
Response to the selection in the 11th cycle of reciprocal recurrent selection among full-sib
families of maize. Acta Sci. Agron. Marin. 35(4): 435-441.
Beyene, Y.A.2005. Phenotypic diversity of morphological and agronomical traits in traditional
Ethiopian highland maize accessions. South African J. Plant & Soil. 22:100-105.
Birchler, J., D. Auger and N. Riddle. 2003. In search of the molecular basis of heterosis. Plant
Cell 15: 2236-2239.
Bocanski, J., Z. Sreckov and A. Nastic. 2009. Genetic and phenotypic relationship between grain
yield and components of grain yield of maize (Zea mays L.). Genetika 41(2): 145 -154.
Borras, F.S., K. Seetharaman, N. Yao, J.L. Robutti, N.M. Percibaldi and G.H. Eyherabide. 2006.
Relationship between popcorn composition and expansion volume and discrimination of
corn types by using zein properties. Cereal Chem. 83: 86-92.
Broccoli, A.M. and R. Burak. 2004. Effect of genotype x environment interactions in popcorn
maize yield and grain quality. Spanish J. Agri. Res. 2(1): 85-91.
Bujak, H., S. Jedynski, J. Karczmarek, C. Karwowska, Z. Kurczych and A. Damczyk. 2006.
Evaluation of breeding value of inbred lines of maize on the basis of multi trait analysis.
Biuletyn Instytutu Hodowli-i-Aklimatyzacji Roslin, (240/241): 211-216.
180
Cabrel, P.D.S., A.T.do Amaral Jr., A. Pio Viana, H.D. Vieira, I.L. de J. Freitas, C. Vittorazzi, M.
Vivas. 2015. Combining ability between tropical and temperate popcorn lines for seed
quality and agronomic traits. Aust. J. Crop Sci. 9(4):256-263.
Carangal, V.R., S.M. Ali, A.F. Koble, E.H. Rinke and J.C. Sentz. 1971. Comparison of S1 with
testcross evaluation for recurrent selection in maize. Crop Sci. 11:658-661.
Cavalli, L.L. 1952. An analysis of linkage in quantitative inheritance (Eds.): E.C.R. Reeveand
C.H. Waddington. pp. 135-144, HMSO, London.
Chandal, U and B.S. Mankotia. 2014. Combining ability in local and CIMMYT inbred lines of
maize (Zea mays L.) for grain yield and yield components using line × tester analysis.
SABRAO J. Breed. Gen. 46(2): 256-264.
Chen, Z. H., M. L. Logrono, A. L. Carpena and J. Lales. 1996. Genetics of characters associated
with drought resistance in maize (Zea mays L.). Philipp. J. Crop sci. 21(3):71-75.
Chohan, M.S., M. Saleem, M. Ahsan and M. Asghar. 2012. Genetic analysis of water stress
tolerance and various morpho-physiological traits in maize (Zea mays L.) using graphical
approach. Pak. J. Nutr. 11, 489-500.
Cochran, W.G. and G.M. Cox. 1960. Experimental designs. John Wiley and Sons, Inc., New
York.
Coors, J.G. and S. Pandey. 1999. Genetics and exploitation of heterosis in crops. Crop Sci. Soc.
Amer. Madison, WI.
Darrah, L.L. and A.R. Hallauer. 1972. Genetic effects estimated from generation means in four
diallel sets of maize inbreds. Crop Sci., 12: 615-621.
Dawod, K.M., M.A.H. Ai-Falahy and A.A. Mohammad, 2012. Genetic variances and gene
effects controlling grain yield and some of its components in maize. J. Agric. Sci. Tech.
2: 814-823.
Debnath, S. C., K. K. Sarker, and D. Singh. 1989. Combining ability estimates in maize. J. Agri.
Res. 9: 37-42.
Debnath, S.C. and M.F. Khan. 1991. Genotypic variations, co variations and path coefficient
analysis in maize. Pak. J. Sci. Ind. Res. 34(10): 391-0394.
Dhasarathan, M., C. Babu, K. Iyanar and K. Velayudham. 2012. Studies on genetic potential of
baby corn (Zea mays L.) hybrids for yield and quality traits. Ele. J. Plant Breed. 3(3):
853-860.
181
Dhliwayo, T. 2008. Genetic mapping and analysis of traits related to improvement of popcorn.
PhD thesis, Deptt. Plant Breeding, Iowa State University.
Dickert, T.E. and W.F. Tracy. 2002. Heterosis for flowering time and agronomic traits among
early open pollinated sweet corn cultivars. J. Ameri. Soci. Horti. Sci. 127(5): 793-797.
Dorri, P., S.K. Khorasani, M. Shahrokhi. 2014. Generation mean analysis: a case study of
variance components in KSC 500 generations of maize (Zea mays L.). Int. Res. J. Appl.
Basic Sci. 8(2): 194-200.
Dugje, I.Y., P.E. Odo, I.A. Teli, A.Y. Kamara, E.A. Asiedu. 2014. Evaluation of multi-stress
tolerant maize varieties for sustainable intensification in northern Guinea Savanna of
north eastern Nigeria. Maydica 59: 137-143.
Duvick, D.N. 1999. Heterosis feeding people and protecting natural resources. In the genetics
and exploitation of heterosis in crops (Eds: Jog. Coors and S. Pandey) PP.19-30. Crop
Sci. Soc. Amer. Madison, WI.
Duvick, D.N. 2001. Biotechnology in the 1930s: the development of hybrid maize. Nat. Rev.
Genet. 2: 69-74.
Dvojkovic, K., G. Drezner, D. Novoselovic, A. Lalic, J. Kovacevic, D. Babic and M. Baric.
2010. Estimation of some genetic parameters through generation mean analysis in two
winter wheat crosses. Period. Biol. 112(3): 247–251.
East, E.M. 1908. Inbreeding in corn. Rep. Conn. Agric. Exp. Stn. 1907: 419–429.
El-Badawy, M. El. M. 2012. Estimation of genetic parameters in maize crosses for yield and its
attributes. Asian J. Crop Sci., 4(4): 127-138.
Entringer, G.C., F.L. Guedes, A.A. Oliveira, J.P. Nascimento and J.C. Souza. 2014. Genetic
control of leaf curl in maize. Genet. Mol. Res. 13(1): 1672-1678.
Erazo-barradas, M. 2009. Evaluation of popping expansion traits in a maize (Zea mays
L.) population. Graduate theses and dissertations, Iowa State University.
Esechie, H. A., V. Rodriguez and H. Al-Asmi. 2004. Comparison of local and exotic maize
varieties for stalk lodging components in a desert climate. Eur. J. Agron. 21(1): 21-30.
Eta-Ndu, J.T. and S.J. Openshaw. 1999. Epistasis for grain yield in two F2populationsof maize.
Crop Sci., 39: 346-352.
Falconer, D.S. and T.F.C. Mackey. 1997. An introduction to quantitative genetics. Addison
Weslay Longman Ltd. Edinburg Gate, Harlow, Essex CM 20 2JE, England, UK.
182
Fan, X.M., Y.M. Zhang, W.H. Yao, H.M. Chen, J. Tan, C.X. Xu, X.L. Han, L.M. Luo and M.S.
Kang. 2009. Classifying maize inbred lines into heterotic groups using a factorial mating
design. Agron. J. 101: 106-112.
Farshadfar, E., M. Ghanadha, M. Zahravi, J. Sutka. 2001. Generation mean analysis of drought
tolerance in wheat. Acta Agron, Hungarica 49(1), 59-66.
Fehr, W.R. 1993. Principles of cultivar development. Vol I: Theory and technique. Macmillan
Pub. Co., USA.
Fisher, R. 1918. The correlation between relatives on the supposition of Mendelian inheritance.
52: 399-433.
Flint-Garcia, S.A., S.E. Buckler, P. Tiffin, E. Ersoz and N.M. Springer. 2009. Heterosis is
prevalent for multiple traits in diverse maize germplasm. PLoS One 4(10): 1-11. e7433.
doi:10.1371/journal.pone.0007433.
Frank, T.E. and A.R. Hallauer. 1997. Generation means analysis of the twin-ear trait in maize. J.
Heredity. 88: 469-474.
Frascaroli, E., M.A. Cane, P. Landi, G. Pea, L. Gianfranceschi, M. Villa, M. Morgante and M.E.
Pe. 2007. Classical genetic and quantitative trait loci analyses of heterosis in a maize
hybrid between two elite inbred lines. Genet. 176(1):625-644.
Freitas, I.L.J., A.T. do Amaral Jr, S.P. Freitas Jr., P.D.S. Cabral, R.M. Ribeiro and L.S.A.
Gonçalves. 2014. Genetic gains in the UENF-14 popcorn population with recurrent
selection. Genet. Mol. Res. 13 (1): 518-527.
Freitas, Jr. S.P., A.T. Amaral Jr, R.M. Rangel and A.P. Viana. 2009. Genetic gains in popcorn by
full-sib recurrent selection. Crop Breed. Appl. Biotechnol. 9: 1-7.
Fry, J.D. 2004. Estimation of genetic variances and covariances by restricted maximum
likelihood using PROC MIXED. Pp. 7–39. In A. R. Saxton (ed.). Genetic analysis of
complex traits using SAS. Books by Users Press, SAS Inst., Cary, NC.
Gamble, E.E., 1962. Gene effects in corn (Zea mays L.): separation and relative importance of
gene effects for yield. Canadian J. Plant Sci. 42: 339–348.
Ghassemi-Golezani, K. and Z. Tajbakhsh. 2012. Relationship of plant biomass and grain filling
with grain yield of maize cultivars. Int. J. Agri. Crop Sci. 4(20): 1536-1539.
183
Gnanamurthy, S., M. Girija, D. Dhanave, P. Pavadai and Bharathi. 2013. Enhancement of
quantitative traits, genetic variability, heritability and genetic advance as percent of mean
in maize (Zea mays (L.) induced by mutation. Int. J. Cur. Tr. Res. 2 (1): 44-50.
Gomez, K.W. and A.A. Gomez. 1983. Statistical procedures for agricultural research. 2nd ed.
London: John Wiley and Sons.
Guerrero, C.G., M.A.G. Robles, J.G.L. Ortega, I.O. Castillo, C.V. Vázquez, M.G. Carrillo,
A.M. Resendez and A.G. Torres. 2014. Combining ability and heterosis in corn breeding
lines to forage and grain. American J. Plant Sci. 5: 845-856.
Haddadi, H.M., M. Eesmaeilof, R. Choukan and V. Rameeh, 2012. Combining ability analysis of
days to silking, plant height, yield components and kernel yield in maize breeding lines.
Afr. J. Agric. Res., 7: 5153-5159.
Haddadia, M.H., M. Eesmaeilovb and R. Choukan. 2014. Diallel analyses of some agronomic
traits in maize (Zea mays L.). Int. J. Plant, Ani. Env. Sci. 4(1): 257-265.
Halidu, J., L. Abubakar, U.A. Izge, S.G. Ado, H. Yakubu and B.S. Haliru. 2015. Correlation
analysis for maize garin yield, other agronomic parameters, and Striga effect ted traits
under Striga infested/free environment. J. Plant Breed. Plant Sci. 7(1): 9-17.
Hallauer, A.R. 1990. Methods used in developing maize inbreds. Maydica, 35: 1-16.
Hallauer, A.R. and J.B. Miranda Filho.1995. Quantitative genetics is maize breeding. 2nd ed.
Ames, Iowa State University Press. pp: 468.
Hallauer, A.R. and J.B. Miranda. 1988. Quantitative genetics in maize breeding. 2nd ed. Iowa
State Univ. Press. Ames. IA (USA).
Hamid, F., M. Saleem, A. Ahmad and A. Naveed, 1995. Combining ability for grain yield and its
components in maize (Zea mays L.). Pak. J. Agri. Sci., 32: 168-171.
Haq, M.I, N. Kamal, S. Khanum, M. Siddique and M. Arshadullah. 2014. Generation mean
analysis for flowering characteristics in maize (Zea mays L.). Persian Gulf Crop Prot.
3(1): 18-24.
Haq, M.I., S.U. Ajmal, M. Munir and M. Gulfaraz. 2010. Gene action studies of different
quantitative traits in maize. Pak. J. Bot. 42(2): 1021-1030.
Hayman, B.I. 1958. The separation of epistatic from additive and dominance variation in
generation means. Heredity 12: 371-390.
184
Hayman, B.I. and K. Mather. 1955. The description of genetic interaction in continuous
variation. Biometrics 11: 69-82.
Hemalatha, V., R.S. Kumar, V. Swarnalatha and J. Suresh. 2014. Combining ability and gene
action for morphological parameters in quality protein maize (Zea mays L.). Int. J. Plant
Anim. Env. Sci. 4(2): 230-235.
Henfy, M. 2011. Genetic parameters and path analysis of yield and its components in corn inbred
lines (Zea mays L.) at different sowing days. Asian J. Crop Sci. 3(3):106-117.
Hinze, L.L. and K.R. Lamkey. 2003. Absence of epistasis for grain yield in elite maize hybrids.
Crop Sci., 43: 46-56.
Hoseney, R.C., K. Zeleznak, and A. Abdelrahman. 1983. Mechanism of popcorn popping. J.
Cereal Sci., 1, 43.
Hussain, M., K. N. Shah, A. Ghafoor, T. T. Kiani and T. Mahmood. 2014. Genetic analysis for
grain yield and various morphological traits in maize (Zea mays L.) under normal and
water stress environments. J. Anim. Plant Sci. 24(4): 1230-1240.
Hussain, M., T.T. Kiani, K.N. Shah, A. Ghafoor and A. Rabbani. 2015. Gene action studies for
protein quality traits in maize (Zea mays L.) under normal and drought conditions. Pak. J.
Bot. 47(1): 57-61.
Hussain, M.A. 2013. Estimation of gene action, combining ability, heterosis and heritability in
maize by using line × tester method under two nitrogen levels. Mesopotamia J. Agri.
41(1): 11-22.
Hussain, M.A. and I.H. Ali. 2014. Combining ability, gene action and heterosis in some inbred
lines of maize at two sowing dates using factorial mating design. Int. J. Pure Appl. Sci.
Technol., 21(1):17-30.
Hussain, M.A. and Z.A. Hassan. 2014. Genetic variability, heritability and correlation studied for
yield and yield components in maize hybrids. Sarhad J. Agri. 30(4): 472-478.
Idahosa, D.O., J.E. Alika and A.U. Omoregie. 2010. Genetic variability, heritability and
expected genetic advance as indices for yield and yield components selection in cowpea
(Vigna ungiculata L.) walp. Academia Arena, 2(5):22-26.
Idris, A.E. and A.I. Abuali. 2011. Genetic variability for vegetative and yield traits in maize (Zea
mays L.) genotypes. Int. Res. J. Agric. Sci. Soil Sci. 1(10): 408-411.
185
Iqbal, M., K. Khan, H. Rahman and H. Sher. 2010. Detection of epistasis for plant height and
leaf area per plant in maize (Zea mays L.) from generation means analysis. Maydica 55:
33-39.
Iqbal, M., K. Khan, H. Rahman and J. Bakht. 2009. Genotypic and phenotypic associations
among physiological traits in subtropical maize. Sarhad J. Agric. 25(4): 551-556.
Ishaq, M., G. Hassan, H. Rahman, M. Iqbal, I.A. Khalil, S.A. Khan, S.A. Khan, Rafiullah and J.
Hussain. 2014. Estimates of heritability and expected response for maturity and grain
yield related traits in half-sib recurrent families of maize. Pak. J. Biotech. 11(2): 141-151.
Ishfaq, A. 2011. Generation mean analysis of reproductive and yield traits in maize (Zea mays
L.). SAARC J. Agri. 9(2): 37-44.
Jabeen, F., H.K Sahib and E. Satyanarayana. 2007. Combining ability analysis in quality protein
maize (Zea mays L.). Crop Res. 34 (1): 171-175.
Jain, R. and D.N. Bharadwaj. 2014. Heterosis and inbreeding depression for grain yield and yield
contributing characters in quality protein maize. Agri. Communications, 2(1): 8-16.
Jain, S.K. and E.V.D. Sastry. 2012. Heterosis and combining ability for grain yield and its
contributing traits in bread wheat (Triticum aestivum L.). Research and Reviews: J. Agri.
Alli. Sci. 1(1): 17-22.
Jaiswal, K.K., S. Marker and B. Kumar. 2013. Combining ability analysis in diallel crosses of
wheat (Triticum aestivum L.). The Bioscan, 8(4): 1557-1560.
Jamshidian, P., A.R. Golparvar, M.R. Naderi and H. Darkha. 2013. Phenotypic correlations and
path analysis between ear yield and other associated characters in corn hybrids (Zea mays
L.). Intl. J. Farm Alli. Sci. 2(S): 1273-1276.
Jatav, M., S.K. Jatav and V.S. Kandalkar. 2014. Combining ability and heterosis analysis of
morpho-physiological characters in wheat. Annals of Plant and Soil Res. 16(2): 79-83.
Jawaharlal, J., G.L. Reddy and R.S. Kumar. 2012. Heterosis for yield component traits in maize
(Zea mays L.). Indian J. Agri. Res. 46(2): 184-187.
Jele, P., J. Derera and M. Siwela. 2014. Assessment of popping ability of new tropical popcorn
hybrids. Aust. J. Crop Sci. 8(6):831-839.
John, H.P. 1991. Hybrid genetic complement and corn plant DK570. Dekalb Genetics
Corporation, IL, USA.
186
Joshi, B.K. 2005. Correlation, regression and path coefficient analyses for some yield
components in common and Tartary buckwheat in Nepal. Fagopyrum 22: 77-82.
Kanagarasu, S., G. Nallatthambi and K.N. Ganesan. 2010. Combining ability analysis for yield
and its component traits in maize (Zea mays L.). Electronic J. Plant Breed. 1: 915-920.
Kanapeckas, J., P. Tarakanovas and A. Lemeþiene. 2005. Variability, heritability and
correlations of genetic resources in meadow fescue (Festuca arundinacea Schreb.). Biol.
J. 3:10-14.
Kapoor, C., S. Lata and J.K. Sharma. 2014. Combining ability and heterosis studies for grain
yield and its component traits in maize (Zea mays L.). Elec. J. Plant Breed. 5(4): 716-721.
Kara, S.M. 2001. Evaluation of yield and yield components in maize inbred lines. Heterosis and
lines x tester analysis of combining ability. Turk. J. Agric. 25: 383-391.
Kashiani, P., G. Saleh, N.A.P Abdullahand S.N Abdullah. 2010. Variation and genetic studies on
selected sweet corn inbred lines. Asian J. Crop Sci. 2: 78-84.
Kathiria, K.B. and R.K. Sharma. 1996. Genetics of plant height and flag leaf area in bread wheat
under normal and salinity conditions. Gujrat Agri. Uni. Res. J. 21(2): 8-12.
Kearsey, M.J. and H.S. Pooni. 2004. The genetical analysis of quantitative traits. Chapman and
Hall, U. K., ISBN:0-7487-4082-1.
Khalil, I.A., H. Rehman, H. Saeed, H.U. Khan, Durrishawar, I. Nawaz, F. Ali, M. Sajjad, M.
Saeed. 2010. Combining ability in maize single cross hybrids of for grain yield: A
graphical analysis. Sarhad J. Agri. 26, 374-379.
Khalili, M., M.R. Naghavi, A.P. Aboughadareh and H.N. Rad. 2013. Evaluation of relationships
among grain yield and related traits in maize (Zea mays L.) cultivars under drought stress.
Int. J. Agron. Plant Prod. 4(6): 1251-1255.
Khan, N.H., M. Ahsan, M.A. Randhawa, A.S. Khan, A. Saeed and M.S. Naeem. 2014.
Estimation of genetic components for various physiological traits in maize (Zea mays L.)
under water deficit conditions. J. Glob. Innov. Agric. Soc. Sci. 2(2): 55-61.
Khanmohammadi, A., M. Valizadeh, A.A. Imani and M.R. Shiri. 2013. Identify the effective
traits on the performance of maize hybrids in Moghan. Tech. J. Eng. Appl. Sci. 3(11):
964-969.
187
Khayatnezhad, M., R. Gholamin and S.H. Jamaati-e-Somarin. 2010. Study of genetic diversity
and path analysis for yield in maize (Zea mays L.) genotypes under water and dry
conditions. World Appl. Sci. J. 11(1): 96-99.
Khodarahmpour, Z. 2011a. Gene action studies of different traits in maize (Zea mays L.) under
heat stress and normal conditions. J. American Sci. 7(5): 442-448.
Khodarahmpour, Z. 2011b. Gene action studies of different traits in maize (Zea mays L.) under
heat stress and normal conditions. J. American Sci. 7(5): 442-448.
Kinfe, H., G. Alemayehu, L. Wolde and Y. Tsehaye. 2015. Correlation and path coefficient
analysis of grain yield and yield related traits in maize (Zea mays L.) hybrids, at Bako,
Ethiopia. J. Bio. Agri. Healthcare. 5(15): 44-52.
Koirala, K. B and D. B. Gurung. 2002. Heterosis and combining ability of seven yellow maize
populations in Nepal. Proceeding of the 8th Asian Regional Maize workshop, Bangkok,
Thailand, August 5-8.
Kruijer, W., M.P. Boer, M. Malosetti, P.J. Flood, B. Engel, R. Kooke, J.J.B. Keurentjes, F.A.V.
Eeuwijk. 2015. Marker-based estimation of heritability in immortal populations. Genetics
199(2): 379-398.
Kumar, A., M.G. Ganshetti and A. Kumar. 1998. Gene effects in some metric traits of maize
(Zea mays L.). Annals Agri. Bio. Res. 3(2):139-43.
Kumar, G.P., V.N. Reddy, S.S. Kumar and P.V. Rao. 2014a. Genetic variability, heritability and
genetic advance studies in newly developed maize genotypes (Zea mays L.). Int. J. Pure
App. Biosci. 2(1): 272-275.
Kumar, G.P., Y. Prashanth, V.N. Reddy, S.S. Kumar and P.V. Rao. 2014b. Character association
and path coefficient analysis in maize (Zea mays L.). Int. J. Appl. Bio. Pharm. Tech. 5(1):
257-260.
Kumar, G.P., Y. Prashanth, V.N. Reddy, S.S. Kumar and P.V. Rao. 2014c. Heterosis for grain
yield and its component traits in maize (Zea mays L.). Int. J. Pure Appl. Biosci. 2(1): 106-
111.
Kumar, R., M. Singh, M.S. Narwal and S.Sharma. 2005. Gene effects for grain yield and its
attributes in maize (Zea mays L.). National J. Plant Impr. 7(2): 105-107.
Kumar, V., P.K. Singh and A. Guptha. 2011. Studies of genetic diversity in quality protein maize
(Zea mays L.) inbreds. Current Adv. Agri. Sci. 3(2): 96-99.
188
Kustanto, H., A.N. Sugiharto, N. Basuki and A. Kasno. 2012. Study on heterosis and genetic
distance of s6 inbred lines of maize. J. Agric. Food. Tech. 2(8): 118-125.
Kwaga, Y.M. 2014. Correlation coefficients between grain yield andother characters of maize
(Zee mays L.) grown at Mubi in Northern Savanna, Nigeria. Int. J. Farm Alli. Sci. 3(2):
220-224.
Kwon, S.H. and J.H. Torrie. 1964. Heritability and inter-relationship among traits of two
soybean populations. Crop Sci. 4: 196-198.
Lamkey, K.R., B.J. Schnicker and A.E. Melchinger. 1995. Epistasis in an elite maize hybrid and
choice of generation for inbred line development. Crop Sci., 35: 1272-1281.
Leon, N. de, J. G. Coors and S.M. Kaeppler. 2005. Genetic control of prolificacy and related
traits in the golden glow maize population: II. Genotypic analysis. Crop. Sci. 45:1370-
1378.
Lorenzana, R.E. and R. Bernardo. 2008. Genetic correlation between corn performance in
organic and conventional production systems. Crop Sci. 48: 903-910.
Lu, H.J., R. Bernardo and H.W. Ohm. 2003. Mapping QTL for popping expansion volume in
popcorn with simple sequence repeat markers. Theor. Appl. Gen. 106: 423-427.
Mahdy, E.E. 1988. Inheritance of some agronomic traits in wheat (Triticum aestivum L.). Assiut
J. Agric. Sci. 19(3):203-213.
Mahmood, Z., S.R. Malik, R. Akhtar and T. Rafique. 2004. Heritability and genetic advance
estimates from maize genotypes in Shishi Lusht a valley of Krakurm. Int. J. Agri. Biol.
6(5): 790-791.
Majidi, M.M., A. Mirlohi and F. Amini. 2009. Genetic variation, heritability and correlations of
agro-morphological traits in tall fescue (Festuca arundinacea Schreb.). Euphytica 167:
323-331.
Malik, H.Z., S.I. Malik, M. Hussain, S.R. Chughtai and H.I. Javed. 2005. Genetic correlation
among various quantitative characters in maize (Zea mays L.) hybrids. J. Agri. Soc. Sci.
1(3): 262-265.
Malik, S.I., H.N. Malik, N.M. Minhas and M. Munir. 2004. General and specific combining
ability studies in maize diallel crosses. Int. J. Agri. Biol. 6(5): 856-859.
Mather, K. and J.L. Jinks. 1971. Introduction to Biometrical Genetics. Cornell University Press.
Ithaca, NY. PP: 382.
189
Mather, K. and J.L. Jinks. 1982. Biometrical Genetics. Methuen, London, pp: 162.
Mathur, R.K., Chunilal, S.K. Bhatnagar and V. Singh. 1998. Combining ability foryield,
phonological and ear characters in white seeded maize. Indian J. Agri. Res. (2), 117-182.
McConnell, R.L. and G.O Gardner. 1979. Inheritance of several cold tolerance traits in corn.
Crop Sci. 19(6): 847-852.
Mehla, B.S., S.C. Sharma and J.S. Hooda. 2000. Gene action for certain quantitative traits in
bread wheat. Ann. Biol. Ludhiana, 16:95-100.
Mehmood, Z., S.R. Malik, R. Akhtar and T. Rafique. 2004. Heritability and genetic advance
estimates from maize genotypes in shishi lusht a valley of krakurm. Int. J. Agri. Biol.,
6(5): 790-791.
Mehri, S. 2015. Assessment of the performance correlation, agronomic characteristics, and
drought tolerance indices in corn hybrids under late season moisture stress conditions.
Cumhuriyet Sci. J. 26(3): 586-594.
Melchinger, A., H. Geiger and F.W. Schnell. 1986. Epistasis in maize. 1. Comparison of single
and 3-way cross hybrids among early flint and dent inbred lines. Maydica 31: 179-192.
Melchinger, A.E., W. Schmidt and H.H. Geiger. 1988. Comparisons of test crosses produced
from F2 and first backcross populations in maize. Crop Sci., 28: 743-749.
Mendes-Moreira, P., M.L. Alves, Z. Satovic, J.P. dos Santos, J.N. Santos, J.C. Souza, S.E. Pêgo,
A.R. Hallauer and M.C.V. Patto. 2015. Genetic architecture of ear fasciation in maize
(Zea mays L.) under QTL scrutiny. Plos One 10(4): e0124543.
doi:10.1371/journal.pone.0124543.
Mhike, X., D.M. Lungu and B. Vivek. 2011. Combining ability analysis amongst AREX and
CIMMYT maize (Zea mays L.) inbred lines under stress and non-stress conditions. Afr. J.
Agric. Res., 6: 1952-1957.
Mhike, X., P. Okori, C. Magorokosho and P. Gibson. 2012. Genetic analysis of tropical maize
inbreds and hybrids for grain yield and traits associated with drought tolerance. Third
Ruforum Biennial Meeting 24-28 September, 2012, Entebbe, Uganda.
Mickelson, H. R., H. Cordova, K.V. Pixley and M.S. Bjarnason. 2001. Heterotic relationships
among nine temperate and subtropical maize populations. Crop Sci. 41:1012-1020.
190
Miranda, G.V., L.V. de Souza, J.C.C. Galvã, L.J.M. Guimarães, A.V. de Melo and I.C. do
Santos. 2008. Genetic variability and heterotic groups of Brazilian popcorn populations.
Euphytica 162: 431-440.
Mohammadi, S.A., B.M. Prasanna, C. Sudan and N.N. Singh. 2002. A microsatellite marker
based study of chromosomal regions and gene effects on yield and yield components in
maize. Cell. Mol. Bio. Lett. 7: 599-606.
Mohammadi, S.A., B.M. Prasanna, N.N. Singh. 2003. Sequential path model for determining
interrelationship among grain yield and related characters in maize. Crop Sci. 43: 1690-
1697.
Mohan, Y.C., D.K. Singh and N.V. Rao. 2002. Path coefficient analysis for oil and grain yield in
maize (Zea mays L.) genotypes. National J. Plant Imp. 4(1): 75-76.
Mora, F., y C.A. Scapim. 2007. Predicción de valores genéticos del efecto de poblaciones de
maíz evaluadas en Brasil y Paraguay. Agric. Téc. (Chile) 67:139-146.
Moradi, M. 2014. Genetic analysis to determine the nature and magnitude of genetic variances
and heritability estimates in maize (Zea mays L.). Int. J. Agron. Agri. Res. 5(5): 183-188.
Moradi, M., R. Choukan, H.E. Majidi and M.R. Bihamta. 2014. Genetic analysis of various
morpho-physiological traits in maize (Zea mays L.) using graphical approach under
normal and water stress conditions. Res. Crops 15(1): 62-70.
Mousa, H. E. 2004. Comparison between two types of testers for evaluating new white inbred
lines of maize. Annals Agri. Sci., Moshtohor 42(2): 475-487.
Mousavi, H., S. Lack, M.A. Fazel. 2013. Analysis of correlation and stepwise regression
between grain protein yield and related traits of maize in conditions of drought stress and
zinc sulfate spraying. Intl. J. Agri. Crop Sci. 5(23): 2783-2788.
Mukambi, D., A. Diallo, F. Kanampiu, S. Mugo and H. Karaya. 2015. Agronomic performance
and genotype environment interaction of herbicide-resistant maize varieties in Eastern
Africa. Crop Sci. 55: 540-555.
Munawar, M., M. Shahbazb, G. Hammada and M. Yasir. 2013. Correlation and path analysis of
grain yield components in exotic maize (Zea mays L.) hybrids. Int. J. Sci. Basic Appl.
Res. 12(1): 22-27.
191
Munhoz, R.E., A.J. Prioli, A.T. Amaral Jr, and C.A. Scapim. 2009. Genetic distances between
popcorn populations based on molecular markers and correlations with heterosis
estimates made by diallel analysis of hybrids. Genet. Mol. Res. 8: 951-962.
Muraya, M.M., C.M. Ndirangu and E.O. Omolo, 2006. Heterosis and combining ability in diallel
crosses involving maize (Zea mays L.)S lines. Aust. J. Exp. Agric., 46: 387-394.
Musila, R.N., A.O. Oiallo, D. Mukambi and K. Njoroge. 2010. Combining ability of early
maturing quality protein maize inbredlines adopted to Eastren Africa. Field Crops Res.
119: 321-237.
Nagabhushan, N.M., C.H. Mallikarjuna, M.S. Shashibhaskar and G.D. Prahalada. 2011. Genetic
variability and correlation studies for yield and related characters in single cross hybrids
of maize (Zea mays L.). Current Biotica 5: 157-163.
Nataraj, V., J.P. Shahi and D.Vandana. 2014. Estimates of variability, heritability and genetic
advance in certain inbreeds of maize (Zea mays, L.). Int. J. Appl. Bio. Pharm. Tech. 5(1):
205-208.
Ngugi, K., J.O. Collins, S. Muchira. 2013. Combining, earliness, short anthesis to silking interval
and yield based selection indices under intermittent water stress to select for drought
tolerant maize. Aust. J. Crop Sci. 7(13):2014-2020.
Nigussie, M. and G. Saleh. 2005. Response of recurrent selection methods in
two sweet corn (Zea mays L. Saccharata) populations. Asian J. Plant Sci.
4(6):589-596.
Nigussie, M. and G. Saleh. 2007. Genetic variability and response to two
methods of recurrent selection in two sweet corn (Zea mays L.
Saccharata) populations. Asian J. Plant Sci. 6(5):859-863.
Niyonzima, J.P., T.E. Nagaraja, H.C. Lohithaswa, M.S. Uma, R. Pavan, F. Niyitanga, A.
Kabayiza. 2015. Combining ability study for grain yield and its contributing characters in
maize (Zea mays L.). Int. J. Agron. Agri. Res. 7(1): 61-69.
Noor, M., Durrishahwar, H. Rahman, F. Ali, M. Iqbal, I.A. Shah and I. Ullah. 2013. Change in
heritability estimates due to half-sib family selection in the maize variety Pahari. Genet.
Mol. Res. 12 (2): 1872-1881.
192
Nzuve, F., S. Githiri, D.M. Mukunya and J. Gethi. 2014. Genetic variability and correlation
studies of grain yield and related agronomic traits in maize. J. Agri. Sci. 6(9): 166-176.
Ofori, A.P., K. Ofori, K. Obeng-Antwi, K.M.L. Tengan and B. Badu-Apraku. 2015.
Combining ability and heterosis estimates of extra-early quality protein
maize (QPM) single cross hybrids. J. Plant Breed. Crop Sci. 7(4): 87-93.
Ohunakin, A.O. and S. O. Adebisi. 2015. Nitrogen use and assimilate partitioning ability for
grain yield in some selected maize (Zea mays L.) inbred lines genotypes. American J.
Exp. Agri. 5(2): 148-155.
Ojo, D.K., O.A. Omikunle, O.A. Oduwaye, O.A. Ajala and S.A. Ogunbayo. 2006. Heritability,
character correlation and path coefficient analysis among six inbred-lines of maize.
World J. Agri. Sci. 2: 352-358.
Ojo, G.O.S., D.K. Adedzewa, L.L. Bello. 2007. Combining ability estimates and
heterosis for grain yield components in maize (Zea mays L.). J. Sustain.
Dev. Agnananthe Environ. 3: 49-57.
Oktem, A. 2008. Determination of selection criterions for sweet corn using path coefficient
analyses. Cereal Res. Communications 36(4): 561–570.
Olakojo, S.A. and G. Olaoye. 2011. Correlation and heritability estimates of maize agronomic
traits for yield improvement and Striga asiatica (L.) Kuntze tolerance. Afr. J. Plant Sci.
5(6): 365-369.
Olawuyi, O.J., A.C. Odebode and S.A Olakojo. 2013. Genotype x Concentration x
Mycorrhiza interaction on early maturing maize under Striga lutea (Lour)
in Nigeria. Proc. Tropentag Conference on “Agricultural development
within the rural-urban continuum” Stuttgart-Hohenheim (Germany), 17-19
Sept, 2013.
Oloyede-Kamiyo, Q.O. 2015. Correlation between agronomic and stem borer resistant traits in
maize: Implications in selection. J. Applied Biosci. 90: 8421-8428.
Pajic, Z., J. Srdic and G. Todorovic. 2006. Effects of the popcorn grain moisture content on the
popping volume. Proc. Tehni. Ener. Polj. 10(3-4): 122-123.
Pajic, Z., M. Babic. 1991. Interrelation of popping volume and some agronomic characteristics in
popcorn hybrids. Brno, Czechoslovakia 1(6): 387-394.
193
Pajic, Z., U. Eric, J. Srdic, S.M. Drinic and M. Filipovic. 2008. Popping volume and grain yield
in diallel set of popcorn inbred lines. Genetika 40(3): 249-260.
Pandey, D.P., T. Dawa, D.L. Sharma and T. Dawa. 1999. Combining ability and gene action in
inter-varietal crosses in bread wheat. Crops Res. Hisar, 18:261-265.
Pereira, M.G. and A.T. Amaral Jr do. 2001. Estimation of genetic components in popcorn based
on the nested design. Crop Breed. Appl. Biot. 1: 3-10.
Pérez-López, F.J. R. Lobato-Ortiz, J.de J. García-Zavala, J.D. Molina-Galán, J.de J. López-
Reynoso, T. Cervantes-Santana. 2014. High yielding inbred lines of maize as progenitors
of single cross hybrids. Publicado como ARTÍCULO en Agrociencia 48: 425-437.
Perez-Velasquez, J.C., H. Cellalos, S. Pandey and C.D. Amaris. 1996. A diallel cross analysis of
some quantitative characters in maize. Crop Sci. 36: 572-578.
Piano, E., P. Annicchiarico, M. Romani and L. Pecetti. 2008. Genetic variation and heritability
of forage yield in Mediterranean tall fescue. Plant Breed. 126:644–646.
doi:10.1111/j.1439-0523.2007.01416.x
Pinto, R.J.B., C.A. Scapim, A.F. Neto, C.A.P. Pacheco, M. Royer, M.V. Pedroni, R.K. Salvadori,
and R.M. Silva. 2004. Analysis of testers with broad and narrow genetic base for
topcrosses in popcorn breeding. Crop Breed. Appl. Biotech. 4: 152-162.
Pinto, R.M.C., A.A.F. Garcia and C.L. Souza Jr. 2001. Alocação de linhagens de milho
derivadas das populações BR-105 e BR-106 em grupos heteróticos. Sci. Agri. 58: 541-
548.
Pípolo, V.C., F.A.M. da Silva and A.L. Seifert. 2003. Popcorn parental selection based on
genetic divergence. Crop Breed. Appl. Tech. 3(4): 261-268.
Pixely, K.V., T. Dhliwayo and P. Tongoona. 2006. Improvement of maize populations by full-
sib selection alone versus full-sib selection with selection during inbreeding. Crop Sci.
46: 1130-1136.
Prakash, S. and D.K. Ganguli. 2004. Combining ability for various yield component characters
in maize (Zee mays L.). J. Res., Birsa Agric. Univ., 16(1):55-60.
Presterl, T., G. Seitz, M. Lnadbock, E. M. Thiemt, W. Schmidt and H.H. Geiger.2003.
Improving nitrogen-use-efficiency in European maize: Estimation of quantitative genetic
parameters. Crop Sci. 43: 1259-1265.
194
Rafiq, Ch.M., M. Rafique, A. Hussainand M. Altaf. 2010. Studies on heritability, correlation and
path analysis in maize (Zea mays L.) J. Agric. Res. 48(1): 35- 38.
Rafique, M., A. Hussain, T. Mahmood, A.W. Alvi and M.B. Alvi. 2004. Heritability and
interrelationships among grain yield and yield components in maize (Zea mays L). Int. J.
Agri. Biol. 6(6): 1113-1114.
Rahman, H., Z.W. Wicks, M.S. Swati and K. Ahmad. 1994. Generation mean analysis of
seedling root characteristics in maize (Zea mays L.) Maydica 39: 77-181.
Rahman, S., M.M. Mia, T. Quddus, L. Hassan and M.A. Haque. 2015. Assessing genetic
diversity of maize (Zea mays L.) genotypes for agronomic traits. Res. Agric. Livest. Fish.
2(1): 53-61.
Ramesh, V.K., X.P. zeng, L. Jeffrey, Bennetzen and B.E. Zehr. 1995. Assessment of genetic
diversity in dent and pop-corn (Zea mays L.) inbred lines using inter-simple sequence
repeat (ISSR) amplification. Molecular Breeding, 1: 365-373.
Rangel, R., A.T. Amaral Jr, C.A. Scapim, S.P. Freitas Jr and M.G. Pereira. 2008. Genetic
parameters in parents and hybrids of circulant diallel in popcorn. Genet. Mol. Res. 7 (4):
1020-1030.
Rangel, R.M., A.T. do Amaral Jr., A.P. Viana, S de P. Frietas Jr. and M.G. Pereira. 2007.
Prediction of popcorn hybrid and composite means. Crop Breed. Appl. Tech. 7(3): 287.
Rasmussen, C.C. 2003. Evaluation of heterotic patterns between stiff-stalk and non-stiff stalk
populations based on Design II crosses. M.Sc. Thesis, Iowa State University, Aemes,
Iowa, USA.
Ravikant, R. Prasad and Chandrakant. 2006. Gene effects for metric traits in quality protein
maize (QPM) (Zee mays L.). Crop Impro. 33(1): 94-101.
Reddy, R.V., S.A. Rao and M.R. Sudarshan. 2011. Heterosis and combining ability for grain
yield and its components in maize (Zea mays L.). J. Res. Angrau 39(3): 6-15.
Rezaei, A.H. and V. Roohi. 2004. Estimate of genetic parameters in corn (Zea mays L.) based on
diallel crossing system. New directions for a diverse planet. Proceedings of the 4th
International Crop Science Congress, 26 September-1 October, Brisbane, Australia.
Rezaei, A.H., B. Yazdisamadi, A. Zali, A.M. Rezaei, A. Tallei and H. Zeinali. 2005. An estimate
of heterosis and combining ability in maize using diallel crosses of inbred lines. Iranian J.
Agric. Sci. 36(2): 385-397.
195
Rezende, G. S. P. and C. L. Souza. 2000. A reciprocal recurrent selection procedure outlined to
integrate hybrid breeding programs in maize. J. Genet. Breed. 54: 57-66.
Ribeiro, R.M., A.T. do Amaral Jr, L.S.A. Gonçalves, L.S. Candido, T.R.C. Silva and G.F. Pena.
2012. Genetic progress in the UNB-2U population of popcorn under recurrent selection
in Rio de Janeiro, Brazil. Genet. Mol. Res. 11 (2): 1417-1423.
Richard, C., L. Daka, D.S. Osiru, M.S. Mwala, D. Lungu, K. Munyinda, M. Mukanga. 2015.
Combining ability and heterotic orientation of selected Zambian maize inbred lines under
low soil phosphorus conditions. Int. J. Agri. Crop Sci. 8(2): 203-213.
Rodovalho, M., F. Mora, O. Arriagada, C. Maldonado, E. Arnhold and C.A. Scapim. 2014.
Genetic evaluation of popcorn families using a Bayesian approach via the independence
chain algorithm. Crop Breed. Appl. Biotech. 14: 261-265.
Rodrigues, M.C. and L.J. Chaves. 2002. Heterosis and its components in crosses among high
quality protein maize populations. Crop Breed. Appl. Biotech. 2(2): 281-290.
Rowe, K.E. and W.L. Alexander.1980. Computations for estimating the genetic parameters in
joint-scaling tests. Crop Sci. 20: 109–110.
Russell, W.A. and A.R. Hallauer. 1980. Corn. In: W.R. Fehr and H.H. Hadley (eds.)
Hybridization of crop plants. Pp: 299-312. Am. Soc. Agron. Crop Sci., Madison.
Sabolu, S., K.B. Kathiria, C.R. Mistry and S. Kumar. 2014. Generation mean analysis of fruit
quality traits in eggplant (Solanum melongena L.). Aust. J. Crop Sci. 8(2): 243-250.
Sadek, S.E., Ahmed, M.A. and Abd-El-Ghaney, H.M. (2006): Correlation and path coefficient
analysis in five parents inbred lines and their six white maize (Zea mays L.) single
crosses developed and grown in Egypt. J. App. Sci. Res. 2: 159-167.
Saeed, A., A.S. Khan, I. Khaliq and R. Ahmad. 2010. Combining ability studies on yield related
traits in wheat under normal and water stress conditions. Pak. J. Agri. Sci. 47(4): 345-
354.
Saeed, M. T., M. Saleem, and M. Afzal. 2000. Genetic analysis of yield and its components in
maize diallel crosses (Zea mays L.). Int. J. Agri. Biol. 2(4): 376-378.
Sah, R.P., M. Chakraborty, K. Prasad and M. Pandit. 2014. Combining ability and genetic
estimates of maize hybrids (Zea mays L.) developed using drought tolerant testers. Maize
J. 3(1&2): 9-17.
196
Salami, A.E., S.A.O. Adegoke and O.A. Adegbite. 2007. Genetic variability among maize
cultivars grown in Ekiti-State, Nigeria. Middle-East J. Scient. Res. 2(1): 09-13.
Saleem, M., K. Shahzd, M. Javid and A. Ahmad. 2002. Genetic analysis for various quantitative
traits in maize (zea mays L.) inbred lines. Int. J. Agric. & Biol. 4 (3): 379-382.
Saleh, G.B., D. Abdullah and A.R. Anuar. 2002. Performance, heterosis and heritability in
selected tropical maize single, double and three-way cross hybrids. J. Agric. Sci.
Cambridge, 138: 21-28.
Seboka, H., A. Ayana and H. Zelleke. 2009. Combining Ability Analysis for Bread Wheat
(Triticum Aestivum L.). East Afri. J. Sci. 3(1): 87-94.
Seyedzavar, J., M. Norouzi and S. Aharizad. 2015. Relationships of morphological characters
and yield components in corn hybrids under water deficit stress. Biological Forum – An
Int. J. 7(1): 1512-1519.
Shadlou, A., M. Solouki, S. Khavari, Barat Ali Fakheri. 2015. Heritability and heterosis of
agronomical characteristics, yield and yield components of sweet and super sweet corn
(Zea mays L.) genotypes. Int. J. Agron. Agri. Res. 6(1): 100-106.
Shahrokhi, M. and S.K. Khorasani. 2013. Comparison of yield and yield component on maize
(Zea mays L.) generations between saline condition and normal condition. Int. J. Agron.
Plant Prod. 4(3): 399-404.
Sharifi, M. 2005. Genetic analysis of salt tolerance in barley. M. Sc. Thesis,
College of Agriculture, Razi univ., Kermanshah, Iran.
Sharma, R., S.R. Maloo and A. Joshi. 2014. Genetic variability analysis in diverse maize
genotypes (Zea mays L.). Elect. J. Plant Breed. 5(3): 545-551.
Shekhawat, U.S., R.P. Bhardwaj, V. Prakash and V. Prekash. 2000. Gene action for yield and its
components in wheat (Triticum aestivumL.). Indian J. Agri. Res. 34: 176–8.
Sheoran, R.K., O.P. Govila, S. Balzor and B. Singh. 2000. Genetic architecture of yield and yield
contributing traits in pearl millet. Annals of Agric. Res. 21(3): 443-445.
Sher, H., M. Iqbal, K. Khan, M. Yasir, H. Rahman. 2012. Genetic analysis of maturity and
flowering characteristics in maize (Zea mays L.). Asian Pac. J. Trop. Biomed. 2(8): 621-
626.
Shimoni, E., E.M. Dirks and T.P. Labuza. 2002. The relation between final popped volume of
popcorn and thermal–physical parameters. Food Sci. Technol. 35: 93-98.
197
Shukla, A.N. and D.K. Mishra. 2013. Path coefficient and correlation assessment of yield and
yield associated traits in elite landraces of maize (Zea mays). Scholarly J. Agric. Sci.
3(10): 410-415.
Shukla, N., D.K. Mishra, S. Singh, A.S. Chavan and Avinash jha. 2014. Genetic studies for
growth and yield parameters in germplasm of desi and quality protein maize. Indian Res.
J. Genet. Biotech. 6(2): 367-373.
Shull, G.H. 1908. The composition of a field of maize. American Breeders Assoc. Rep. 4: 296-
301.
Silva, V.Q.R., A.T. Amaral Jr, L.S.A. Gonçalves, S.P. Freitas Jr, L.S. Candido, C. Vittorazzi,
L.M. Moterle, R.A. Vieira and C.A. Scapim. 2010. Combining ability of tropical and
temperate inbred lines of popcorn. Genet. Mol. Res. 9: 1742-1750.
Singh, K., U.B. Singh and S.N. Sharma. 2013. Combining ability analysis for yield and its
components in bread wheat (Triticum aestivum L. em. Thell.). J. Wheat Res. 5(1): 63-67.
Singh, P. and S. Narayanan. 1993. Biometrical Techniques in Plant Breeding.
Kalyani Publisher, New Delhi.
Singh, P. K. and A. K. Roy. 2007. Diallel analysis of inbred lines in maize
(Zee mays L.). Int. J. Agri. Sci., 3(1): 213-216.
Singh, R.K. and B.D. Chaudhary. 1985. Biometrical methods in quantitative gentic analysis.
Kalyani Publishers New Dehli, India.
Singh, R.P. and S. Singh. 1992. Estimation of genetic parameters through generation mean
analysis in bread wheat. Indian J. Gen. 52:369-375.
Singhal, N., S.S. Verma, D.C. Baskheti and A. Kumar. 2006. Heritability, genetic advance,
correlation and path-coefficient estimation in high quality protein maize (Zea mays L.).
Asian J. Bio. Sci. 1(2): 54-56.
Smith, J.S.C. and O.S. Smith. 1989. Comparison of heterosis among hybrids as a measure of
relatedness with that to be expected on the basis of pedigree. Maize Genet. Coop. Newsl.
63: 86-87.
Smith, O.S., J.S.C. Smith, S.L. Brown et al. 1990. Similarities among a group of elite maize
inbreds as measured by pedigree, F1 grain yield, grain yield, heterosis and RFLPs. Theor.
Appl. Genet., 80: 833-840.
198
Snedecor, G.W. and W.G. Cochran. 1989. Statistical methods, Eighth edition, Iowa State
University Press.
Soengas, P., B. Ordas, R.A. Malvar, P. Revilla and A. Ordas. 2006. Combining abilities and
heterosis for adaptation in flint maize populations. Crop Sci. 46:2666-2669.
Sofi, P., A.G. Rather and S. Venkatesh. 2006. Detection of epistasis by generation means
analysis in maize hybrids. Pak. J. Biol. Sci. 9(10): 1983-1986.
Sofi. P. and A.G. Rather. 2006. Genetic analysis of yield traits in local and CIMMYT inbred
lines crosses using Line x Tester analysis in maize (Zee mays L.). Asian J. Pl. Sci. 5(6):
1039-1042.
Solalinde, J.M.Q., C.A. Scapim, R.A. Vieira, A.T. do Amaral Jr., M. Vivas, R.J.B. Pinto, F.
Mora and A.P. Viana. 2014. Performance of popcorn maize populations in South
American Avatí Pichingá using diallel analysis. Aust. J. Crop Sci. 8(12): 1632-1638.
Springer, N.M. and R.M. Stupar. 2007. Allelic variation and heterasis in maize: How do two
halves make more than a whole? Genome Res., 17: 264-275.
Srdic, J., Z. Pajic and S.S. Mladenovic-Drinic. 2007. Inheritance of maize grain yield
components. Maydica 52(3): 261-264.
Sujiprihati, S., G.B. Saleh and E.S. Ali. 2003. Heritability, performance and correlation studies
on single cross hybrids of tropical maize. Asian J. Plant Sci. 2(1): 51-57.
Sumathi, P., A. Nirmalakumari and K. Mohanraj. 2005. Genetic variability and
traits interrelationship studies in industrially utilized oil rich
CIMMYT lines of maize (Zee mays L.). Madras Agric. J. 92(10-12): 612-
617.
Suzuki, D.T., A.J.F. Griffiths and R.C. Levontin. 1981. An introduction to genetic analysis. San
Francisco: W.H. Freeman and Co., pp: 911.
Tengan, K.M.L., K. Obeng-Antwi and R. Akromah. 2014. Genetic variances, heritability, and
correlation studies on selected phenotypic traits in a backcross breeding program
involving normal and Opaque-2 maize. Agric. Biol. J. North America 3(7): 287-291.
Tesfaye, T., T. Genet and T. Desalegn. 2014. Genetic variability, heritability and genetic
diversity of bread wheat (Triticum aestivum L.) genotype in western Amhara region,
Ethiopia. Wudpecker J. Agri. Res. 3(1): 26-34.
199
Tollenaar, M., A. Ahmadzadeh and E.A. Lee. 2004. Physiological basis of heterosis for grain
yield in maize. Crop Sci. 44: 2086-2094.
Ullah, K., H. Rahman1, M. Noor, M. Rehman, M. Iqbal and Sanaullah. 2013.
Heritability estimates and yield performance of half sib families
derived from maize variety sarhad white. Sarhad J. Agric. 29(1): 29-32.
Umakanth, A.V., E. Satyanarayana and M.V. Kumar. 2000. Correlation and heritability studies
in Ashwini maize composite. Ann. Agric. Res. 21: 228-30.
Unay, A., H. Basal and C. Konak. 2004. Inheritance of grain yield in a half-diallel maize
population. Turkish J. Agri. Fores. 28: 293-244.
Uzarowska, A., B. Keller, H.P. Piepho, G. Schwarz, C. Ingvardsen, G. Wenzel and T.
Lubberstedt. 2007. Comparative expression profiling in meristems of inbred-hybrid
triplets of maize based on morphological investigations of heterosis for plant height.
Plant Mol. Biol. 63: 21-34.
Valerio, I.P., F.I.F. de Carvalho, A.C. de Oliveira, V.Q. de Souza, G. Benin, D.A.M. Schmidt, G.
Ribeiro, R. Nornberg and H. Luch. 2009. Combining ability of wheat genotypes in two
models of diallel analyses. Crop Breed. App. Biot. 9: 100–107.
Venugopal, M., N.A. Ansari and T. Rajanikanth. 2003. Correlation and path analysis in maize.
Crop Res. 25(3): 525-52.
Viana, J.M., C.D. Cruz and A.A. Cardeso. 1999. Theory and analysis of partial diallel crosses.
Genet. Mol. Bio., 22: 591-599.
Vidal-Martinez, V. A., M. Clegg, B. Johnson, and R. Valdivia-Bernal. 2001. Phenotypic and
genotypic relationships between pollen and grain yield components in maize.
Agrociencia 35: 503-511.
Vieira, R.A., C.A. Scapim, D.J. Tessmann and F.T. Hata. 2011. Diallel analysis of yield, popping
expansion, and southern rust resistance in popcorn lines. Revista Ciência Agron. 42(3):
774-780.
Vieira, R.A., I.L.S. Neto, L.S. Bignotto, C.D. Cruz, A.T. do Amaral Jr. and C.A. Scapim. 2009.
Heterotic parameterization for economically important traits in popcorn. Acta Sci. Agron.
31(3): 411-419.
200
Wannows, A.A., H.K. Azzam and S.A. AL- Ahmad. 2010. Genetic variances,
heritability, correlation and path coefficient analysis in yellow maize
crosses (Zea mays L.). Agric. Biol. J. N. Am. 1(4): 630-637.
Wannows, A.A., M.Y. Sabbouh and S.A. AL-Ahmad. 2015. Generation mean analysis
technique for determining genetic parameters for some quantitative
traits in two maize hybrids (Zea mays L.). Jordan J. Agri. Sci. 11(1):
59-72.
Warner, J.N. 1952. A method for estimating heritability. Agron. J. 44: 427-430.
Wasif, A.H.M., 2008. Estimation of combining ability for various quantitative traits in maize
(Zea mays L.). M. Sc. Thesis Dept. Plant Breed. & Genet. Univ. Agric. Faisalabad.
Wattoo, F.M., M. Saleem, M. Ahsan, M. Sajjad and W. Ali. 2009. Genetic analysis for yield
potential and quality traits in maize (Zea mays L.). American-Eurasian J. Agric. Env. Sci.
6(6): 723-729.
White, P. J., and Johnson, L. A., eds., 2003, Corn chemistry and technology (2nd edn.): Am.
Assoc. Cereal Chemists, St. Paul, Minnesota, 892 p.
Wilcox, C.J. 1992. Large dairy herd management. American Diary Science Association, 309,
West Clark Street, Champaign, IL 61820.
Wolf, D.P. and A.R. Hallauer. 1977. Triple test cross analysis to detect epistasis in maize. Crop
Sci., 37: 763-770.
Wright, S. 1980. Genic and organismic selection. Evolution 34: 825-843.
Yan, J., C. Kandianis, C.E.Harjes, L. Bai, E. Kim, X. Yang, D.J. Skinner, Z. Fu, S.E. Mitchell,
Q.B. Li, M.G. Fernandez, M. Zaharieva, R. Babu, Y. Fu, N. Palacios-Rojas, J.S. Li, D.
DellaPenna, T.P. Brutnell, E. Buckler, M.L. Warburton, T.R. Rocheford. 2010. Rare
genetic variation at Zea mays crtRB1 increases β-carotene in maize grain. Nat.
Gen. 42(4):322-327.
Yosuf, N., M. Habib, Z.A. Dar, A.A. Lone, M.A. Wani, A. Gazal and S. Gulzar. 2014. Heterosis
for grain yield and its component traits in single cross hybrids of maize (Zea mays L.).
Plant Archives 14(2): 773-777.
Zaidi, P.H., P.M. Selven, R. Sultana, A. Srivastava, A.K. Singh, G. Srinivasan, R.R. Singh and
P.P. Singh. 2007. Association between line per se and hybrid performance under
201
excessive soil moisture stress in tropical maize (Zee mays L.). Field Crop Res. 101: 117-
126.
Zare, M., R. Choukan, M.R. Bihamta, E.M. Heravan, and M.M. Kamelmanesh. 2011. Gene
action for some agronomic traits in maize (Zea mays L.). Crop Breed. J. 1(2): 133-141.
Zeeshan, M., M. Ahsan, W. Arshad, S. Ali, M. Hussain and M.I. Khan. 2013. Estimate of
correlated responses for some polygenic parameters in yellow maize (Zea mays L.)
hybrids. Int. J. Adv. Res. 1(5): 24-29.
Ziegler, K.E. 2001. Popcorn. In: Hallauer AR (ed) Specialty Corns. CRC Press, USA. pp. 199-
234.
Zivanovic, T., G. Brankovic and S. Radanovic, 2010. Combining abilities of maize inbred lines
for grain yield and yield components. Genetika, 42: 565-574.
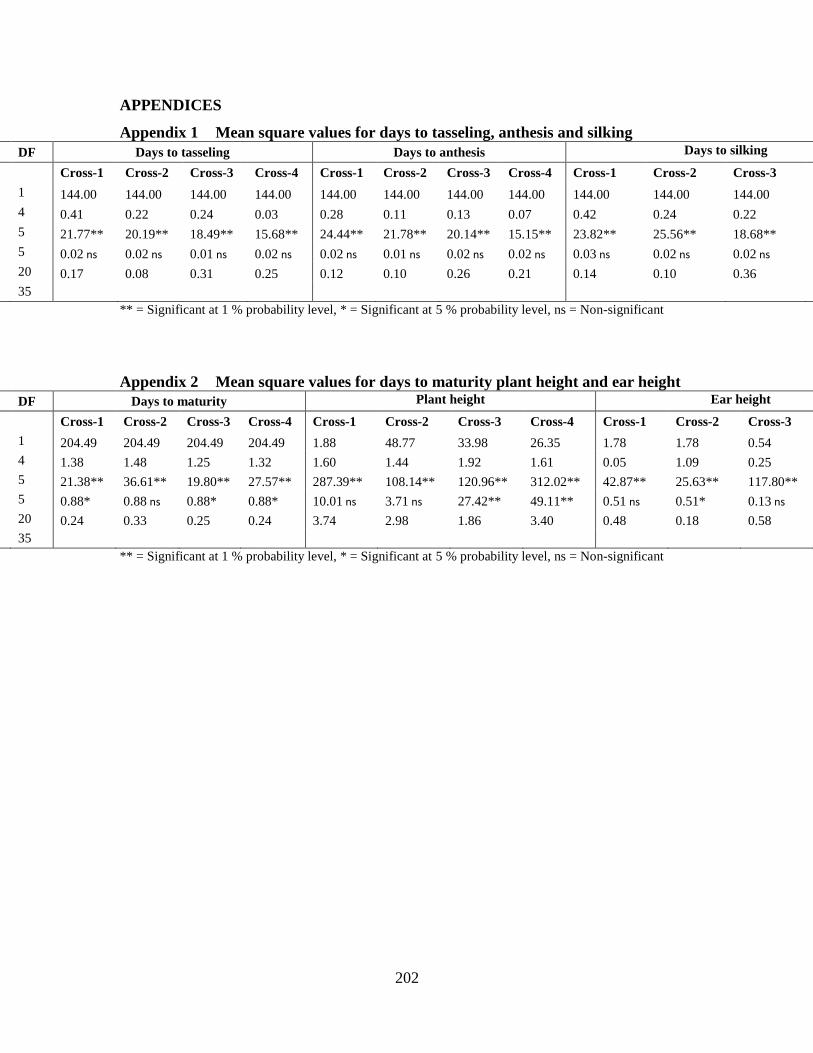
202
APPENDICES
Appendix 1 Mean square values for days to tasseling, anthesis and silking
SOV DF Days to tasseling Days to anthesis Days to silking
Cross-1 Cross-2 Cross-3 Cross-4 Cross-1 Cross-2 Cross-3 Cross-4 Cross-1 Cross-2 Cross-3 Cross-4
Loc 1 144.00 144.00 144.00 144.00 144.00 144.00 144.00 144.00 144.00 144.00 144.00 144.00
Rep/Loc 4 0.41 0.22 0.24 0.03 0.28 0.11 0.13 0.07 0.42 0.24 0.22 0.05
Gen 5 21.77** 20.19** 18.49** 15.68** 24.44** 21.78** 20.14** 15.15** 23.82** 25.56** 18.68** 17.53**
G × L 5 0.02 ns 0.02 ns 0.01 ns 0.02 ns 0.02 ns 0.01 ns 0.02 ns 0.02 ns 0.03 ns 0.02 ns 0.02 ns 0.02 ns
Error 20 0.17 0.08 0.31 0.25 0.12 0.10 0.26 0.21 0.14 0.10 0.36 0.37
Total 35
** = Significant at 1 % probability level, * = Significant at 5 % probability level, ns = Non-significant
Appendix 2 Mean square values for days to maturity plant height and ear height
SOV DF Days to maturity Plant height Ear height
Cross-1 Cross-2 Cross-3 Cross-4 Cross-1 Cross-2 Cross-3 Cross-4 Cross-1 Cross-2 Cross-3 Cross-4
Loc 1 204.49 204.49 204.49 204.49 1.88 48.77 33.98 26.35 1.78 1.78 0.54 0.22
Rep/Loc 4 1.38 1.48 1.25 1.32 1.60 1.44 1.92 1.61 0.05 1.09 0.25 0.76
Gen 5 21.38** 36.61** 19.80** 27.57** 287.39** 108.14** 120.96** 312.02** 42.87** 25.63** 117.80** 128.38**
G × L 5 0.88* 0.88 ns 0.88* 0.88* 10.01 ns 3.71 ns 27.42** 49.11** 0.51 ns 0.51* 0.13 ns 0.19 ns
Error 20 0.24 0.33 0.25 0.24 3.74 2.98 1.86 3.40 0.48 0.18 0.58 1.04
Total 35
** = Significant at 1 % probability level, * = Significant at 5 % probability level, ns = Non-significant
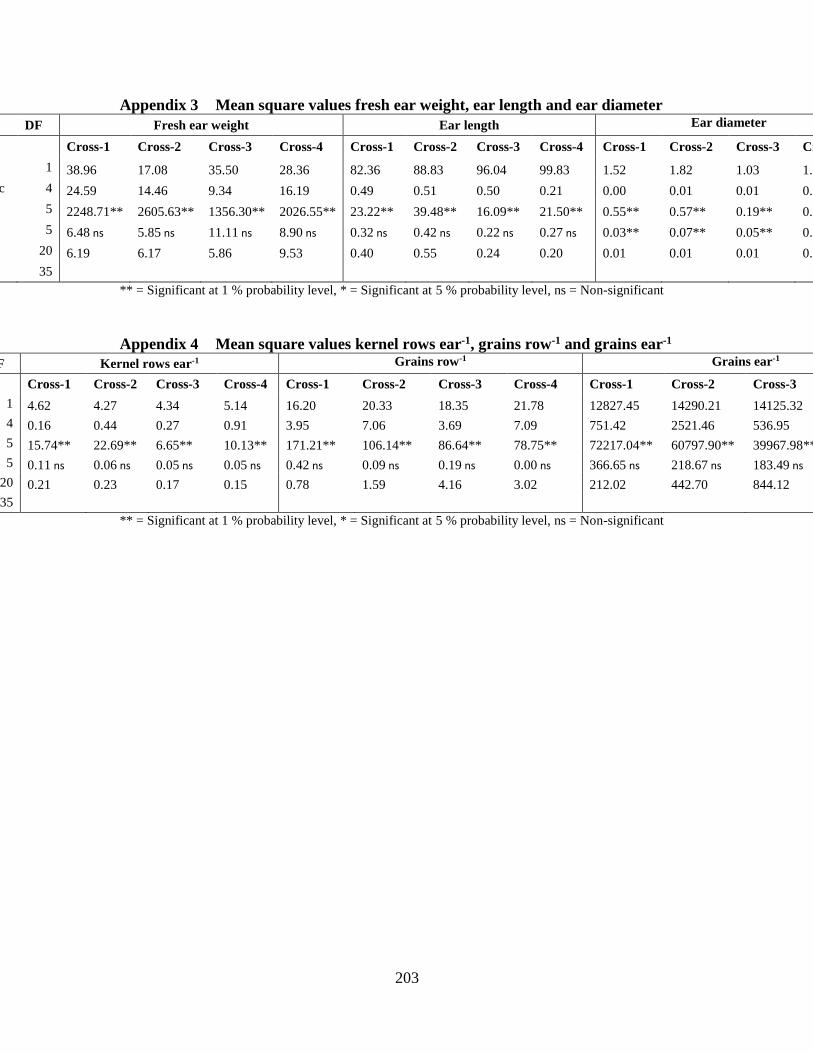
203
Appendix 3 Mean square values fresh ear weight, ear length and ear diameter
SOV DF Fresh ear weight Ear length Ear diameter
Cross-1 Cross-2 Cross-3 Cross-4 Cross-1 Cross-2 Cross-3 Cross-4 Cross-1 Cross-2 Cross-3 Cross-4
Loc 1 38.96 17.08 35.50 28.36 82.36 88.83 96.04 99.83 1.52 1.82 1.03 1.29
Rep/Loc 4 24.59 14.46 9.34 16.19 0.49 0.51 0.50 0.21 0.00 0.01 0.01 0.01
Gen 5 2248.71** 2605.63** 1356.30** 2026.55** 23.22** 39.48** 16.09** 21.50** 0.55** 0.57** 0.19** 0.68**
G × L 5 6.48 ns 5.85 ns 11.11 ns 8.90 ns 0.32 ns 0.42 ns 0.22 ns 0.27 ns 0.03** 0.07** 0.05** 0.10**
Error 20 6.19 6.17 5.86 9.53 0.40 0.55 0.24 0.20 0.01 0.01 0.01 0.01
Total 35
** = Significant at 1 % probability level, * = Significant at 5 % probability level, ns = Non-significant
Appendix 4 Mean square values kernel rows ear-1, grains row-1 and grains ear-1
SOV DF Kernel rows ear-1 Grains row-1 Grains ear-1
Cross-1 Cross-2 Cross-3 Cross-4 Cross-1 Cross-2 Cross-3 Cross-4 Cross-1 Cross-2 Cross-3 Cross-4
Loc 1 4.62 4.27 4.34 5.14 16.20 20.33 18.35 21.78 12827.45 14290.21 14125.32 15775.36
Rep/Loc 4 0.16 0.44 0.27 0.91 3.95 7.06 3.69 7.09 751.42 2521.46 536.95 3291.37
Gen 5 15.74** 22.69** 6.65** 10.13** 171.21** 106.14** 86.64** 78.75** 72217.04** 60797.90** 39967.98** 40541.69**
G × L 5 0.11 ns 0.06 ns 0.05 ns 0.05 ns 0.42 ns 0.09 ns 0.19 ns 0.00 ns 366.65 ns 218.67 ns 183.49 ns 166.32 ns
Error 20 0.21 0.23 0.17 0.15 0.78 1.59 4.16 3.02 212.02 442.70 844.12 455.60
Total 35
** = Significant at 1 % probability level, * = Significant at 5 % probability level, ns = Non-significant
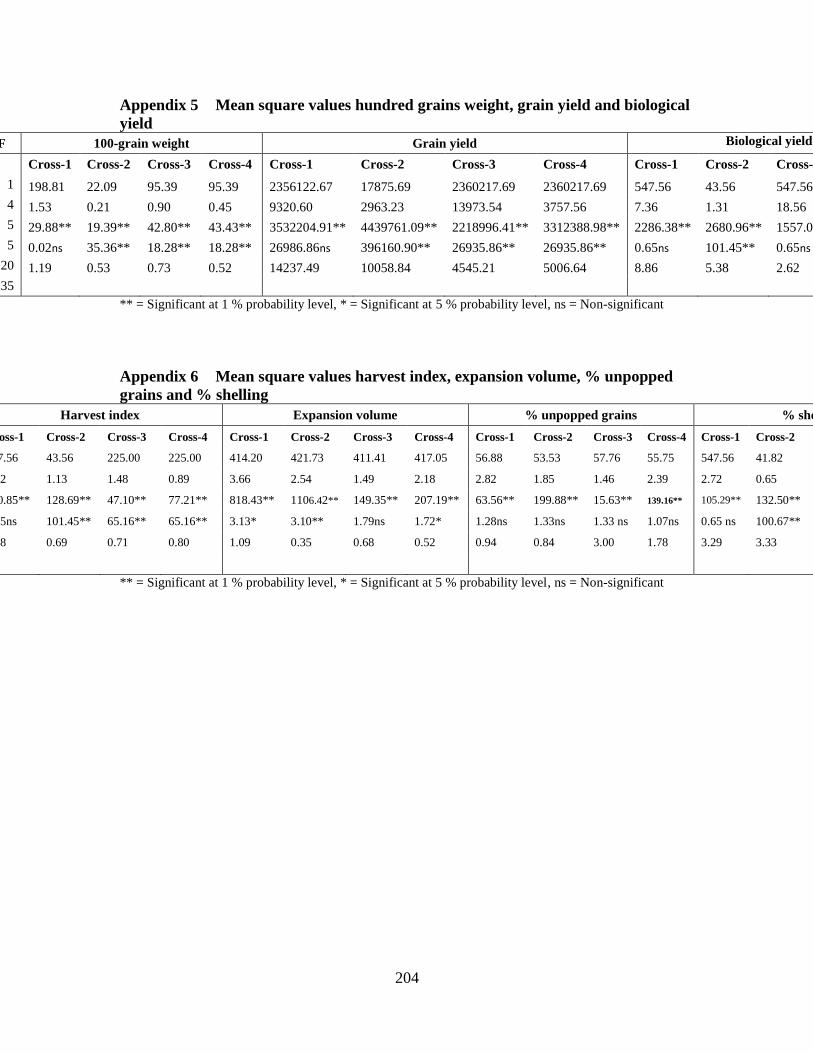
204
Appendix 5 Mean square values hundred grains weight, grain yield and biological
yield
SOV DF 100-grain weight Grain yield Biological yield
Cross-1 Cross-2 Cross-3 Cross-4 Cross-1 Cross-2 Cross-3 Cross-4 Cross-1 Cross-2 Cross-3 Cross-4
Loc 1 198.81 22.09 95.39 95.39 2356122.67 17875.69 2360217.69 2360217.69 547.56 43.56 547.56 547.56
Rep/Loc 4 1.53 0.21 0.90 0.45 9320.60 2963.23 13973.54 3757.56 7.36 1.31 18.56 14.26
Gen 5 29.88** 19.39** 42.80** 43.43** 3532204.91** 4439761.09** 2218996.41** 3312388.98** 2286.38** 2680.96** 1557.02** 2068.24**
G × L 5 0.02ns 35.36** 18.28** 18.28** 26986.86ns 396160.90** 26935.86** 26935.86** 0.65ns 101.45** 0.65ns 0.65ns
Error 20 1.19 0.53 0.73 0.52 14237.49 10058.84 4545.21 5006.64 8.86 5.38 2.62 6.92
Total 35
** = Significant at 1 % probability level, * = Significant at 5 % probability level, ns = Non-significant
Appendix 6 Mean square values harvest index, expansion volume, % unpopped
grains and % shelling
SOV DF Harvest index Expansion volume % unpopped grains % shelling
Cross-1 Cross-2 Cross-3 Cross-4 Cross-1 Cross-2 Cross-3 Cross-4 Cross-1 Cross-2 Cross-3 Cross-4 Cross-1 Cross-2 Cross-3 Cross-4
Loc 1 547.56 43.56 225.00 225.00 414.20 421.73 411.41 417.05 56.88 53.53 57.76 55.75 547.56 41.82 225.00 225.00
Rep/Loc 4 0.92 1.13 1.48 0.89 3.66 2.54 1.49 2.18 2.82 1.85 1.46 2.39 2.72 0.65 1.33 8.81
Gen 5 100.85** 128.69** 47.10** 77.21** 818.43** 1106.42** 149.35** 207.19** 63.56** 199.88** 15.63** 139.16** 105.29** 132.50** 72.82** 67.40**
G × L 5 0.65ns 101.45** 65.16** 65.16** 3.13* 3.10** 1.79ns 1.72* 1.28ns 1.33ns 1.33 ns 1.07ns 0.65 ns 100.67** 65.16** 65.16**
Error 20 0.78 0.69 0.71 0.80 1.09 0.35 0.68 0.52 0.94 0.84 3.00 1.78 3.29 3.33 9.35 2.44
Total 35
** = Significant at 1 % probability level, * = Significant at 5 % probability level, ns = Non-significant
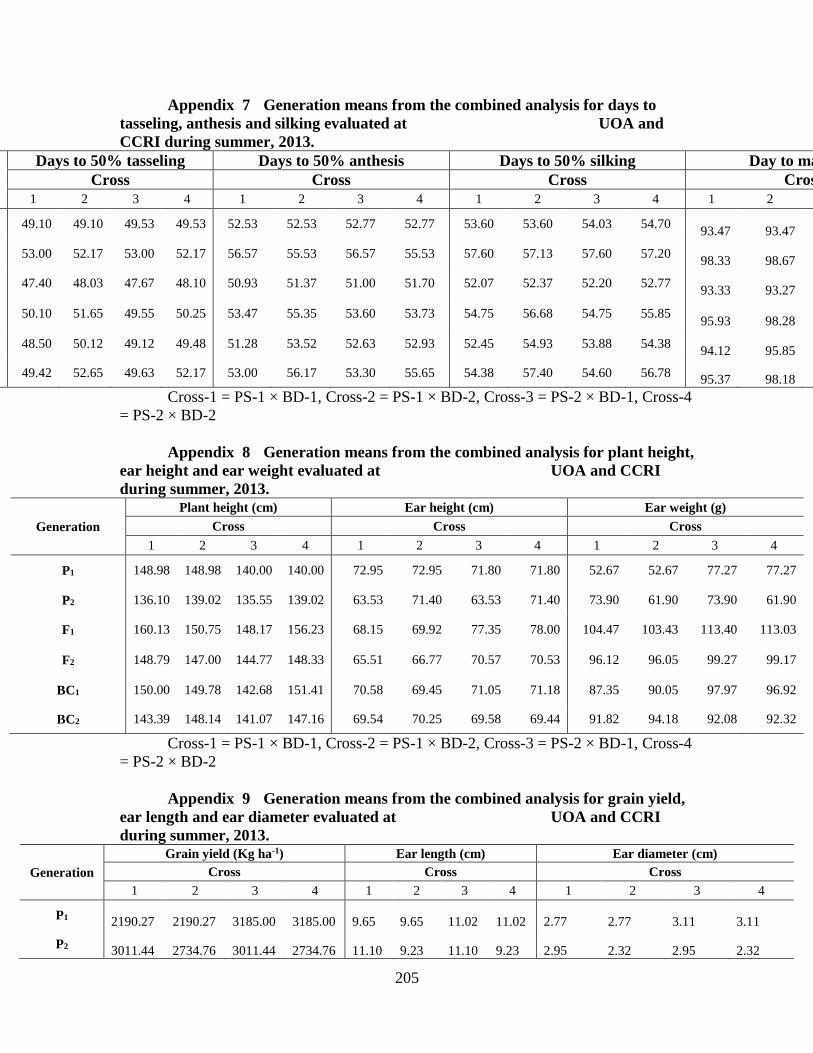
205
Appendix 7 Generation means from the combined analysis for days to
tasseling, anthesis and silking evaluated at UOA and
CCRI during summer, 2013.
Generation
Days to 50% tasseling Days to 50% anthesis Days to 50% silking Day to maturity
Cross Cross Cross Cross
1 2 3 4 1 2 3 4 1 2 3 4 1 2 3 4
P1 49.10 49.10 49.53 49.53 52.53 52.53 52.77 52.77 53.60 53.60 54.03 54.70 93.47 93.47 93.33 93.33
P2 53.00 52.17 53.00 52.17 56.57 55.53 56.57 55.53 57.60 57.13 57.60 57.20 98.33 98.67 98.33 98.67
F1 47.40 48.03 47.67 48.10 50.93 51.37 51.00 51.70 52.07 52.37 52.20 52.77 93.33 93.27 93.60 93.87
F2 50.10 51.65 49.55 50.25 53.47 55.35 53.60 53.73 54.75 56.68 54.75 55.85 95.93 98.28 95.85 97.07
BC1 48.50 50.12 49.12 49.48 51.28 53.52 52.63 52.93 52.45 54.93 53.88 54.38 94.12 95.85 94.88 95.35
BC2 49.42 52.65 49.63 52.17 53.00 56.17 53.30 55.65 54.38 57.40 54.60 56.78 95.37 98.18 95.57 97.67
Cross-1 = PS-1 × BD-1, Cross-2 = PS-1 × BD-2, Cross-3 = PS-2 × BD-1, Cross-4
= PS-2 × BD-2
Appendix 8 Generation means from the combined analysis for plant height,
ear height and ear weight evaluated at UOA and CCRI
during summer, 2013.
Generation
Plant height (cm) Ear height (cm) Ear weight (g)
Cross Cross Cross
1 2 3 4 1 2 3 4 1 2 3 4
P1 148.98 148.98 140.00 140.00 72.95 72.95 71.80 71.80 52.67 52.67 77.27 77.27
P2 136.10 139.02 135.55 139.02 63.53 71.40 63.53 71.40 73.90 61.90 73.90 61.90
F1 160.13 150.75 148.17 156.23 68.15 69.92 77.35 78.00 104.47 103.43 113.40 113.03
F2 148.79 147.00 144.77 148.33 65.51 66.77 70.57 70.53 96.12 96.05 99.27 99.17
BC1 150.00 149.78 142.68 151.41 70.58 69.45 71.05 71.18 87.35 90.05 97.97 96.92
BC2 143.39 148.14 141.07 147.16 69.54 70.25 69.58 69.44 91.82 94.18 92.08 92.32
Cross-1 = PS-1 × BD-1, Cross-2 = PS-1 × BD-2, Cross-3 = PS-2 × BD-1, Cross-4
= PS-2 × BD-2
Appendix 9 Generation means from the combined analysis for grain yield,
ear length and ear diameter evaluated at UOA and CCRI
during summer, 2013.
Generation
Grain yield (Kg ha-1) Ear length (cm) Ear diameter (cm)
Cross Cross Cross
1 2 3 4 1 2 3 4 1 2 3 4
P1 2190.27 2190.27 3185.00 3185.00 9.65 9.65 11.02 11.02 2.77 2.77 3.11 3.11
P2 3011.44 2734.76 3011.44 2734.76 11.10 9.23 11.10 9.23 2.95 2.32 2.95 2.32
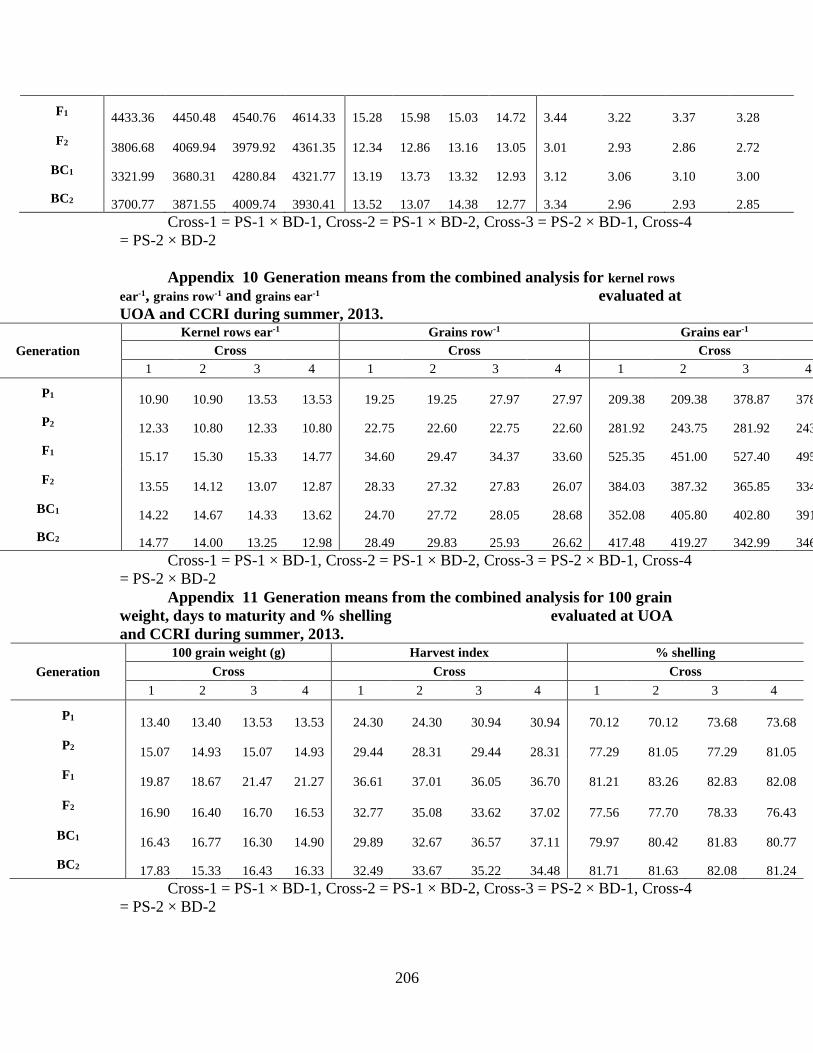
206
F1 4433.36 4450.48 4540.76 4614.33 15.28 15.98 15.03 14.72 3.44 3.22 3.37 3.28
F2 3806.68 4069.94 3979.92 4361.35 12.34 12.86 13.16 13.05 3.01 2.93 2.86 2.72
BC1 3321.99 3680.31 4280.84 4321.77 13.19 13.73 13.32 12.93 3.12 3.06 3.10 3.00
BC2 3700.77 3871.55 4009.74 3930.41 13.52 13.07 14.38 12.77 3.34 2.96 2.93 2.85
Cross-1 = PS-1 × BD-1, Cross-2 = PS-1 × BD-2, Cross-3 = PS-2 × BD-1, Cross-4
= PS-2 × BD-2
Appendix 10 Generation means from the combined analysis for kernel rows
ear-1, grains row-1 and grains ear-1 evaluated at
UOA and CCRI during summer, 2013.
Generation
Kernel rows ear-1 Grains row-1 Grains ear-1
Cross Cross Cross
1 2 3 4 1 2 3 4 1 2 3 4
P1 10.90 10.90 13.53 13.53 19.25 19.25 27.97 27.97 209.38 209.38 378.87 378.87
P2 12.33 10.80 12.33 10.80 22.75 22.60 22.75 22.60 281.92 243.75 281.92 243.75
F1 15.17 15.30 15.33 14.77 34.60 29.47 34.37 33.60 525.35 451.00 527.40 495.85
F2 13.55 14.12 13.07 12.87 28.33 27.32 27.83 26.07 384.03 387.32 365.85 334.07
BC1 14.22 14.67 14.33 13.62 24.70 27.72 28.05 28.68 352.08 405.80 402.80 391.13
BC2 14.77 14.00 13.25 12.98 28.49 29.83 25.93 26.62 417.48 419.27 342.99 346.33
Cross-1 = PS-1 × BD-1, Cross-2 = PS-1 × BD-2, Cross-3 = PS-2 × BD-1, Cross-4
= PS-2 × BD-2
Appendix 11 Generation means from the combined analysis for 100 grain
weight, days to maturity and % shelling evaluated at UOA
and CCRI during summer, 2013.
Generation
100 grain weight (g) Harvest index % shelling
Cross Cross Cross
1 2 3 4 1 2 3 4 1 2 3 4
P1 13.40 13.40 13.53 13.53 24.30 24.30 30.94 30.94 70.12 70.12 73.68 73.68
P2 15.07 14.93 15.07 14.93 29.44 28.31 29.44 28.31 77.29 81.05 77.29 81.05
F1 19.87 18.67 21.47 21.27 36.61 37.01 36.05 36.70 81.21 83.26 82.83 82.08
F2 16.90 16.40 16.70 16.53 32.77 35.08 33.62 37.02 77.56 77.70 78.33 76.43
BC1 16.43 16.77 16.30 14.90 29.89 32.67 36.57 37.11 79.97 80.42 81.83 80.77
BC2 17.83 15.33 16.43 16.33 32.49 33.67 35.22 34.48 81.71 81.63 82.08 81.24
Cross-1 = PS-1 × BD-1, Cross-2 = PS-1 × BD-2, Cross-3 = PS-2 × BD-1, Cross-4
= PS-2 × BD-2
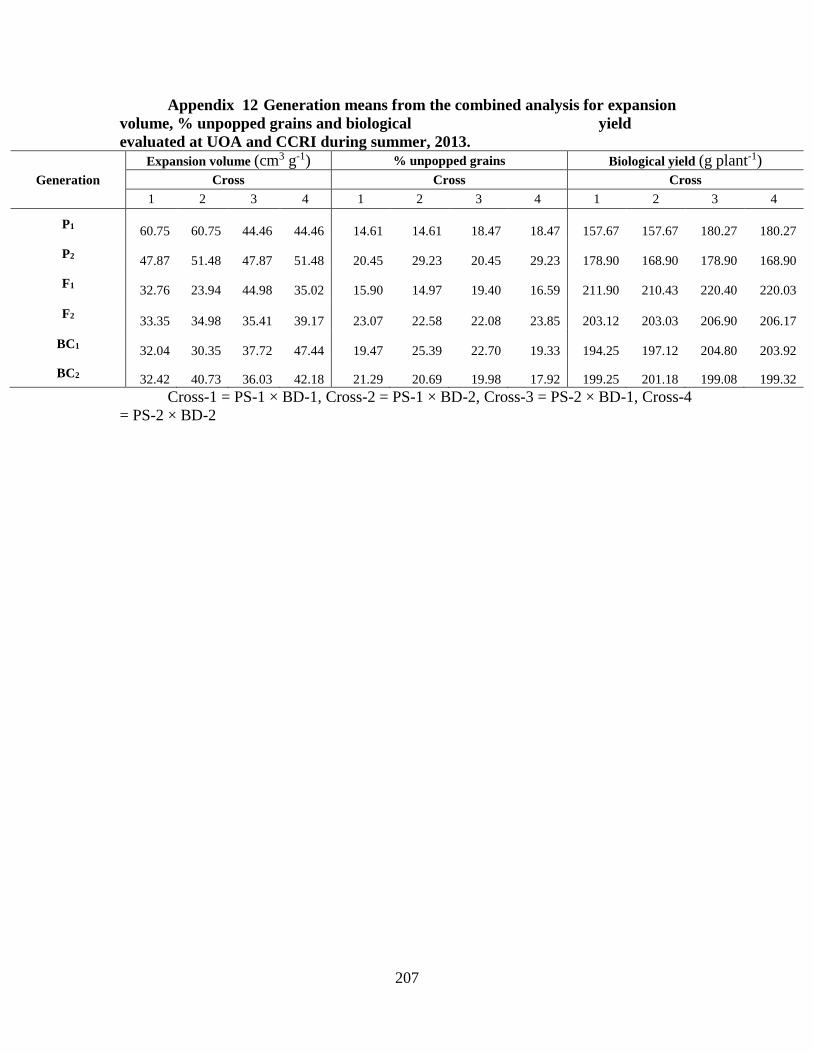
207
Appendix 12 Generation means from the combined analysis for expansion
volume, % unpopped grains and biological yield
evaluated at UOA and CCRI during summer, 2013.
Generation
Expansion volume (cm3 g-1) % unpopped grains Biological yield (g plant-1)
Cross Cross Cross
1 2 3 4 1 2 3 4 1 2 3 4
P1 60.75 60.75 44.46 44.46 14.61 14.61 18.47 18.47 157.67 157.67 180.27 180.27
P2 47.87 51.48 47.87 51.48 20.45 29.23 20.45 29.23 178.90 168.90 178.90 168.90
F1 32.76 23.94 44.98 35.02 15.90 14.97 19.40 16.59 211.90 210.43 220.40 220.03
F2 33.35 34.98 35.41 39.17 23.07 22.58 22.08 23.85 203.12 203.03 206.90 206.17
BC1 32.04 30.35 37.72 47.44 19.47 25.39 22.70 19.33 194.25 197.12 204.80 203.92
BC2 32.42 40.73 36.03 42.18 21.29 20.69 19.98 17.92 199.25 201.18 199.08 199.32
Cross-1 = PS-1 × BD-1, Cross-2 = PS-1 × BD-2, Cross-3 = PS-2 × BD-1, Cross-4
= PS-2 × BD-2