Embed Size (px)
Citation preview
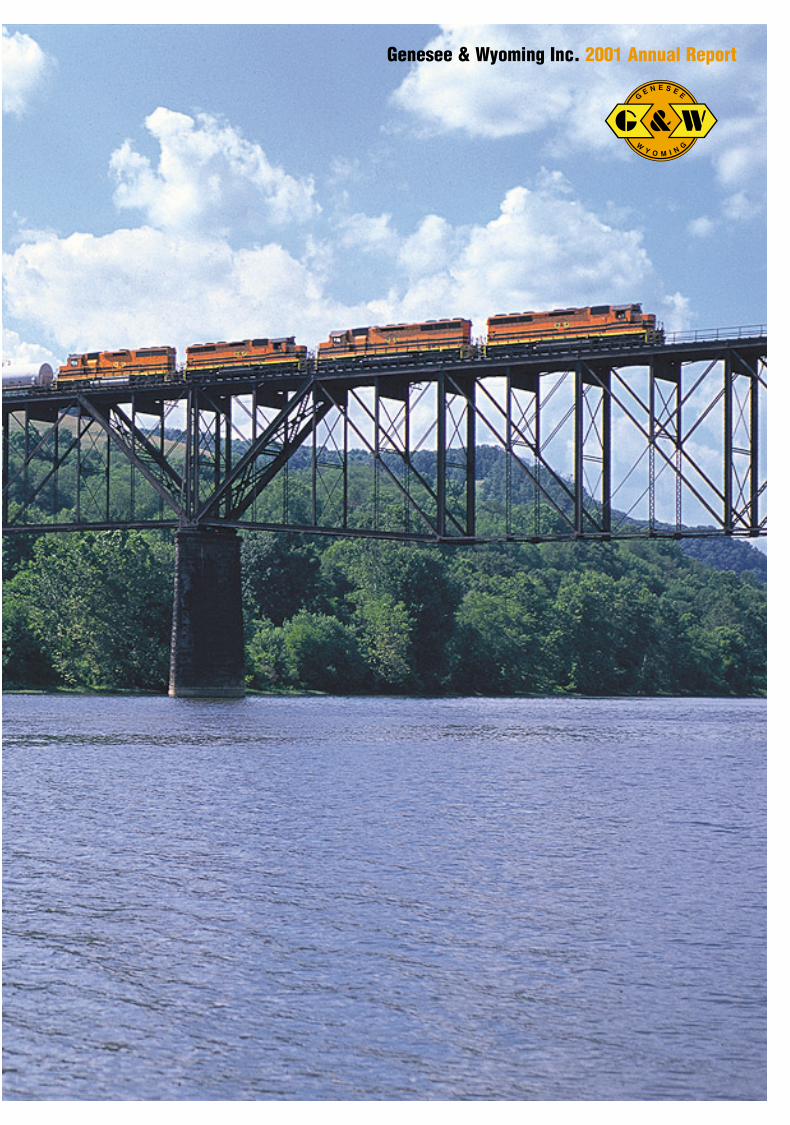
Genesee & Wyoming Inc. 2001 Annual Report

Financial Highlights
(in thousands, except per share data) Years Ended December 31
Income Statement Data
Operating revenues $173,576 $206,530Operating income $22,140 $23,753Net income $19,084 $13,932Diluted earnings per common share $1.48 $1.38Weighted average number
of shares of common stock–diluted 12,917 10,094
Balance Sheet Data as of Period End
Total assets $402,519 $338,383Total debt $60,591 $104,801Redeemable Convertible Preferred Stock $23,808 $18,849Stockholders’ equity $185,663 $94,732
2001 2000
1998 1999 2000 2001
Net Income(in thousands)
$20
$15
$10
$5
$0
$11,434
$12,533$13,932
$19,084
1998 1999 2000 2001
$1.23
$1.38
Diluted Earnings(per share)
$1.50
$1.00
$.50
$0
$0.97
$1.48
2001 Net Income by Geography
North America 53.6%
South America 2.1%
44.3% Australia
2 ❘ Genesee & Wyoming Inc.
Cover: A mixed consist on the Mosgrove Bridge heads over the Allegheny River in GWI’s New York/Pennsylvania
region. This line interchanges with all major eastern Class I railroads in the United States and Canada.

Mortimer B. Fuller III
Chairman of the Board of Directors
and Chief Executive Officer
To Our Shareholders
By nearly every measure, 2001 was an exceptional year for Genesee & Wyoming Inc.
(GWI). We once again achieved record earnings, supported by the successful inte-
gration of our Australian joint venture and by steady performance in North America
in a difficult economic environment. We made two acquisitions in North America as
we continued to build our regional rail systems. Then, in December we completed a
well-received secondary stock offering, the proceeds of which paid down debt and
expanded our acquisition capacity. These accomplishments were the result of our
continued execution of a focused strategy to be the best in our industry as measured
by our customers and shareholders.
Delivering Record Results in a Difficult Economy Our 2001 strategic efforts, combined with strong shipments from our Australian
customer base, drove dramatic improvement in GWI’s financial results — a notable
achievement given the general economic softness that characterized the American,
Canadian and Mexican markets in 2001. Our net income rose 37 percent to a record
$19.1 million from $13.9 million at year-end 2000. Diluted earnings per share
increased to a record $1.48 on 12.9 million shares, a 7.2 percent increase from
$1.38 on 10.1 million shares at the close of the prior year. We continue to have a
solid performance record, with a five-year compounded annual growth rate in earn-
ings per share of 22.8 percent. Backing up our 2001 earnings, free cash flow was an
impressive $16.3 million. Reflecting the deconsolidation of the Australia Southern
Railroad (ASR), revenues declined to $173.6 million, compared with $206.5 million
in 2000.
We also worked hard during 2001 to expand our ownership base, increase the
liquidity of our stock, and provide capital to support our future growth. We executed
a three-for-two stock split, completed the funding of convertible preferred stock with
Brown Brothers Harriman & Co., and completed the secondary public offering of
common stock, using the $67.5 million in proceeds to reduce bank debt. The price
of our common stock increased 79 percent to a split-adjusted $21.77 at year-end
2001 from $12.16 at the end of the prior year, while our market capitalization grew
308 percent to $378 million at year-end 2001 from $123 million at the close of
2000. After several years of having been overlooked in the “dot-com” era, the mar-
ket’s recognition of GWI, as reflected in this increase in value, is gratifying. We have
Above: Newly painted locomotives
in the Australia Northern Railroad
(ANR) livery are ready to begin
hauling loads of construction
materials on the Asia Pacific
Transport Consortium’s Alice
Springs-to-Darwin project.
ARG is the contract rail operator
supplying all crewing and
rollingstock required in the initial
construction phase and will
manage the freight business
following the project’s completion.
This approximately 885-mile
construction project, expected to
continue into 2004, is the last link
in the Australian North-South
transcontinental rail system.
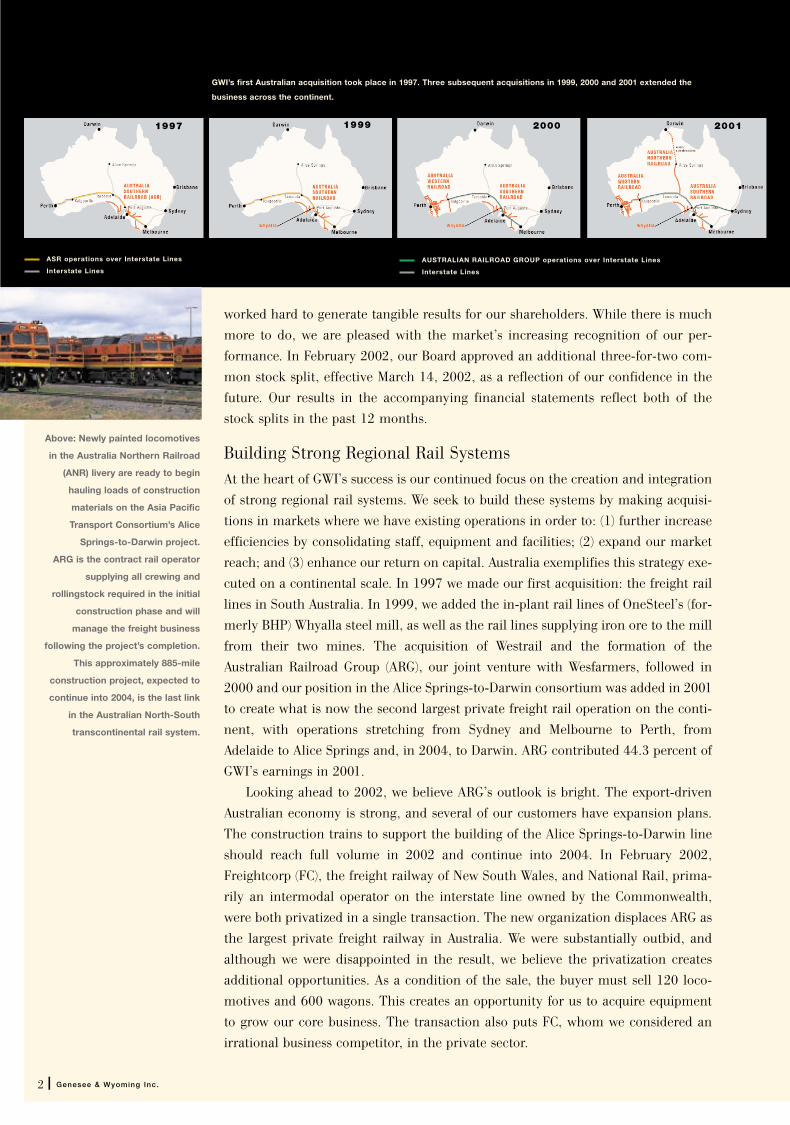
GWI’s first Australian acquisition took place in 1997. Three subsequent acquisitions in 1999, 2000 and 2001 extended the
business across the continent.
ASR operations over Interstate Lines
Interstate Lines
AUSTRALIAN RAILROAD GROUP operations over Interstate Lines
Interstate Lines
1997 1999 2000 2001
2 ❘ Genesee & Wyoming Inc.
worked hard to generate tangible results for our shareholders. While there is much
more to do, we are pleased with the market’s increasing recognition of our per-
formance. In February 2002, our Board approved an additional three-for-two com-
mon stock split, effective March 14, 2002, as a reflection of our confidence in the
future. Our results in the accompanying financial statements reflect both of the
stock splits in the past 12 months.
Building Strong Regional Rail SystemsAt the heart of GWI’s success is our continued focus on the creation and integration
of strong regional rail systems. We seek to build these systems by making acquisi-
tions in markets where we have existing operations in order to: (1) further increase
efficiencies by consolidating staff, equipment and facilities; (2) expand our market
reach; and (3) enhance our return on capital. Australia exemplifies this strategy exe-
cuted on a continental scale. In 1997 we made our first acquisition: the freight rail
lines in South Australia. In 1999, we added the in-plant rail lines of OneSteel’s (for-
merly BHP) Whyalla steel mill, as well as the rail lines supplying iron ore to the mill
from their two mines. The acquisition of Westrail and the formation of the
Australian Railroad Group (ARG), our joint venture with Wesfarmers, followed in
2000 and our position in the Alice Springs-to-Darwin consortium was added in 2001
to create what is now the second largest private freight rail operation on the conti-
nent, with operations stretching from Sydney and Melbourne to Perth, from
Adelaide to Alice Springs and, in 2004, to Darwin. ARG contributed 44.3 percent of
GWI’s earnings in 2001.
Looking ahead to 2002, we believe ARG’s outlook is bright. The export-driven
Australian economy is strong, and several of our customers have expansion plans.
The construction trains to support the building of the Alice Springs-to-Darwin line
should reach full volume in 2002 and continue into 2004. In February 2002,
Freightcorp (FC), the freight railway of New South Wales, and National Rail, prima-
rily an intermodal operator on the interstate line owned by the Commonwealth,
were both privatized in a single transaction. The new organization displaces ARG as
the largest private freight railway in Australia. We were substantially outbid, and
although we were disappointed in the result, we believe the privatization creates
additional opportunities. As a condition of the sale, the buyer must sell 120 loco-
motives and 600 wagons. This creates an opportunity for us to acquire equipment
to grow our core business. The transaction also puts FC, whom we considered an
irrational business competitor, in the private sector.
During 2001, we announced two important additional acquisitions in North America
that exemplify our strategy of building regional rail systems:
In September, we acquired the South Buffalo Railway (SBR), a switching railroad
near Buffalo, New York, that, in addition to connecting to our New York/Penn-
sylvania region, provides new access to bulk transload opportunities on Lake
Erie. The seamless integration of SBR into GWI’s existing operations contributed
substantially to our strong fourth quarter results in 2001.
In December, we announced the acquisition of Emons Transportation, a short-
line railroad holding company. The transaction was completed on February 22,
2002. The St. Lawrence & Atlantic Railroad, which accounts for 75 percent of
Emons’ revenue, complements our existing operations in Canada, and will be
integrated into GWI’s Canadian region in 2002. The balance of Emon’s business
fits well with our railroad switching operations. In addition, Emons brings
expertise in intermodal and rail warehousing operations.
We also build our regional rail systems by improving operating efficiencies and
adding new customers. In a weak North American economy, cost controls were par-
ticularly important in 2001. In addition, three new customers helped to stabilize our
revenues and to provide a foundation for future growth. The first new coal mine in
decades opened in the NY/PA region late in the first quarter. The same region also
began shipping rock salt in the second half of 2001 from American Rock Salt’s new
mine, which should become a major customer once initial production settles down.
And in Mexico, as a result of our service reliability and improved track, Ford Motor
Company began moving vehicles by rail, taking the business off the highway.
Genesee & Wyoming Inc. ❘ 3
CANADA
USA
Caledonia
Retsof
Lake Ontario
Lake Er ie
Buffalo
Rochester
Pennsylvania
New York
Pennsylvania
New York
CANADA
USA
Le RoyCaledonia
RetsofMt. Morris
Dansville
Lake Ontario
Lake Er ie
Silver Springs
Buffalo
Rochester CANADA
USA
Dubois
Machias
Owen
Caledonia
Ridgway
Retsof
Dansville
Homer CityClarksburg
Eidenau
Bradford
Johnsonburg
NewCastle
Lake Ontario
Lake Er ieSilver Springs
Buffalo
Rochester
Mt. Jewett
Punxsutawney
Butler
Pennsylvania
New York
Machias
Brockway
Erie
Emporium
Corry
Kane
Warren
St. Marys
CANADA
USA
Dubois
Machias
Caledonia
Ridgway
Retsof
Dansville
Homer CityClarksburg
Eidenau
Bradford
Johnsonburg
NewCastle
Lake Ontario
Lake Er ieSilver Springs
Buffalo
Rochester
Mt. Jewett
Punxsutawney
Butler
Pennsylvania
New York
Brockway Driftwood Dubois
Brockway
Sligo
Kittanning
PenfieldBrookville
Dora
Erie
Emporium
Corry
Kane
Warren
St. Marys
CANADA
USAMachias
Caledonia
Ridgway
Retsof
Dansville
Karns City
BruinPetrolia
Karns City
BruinPetrolia
Karns City
BruinPetrolia
Eidenau
Bradford
Johnsonburg
NewCastle
Lake Ontario
Lake Er ieSilver Springs
Buffalo
Rochester
Mt. Jewett
Punxsutawney
Butler
Pennsylvania
New York
Reesedale
Freeport
Le Roy
E. SalamancaE. Salamanca E. Salamanca
West Valley
Ashford Jct.
Orchard Park
Marion Center
Ashford Jct.
Driftwood Dubois
Brockway
Sligo
Kittanning
PenfieldBrookville
Dora
Erie
Emporium
Corry
Kane
Warren
St. Marys
CANADA
USAMachias
Caledonia
Ridgway
Retsof
Dansville
Karns City
BruinPetrolia
Eidenau
Bradford
Johnsonburg
NewCastle
Lake Ontario
Lake Er ieSilver Springs
Buffalo
Rochester
Mt. Jewett
Punxsutawney
Butler
Pennsylvania
New York
Reesedale
Freeport
Le Roy
E. Salamanca
West Valley
Orchard Park
Marion Center
Ashford Jct.
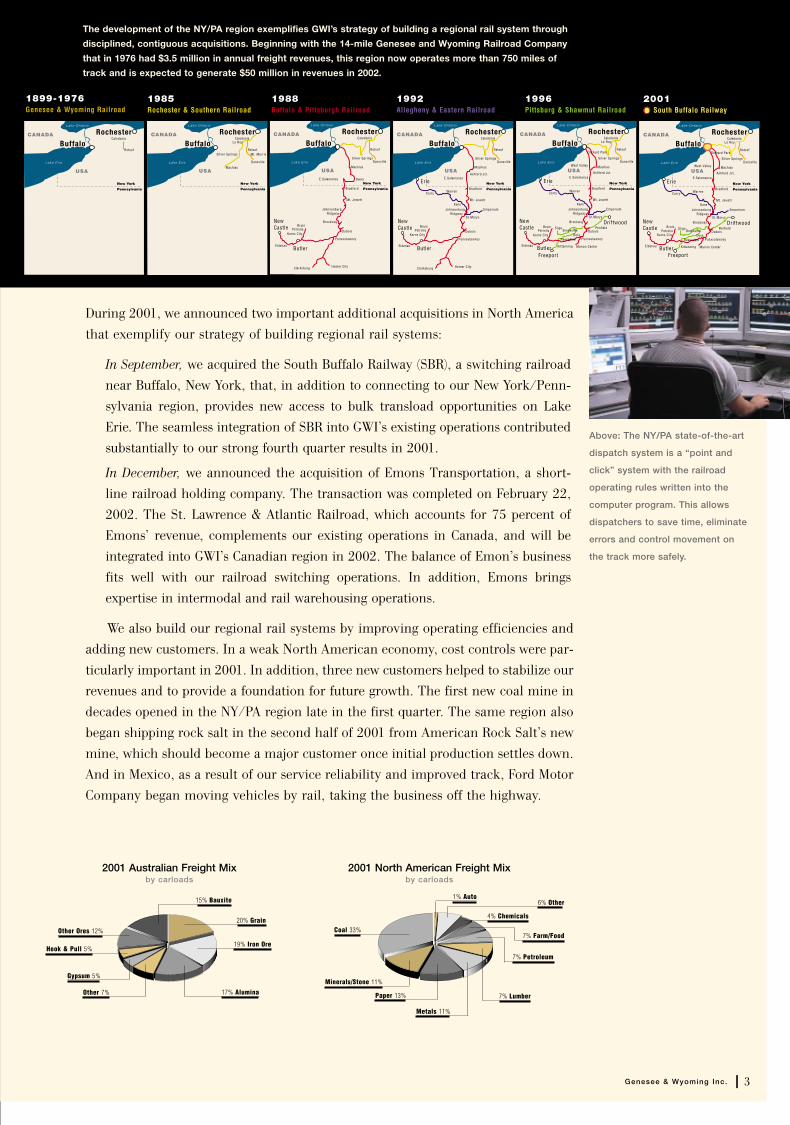
The development of the NY/PA region exemplifies GWI’s strategy of building a regional rail system through
disciplined, contiguous acquisitions. Beginning with the 14-mile Genesee and Wyoming Railroad Company
that in 1976 had $3.5 million in annual freight revenues, this region now operates more than 750 miles of
track and is expected to generate $50 million in revenues in 2002.
1899-1976 Genesee & Wyoming Railroad
1985Rochester & Southern Railroad
1988Buffalo & Pittsburgh Railroad
1992Allegheny & Eastern Railroad
1996Pittsburg & Shawmut Railroad
2001South Buffalo Railway
2001 Australian Freight Mixby carloads
19% Iron Ore
Other Ores 12%
Hook & Pull 5%
Other 7%
20% Grain
15% Bauxite
17% Alumina
Coal 33%
1% Auto6% Other
4% Chemicals
7% Farm/Food
7% Petroleum
2001 North American Freight Mixby carloads
7% Lumber
Above: The NY/PA state-of-the-art
dispatch system is a “point and
click” system with the railroad
operating rules written into the
computer program. This allows
dispatchers to save time, eliminate
errors and control movement on
the track more safely.
Paper 13%
Metals 11%
Minerals/Stone 11%Gypsum 5%
Above: Alcoa’s Deschambault
Mill, located about 30 miles west
of Québec City, is a major cus-
tomer of the Québec Gatineau
Railway. With the addition to this
region of the St. Lawrence
& Atlantic Railroad, one of the
Emons Transportation properties
acquired in February 2002,
expected revenues should
approach $50 million.
Aligning the Organization with Shareholder ValueIn 2001, we began to roll out a new financial management plan to integrate our budg-
eting, financial analysis and compensation systems effectively. This plan establishes
performance benchmarks for each of our regions that are tied to targeted returns on
invested capital. It also links employee compensation to achievement of those targets,
ensuring greater accountability and alignment with enhancing shareholder value.
We also further strengthened our management in 2001. We appointed Marty
Lacombe, formerly President of Genesee • Rail-One in Canada, to the position of
Chief Executive of ARG. Marty replaced Chuck Chabot, whose expiring visa trig-
gered his return to the United States after five years of outstanding management
performance in Australia. Upon his return, Chuck will move to a new top manage-
ment position, and he will continue to work on strategic issues in Australia. We
named Mario Brault, a longtime railroad executive, as Marty’s replacement in
Canada. We were pleased with the results achieved by Jaime Valencia Valencia our
new general manager in Bolivia, whose operational improvements partially miti-
gated poor revenues due to drought’s impact on soybean production. In Oregon, we
appointed Larry Phipps, another seasoned railroad executive, to the post of
President and General Manager of Portland & Western Railroad. Finally, to reflect
emphasis on improved asset utilization and return on capital, Carl Belke was
appointed General Manager, Fleet Management.
We are confident about GWI’s future because of our numerous strengths:
We are an industry leader;
Our acquisition growth has brought increasing customer, commodity and geo-
graphic diversification producing steadier and more predictable earnings and
healthy cash flow;
As a result of our secondary stock offering, our capital structure is flexible and
our balance sheet strong;
Because of our reputation and integrity, we have forged strong partnerships
with Brown Brothers Harriman & Co., Wesfarmers and the International
Finance Corporation (IFC);
We have demonstrated the ability to acquire and grow rail freight businesses,
and we expect to be exposed to many new acquisition opportunities.
■
■
■
■
■

We are also guided by exceptional people, including a board of directors that appro-
priately reflects our international outlook and a management team that provides us
with a distinct competitive advantage.
Although all our lives have been changed by September 11th, fortunately GWI
was not materially affected. However, we have all been inspired by the heroic efforts
made by so many extraordinary people doing their “jobs” as the circumstances
required. In that spirit, I feel GWI is blessed with truly outstanding employees who
work every day to make our Company a success. At a moment in our nation’s his-
tory when courage has never been more treasured, we count among our heroes
some of our very own people: Ed Somerville, a Buffalo & Pittsburgh yardmaster, on
his way home, spotted an ambulance parked across our tracks at the scene of an
auto accident and made an emergency call to stop an oncoming train from a certain
collision. Québec Gatineau engineer Claude Lemieux, conductor Ronnie Samson and
car man Jean Bergeron, came upon a fire near a 400-liter propane tank and warned
local residents to evacuate, protecting them from a possible explosion. And Aric Jeffs,
a Portland & Western conductor, plucked seven-year-old Dylan Arledge from the
trestle tracks in front of a moving 4,000-pound locomotive, saving the youngster
from certain death. These are men who acted swiftly to save lives, putting them-
selves at grave personal risk in the process. I am deeply grateful to them for their
courage and for the example they set for us all. I am honored to call them my col-
leagues.
Mortimer B. Fuller III
Chairman and Chief Executive Officer
March 25, 2002
Above: The Cooperative Bulk
Handling Limited (CBH) grain
terminal at Kwinana is one of
four export grain terminals in
Western Australia served by AWR.
CBH, founded, financed and
controlled by Western Australia’s
grain growers, annually stores and
handles up to 40 percent of the
national average of grain produc-
tion. Grain is approximately 20
percent of ARG’s commodity mix.


Genesee & Wyoming Inc. ❘ 13
Management’s Discussion and Analysis of Financial Condition and Results of Operations. . . . . . . . . . . . . . . . 14
Selected Financial Data . . . . . . . . . . . . . . . . . .37
Report of Independent Public Accountants . . . .38
Report of Independent Public Auditors . . . . . . . 39
Consolidated Balance Sheets as of December 31, 2001 and 2000 . . . . . . . . . 40
Consolidated Statements of Income for the Years Ended December 31, 2001, 2000 and 1999. . . . . . . . . 41
Consolidated Statements of Stockholders’ Equity and ComprehensiveIncome for the Years Ended December 31, 2001, 2000 and 1999 . . . . . . . . 42
Consolidated Statements of Cash Flows for the Years Ended December 31, 2001, 2000 and 1999 . . . . . . . . 43
Notes to Consolidated Financial Statements. . . 44
Index to Financial StatementsGenesee & Wyoming Inc. and Subsidiaries:
Left: These Portland & Western locomotives near Beaverton, Oregon are among GWI’s more than 300 loco-motives serving customers in North America. Improved management of our locomotive fleet provides oppor-tunities to increase asset utilization and improve our return on capital.

14 ❘ Genesee & Wyoming Inc.
and derailments. In periods when these events occur,
results of operations are not easily comparable to other
periods. Also, the Company has completed a number
of recent acquisitions. The Company completed the
acquisition of South Buffalo Railway in the United States
in October, 2001. The Company, through a 50% owned
joint venture, completed an acquisition in Western
Australia in December 2000, and through an investment
in an unconsolidated affiliate, acquired an interest in
a railroad in Bolivia in November 2000. Additionally,
the Company completed two acquisitions, one in Canada
and one in Mexico, in 1999. Because of variations in
the structure, timing and size of these acquisitions
and differences in economics among the Company’s
railroads resulting from differences in the rates and
other material terms established through negotiation,
the Company’s results of operations in any reporting
period may not be directly comparable to its results
of operations in other reporting periods.
The general downturn in economies in North
America in 2001, has adversely affected the Company’s
cyclical shipments of commodities such as paper
products in Canada, chemicals in the United States,
and cement in Mexico. However, shipments of other
important commodities such as coal and salt are less
affected by economic downturns and are more closely
affected by the weather. The economic downturn has
also impacted the Company’s customers and while
a limited number of them have declared bankruptcy,
their traffic volumes have remained largely unaffected
and the impact on the collection of their receivables
has not been significant to date.
On February 14, 2002 and May 1, 2001, the
Company announced three-for-two common stock splits
in the form of 50% stock dividends distributed on March
14, 2002 to shareholders of record as of February 28,
2002, and on June 15, 2001 to shareholders of record as
of May 31, 2001, respectively. All share, per share and
par value amounts presented herein have been restated
to reflect the retroactive effect of both of the stock splits.
The following discussion should be read in conjunction
with the Consolidated Financial Statements and related
notes included elsewhere in this Annual Report.
General
The Company is a holding company whose subsidiaries
and unconsolidated affiliates own and/or operate short
line and regional freight railroads and provide related
rail services in North America, South America and
Australia. The Company, through its U.S. industrial
switching subsidiary, also provides freight car switching
and related services to United States industrial compa-
nies with extensive railroad facilities within their com-
plexes. The Company generates revenues primarily from
the movement of freight over track owned or operated
by its railroads. The Company also generates non-freight
revenues primarily by providing freight car switching
and ancillary rail services.
The Company’s operating expenses include wages
and benefits, equipment rents (including car hire),
purchased services, depreciation and amortization,
diesel fuel, casualties and insurance, materials and other
expenses. Car hire is a charge paid by a railroad to the
owners of railcars used by that railroad in moving freight.
Other expenses generally include property and other
non-income taxes, professional services, communication
and data processing costs, and general overhead expense.
When comparing the Company’s results of operations
from one reporting period to another, the following fac-
tors should be taken into consideration. The Company
has historically experienced fluctuations in revenues
and expenses such as one-time freight moves, customer
plant expansions and shut-downs, railcar sales, accidents
Management’s Discussion andAnalysis Of Financial Condition and Results of Operations
Genesee & Wyoming Inc. ❘ 15
Expansion of OperationsUnited States
On February 22, 2002, the Company acquired Emons
Transportation Group, Inc. (Emons) for approximately
$20.0 million in cash, including transaction costs and
net of cash received in the acquisition, and $11.0 million
of debt assumed. The Company purchased all of the
outstanding shares of Emons at $2.50 per share. The
Company funded the acquisition through its $103.0
million revolving line of credit held under its primary
credit agreement, all of which was available at the time
of the purchase. Emons is a short line railroad holding
company with operations over 340 miles of track in
Maine, Vermont, Québec and Pennsylvania.
On October 1, 2001, the Company acquired all of
the issued and outstanding shares of common stock of
South Buffalo Railway (South Buffalo) from Bethlehem
Steel Corp. (Bethlehem) for $33.1 million in cash,
including transaction costs, and the assumption of
certain liabilities of $5.6 million. At the closing, the
Company acquired beneficial ownership of the shares
and, having received the necessary approvals from The
Surface Transportation Board on November 21, 2001,
assumed actual ownership on December 6, 2001. The
purchase price was allocated to current assets ($2.3 mil-
lion), property and equipment ($17.6 million) and good-
will ($18.8 million) less assumed current liabilities ($2.4
million) and assumed long-term liabilities ($3.2 million).
South Buffalo operates over 52 miles of owned track in
Buffalo, New York. The purchase price has been reduced
by a $407,000 estimated adjustment pursuant to the
final determination of the net assets of South Buffalo
on the sale date. This amount, together with another
$300,000 related to pre-acquisition liabilities paid by
the Company on Bethlehem’s behalf, are reflected in
the December 31, 2001 balance sheet as receivables.
Although Bethlehem filed for voluntary protection under
U.S. bankruptcy laws on October 5, 2001, payment of
this receivable could be funded from a $3.0 million
escrow account held by an independent trustee to settle
amounts due to the Company pursuant to the South
Buffalo acquisition.
As contemplated with the acquisition, the Company
will close the former South Buffalo headquarters office
in March 2002 and has implemented an early retirement
program under which 28 South Buffalo employees
terminated in December 2001. The aggregate $876,000
cost of these restructuring activities is considered a
liability assumed in the acquisition, and therefore is
included in goodwill. The majority of these costs were
paid in 2001.
The acquisition of South Buffalo triggered the
right of The 1818 Fund III, L.P. (the Fund), a private
equity fund managed by Brown Brothers Harriman
& Co., to acquire an additional $5.0 million of the
Company’s Series A Redeemable Convertible Preferred
Stock (the Convertible Preferred), and the Fund
exercised that right on December 11, 2001 (see Note
12 to Consolidated Financial Statements).
Australia
On December 16, 2000, the Company, through its
newly-formed joint venture, Australian Railroad Group
Pty. Ltd. (ARG), completed the acquisition of Westrail
Freight from the government of Western Australia for
approximately $334.4 million U.S. dollars including
working capital. ARG is a joint venture owned 50% by
the Company and 50% by Wesfarmers Limited, a public
corporation based in Perth, Western Australia. Westrail
Freight was composed of the freight operations of the
formerly state-owned railroad of Western Australia.
To complete the acquisition, the Company contributed
its formerly wholly-owned subsidiary, Australia Southern
Railroad (ASR), to ARG along with the Company’s 2.6%
interest in the Asia Pacific Transport Consortium (APTC)
– a consortium selected to construct and operate the
Alice Springs to Darwin railway line in the Northern
Territory of Australia. Additionally, the Company
contributed $21.4 million of cash to ARG (partially
funded by a $20.0 million private placement of the
Convertible Preferred with the Fund) while Wesfarmers
contributed $64.2 million in cash, including $8.2 mil-
lion which represents a long-term Australian dollar
denominated non-interest bearing note to match a simi-
lar note due to the Company from ASR at the date of the

16 ❘ Genesee & Wyoming Inc.
agreement as to the level of acquisition-related costs
to be reimbursed to both venture partners. Accordingly,
in the fourth quarter of 2001, the Company recorded a
$728,000 decrease to its previously recorded gains to
reflect the lower than estimated reimbursed amount
for acquisition-related costs.
The Company accounts for its 50% ownership
in ARG under the equity method of accounting and
therefore deconsolidated ASR from its consolidated
financial statements as of December 16, 2000. Prior
to its deconsolidation, ASR accounted for $37.6 million
and $4.0 million of operating revenue and income from
operations (excluding the $4.0 option buyout charge),
respectively, for 2000 and $43.2 million and $6.6
million, respectively, for 1999.
Mexico
In August 1999, the Company’s then wholly-owned
subsidiary, Compañía de Ferrocarriles Chiapas-Mayab,
S.A. de C.V. (FCCM), was awarded a 30-year concession
to operate certain railways owned by the state-owned
Mexican rail company Ferronales. FCCM also acquired
equipment and other assets. The aggregate purchase
price, including acquisition costs, was approximately
297 million pesos, or approximately $31.5 million at
then-current exchange rates. The purchase price included
rolling stock, an advance payment on track improve-
ments to be completed on the state-owned track property,
an escrow payment, which was returned to the Company
upon successful completion of the track improvements,
and prepaid value-added taxes. A portion of the purchase
price ($8.4 million) was also allocated to the 30-year
operating license. As the track improvements were made,
the related costs were reclassified into the property
accounts as leasehold improvements and are now being
amortized over the improvements’ estimated useful lives.
Pursuant to the acquisition, employee termination pay-
ments of $1.0 million were made to former state employ-
ees and approximately 55 employees who the Company
retained upon acquisition but terminated as part of its
plan to reduce operating costs after September 30, 1999.
All payments were made during the fourth quarter of
1999 and are considered a cost of the acquisition.
transaction. ARG funded the remaining purchase price
with proceeds from its Australian bank credit facility.
As a direct result of the ARG transaction, ASR stock
options became immediately exercisable by key manage-
ment of ASR and, as allowed under the provisions of
the stock option plan, the option holders, in lieu of ASR
stock, were paid an equivalent value in cash, resulting
in a $4.0 million compensation charge to ASR earnings.
The Company recognized a $10.1 million gain upon
the issuance of ASR stock to Wesfarmers upon the for-
mation of ARG as a result of such issuance being at
a per share price in excess of the Company’s book value
per share investment in ASR. Additionally, due to the
deconsolidation of ASR, the Company recognized a
$6.5 million deferred tax expense resulting from the
financial reporting versus tax basis difference in the
Company’s equity investment in ARG.
On April 20, 2001, APTC completed the arrangement
of debt and equity capital to finance a project to build,
own and operate the Alice Springs to Darwin railway
line in the Northern Territory of Australia. As previ-
ously arranged, upon APTC reaching financial closure,
Wesfarmers contributed an additional $7.4 million into
ARG and accordingly, the Company recorded an addi-
tional first quarter gain of $3.7 million related to the
December, 2000 issuance of ARG stock to Wesfarmers.
A related deferred income tax expense of $1.1 million
was also recorded. In the second quarter of 2001, ARG
paid the $7.4 million to its two shareholders, in equal
amounts of $3.7 million each, as partial payment of
each shareholder’s Australian dollar denominated
non-interest bearing note which resulted in a
$508,000 currency transaction loss.
The combined gains totaling $13.8 million relating
to the formation of ARG represented the difference
between the recorded balance of the Company’s previ-
ously wholly owned investment in Australia, less invest-
ment amounts that the Company estimated would be
reimbursed by ARG, and the value of those Australian
operations when ARG was formed. In the fourth quarter
of 2001, the Company, ARG and Wesfarmers reached
Management’s Discussion and Analysis

Genesee & Wyoming Inc. ❘ 17
On December 7, 2000, in conjunction with
the refinancing of FCCM and its parent company,
GW Servicios, S.A. de C.V. (Servicios) (see Note 9 to
Consolidated Financial Statements), the International
Finance Corporation (IFC) invested $1.9 million of equity
for a 12.7% indirect interest in FCCM, through Servicios.
The Company contributed an additional $13.1 million
and maintains an 87.3% indirect ownership in FCCM.
The Company funded $10.7 million of its new invest-
ment with borrowings under its amended credit facility,
with the remaining investment funded by the conversion
of intercompany advances into permanent capital.
Along with its equity investment, IFC received a put
option exercisable in 2005 to sell its equity stake back
to the Company. The put price will be based on a multi-
ple of earnings before interest, taxes, depreciation and
amortization. The Company increases its minority inter-
est expense in the event that the value of the put option
exceeds the otherwise minority interest liability. Because
the IFC equity stake can be put to the Company, the
impact of selling the equity stake at a per share price
below the Company’s book value per share investment
was recorded directly to paid-in capital in 2000.
Canada
On April 15, 1999, the Company acquired Rail-One
Inc. (Rail-One) which has a 47.5% ownership interest in
Genesee • Rail-One Inc. (GRO), thereby increasing the
Company’s ownership of GRO to 95% from the 47.5%
it acquired in 1997. GRO owns and operates two short
line railroads in Canada. Under the terms of the purchase
agreement, the Company converted outstanding notes
receivable from Rail-One of $4.6 million into capital,
committed to pay approximately $844,000 in cash to the
sellers of Rail-One in installments over a four year period,
and granted options to the sellers of Rail-One to pur-
chase up to 180,000 shares of the Company’s Class A
Common Stock at an exercise price of $3.83 per share.
Exercise of the option is contingent on the Company’s
recovery of its capital investment in GRO (after payoff
of existing GRO debt) if the Company were to sell GRO,
and upon certain GRO income performance measures
which have not yet been met. The transaction was
accounted for as a purchase and resulted in $2.8 million
of initial goodwill which was being amortized over 15
years. The contingent purchase price will be recorded as
a component of goodwill at the value of the options
issued, if and when such options are exercisable.
Effective with this agreement, the operating results of
GRO were initially consolidated within the financial
statements of the Company, with a 5% minority interest
due to another GRO shareholder. During the second
quarter of 2000, the Company purchased the remaining
5% minority interest in GRO with an initial cash pay-
ment of $240,000 and subsequent annual cash install-
ments of $180,000 paid in 2001 and due in 2002.
Prior to April 15, 1999, the Company accounted for
its investment in GRO under the equity method and
recorded an equity loss of $618,000 in 1999.
South America
On November 5, 2000, the Company acquired an
indirect 21.87% equity interest in Empresa Ferroviaria
Oriental, S.A. (Oriental) increasing its stake in Oriental
to 22.55% from its original indirect 0.68% interest
acquired in September 1999. On July 24, 2001, the
Company increased its indirect equity interest in
Oriental to 22.89% with an additional investment of
$246,000. Oriental is a railroad serving eastern Bolivia
and connecting to railroads in Argentina and Brazil.
The Company’s ownership interest is largely through
a 90% owned holding company in Bolivia which also
received $740,000 from the minority partner for invest-
ment into Oriental. The Company’s portion of the
Oriental investment is composed of $6.9 million in
cash, the assumption (via an unconsolidated subsidiary)
of non-recourse debt of $10.8 million (90% of $12.0
million) at an adjustable interest rate dependent on
operating results of Oriental, and a non-interest bearing
contingent payment of $450,000 due in 2003 if certain
financial results are achieved. The cash used by the

18 ❘ Genesee & Wyoming Inc.
Results of Operations
Year Ended December 31, 2001Compared to Year Ended December 31, 2000Consolidated Operating Revenues
Consolidated operating revenues (which exclude revenues
from the Company’s equity investees) were $173.6 mil-
lion in the year ended December 31, 2001 compared to
$206.5 million in the year ended December 31, 2000, a
net decrease of $33.0 million or 16.0%. The net decrease
was attributable to a $37.6 million decrease due to the
deconsolidation of Australian railroad operations as of
December 16, 2000 and a $275,000 net decrease on
existing North American railroad operations, offset by
a $3.4 million increase in North American railroad
revenues from the October 1, 2001 acquisition of South
Buffalo, and a $1.5 million increase in industrial switch-
ing revenues.
The following two sections provide information on
railroad revenues for North America and industrial
switching revenues in the United States.
North American Railroad Operating Revenues
Operating revenues had a net increase of $3.1 million, or
2.0%, to $161.4 million in the year ended December 31,
2001 of which $129.9 million were freight revenues and
$31.6 million were non-freight revenues. Operating rev-
enues in the year ended December 31, 2000 were $158.3
million of which $126.4 million were freight revenues
and $31.9 million were non-freight revenues. The net
increase in operating revenues was attributable to a
$3.5 million increase in freight revenues which consisted
of $2.8 million in freight revenue from South Buffalo
and a $643,000 increase on existing North American
railroad operations, offset by a $362,000 decrease in
non-freight revenues which consisted of $556,000 in
non-freight revenue from South Buffalo offset by a
$918,000 decrease on existing North American railroad
operations. The following table compares North American
freight revenues, carloads and average freight revenues
per carload for the years ended December 31, 2001
and 2000:
Company to fund such investment was obtained from
its existing revolving credit facility. Additionally, the
Company received the right to collect dividends from
Oriental related to its full year 2000 earnings. Such
dividends of $617,000 were received in March 2001.
The full value of the non-recourse debt of the Company’s
unconsolidated subsidiary ($12.0 million as of December
31, 2001) bears interest, based on the availability of divi-
dends received from Oriental, between a floor of 4% and
a ceiling of 7.67%. The debt effectively bore interest of
6.12% throughout 2001 and is due, in annual install-
ments through 2003. Such installments and interest are
primarily funded by dividends received from Oriental,
with any shortages (which are expected for 2002 pay-
ments) to be funded by the Company and its partner.
The Company accounts for its indirect interest in
Oriental under the equity method of accounting.
Management’s Discussion and Analysis

Genesee & Wyoming Inc. ❘ 19
Coal, Coke and Ores revenue increased by $2.1
million, or 8.1%, primarily due to hauling additional
carloads of Coal on existing railroad operations for
customers operating in the electric utility industry.
Minerals and Stone revenue increased by $1.5
million, or 8.6%, primarily due to hauling additional
carloads of Salt on existing railroad operations as the
result of a new salt mine customer which began
shipping in May 2001.
Pulp and Paper revenue decreased by $1.0 million,
or 5.0%, primarily due to a decrease of 2,720 carloads
hauled in 2001 resulting from a business decline in the
Pulp and Paper industries located on the Company’s
Oregon, New York-Pennsylvania and Canada railroad
operations.
Petroleum Products revenue decreased by $1.3
million, or 6.9%, primarily due to a decrease of 2,534
carloads hauled in 2001 for Petroleum Products indus-
tries located on the Company’s Mexico railroad opera-
tions due to a weakening Mexican economy and
shifting traffic patterns.
Metals revenue increased by a net $1.2 million, or
11.6%, primarily due to $1.4 million in freight revenue
from South Buffalo, offset by a $222,000 decrease on
existing railroad operations.
Lumber and Forest Products revenue increased by
$1.0 million, or 13.0%, primarily due to an increase of
1,301 carloads hauled in 2001 for lumber and forest
products industries located on the Company’s Oregon
and New York-Pennsylvania railroad operations.
Freight revenues from all remaining commodities
reflected a net decrease of $92,000, after consideration
of $1.4 million of mostly Auto and Auto Parts revenue
from South Buffalo during its 13 weeks as part of the
Company.
Total North American carloads were 387,983
in the year ended December 31, 2001 compared to
375,125 in the year ended December 31, 2000, an
increase of 12,858, or 3.4%. The increase of 12,858
consisted of 9,652 carloads from South Buffalo and
10,584 carloads of coal on existing railroad operations,
offset by a net decrease of 7,378 carloads in all other
commodities combined on existing railroad operations.
The overall average revenue per carload decreased
to $335 in the year ended December 31, 2001, compared
to $337 per carload in the year ended December 31,
2000, a decrease of 0.6%, due primarily to a 1.4%
decrease in per carload revenues attributable to coal
resulting from volume discounts.
North American Freight Revenues and Carloads Comparison by Commodity Group
Commodity Group
Coal, Coke & Ores $28,081 21.6% $25,987 20.6% 128,286 33.1% 117,189 31.2% $219 $222Minerals & Stone 19,439 15.0% 17,901 14.2% 43,615 11.2% 42,146 11.2% 446 425Pulp & Paper 18,663 14.4% 19,653 15.6% 49,033 12.6% 51,753 13.8% 381 380Petroleum Products 16,971 13.1% 18,221 14.4% 27,541 7.1% 30,075 8.0% 616 606Metals 11,239 8.7% 10,069 8.0% 40,679 10.5% 36,554 9.7% 276 275Farm & Food Products 10,008 7.7% 9,653 7.6% 28,205 7.3% 27,710 7.4% 355 348Lumber & Forest Products 8,846 6.8% 7,827 6.2% 26,727 6.9% 25,426 6.8% 331 308Chemicals-Plastics 8,359 6.4% 8,800 7.0% 16,574 4.3% 16,985 4.5% 504 518Autos & Auto Parts 2,499 1.9% 3,148 2.5% 5,283 1.4% 5,849 1.6% 473 538Other 5,756 4.4% 5,113 3.9% 22,040 5.6% 21,438 5.8% 261 239
Totals $129,861 100.0% $126,372 100.0% 387,983 100.0% 375,125 100.0% 335 337
(dollars in thousands, except average per carload) Years Ended December 31, 2001 and 2000
CarloadsFreight RevenuesAverage Freight
Revenue Per Carload
2001 % of total 2000 % of total 2001 % of total 2000 % of total 2001 2000

20 ❘ Genesee & Wyoming Inc.
U.S. Industrial Switching Revenues
Revenues from U.S. industrial switching activities were
$12.1 million in the year ended December 31, 2001
compared to $10.6 million in the year ended December
31, 2000, an increase of $1.5 million, or 14.7%, due
primarily to the addition of several new switching
contracts in 2001.
Consolidated Operating Expenses
Consolidated operating expenses for all operations were
$151.4 million in the year ended December 31, 2001,
compared to $182.8 million in the year ended December
31, 2000, a net decrease of $31.4 million, or 17.1%. The
net decrease was attributable to a $37.7 million decrease
due to the deconsolidation of Australian railroad opera-
tions on December 16, 2000, offset by a $5.0 million
increase in North American railroad operating expenses
of which $2.4 million was attributable to the Company’s
start-up logistics operation, Speedlink, for which opera-
tions were discontinued in September 2001, $1.9 million
resulted from the October 1, 2001 acquisition of South
Buffalo, $747,000 was from an increase on North Ameri-
can railroad operations, and $1.3 million was from an
increase in industrial switching operating expenses.
Operating Ratios
The Company’s consolidated operating ratio improved
to 87.2% in the year ended December 31, 2001 from
88.5% in the year ended December 31, 2000. The
operating ratio for North American railroad operations
declined to 86.6% in the year ended December 31, 2001
from 85.1% in the year ended December 31, 2000. The
operating ratio for U.S. industrial switching operations
improved to 96.0% in the year ended December 31, 2001
from 97.7% in the year ended December 31, 2000.
The operating ratio for Australian railroad operations
was 89.4% in 2000 (excluding the $4.0 million stock
option charge).
The following two sections provide information
on railroad expenses in North America and industrial
switching expenses in the United States.
North American non-freight railroad revenues were
$31.6 million in the year ended December 31, 2001,
compared to $31.9 million in the year ended December
31, 2000, a decrease of $362,000, or 1.1%, which consisted
of $556,000 in non-freight revenue from South Buffalo
offset by a $918,000 decrease on existing North American
railroad operations. The following table compares North
American non-freight revenues for the years ended
December 31, 2001 and 2000:
North American RailroadNon-Freight Operating Revenues Comparison
Railroad switching $8,785 27.8% $11,340 35.5%Car hire and
rental income 7,484 23.7% 7,969 24.9%Car repair services 3,135 9.9% 3,019 9.5%Other operating income 12,180 38.6% 9,618 30.1%
Total non-freightrevenues $31,584 100.0% $31,946 100.0%
The net decrease of $2.6 million in railroad
switching revenues is primarily attributable to a decrease
of $3.1 million from passenger train operations in
Mexico, offset by an increase of $531,000 in switching
revenues from operations in the United States of
which $413,000 is revenue from South Buffalo.
The increase of $2.6 million in other operating
income is primarily attributable to a $1.1 million
increase in storage and demurrage of which $93,000
is revenue from South Buffalo and $1.0 million is from
existing railroad operations, and a $1.1 million increase
in other income. The increase in other income consists
primarily of a $420,000 increase in management fee
revenue on existing railroad operations related to coal
unloading facilities, and $398,000 of revenue from the
Company’s start-up logistics operation, Speedlink, for
which operations were discontinued in September 2001.
Management’s Discussion and Analysis
Year Ended December 31,(dollars in thousands)
$ $
% of Non-FreightOperatingRevenue
% of Non-FreightOperatingRevenue
20002001
Genesee & Wyoming Inc. ❘ 21
North American Railroad Operating Expenses
The following table sets forth a comparison of the
Company’s North American railroad operating expenses
in the years ended December 31, 2001 and 2000:
North American RailroadOperating Expense Comparison
Labor and benefits $55,902 34.7% $54,212 34.2%Equipment rents 19,675 12.2% 19,787 12.5%Purchased services 11,942 7.4% 10,805 6.8%Depreciation and
amortization 12,139 7.5% 11,068 7.0%Diesel fuel 11,596 7.2% 12,888 8.1%Casualties and
insurance 6,779 4.3% 6,111 3.9%Materials 10,560 6.5% 10,226 6.5%Other expenses 11,200 6.6% 9,677 6.1%
Total operating expenses $139,793 86.4% $134,774 85.1%
Labor and benefits expense increased $1.7 million,
or 3.1%, of which $945,000 was attributable to South
Buffalo, $252,000 was attributable to the Company’s
start-up logistics operation, Speedlink, for which
operations were discontinued in September 2001, and
$493,000 was on existing North American operations.
Purchased services increased a net $1.1 million,
or 10.5%, of which $139,000 was attributable to South
Buffalo and $1.3 million was attributable to Speedlink,
offset by a $334,000 decrease on existing North
American operations.
Depreciation and amortization expense increased
$1.1 million, or 9.7%, of which $150,000 was attributa-
ble to South Buffalo and $921,000 was on existing North
American operations. Pursuant to adopting SFAS No.
142 on January 1, 2002, goodwill will no longer be
amortized (see Note 21 to Consolidated Financial
Statements).
Diesel fuel expense decreased a net $1.3 million,
or 10.0%, of which $1.4 million was a decrease on exist-
ing North American operations resulting primarily from
decreased fuel prices in 2001, offset by $52,000 of
expense attributable to South Buffalo.
All remaining operating expenses combined
increased $2.4 million, or 5.3%, of which $625,000
was attributable to South Buffalo, $839,000 was
attributable to Speedlink, and $1.0 million was on
existing North American operations.
U. S. Industrial Switching Operating Expenses
The following table sets forth a comparison of the
Company’s industrial switching operating expenses
in the years ended December 31, 2001 and 2000:
U.S. Industrial SwitchingOperating Expense Comparison
Labor and benefits $8,061 66.4% $6,419 60.7%Equipment rents 289 2.4% 239 2.3%Purchased services 392 3.2% 335 3.2%Depreciation and
amortization 617 5.1% 658 6.2%Diesel fuel 464 3.8% 542 5.1%Casualties
and insurance 294 2.4% 529 5.0%Materials 702 5.8% 643 6.1%Other expenses 824 6.9% 970 9.1%
Total operating expenses $11,643 96.0% $10,335 97.7%
Labor and benefits expense increased $1.6 million,
or 25.6%, due primarily to the addition of several new
switching contracts in 2001.
Year Ended December 31,(dollars in thousands)
$ $
% ofOperatingRevenue
% ofOperatingRevenue
20002001
Year Ended December 31,(dollars in thousands)
$ $
% ofOperatingRevenue
% ofOperatingRevenue
20002001

22 ❘ Genesee & Wyoming Inc.
Other Income, Net
Other income, net, in the year ended December 31, 2001,
was $1.4 million compared to $3.0 million in the year
ended December 31, 2000, a decrease of $1.6 million, or
53.3%. Other income, net, in the year ended December
31, 2001 consists primarily of interest income of $1.1
million and gain on asset sales of $814,000, offset by
currency losses of $508,000 on Australian dollar denom-
inated receivables. Other income, net, in the year ended
December 31, 2000, consisted primarily of interest
income of $2.3 million. The decrease in interest income
in the year ended December 31, 2001, is primarily due
to a partial year of earnings compared to a full year of
earnings in the year ended December 31, 2000 on a
special deposit at the Company’s Mexican subsidiary.
Income Taxes
The Company’s effective income tax rate in the years
ended December 31, 2001 and 2000 was 37.6% and
43.9%, respectively. The decrease in 2001 is partially
attributable to a lower Australian income tax rate
(30%) recorded on the $3.0 million one-time gain on
the sale of 50% of its interest in APTC. The 2000 rate
was impacted by a $6.6 million non-cash deferred tax
expense related to the financial reporting versus tax
basis difference in the Company’s investment in
Australia which resulted from the deconsolidation of
those operations, and a $1.0 million reduction in the
valuation allowance established in 1999 against the
positive impact of a favorable tax law change in
Australia. Without the impact of these items,
the Company’s effective income tax rate in the year
ended December 31, 2000, was 35.8%.
Equity in Net Income of Unconsolidated International Affiliates
Equity earnings of unconsolidated international affiliates
in the year ended December 31, 2001, were $8.9 million
compared to $411,000 in the year ended December 31,
2000, an increase of $8.5 million. Equity earnings in the
year ended December 31, 2001, consist of $8.5 million
from Australian Railroad Group and $412,000 from
South America affiliates. Equity earnings in the year
ended December 31, 2000, consist of $261,000 from
All other expenses were $3.6 million in the year
ended December 31, 2001, compared to $3.9 million
in the year ended December 31, 2000, a decrease of
$334,000, or 8.5%, due primarily to a $235,000 net
decrease in casualties and insurance which resulted
from the settlement of a long-standing claim for
$350,000 less than the Company’s recorded accrual,
offset by a $115,000 increase in actual 2001 casualties
and insurance expense.
Interest Expense
Interest expense in the year ended December 31, 2001,
was $10.0 million compared to $11.2 million in the year
ended December 31, 2000, a decrease of $1.2 million,
or 10.5%, primarily due to a decrease in debt and lower
interest rates in 2001, offset by new borrowings to
acquire South Buffalo.
Gain on 50% Sale of Australia Southern Railroad
The Company recorded a non-cash gain of $10.1 million
upon the issuance of shares of ASR at a price per share
in excess of its book value per share investment in ASR
in December 2000 and a related net $3.0 million increase
of that gain in 2001 (see Note 3 to Consolidated Finan-
cial Statements).
Valuation Adjustment of U.S. Dollar Denominated Foreign Debt
Amounts outstanding under the Company’s credit
facilities which were borrowed by FCCM represented
U.S. dollar denominated foreign debt of the Company’s
Mexican subsidiary. As the Mexican peso moved against
the U.S. dollar, the revaluation of this outstanding debt
to its Mexican peso equivalent resulted in non-cash
gains and losses. On June 16, 2000, pursuant to a
corporate and financial restructuring of the Company’s
Mexican subsidiaries, the income statement impact
of the U.S. dollar denominated foreign debt revaluation
was significantly reduced.
Management’s Discussion and Analysis

Genesee & Wyoming Inc. ❘ 23
Australian Railroad Group for the period of December 17
through December 31, 2000, and $150,000 from South
America affiliates for the period of November 6 through
December 31, 2000.
Net Income and Earnings Per Share
The Company’s net income for the year ended December
31, 2001, was $19.1 million compared to net income
in the year ended December 31, 2000, of $13.9 million,
an increase of $5.2 million, or 37.0%. The increase in
net income is the net result of an increase in equity
earnings of unconsolidated affiliates of $8.5 million and
a decrease in the net loss of industrial switching of
$83,000, offset by a decrease in net income from exist-
ing North American railroad operations of $3.2 million
and a decrease in net income from Australian railroad
operations of $204,000 due to its deconsolidation.
Basic and Diluted Earnings Per Share in the year
ended December 31, 2001, were $1.72 and $1.48,
respectively, on weighted average shares of 10.5 million
and 12.9 million, respectively, compared to $1.42 and
$1.38, respectively, on weighted average shares of 9.8
million and 10.1 million in the year ended December 31,
2000. The earnings per share and weighted average
shares outstanding for the years ended December 31,
2001 and 2000 are adjusted for the impact of the March
14, 2002 and June 15, 2001 stock splits (see Note 2. to
Consolidated Financial Statements). The increase in
weighted average shares outstanding for Basic Earnings
Per Share of 731,000 is primarily attributable to the
exercise of employee stock options in 2001, and the
impact of the December 21, 2001, offering of common
stock (see Note 11 to Consolidated Financial Statements).
The increase in weighted average shares outstanding for
Diluted Earnings Per Share of 2.8 million is primarily
attributable to the above impact and the dilutive impact
of the common stock equivalents associated with the
Redeemable Convertible Preferred Stock issued in
December 2001 and December 2000, (26,802 and
1,956,522 weighted average shares, respectively), and
the dilutive impact of unexercised employee and director
stock options as a result of an increase in the market
price of the Company’s stock in 2001.
Year Ended December 31, 2000Compared to Year Ended December 31, 1999Consolidated Operating Revenues
Consolidated operating revenues (which exclude revenues from the Company’s equity investees) were$206.5 million in the year ended December 31, 2000,compared to $175.6 million in the year ended December31, 1999, a net increase of $30.9 million, or 17.6%. The net increase was attributable to a $37.2 millionincrease in North American railroad revenues of which$23.8 million was attributable to a full year of railroadoperations in Mexico compared to four months of rail-road operations in Mexico in the 1999 period, $10.2 million was attributable to a full year of railroad opera-tions in Canada compared to eight and one-half monthsof railroad operations in Canada in the 1999 period, and $3.2 million was on existing North American opera-tions, offset by a $5.5 million decrease in revenues fromAustralian railroad operations and a $768,000 decreasein industrial switching revenues.
The following three sections provide information on railroad revenues for North American and Australianrailroad operations, and industrial switching revenues in the United States. Australian railroad operations were deconsolidated starting December 17, 2000.
North American Railroad Operating Revenues
Operating revenues increased $37.2 million, or 30.7%, to $158.3 million in the year ended December 31, 2000,of which $126.4 million were freight revenues and $31.9 million were non-freight revenues. Operating revenues in the year ended December 31, 1999, were$121.1 million, of which $95.5 million were freight revenues and $25.6 million were non-freight revenues. The increase was attributable to a $30.7 million increasein freight revenues and a $6.5 million increase in non-freight revenues. The increase of $30.7 million in North American freight revenues consisted of $20.7 million in freight revenues attributable to a full year ofrailroad operations in Mexico, $8.6 million in freightrevenues attributable to a full year of railroad operations

24 ❘ Genesee & Wyoming Inc.
North American Freight Revenues and Carloads Comparison by Commodity Group
Coal, Coke & Ores $25,987 20.6% $24,779 25.9% 117,189 31.2% 94,140 31.4% $222 $263Pulp & Paper 19,653 15.6% 14,867 15.6% 51,753 13.8% 39,952 13.3% 380 372Petroleum Products 18,221 14.4% 10,210 10.7% 30,075 8.0% 20,206 6.7% 606 505Minerals & Stone 17,901 14.2% 7,905 8.3% 42,146 11.2% 23,667 7.9% 425 334Metals 10,069 8.0% 8,156 8.5% 36,554 9.7% 30,614 10.2% 275 266Farm & Food Products 9,653 7.6% 5,831 6.1% 27,710 7.4% 19,898 6.6% 348 293Chemicals-Plastics 8,800 7.0% 8,169 8.6% 16,985 4.5% 16,039 5.4% 518 509Lumber & Forest Products 7,827 6.2% 8,304 8.7% 25,426 6.8% 28,627 9.6% 308 290Autos & Auto Parts 3,148 2.5% 2,491 2.6% 5,849 1.6% 4,790 1.6% 538 520Other 5,113 3.9% 4,825 5.0% 21,438 5.8% 22,024 7.3% 239 219
Totals $126,372 100.0% $95,537 100.0% 375,125 100.0% 299,957 100.0% 337 319
in Canada, and $1.4 million on existing North Americanoperations. The following table compares NorthAmerican freight revenues, carloads and average freightrevenues per carload for the years ended December 31,2000 and 1999:
Management’s Discussion and Analysis
Years Ended December 31, 2000 and 1999
CarloadsFreight RevenuesAverage Freight
Revenues Per Carload
2000 % of total 1999 % of total 2000 % of total 1999 % of total 2000 1999
Revenues from hauling Coal increased by $1.2 million, or 4.9%, of which $77,000 was attributable to a full year of railroad operations in Canada, and $1.1million was on existing North American operations. The increase on existing railroad operations was primarilyattributable to freight revenues for two new customers in the 2000 period. The average revenue per carload forcoal decreased by 15.6% due to lower revenue per car-load for the new customers, and freight rate reductionson certain existing traffic.
Pulp and Paper revenues increased by $4.8 million, or 32.2%, of which $306,000 was attributable to a fullyear of railroad operations in Mexico, $2.9 million wasattributable to a full year of railroad operations inCanada, and $1.6 million was on existing NorthAmerican operations.
Petroleum Products revenues increased by $8.0 mil-lion, or 78.5%, of which $7.1 million was attributable to a full year of railroad operations in Mexico, $33,000 was attributable to a full year of railroad operations inCanada, and $868,000 was on existing North Americanoperations.
Minerals and Stone revenues increased by $10.0 mil-lion, or 126.5%, of which $8.9 million was attributable to a full year of railroad operations in Mexico, $237,000was attributable to a full year of railroad operations inCanada, and $887,000 was on existing North Americanoperations.
Farm and Food Products increased by a net $3.8 mil-lion, or 65.5%, of which $2.2 million was attributable to a full year of railroad operations in Mexico and $1.7 mil-lion was attributable to a full year of railroad operationsin Canada, offset by a decrease of $103,000 on existingNorth American operations.
(dollars in thousands, except average per carload)

Genesee & Wyoming Inc. ❘ 25
Freight revenues from all remaining commoditiesreflected a net increase of $3.0 million, or 9.4%, of which$2.3 million was attributable to a full year of railroadoperations in Mexico, $3.7 million was attributable to a full year of railroad operations in Canada, offset by anet decrease of $3.0 million on existing North Americanoperations. The net decrease on existing North Americanoperations was primarily due to decreases in revenuesfrom Lumber and Forest Products of $1.5 million,Chemicals and Plastics of $698,000, and Other of $1.5million, offset by increases in Metals of $293,000 andAutos and Auto Parts of $436,000.
Total North American carloads were 375,125 in theyear ended December 31, 2000, compared to 299,957 in the year ended December 31, 1999, an increase of75,168, or 25.1%. The increase of 75,168 consisted of29,914 carloads attributable to a full year of railroadoperations in Mexico, 24,962 carloads attributable to a full year of railroad operations in Canada, and a netincrease of 20,292 carloads on existing North Americanrailroad operations of which 23,049 were coal offset by a net decrease of 2,757 in all other commodities.
The overall average revenue per carload increased to $337 in the year ended December 31, 2000, comparedto $319 per carload in the year ended December 31,1999, an increase of 5.6% due primarily to higher percarload revenues attributable to Canada and Mexico carloads offset by a decrease on existing North Americanrailroad operations carloads.
North American non-freight railroad revenues were$31.9 million in the year ended December 31, 2000,compared to $25.6 million in the year ended December31, 1999, an increase of $6.3 million, or 25.0%. Theincrease of $6.3 million in North American non-freightrevenues consisted of $3.1 million attributable to a fullyear of operations in Mexico, $1.5 million attributable to a full year of operations in Canada, and $1.7 millionin non-freight revenues on existing North Americanoperations. The following table compares NorthAmerican non-freight revenues for the years endedDecember 31, 2000 and 1999:
North American RailroadNon-Freight Operating Revenues Comparison
Railroad switching $ 11,340 35.5% $ 6,818 26.7%Car hire and
rental income 7,969 24.9% 7,981 31.2%Car repair services 3,019 9.5% 2,346 9.2%Other operating income 9,618 30.1% 8,411 32.9%
Total non-freight revenues $ 31,946 100.0% $ 25,556 100.0%
The increase of $4.5 million in railroad switching
revenues is primarily attributable to a full year of
railroad operations in Mexico.
Year Ended December 31,(dollars in thousands)
$ $% of
Non-FreightOperatingRevenue
% of Non-FreightOperatingRevenue
19992000

The net decrease of $5.2 million in Australian freight
revenues was primarily attributable to the December 17
deconsolidation and the 9.6% depreciation of the
Australian dollar. Decreases in revenues from Grain of
$4.6 million, Hook and Pull of $2.6 million, Coal of
$664,000, and all remaining commodities except Iron
Ores of $762,000, were primarily due to the deconsoli-
dation and depreciation. Grain revenues for 1999 also
reflect the strong harvest experienced during the
1998/99 season. There were no freight revenues from
coal in the 2000 period due to the non-renewal of a coal
contract. The increase of $3.4 million from the shipment
of Iron Ores was from a new customer that began
shipments in the forth quarter of 1999.
Australian carloads were 240,374 in the period
ended December 16, 2000, compared to 167,486 in the
year ended December 31, 1999, an increase of 72,888,
or 43.5%. The net increase of 72,888 was primarily
the result of increases of 91,475 carloads from the ship-
ment of Iron Ores and 537 carloads from the shipment
of Gypsum, offset by decreases in carloads from Grain,
Coal, and all other commodities of 13,906, 4,317, and
901, respectively.
The overall average revenue per carload decreased to
$139 in the period ended December 16, 2000, compared
to $231 per carload in the year ended December 31,
1999. The decrease is primarily due to the significantly
higher number of carloads of lower revenue per carload
Iron Ore, and the depreciation of the Australian dollar
against the U.S. dollar in the 2000 period compared
to the 1999 period.
Australian non-freight revenues were $4.2 million
in the period ended December 16, 2000, compared to
$4.5 million in the year ended December 31, 1999,
a decrease of $284,000, or 6.3%.
Australian Freight Revenues by Commodity
Hook and Pull (Haulage) $14,905 44.6% $17,533 45.4% 51,165 21.3% 52,407 31.3% $291 $335
Grain 9,009 27.0% 13,588 35.2% 34,875 14.5% 48,781 29.1% 258 279Iron Ore 3,754 11.2% 350 0.9% 99,544 41.4% 8,069 4.8% 38 43Gypsum 2,417 7.2% 2,861 7.4% 40,841 17.0% 40,304 24.1% 59 71Marble 1,788 5.4% 2,034 5.3% 8,171 3.4% 8,343 5.0% 219 244Lime 1,451 4.3% 1,531 4.0% 4,182 1.7% 4,662 2.8% 347 328Coal - 0.0% 664 1.7% - 0.0% 4,317 2.6% - 154Other 96 0.3% 88 0.1% 1,596 0.7% 603 0.3% 60 146
Total $33,420 100.0% $38,649 100.0% 240,374 100.0% 167,486 100.0% 139 231
26 ❘ Genesee & Wyoming Inc.
in Australian operating revenues is due to the December
17 deconsolidation and the depreciation of the Australian
dollar against the U.S. dollar in the 2000 period com-
pared to the 1999 period. The weighted average currency
exchange rate in the year ended December 31, 2000
was $0.5828 compared to $0.6449 in the year ended
December 31, 1999, a decrease of $0.0621, or 9.6%.
The following table outlines Australian freight revenues
for the two periods:
Australian Railroad Operating Revenues
Operating revenues were $37.6 million in the period
ended December 16, 2000, compared to $43.2 million
in the year ended December 31, 1999, a decrease of
$5.6 million, or 12.8%. The Company deconsolidated its
Australian subsidiary as part of the ARG transaction on
December 17, 2000. The decrease was the result of a
decrease in freight revenues from Australian railroad
operations of $5.2 million, or 13.5%, and a decrease in
non-freight revenues of $284,000, or 6.3%. The decrease
Management’s Discussion and Analysis
(dollars in thousands, except average per carload) Years Ended December 31, 2000 and 1999
CarloadsFreight RevenuesAverage Freight
Revenues Per Carload
2000 % of total 1999 % of total 2000 % of total 1999 % of total 2000 1999

Genesee & Wyoming Inc. ❘ 27
U.S. Industrial Switching Revenues
Revenues from U.S. industrial switching activities were
$10.6 million in the year ended December 31, 2000,
compared to $11.3 million in the year ended December
31, 1999, a decrease of $768,000, or 6.8%, due primarily
to the Company’s decision to exit an unprofitable switch-
ing contract in May, 1999.
Consolidated Operating Expenses
Consolidated operating expenses for all operations were
$182.8 million in the year ended December 31, 2000,
compared to $153.2 million in the year ended December
31, 1999, a net increase of $29.6 million, or 19.3%.
Expenses attributable to North American railroad opera-
tions were $134.8 million in the year ended December
31, 2000, compared to $105.2 million in the year ended
December 31, 1999, an increase of $29.6 million, or
28.1%, of which $17.5 million are operating expenses
attributable to a full year of railroad operations in
Mexico compared to four months of railroad operations
in Mexico in the 1999 period, $8.1 million are operating
expenses attributable to a full year of railroad operations
in Canada compared to eight and one-half months of
railroad operations in Canada in the 1999 period, and
$4.0 million are operating expenses on existing North
American operations. Expenses attributable to operations
in Australia were $37.7 million in 2000, compared to
$36.6 million in 1999, an increase of $1.1 million, or
2.9%. Expenses attributable to U.S. industrial switching
were $10.3 million in the year ended December 31,
2000, compared to $11.4 million in the year ended
December 31, 1999, a decrease of $1.1 million, or 9.6%.
Operating Ratios
The Company’s consolidated operating ratio increased
to 88.5% in the year ended December 31, 2000 from
87.3% in the year ended December 31, 1999. The
operating ratio for North American railroad operations
decreased to 85.1% in the year ended December 31,
2000 from 86.9% in the year ended December 31, 1999.
The operating ratio for Australian railroad operations
increased to 100.1% in 2000 from 84.8% in 1999. The
operating ratio for U.S. industrial switching operations
decreased to 97.7% in the year ended December 31, 2000
from 100.8% in the year ended December 31, 1999.
The following three sections provide information
on railroad expenses for North American and Australian
railroad operations, and industrial switching expenses
in the United States. Australian railroad operations were
deconsolidated starting December 17, 2000.
North American Railroad Operating Expenses
The following table sets forth a comparison of the
Company’s North American railroad operating expenses
in the years ended December 31, 2000 and 1999:
North American RailroadOperating Expense Comparison
Labor and benefits $54,212 34.2% $38,819 32.1%Equipment rents 19,787 12.5% 13,768 11.4%Purchased services 10,805 6.8% 7,996 6.6%Depreciation and
amortization 11,068 7.0% 9,649 8.0%Diesel fuel 12,888 8.1% 6,357 5.2%Casualties and
insurance 6,111 3.9% 4,172 3.4%Materials 10,226 6.5% 8,503 7.0%Other expenses 9,677 6.1% 15,929 13.2%
Total operating expenses $134,774 85.1% $105,193 86.9%
Labor and benefits expense increased $15.4 million,
or 39.7%, of which $7.5 million was attributable to a full
year of railroad operations in Mexico, $2.2 million was
attributable to a full year of railroad operations in
Canada, and $5.7 million was on existing North
American operations.
Equipment rents increased $6.0 million, or 43.7%,
of which $994,000 was attributable to a full year of rail-
road operations in Mexico, $1.8 million was attributable
to a full year of railroad operations in Canada, and $3.2
million was on existing North American operations.
Purchased services increased $2.8 million, or 35.1%,
of which $1.8 million was attributable to a full year of
railroad operations in Mexico, $955,000 was attributable
Year Ended December 31,(dollars in thousands)
$ $
% ofOperatingRevenue
% ofOperatingRevenue
19992000

28 ❘ Genesee & Wyoming Inc.
Australian Railroad Operating Expenses
The following table sets forth a comparison of the
Company’s Australian railroad operating expenses
in the periods ended December 16, 2000 and
December 31, 1999:
Australian RailroadOperating Expense Comparison
Labor and benefits $5,266 14.0% $5,443 12.6%Equipment rents 210 0.6% 367 0.9%Purchased services 11,947 31.7% 12,116 28.1%Depreciation and
amortization 2,254 6.0% 2,157 5.0%Diesel fuel 6,672 17.7% 8,186 19.0%Casualties and
insurance 1,415 3.8% 1,635 3.8%Materials 1,492 4.0% 1,861 4.3%Other expenses 4,397 11.7% 4,833 11.1%Stock option charge 4,015 10.6% - 0.0%
Total operating expenses $37,668 100.1% $36,598 84.8%
Operating expenses (exclusive of a $4.0 million
stock option charge) decreased by $2.9 million in 2000
primarily due to the December 17 deconsolidation and
the 9.6% depreciation of the Australian dollar against the
U.S. dollar in the 2000 period compared to the 1999
period.
As a direct result of the Company’s contribution of
ASR to ARG, ASR stock options became immediately
exercisable by the option holders and, as allowed under
the provisions of the stock option plan, the option hold-
ers, in lieu of ASR stock, were paid an equivalent value
in cash, resulting in a $4.0 million pre-tax compensation
charge to ASR earnings.
to a full year of railroad operations in Canada, and
$81,000 was on existing North American operations.
Depreciation and amortization expense increased
$1.4 million, or 14.7%, of which $1.3 million was attrib-
utable to a full year of railroad operations in Mexico
and $512,000 was attributable to a full year of railroad
operations in Canada, offset by a decrease of $434,000
on existing North American operations.
Diesel fuel expense increased $6.5 million, or 102.7%,
of which $2.4 million was attributable to a full year of
railroad operations in Mexico, $1.8 million was attribut-
able to a full year of railroad operations in Canada, and
$2.3 million was on existing North American operations.
The increase on existing railroad operations was due
primarily to increased fuel oil prices in 2000 and sec-
ondarily to increased fuel consumption resulting from
an increase in carloads on existing operations.
Casualties and insurance expense increased $1.9
million, or 46.5%, of which $1.4 million was attributable
to a full year of railroad operations in Mexico, $19,000
was attributable to a full year of railroad operations in
Canada, and $565,000 was on existing North American
operations.
Materials expense increased $1.7 million, or 20.3%,
of which $1.5 million was attributable to a full year
of railroad operations in Mexico and $231,000 was on
existing North American operations, offset by a $48,000
decrease attributable to Canada. The decrease attributa-
ble to Canada is due primarily to increased capital
work in the 2000 period compared to a higher level
of maintenance work in the 1999 period.
Other expenses were $9.7 million in the year
ended December 31, 2000, compared to $15.9 million
in the year ended December 31, 1999, a net decrease of
$6.2 million, or 39.2%. The net decrease of $6.2 million
consists of an increase of $531,000 attributable to a full
year of railroad operations in Mexico, $800,000 attribut-
able to a full year of railroad operations in Canada,
offset by a $7.6 million decrease on existing North
American operations.
Management’s Discussion and Analysis
Year Ended December 31,(dollars in thousands)
$ $
% ofOperatingRevenue
% ofOperatingRevenue
19992000
Genesee & Wyoming Inc. ❘ 29
U. S. Industrial Switching Operating Expenses
The following table sets forth a comparison of the
Company’s industrial switching operating expenses
in the years ended December 31, 2000 and 1999:
U.S. Industrial SwitchingOperating Expense Comparison
Labor and benefits $6,419 60.7% $7,945 70.1%Equipment rents 239 2.3% 187 1.6%Purchased services 335 3.2% 476 4.2%Depreciation and
amortization 658 6.2% 768 6.8%Diesel fuel 542 5.1% 421 3.7%Casualties and insurance 529 5.0% 971 8.6%Materials 643 6.1% 743 6.6%Other expenses 970 9.1% (84) (0.8%)
Total operating expenses $10,335 97.7% $11,427 100.8%
Labor and benefits expense decreased $1.5 million,
or 19.2%, due primarily to the Company’s decision to
exit an unprofitable switching contract in May, 1999.
All other expenses were $3.9 million in the year
ended December 31, 2000, compared to $3.5 in the year
ended December 31, 1999, an increase of $434,000,
or 12.5%.
Interest Expense
Interest expense in the year ended December 31, 2000,
was $11.2 million compared to $8.5 million in the year
ended December 31, 1999, an increase of $2.7 million
or 32.7% primarily due to the increase in debt used to
fund acquisitions in 1999 and investments in uncon-
solidated affiliates in 2000.
Gain on 50% Sale of Australia Southern Railroad
The Company recorded a non-cash gain of $10.1 million
upon the issuance of shares of ASR at a price per share
in excess of its book value per share investment in ASR
in December 2000 (see Note 3 to Consolidated Financial
Statements).
Valuation Adjustment of U.S. Dollar Denominated Foreign Debt
Amounts outstanding under the Company’s credit
facilities which were borrowed by FCCM represented
U.S. dollar denominated foreign debt of the Company’s
Mexican subsidiary. As the Mexican peso moved against
the U.S. dollar, the revaluation of this outstanding debt
to its Mexican peso equivalent resulted in non-cash
gains and losses which totaled a loss of $1.5 million in
the year ended December 31, 2000, compared to a loss
of $191,000 in the year ended December 31, 1999.
On June 16, 2000, pursuant to a corporate and financial
restructuring of the Company’s Mexican subsidiaries, the
income statement impact of the U.S. dollar denominated
foreign debt revaluation was significantly reduced.
Other Income, Net
Other income, net in the year ended December 31,
2000, was $3.0 million compared to $1.9 million in
the year ended December 31, 1999, an increase of
$1.1 million or 59.1%. Other income, net in the years
ended December 31, 2000 and 1999, consists primarily
of interest income of $2.3 million and $1.3 million,
respectively. The increase in interest income in the
year ended December 31, 2000, is primarily due to a
full year of earnings on a special deposit at the
Company’s Mexican subsidiary.
Income Taxes
The Company’s effective income tax rate in the years
ended December 31, 2000 and 1999 was 43.9% and
14.0%, respectively. The 2000 rate was impacted by a
$6.6 million non-cash deferred tax expense related to
the financial reporting versus tax basis difference in the
Company’s investment in Australia which resulted from
the deconsolidation of those operations, and a $1.0 mil-
lion reduction in the valuation allowance established in
1999 against the positive impact of a favorable tax law
change in Australia. Without the impact of these items,
the Company’s effective income tax rate in the year
ended December 31, 2000, was 35.8%. The 1999 rate
was impacted by a $4.2 million benefit recorded in
the third quarter of 1999 as a result of the favorable tax
law change in Australia. Without this impact, 1999’s
effective income tax rate was 40.9%.
Year Ended December 31,(dollars in thousands)
$ $
% ofOperatingRevenue
% ofOperatingRevenue
19992000

30 ❘ Genesee & Wyoming Inc.
Liquidity and Capital Resources
During 2001, 2000 and 1999, the Company generated
$28.6 million, $23.5 million and $29.3 million, respec-
tively, of cash from operations. The 2001 increase over
2000 was primarily due to the net decrease in non-cash
working capital during 2001 compared to the increase in
non-cash working capital in 2000, offset by lower cash
earnings in 2001. The 2000 decrease is primarily due
to higher cash earnings in 2000 being more than offset
by the net increase in non-cash working capital during
2000 compared to the net decrease in such non-cash
working capital in 1999.
Cash flows from investing activities included
capital expenditures of $16.6 million, $29.3 million
and $24.9 million in 2001, 2000 and 1999, respectively.
Of these expenditures, $4.5 million, $14.4 million and
$14.8 million were for equipment and rolling stock
in 2001, 2000 and 1999, respectively. The remaining
capital expenditure amounts each year were for track
improvements and are net of funds received under
governmental grants of $3.9 million, $8.9 million and
$8.6 million in 2001, 2000 and 1999, respectively.
Year 2001 cash flows from investing activities included
$33.1 million for the acquisition of South Buffalo
Railway, $246,000 of investments in unconsolidated
affiliates, and $4.3 million in cash received from uncon-
solidated affiliates. Year 2000 cash flows from investing
activities included $29.4 million of investments in
unconsolidated affiliates and $2.6 million of proceeds
from the issuance of minority shares in consolidated
affiliates. Year 1999 cash flows from investing activities
included $1.0 million of investments in unconsolidated
affiliates and $31.5 million for the acquisition by FCCM.
Proceeds from assets sales were $8.1 million in 2001,
$679,000 in 2000 and $10.3 million in 1999.
Cash flows from financing activities included a net
decrease in outstanding debt of $43.0 million in 2001
and net increases in outstanding debt of $6.4 million in
2000 and $17.5 million in 1999. Common stock activity
resulted in net cash inflows of $71.6 million and $2.2
million, respectively, in 2001 and 2000 and outflows of
$6.3 million in 1999, such outflows primarily represent-
ing the 1999 portion of the Company’s program from
Equity in Net Income of Unconsolidated International Affiliates
Equity earnings of unconsolidated international affiliates
in the year ended December 31, 2000, were $411,000
compared to a loss of $618,000 in the year ended
December 31, 1999, an increase of $1.0 million. Equity
earnings in the year ended December 31, 2000, consist
of $261,000 from Australian Railroad Group for the
period of December 17 through December 31, 2000,
and $150,000 from South America affiliates for the
period of November 6 through December 31, 2000.
Equity losses of $618,000 in the year ended December
31, 1999, were from Genesee • Rail-One for the period
of January 1 through April 15, 1999, at which date
the Company acquired majority ownership of Genesee •
Rail-One.
Net Income and Earnings Per Share
The Company’s net income for the year ended
December 31, 2000, was $13.9 million compared to
net income in the year ended December 31, 1999,
of $12.5 million, an increase of $1.4 million, or 11.2%.
The increase in net income is the net result of an
increase in net income from North American railroad
operations of $7.6 million, an increase in equity earn-
ings of unconsolidated affiliates of $1.0 million, and
a decrease in the net loss of industrial switching of
$86,000, offset by a decrease in net income from
Australian railroad operations of $7.3 million.
Basic and Diluted Earnings Per Share in the year
ended December 31, 2000, were $1.42 and $1.38,
respectively, on weighted average shares of 9.8 million
and 10.1 million, respectively, compared to $1.24 and
$1.23, respectively, on weighted average shares of 10.1
million and 10.2 million, respectively, in the year ended
December 31, 1999. The earnings per share and weighted
average shares outstanding for years ended December
31, 2000 and 1999 are adjusted for the impact of the
March 14, 2002 and June 15, 2001 stock splits (see
Note 2 to Consolidated Financial Statements).
Management’s Discussion and Analysis
Genesee & Wyoming Inc. ❘ 31
August, 1998 to April, 1999 to repurchase 2.3 million
shares of its Class A common stock. Year 2001 and 2000
cash flows from financing activities also included $4.8
million and $18.8 million, respectively, of net proceeds
from the Company’s respective December 2001 and
December 2000 issuances of Redeemable Convertible
Preferred Stock and 2001 included $855,000 of divi-
dends paid on the Preferred.
During 2001, the Company completed two amend-
ments to its primary credit agreement (neither of which
affected the terms of the debt) to facilitate the Company’s
acquisition of South Buffalo, the issuance of Class A
Common Stock, and the acquisition of Emons (see Note
3 to Consolidated Financial Statements). During 2000,
the Company completed four amendments to its primary
credit agreement to facilitate the Company’s corporate
restructuring and refinancing of its Mexico operations,
the issuance of Convertible Preferred stock, and the sale
of a 50% interest in ASR. As amended, the Company’s
primary credit agreement consists of a $135.0 million
credit facility with $103.0 million in revolving credit
facilities and $32.0 million in term loan facilities. The
term loan facilities consist of a U.S. Term Loan facility
in the amount of $10.0 million and a Canadian Term
Loan facility in the Canadian Dollar Equivalent of
$22.0 million in U.S. dollars. Prior to the 2000 amend-
ments, this agreement allowed for maximum borrowings
of $150.0 million including $45.0 million in Mexico and
$15.0 million in Australia. Amounts previously outstand-
ing under the credit agreement which were borrowed by
FCCM represented U.S. dollar denominated foreign debt
of the Company’s Mexican subsidiary. As the Mexican
peso moved against the U.S. dollar, the revaluation of
this outstanding debt to its Mexican peso equivalent
resulted in non-cash gains and losses as reflected in the
accompanying statements of income. On June 16, 2000,
pursuant to a corporate and financial restructuring of
the Company’s Mexican subsidiaries, the income state-
ment impact of the U.S. dollar denominated foreign
debt revaluation was significantly reduced.
The term loans are due in quarterly installments
and mature, along with the revolving credit facilities,
on August 17, 2004. The credit facilities accrue interest
at various rates plus the applicable margin, which varies
from 1.75% to 2.5% depending upon the country in
which the funds are drawn and the Company’s funded
debt to Earnings Before Interest, Taxes, Depreciation,
Amortization and Operating Leases (EBITDAR) ratio, as
defined in the agreement. Interest is payable in arrears
based on certain elections of the Company, not to exceed
three months outstanding. The Company pays a commit-
ment fee which varies between 0.375% and 0.500% per
annum on all unused portions of the revolving credit
facility depending on the Company’s funded debt to
EBITDAR ratio. The credit facilities agreement requires
mandatory prepayments from the issuance of new equity
or debt and annual sale of assets in excess of varying
minimum amounts depending on the country in which
the sales occur. The credit facilities are secured by essen-
tially all the Company’s assets in the United States and
Canada. The credit agreement requires the maintenance
of certain covenant ratios or amounts, including, but not
limited to, funded debt to EBITDAR, cash flow coverage,
and net worth, all as defined in the credit agreement.
The Company and its subsidiaries were in compliance
with the provisions of these covenants as of December
31, 2001.
On August 17, 1999, the Company amended and
restated its primary credit agreement to provide for an
increase in total borrowings. Borrowings under the
Canadian portion of the amended agreement were used
to refinance certain GRO debt. In conjunction with that
refinancing, the Company recorded a non-cash after
tax extraordinary charge of $262,000 related to the
write off of unamortized deferred financing costs
of the retired debt.
On December 7, 2000, one of the Company’s sub-
sidiaries in Mexico, Servicios, entered into three promis-
sory notes payable totaling $27.5 million with variable
interest rates based on LIBOR plus 3.5%. Two of the
notes have an eight year term with principal payments
of $1.4 million due semi-annually beginning March 15,
2003, through the maturity date of September 15, 2008.
32 ❘ Genesee & Wyoming Inc.
additional $5.0 million in the Company through the
private placement of Redeemable Convertible Preferred
Stock (See Note 12 to Consolidated Financial Statements).
On March 30, 2001 and December 7, 1999, the
Company completed the sale of certain rolling stock to
financial institutions for a net sale price of $6.5 million
and $8.6 million, respectively. The proceeds were used
to reduce borrowings under the Company’s revolving
credit facilities. Simultaneously, the Company entered
into agreements with the financial institutions to lease
this and other rolling stock for a period of eight years
including automatic renewals. The sale/leaseback
transactions resulted in aggregate deferred gains of
$2.4 million, which are being amortized over the term
of the lease as a non-cash offset to rent expense. The
Company fully anticipates renewing these leases at
all available lease renewal dates.
Alternatively, if the Company chooses not to renew
these and certain other leases at their next available
renewal dates, it would have (depending upon the lease)
up to two additional options. One option would
be to return the rolling stock and pay aggregate fees of
approximately $9.0 million. The other option would be
to purchase the rolling stock. The leases that allow this
second option would require payments of approximately
$17.8 million. Management anticipates the future mar-
ket value of the leased rolling stock will equal or exceed
the payments necessary to purchase the rolling stock.
At December 31, 2001 the Company had long-term
debt, including current portion, totaling $60.6 million,
which comprised 22.4% of its total capitalization includ-
ing the Convertible Preferred. At December 31, 2000 the
Company had long-term debt, including current portion,
totaling $104.8 million, which comprised 48.0% of its
total capitalization including the Convertible Preferred.
On February 22, 2002, the Company acquired
Emons Transportation Group, Inc. (Emons) for approxi-
mately $20.0 million in cash, including transaction costs
and net of cash received in the acquisition, and $11.0
million of debt assumed. The Company purchased all
of the outstanding shares of Emons at $2.50 per share.
The Company funded the acquisition through its $103.0
million revolving line of credit held under its primary
The third note has a nine year term with principal pay-
ments of $750,000 due semi-annually beginning March
15, 2003, with a maturity date of September 15, 2009.
The promissory notes are secured by essentially all of
the assets of Servicios and FCCM, and a pledge of the
Company’s shares of Servicios and FCCM. The promis-
sory notes contain certain financial covenants which
Servicios is in compliance with as of December 31, 2001.
In October 2000, the Company amended and restated
its promissory note payable to a Class I railroad, after
making a $1.0 million principal payment, by refinancing
$7.9 million at 8% with interest due quarterly and prin-
cipal payments due in annual installments of $1.0 mil-
lion beginning October 31, 2001 through the maturity
date of October 31, 2008. Prior to this amendment and
restatement, the promissory note payable provided for
annual principal payments of $1.2 million provided a
certain subsidiary of the Company met certain levels
of revenue and cash flow. In accordance with these prior
provisions, the Company was not required to make any
principal payments through 1999.
In November 2001, the Company completed a
universal shelf registration of up to $200.0 million of
various debt and equity securities. The form and terms
of such securities shall be determined when and if these
securities are issued. On December 21, 2001, as an initial
draw on the shelf registration, the Company sold 3.9
million shares of Class A Common Stock in a public
offering at a price of $18.50 per share for net proceeds
of $66.5 million. The proceeds were used to pay off all
revolving debt under the Company’s primary credit
agreement and for general corporate purposes.
In December 2000, to fund its cash investment in
ARG, the Company completed a private placement of
Redeemable Convertible Preferred Stock. The Company
exercised its option to fund $20.0 million of a possible
$25.0 million in gross proceeds from the Convertible
Preferred. In December 2001, upon final approval by
the Surface Transportation Board of the Company’s
acquisition of South Buffalo Railway, the Fund exercised
the option it had received in December 2000 to invest an
Management’s Discussion and Analysis

Genesee & Wyoming Inc. ❘ 33
credit agreement, all of which was available at the time
of the purchase. Emons is a short line railroad holding
company with operations over 340 miles of track in
Maine, Vermont, Quebec and Pennsylvania.
The Company’s railroads have entered into a
number of rehabilitation or construction grants with
state and federal agencies. The grant funds are used
as a supplement to the Company’s normal capital pro-
grams. In return for the grants, the railroads pledge to
maintain various levels of service and maintenance on
the rail lines that have been rehabilitated or constructed.
The Company believes that the levels of service and
maintenance required under the grants are not materially
different from those that would be required without the
grant obligation. In addition to government grants,
customers occasionally provide fixed funding of certain
track rehabilitation or construction projects to facilitate
the Company’s service over that track. The Company
records any excesses in the fixed funding compared to
the actual cost of rehabilitation and construction as
gains in the current period. While the Company has
benefited from these grant funds in recent years, includ-
ing 2001 and 2000, there can be no assurance that the
funds will continue to be available.
On December 7, 2000, in conjunction with the
refinancing of FCCM and Servicios, the International
Finance Corporation invested $1.9 million of equity for
a 12.7% indirect interest in FCCM, through its parent
company Servicios (See Notes 3 and 9 to Consolidated
Financial Statements). Along with its equity investment,
IFC received a put option exercisable in 2005 to sell its
equity stake back to the Company. The put price will
be based on a multiple of earnings before interest,
taxes, depreciation and amortization. The Company
increases its minority interest expense in the event
that the value of the put option exceeds the otherwise
minority interest liability. This put option may result
in a future cash outflow of the Company.
The Company has budgeted approximately $18.0
million in capital expenditures in 2002, primarily for
track rehabilitation. The $18.0 million in capital expen-
ditures is net of $1.8 million that is expected to be funded
by rehabilitation grants from state and federal agencies
to several of the Company’s railroads.
In connection with the Company’s purchase of
selected assets in Australia in 1997, the Company had
committed to the Commonwealth of Australia to spend
approximately $26.7 million (AU $52.3 million) to reha-
bilitate track structures and equipment by December 31,
2002. This commitment was transferred to ARG in
December, 2000.
The Company has historically relied primarily on
cash generated from operations to fund working capital
and capital expenditures relating to ongoing operations,
while relying on borrowed funds and stock issuances to
finance acquisitions and investments in unconsolidated
affiliates. The Company believes that its cash flow from
operations together with amounts available under the
credit facilities will enable the Company to meet its
liquidity and capital expenditure requirements relating
to ongoing operations for at least the duration of the
credit facilities.
The Company has the potential to draw on its
remaining universal shelf registration up to $128.5
million of various debt and equity securities. The form
and terms of such securities shall be determined when
and if these securities are issued.
Disclosures About Market Risk
The Company actively monitors its exposure to interest
rate and foreign currency exchange rate risks and uses
derivative financial instruments to manage the impact
of certain of these risks. The Company uses derivatives
only for purposes of managing risk associated with
underlying exposures. The Company does not trade or
use instruments with the objective of earning financial
gains on the exchange rate or interest rate fluctuations
alone, nor does it use instruments where there are not
underlying exposures. The Company’s use of derivative
financial instruments may result in short-term gains or
losses and increased earnings volatility. Complex instru-
ments involving leverage or multipliers are not used.
Management believes that its use of derivative instru-
ments to manage risk is in the Company’s best interest.
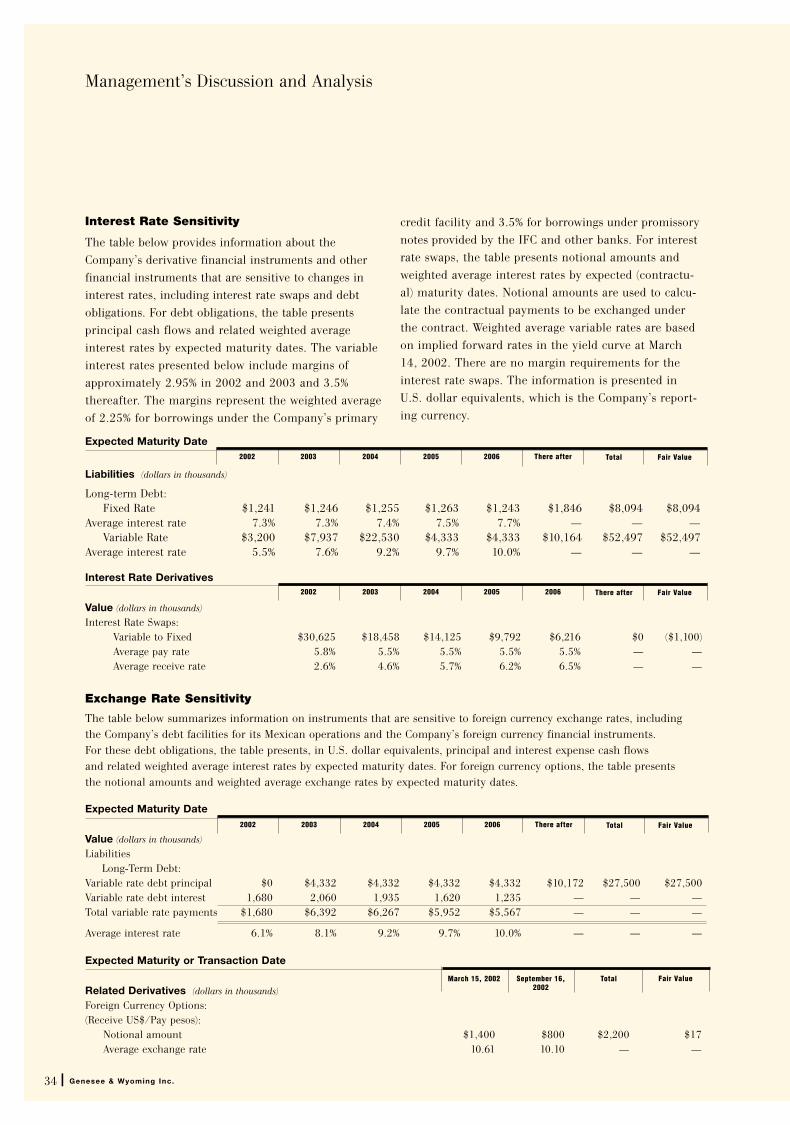
34 ❘ Genesee & Wyoming Inc.
Management’s Discussion and Analysis
20062002 2003 2004 2005 There after Total Fair Value
20062002 2003 2004 2005 There after Total Fair Value
Fair ValueTotalSeptember 16,2002
March 15, 2002
20052002 2003 2004 2006 There after Fair Value
Expected Maturity Date
Liabilities (dollars in thousands)
Long-term Debt: Fixed Rate $1,241 $1,246 $1,255 $1,263 $1,243 $1,846 $8,094 $8,094
Average interest rate 7.3% 7.3% 7.4% 7.5% 7.7% — — —Variable Rate $3,200 $7,937 $22,530 $4,333 $4,333 $10,164 $52,497 $52,497
Average interest rate 5.5% 7.6% 9.2% 9.7% 10.0% — — —
Interest Rate Derivatives
Value (dollars in thousands)
Interest Rate Swaps: Variable to Fixed $30,625 $18,458 $14,125 $9,792 $6,216 $0 ($1,100) Average pay rate 5.8% 5.5% 5.5% 5.5% 5.5% — — Average receive rate 2.6% 4.6% 5.7% 6.2% 6.5% — —
Exchange Rate Sensitivity
The table below summarizes information on instruments that are sensitive to foreign currency exchange rates, including the Company’s debt facilities for its Mexican operations and the Company’s foreign currency financial instruments. For these debt obligations, the table presents, in U.S. dollar equivalents, principal and interest expense cash flows and related weighted average interest rates by expected maturity dates. For foreign currency options, the table presents the notional amounts and weighted average exchange rates by expected maturity dates.
Expected Maturity Date
Value (dollars in thousands)
LiabilitiesLong-Term Debt:
Variable rate debt principal $0 $4,332 $4,332 $4,332 $4,332 $10,172 $27,500 $27,500Variable rate debt interest 1,680 2,060 1,935 1,620 1,235 — — —Total variable rate payments $1,680 $6,392 $6,267 $5,952 $5,567 — — —
Average interest rate 6.1% 8.1% 9.2% 9.7% 10.0% — — —
Expected Maturity or Transaction Date
Related Derivatives (dollars in thousands)
Foreign Currency Options: (Receive US$/Pay pesos):
Notional amount $1,400 $800 $2,200 $17Average exchange rate 10.61 10.10 — —
Interest Rate Sensitivity
The table below provides information about theCompany’s derivative financial instruments and otherfinancial instruments that are sensitive to changes ininterest rates, including interest rate swaps and debtobligations. For debt obligations, the table presents principal cash flows and related weighted average interest rates by expected maturity dates. The variableinterest rates presented below include margins ofapproximately 2.95% in 2002 and 2003 and 3.5% thereafter. The margins represent the weighted averageof 2.25% for borrowings under the Company’s primary
credit facility and 3.5% for borrowings under promissorynotes provided by the IFC and other banks. For interestrate swaps, the table presents notional amounts andweighted average interest rates by expected (contractu-al) maturity dates. Notional amounts are used to calcu-late the contractual payments to be exchanged underthe contract. Weighted average variable rates are basedon implied forward rates in the yield curve at March14, 2002. There are no margin requirements for theinterest rate swaps. The information is presented inU.S. dollar equivalents, which is the Company’s report-ing currency.
Genesee & Wyoming Inc. ❘ 35
ARG derives a significant portion of its rail freight
revenues from shipments of grain. For example, for the
year ended December 31, 2001, grain shipments in
South Australia and Western Australia generated approxi-
mately 27.4% of ARG’s operating revenues. A decrease in
grain shipments as a result of adverse weather or other
negative agricultural conditions could have a material
effect on the Company’s income from ARG and financial
condition.
Australia’s open access regime could lead to additional
competition for ARG’s business, which could result in
decreased revenues and profit margins. The legislative
and regulatory framework in Australia allows third party
rail operators to gain access to ARG’s railway infrastruc-
ture, and in turn governs ARG’s access to track owned
by others. ARG currently operates on the Commonwealth-
owned interstate network from Sydney, New South Wales
and Melbourne, Victoria to Kalgoorlie, Western Australia
and on State-owned track in New South Wales. Access
charges are paid for access onto the track of other
companies, and access charges under state and federal
regimes continue to evolve because privatization of
railways in Australia is recent. Where ARG pays access
fees to others, if those fees are increased, ARG’s operat-
ing margins could be negatively affected. Conversely,
if the federal government or respective state regulators
determine that access fees charged to current or prospec-
tive third party rail freight operators by ARG in Western
Australia or South Australia do not meet competitive
standards, then ARG’s income from those fees could be
negatively affected. When ARG operates over track
networks owned by others, including Commonwealth-
owned and State-owned networks, the owners of the
network rather than the operators are responsible for
scheduling the use of the tracks as well as for determin-
ing the amount and timing of the expenditures neces-
sary to maintain the network in satisfactory condition.
Therefore, in areas where ARG operates over tracks
owned by others, it is subject to train scheduling set
Risk Factors of Foreign Operations
The Company’s operations and financial condition
are subject to certain risks that could cause actual oper-
ating and financial results to differ materially from
those expressed or forecast in the Company’s forward-
looking statements. These risks include the fact that
the Company’s 50/50 joint venture in Australia, ARG,
and some of the Company’s significant subsidiaries
transact business in foreign countries, namely in
Australia, Canada, Mexico and Bolivia. In addition,
the Company may consider acquisitions in other foreign
countries in the future. The risks of doing business
in foreign countries may include:
■ changes or greater volatility in the economies
of those countries,
■ effects of currency exchange controls,
■ changes to the regulatory environment of those
countries,
■ changes to the tax laws and regulations of those
countries,
■ restrictions on the withdrawal of foreign
investment and earnings,
■ the nationalization of the businesses that the
Company operates,
■ the actual or perceived failure by the Company
to fulfill commitments under concession agreements,
■ the potential instability of foreign governments,
including from domestic insurgency movements, and
■ the challenge of managing a culturally and
geographically diverse operation.
The Company’s operations in foreign countries are
also subject to economic uncertainties, including among
others, risk of renegotiation or modification of existing
agreements or arrangements with governmental authori-
ties, exportation and transportation tariffs, foreign
exchange restrictions and changes in taxation structure.

36 ❘ Genesee & Wyoming Inc.
by the owners as well as the risk that the network is not
adequately maintained. Either risk could affect ARG’s
results of operations and financial condition.
The results of operations of the Company’s foreign
operations are reported in the local currency - the
Australian dollar, the Canadian dollar and the Mexican
peso - and then translated into U.S. dollars at the appli-
cable exchange rates for inclusion in the Company’s
financial statements. The functional currency of the
Company’s Bolivian operations is the U.S. dollar. The
exchange rates between some of these currencies and
the U.S. dollar have fluctuated significantly in recent
years and may continue to do so in the future. In addi-
tion, because the Company’s financial statements are
stated in U.S. dollars, the translation effect of such
fluctuations may affect the Company’s results of opera-
tions and financial position and may affect the compara-
bility of the Company’s results between financial periods.
Forward-Looking Statements
This discussion and analysis contains forward-looking
statements with the meaning of Section 27A of the
Securities Act of 1933, as amended, and Section 21E
of the Securities Exchange Act of 1934, as amended,
regarding future events and future performance of
Genesee & Wyoming Inc. Words such as “anticipates,”
“intends,” “plans,” “believes,” “seeks,” “estimates,”
variations of these words and similar expressions are
intended to identify these forward-looking statements.
These statements are not guarantees of future perform-
ance and are subject to certain risks, uncertainties and
assumptions that are difficult to forecast. Actual results
may differ materially from those expressed or forecast
in these forward-looking statements. These risks and
uncertainties include those noted above under the
caption “Risk Factors of Foreign Operations” as well
as those noted in documents that the Company files
from time to time with the Securities and Exchange
Commission, such as Forms 10-K and 10-Q which con-
tain additional important factors that could cause actual
results to differ from current expectations and from
the forward-looking statements contained in this
discussion and analysis.
Management’s Discussion and Analysis

2001
Year Ended December 31,
19981999 2000 1997
(In thousands, except per share amounts)
Selected Financial Data
Income Statement Data:
Operating revenues $173,576 $206,530 $175,586 $147,472 $103,643Operating expenses 151,436 182,777 153,218 127,904 87,200
Income from operations 22,140 23,753 22,368 19,568 16,443Interest expense (10,049) (11,233) (8,462) (7,071) (3,349)Gain on sale of 50% equity in
Australian operations 2,985 10,062 — — —Other income, net 1,311 1,508 1,682 7,290 345
Income before income taxes, equity earnings and extraordinary item 16,387 24,090 15,588 19,787 13,439
Income taxes 6,166 10,569 2,175 7,708 5,441Equity earnings (losses) 8,863 411 (618) (645) —
Income before extraordinary item 19,084 13,932 12,795 11,434 7,998Extraordinary item — — (262) — —
Net income 19,084 13,932 12,533 11,434 7,998Preferred stock dividends and cost accretion 957 52 — — —
Net income available to common stockholders $18,127 $13,880 $12,533 $11,434 $7,998
Basic Earnings Per Common Share:
Net income available to commonstockholders before extraordinary item $1.72 $1.42 $1.27 $0.98 $0.68
Extraordinary item — — (0.03) — —
Net income $1.72 $1.42 $1.24 $0.98 $0.68
Weighted average number of shares of common stock 10,509 9,779 10,104 11,671 11,813
Diluted Earnings Per Common Share:
Net income before extraordinary item $1.48 $1.38 $1.26 $0.97 $0.65
Extraordinary item — — (0.03) — —
Net income $1.48 $1.38 $1.23 $0.97 $0.65
Weighted average number of shares of common stock and equivalents 12,917 10,094 10,215 11,765 12,256
Balance Sheet Data at Year End:
Total assets $402,519 $338,383 $216,760 $210,532 $145,339
Total debt 60,591 104,801 108,376 65,690 74,144
Redeemable Convertible Preferred Stock 23,808 18,849 — — —
Stockholders’ equity 185,663 94,732 81,829 74,537 68,343
Genesee & Wyoming Inc. ❘ 37

38 ❘ Genesee & Wyoming Inc.
Report of Independent Public Accountants
To the Board of Directors and the Shareholders of Genesee & Wyoming Inc.:
We have audited the accompanying consolidated balance sheets of GENESEE & WYOMING INC. (a Delaware corporation)
AND SUBSIDIARIES as of December 31, 2001 and 2000, and the related consolidated statements of income, stockholders’
equity and comprehensive income and cash flows for each of the three years in the period ended December 31, 2001.
These financial statements are the responsibility of the Company’s management. Our responsibility is to express an
opinion on these financial statements based on our audits. We did not audit the financial statements of Australian
Railroad Group Pty. Ltd. (ARG), the investment in which is reflected in the accompanying financial statements using the
equity method of accounting. The investment in ARG represents 14.8 percent and 16.1 percent of the Company’s total
assets as of December 31, 2001 and 2000, respectively, and the equity in its net income represents 44.3 percent of the
Company’s net income for the year ended December 31, 2001. Additionally, the summarized financial data for ARG
contained in Note 7 is based on the financial statements of ARG, which were audited by other auditors. Their report
has been furnished to us, and our opinion, insofar as it relates to amounts included in the Company’s financial state-
ments for ARG, including the data in Note 7, is based on the report of the other auditors.
We conducted our audits in accordance with auditing standards generally accepted in the United States. Those stan-
dards require that we plan and perform the audits to obtain reasonable assurance about whether the financial state-
ments are free of material misstatement. An audit includes examining, on a test basis, evidence supporting the amounts
and disclosures in the financial statements. An audit also includes assessing the accounting principles used and signifi-
cant estimates made by management, as well as evaluating the overall financial statement presentation. We believe that
our audits provide a reasonable basis for our opinion.
In our opinion, based on our audits and the report of other auditors, the financial statements referred to above pres-
ent fairly, in all material respects, the financial position of Genesee & Wyoming Inc. and Subsidiaries as of December 31,
2001 and 2000, and the results of their operations and their cash flows for each of the three years in the period ended
December 31, 2001, in conformity with accounting principles generally accepted in the United States.
ARTHUR ANDERSEN LLP
Chicago, Illinois
February 11, 2002
Genesee & Wyoming Inc. ❘ 39
To the Board of Directors and Stockholders of Australian Railroad Group Pty Ltd
We have audited the consolidated balance sheet of Australian Railroad Group Pty Ltd and subsidiaries as of December
31, 2001 and the related consolidated statements of income, stockholders’ equity and comprehensive income and
cash flows for the year ended December 31, 2001. These financial statements are the responsibility of the Company’s
management. Our responsibility is to express an opinion on these financial statements based on our audit.
We conducted our audit in accordance with auditing standards generally accepted in the United States. Those stan-
dards require that we plan and perform the audit to obtain reasonable assurance about whether the financial statements
are free of material misstatement. An audit includes examining, on a test basis, evidence supporting the amounts and
disclosures in the financial statements. An audit also includes assessing the accounting principles used and significant
estimates made by management, as well as evaluating the overall financial statement presentation. We believe that our
audit provides a reasonable basis for our opinion.
In our opinion, the financial statements referred to above present fairly, in all material respects, the consolidated
financial position of Australian Railroad Group Pty Ltd and subsidiaries at December 31, 2001 and the consolidated
results of their operations and their cash flows for the year ended December 31, 2001, in conformity with accounting
principles generally accepted in the United States. The balance sheet at December 31, 2000 was not audited by us and,
accordingly, we do not express an opinion on it.
Ernst & Young
Perth, Western Australia
February 11, 2002
Report of Independent Auditors

40 ❘ Genesee & Wyoming Inc.
Consolidated Balance Sheets
2001 2000
The accompanying notes are an integral part of these consolidated financial statements.
(in thousands, except share amounts)
Assets
Current Assets:Cash and cash equivalents $28,732 $3,373Accounts receivable, net 41,025 45,209Materials and supplies 4,931 5,023Prepaid expenses and other 6,514 7,249Deferred income tax assets, net 2,150 2,202
Total current assets 83,352 63,056
Property and Equipment, net 199,102 177,317
Investment in Unconsolidated Affiliates 69,402 64,091
Service Assurance Agreement, net 10,566 11,315
Other Assets, net 40,097 22,604
Total assets $402,519 $338,383
Liabilities and Stockholders’ Equity
Current Liabilities:Current portion of long-term debt $4,441 $3,996 Accounts payable 45,206 43,045Accrued expenses 12,077 10,860
Total current liabilities 61,724 57,901
Long-Term Debt, less current portion 56,150 100,805
Deferred Income Tax Liabilities, net 24,620 22,179
Deferred Items—grants from governmental agencies 35,362 32,897
Deferred Gain—sale/leaseback 4,607 3,558
Other Long-Term Liabilities 7,731 4,737
Minority Interest 2,854 2,725
Redeemable Convertible Preferred Stock 23,808 18,849
Stockholders’ Equity:
Class A Common Stock, $0.01 par value, one vote per share; 30,000,000 shares authorized; 15,074,462 and 10,370,627 shares issued and12,737,601 and 8,116,833 shares outstanding (net of 2,336,861 and 2,253,794shares in treasury) on December 31, 2001 and 2000, respectively 151 104
Class B Common Stock, $0.01 par value, ten votes per share; 5,000,000 shares authorized; 1,805,292 and 1,902,257 shares issued and outstanding on December 31, 2001 and 2000, respectively 18 19
Additional paid-in capital 123,597 49,642Retained earnings 79,030 60,903Accumulated other comprehensive loss (4,905) (4,883) Less treasury stock, at cost (12,228) (11,053)
Total stockholders’ equity 185,663 94,732
Total liabilities and stockholders’ equity $402,519 $338,383
December 31,
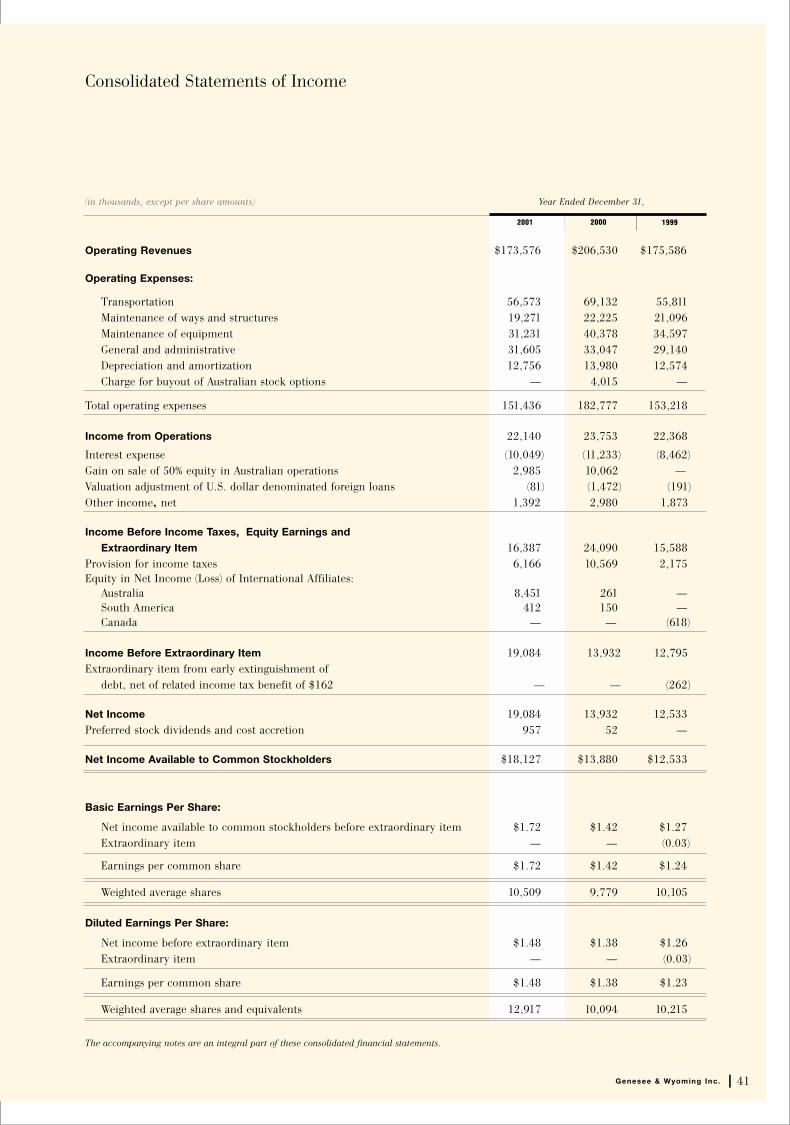
Genesee & Wyoming Inc. ❘ 41
Consolidated Statements of Income
(in thousands, except per share amounts)
Operating Revenues $173,576 $206,530 $175,586
Operating Expenses:
Transportation 56,573 69,132 55,811 Maintenance of ways and structures 19,271 22,225 21,096Maintenance of equipment 31,231 40,378 34,597General and administrative 31,605 33,047 29,140Depreciation and amortization 12,756 13,980 12,574Charge for buyout of Australian stock options — 4,015 —
Total operating expenses 151,436 182,777 153,218
Income from Operations 22,140 23,753 22,368
Interest expense (10,049) (11,233) (8,462)Gain on sale of 50% equity in Australian operations 2,985 10,062 —Valuation adjustment of U.S. dollar denominated foreign loans (81) (1,472) (191)Other income, net 1,392 2,980 1,873
Income Before Income Taxes, Equity Earnings and
Extraordinary Item 16,387 24,090 15,588Provision for income taxes 6,166 10,569 2,175Equity in Net Income (Loss) of International Affiliates:
Australia 8,451 261 —South America 412 150 —Canada — — (618)
Income Before Extraordinary Item 19,084 13,932 12,795Extraordinary item from early extinguishment of
debt, net of related income tax benefit of $162 — — (262)
Net Income 19,084 13,932 12,533Preferred stock dividends and cost accretion 957 52 —
Net Income Available to Common Stockholders $18,127 $13,880 $12,533
Basic Earnings Per Share:
Net income available to common stockholders before extraordinary item $1.72 $1.42 $1.27Extraordinary item — — (0.03)
Earnings per common share $1.72 $1.42 $1.24
Weighted average shares 10,509 9,779 10,105
Diluted Earnings Per Share:
Net income before extraordinary item $1.48 $1.38 $1.26Extraordinary item — — (0.03)
Earnings per common share $1.48 $1.38 $1.23
Weighted average shares and equivalents 12,917 10,094 10,215
20002001 1999
Year Ended December 31,
The accompanying notes are an integral part of these consolidated financial statements.

Consolidated Statements of Stockholders’ Equity and Comprehensive Income
(dollars in thousands)
Balance, December 31, 1998 $102 $19 $46,662 $34,490 $(2,107) $(4,629) $74,537
Comprehensive income, net of tax:Net income — — — 12,533 — — 12,533Currency translation adjustments — — — — 791 — 791
Proceeds from employee stock purchases — — 61 — — — 61 Shares issued for investment in
unconsolidated affiliate — — 281 — — — 281Treasury stock acquisitions, 1,473,750 shares — — — — — (6,374) (6,374)
Balance, December 31, 1999 102 19 47,004 47,023 (1,316) (11,003) 81,829
Comprehensive income, net of tax:Net income — — — 13,932 — — 13,932Currency translation adjustments — — — — (3,567) — (3,567)
Proceeds from employee stock purchases 2 — 2,217 — — — 2,219Impact of sale of puttable equity in
Mexican operations — — (75) — — — (75)Tax benefit from exercise of stock options — — 496 — — — 496Accretion of fees on Redeemable
Convertible Preferred Stock — — — (8) — — (8)4% dividend earned on Redeemable
Convertible Preferred Stock — — — (44) — — (44)Treasury stock acquisitions, 3,794 shares — — — — — (50) (50)
Balance, December 31, 2000 104 19 49,642 60,903 (4,883) (11,053) 94,732
Comprehensive income, net of tax:Net income — — — 19,084 — — 19,084Currency translation adjustments — — — — 708 — 708Fair market value adjustments
of cash flow hedges — — — — (730) — (730)Proceeds from Class A Common Stock
Offering, net of fees 38 — 66,495 — — — 66,533Proceeds from employee stock purchases 8 — 6,254 — — — 6,262Conversion of Class B Common Stock
to Class A Common Stock 1 (1) — — — — —Tax benefit from exercise of stock options — — 1,206 — — — 1,206Accretion of fees on Redeemable
Convertible Preferred Stock — — — (146) — — (146)4% dividend earned on Redeemable
Convertible Preferred Stock — — — (811) — — (811)Treasury stock acquisitions, 83,067 shares — — — — — (1,175) (1,175)
Balance, December 31, 2001 $151 $18 $123,597 $79,030 $(4,905) $(12,228) $185,663
Class A Common Stock
Class B Common Stock
Additional Paid-in Capital
RetainedEarnings
AccumulatedOther
ComprehensiveLoss
Treasury Stock
TotalStockholders’
Equity
The accompanying notes are an integral part of these consolidated financial statements.
42 ❘ Genesee & Wyoming Inc.
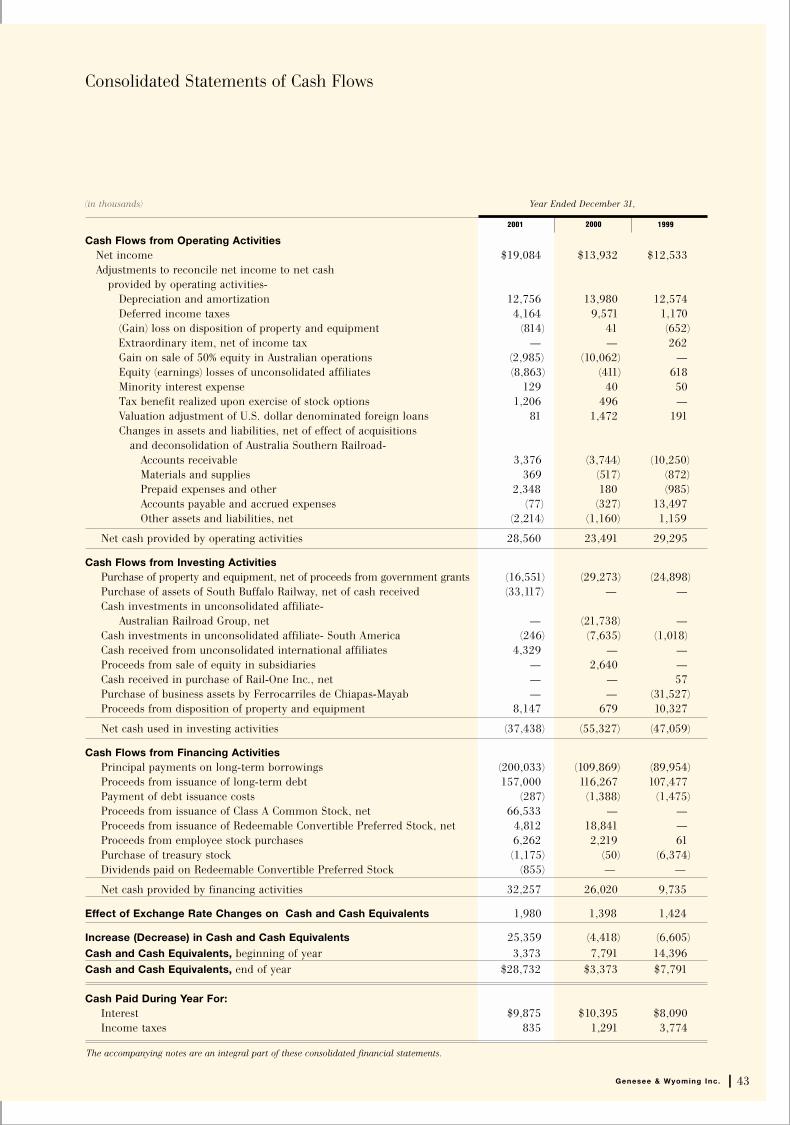
Consolidated Statements of Cash Flows
(in thousands)
Cash Flows from Operating ActivitiesNet income $19,084 $13,932 $12,533Adjustments to reconcile net income to net cash
provided by operating activities-Depreciation and amortization 12,756 13,980 12,574Deferred income taxes 4,164 9,571 1,170(Gain) loss on disposition of property and equipment (814) 41 (652) Extraordinary item, net of income tax — — 262Gain on sale of 50% equity in Australian operations (2,985) (10,062) —Equity (earnings) losses of unconsolidated affiliates (8,863) (411) 618Minority interest expense 129 40 50Tax benefit realized upon exercise of stock options 1,206 496 —Valuation adjustment of U.S. dollar denominated foreign loans 81 1,472 191Changes in assets and liabilities, net of effect of acquisitions
and deconsolidation of Australia Southern Railroad-Accounts receivable 3,376 (3,744) (10,250)Materials and supplies 369 (517) (872)Prepaid expenses and other 2,348 180 (985)Accounts payable and accrued expenses (77) (327) 13,497Other assets and liabilities, net (2,214) (1,160) 1,159
Net cash provided by operating activities 28,560 23,491 29,295
Cash Flows from Investing ActivitiesPurchase of property and equipment, net of proceeds from government grants (16,551) (29,273) (24,898)Purchase of assets of South Buffalo Railway, net of cash received (33,117) — —Cash investments in unconsolidated affiliate-
Australian Railroad Group, net — (21,738) —Cash investments in unconsolidated affiliate- South America (246) (7,635) (1,018)Cash received from unconsolidated international affiliates 4,329 — —Proceeds from sale of equity in subsidiaries — 2,640 —Cash received in purchase of Rail-One Inc., net — — 57Purchase of business assets by Ferrocarriles de Chiapas-Mayab — — (31,527)Proceeds from disposition of property and equipment 8,147 679 10,327
Net cash used in investing activities (37,438) (55,327) (47,059)
Cash Flows from Financing ActivitiesPrincipal payments on long-term borrowings (200,033) (109,869) (89,954)Proceeds from issuance of long-term debt 157,000 116,267 107,477Payment of debt issuance costs (287) (1,388) (1,475)Proceeds from issuance of Class A Common Stock, net 66,533 — —Proceeds from issuance of Redeemable Convertible Preferred Stock, net 4,812 18,841 —Proceeds from employee stock purchases 6,262 2,219 61Purchase of treasury stock (1,175) (50) (6,374)Dividends paid on Redeemable Convertible Preferred Stock (855) — —
Net cash provided by financing activities 32,257 26,020 9,735
Effect of Exchange Rate Changes on Cash and Cash Equivalents 1,980 1,398 1,424
Increase (Decrease) in Cash and Cash Equivalents 25,359 (4,418) (6,605)Cash and Cash Equivalents, beginning of year 3,373 7,791 14,396Cash and Cash Equivalents, end of year $28,732 $3,373 $7,791
Cash Paid During Year For:Interest $9,875 $10,395 $8,090Income taxes 835 1,291 3,774
Year Ended December 31,
20002001 1999
The accompanying notes are an integral part of these consolidated financial statements.
Genesee & Wyoming Inc. ❘ 43

44 ❘ Genesee & Wyoming Inc.
Notes to Consolidated Financial Statements
1. Business and Customers:Genesee & Wyoming Inc. and Subsidiaries (the Company)
has interests in twenty-four short line and regional
railroads through its various operating subsidiaries and
unconsolidated affiliates of which eighteen are located
in the United States, two are located in Australia, one
is located in Bolivia, one is located in Mexico, and two
are located in Canada. The eighteen U. S. railroads are
wholly owned by the Company through various acquisi-
tions from 1985 to, most recently, the acquisition of
South Buffalo Railway (South Buffalo) in October 2001.
The two Canadian railroads have been wholly owned
by the Company since its June 2000 acquisition of the
remaining 5% minority holding. In April 1999, the
Company increased its ownership in these Canadian
roads from 47.5% to 95% and began consolidating their
results. The Mexican railroad, acquired in September
1999, was wholly owned by the Company until
December 2000, when the Company sold a minority
12.7% interest in the operations. The Company wholly
owned one of the Australian railroads from November
1997 to December 2000, at which point the Company
contributed the operations into a venture that then
acquired the second Australian railroad. The Company
now owns 50% of the venture and accounts for its invest-
ment under the equity method of accounting. In July
2001, the Company increased its indirect equity interest
in the Bolivian railroad by 0.34% to 22.89% with an
additional investment of cash. Previously, through a
majority owned subsidiary, the Company acquired an
indirect 21.87% interest in the Bolivian railroad in
November 2000, and an indirect 0.68% interest in
September 1999. This investment is also accounted
for under the equity method of accounting. See
Note 3 for descriptions of the Company’s expansions
in recent years.
The Company, through its leasing subsidiary,
also leases and manages railroad transportation equip-
ment in the United States and Canada. The Company,
through its industrial switching subsidiary, provides
freight car switching and ancillary rail services.
A large portion of the Company’s operating revenue
is attributable to customers operating in the electric
utility, cement and forest products industries in North
America, and prior to the December 16, 2000 deconsoli-
dation of Australian railroad operations, the farm and
food products, iron ores and transportation (hook and
pull) industries in Australia. As the Company acquires
new railroad operations, the base of customers and
industries served continues to grow and diversify.
The largest ten customers accounted for approximately
28%, 29% and 36% of the Company’s operating revenues
in 2001, 2000 and 1999, respectively. In 2001, the
Company’s largest customer was a coal-fired electricity
generating plant which accounted for approximately
7% of the Company’s operating revenues. In 2000,
no single customer accounted for more than 5% of the
Company’s operating revenue. In 1999, one customer in
the electric utility industry accounted for approximately
10% of the Company’s operating revenues (see Note 16).
The Company regularly grants trade credit to most of its
customers. In addition, the Company grants trade credit
to other railroads through the routine interchange of
traffic. Although the Company’s accounts receivable
include a diverse number of customers and railroads,
the collection of these receivables is substantially
dependent upon the economies of the regions in which
the Company operates, the electric utility, cement and
forest products industries, and the railroad sector of
the economy in general.
The general downturn in economies in North
America in 2001 has adversely affected the Company’s
cyclical shipments of commodities such as paper prod-
ucts in Canada, chemicals in the United States, and
cement in Mexico. However, shipments of other impor-
tant commodities such as coal and salt are less affected
by economic downturns and are more closely affected
by the weather. The economic downturn has also
impacted the Company’s customers and while a limited
number of them have declared bankruptcy, their
traffic volumes have remained largely unaffected
and the impact on the collection of their receivables
has not been significant to date.

Genesee & Wyoming Inc. ❘ 45
related undiscounted future cash flows over the remain-
ing lives of assets in measuring whether or not an
impairment has occurred. If an impairment is identified,
a loss would be reported to the extent that the carrying
value of the related assets exceeds the fair value of those
assets as determined by valuation techniques available
in the circumstances. (See Note 21 regarding adoption
of SFAS No.144 “Accounting for the Impairment or
Disposal of Long-Lived Assets” effective January 1, 2002.)
Grants
Grants received from governmental agencies are recorded
as long-term liabilities as received and amortized over
the same period which the underlying purchased assets
are depreciated. In addition to government grants,
customers occasionally provide fixed funding of certain
track rehabilitation or construction projects to facilitate
the Company’s service over that track. The Company
records any excesses in the fixed funding compared to
the actual cost of rehabilitation and construction as
gains in the current period.
Insurance
The Company maintains insurance, with varying
deductibles up to $400,000 per incident for liability
and up to $250,000 per incident for property damage,
for claims resulting from train derailments and other
accidents related to its railroad and industrial switching
operations. Additionally, the Company is self-insured
for general employee health and medical claims.
Accruals for claims, limited when appropriate to the
applicable deductible, are estimated and recorded
when such claims are incurred.
Gains/Losses on Sales of Stock in Subsidiaries
The Company records gains and losses on the sale of
the stock of its subsidiaries in current earnings unless
the sales transaction is part of a broader corporate
reorganization which involves the potential for a repur-
chase of the shares at a future date. If the sale is part
of a broader corporate reorganization, gains and losses
are recorded in additional paid in capital.
2. Significant Accounting Policies:Principles of Consolidation
The consolidated financial statements include the
accounts of the Company and its controlled subsidiaries.
The Company’s investments in unconsolidated affiliates
are accounted for under the equity method. All signifi-
cant intercompany transactions and accounts have
been eliminated in consolidation.
Revenue Recognition
Railroad revenues are estimated and recognized as
shipments initially move onto the Company’s tracks,
which, due to the relatively short length of haul, is not
materially different from the recognition of revenues as
shipments progress. Industrial switching and other serv-
ice revenues are recognized as such services are provided.
Cash Equivalents
The Company considers all highly liquid instruments
with a maturity of three months or less when purchased
to be cash equivalents.
Materials and Supplies
Materials and supplies consist of purchased items for
improvement and maintenance of road property and
equipment, and are stated at the lower of average
cost or market.
Property and Equipment
Property and equipment are carried at historical cost.
Acquired railroad property is recorded at the purchased
cost. Major renewals or betterments are capitalized while
routine maintenance and repairs are charged to expense
when incurred. Gains or losses on sales or other disposi-
tions are credited or charged to other income upon
disposition. Depreciation is provided on the straight-line
method over the useful lives of the road property
(20-30 years) and equipment (3-20 years).
The Company continually evaluates whether events
and circumstances have occurred that indicate that its
long-lived assets may not be recoverable. When factors
indicate that assets should be evaluated for possible
impairment, the Company uses an estimate of the

46 ❘ Genesee & Wyoming Inc.
Notes to Consolidated Financial Statements
Service Assurance Agreement
The service assurance agreement represents a commit-
ment from a significant customer of a U.S. railroad that
the Company acquired in 1996 (see Note 16), which
grants the Company the exclusive right to serve indefi-
nitely three specific facilities. The service assurance agree-
ment is amortized on a straight-line basis over the same
period as the related track structure, which is 20 years,
and accumulated amortization was $4.4 million and $3.6
million as of December 31, 2001 and 2000, respectively.
Common Stock Splits
On February 14, 2002 and May 1, 2001 the Company
announced three-for-two common stock splits in the
form of 50% stock dividends distributed on March 14,
2002 to shareholders of record as of February 28, 2002,
and on June 15, 2001 to shareholders of record as of
May 31, 2001, respectively. All share, per share and par
value amounts presented herein have been restated to
reflect the retroactive effect of both of the stock splits.
Earnings Per Share
Common shares issuable under unexercised stock
options, calculated under the treasury stock method,
and redeemable convertible preferred stock (see Note 12)
are the only reconciling items between the Company’s
basic and diluted weighted average shares outstanding.
The number of shares from options used to calculate
diluted earnings per share is 1,289,826, 1,649,177 and
460,688 for 2001, 2000 and 1999, respectively. Options
to purchase 70,875 and 1,434,376 additional shares of
stock were outstanding as of December 31, 2000 and
1999, respectively, but were not included in the compu-
tation of diluted earnings per share because the options’
exercise prices were greater than the average market
price of the common shares. Also included in the diluted
earnings per share calculation in 2001 and 2000 are
1,983,324 shares and 107,207 shares, respectively, of
common stock equivalents which represent the weighted
average share impact of the assumed conversion of the
redeemable convertible preferred stock.
Disclosures About Fair Value of Financial Instruments
The following methods and assumptions were used
to estimate the fair value of each class of financial
instrument held by the Company:
Current assets and current liabilities: The carrying
value approximates fair value due to the short
maturity of these items.
Long-term debt: The fair value of the Company’s
long-term debt is based on secondary market indica-
tors. Since the Company’s debt is not quoted, esti-
mates are based on each obligation’s characteristics,
including remaining maturities, interest rate, credit
rating, collateral, amortization schedule and liquidity.
The carrying amount approximates fair value.
Foreign Currency
The financial statements of the Company’s foreign
subsidiaries were prepared in their respective local
currencies and translated into U.S. dollars based on
the current exchange rate at the end of the period for
balance sheet items and a monthly weighted-average rate
for the statement of income items. Translation adjust-
ments are reflected as currency translation adjustments
in Stockholders’ Equity and accordingly only affect
comprehensive income.
Revaluation of U.S. dollar denominated foreign loans
into the appropriate local currency resulted in losses of
$81,000, $1.5 million and $191,000 in 2001, 2000 and
1999, respectively. Additionally, foreign currency exchange
transaction losses, most notably, $508,000 from the par-
tial settlement of an Australian dollar denominated
receivable in 2001, are reported in Other Income, net.
Management Estimates
The preparation of financial statements in conformity
with generally accepted accounting principles requires
management to make estimates and assumptions
that affect the reported amounts of assets, liabilities,
revenues and expenses during the reporting period.
Actual results could differ from those estimates.
Reclassifications
Certain prior year balances have been reclassified to
conform with the 2001 presentation.

Genesee & Wyoming Inc. ❘ 47
As contemplated with the acquisition, the Company
will close the former South Buffalo headquarters office
in March 2002 and has implemented an early retirement
program under which 28 South Buffalo employees were
terminated in December 2001. The aggregate $876,000
cost of these restructuring activities is considered a
liability assumed in the acquisition, and therefore is
included in goodwill. The majority of these costs were
paid in 2001.
The acquisition of South Buffalo triggered the right
of The 1818 Fund III, L.P. (the Fund), a private equity
fund managed by Brown Brothers Harriman & Co., to
acquire an additional $5.0 million of the Company’s
Series A Redeemable Convertible Preferred Stock (the
Convertible Preferred), and the Fund exercised that
right on December 11, 2001 (see Note 12).
Australia
On December 16, 2000, the Company, through its
newly-formed joint venture, Australian Railroad Group
Pty. Ltd. (ARG), completed the acquisition of Westrail
Freight from the government of Western Australia for
approximately $334.4 million U.S. dollars including
working capital. ARG is a joint venture owned 50% by
the Company and 50% by Wesfarmers Limited, a public
corporation based in Perth, Western Australia. Westrail
Freight is composed of the freight operations of the
formerly state-owned railroad of Western Australia.
To complete the acquisition, the Company con-
tributed its formerly wholly-owned subsidiary, Australia
Southern Railroad (ASR), to ARG along with the
Company’s 2.6% interest in the Asia Pacific Transport
Consortium (APTC) – a consortium selected to construct
and operate the Alice Springs to Darwin railway line in
the Northern Territory of Australia. Additionally, the
Company contributed $21.4 million of cash to ARG
(partially funded by a $20.0 million private placement
of the Convertible Preferred with the Fund) while
Wesfarmers contributed $64.2 million in cash, including
$8.2 million which represents a long-term Australian
dollar denominated non-interest bearing note to match a
similar note due to the Company from ASR at the date of
the transaction. ARG funded the remaining purchase price
with proceeds from its Australian bank credit facility.
3. Expansion of Operations:United States
On February 22, 2002, the Company acquired Emons
Transportation Group, Inc. (Emons) for approximately
$20.0 million (Unaudited) in cash, including transaction
costs and net of cash received in the acquisition, and
$11.0 million (Unaudited) of debt assumed. The Company
purchased all of the outstanding shares of Emons at
$2.50 per share. The Company funded the acquisition
through its $103.0 million revolving line of credit held
under its primary credit agreement, all of which was
available at the time of the purchase. Emons is a short
line railroad holding company with operations over
340 miles of track in Maine, Vermont, Québec and
Pennsylvania.
On October 1, 2001, the Company acquired all of
the issued and outstanding shares of common stock of
South Buffalo Railway (South Buffalo) from Bethlehem
Steel Corp. (Bethlehem) for $33.1 million in cash,
including transaction costs and the assumption of cer-
tain liabilities. At the closing, the Company acquired
beneficial ownership of the shares and, having received
the necessary approvals from The Surface Transportation
Board on November 21, 2001, assumed actual ownership
on December 6, 2001. The purchase price was allocated
to current assets ($2.3 million), property and equipment
($17.6 million) and goodwill ($18.8 million) less
assumed current liabilities ($2.4 million) and assumed
long-term liabilities ($3.2 million). South Buffalo oper-
ates over 52 miles of owned track in Buffalo, New York.
The purchase price was reduced by a $407,000 estimated
adjustment pursuant to the final determination of the net
assets of South Buffalo on the sale date. This amount,
along with another $300,000 related to pre-acquisition
liabilities paid by the Company on Bethlehem’s behalf,
are reflected in the December 31, 2001 balance sheet
as receivables. Although Bethlehem filed for voluntary
protection under U.S. bankruptcy laws on October 5,
2001, payment of this receivable could be funded from
a $3.0 million escrow account held by an independent
trustee to settle amounts due to the Company pursuant
to the South Buffalo acquisition.

48 ❘ Genesee & Wyoming Inc.
Notes to Consolidated Financial Statements
As a direct result of the ARG transaction, ASR stock
options became immediately exercisable by key manage-
ment of ASR and, as allowed under the provisions of the
stock option plan, the option holders, in lieu of ASR
stock, were paid an equivalent value in cash, resulting
in a $4.0 million compensation charge to ASR earnings.
The Company recognized a $10.1 million gain upon
the issuance of ASR stock to Wesfarmers upon the for-
mation of ARG as a result of such issuance being at a
per share price in excess of the Company’s book value
per share investment in ASR. Additionally, due to the
deconsolidation of ASR, the Company recognized a $6.5
million deferred tax expense resulting from the financial
reporting versus tax basis difference in the Company’s
equity investment in ARG.
On April 20, 2001, APTC completed the arrangement
of debt and equity capital to finance a project to build,
own and operate the Alice Springs to Darwin railway
line in the Northern Territory of Australia. As previously
arranged, upon APTC reaching financial closure,
Wesfarmers contributed an additional $7.4 million into
ARG and accordingly, the Company recorded an addi-
tional first quarter gain of $3.7 million related to the
December, 2000 issuance of ARG stock to Wesfarmers.
A related deferred income tax expense of $1.1 million
was also recorded. In the second quarter of 2001,
ARG paid the $7.4 million to its two shareholders, in
equal amounts of $3.7 million each, as partial payment
of each shareholder’s Australian dollar denominated
non-interest bearing note which resulted in a $508,000
currency transaction loss.
The combined gains totaling $13.8 million relating
to the formation of ARG represented the difference
between the recorded balance of the Company’s previ-
ously wholly owned investment in Australia, less invest-
ment amounts that the Company estimated would be
reimbursed by ARG, and the value of those Australian
operations when ARG was formed. In the fourth quarter
of 2001, the Company, ARG and Wesfarmers reached
agreement as to the level of acquisition-related costs to
be reimbursed to both venture partners. Accordingly,
in the fourth quarter of 2001, the Company recorded
a $728,000 decrease to its previously recorded gains to
reflect the lower than estimated reimbursed amount for
acquisition-related costs.
The Company accounts for its 50% ownership in
ARG under the equity method of accounting and there-
fore deconsolidated ASR from its consolidated financial
statements as of December 16, 2000. Prior to its decon-
solidation, ASR accounted for $37.6 million and $4.0
million of operating revenue and income from opera-
tions (excluding the $4.0 option buyout charge),
respectively, for 2000 and $43.2 million and
$6.6 million, respectively, for 1999.
Pro Forma Financial Results
The following table summarizes the Company’s
unaudited pro forma operating results for the years
ended December 31, 2001 and 2000, as if South Buffalo
had been acquired and ARG had been formed and
acquired Westrail Freight as of the beginning of the appli-
cable period (in thousands, except per share amounts):
Operating revenues $186,688 $187,122Net income 18,956 20,540 Basic earnings per share 1.70 1.98 Diluted earnings per share 1.43 1.66
The pro forma operating results include the acquisi-
tion of South Buffalo, the deconsolidation of ASR,
depreciation expense resulting from the step-up of South
Buffalo property based on appraised values, amortization
of goodwill generated in the South Buffalo acquisition,
incremental interest expense (with related tax benefit)
related to borrowings used to fund the ASR stock option
buyout and related to borrowings used to fund the
South Buffalo acquisition and incremental preferred
stock impacts on income available to common stock-
holders related to the initial issuance of $20 million
in Convertible Preferred for the ARG transactions and
the subsequent issuance of $5 million triggered by
the South Buffalo acquisition.
These results exclude the gain on sale of 50% equity
in Australian operations but include the pro forma equity
earnings attributable to the investment in ARG based
on ARG’s pro forma net income of $17.9 million for
2000. These pro forma net income results give effect
to ARG’s acquisition of Westrail Freight and the related
2001 2000
Genesee & Wyoming Inc. ❘ 49
approximately 55 employees whom the Company
retained upon acquisition but terminated as part of its
plan to reduce operating costs after September 30, 1999.
All payments were made during the fourth quarter of
1999 and are considered a cost of the acquisition.
On December 7, 2000, in conjunction with the refi-
nancing of FCCM and its parent company, GW Servicios,
S.A. de C.V. (Servicios) (see Note 9.), the International
Finance Corporation (IFC) invested $1.9 million of equity
for a 12.7% indirect interest in FCCM, through Servicios.
The Company contributed an additional $13.1 million
and maintains an 87.3% indirect ownership in FCCM.
The Company funded $10.7 million of its new invest-
ment with borrowings under its amended credit facility,
with the remaining investment funded by the conversion
of intercompany advances into permanent capital. Along
with its equity investment, IFC received a put option
exercisable in 2005 to sell its equity stake back to the
Company. The put price will be based on a multiple of
earnings before interest, taxes, depreciation and amorti-
zation. The Company increases its minority interest
expense in the event that the value of the put option
exceeds the otherwise minority interest liability. Because
the IFC equity stake can be put to the Company, the
impact of selling the equity stake at a per share price
below the Company’s book value per share investment
was recorded directly to paid-in capital in 2000.
Canada
On April 15, 1999, the Company acquired Rail-One Inc.
(Rail-One) which has a 47.5% ownership interest in
Genesee • Rail-One Inc. (GRO), thereby increasing the
Company’s ownership of GRO to 95% from the 47.5% it
acquired in 1997. GRO owns and operates two short line
railroads in Canada. Under the terms of the purchase
agreement, the Company converted outstanding notes
receivable from Rail-One of $4.6 million into capital,
committed to pay approximately $844,000 in cash to
the sellers of Rail-One in installments over a four year
period, and granted options to the sellers of Rail-One to
purchase up to 180,000 shares of the Company’s Class A
Common Stock at an exercise price of $3.83 per share.
Exercise of the option is contingent on the Company’s
purchase accounting adjustments primarily for incre-
mental depreciation and amortization expense, elimina-
tion of access fees charged by the government, impacts
of the new financing structure and related income taxes.
The Company has adopted Statement of Financial
Accounting Standards No. 142, “Goodwill and Other
Intangible Assets” effective June 30, 2001. That state-
ment requires that goodwill related to acquisitions
after June 30, 2001 not be amortized, while goodwill
for acquisitions prior to June 30, 2001 continue to be
amortized through December 31, 2001. As the pro forma
statements give effect to the South Buffalo acquisition
as if it occurred prior to June 30, 2001, annual amortiza-
tion of $1.0 million has been reflected. However, actual
goodwill generated by this acquisition will not be
amortized.
The pro forma financial information does not
purport to be indicative of the results that actually
would have been obtained had all the transactions been
completed as of the assumed dates and for the periods
presented and are not intended to be a projection of
future results or trends.
Mexico
In August 1999, the Company’s then wholly-owned sub-
sidiary, Compañía de Ferrocarriles Chiapas-Mayab, S.A.
de C.V. (FCCM), was awarded a 30-year concession to
operate certain railways owned by the state-owned
Mexican rail company Ferronales. FCCM also acquired
equipment and other assets. The aggregate purchase
price, including acquisition costs, was approximately
297 million pesos, or approximately $31.5 million at
then-current exchange rates. The purchase price included
rolling stock, an advance payment on track improve-
ments to be completed on the state-owned track property,
an escrow payment, which was returned to the Company
upon successful completion of the track improvements,
and prepaid value-added taxes. A portion of the purchase
price ($8.4 million) was also allocated to the 30-year
operating license. As the track improvements were made,
the related costs were reclassified into the property
accounts as leasehold improvements and amortized over
the improvements’ estimated useful life. Pursuant to
the acquisition, employee termination payments of
$1.0 million were made to former state employees and

50 ❘ Genesee & Wyoming Inc.
Notes to Consolidated Financial Statements
recovery of its capital investment in GRO (after payoff
of existing GRO debt) if the Company were to sell GRO,
and upon certain GRO income performance measures
which have not yet been met. The transaction was
accounted for as a purchase and resulted in $2.8 million
of initial goodwill, which was being amortized over 15
years. The contingent purchase price will be recorded as
a component of goodwill at the value of the options
issued, if and when such options are exercisable.
Effective with this agreement, the operating results of
GRO were initially consolidated within the financial
statements of the Company, with a 5% minority interest
due to another GRO shareholder. During the second
quarter of 2000, the Company purchased the remaining
5% minority interest in GRO with an initial cash payment
of $240,000 and subsequent annual cash installments of
$180,000 paid in 2001 and due in 2002. Prior to April
15, 1999, the Company accounted for its investment in
GRO under the equity method and recorded an equity
loss of $618,000 in 1999.
South America
On November 5, 2000, the Company acquired an
indirect 21.87% equity interest in Empresa Ferroviaria
Oriental, S.A. (Oriental) increasing its stake in Oriental
to 22.55% from its original indirect 0.68% interest
acquired in September 1999. On July 24, 2001, the
Company increased its indirect equity interest in
Oriental to 22.89% with an additional investment of
$246,000. Oriental is a railroad serving eastern Bolivia
and connecting to railroads in Argentina and Brazil.
The Company’s ownership interest is largely through
a 90% owned holding company in Bolivia which also
received $740,000 from the minority partner for invest-
ment into Oriental. The Company’s portion of the
Oriental investment is composed of $6.9 million in
cash, the assumption (via an unconsolidated subsidiary)
of non-recourse debt of $10.8 million (90% of $12.0
million ) at an adjustable interest rate dependent on
operating results of Oriental, and a non-interest bearing
contingent payment of $450,000 due in 2003 if certain
financial results are achieved. The cash used by the
Company to fund such investment was obtained from
its existing revolving credit facility. Additionally, the
Company received the right to collect dividends from
Oriental related to its full year 2000 earnings. Such divi-
dends of $617,000 were received in March 2001. The full
value of the non-recourse debt of the Company’s uncon-
solidated subsidiary ($12.0 million as of December 31,
2001) bears interest, based on the availability of divi-
dends received from Oriental, between a floor of 4% and
a ceiling of 7.67%. The debt effectively bore interest
of 6.12% throughout 2001 and is due, in annual install-
ments through 2003. Such installments and interest are
primarily funded by dividends received from Oriental,
with any shortages (which are expected for 2002 pay-
ments) to be funded by the Company and its partner.
The Company accounts for its indirect interest in
Oriental under the equity method of accounting.
4. Allowance for Doubtful Accounts:
Activity in the Company’s allowance for doubtfulaccounts was as follows (in thousands):
Balance, beginning of year $1,308 $1,264 $250Provisions 468 389 628Charges (775) (345) (836)Established in acquisitions - - 1,222
Balance, end of year $1,001 $1,308 $1,264
5. Property and Equipment:Major classifications of property and equipment are as
follows (in thousands):
Road properties $198,117 $164,497 Equipment and other 60,074 61,438
258,191 225,935 Less- Accumulated depreciation
and amortization 59,089 48,618
$199,102 $177,317
20002001 1999
2001 2000

Genesee & Wyoming Inc. ❘ 51
receivable due from Company executives which bear
interest at 5.69% and are due in annual installments
through 2003.
7. Equity Investments: Australian Railroad Group
The following condensed financial data of ARG is
based on accounting principles generally accepted in
the United States and converted into thousands of
U.S. dollars based on the following Australian dollar
to U.S. dollar exchange rates:
As of December 31, 2000 $.559As of December 31, 2001 $.510Average for the 15 day period
ended December 31, 2000 $.553Average for the year ended
December 31, 2001 $.518
Australian Railroad Group Statement of Income
(U.S. dollars in thousands)
Operating revenues $181,714Operating expenses 134,471
Income from operations 47,243
Interest expense (22,505)Other income, net 748
Income before income taxes 25,486Provision for income taxes 8,584
Net income $16,902
Net income for the year ended December 31, 2001
includes a $1.2 million after-tax charge related to costs
incurred in the fourth quarter of 2001 from ARG’s
unsuccessful bid for the privatization of an Australian
railroad. Condensed results of operations for the 15
days ending December 31, 2000 consisted of operating
revenues of $4.8 million, income before income taxes
of $834,000, and net income of $522,000.
6. Other Assets:Major classifications of other assets are as follows
(in thousands):
Goodwill $25,808 $6,507Chiapas-Mayab Operating License 8,651 8,200Chiapas-Mayab Special Escrow
Deposit - Track Project - 1,638Deferred financing costs 3,642 3,356Executive split-dollar life insurance 2,507 2,728Assets held for sale or future use 557 1,045 Other 2,522 1,298
43,687 24,772 Less- Accumulated amortization 3,590 2,168
$40,097 $22,604
The Company adopted Statement of Financial
Accounting Standards No. 142 as of January 1, 2002
for existing goodwill and intangible assets and immedi-
ately for any new business combinations subsequent to
June 30, 2001. Goodwill for all acquisitions prior to June
2001 has been amortized on a straight-line basis over
lives of 15-20 years through December 31, 2001. The
Chiapas-Mayab Operating License (see Note 3) is being
amortized over 30 years. The change in the asset value
of the Operating License from 2000 to 2001 results from
currency exchange rates changes. The Chiapas-Mayab
special escrow deposit (see Note 3) was reclassified into
road property upon completion of the project and is
being depreciated. Deferred financing costs are amor-
tized over terms of the related debt using the straight-
line method, which is not materially different from
amortization computed using the effective-interest
method. Executive split dollar life insurance is the pres-
ent value of life insurance benefits which the Company
funds but that are owned by executive officers. The
Company retains a collateral interest in the policies’
cash values and death benefits. Assets held for sale or
future use at December 31, 2001, primarily represent
excess locomotives. Assets held for sale or future use
at December 31, 2000, primarily represent excess loco-
motives and a segment of railroad track that was sold
in 2001. Reflected within Other are $536,000 of notes
2001 2000
Year Ended December 31,
2001
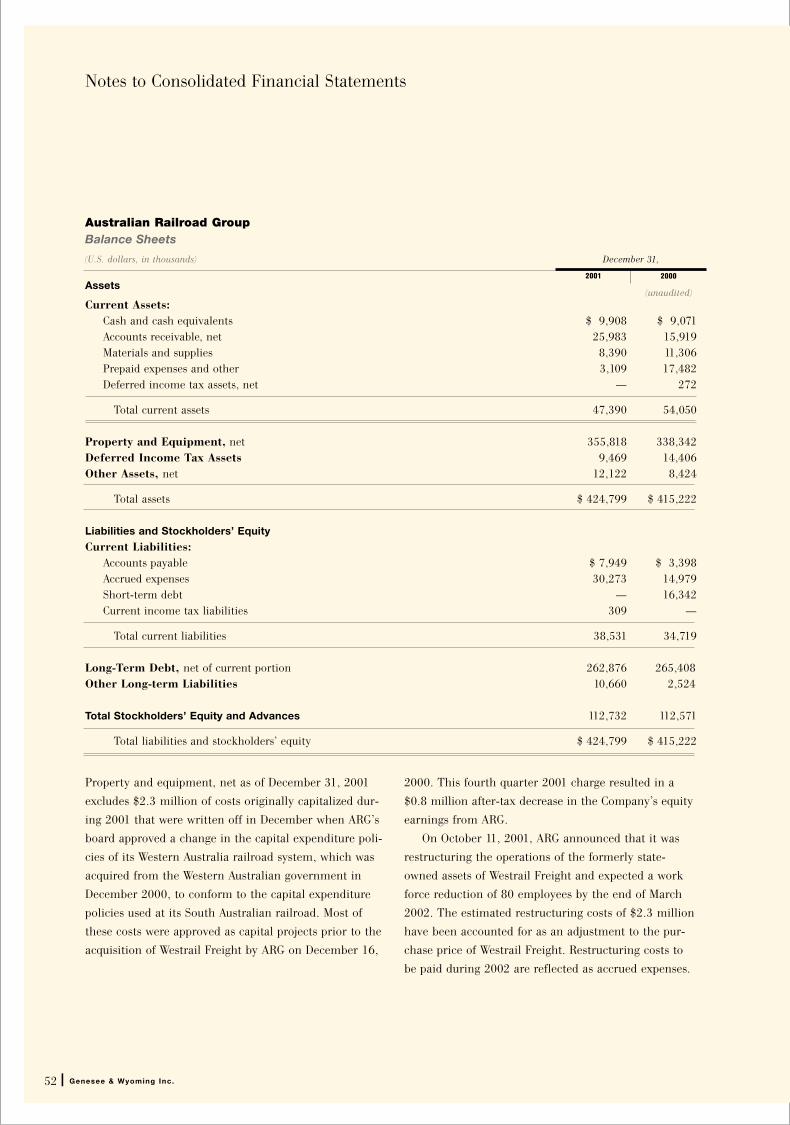
52 ❘ Genesee & Wyoming Inc.
Notes to Consolidated Financial Statements
Australian Railroad Group Balance Sheets
Assets
Current Assets:Cash and cash equivalents $ 9,908 $ 9,071Accounts receivable, net 25,983 15,919Materials and supplies 8,390 11,306Prepaid expenses and other 3,109 17,482Deferred income tax assets, net — 272
Total current assets 47,390 54,050
Property and Equipment, net 355,818 338,342Deferred Income Tax Assets 9,469 14,406Other Assets, net 12,122 8,424
Total assets $ 424,799 $ 415,222
Liabilities and Stockholders’ Equity
Current Liabilities:Accounts payable $ 7,949 $ 3,398Accrued expenses 30,273 14,979Short-term debt — 16,342Current income tax liabilities 309 —
Total current liabilities 38,531 34,719
Long-Term Debt, net of current portion 262,876 265,408Other Long-term Liabilities 10,660 2,524
Total Stockholders’ Equity and Advances 112,732 112,571
Total liabilities and stockholders’ equity $ 424,799 $ 415,222
(U.S. dollars, in thousands) December 31,
2001 2000
Property and equipment, net as of December 31, 2001
excludes $2.3 million of costs originally capitalized dur-
ing 2001 that were written off in December when ARG’s
board approved a change in the capital expenditure poli-
cies of its Western Australia railroad system, which was
acquired from the Western Australian government in
December 2000, to conform to the capital expenditure
policies used at its South Australian railroad. Most of
these costs were approved as capital projects prior to the
acquisition of Westrail Freight by ARG on December 16,
2000. This fourth quarter 2001 charge resulted in a
$0.8 million after-tax decrease in the Company’s equity
earnings from ARG.
On October 11, 2001, ARG announced that it was
restructuring the operations of the formerly state-
owned assets of Westrail Freight and expected a work
force reduction of 80 employees by the end of March
2002. The estimated restructuring costs of $2.3 million
have been accounted for as an adjustment to the pur-
chase price of Westrail Freight. Restructuring costs to
be paid during 2002 are reflected as accrued expenses.
(unaudited)

Genesee & Wyoming Inc. ❘ 53
Australian Railroad Group Statement of Cash Flows
Cash Flows from Operating Activities:
Net income $16,902 Adjustments to reconcile net income to net cash provided by operating activities-
Depreciation and amortization 13,392Deferred income taxes 7,252 Gain on disposition of property (152) Changes in assets and liabilities 4,004
Net cash provided by operating activities 41,398
Cash Flows from Investing Activities:
Purchase of property and equipment (54,358) Proceeds from disposition of property and equipment 152
Net cash used in investing activities (54,206)
Cash Flows from Financing Activities:
Payments on short-term borrowings (16,360) Borrowings on debt 20,452 Proceeds from issuance of shares 7,685 Repayment of subordinated loans (7,685) Refund of goods and services tax received from acquisition of Westrail Freight 16,457 Transfer to restricted funds on deposit (6,351)
Net cash provided by financing activities 14,198
Effect of Exchange Rate Differences on Cash and Cash Equivalents (553)
Increase in Cash and Cash Equivalents 837 Cash and Cash Equivalents, beginning of year 9,071
Cash and Cash Equivalents, end of year $9,908
Year ended December 31,
2001
(U.S. dollars, in thousands)

54 ❘ Genesee & Wyoming Inc.
Notes to Consolidated Financial Statements
South America
The following condensed unaudited results of operations
for Oriental for the year ended December 31, 2001 have
a U.S. functional currency and are based on accounting
principles generally accepted in the United States
(in thousands):
Operating revenues $ 27,440Net income 5,979
Condensed balance sheet information for Oriental
as of December 31, 2001:
Current assets $ 10,201Non-current assets 54,533
Current liabilities 5,483Non-current liabilities 2,446Senior debt 1,526Shareholders’ equity 55,279
The above data does not include the non-recourse
debt of $12.0 million held at an intermediate unconsoli-
dated subsidiary or any of the general and administra-
tive, interest or income tax costs at various intermediate
unconsolidated subsidiaries.
8. Leases:The Company has entered into several leases for freight
cars, locomotives and other equipment. Related operat-
ing lease expense for the years ended December 31,
2001, 2000 and 1999 was approximately $8.1 million,
$7.6 million and $6.6 million, respectively. Additionally,
the Company leases certain real property which resulted
in lease expense for the years ended December 31, 2001,
2000 and 1999 of approximately $1.2 million, $1.1
million and $1.0 million, respectively.
On March 30, 2001 and December 7, 1999, the
Company completed the sale of certain rolling stock to
financial institutions for a net sale price of $6.5 million
and $8.6 million, respectively. The proceeds were used
to reduce borrowings under the Company’s revolving
credit facilities. Simultaneously, the Company entered
into agreements with the financial institutions to lease
this and other rolling stock for a period of 8 years
including automatic renewals. The sale/leaseback
transactions resulted in aggregate deferred gains of
$2.4 million, which are being amortized over the term
of the leases as a non-cash offset to rent expense.
The Company fully anticipates renewing these leases
at all available lease renewal dates.
Alternatively, if the Company chooses not to renew
these and certain other leases at their next available
renewal dates, they would have (depending upon the
lease) up to two additional options. One option would
be to return the rolling stock and pay aggregate fees of
approximately $9.0 million. The other option would be
to purchase the rolling stock. The leases that allow this
second option would require payments of approximately
$17.8 million. Management anticipates the future mar-
ket value of the leased rolling stock will equal or exceed
the payments necessary to purchase the rolling stock.
The following is a summary of future minimum lease
payments (without consideration of $4.6 million of
amortizing deferred gains from sale/leasebacks) under
noncancelable leases and expected automatic renewals
(in thousands):
Noncancelable Automatic Renewals Totals
2002 $2,501 $4,440 $6,9412003 2,106 4,440 6,5462004 1,761 4,440 6,2012005 929 4,440 5,3692006 818 4,440 5,258Thereafter 1,364 5,912 7,276
Total minimum payments $9,479 $28,112 $37,591
The Company is party to two lease agreements with
Class I carriers to operate 238 miles of track in Oregon.
Under the leases, no payments to the lessor are required
as long as certain operating conditions are met. The
leases expire in 2013 and 2015 unless renewed for suc-
cessive ten year renewal terms. If the lessor terminates
the leases for any reason, the lessor must reimburse
the Company for its depreciated basis of certain
improvements on the track. The Company has assumed
all operating and financial responsibilities including
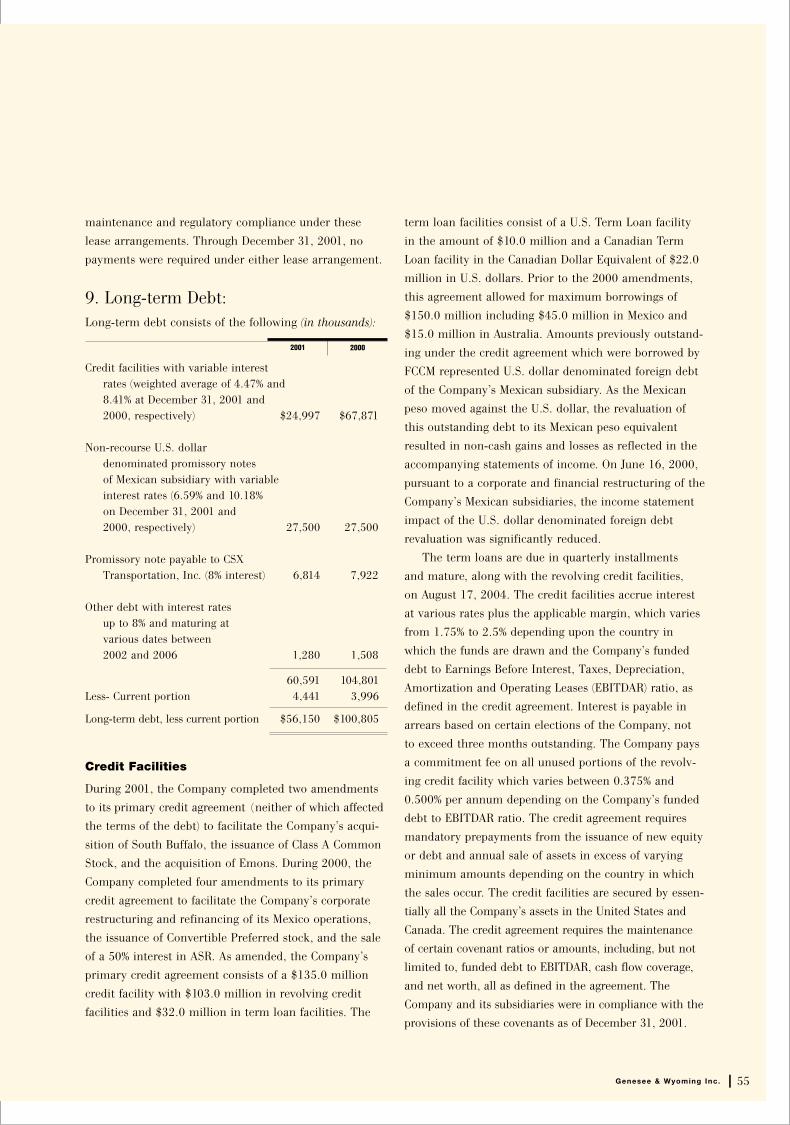
Genesee & Wyoming Inc. ❘ 55
term loan facilities consist of a U.S. Term Loan facility
in the amount of $10.0 million and a Canadian Term
Loan facility in the Canadian Dollar Equivalent of $22.0
million in U.S. dollars. Prior to the 2000 amendments,
this agreement allowed for maximum borrowings of
$150.0 million including $45.0 million in Mexico and
$15.0 million in Australia. Amounts previously outstand-
ing under the credit agreement which were borrowed by
FCCM represented U.S. dollar denominated foreign debt
of the Company’s Mexican subsidiary. As the Mexican
peso moved against the U.S. dollar, the revaluation of
this outstanding debt to its Mexican peso equivalent
resulted in non-cash gains and losses as reflected in the
accompanying statements of income. On June 16, 2000,
pursuant to a corporate and financial restructuring of the
Company’s Mexican subsidiaries, the income statement
impact of the U.S. dollar denominated foreign debt
revaluation was significantly reduced.
The term loans are due in quarterly installments
and mature, along with the revolving credit facilities,
on August 17, 2004. The credit facilities accrue interest
at various rates plus the applicable margin, which varies
from 1.75% to 2.5% depending upon the country in
which the funds are drawn and the Company’s funded
debt to Earnings Before Interest, Taxes, Depreciation,
Amortization and Operating Leases (EBITDAR) ratio, as
defined in the credit agreement. Interest is payable in
arrears based on certain elections of the Company, not
to exceed three months outstanding. The Company pays
a commitment fee on all unused portions of the revolv-
ing credit facility which varies between 0.375% and
0.500% per annum depending on the Company’s funded
debt to EBITDAR ratio. The credit agreement requires
mandatory prepayments from the issuance of new equity
or debt and annual sale of assets in excess of varying
minimum amounts depending on the country in which
the sales occur. The credit facilities are secured by essen-
tially all the Company’s assets in the United States and
Canada. The credit agreement requires the maintenance
of certain covenant ratios or amounts, including, but not
limited to, funded debt to EBITDAR, cash flow coverage,
and net worth, all as defined in the agreement. The
Company and its subsidiaries were in compliance with the
provisions of these covenants as of December 31, 2001.
maintenance and regulatory compliance under these
lease arrangements. Through December 31, 2001, no
payments were required under either lease arrangement.
9. Long-term Debt:Long-term debt consists of the following (in thousands):
Credit facilities with variable interest rates (weighted average of 4.47% and 8.41% at December 31, 2001 and 2000, respectively) $24,997 $67,871
Non-recourse U.S. dollar denominated promissory notes of Mexican subsidiary with variable interest rates (6.59% and 10.18% on December 31, 2001 and 2000, respectively) 27,500 27,500
Promissory note payable to CSX Transportation, Inc. (8% interest) 6,814 7,922
Other debt with interest rates up to 8% and maturing at various dates between 2002 and 2006 1,280 1,508
60,591 104,801Less- Current portion 4,441 3,996
Long-term debt, less current portion $56,150 $100,805
Credit Facilities
During 2001, the Company completed two amendments
to its primary credit agreement (neither of which affected
the terms of the debt) to facilitate the Company’s acqui-
sition of South Buffalo, the issuance of Class A Common
Stock, and the acquisition of Emons. During 2000, the
Company completed four amendments to its primary
credit agreement to facilitate the Company’s corporate
restructuring and refinancing of its Mexico operations,
the issuance of Convertible Preferred stock, and the sale
of a 50% interest in ASR. As amended, the Company’s
primary credit agreement consists of a $135.0 million
credit facility with $103.0 million in revolving credit
facilities and $32.0 million in term loan facilities. The
2001 2000

56 ❘ Genesee & Wyoming Inc.
Notes to Consolidated Financial Statements
On August 17, 1999, the Company amended and
restated its primary credit agreement to provide for
an increase in total borrowings. Borrowings under the
Canadian portion of the amended agreement were used
to refinance certain GRO debt. In conjunction with
that refinancing, the Company recorded a non-cash
after tax extraordinary charge of $262,000 related to
the write off of unamortized deferred financing costs
of the retired debt.
Non-Recourse Promissory Notes
On December 7, 2000, one of the Company’s sub-
sidiaries in Mexico, Servicios, entered into three promis-
sory notes payable totaling $27.5 million with variable
interest rates based on LIBOR plus 3.5%. Two of the
notes have an eight year term with principal payments
of $1.4 million due semi-annually beginning March 15,
2003, through the maturity date of September 15, 2008.
The third note has a nine year term with principal pay-
ments of $750,000 due semi-annually beginning March
15, 2003, with a maturity date of September 15, 2009.
The promissory notes are secured by essentially all the
assets of Servicios and FCCM, and a pledge of the
Company’s shares of Servicios and FCCM. The promis-
sory notes contain certain financial covenants which
Servicios is in compliance with as of December 31, 2001.
Promissory Note
In October 2000, the Company amended and restated
its promissory note payable to CSX Transportation, Inc.,
after making a $1.0 million discretionary principal pay-
ment, by refinancing $7.9 million at 8% with interest
due quarterly and principal payments due in annual
installments of $1.0 million which began October 31,
2001 through the maturity date of October 31, 2008.
Prior to this amendment and restatement, the promis-
sory note payable provided for annual principal pay-
ments of $1.2 million provided a certain subsidiary of
the Company met certain levels of revenue and cash
flow. In accordance with these prior provisions, the
Company was not required to make any principal
payments through 1999.
Schedule of Future Payments
The following is a summary of the maturities of long-
term debt as of December 31, 2001 (in thousands):
2002 $4,4412003 9,183 2004 23,7852005 5,596 2006 5,576Thereafter 12,010
$60,591
10. Financial Risk ManagementThe Company actively monitors its exposure to foreign
currency exchange rate and interest rate risks and uses
derivative financial instruments to manage the impact
of certain of these risks. The Company uses derivatives
only for purposes of managing risk associated with
underlying exposures. The Company does not trade or
use instruments with the objective of earning financial
gains on the exchange rate or interest rate fluctuations
alone, nor does it use instruments where there are not
underlying exposures. The Company’s use of derivative
financial instruments may result in short-term gains or
losses and increased earnings volatility. Complex instru-
ments involving leverage or multipliers are not used.
Management believes that its use of derivative instru-
ments to manage risk is in the Company’s best interest.
On January 1, 2001, the Company adopted SFAS
No. 133, “Accounting for Derivative Instruments and
Hedging Activities,” as amended by SFAS No. 137
and SFAS No. 138. In accordance with the provisions
of SFAS No. 133, the Company recorded a transition
adjustment upon adoption of the standard to recognize
its derivative instruments at the then fair value of a
liability of $388,000. The effect of this transition adjust-
ment did not impact earnings and was not material
to accumulated other comprehensive income.
Initially, upon adoption of the new derivative
accounting standard, and prospectively as of the date
new derivatives are entered into, the Company desig-
nates the derivatives as a hedge of a forecasted transac-
tion or the variability of the cash flows to be received or
paid in the future related to a recognized asset or liability

Genesee & Wyoming Inc. ❘ 57
rates for converting Mexican Pesos to U.S. Dollars,
one of which expired in March 2001 and one of which
expired in September 2001. The remaining options
expire in March 2002 and September 2002, and give the
Company the right to sell Mexican Pesos for U.S. Dollars
at exchange rates of 10.10 Mexican Pesos to the U.S.
Dollar and 10.61 Mexican Pesos to the U.S. Dollar.
At December 31, 2001, the notional amount under
these options is $2.2 million. The Company paid up-
front premiums for these options totaling $120,000.
At December 31, 2001, the fair value of these currency
options was $17,000.
Interest Rate Risk
The Company uses interest rate swap agreements to
manage its exposure to changes in interest rates for its
floating rate debt. Interest rate swap agreements are
accounted for as cash flow hedges. Gains or losses on
the swaps, representing interest rate differentials to be
received or paid on the swaps, are recognized in the con-
solidated statements of income as a reduction or increase
in interest expense, respectively. In accordance with the
new derivative requirements, the effective portion of the
change in the fair value of the derivative instrument is
recorded in the consolidated balance sheets as a compo-
nent of current assets or liabilities and other comprehen-
sive income. The ineffective portion of the change in the
fair value of the derivative instrument, along with the
gain or loss on the hedged item, is recorded in earnings
and reported in the consolidated statements of income,
on the same line as the hedged item.
During 2001 and 2000, the Company entered into
various interest rate swaps fixing its base interest rate
by exchanging its variable LIBOR interest rates on
long-term debt for a fixed interest rate. The swaps expire
at various dates through September 2006 and the fixed
base rates range from 5.46% to 6.47%. At December 31,
2001, the notional amount under these agreements is
$30.6 million and the fair value of these interest rate swaps
is a negative $1.1 million. During 2002, the Company
anticipates it will record a charge to earnings of $412,000,
as certain swaps expire, representing the anticipated
value of the interest rate differentials to be paid.
(cash flow hedge). The effective portion of the changes
in the fair value of the derivative that is designated as a
cash flow hedge is recorded in accumulated other com-
prehensive income. When the hedged item is realized,
the gain or loss included in accumulated other compre-
hensive income is reported on the same line in the
consolidated statements of income, as the hedged item.
In addition, the ineffective portion of the changes in
fair value of derivatives used as cash flow hedges are
immediately recognized.
The Company formally documents its hedge relation-
ships, including identifying the hedge instruments and
hedged items, as well as its risk management objectives
and strategies for entering into the hedge transaction.
Derivatives are recorded in the consolidated balance
sheets at fair value in prepayments or other assets and
accrued expenses or other liabilities. This process
includes matching the hedge instrument to the underly-
ing hedged item (assets, liabilities, firm commitments or
forecasted transactions). At hedge inception and at least
quarterly thereafter, the Company assesses whether the
derivatives used to hedge transactions are highly effec-
tive in offsetting changes in either the fair value or cash
flows of the hedged item. When it is determined that a
derivative ceases to be a highly effective hedge, the
Company discontinues hedge accounting, and any gains
or losses on the derivative instrument are recognized in
earnings during the period it no longer qualifies as a
hedge. Summarized below are the specific accounting
policies by market risk category.
Foreign Currency Exchange Rate Risk
The Company uses purchased options to manage foreign
currency exchange rate risk related to certain projected
cash flows related to foreign operations. Under SFAS No.
133, the instruments are carried at fair value in the con-
solidated balance sheets as a component of prepayments
or other assets or accrued expense or other liabilities.
Changes in the fair value of derivative instruments that
are used to manage exchange rate risk in foreign currency
denominated cash flows are recognized in the consolidated
balance sheets as a component of accumulated other com-
prehensive income in common shareholders’ equity.
During 2001 and 2000, the Company entered into
various exchange rate options that established exchange

58 ❘ Genesee & Wyoming Inc.
Notes to Consolidated Financial Statements
11. Class A Common Stock:In November 2001, the Company completed a universal
shelf registration of up to $200 million of various debt
and equity securities. The form and terms of such secu-
rities shall be determined when and if these securities
are issued. On December 21, 2001, as an initial draw
on the shelf registration, the Company sold 3.9 million
shares of Class A Common Stock in a public offering
at a price of $18.50 per share for net proceeds of
$66.5 million. The proceeds were used to pay off all
revolving debt under the Company’s primary credit
agreement and for general corporate purposes.
Additionally, certain shareholders (after exercising
options and converting shares of Class B Common Stock
into 64,641 shares of Class A Common Stock) sold shares
in this offering. While the Company paid all issuance
costs (except for the related underwriter’s fee), the
Company did not receive any proceeds from the sale
of shareholder shares. Had this issuance, and the
December 2001 Convertible Preferred issuance, occurred
on January 1, 2001, basic and diluted earnings per share
for 2001 would have been $1.26 and $1.11, respectively,
on 14.3 million and 17.1 million weighted average
shares outstanding.
12. Redeemable Convertible Preferred Stock: In December 2000, to fund its cash investment in
ARG, the Company completed a private placement of
the Convertible Preferred with the Fund managed by
Brown Brothers Harriman & Co. The Company exercised
its option to fund $20.0 million of a possible $25.0
million in gross proceeds from the Convertible Preferred.
The Fund also received an option to invest an additional
$5.0 million in the Company provided that the Company
complete future acquisitions with an aggregate purchase
price greater than $25.0 million. In December 2001,
upon final approval by the Surface Transportation Board
of the Company’s acquisition of South Buffalo Railway,
the Fund exercised its option and invested an additional
$5.0 million. Dividends on the Convertible Preferred
are cumulative and payable quarterly in arrears in an
amount equal to 4% of the issue price. Each share of
the Convertible Preferred is convertible by the Fund at
any time into shares of Class A Common Stock of the
Company at a conversion price of $10.22 per share of
Class A Common Stock (if converted, 2,445,654 shares
of Common Stock). The Convertible Preferred is callable
by the Company after four years, and is mandatorily
redeemable in eight years. At December 31, 2001, no
shares of Convertible Preferred have been converted
into shares of Class A Common Stock. Issuance fees
are being amortized as additional dividends over
the Convertible Preferred’s eight year life.
13. Pension and Other Postretirement Benefit Plans:The Company administers two noncontributory
defined benefit plans for union and non-union employ-
ees of two U.S. subsidiaries. Benefits are determined
based on a fixed amount per year of credited service.
The Company’s funding policy is to make contributions
for pension benefits based on actuarial computations
which reflect the long-term nature of the plans. The
Company has met the minimum funding requirements
according to the Employee Retirement Income Security
Act. The plan assets are managed by Registered Invest-
ment Companies that invest in Balanced Asset Funds,
none of which are invested in the Company’s stock. On
January 31, 2002, the Company froze one of its defined
benefit plans. Effective that date, new employees will not
be eligible to participate in this plan, and future earning
for current participants will not be eligible in the compu-
tation of benefits for those participants.
Historically, the Company has provided certain
health care and life insurance benefits for certain retired
employees. Eligible employees include union employees
of one of its U.S. subsidiaries, and certain nonunion
employees who have reached the age of 55 with 30 or

Genesee & Wyoming Inc. ❘ 59
more years of service. In October 2001, upon the South
Buffalo acquisition, the Company assumed a liability to
provide certain health care and life insurance benefits
for union and non-union personnel employed by that
subsidiary as of its acquisition date. The union and non-
union employees of the subsidiary will become eligible
for these health care and life insurance benefits upon
Change in benefit obligations:
Benefit obligation at beginning of year $1,323 $1,267 $624 $706Adjustment for plan assumed in acquisition — — 2,085 —Service cost 155 210 104 3Interest cost 91 95 210 48 Actuarial (gain) loss (6) (91) 11 (63)Benefits paid (50) (158) (50) (70)
Benefit obligation at end of year $1,513 $1,323 $2,984 $624
Change in plan assets:
Fair value of assets at beginning of year $1,105 $1,020 — —Actual return (loss) on plan assets (119) 163 — —Employer contributions 206 80 $50 $70Benefits paid (50) (158) ($50) ($70)
Fair value of assets at end of year $1,142 $1,105 — —
Reconciliation of Funded Status:
Funded status ($371) ($217) ($2,984) ($624)Unrecognized net actuarial (gain) loss 8 (213) (17) (28)Unrecognized prior service cost 182 204 — —
Total accrued benefit obligation ($181) ($226) ($3,001) ($652)
Weighted-average assumptions:
Discount rate 7.75% 7.75% 7.5% 7.5%Expected return on plan assets 8.5% 8.5% N/A N/ARate of compensation increase 3.5% 4.5% N/A N/A
Components of net periodic benefit cost:
Service cost $155 $210 $179 $104 $3 $2 Interest cost 91 95 76 210 48 36 Expected return on plan assets (96) (88) (38) — — — Amortization of prior service cost 23 23 24 — — — Amortization of (gain) loss (12) — — — — (6)
Net periodic benefit cost $161 $240 $241 $314 $51 $32
retirement if certain combinations of age and years of
service are met. The Company funds the plans on a
pay-as-you-go basis.
The following provides a reconciliation of benefit
obligation, plan assets, and funded status of the plans
(in thousands):
2001
Pension Other Retirement Benefits
20002001 2000
2000
Pension Other Retirement Benefits
1999199920002001 2001
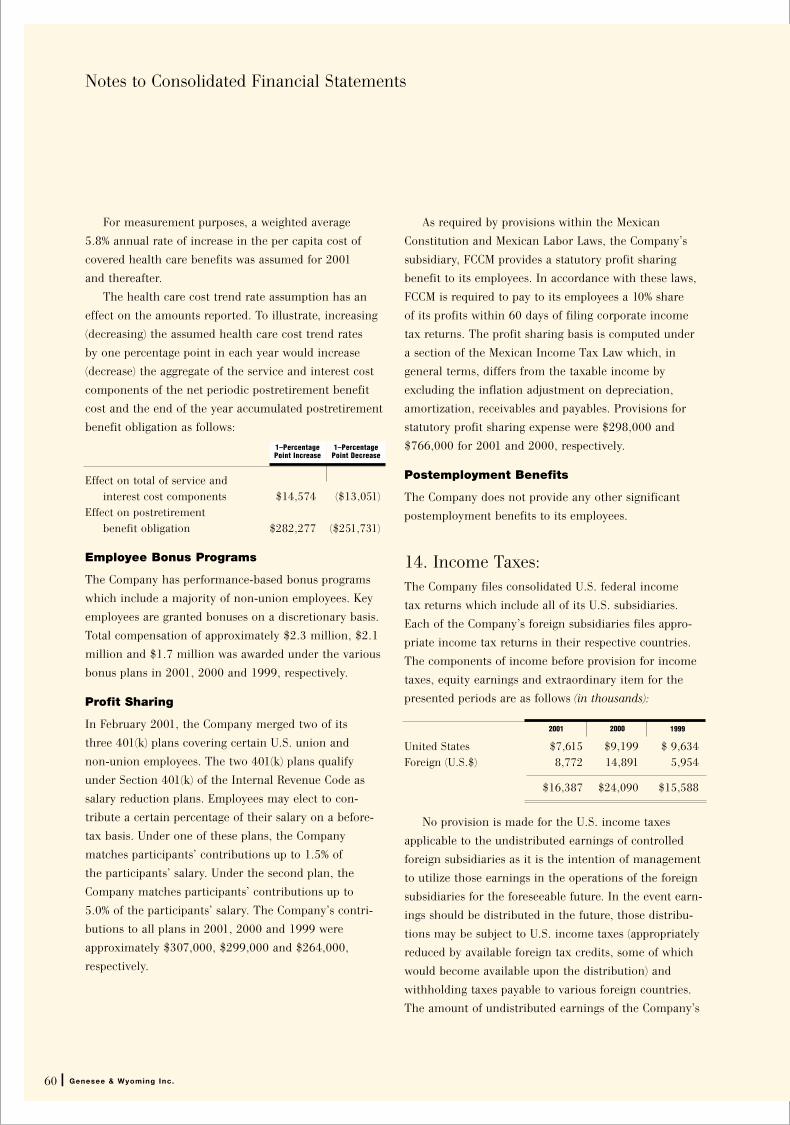
60 ❘ Genesee & Wyoming Inc.
Notes to Consolidated Financial Statements
For measurement purposes, a weighted average
5.8% annual rate of increase in the per capita cost of
covered health care benefits was assumed for 2001
and thereafter.
The health care cost trend rate assumption has an
effect on the amounts reported. To illustrate, increasing
(decreasing) the assumed health care cost trend rates
by one percentage point in each year would increase
(decrease) the aggregate of the service and interest cost
components of the net periodic postretirement benefit
cost and the end of the year accumulated postretirement
benefit obligation as follows:
Effect on total of service and interest cost components $14,574 ($13,051)
Effect on postretirement benefit obligation $282,277 ($251,731)
Employee Bonus Programs
The Company has performance-based bonus programs
which include a majority of non-union employees. Key
employees are granted bonuses on a discretionary basis.
Total compensation of approximately $2.3 million, $2.1
million and $1.7 million was awarded under the various
bonus plans in 2001, 2000 and 1999, respectively.
Profit Sharing
In February 2001, the Company merged two of its
three 401(k) plans covering certain U.S. union and
non-union employees. The two 401(k) plans qualify
under Section 401(k) of the Internal Revenue Code as
salary reduction plans. Employees may elect to con-
tribute a certain percentage of their salary on a before-
tax basis. Under one of these plans, the Company
matches participants’ contributions up to 1.5% of
the participants’ salary. Under the second plan, the
Company matches participants’ contributions up to
5.0% of the participants’ salary. The Company’s contri-
butions to all plans in 2001, 2000 and 1999 were
approximately $307,000, $299,000 and $264,000,
respectively.
As required by provisions within the Mexican
Constitution and Mexican Labor Laws, the Company’s
subsidiary, FCCM provides a statutory profit sharing
benefit to its employees. In accordance with these laws,
FCCM is required to pay to its employees a 10% share
of its profits within 60 days of filing corporate income
tax returns. The profit sharing basis is computed under
a section of the Mexican Income Tax Law which, in
general terms, differs from the taxable income by
excluding the inflation adjustment on depreciation,
amortization, receivables and payables. Provisions for
statutory profit sharing expense were $298,000 and
$766,000 for 2001 and 2000, respectively.
Postemployment Benefits
The Company does not provide any other significant
postemployment benefits to its employees.
14. Income Taxes:The Company files consolidated U.S. federal income
tax returns which include all of its U.S. subsidiaries.
Each of the Company’s foreign subsidiaries files appro-
priate income tax returns in their respective countries.
The components of income before provision for income
taxes, equity earnings and extraordinary item for the
presented periods are as follows (in thousands):
United States $7,615 $9,199 $ 9,634 Foreign (U.S.$) 8,772 14,891 5,954
$16,387 $24,090 $15,588
No provision is made for the U.S. income taxes
applicable to the undistributed earnings of controlled
foreign subsidiaries as it is the intention of management
to utilize those earnings in the operations of the foreign
subsidiaries for the foreseeable future. In the event earn-
ings should be distributed in the future, those distribu-
tions may be subject to U.S. income taxes (appropriately
reduced by available foreign tax credits, some of which
would become available upon the distribution) and
withholding taxes payable to various foreign countries.
The amount of undistributed earnings of the Company’s
1–PercentagePoint Increase
1–PercentagePoint Decrease
20002001 1999

Genesee & Wyoming Inc. ❘ 61
deferred income taxes as of the presented year ends
are as follows (in thousands):
Deferred tax benefits- Accruals and reserves not deducted
for tax purposes until paid $2,150 $2,202 Alternative minimum tax credits 841 935 Net operating losses 6,776 7,586 Postretirement benefits 176 233Other 707 131
10,650 11,087 Deferred tax obligations –
Property and investmentsbasis differences (32,670) (30,267)
Valuation allowance (450) (797)
Net deferred tax obligations ($22,470) ($19,977)
In the accompanying consolidated balance sheets,
these deferred benefits and deferred obligations are
classified as current or non-current based on the
classification of the related asset or liability for financial
reporting. A deferred tax obligation or benefit that is
not related to an asset or liability for financial reporting,
including deferred tax assets related to carry-forwards,
are classified according to the expected reversal date
of the temporary difference as of the end of the year.
The Company’s alternative minimum tax credit can
be carried forward indefinitely; however, the Company
must achieve future regular U.S. taxable income in order
to realize this credit. The Company had net operating
loss carry-forwards from its Mexican operations in
2001, 2000 and 1999 of $18.1 million, $20.0 million
and $10.3 million, respectively. The Mexican losses, for
income tax purposes, primarily relate to the immediate
deduction of the purchase price paid for the FCCM oper-
ations. These loss carry-forwards will expire, if unused,
between 2009 and 2010. The Company had net operating
loss carry-forwards from its Canadian operations as of
December 31, 2001, 2000 and 1999 of $1.1 million,
$1.5 million and $2.2 million, respectively. The
Canadian losses primarily represent losses generated
prior to the Company gaining control of those operations
in April 1999. These loss carry-forwards will expire,
if unused, between 2004 and 2006.
controlled foreign subsidiaries as of December 31, 2001
is $16.0 million. It is not practicable to determine the
amount of U.S. income and foreign withholding taxes
that could be payable if a distribution of earnings
were to occur.
The components of the provision for income taxes
are as follows (in thousands):
United States: Current-
Federal $681 $ 495 $1,265 State 85 339 952
Deferred 2,228 2,594 2,381
2,994 3,428 4,598
Foreign (U.S.$): Current 1,236 164 (1,212) Deferred 1,936 6,977 (1,211)
3,172 7,141 (2,423)
Total $6,166 $10,569 $2,175
The provision for income taxes differs from that
which would be computed by applying the statutory
U.S. federal income tax rate to income before taxes.
The following is a summary of the effective tax rate
reconciliation:
Tax provision at statutory rate 34.0% 34.0% 35.0%
Effect of foreign operations 3.2% 12.2% (100.7%)
State income taxes, net of federalincome tax benefit 1.9% 1.8% 5.7%
Change in valuation allowance (2.0%) (3.6%) 71.9%
Other, net 0.5% (0.5%) 2.1%
Effective income tax rate 37.6% 43.9% 14.0%
Deferred income taxes reflect the net income effects
of temporary differences between the carrying amounts
of assets and liabilities for financial reporting purposes
and the amounts used for income tax purposes as well
as available income tax credits. The components of net
20002001 1999
20002001 1999
2001 2000

62 ❘ Genesee & Wyoming Inc.
Notes to Consolidated Financial Statements
In the third quarter of 1999, the Australian govern-
ment enacted an income tax law that, for assets acquired
from a tax-exempt entity, impacts the depreciable basis
of those assets. The impact of the new law on the
Company’s Australian operation is that it will be able to
deduct, for income tax purposes, depreciation in excess
of the financial reporting basis of certain fixed assets
acquired from the government in November 1997.
However, management estimated that it was more likely
than not that the Company would be unable to fully
realize all of the potential income tax benefits and
accordingly, established a partial valuation allowance
against the deferred tax assets recorded pursuant to the
tax law change. Accordingly, the net income tax benefit
recorded in the 1999 third quarter as a result of this tax
law change was $4.2 million. Management’s assessment
of the likelihood of realizing the full benefit of this
incremental tax depreciation included a review of the
Australian operation’s forecasted results for the next
several years which indicated that, with the additional
tax depreciation deductions and other accelerated
deductions for income tax purposes, this operation
would not likely realize the entire tax benefit. During
2000, based on the actual operating results achieved
by the Australian subsidiary, management revised its
assessment of the likelihood that this tax benefit
would be realized. The 2000 reassessment resulted in
a decrease in the related valuation allowance of $1.0
million. Pursuant to the deconsolidation of ASR, the
remaining valuation allowance and related deferred
tax assets are no longer included in the consolidated
results of the Company.
As of December 31, 2001, 2000 and 1999, in addition
to the valuation allowance described above, the income
tax benefit of the Mexican and Canadian net operating
losses had been offset by a partial valuation allowance
based on management’s assessment regarding their ulti-
mate realization. A certain portion of this incremental
valuation allowance was established in the acquisition
of GRO, and accordingly, if reversed will result in a
decrease to goodwill. Management does not believe that
a valuation allowance is required for any other deferred
tax assets based on anticipated future profit levels and
the reversal of current deferred tax obligations.
15. Grants From Governmental Agencies:The Company periodically receives grants from states
and provinces in which it operates for rehabilitation or
construction of track. The states and provinces typically
reimburse the Company for 75% to 100% of the total cost
of specific projects. Under two such grant programs, the
Company received $278,000, $6.0 million and $6.1 mil-
lion in 2001, 2000 and 1999, respectively, from the State
of New York and $3.2 million, $2.2 million and $3.2
million in 2001, 2000 and 1999, respectively, from the
State of Pennsylvania. In addition, the Company
received $86,000, $341,000 and $200,000 of grants in
2001, 2000 and 1999, respectively, from other states,
and $388,000 and $315,000 in 2001 and 2000, respec-
tively, from a province in Canada.
None of the Company’s grants represent a future
liability of the Company unless the Company abandons
the rehabilitated or new track structure within a speci-
fied period of time or fails to maintain the rehabilitated
or new track to certain standards and make certain min-
imum capital improvements, as defined in the respective
agreements. As the Company intends to comply with
these agreements, the Company has recorded additions
to road property and has deferred the amount of the
grants as the construction and rehabilitation expendi-
tures have been incurred. The amortization of deferred
grants is a non-cash offset to depreciation expense over
the useful lives of the related assets and is not included
as taxable income. During the years ended December 31,
2001, 2000 and 1999, the Company recorded offsets
to depreciation expense from grant amortization of
$1.4 million, $1.1 million and $1.0 million, respectively.
16.Commitments and Contingencies:The Company has built its portfolio of railroad proper-
ties primarily through the purchase or lease of road
and track structure and through operating agreements.
These transactions have historically related only to the
physical assets of the railroad property. Typically, the
Company does not assume the operations or liabilities
of the divesting railroads. However, in October 2001,

Genesee & Wyoming Inc. ❘ 63
declaration of certain rights regarding the SAA and
damages for ComEd’s failure to assign the SAA to the
purchaser of the Powerton plant. The Company believes
that its counterclaim against ComEd is well-founded
and is pursuing it vigorously.
17. Stock-Based Compensation Plans:In 1996, the Company established an incentive and
nonqualified stock option plan for key employees and a
nonqualified stock option plan for non-employee direc-
tors (the Stock Option Plans). The Company accounts
for these plans under APB Opinion No. 25, under which
no compensation cost has been recognized, except for
$200,000 of compensation expense related to the imme-
diate repurchase of shares issued upon exercise of certain
stock options in 2001. Had compensation cost for all
options issued under these plans been determined con-
sistent with FASB Statement No. 123, the Company’s net
income and earnings per share would have been reduced
as follows (in thousands, except EPS):
Net Income: As reported $19,084 $13,932 $12,533 Pro Forma 18,307 12,925 11,468
Basic EPS: As reported $1.72 $1.42 $1.24 Pro Forma 1.65 1.32 1.13
Diluted EPS: As reported $1.48 $1.38 $1.23 Pro Forma 1.42 1.28 1.12
The Company has reserved 2,565,000 Class A shares
for option grants under the Stock Option Plans. The
Compensation and Stock Option Committee of the
Company’s Board of Directors has discretion to deter-
mine employee grantees, dates and amounts of grants,
vesting and expiration dates. Some awards under the
director’s plan are automatic during the first two years
after joining the Board of Directors, and the Board of
Directors may make other awards under this plan. Under
both Plans, the exercise price must equal at least 100%
of the stock’s market price on the date of grant and
must be exercised within five years, or ten years for
directors, from the date of grant.
the Company assumed certain current liabilities of
$2.4 million and certain long-term liabilities of $3.2
million through the acquisition of South Buffalo Railway
(see Note 3).
Legal Proceedings
The Company is a defendant in certain lawsuits resulting
from railroad and industrial switching operations, one
of which had included the commencement of a criminal
investigation that was resolved in 2001 with no charges
arising. Management believes that the Company has
adequate provisions in the financial statements for any
expected liabilities which may result from disposition
of such lawsuits. While it is possible that some of the
foregoing matters may be resolved at a cost greater than
that provided for, it is the opinion of management that
the ultimate liability, if any, will not be material to the
Company’s results of operations or financial position.
On August 6, 1998, a lawsuit was commenced
against the Company and its subsidiary, Illinois &
Midland Railroad, Inc. (IMRR), by Commonwealth
Edison Company (ComEd) in the Circuit Court of Cook
County, Illinois. The suit alleges that IMRR breached
certain provisions of a stock purchase agreement entered
into by a prior unrelated owner of the IMRR rail line.
The provisions allegedly pertain to limitations on rates
received by IMRR and the unrelated predecessor for
freight hauled for ComEd’s previously owned Powerton
Plant. The suit seeks unspecified compensatory damages
for alleged past rate overcharges. The Company believes
the suit is without merit and intends to vigorously
defend against the suit. However, an adverse outcome
of this lawsuit could have a material adverse effect on
the Company’s financial condition.
The parent company of ComEd has sold certain of
ComEd’s power facilities, one of which is the Powerton
plant served by IMRR under the provisions of a 1987
Service Assurance Agreement (the SAA), entered into by
a prior unrelated owner of the IMRR rail line. The SAA,
which is not terminable except for failure to perform,
provides that IMRR has exclusive access to provide rail
service to the Powerton plant. On July 7, 2000, the
Company filed an amended counterclaim against ComEd
in the Cook County action. The counterclaim seeks a
20002001 1999

64 ❘ Genesee & Wyoming Inc.
In addition to the Stock Option Plans, the Company
has reserved 562,500 shares of Class A common stock
it may sell to its full-time employees under its Stock
Purchase Plan. At December 31, 2001, 2000 and 1999,
25,202 shares, 22,388 shares and 17,912 shares,
respectively, had been purchased under this plan.
The Company sells shares at 100% of the stock’s market
price at date of purchase; therefore, no compensation
cost exists for this plan.
Notes to Consolidated Financial Statements
Outstanding at beginning of year 1,720,052 $7.72 1,715,064 $7.88 1,467,845 $8.67
Granted 339,977 11.45 336,488 6.70 279,900 3.81 Exercised (741,428) 8.39 (287,625) 7.59 — — Forfeited (28,775) 7.28 (43,875) 6.42 (32,681) 9.40
Outstanding at end of year 1,289,826 8.32 1,720,052 7.72 1,715,064 7.88
Exercisable at end of year 466,977 7.77 950,220 8.38 827,744 8.38
Weighted average fair value of options granted 6.28 3.47 1.85
The following table summarizes information about stock options outstanding at December 31, 2001:
Exercise Price
$3.72 - 5.99 258,159 2.6 Years $ 4.12 98,686 $4.026.00 - 7.99 293,821 3.8 Years 6.93 114,990 7.228.00 - 9.99 396,520 1.4 Years 9.38 248,801 9.42
10.00 - 11.99 268,575 4.2 Years 10.64 — —12.00 - 17.35 72,751 5.3 Years 14.57 4,500 12.67
3.72 - 17.35 1,289,826 3.0 Years 8.32 466,977 7.77
Weighted Average Exercise
Price
Options Outstanding Options Exercisable
Number of OptionsWeighted Average
Remaining Contractual Life
Weighted Average Exercise
PriceNumber of Options
Year Ended December 31,
2000 1999
SharesWtd. Average
Exercise Price
2001
SharesWtd. Average
Exercise Price SharesWtd. Average
Exercise Price
The fair value of each option grant is estimated on the date of grant using the Black-Scholes option pricing model with the following weighted-average assumptions:
Risk-free interest rate 4.50% 6.20% 5.40%Expected dividend yield 0.00% 0.00% 0.00%Expected lives in years 4.91 5.45 5.90Expected volatility 58.11% 47.80% 39.50%
20002001 1999
The following is a summary of stock option activity for
2001, 2000 and 1999:

18. Business Segment and Geographic Area InformationThe Company currently operates in two business seg-
ments: North American Railroad Operations, which
includes operating short line and regional railroads,
and buying, selling, leasing and managing railroad
transportation equipment within the United States,
Canada and Mexico; and Industrial Switching, which
includes providing freight car switching and related
services to industrial companies with extensive railroad
facilities within their complexes in the United States.
Through December 16, 2000, the Company also operated
in the Australian Railroad Operations segment, which
included operating a regional railroad and providing
hook and pull (haulage) services to other railroads
within Australia.
Corporate overhead expenses, including acquisition
expenses, are reported in North American Railroad
Operations. The Company’s December 31, 2001 and
2000, equity investments in Australia and South America
are also included in the Asset section of North American
Railroad Operations.
The accounting policies of the reportable segments
are the same as those described in Note 2. The Company
evaluates the performance of its operating segments
based on operating income. Intersegment sales and
transfers are not significant. Summarized financial infor-
mation for each business segment and for each geo-
graphic area for 2001, 2000 and 1999 are shown in the
following tables (in thousands):
Genesee & Wyoming Inc. ❘ 65
Consolidated
Total
North American Australian
Railroad Operations Total
Railroad Operations
Industrial SwitchingOperations
2001
Operating revenues $161,445 $12,131 $173,576 — $173,576Income from operations 21,653 487 22,140 — 22,140Depreciation and amortization 12,139 617 12,756 — 12,756Assets 394,746 7,773 402,519 — 402,519Capital expenditures, net of government grants 16,307 244 16,551 — 16,551
2000
Operating revenues $158,318 $10,573 $168,891 $37,639 $206,530Income (loss) from operations 23,545 238 23,783 (30) 23,753Depreciation and amortization 11,068 658 11,726 2,254 13,980Assets 330,358 8,025 338,383 — 338,383Capital expenditures, net of government grants 22,581 404 22,985 6,288 29,273
1999
Operating revenues $121,093 $11,341 $132,434 $43,152 $175,586Income (loss) from operations 15,900 (86) 15,814 6,554 22,368Depreciation and amortization 9,649 768 10,417 2,157 12,574Assets 253,624 8,319 261,943 41,997 303,940Capital expenditures, net of government grants 18,260 130 18,390 6,508 24,898
Refer to the accompanying consolidated statements of
income for items to reconcile from consolidated income
from operations to consolidated net income.

Notes to Consolidated Financial Statements
66 ❘ Genesee & Wyoming Inc.
19. Quarterly Financial Data:(in thousands, except per share data)
2001
Operating revenues $42,871 $44,243 $42,050 $44,412Income from operations 5,181 5,960 5,108 5,891Net income 6,578 5,087 4,531 2,888Diluted earnings per share 0.53 0.40 0.35 0.21
2000
Operating revenues $55,411 $52,354 $50,095 $48,670Income from operations 8,297 7,807 6,681 967Net income 4,412 2,278 3,192 4,050Diluted earnings per share 0.44 0.23 0.32 0.38
1999
Operating revenues $34,172 $42,669 $45,063 $53,682Income from operations 2,038 5,723 6,351 8,257Net income (loss) (331) 2,746 6,691 3,429Diluted earnings (loss) per share (0.03) 0.27 0.67 0.35
Quarterly Results (Unaudited)
First Quarter Second Quarter Third Quarter Fourth Quarter
The fourth quarter of 2001 includes a $728,000
pre-tax decrease to the previously recorded gain of $3.7
million to reflect the lower than estimated reimbursed
amount for acquisition-related costs (see Note 3).The first quarter of 2001 includes an additional pre-tax
gain of $3.7 million related to the December, 2000 issuanceof ARG stock to Wesfarmers (see Note 3).
The fourth quarter of 2000 includes a $10.1 million
pre-tax gain upon the issuance of ASR stock to Wesfarmers,
a $4.0 million pre-tax compensation charge related to
accelerating ASR stock options and a $6.6 million
deferred tax expense resulting from the deconsolidation
of ASR (see Note 3).
The third quarter of 1999 includes $4.2 million of
nonrecurring income tax benefit related to a favorable
income tax legislation change in Australia (see Note 14).

Genesee & Wyoming Inc. ❘ 67
20. Comprehensive Income:Comprehensive income is the total of net income and all
other non-owner changes in equity. The following table
sets forth the Company’s comprehensive income for the
years ended December 31, 2001, 2000 and 1999 (in
thousands):
Net income $19,084 $13,932 $12,533 Other comprehensive
income (loss), net of tax:Foreign currency translation adjustments 708 (3,567) 791
Transition adjustment related to change in accounting for derivative instruments and hedging activities (255) — —
Net change in unrealized losses on qualifying cash flow hedges (475) — —
Comprehensive income $19,062 $10,365 $13,324
The following table sets forth the components ofaccumulated other comprehensive loss, net of tax,included in the consolidated balance sheets as ofDecember 31, 2001 and 2000 (in thousands):
Net foreign currency translation adjustments $(4,175) $(4,883)
Net unrealized losses on qualifying cash flow hedges (730) —
Accumulated other comprehensive loss $(4,905) $(4,883)
20002001 1999
2001 2000
21. Recently Issued AccountingStandards:On October 3, 2001, the Financial Accounting Standards
Board issued Statement of Financial Accounting
Standards No. 144 (SFAS No. 144), “Accounting for the
Impairment or Disposal of Long-Lived Assets.” SFAS
No. 144 addresses financial accounting and reporting
for the impairment of long-lived assets and for long-
lived assets to be disposed of. SFAS No. 144 supersedes
SFAS No. 121, “Accounting for the Impairment of
Long-Lived Assets and for Long-Lived Assets to Be
Disposed Of.” SFAS No. 144, however, retains the funda-
mental provisions of SFAS No. 121 for (a) recognition
and measurement of the impairment of long-lived assets
to be held and used and (b) measurement of long-lived
assets to be disposed of by sale. SFAS No. 144 supersedes
the accounting and reporting provisions of APB Opinion
No. 30 (“Opinion 30”), “Reporting the Results of
Operations - Reporting the Effects of Disposal of a
Segment of a Business, and Extraordinary, Unusual and
Infrequently Occurring Events and Transactions,” for
segments of a business to be disposed of. SFAS No. 144,
however, retains the requirement of Opinion 30 to report
discontinued operations separately from continuing
operations and extends that reporting to a component
of an entity that either has been disposed of (by sale,
by abandonment, or in a distribution to owners) or is
classified as held for sale. The Company adopted SFAS
No. 144 on January 1, 2002 and does not expect to
record any impairment charges upon adoption.
On June 30, 2001, the Financial Accounting
Standards Board issued Statement No. 141, “Business
Combinations”(SFAS No. 141). Under SFAS No. 141,
all business combinations initiated after June 30, 2001
must be accounted for using the purchase method of
accounting. Use of the pooling-of-interests method is
prohibited. Additionally, Statement No. 141 requires
that certain intangible assets that can be identified and
named be recognized as assets apart from goodwill.
SFAS No. 141 is effective for all business combinations
initiated after June 30, 2001.

68 ❘ Genesee & Wyoming Inc.
Notes to Consolidated Financial Statements
On June 30, 2001, the Financial Accounting
Standards Board issued Statement No. 142, “Goodwill
and Other Intangible Assets” (SFAS No. 142). Under
SFAS No. 142, goodwill and intangible assets that have
indefinite useful lives will not be amortized but rather
will be tested at least annually for impairment.
Intangible assets that have finite useful lives will contin-
ue to be amortized over their useful lives. In accordance
with this statement, the Company adopted SFAS 142
as of January 1, 2002 for existing goodwill and intangi-
ble assets and on June 30, 2001 for South Buffalo.
As of December 31, 2001, goodwill, net of accumulated
amortization, is $24.1 million and amortization expense
for the year ended December 31, 2001 is $358,000.
The Company does not expect to record any impairment
charges upon adoption in 2002.

Genesee & Wyoming Inc. ❘ 69
Corporate Headquarters
Genesee & Wyoming Inc.66 Field Point RoadGreenwich, Connecticut 06830203-629-3722Fax 203-661-4106NASDAQ GNWRwww.gwrr.com
Common Stock
The Class A Common Stock of the Company has beentraded since June 24, 1996, on the Nasdaq NationalMarket under the symbol GNWR. The Class B CommonStock is not publicly traded.
The actual trade prices of Class A Common Stockreflected below have been adjusted for a three-for-twostock split paid on March 14, 2002 to shareholders ofrecord on February 28, 2002; and for a three-for-twostock split paid on June 15, 2001 to shareholders ofrecord on May 31, 2001:
Year Ended December 31, 2001
High Low1st Quarter $13.055 $ 9.0002nd Quarter $14.600 $ 9.0283rd Quarter $17.966 $12.3404th Quarter $22.066 $15.000
Year Ended December 31, 2000
High Low1st Quarter $ 6.888 $ 5.2782nd Quarter $ 8.555 $ 6.3333rd Quarter $11.222 $ 7.1114th Quarter $14.222 $ 7.666
As of March 22, 2002, there were 133 record holders of Class A Common Stock and 9 holders of Class BCommon Stock. Class B Common Stock is not publiclytraded. The Company believes that there are approxi-mately 3,650 beneficial owners of Class A CommonStock. Prior to its initial public offering, the Companyhistorically paid dividends on its common stock. See“Selected Financial Data.” However, the Company doesnot intend to pay cash dividends for the foreseeablefuture.
Stock Registrar and Transfer Agent
LaSalle Bank, N.A.Trust and Asset Management135 South LaSalle StreetChicago, IL 60603312-904-2450www.lasallebank.com
Legal Counsel
Simpson Thacher & Bartlett425 Lexington AvenueNew York, New York 10017212-455-2000www.stblaw.com
Harter, Secrest & Emery LLP1600 Bausch & Lomb PlaceRochester, New York 14604-2711716-232-6500www.hselaw.com
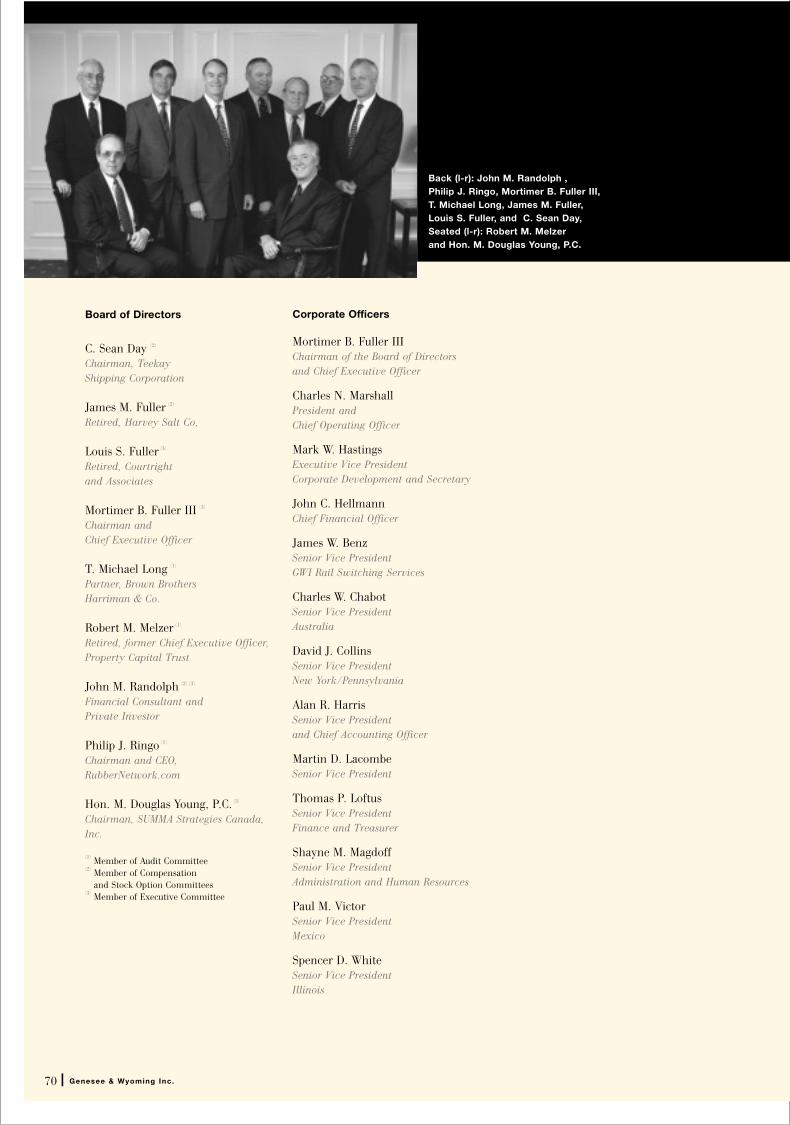
70 ❘ Genesee & Wyoming Inc.
Corporate Officers
Mortimer B. Fuller IIIChairman of the Board of Directorsand Chief Executive Officer
Charles N. MarshallPresident andChief Operating Officer
Mark W. HastingsExecutive Vice PresidentCorporate Development and Secretary
John C. HellmannChief Financial Officer
James W. BenzSenior Vice PresidentGWI Rail Switching Services
Charles W. ChabotSenior Vice PresidentAustralia
David J. CollinsSenior Vice PresidentNew York/Pennsylvania
Alan R. HarrisSenior Vice Presidentand Chief Accounting Officer
Martin D. LacombeSenior Vice President
Thomas P. LoftusSenior Vice PresidentFinance and Treasurer
Shayne M. MagdoffSenior Vice PresidentAdministration and Human Resources
Paul M. VictorSenior Vice PresidentMexico
Spencer D. WhiteSenior Vice PresidentIllinois
Board of Directors
C. Sean Day (2)
Chairman, TeekayShipping Corporation
James M. Fuller (2)
Retired, Harvey Salt Co.
Louis S. Fuller (3)
Retired, Courtrightand Associates
Mortimer B. Fuller III (3)
Chairman andChief Executive Officer
T. Michael Long (1)
Partner, Brown BrothersHarriman & Co.
Robert M. Melzer (1)
Retired, former Chief Executive Officer,Property Capital Trust
John M. Randolph (2) (3)
Financial Consultant andPrivate Investor
Philip J. Ringo (1)
Chairman and CEO,RubberNetwork.com
Hon. M. Douglas Young, P.C. (3)
Chairman, SUMMA Strategies Canada,Inc.
(1) Member of Audit Committee(2) Member of Compensation
and Stock Option Committees(3) Member of Executive Committee
Back (l-r): John M. Randolph , Philip J. Ringo, Mortimer B. Fuller III, T. Michael Long, James M. Fuller, Louis S. Fuller, and C. Sean Day, Seated (l-r): Robert M. Melzer and Hon. M. Douglas Young, P.C.