Embed Size (px)
Citation preview
University of South CarolinaScholar Commons
Theses and Dissertations
8-9-2014
Genes Mediating Cardiac Remodeling DuringPregnancy and the Early Post-Partum-Period inMiceEsam AljrbiUniversity of South Carolina - Columbia
Follow this and additional works at: https://scholarcommons.sc.edu/etd
Part of the Earth Sciences Commons
This Open Access Dissertation is brought to you by Scholar Commons. It has been accepted for inclusion in Theses and Dissertations by an authorizedadministrator of Scholar Commons. For more information, please contact [email protected].
Recommended CitationAljrbi, E.(2014). Genes Mediating Cardiac Remodeling During Pregnancy and the Early Post-Partum-Period in Mice. (Doctoraldissertation). Retrieved from https://scholarcommons.sc.edu/etd/2775
GENES MEDIATING CARDIAC REMODELING DURING PREGNANCY AND THE EARLY POST-PARTUM-PERIOD IN MICE
By
Esam Aljrbi
Bachelor of Medical Technology University of Tripoli, 2001
Submitted in Partial Fulfillment of the Requirements
For the Degree of Master of Science in
Biomedical Engineering
College of Engineering and Computing
University of South Carolina
2014
Accepted by:
Holly LaVoie, Director of Thesis
Edie Goldsmith, Reader
Ugra Singh, Reader
Lacy Ford, Vice Provost and Dean of Graduate Studies

ii
DEDICATION
I dedicate my thesis to my father and family, with a special feeling of gratitude to my
loving parents. To my brothers, sisters, friends and my son who encourage me to
continue whenever I face tough situations.

iii
ACKNOWLEDGMENTS
First, I would like to thank my mentor, Dr. Holly LaVoie for her advice, direction, and
providing me all the resources and materials to complete my project. Also, I would like
to thank Bo Shi and all of my colleagues in the lab for their help and support. Finally, a
special thanks to Dr. Edie Goldsmith and Dr. Ugra Singh for their time, comments, and
instructions as a member of my thesis committee.
iv
ABSTRACT
The female heart undergoes adaptive remodeling during pregnancy to compensate for the
increased hemodynamic load imposed by the developing fetus. However, unlike a
similar adaptive process which occurs under pathological conditions (such as
hypertension and valvular heart disease) the cardiac changes observed during
hypertrophy associated with pregnancy are reversible. The goal of this study is to identify
changes in gene expression associated with pregnancy-induced hypertrophy. We tested
the hypothesis that pregnancy-induced physiological hypertrophy has a unique genetic
signature, likely due to altered hormone levels, which supports and promotes reversible
remodeling. Comparing the gene expression profile associated with physiological
remodeling with that involved in pathological remodeling of the heart, may lead to new
therapeutic approaches for treating pathological heart disease under conditions of
increased hemodynamic load. We analyzed two microarray datasets for gene changes
during mid and late pregnancy and the early post-partum period and compared them to
virgin mice in diestrus. Numerous changes in extracellular matrix genes were identified
and the mRNAs for TIMP1-4, MMP3, MMP11, MMP13-MMP16, MMP25, and MMP28
were quantified in left ventricles by real-time PCR confirming some of the microarray
changes but not others. Late pregnancy and the early post-partum period exhibited the
most gene changes. As changes in TIMP and MMP mRNAs may reflect changes in their
protein levels and activity, we predict that MMPs and TIMPs are important players

v
during the peripartum period may determine the extent of matrix remodeling that occurs
in the left ventricle during this time.
vi
TABLE OF CONTENTS
DEDICATION .................................................................................................................... ii
ACKNOWLEDGEMENTS ............................................................................................... iii
ABSTRACT ....................................................................................................................... iv
LIST OF FIGURES .......................................................................................................... viii
CHAPTER 1: INTRODUCTION ........................................................................................1
1.1 Introduction overview ........................................................................................1
1.2 Anatomy of the Heart.........................................................................................2
1.3 Cell type of the heart .........................................................................................3
1.4 Myocardial cells (cardiac muscle cells) and fibroblasts ....................................3
1.5. Pathological and physiological hypertrophy ....................................................4
1.6 Extracellular matrix ...........................................................................................6
1.7. Matrix metalloproteinases and Tissue inhibitors of metalloproteinases are important regulators of extracellular matrix remodeling ................................14
1.8. Other ECM proteins and their genes ...............................................................16
1.9 Aims of this study ............................................................................................26
CHAPTER 2: MATERIALS AND METHODS ...............................................................27
2.1 Animals. ...........................................................................................................27
2.2 Cardiac tissue collection ..................................................................................27
vii
2.3. Quantitative real-time PCR (Q-PCR) ............................................................28
2.3.1. RNA isolation ..............................................................................................28
2.3.2. Microarray analyses: ....................................................................................29
2.3.3. cDNA synthesis ...........................................................................................30
2.3.4. Real time PCR..............................................................................................30
2.4. Data and statistical analysis ............................................................................31
CHAPTER 3: RESULTS .................................................................................................. 34
3.1. Animal Tissue Data and Heart weight/tibial length ........................................34
3.2. Microarray data: Differentially expressed genes in the left ventricle. ...........35
3.3. Real-time PCR results for TIMPs ...................................................................37
3.4. Real-time PCR results for MMPs ...................................................................37
CHAPTER 4: DISCUSSION .............................................................................................61
REFERENCES ..................................................................................................................66
viii
LIST OF FIGURES
Figure 1.1. Cardiac hypertrophy can be classified as physiological, which occurs during pregnancy or in response to chronic exercise training .......................7 Figure 3.1. The ratio of heart weight to tibia length (HW/TL) for the four groups of female mice. ...................................................................................40 Figure 3.2. Heat map showing differential expression of extracellular matrix genes in the left ventricle from GEO dataset GSE36330. ................................ 41-42 Figure 3.3. Heat map showing differential expression of extracellular matrix genes in the left ventricle as measured by our 2.0 ST array. ..................................43 Figure 3.4. Individual heat maps for some of the genes discussed in the Introduction. This part of heat map comes from our array Affymetrix 2.0 ST. ................44 Figure 3.5. Individual gene profiles from the heat map for selected collagen and collagen related genes in left ventricles. ...........................................................................................45 Figure 3.6. Individual gene profiles from the heat map for TIMP1, TIMP2 and TIMP4 gene expression in left ventricles. .....................................................................................46 Figure 3.7. . Individual gene profiles from the heat map of MMP2, MMP4, MMP11, MMP13, MMP14, MMP15, MMP16, MMP25, and MMP28 gene expression in left ventricles ............................................................................................................................47 Figure 3.8. The level of tissue inhibitor of metalloproteinases 1 (timp1) mRNA in left ventricle tissue of female mice as measured by qPCR. ...............................48 Figure 3.9. The level of tissue inhibitor of metalloproteinases 2 (timp2) mRNA in left ventricle tissue of female mice as measured by qPCR ...............................49

ix
Figure 3.10. The level of tissue inhibitor of metalloproteinases 3(timp3) mRNA in left ventricle tissue of female mice as measured by qPCR ................................50 Figure 3.11. The level of tissue inhibitor of metalloproteinases 4 (timp4) mRNA in left ventricle tissue of female mice as measured by qPCR ................................51 Figure 3.12. The level of matrix metalloproteinase 2 (mmp2) mRNA in left ventricle tissue of female mice as measured by qPCR ................................52 Figure 3.13. The level of matrix metalloproteinase 3 (mmp3) mRNA in left ventricle tissue of female mice as measured by qPCR ................................53 Figure 3.14. The level of matrix metalloproteinase 11 (mmp11) mRNA in left ventricle tissue of female mice as measured by qPCR ................................54 Figure 3.15. The level of matrix metalloproteinase 13 (mmp13) mRNA in left ventricle tissue of female mice as measured by qPCR ...............................55 Figure 3.16. The level of matrix metalloproteinase 14 (mmp14) mRNA in left ventricle tissue of female mice as measured by qPCR ................................56 Figure 3.17. The level of matrix metalloproteinase 15 (mmp15) mRNA in left ventricle tissue of female mice as measured by qPCR ...............................57 Figure 3.18. The level of matrix metalloproteinase 16 (mmp16) mRNA in left ventricle tissue of female mice as measured by qPCR ................................58 Figure 3.19. The level of matrix metalloproteinase 25 (mmp25) mRNA in left ventricle tissue of female mice as measured by qPCR ...............................59 Figure 3.20. The level of matrix metalloproteinase 28 (mmp28) mRNA in left ventricle tissue of female mice as measured by qPCR ...............................60
1
CHAPTER 1
INTRODUCTION
1.1 Introduction Overview
Cardiovascular disease is the most common cause of death in the world. Based
on 2013 statistics from the American Heart Association, approximately 83.6 million
Americans are living with some form of cardiovascular disease (Go et al, 2014). The
cardiovascular system is comprised of the heart and a circulation system of blood vessels.
The heart is a muscular organ which pumps blood through blood vessels to tissues to
supply all the cells of the body with oxygen. Cardiac hypertrophy is defined as an
increased thickening of the heart wall including that of the left and right ventricles and
which can decrease the size of the heart chambers; it is a feature of many types of
cardiovascular disease. Despite advances to the cardiac research field, pathological
cardiac hypertrophy is not completely understood and deserves further study. Once
damage occurs to the cardiac muscle, such as during cardiovascular disease, there is no
way to restore the muscle back to normal. Pathological changes in the heart extend to
regions outside the cardiac muscle and include the extracellular matrix regions.
Pathological cardiac hypertrophy can lead to heart failure, while physiological cardiac
hypertrophy, such as that which occurs with exercise and during pregnancy, is beneficial
to the heart and is reversible. In this section the structure of the heart and cell types
within it will be reviewed and the relationship between the muscle cells (myocytes) and
2
their extracellular matrix (ECM) environment will be discussed. Pathological and
physiological hypertrophy (including that of pregnancy) will be reviewed and compared.
As changes in the extracellular matrix are features of cardiac hypertrophy, components of
the extracellular matrix will be reviewed. Matrix metalloproteinases (MMPs) and Tissue
inhibitors of metalloproteinases (TIMPs) are major regulators of extracellular matrix
remodeling. As initial microarray data analyses revealed that some genes for MMPs and
TIMPS are regulated during the physiological hypertrophy accompanying pregnancy,
these proteins will be the focus of this work and their general function and relevance to
normal heart function and cardiac hypertrophy will be reviewed herein.
1.2 Anatomy of the Heart
In human, the heart is located within the mediastinum of the thorax and weighs
usually between 250 to 350 grams (Marieb 2013). One-third of the heart mass projects to
the right of the mid-sternal line, and two-thirds of its mass lies to the left of the mid-
sternal line. It has four chambers which serve to hold the blood. The two upper
chambers, the right and left atria, are separated by a wall called the interatrial septum.
The two lower chambers, the right and left ventricles, are separated by a wall called the
interventricular septum. The heart muscle in the chamber walls serves to pump the
blood. The right ventricle pumps blood through the pulmonary trunk to the lungs, while
the left ventricle pumps blood through the aorta and throughout the body. Furthermore,
there are four cardiac valves which are located in the heart at the entrance and the exit of
each ventricle. The heart has control of unidirectional blood flow through the chambers
by opening and closing the valves of the heart. Outflow valve opening and closure
results from differences in the blood pressure on the two sides of the valve. There are
3
two atrioventricular (AV) valves, the tricuspid and mitral valves. When the ventricles are
contracting the AV valves stop backflow through the atria. The other two valves are
called the semilunar valves and include the pulmonary and aortic valves. When the
ventricles relax these valves stop backflow through the aorta and pulmonary arteries.
1.3 Cells types of the heart
The heart contains different cell types that participate in the structural,
biochemical, mechanical and electrical properties of the heart. The main cell types
include the cardiomyocytes, fibroblasts, endothelial cells, and smooth muscle cells. The
myocardium is composed of the atrial and ventricular cardiomyocytes to form the
muscular walls of the heart (Xin et al, 2013). Although myocytes occupy two thirds of
the tissue volume, approximately 70% of cells within the myocardium are fibroblasts
(Banerjee et al, 2007; Borg and Baudino, 2011; Goldsmith et al, 2004). Fibroblasts
reside in the connective tissue (Krenning et al, 2010; Souders et al, 2009). Vascular
smooth muscle cells are found in blood vessel walls and endothelial cells line the inside
of the heart and blood vessels.
1.4 Myocardial cells (cardiac muscle cells) and fibroblasts
The myocardium of the heart houses the cardiac muscle cells also called
cardiocytes or cardiac myocytes (Wolfgang Kühnel 2003). The cardiac muscle tissue is
formed by an end to end arrangement of myocytes. By a sliding filament mechanism,
similar to skeletal muscle, the cardiac muscle contracts. On the other hand, in contrast to
skeletal muscle cells, cardiac cells are branched, short, and wide, and have centrally
located nuclei. The human cardiac myocyte can contract constantly 3 billion or more
times without fatigue. Myocytes measure approximately 100 to 150 µm in length and 20
4
to 35 µm in width, and each myocyte functions as an autonomous contractile unit (Severs
2000).
There are three types of cell junctions including the gap junction, the desmosome
and the fascia adherens which are found at the intercalated discs between myocytes.
Mitochondria comprise 30% of the volume of the cardiac cells and make those cells
highly fatigue resistant. Contractile myofilaments consist of actin, myosin, and
associated proteins. There are two types of myofilaments thin actin filaments and thick
myosin filaments. The myofibrils are divided into repetitive sections called sarcomeres.
Sarcomere that have (A) dark bands, (I) light band and (Z) discs which reflect the
arrangement of actin and myosin filaments. The cardiac muscle cell has sarcoplasmic
reticulum tubules for storing and releasing Ca2+ which contributes to the contraction
cycle (Marieb et al, 2013).
Fibroblasts are cells of mesenchymal origin and are present in every tissue in the
body (Krenning et al, 2010; Souders et al, 2009). Morphologically, fibroblasts are flat,
spindle-shaped with multiple processes of connective tissue surrounded by ECM.
Cardiac fibroblasts play a central role in the physiological turnover of the ECM as well as
its pathological remodeling (Fan et al, 2012).They secrete ECM proteins, cytokines,
TIMPs and MMPs, natriuretic peptides and growth factors.Fibroblasts impact ECM
homeostasis, myocyte hypertrophy and apoptosis, angiogenesis, and cardiac electrical
properties.
1.5 Pathological and physiological hypertrophy
They are two forms of cardiac hypertrophy, concentric and eccentric, and the
change in myocytes is different depending upon which one is occurs. Concentric
5
hypertrophy results in a thickening of the ventricular wall and is associated with
increased myocyte size while eccentric hypertrophy results in a lengthening of the
myocyte and increased chamber diameter. Hypertrophy can be adaptive and
physiological or it can be pathological and ultimately maladaptive and detrimental to
function. Hypertrophy usually occurs in response to hemodynamic stress from volume or
pressure overload and both types show increased cardiac growth or hypertrophy (Mone et
al, 1996). During pregnancy the heart develops physiological left ventricular
hypertrophy as a result of the natural volume overload (Li et al, 2012). In response to
normal exercise or pregnancy physiological hypertrophy results and is characterized by
an increase in cardiac pumping ability and muscle mass (Mone et al, 1996). Pressure
overload leads to concentric hypertrophy. Volume overload-induced hypertrophy under
non-pathological conditions is characterized as a proportional enlargement of the
chamber size and the wall thickness (Dorn et al, 2003) and is reversible without aberrant
effects on cardiac function (Daniels et al, 1988; Pluim et al, 2000; Schannwell et al,
2002). Physiological hypertrophy involves normal organization of cardiac structure and
normal or enhanced cardiac function. On the other hand, pregnancy, unlike exercise, has
a continuous rather than sporadic force demand on the heart, and pregnancy is also
accompanied by changes in the mother's hormonal environment (Iorga et al, 2012).
Physiological growth is reversible in the instance of exercise- or pregnancy-induced
hypertrophy and is associated with normal cardiac structure and normal or improved
cardiac function (Ferrans , 1984; Schaible and Scheuer , 1984, Fagard 1997) (Fig.1).
Physiological hypertrophy occurs in pregnancy in healthy women without heart disease
to allow adaptation to the extreme hemodynamic changes that occur during pregnancy.
6
These changes in the heart slowly return to normal values during the post-partum period,
but complete resolution may take as long as 6 months after delivery in humans. In
contrast concentric hypertrophy is a hypertrophic growth of a hollow organ without
overall enlargement, and occurs as a result of pressure overload, which is characterized as
increased wall thickness without a concomitant chamber enlargement. Pathological
hypertrophy occurs in response to chronic volume or pressure overload in a cardiac
disease setting such as valvular heart disease, hypertension, myocardial infarction, or
ischemia associated with coronary artery disease. Pathological hypertrophy is also
typically associated with loss of myocytes, fibrosis, cardiac dysfunction, and increased
risk of heart failure and sudden death (Cohn et al, 1997; Levy et al, 1990; Weber et al,
1993).
1.6 Extracellular matrix
Extracellular matrix (ECM) is the collective group of proteins and
polysaccharides that surrounds most cells in tissues. It contributes to the structure and
function of a tissue (Lodish Freeman 2007). The ECM of the heart contributes to the
structural and functional integrity of the heart by creating an organized complex of
proteins and proteoglycans that service many functions (Borg et al, 1993). In the
myocardium the ECM scaffold surrounds and supports the cells such as the
cardiomyocytes and fibroblasts (Frangogiannis 2012). ECM molecules include collagen,
fibrillin, fibronectin, hyaluronic acid, proteoglycans and proteases and numerous other
glycoproteins and proteoglycans. Proteases break down proteins. There are two main
classes of protease that breakdown ECM proteins, ADAMTs (A disintegrin and
metalloproteinase domain-containing proteins) and MMPs (Lockhart et al, 2011).
7
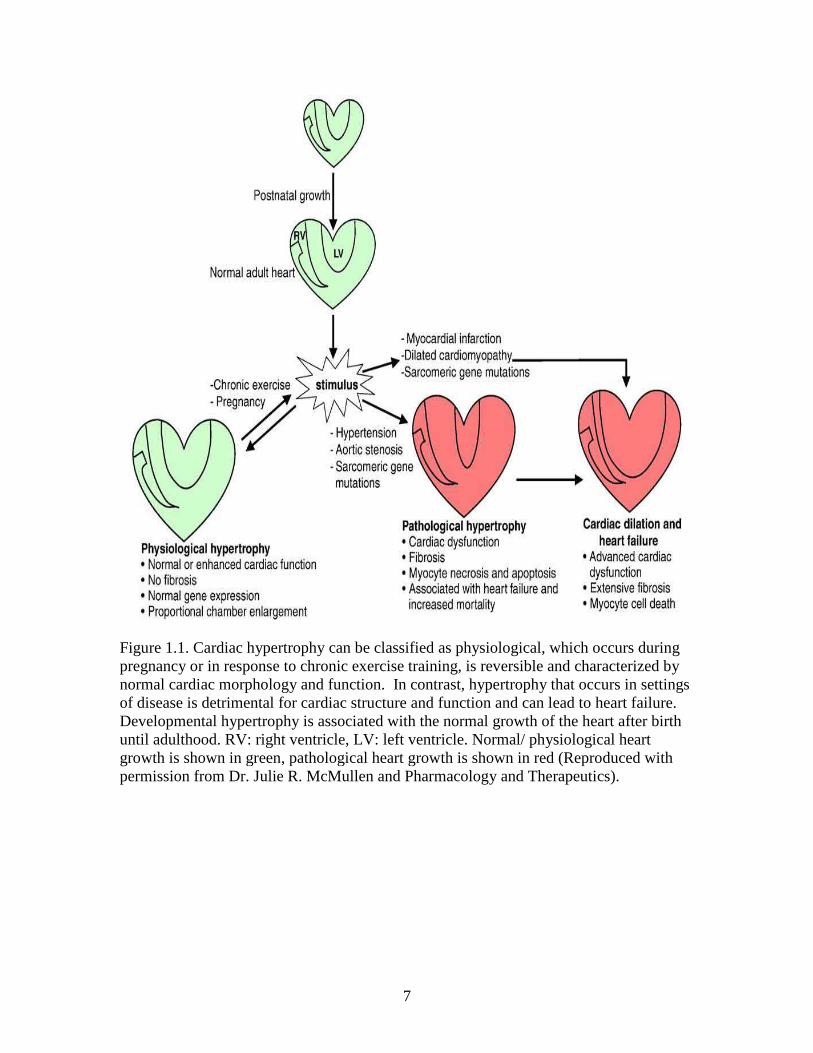
Figure 1.1. Cardiac hypertrophy can be classified as physiological, which occurs during pregnancy or in response to chronic exercise training, is reversible and characterized by normal cardiac morphology and function. In contrast, hypertrophy that occurs in settings of disease is detrimental for cardiac structure and function and can lead to heart failure. Developmental hypertrophy is associated with the normal growth of the heart after birth until adulthood. RV: right ventricle, LV: left ventricle. Normal/ physiological heart growth is shown in green, pathological heart growth is shown in red (Reproduced with permission from Dr. Julie R. McMullen and Pharmacology and Therapeutics).
8
ADAMTs and MMPs are in turn inhibited by TIMPs. Under normal conditions,
all these players function in equilibrium to maintain cardiac ECM homeostasis (Bowers
et al, 2010). The ECM is critical in both homeostasis and pathological remodeling
(Manabe et al, 2002), where it maintains structural stability, correct myocyte geometry
and provides for the transmission of contractile force (Caulfield and Borg, 1979; Weber
1989). The loose connective tissue matrix of the endomysium fills the intercellular
spaces and containing a number of capillaries (Marieb et al, 2013). Recent work has
revealed that the ECM is involved in cell-cell signaling, regulation of cell proliferation,
and control of gene expression. It also aids in cell differentiation, cell migration and cell
growth that aids the formation of cells into tissues and organizes their cellular functions
(Daley et al, 2008; Frantz et al, 2010). ECM remodeling is a key process for
development of cardiac hypertrophy, the post-myocardial infarction response, dilated
cardiomyopathy and heart failure (Swynghedauw 1999).
The cardiac myocytes of the myocardium are tethered together by an intricate
framework of ECM proteins which provides structural integrity to the tissue and a means
for optimal vectoral transmission of force (Baicu et al, 2003). Cardiac remodeling
includes myocyte hypertrophy and fibroblast proliferation and alterations to the
expression and distribution of major structural proteins of the ECM. The different cell
populations of the heart vary in their ability to make and secrete different ECM
components. Various studies show that cardiac fibroblasts are the main cells that
synthesize ECM components and secrete proteolytic enzymes such as the MMPs
(Eghbali et al, 1989; Pelouch et al, 1993). Cardiac fibroblasts are the primary producers
of MMP family members (Baudino et al, 2006). Fibroblasts and vascular smooth muscle
9
cells (VSMCs) are involved in collagen type I and III and fibronectin production, and
VSMCs, myocytes and endothelial cells produce laminins and type IV collagen (Cohn et
al, 2000). Cardiac myocytes also produce collagen VI and proteoglycans (Jane-Lise et al,
2000).
The cardiac ECM plays an important role in synchronized beating of
cardiomyocytes to help the relaxation phase of the heart (Mishra et al, 2013). The
function of the healthy heart depends on an effective transmission of force from cardiac
myocytes to the ECM scaffold and the ECM protein content and arrangement are
important for this process. Aberrant expression of ECM components can lead to cardiac
malformations like those found in congenital heart disease (Lockhart et al, 2011).
Understanding ECM turnover during LV remodeling for post-MI patients and targeting
ECM proteins will likely aid development of novel treatment strategies (Yabluchanskiy
et al, 2013).
The following describes the major ECM and ECM-associated proteins, collagen,
elastin, proteoglycans, hyaluron, fibronectin, laminin, and integrins:
Collagen: Fibrillar collagens are the most abundant of the ECM proteins. These
proteins provide structural strength by helping to create three-dimensional matrix
between cardiac muscle fibers (Bishop and Laurent, 1995). Collagen structure is a unique
triple helix: a right-handed supercoil of three left-handed polyproline II-like polypeptide
strands composed of regular Gly-XY repeats (typically, X and Y are Pro and 4-
hydroxyproline (Hyp), respectively) (Beck and Brodsky, 1998; Okuyama 2008). The
specific cellular functions of collagen are known to be elicited by the interaction of
specific epitopes displayed on the triple helix with either collagen receptors (i.e.,
10
integrins, discoidin-domain receptors, and platelet glycoprotein VI) (Lebbink et al, 2009;
Leitinger and Hohenester, 2007) or other collagen-binding molecules (Giudici et al,
2008; Sweeney et al, 1998). There are at least 28 distinct collagen types expressed in
vertebrates. Several collagen types have been identified within the myocardium
including types I, III, IV, V, VI and VIII (Chapman et al, 1990; Iruela-Arispe and Sage,
1991; Kitamura et al, 2001). Approximately 70% to 85% of total cardiac collagen is in
the left ventricle and provides tensile strength. The majority of this collagen is type
collagen I. Collagen type III makes up approximately 10% of total cardiac collagen and
helps maintain the elasticity of the ECM network. Early pressure-overload hypertrophy
studies revealed increased collagen content as well as myocardial mass as a result of
experimental pressure overload (Bing et al, 1971). Throughout systole, myocytes bear
the vast majority of the wall stress but the surrounding collagen transmits force and helps
maintain myocyte arrangement. In diastole, perimysial collagen fibers uncoil as the
ventricle fills; once these fibers are stretched to become straightened these fibers resist
further expansion, account for the steep portion of the end-diastolic pressure-volume
curve, and prevent myocytes from overstretching. This concept of the mechanical role of
fibrillar collagen in the heart emerged generally through correlative studies (Borg et al,
1981). Passive tension in cardiac muscle is due to the contribution of collagen, titin,
microtubules, and intermediate filaments. More quantitative modeling studies of
collagen structure and content to myocardial mechanics is needed to completely
understand the mechanical impact of changes in collagen type ratios and collagen cross-
linking. The fibrillar collagens are identified with structural support for the matrix but
the non-fibrillar collagens are important regulators in securing and organizing the ECM
11
meshwork. Type IV collagen is the major component of the basement membrane.
Collagen IV constructs a scaffold with laminin, entactin, and perlecan to create a
collagen, proteoglycan, and glycoprotein meshwork in the basement membrane
(Khoshnoodi et al, 2008; LeBleu et al, 2007). Types IV and VI collagen interact in the
basement membrane creating a connecting bridge between the basement membrane and
the interstitial matrix (Kuo et al, 1997).
Elastin: Elastic fibers impart passive recoil, promote cell attachment and regulate
growth factor availability to dynamic tissues such as lung, aorta and skin (Kielty 2006).
Elastic fiber constituents (elastin and fibrillin microfibrils) are degraded by serine
proteases and MMPs (Ashworth et al, 1999). Individuals with cardiac disease and
increased MMP activation will eventually have reduced myocardial elastin content which
is associated with increased ventricular stiffness, such as in the case of the spontaneous
hypertrophic rat with decompensated heart failure (Mujumdar and Tyagi, 1999). The
myocardium contains elastin in the walls of coronary blood vessels as well as in the
interstitium, but it is yet unclear whether elastin contributions are significant to
myocardial mechanics (Fomovsky et al, 2010). Acute ischemia disrupts the interstitial
elastin fibers (Sato et al, 1983), as well as pressure overload (Henderson et al, 2007) and
consequential heart failure (Cheng et al, 2006). Fifteen years ago (1999), Mujumdar and
Tyagi speculated that changes in both the elastin-collagen ratio rather than collagen
content alone controlled the increased diastolic stiffness in pressure overload.
Proteoglycans: The ECM is composed of large proteoglycans (PGs) that a
contain glycosaminoglycan (GAG) (Gao et al, 2014). Water flow in and out of the tissue
during loading regulates cartilage mechanics and is controlled by proteoglycans. There is
12
currently no evidence that proteoglycans play a similar role in the myocardium, but it is
possible. Fluid movement is important to myocardial mechanics yet it is poorly
understood. Proteoglycans present in the myocardium are frequently overlooked when
examining the cardiac ECM (Azeloglu et al, 2008). Proteoglycans are known to be a
significant determinant of residual stress in arteries, but their role in the myocardium
needs further study.
Hyaluronan: (HA) is the most abundant GAG in the developing heart.
Glycosaminoglycans are long unbranched polysaccharide chains of repeating
disaccharide units. Hyaluronan is a non-sulfated GAG composed of an extra-long
carbohydrate chain which allows it to displace a large volume of water. It can act to
absorb shock and affects the distribution and transport of proteins in ECM (Toole et
al,2004). In the developing heart, HA is found in the cardiac jelly and later in
development in the AV canal and cardiac outflow tract endocardial cushions tissues and
forming leaflets. Moreover, HA is also a present in epicardial mesenchyme and in the
interstitial space surrounding the cardiomyocytes of the myocardial structures in the
heart. HA and its receptor CD44 are present in the heart of newborn and adult rats
(Hellström et al, 2006). An experimental rat model of cardiac hypertrophy showed
increased synthesis of HA and CD44 (Hellman et al, 2008).
Adhesive glycoproteins:
Fibronectin (FN): Fibronectin is a ubiquitous, multifunctional extracellular
glycoprotein involved in cell adhesion, wound healing, migration and tissue structuring
throughout embryogenesis (Hay 1991; Potts and Campbell, 1996). The structure of
fibronectin has a series of repeating FN I, II and III domains and is considered to be
13
synthesized by nearly all the heart cell types except cardiac myocytes (Hein and Schaper,
2001). Fibronectin can interact with integrins other ECM proteins including hyaluronan,
heparin sulfate proteoglycans, collagen, fibronectin and other molecules (Pankov and
Yamada, 2002). In the myocardium, fibronectin is mostly located in the basement
membranes surrounding myocytes, smooth muscle cells and endothelial cells (Ahumada
et al, 1981; Heling et al, 2000; Sharov et al, 2005).
Laminin: The basement membrane glycoprotein laminin is a potent cell adhesion
molecule with similar functions to fibronectin, and mediates cell migration, expansion
and contributes to the structure of basement membranes (Tryggvason 1993). Laminin
can bind integrin receptors. Pressure overload hypertrophy results in an increased levels
of total laminin; however, in response to increased workload differential expression of
laminin isoforms has been reported. The hypertrophied left ventricle in the rat pressure
overload model exhibited increased laminin chain expression (Grimm et al, 1998).
Integrins: Integrins are heterodimers consisting of both alpha and beta subunits.
Integrins are expressed in both myocytes and fibroblasts in the myocardium, however
only a subpopulation of the known eighteen α and eight β subunits have been identified in
these cell types. The subunits α1, α3, α5 , α6, α7, α9 and α10 associate with β1 subunit in
the myocardium and β3 and β5 expression have also been detected in cardiac tissue (Ross
and Borg, 2001). Integrins function as a family of transmembrane cell surface adhesion
receptors that mediate bidirectional signaling to the plasma membrane and anchor the
intracellular cytoskeletal proteins to the surrounding ECM (Humphries et al, 2004).
Under normal conditions integrins allow signaling interactions between cardiac cells and
matrix proteins to promote ECM homeostasis. During cardiovascular disease ADAMs
14
proteases can attack integrins causing shedding which reduces cell-matrix interactions
(Fedak et al., 2006). Proteolytic cleavage of integrins can also give rise to soluble
integrin fragments with the ability to bind various ECM proteins and stimulate myocyte
attachment to matrix proteins during cardiac growth (Goldsmith et al., 2003).
1.7 Matrix metalloproteinases and Tissue inhibitors of
metalloproteinases are important regulators of extracellular matrix
remodeling
Matrix metalloproteinases are a group of extracellular matrix degrading enzymes
that are involved in normal matrix turnover, but that are also involved in causing adverse
remodeling which can result in ventricular dysfunction (Berk et al, 2007; Umar et al,
2007). Matrix metalloproteases are zinc containing calcium-dependent endopeptidases
which are released as inactive zymogens in a latent form (Dhanaraj et al, 1996; Lindsey
and Zamilpa, 2012; Tyagi et al, 1993). MMPs are activated by autoproteolysis, serine
proteases, or other activated MMPs. In the late 1970s a search for MMPS inhibitors
began (Hodgson 1995). At that time only a few MMPs had been identified, making their
individual functions difficult to assess. Abnormal MMP enzyme activity aberrantly
increases proteolysis of extracellular matrix proteins leading to the loss of their
supportive role to cardiomyocytes. Such events promote disorder in ECM protein
orientation and its coordination and can result in left ventricular dysfunction as well as
pump failure (Aggeli et al, 2012). MMPs can degrade a wide variety of extracellular
molecules including various bioactive molecules. Twenty four MMP genes have been
identified within humans, which are classified into six groups based on domain
organization and substrate preference. These include: Stromelysins (MMP-3, -10 and -
15
11), Gelatinases (MMP-2 and -9), Collagenases (MMP-1, -8 and -13), Matrilysin (MMP-
7 and -26) , Membrane-type (MT)-MMPs (MMP-14, -15, -16, -17, -24 and -25) and
others (MMP-12, -19, -20,-21, -23, -27 and -28) (Visse and Nagase, 2003). Collectively,
these enzymes can degrade all components of the extracellular matrix thereby influencing
many essential processes, such as cell proliferation, migration, differentiation, and death,
along with cell-cell interactions (Elkington et al, 2005). By modulating the expression
and activity of MMPs via TIMPs, fibroblasts can modify collagen production and
degradation (Truter et al, 2009).
MMPs are inhibited by TIMPs, there are four TIMP types that have been
identified and exist within the ECM, these include TIMP-1, -2, -3 and -4. TIMPs are
involved in normal and abnormal cardiac function such as cardiac fibrosis (Spoto et al,
2012), angiogenesis (Seo et al, 2003; Seo et al, 2011) as well as apoptosis (Finan et al,
2006; Kallio et al, 2011). Each type of TIMP displays a different tissue expression with
all four types being expressed in the heart. TIMP-4 expression is abundant in heart. The
activity of MMPs is governed through activation and inhibition by other proteins along
with the TIMPs as well as at the transcriptional level. As cardiac fibroblasts produce
both MMPs and ECM proteins, fibroblasts play a central role in the arrangement of ECM.
ECM remodeling is managed by the balance in activity of MMPs by their natural
inhibitors, TIMPs. Studies of cardiac disease have noted disturbances in the equilibrium
between the TIMPs and MMPs in the failing heart which occur transitional time points
(Graham et al, 2008). TIMPs bind to MMPs stoichiometrically in a 1:1 ratio and once the
levels of MMPs are equivalent to TIMPs, proteolysis is neutralized. In many
pathological situations, the concentration of MMPs is increased as the TIMP levels are
16
decreased, disturbing the balance in favor of the proteinases. Such imbalance correlates
with extreme substrate turnover along with a worsened disease status. Animal models
have indicated direct causal roles of excess MMP activity in pathological left ventricle
remodeling. The effects of MMP activity depends on whether the pressure overload is
acute or chronic (Fingleton 2007).
Neutrophils are considered a rich source of MMPs. Neutrophil infiltration occurs
as early as 15 minutes after the initiation of reperfusion in the heart (Frangogiannis
2012). MMPs cleave collagens and other ECM proteins at site-specific locations to
generate ECM fragments (Villarreal et al, 2003). In many pathological situations, this
degradation of ECM is accompanied by the continuous generation of a fibrin-based
provisional matrix that provides structural support for the infarct region.
1.8 Other ECM proteins and their genes:
Biglycan: Biglycan, an extracellular proteoglycan, is synthesized as a 38 kDa
polypeptide core sequence, and is a member of the small leucine-rich repeat proteoglycan
or SLRP family (Mercado et al, 2006). It is encoded by the BGN gene (Traupe et al,
1992). The functions of biglycan include collagen fibril assembly (as it can bind
collagen), cell adhesion, and growth factor interactions (as it can bind some growth
factors and regulate their bioactivity) (Ahmed et al, 2003; Schonherr et al, 1995). It
regulates the expression and sarcolemmal localization of the intracellular signaling
proteins dystrobrevin-1 and -2, α-, β1-syntrophin and nNOS. It promotes muscle cell
integrity. Biglycan has a direct role in pathological remodeling of cardiac tissue and
mediates cardioprotection (Bereczki et al, 2007). Angiotensin II receptor type 1 (AT1)
antagonism, which is a intervention well documented to halt cardiac remodeling during
17
heart failure, can block the increase in target myocardial biglycan expression (Ahmed et
al., 2003).
Versican : The VCAN gene encodes the ECM protein versican, a large
chondroitin sulfate proteoglycan and is a major component of the ECM with a wide tissue
distribution which includes the vasculature (Kenagy et al, 2006; Wight and Merrilees,
2004). In ECM it can bind hyaluronan and a variety of other ECM molecules including
type I collagen, fibronectin, fibulins, tenascin-R, and integrins among others
(Zimmermann and Dours-Zimmermann, 2008). During development of cartilage, heart,
hair follicles and kidney, versican is found as highly expressed in the mesenchymal cell
condensation areas and versican V0 and V1 isoforms in vitro are show to be involved in
the process of precartilage mesenchymal condensation and subsequent chondrogenesis.
ADAMTS family members can cleave versican (Kern et al, 2006).
Fibulin-2: Fibulin-2 is a calcium-binding protein encoded by the FBLN2 gene
and its mRNA is prominently expressed in mouse heart tissue and is present in low
amounts in other tissues (Zhang et al, 1994). Fibulin-2 contains multiple calcium-binding
sites in a tandem array of 11 epidermal growth factor-like domains and forms an anti-
parallel disulfide bonded homodimer (Pan et al, 1993; Sasaki et al, 1997). There is high
expression of fibulin-2 during cardiac valvuloseptal formation. It is produced by
migratory cardiac mesenchymal cells that derive from endocardial cells (Bouchey et al.,
1996; Tsuda et al, 2001; Zhang et al, 1995). Fibulin-2 serves as a scaffold protein in the
ECM by binding to a variety of ligands including type IV collagen, fibronectin,
fibrinogen, fibrillin, laminins, aggrecan, and versican (Gu et al, 2000; Olin et al, 2001;
Sasaki et al, 1995). The fibulin-2 is produced by epicardial cells upon their migration
18
over the myocardial surface and expression persists throughout coronary vasculogenesis
and angiogenesis (Tsuda et al, 2001). Fibulin-2 helps bridging plasma membranes to the
basement membranes. During wound-healing, FBLN2 becomes overexpressed and may
also influence tissue remodeling (Fassler et al, 1996; Strom et al, 2006).
Tenascin XB and C: Tenascin C and tenascin XB are two members of the
tenascin gene family encoded by the TNC and TNXB genes, respectively (Tee et al,
1995). A member of the tenascin family, also known as hexabrachion-like protein is a
glycoprotein that is expressed in connective tissues including skin, joints and muscles.
There are few studies that have shown that C-terminal domains of human TNX bind to
major dermal fibrillar collagens and tropoelastin. The interaction has been mapped to the
fibronectin type III repeat 29 (FNIII 29) and the C-terminal fibrinogen domain (FbgX) of
TNX (Egging et al, 2007). Tenascin organizes collagen fibrils for both structure and
stability and impacts the rigidity and elasticity of tissues. Tenascin X, a product of
fibroblasts in the ECM can mediate fibrosis in the presence of collagen. Consequently,
Jing et al. showed tenascin facilitates myocardial fibrosis and cardiac remodeling by the
transforming growth factor-β1 and peroxisome proliferator-activated receptor γ in
alcoholic cardiomyopathy (Jing et al, 2011).
Agrin: Agrin is an ECM protein encoded by the AGRN gene (Rupp et al, 1991).
It is involved in the accumulation of acetylcholine receptors at the neuromuscular
synapse during embryogenesis. Agrin signals through MuSK, a muscle-specific receptor
tyrosine kinase which is also present at the neuromuscular junction (Ngo et al, 2007). In
the myocardium agrin interacts with the α3 subunit of the Na+-K+-ATPase, and it
modulates the basal frequency of myocyte contraction (Hilgenberg et al, 2009b;
19
Hilgenberg et al, 2009c). Myocytes from agrin mutant mice show higher contraction
frequency which is reversed with agrin treatment, and treating wildtype with agrin
antagonist shows a similar phenotype.(Hilgenberg et al, 2009a)(Hilgenberg et al, 2009)
Heparinase-1: Heparinase is an endo-β-D-glucuronidase that degrades the
sulfate side chains of the GAG heparin sulfate in the extracellular matrix (Nakajima et al,
1983). In β-adrenergic agonist-induced cardiac hypertrophy, heparinase expression
might be induced in ventricular myocardium and might play an important role in cardiac
hypertrophy development (Kizaki et al, 2005). In the heart, heparinase is synthesized by
endothelial cells as a latent 65-kDa form and is processed in lysosomes to become a 50-
kDa active enzyme (Zetser et al, 2004). It cleaves heparin sulfate at low-sulfation sites,
liberating sequestered ligands from surface HSPGs (Pillarisetti et al, 1997). It has also
been shown that through surface HSPGs, heparinase can trigger intracellular signal
pathways including Src, Akt, and p38 MAPK.(Cui et al, 2011; Fux et al, 2009)
Thrombospondin-1: Thrombospondin-1 (TSP-1) is a multifunctional matrix
protein mediating inhibition of angiogenesis, promotion of apoptosis, cell to cell and cell
to matrix interactions (Crawford et al, 1998; Sezaki et al, 2005). Thrombospondin is
encoded by the THBS1 gene. In ECM it exists as a large modular glycoprotein
component and contains three subunits (Wolf et al, 1990). It is expressed by
macrophages and endothelial cells in a highly regulated manner and is also present in
platelet granules (Sheibani and Frazier, 1998). It can be rapidly induced as for example
during vascular injury (Raugi et al, 1990). Thrombospondin is upregulated during heart
failure and thought to be protective (Schellings et al, 2009).
20
Procollagen C-endopeptidase: Procollagen C-endopeptidase is also known as
bone morphogenic protein 1 and encoded by the BMP1 gene, and functions as a positive
regulator of collagen deposition (Ogata et al, 1997) and plays a role in cardiac fibrosis
(Kessler-Icekson et al, 2006). Procollagen C-endopeptidase enhancer 1 increases its
activity. It may also play a key role in the ECM production during atheroma formation
and the proliferation of smooth muscle cells (Kanaki et al, 2000), and may contribute to
cell growth and differentiation (Masuda et al, 1998).
Lysyl oxidase: Lysyl oxidase is a copper-containing protein that is encoded by
the LOX gene (Hamalainen et al, 1991). Specific lysyl oxidases catalyze the post-
translational modifications such as cross-linking of collagen and elastin in the ECM. The
primary sources of lysyl oxidases in the heart are cardiac myocytes and fibroblasts. The
enzyme induces oxidative deamination of the ε-amino group of selected lysine and
hydroxylysine residues of proteins resulting in the formation of allysine and
hydroxyallysine. The percentage of cross-linking is a contributing factor to diastole
function during the filling phase of the cardiac cycle (Yu et al, 2010). In addition, the
collagen cross-linkages appear to protect the fibrillar collagen from MMP mediated
degradation (van der Slot-Verhoeven AJ et al, 2005). Therefore, altered ECM
biomechanical properties and ventricular diastolic mechanics may result from elevated
concentrations of cross-linked ECM collagen.
Collagen 8 alpha1: The COL8A1 (collagen type VIII, alpha-1) gene encodes
alpha 1 chain of collagen, type VIII. This collagen form is thought to control adherence,
migration, and proliferation of different cells (Zhao et al, 2009). Type VIII collagen is
localized within the vascular basement membrane beneath endothelial cells (Wayne et al
21
1996). This collagen is made by mast cells, endothelial cells, keratinocytes and some
tumor cells (Shuttleworth 1997).
Collagen 3 alpha1: The COL3A1 gene encodes the ECM collagen type III,
alpha-1 protein (Janeczko and Ramirez, 1989; Superti-Furga et al, 1988). The expression
of COL3A1 is associated with chronic liver diseases (Lee et al, 2008). Collagen types I
and III from fibroblasts form a network to assistant cardiac cell alignment, interaction and
communication.
Collagen 5 alpha1: The COL5A1 gene encodes the ECM protein collagen, type
V, alpha 1 (Greenspan et al, 1992). Collagen type V is a heterotrimer that is composed of
two pro-α1(V) chains and a single pro-α2(V) chain, which are encoded by the COL5A1
and COL5A2 genes, respectively (Ritelli et al, 2013). Col5a1 expression was found in
the heart, dorsal aorta wall, mesonephric tubules, branchial arches, and intestinal
mesenchyme (Roulet et al, 2007).
Collagen 1 alpha2: The COL1A2 gene, which encodes the α1 and α2 chain of
type I collagen, COL1A2 chain protein (Malfait et al, 2006; Retief et al, 1985). COL1A2
is overexpressed in intracranial aneurysms and is located on 7q22.1 where the best
evidence of linkage was detected (Voss and Rauterberg, 1986; Yoneyama et al, 2004).
Occasionally, mutations in COL1A2 result in a rare form of Ehlers-Danlos syndrome
Collagen 1 alpha1: Type I collagen is a heterotrimer consisting of two α1 (I)
chains and one α2 (I) chain, encoded, respectively, by the COL1A1 and COL1A2 genes.
In the skin, type-I collagen chain is the most abundant ECM protein and is necessary for
differentiation, normal growth, and wound repair (Powell et al, 1999). Collagen-I
enhances ECM cross-linking, resulting in increased mechanical strength in the wound.
22
Tightly regulated synthesis of these two moieties ensures a 2:1 ratio of COL1A1 and
COL1A2 (Kanji et al, 2014; Karsenty and de, 1991). Some mutations in COL1A1 result
in a rare form of Ehlers-Danlos syndrome.
TIMP1: Tissue inhibitor of metalloproteinase 1 is encoded by the TIMP1 gene.
This enzyme is produced and secreted by fibroblasts, macrophages, endothelial cells,
VSMCs and cardiomyocytes (Vanhoutte and Heymans, 2010). TIMP1 inhibits all
MMPs, but it can’t inhibit MMP-2 and MT1-MMP (Creemers et al., 2003). The effect of
TIMP1 in the heart is decreased cardiac inflammation and reduced hypertrophic response
(Heymans, 2005, Heymans, 2006).
TIMP2: Tissue inhibitor of metalloproteinase 2 is encoded by the TIMP2 gene.
This enzyme is produced by fibroblasts, endothelial cells, macrophages, VSMC, and
cardiomyocytes. It inhibits all MMPs, except MMP-9; and activates pro-MMP-2
(Vanhoutte et al, 2006).
TIMP3: Tissue inhibitor of metalloproteinase 3 is encoded by the TIMP3 gene.
The cellular sources are fibroblasts, VSMC and cardiomyocytes. TIMP3 inhibits MMP-
1, -2, -3, -9 and -13, spontaneous hypertrophic response, LV dilatation and contractile
dysfunction (Fedak et al, 2004). It reduces fibrosis and increases proliferation, apoptosis,
and angiogenesis (Tian et al, 2007). It contributes to LV dilatation and mortality and
dilated cardiomyopathy (Kassiri et al, 2005).
TIMP4: Tissue inhibitor of metalloproteinase 4 is encoded by the TIMP4 gene
metalloproteinase 4 (TIMP-4) this enzyme is produced in by fibroblasts, cardiomyocytes
,VSMCs. TIMP4 inhibits MMP-1, -3, -7 and -9 (Vanhoutte et al,2006).
23
MMP2: Matrix metalloproteinase 2 is encoded by the MMP2 gene, falls under
the gelatinase group, and is also called gelatinase A or matrix metallopeptidase 2
(Devarajan et al, 1992). The cellular source is fibroblasts, cardiomyocytes, macrophages,
T- and B-lymphocytes and VSMCs. One of the major known functions of matrix
metallopeptidase 2 is to degrade collagens including types I, IV, V, VII, X, XI and XIV
collagen, aggrecan, decorin, elastin, fibronectin, galectin-3, gelatin, hyaluronidase-treated
versican, laminin-1 and-5, and osteonectin. Excess MMP2 activity in the heart results in
slower wound healing, decreased inflammatory response and cardiac rupture (Matsumura
et al, 2005). MMP2 has a role in myocardial remodeling in a number of cardiovascular
diseases, including idiopathic dilated cardiomyopathy and ischemic and myocardial
infarction (Braunhut and Moses, 1994; Coker et al, 1999). Additionally, in vascular
remodeling of hypertrophied heart it prevented progression to ventricular dilation,
increased capillary formation as well as severe hypertrophy and dysfunction as result of
vascular remodeling (Friehs et al, 2006).
MMP3: Matrix metallopproteinase 3 is encoded by the MMP3 gene, falls under
the stromelysin group, and is also called stromelysin-1or matrix metallopeptidase 3 (Zhu
et al, 2011). The cellular source for this enzyme is fibroblasts, cardiomyocytes, and
VSMCs. One of the major known functions of MMP3 is to degrade collagens including
types III, IV, V and IX collagen, aggrecan, decorin, elastin, entactin, fibronectin, gelatin,
hyaluronidase-treated versican, laminin, large tenascin-C, ostenectin, perlcan, and
proteglycan linked protein. There is no the cardiac effect observed with MMP3deletion
in mice (Heymans et al, 1999).
24
MMP11: Matrix metalloproteinase 11 is encoded by the MMP11 gene and is
also called stromelysin-3 or matrix metallopeptidase 11 (Li et al, 2000). MMP11 targets
include: gelatin, insulin-like growth factor-binding protein-1, the laminin receptor, serine
proteinase inhibitors (such as α1-proteinase inhibitor, α1PI, and α2-antiplasmin), type VI
collagen α2-macroglobulin and β-casein (Barrasa et al, 2012; Motrescu et al, 2008).
MMP13: Matrix metalloproteinase 13 is encoded by the MMP13 gene, falls
under the Collagenase family, and is also called Collagenase-3 or matrix
metallopeptidase 13. Fibroblasts produce MMP13. It is involved in the breakdown of
collagens including type I, II, III, IV, IX, X and XIV collagen, aggrecan, fibronectin,
gelatin, large tenascin-C, osteonectin, and perlecan. Nevertheless, MMP13 deletion in
mice has no significant effect on the heart (Vanhoutte et al,2006). .
MMP14: Matrix metalloproteinase 14 is encoded by the MMP14 gene and is the
first member of the MT-MMP group, whose members are membrane inserted. It is also
called Membrane-type MMP (MT1-MMP) or matrix metallopeptidase14. It is produced
by fibroblasts, cardiomyocytes, and VSMCs. MMP14 plays role in ECM remodeling and
is involved in the breakdown of collagens including type I, II and III collagen,
fibronectin, laminin , elastin, casein, vitronectin, gelatin entactin, large tenascin and
proteoglycan under physiological and pathological conditions. However, there is no the
cardiac effect observed in the MMP14 null mouse (Klawitter et al, 2011; Stroud et al,
2002).
MMP15: Matrix metalloproteinase 15 is encoded by the MMP15 gene and is the
second member of the MT-MMP group. It is also called Membrane type-2 matrix
metalloproteinase (MT2-MMP) or matrix metallopeptidase 15 and is membrane inserted.
25
MMP15 is responsible for degradation of various components of the ECM under
physiological and pathological conditions.
MMP16: Matrix metalloproteinase 16 is encoded by the MMP16 gene and is the
third member of the MT-MMP group. It is also called Membrane type-3 matrix
metalloproteinase (MT3-MMP) or matrix metallopeptidase 16 and is membrane inserted
Additionally, MMP-16 can not only directly degrade some matrix molecules, However, it
can also activate pro-MMP-2 (gelatinase A). The resulting activated MMP-2 hydrolyses
collagen type IV and other connective tissue substrates and is thought to be one of the
most important MMPs in tissue remodeling and cell migration (Planutiene et al, 2011;
Walsh et al, 2007).
MMP25: Matrix metalloproteinase 25 is encoded by the MMP25 gene and is the
sixth member of the MT-MMP group. It is also called type 6 metalloproteinase (MT6-
MMP) or matrix metallopeptidase 25. It was first detected in polymorphonuclear
leukocytes. Functional studies showed that MT6-MMP is involved in the breakdown of
type I-IV collagens, gelatin, fibronectin, and fibrin(English et al, 2001). MMP-25 has
been suggested to have a role in inflammation, cellular migration, and is linked to tumor
invasion (Kuula et al, 2008).
MMP28: Matrix metalloproteinase 28 is encoded by the MMP28 gene and is
alternatively named epilysin or matrix metallopeptidase 28 (Marchenko and Strongin,
2001). MMP28 was expressed in keratinocytes and testis and in response to injury. The
number of normal tissues which express it including the heart, skin, lung, intestine, testes,
and brain as well as a variety of tumor and tumor cell lines (Padmavati et al, 2013).
During wound repair, MMP-28 may play a key role in epithelial cell proliferation and
26
may also play a key role in the restructuring of newly formed basement membrane. (Ma
et al, 2013). MMP28 was play increase interest role in vivo, however, little is known
about its substrates. Recombinant MMP28 has been reported to degrade casein in vitro
and is thought to cleave several neural proteins such as neurite outgrowth inhibitor A
(Nogo-A), neural cell adhesion molecule (NCAM-1) and neuregulin 1 (NRG1) (Lohi et
al, 2001; Werner et al, 2008; Werner et al, 2007).
1.9 Aims of this study
A wealth of information regarding gene changes in the hearts of various models
of pathological cardiac hypertrophy exists, yet there is only limited information about the
gene expression changes that accompany the physiological hypertrophy of pregnancy and
its reversal during the post-partum period. In this project, we have two aims. Aim I is to
utilize microarray analyses to determine changes in gene expression in the left ventricle
of the hearts of pregnant and non-pregnant mice that are related to extracellular matrix
and pathological cardiac hypertrophy states. Aim II is to quantify by real-time PCR
changes in specific MMP and TIMP mRNA expression in the left ventricle of the hearts
from non-pregnant mice and mice during pregnancy and the early post-partum period.
27
CHAPTER 2
MATERIALS AND METHODS
2.1 Animals.
Age-matched 3-4 month old non pregnant and timed pregnant C57BL/6 mice
were purchased from Jackson Laboratories (Bar Harbor, ME) and divided into 4 groups
(n = 4-6 per group). Animals were housed under standard conditions. All of the animals
were handled and euthanized under the guidelines of University of South Carolina
Institutional Animal Care and Use committee. Animals were subjected to isoflurane
inhalation until toe pinch reflex was lost, subjected to cervical dislocation, and
decapitated to collect trunk blood. Animals were sacrificed under the following states:
1) non-pregnant mice in diestrus mice (checked daily for two consecutive cycles by
vaginal smears) (Champlin et al, 1973), 2) Mice at 12 days of pregnancy (mid-
pregnancy) where cardiac remodeling is well underway, 3) Mice at 18/19 days of
pregnancy (late pregnancy) where the demands on the heart are the greatest, 4) Mice at
1.5 days post-partum when the heart's structure is in the process of returning to the non-
pregnant state, a process that is believed to be complete by post-partum day 1 in mice
(Gonzalez et al, 2007).
2.2 Cardiac tissue collection
The body weight, heart weight, kidney weights, lung weight, tibia length, and
number of embryos were recorded for each mouse. At the sacrifice, the left ventricles
and other tissues (uterus, ovary, liver, heart leftovers devoid of the ventricles) were
28
immediately frozen on dry ice or in liquid nitrogen and stored at -80 ºC for later RNA
isolation.
2.3. Quantitative real-time PCR (Q-PCR)
2.3.1. RNA isolation
Frozen tissues were maintained on dry ice after removal from the -80 °C. RNA
was isolated using Trizol reagent (cat#15596-026, Life Technologies) and the Qiagen
RNeasy kit. Excess Trizol reagent was added to frozen tissue in a glass dounce
homogenizer on wet ice and dispersed with 15-20 strokes. Lysates were transferred to
microfuge tubes and spun 10 min in an Eppendorf refrigerated microfuge at 12000xg at 4
°C to pellet debris and then the supernatant transferred to new tube. Lysates were
allowed to sit for 5 min at room temperature to allow dissociation of ribonucleoprotein
complexes. The volume of supernatant was measured and 0.2 ml chloroform was added
to each 1 ml of Trizol. The tube was vigorously shaken by hand for 15 seconds, then let
sample to sit for 3 min and spun for 10 min at 12000xg at 4 °C. The mixture was
separated into a lower red phase and a colorless upper aqueous phase. The upper aqueous
phase was collected as the interphase was avoided. The aqueous phase was placed in a
new tube. After measuring the volume an equal volume of 70% ethanol was added to the
aqueous phase and the tube was vortexed and samples were loaded into an RNeasy
column with collection tubes and centrifuged at 9,000xg for 30 seconds. After discarding
the flow-through, RW1 buffer (700 µl) from the Qiagen kit was added to column and was
centrifuged at 9,000xg for 30 seconds and flow. RPE wash buffer (500 µl) was added to
column with new collection tube and centrifuged at 9,000xg for 30 seconds. After the
flow-through was discarded the another 500 µl of RPE buffer was added, centrifuged at
29
9,000xg for 2 minute and finally the flow-through was discarded from collection tube.
The column with the bound RNA was dried by centrifugation at 9,000xg for 2 minutes.
RNase-free water (40 µl) was added to the column matrix and eluted by spinning 2
minutes at 9,000xg and then kept on ice for use or stored at -80 ºC. RNA was quantified
using a Biophotometer (Eppendorf) at 260 nm. Dilutions were made for cDNA synthesis
and stored at -80 ºC.
2.3.2 Microarray analyses:
Gene expression profiling or microarray analysis enables measurement of
thousands of genes in a single RNA sample and thus was used for this purpose with left
ventricular RNA. Purification of RNA was performed using Trizol and the Qiagen
RNeasy kit as above. Samples for microarray analyses were screened for quality by
Expirion (Biorad) RNA analysis chip. An aliquot of high quality RNA (n = 2 per group)
was sent to the MUSC Medical University of South Carolina Proteogenomics Facility for
microarray hybridization to AffymetrixGeneChip Mouse Gene 2.0 ST array. Dr. Jeremy
Barth at the MUSC searched the Gene Ontology (GO) term database for genes related to
extracellular matrix and cardiac hypertrophy and the resulting list was supplemented
from the literature. These gene lists were used as the basis of examining gene changes
initially from data from an existing NCBI GEO dataset #GSE36330 (entitled:
comparison of exercise and pregnancy-induced cardiac hypertrophy) and subsequently
from data derived our animals and the Affymetrix 2.0 ST arrays.
Briefly, total RNA samples will be converted into biotin-labeled and fragmented
cRNA and then hybridized to Affymetrix mouse GeneChip 2.0 ST using established
procedures. Hybridized arrays were washed, fluorescently labeled and then scanned in an
30
Affymetrix 7G scanner. Resulting hybridization data will be normalized by RMA
algorithm and then filtered by fold change and statistical (t-test) thresholds to identify
genes differentially expressed between experimental and control samples at acceptable
false discovery levels (e.g., <5%). Pathway enrichment was also evaluated with Partek
software. Heat maps were created for the lists of extracellular matrix genes and cardiac
hypertrophy genes.
2.3.3. cDNA synthesis
cDNA was synthesize using the Biorad iScript cDNA Synthesis Kit (cat# 1636,
Bio-Rad). The cDNA synthesis reaction consisted of 15 µl of RNA, 4 µl of 5X buffer
iScript reaction mix, and 1µl of iScript Reverse Transcriptase mix. cDNA synthesis
reaction were added to a 0.6 ml PCR tube for each sample and placed in the room
temperature for 2 minute before putting in thermal cycler and then cDNA synthesis was
carried out in a thermal cycler (Effendorf, Hauppauge, NY). The cycle consisted of 25
ºC for 5 minutes, 42 ºC for 30 minutes, and 85 ºC for 5 minutes, and 4 ºC hold. After
cDNA synthesis, each sample of the cDNA was diluted with 60 µl RNase-free water and
stored at -20º C for later usage for real time PCR.
2.3.4. Real time PCR
Validated mouse primers for PCR were purchased from Qiagen Superarray.
Standard curves were generated for each primer set. The genes evaluated were: TIMP1,
TIMP2, TIMP3, TIMP4, MMP2, MMP3, MMP11, MMP13, MMP14, MMP15, MMP16,
MMP25, and MMP28. RNA levels for each tissue sample were derived using the
standard curve method and normalized to internal control rplp0 mRNA levels. All PCR
primers were initially tested for single products as assessed by single peaks in melt-
31
curves and by visualizing the correct size band on 2% agarose gels. Standard curves
were generated by initially amplifying the amplicon, purifying it using the Qiagen PCR
purification kit, quantifying the amplicon and making 10-fold serial dilutions of the
amplicon, followed by real-time PCR amplification of the dilution series.
Quantitative polymerase chain reaction was performed using real-time PCR. We
used SYBR-green based reagents (BioRAD Sso-Advanced Mastermix) for real-time PC
with cDNA from the left ventricle of each animal. In some cases, leftover heart tissue
(right ventricle and septa) RNA was also examined by real-time PCR (not shown). All
primers used are listed in table 2.1. Quantification was performed by real-time PCR using
the standard curve method. cDNA samples were amplified in duplicate and repeated if
numbers varied by more than 0.8 Ct. A water negative control was included in each PCR
run. PCR reactions consisted of 4 ul cDNA (20 ng) 1µl primer mix assay, 5µl RNase-
free water and10 µl 1X SSoAdvanced SYBR Green mastermix. Real-time PCR was
performed using an I-cycler (Bio Rad Hercules, CA) with the initial denaturation, 1X, 95
ºC for 1.5 min, followed by 35 cycles of denaturation for 15 seconds at 95 ºC, annealing
for 15 seconds at 60 ºC, elongation for 30 seconds at 72º C, followed by 10 min final
extension at 72 ºC, and a melt curve using 80 cycles of 0.5 ºC increments starting at 60
ºC. The expression profile of each gene analyzed by real-time PCR was visually
compared with the microarray results to determine if the trends were similar or different.
2. Data and statistical analysis
The amount of target mRNA for each sample was extrapolated from a standard
curve generated for each primer set and an example is shown in Figure 2.1. Each target
mRNA amount was normalized to amount of rplp0 mRNA in the sample. All results are
32
expressed as mean ± standard error of mean (SEM). PCR ratios were ln-transformed and
analysis of variance (ANOVA) preformed. Statistical significance was tested with
analysis of ANOVA followed by Tukey’s post-hoc test for multiple group comparisons
and GraphPad Prism version 3.02 for Windows (GraphPad Software, Inc, San Diego,
CA) was used for statistical analysis for at least fourth independent sets of samples of
mRNA in left ventricle tissues of female mice for all real-time PCR data. The mean and
standard error of the mean were used on this study. A P-value less than or equal to 0.05
was regarded as significant.
33
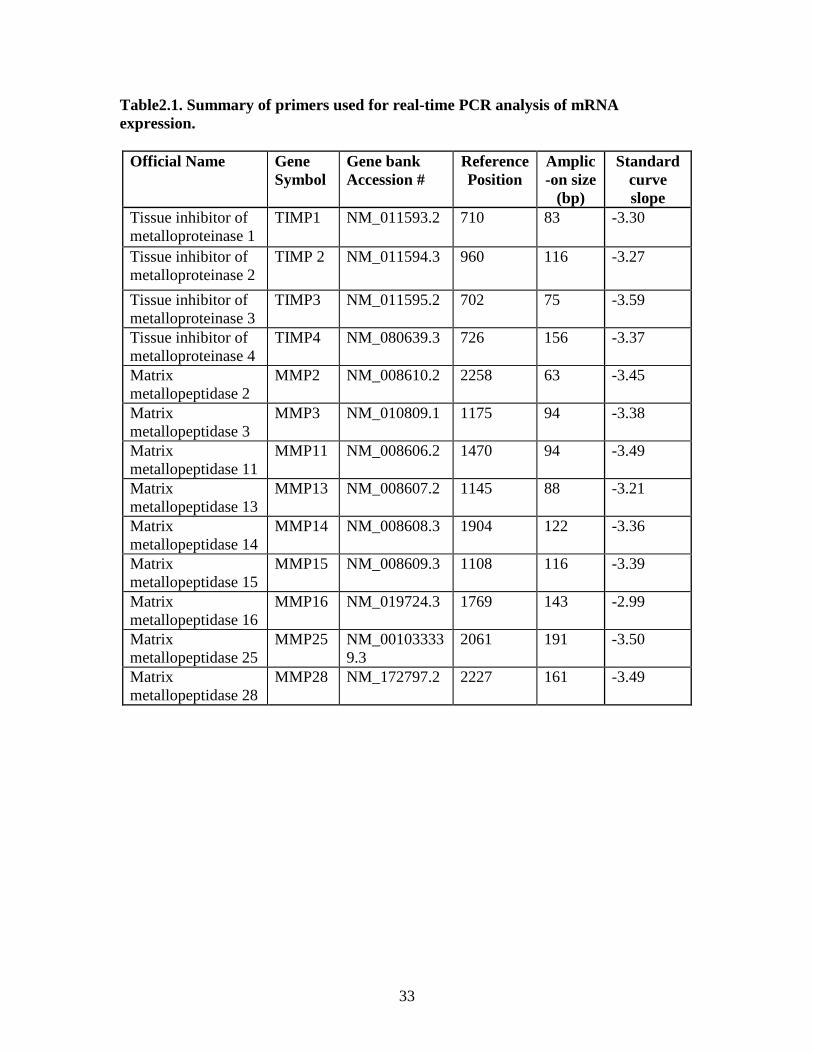
Table2.1. Summary of primers used for real-time PCR analysis of mRNA expression.
Official Name Gene Symbol
Gene bank Accession #
Reference Position
Amplic-on size
(bp)
Standard curve slope
Tissue inhibitor of metalloproteinase 1
TIMP1 NM_011593.2 710 83 -3.30
Tissue inhibitor of metalloproteinase 2
TIMP 2 NM_011594.3 960 116 -3.27
Tissue inhibitor of metalloproteinase 3
TIMP3 NM_011595.2 702 75 -3.59
Tissue inhibitor of metalloproteinase 4
TIMP4 NM_080639.3 726 156 -3.37
Matrix metallopeptidase 2
MMP2 NM_008610.2 2258 63 -3.45
Matrix metallopeptidase 3
MMP3 NM_010809.1 1175 94 -3.38
Matrix metallopeptidase 11
MMP11 NM_008606.2 1470 94 -3.49
Matrix metallopeptidase 13
MMP13 NM_008607.2 1145 88 -3.21
Matrix metallopeptidase 14
MMP14 NM_008608.3 1904 122 -3.36
Matrix metallopeptidase 15
MMP15 NM_008609.3 1108 116 -3.39
Matrix metallopeptidase 16
MMP16 NM_019724.3 1769 143 -2.99
Matrix metallopeptidase 25
MMP25 NM_001033339.3
2061 191 -3.50
Matrix metallopeptidase 28
MMP28 NM_172797.2 2227 161 -3.49
34
CHAPTER 3
RESULTS
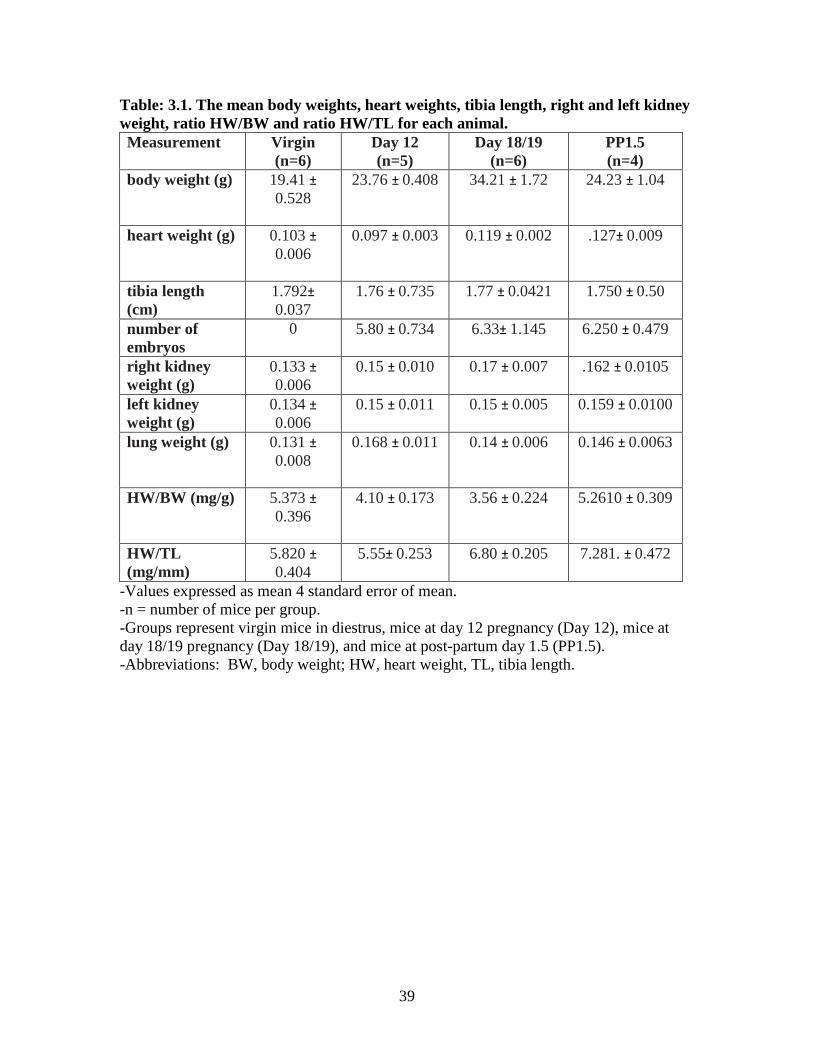
3.1 Animal tissue data and heart weight/tibial length
The body weight (BW) of each mouse was recorded before sacrifice. Hearts were
weighed after removal of excess blood. Table 3.1 shows the mean body weights, heart
weights (HW), tibia length (TL), right and left kidney weights, HW/BW and HW/TL for
each animal. Tibia length was used for normalization of heart weight (HW/TL), as it has
been previously demonstrated to be more reliable than normalization based on body
weight (Wei et al, 1984; Yin et al, 1982). Mean heart weight were normalized to tibia
length for each group of animals (virgin, day 12 pregnancy, day 18/19 pregnancy and
post-partum 1.5 day). As predicted, late pregnancy and the early post-partum period
were associated with a significant increase in heart weight. There was no difference
between day 12 groups and virgin group heart weights normalized to tibia length. There
were significant increases in the HW/TL of the day 18/19 group and post-partum 1.5 day
group compared to the virgin group. There was an increase in the HW/TL for day 18/19
and post-partum 1.5 day compared to the day 12 group. There was no difference between
the day18/19 and post-partum 1.5 groups (Figure 3.1)
35
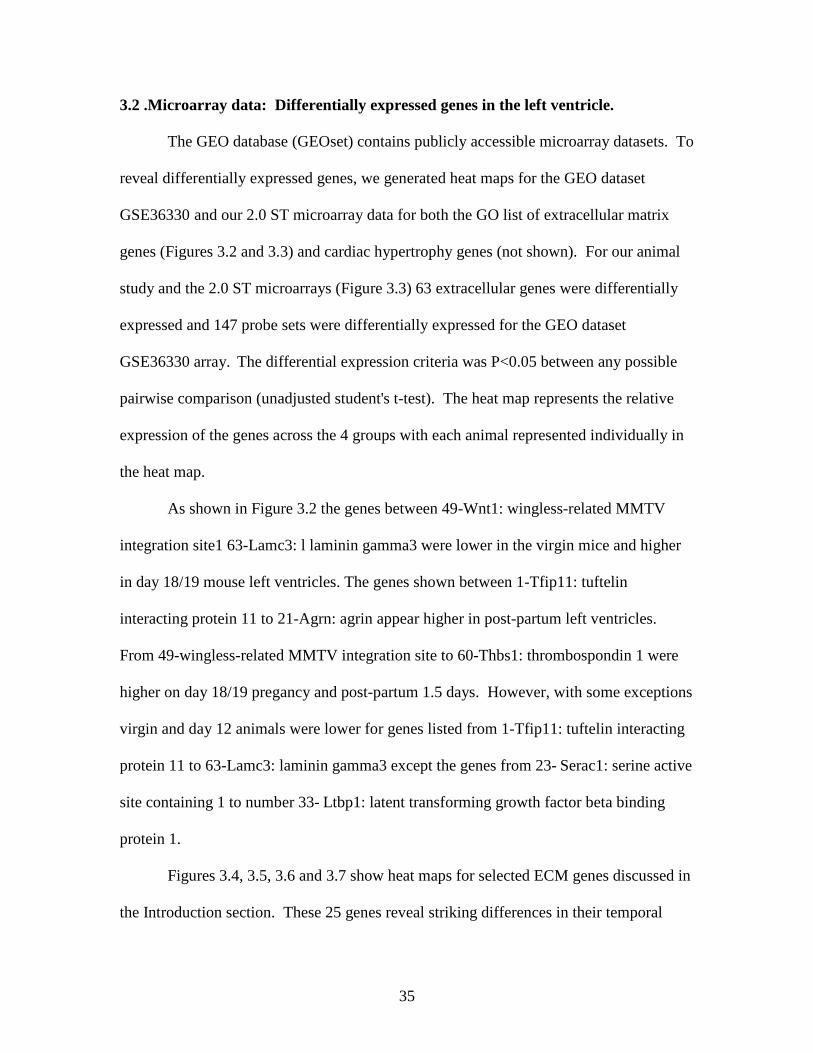
3.2 .Microarray data: Differentially expressed genes in the left ventricle.
The GEO database (GEOset) contains publicly accessible microarray datasets. To
reveal differentially expressed genes, we generated heat maps for the GEO dataset
GSE36330 and our 2.0 ST microarray data for both the GO list of extracellular matrix
genes (Figures 3.2 and 3.3) and cardiac hypertrophy genes (not shown). For our animal
study and the 2.0 ST microarrays (Figure 3.3) 63 extracellular genes were differentially
expressed and 147 probe sets were differentially expressed for the GEO dataset
GSE36330 array. The differential expression criteria was P<0.05 between any possible
pairwise comparison (unadjusted student's t-test). The heat map represents the relative
expression of the genes across the 4 groups with each animal represented individually in
the heat map.
As shown in Figure 3.2 the genes between 49-Wnt1: wingless-related MMTV
integration site1 63-Lamc3: l laminin gamma3 were lower in the virgin mice and higher
in day 18/19 mouse left ventricles. The genes shown between 1-Tfip11: tuftelin
interacting protein 11 to 21-Agrn: agrin appear higher in post-partum left ventricles.
From 49-wingless-related MMTV integration site to 60-Thbs1: thrombospondin 1 were
higher on day 18/19 pregancy and post-partum 1.5 days. However, with some exceptions
virgin and day 12 animals were lower for genes listed from 1-Tfip11: tuftelin interacting
protein 11 to 63-Lamc3: laminin gamma3 except the genes from 23- Serac1: serine active
site containing 1 to number 33- Ltbp1: latent transforming growth factor beta binding
protein 1.
Figures 3.4, 3.5, 3.6 and 3.7 show heat maps for selected ECM genes discussed in
the Introduction section. These 25 genes reveal striking differences in their temporal
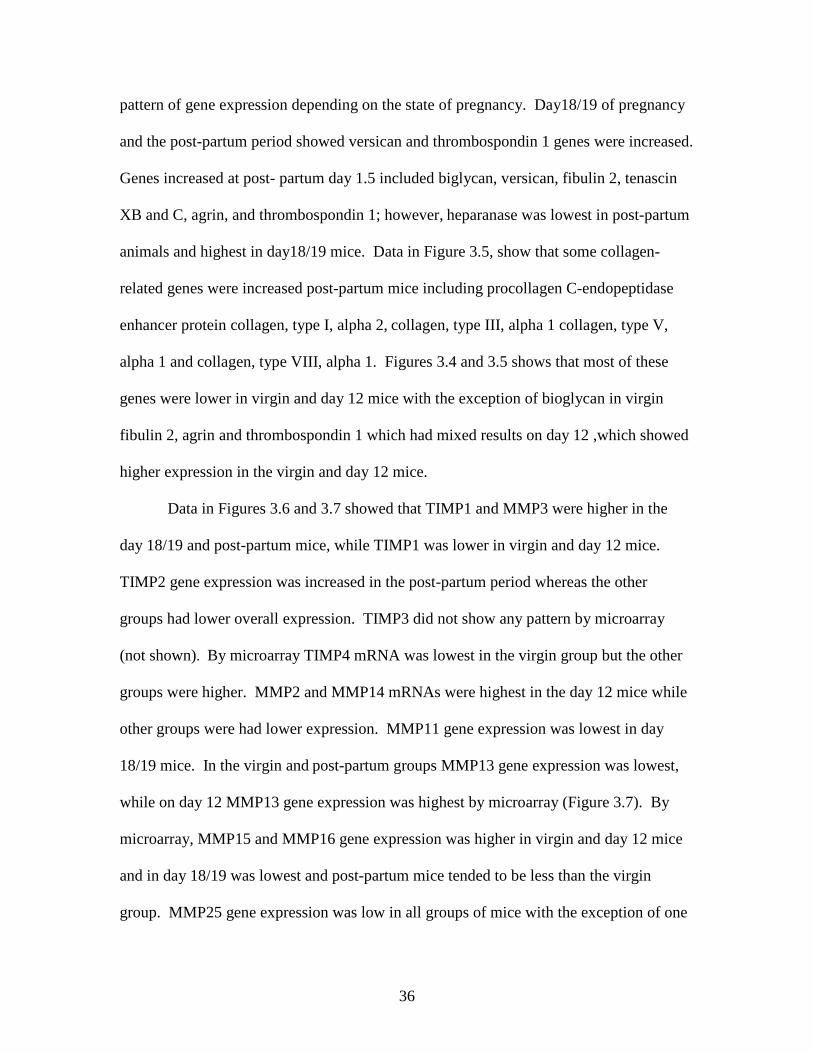
36
pattern of gene expression depending on the state of pregnancy. Day18/19 of pregnancy
and the post-partum period showed versican and thrombospondin 1 genes were increased.
Genes increased at post- partum day 1.5 included biglycan, versican, fibulin 2, tenascin
XB and C, agrin, and thrombospondin 1; however, heparanase was lowest in post-partum
animals and highest in day18/19 mice. Data in Figure 3.5, show that some collagen-
related genes were increased post-partum mice including procollagen C-endopeptidase
enhancer protein collagen, type I, alpha 2, collagen, type III, alpha 1 collagen, type V,
alpha 1 and collagen, type VIII, alpha 1. Figures 3.4 and 3.5 shows that most of these
genes were lower in virgin and day 12 mice with the exception of bioglycan in virgin
fibulin 2, agrin and thrombospondin 1 which had mixed results on day 12 ,which showed
higher expression in the virgin and day 12 mice.
Data in Figures 3.6 and 3.7 showed that TIMP1 and MMP3 were higher in the
day 18/19 and post-partum mice, while TIMP1 was lower in virgin and day 12 mice.
TIMP2 gene expression was increased in the post-partum period whereas the other
groups had lower overall expression. TIMP3 did not show any pattern by microarray
(not shown). By microarray TIMP4 mRNA was lowest in the virgin group but the other
groups were higher. MMP2 and MMP14 mRNAs were highest in the day 12 mice while
other groups were had lower expression. MMP11 gene expression was lowest in day
18/19 mice. In the virgin and post-partum groups MMP13 gene expression was lowest,
while on day 12 MMP13 gene expression was highest by microarray (Figure 3.7). By
microarray, MMP15 and MMP16 gene expression was higher in virgin and day 12 mice
and in day 18/19 was lowest and post-partum mice tended to be less than the virgin
group. MMP25 gene expression was low in all groups of mice with the exception of one
37
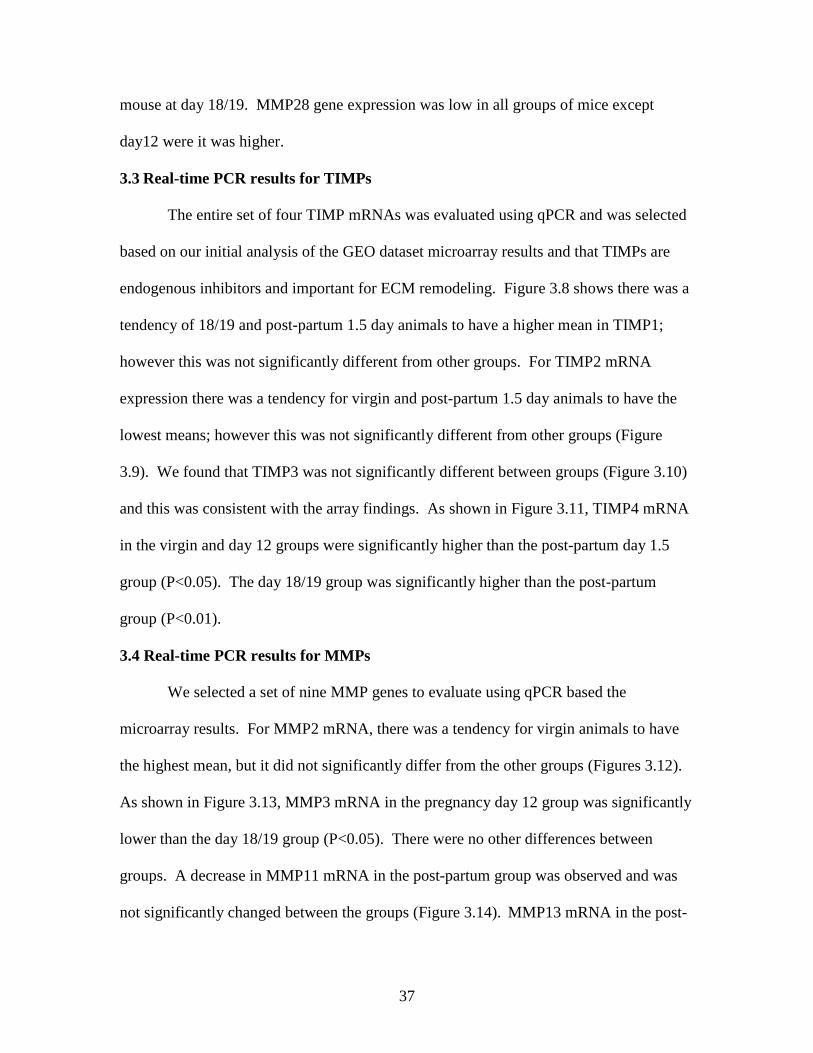
mouse at day 18/19. MMP28 gene expression was low in all groups of mice except
day12 were it was higher.
3.3 Real-time PCR results for TIMPs
The entire set of four TIMP mRNAs was evaluated using qPCR and was selected
based on our initial analysis of the GEO dataset microarray results and that TIMPs are
endogenous inhibitors and important for ECM remodeling. Figure 3.8 shows there was a
tendency of 18/19 and post-partum 1.5 day animals to have a higher mean in TIMP1;
however this was not significantly different from other groups. For TIMP2 mRNA
expression there was a tendency for virgin and post-partum 1.5 day animals to have the
lowest means; however this was not significantly different from other groups (Figure
3.9). We found that TIMP3 was not significantly different between groups (Figure 3.10)
and this was consistent with the array findings. As shown in Figure 3.11, TIMP4 mRNA
in the virgin and day 12 groups were significantly higher than the post-partum day 1.5
group (P<0.05). The day 18/19 group was significantly higher than the post-partum
group (P<0.01).
3.4 Real-time PCR results for MMPs
We selected a set of nine MMP genes to evaluate using qPCR based the
microarray results. For MMP2 mRNA, there was a tendency for virgin animals to have
the highest mean, but it did not significantly differ from the other groups (Figures 3.12).
As shown in Figure 3.13, MMP3 mRNA in the pregnancy day 12 group was significantly
lower than the day 18/19 group (P<0.05). There were no other differences between
groups. A decrease in MMP11 mRNA in the post-partum group was observed and was
not significantly changed between the groups (Figure 3.14). MMP13 mRNA in the post-

38
partum group was significantly lower than day 18/19 group; there were no other
differences between groups for MMP13 mRNA (Figure 3.15). MMP14 was not
significantly changed between the groups (Figure 3.16). MMP15 had no significant
change between groups (Figure 3.17). The post-partum group had the lowest MMP16
mRNA but was not significantly different from other groups (Figure 3.18). There was no
statistically significant difference in the gene expression levels of MMP-25 found
between groups (Figure 3.19). mRNA expression for MMP-28 did not vary significantly
among groups (Figure 3.20).
39
Table: 3.1. The mean body weights, heart weights, tibia length, right and left kidney weight, ratio HW/BW and ratio HW/TL for each animal. Measurement Virgin
(n=6) Day 12 (n=5)
Day 18/19 (n=6)
PP1.5 (n=4)
body weight (g) 19.41 ± 0.528
23.76 ± 0.408 34.21 ± 1.72 24.23 ± 1.04
heart weight (g) 0.103 ±
0.006
0.097 ± 0.003 0.119 ± 0.002 .127± 0.009
tibia length (cm)
1.792±
0.037 1.76 ± 0.735 1.77 ± 0.0421 1.750 ± 0.50
number of embryos
0 5.80 ± 0.734 6.33± 1.145 6.250 ± 0.479
right kidney weight (g)
0.133 ±
0.006 0.15 ± 0.010 0.17 ± 0.007 .162 ± 0.0105
left kidney weight (g)
0.134 ±
0.006 0.15 ± 0.011 0.15 ± 0.005 0.159 ± 0.0100
lung weight (g) 0.131 ±
0.008
0.168 ± 0.011 0.14 ± 0.006 0.146 ± 0.0063
HW/BW (mg/g) 5.373 ±
0.396
4.10 ± 0.173 3.56 ± 0.224 5.2610 ± 0.309
HW/TL (mg/mm)
5.820 ±
0.404 5.55± 0.253 6.80 ± 0.205 7.281. ± 0.472
-Values expressed as mean 4 standard error of mean. -n = number of mice per group. -Groups represent virgin mice in diestrus, mice at day 12 pregnancy (Day 12), mice at day 18/19 pregnancy (Day 18/19), and mice at post-partum day 1.5 (PP1.5). -Abbreviations: BW, body weight; HW, heart weight, TL, tibia length.
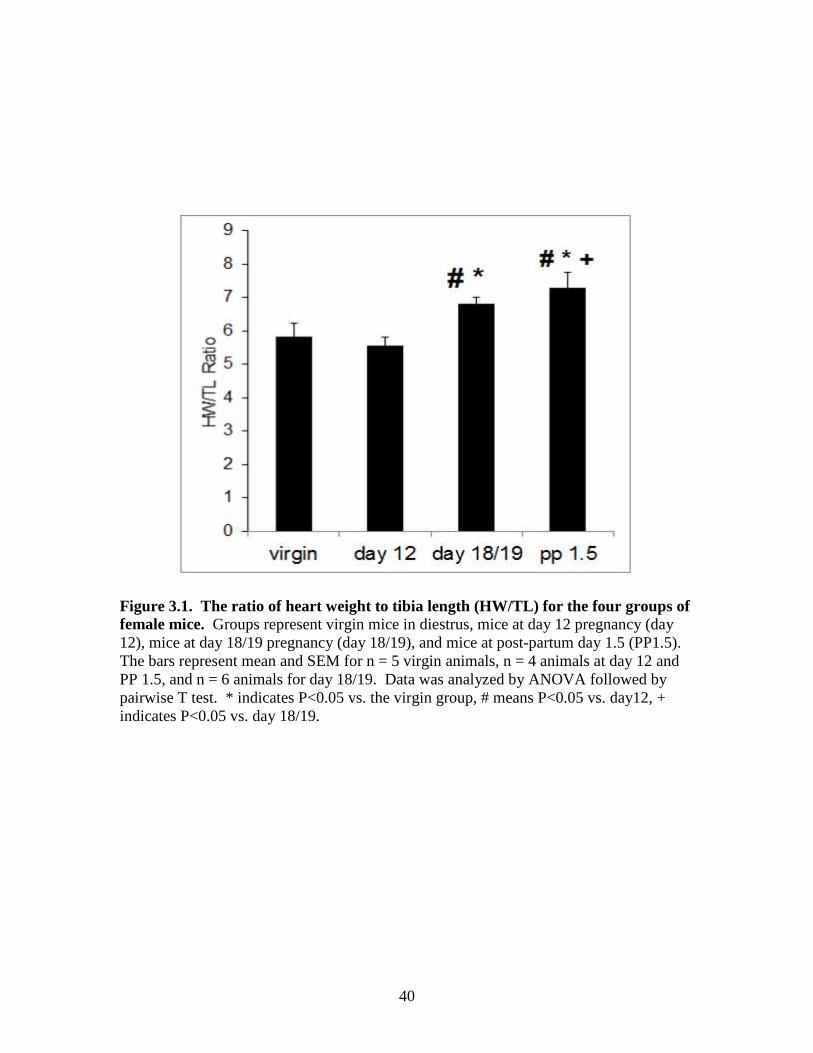
40
Figure 3.1. The ratio of heart weight to tibia length (HW/TL) for the four groups of female mice. Groups represent virgin mice in diestrus, mice at day 12 pregnancy (day 12), mice at day 18/19 pregnancy (day 18/19), and mice at post-partum day 1.5 (PP1.5). The bars represent mean and SEM for n = 5 virgin animals, n = 4 animals at day 12 and PP 1.5, and n = 6 animals for day 18/19. Data was analyzed by ANOVA followed by pairwise T test. * indicates P<0.05 vs. the virgin group, # means P<0.05 vs. day12, + indicates P<0.05 vs. day 18/19.
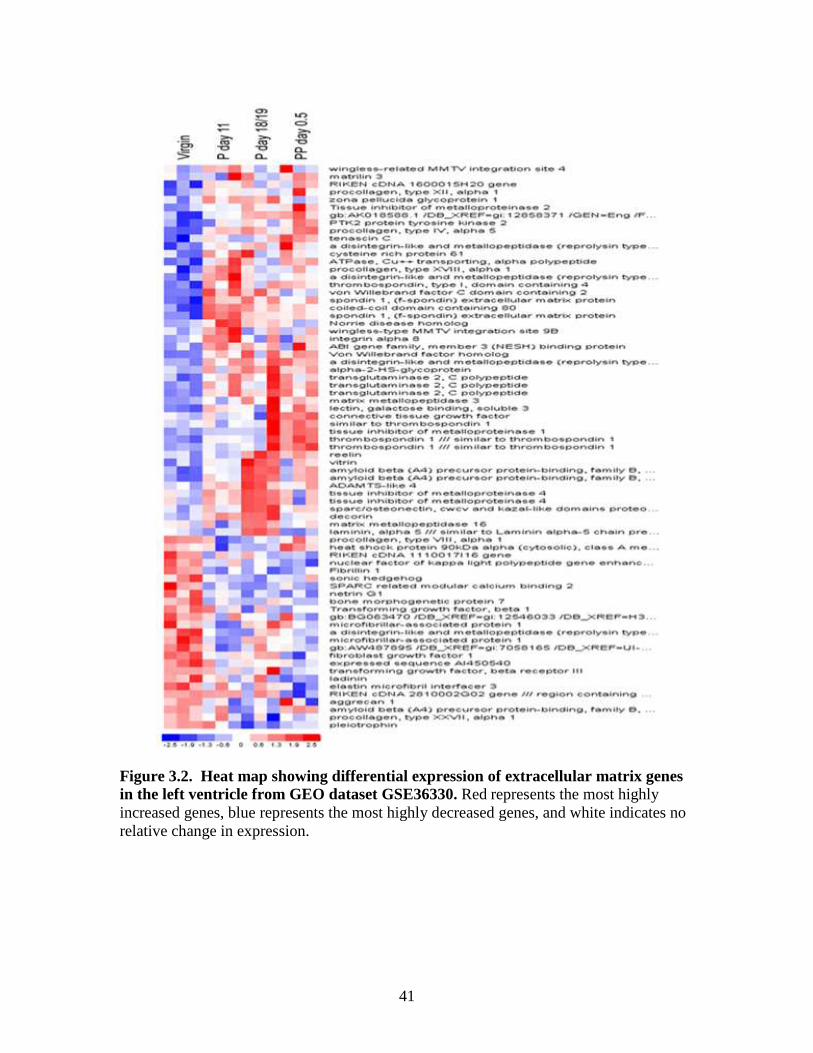
41
Figure 3.2. Heat map showing differential expression of extracellular matrix genes in the left ventricle from GEO dataset GSE36330. Red represents the most highly increased genes, blue represents the most highly decreased genes, and white indicates no relative change in expression.
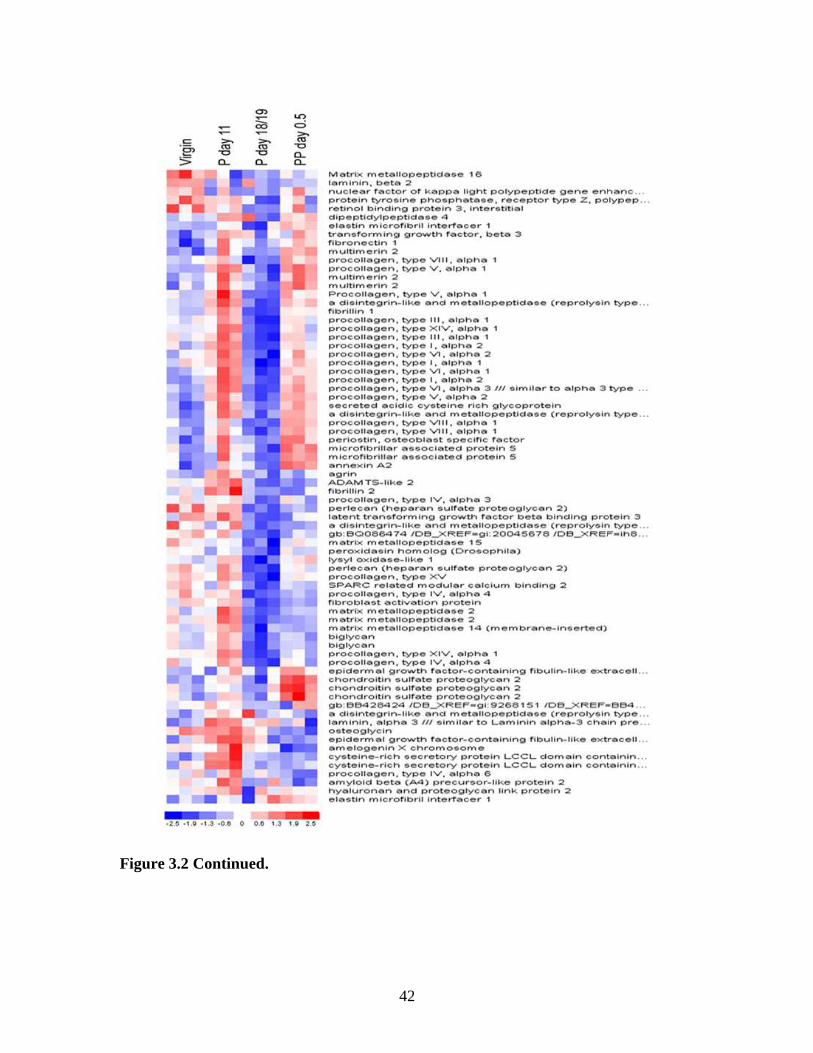
Figure 3.2 Continued.
42
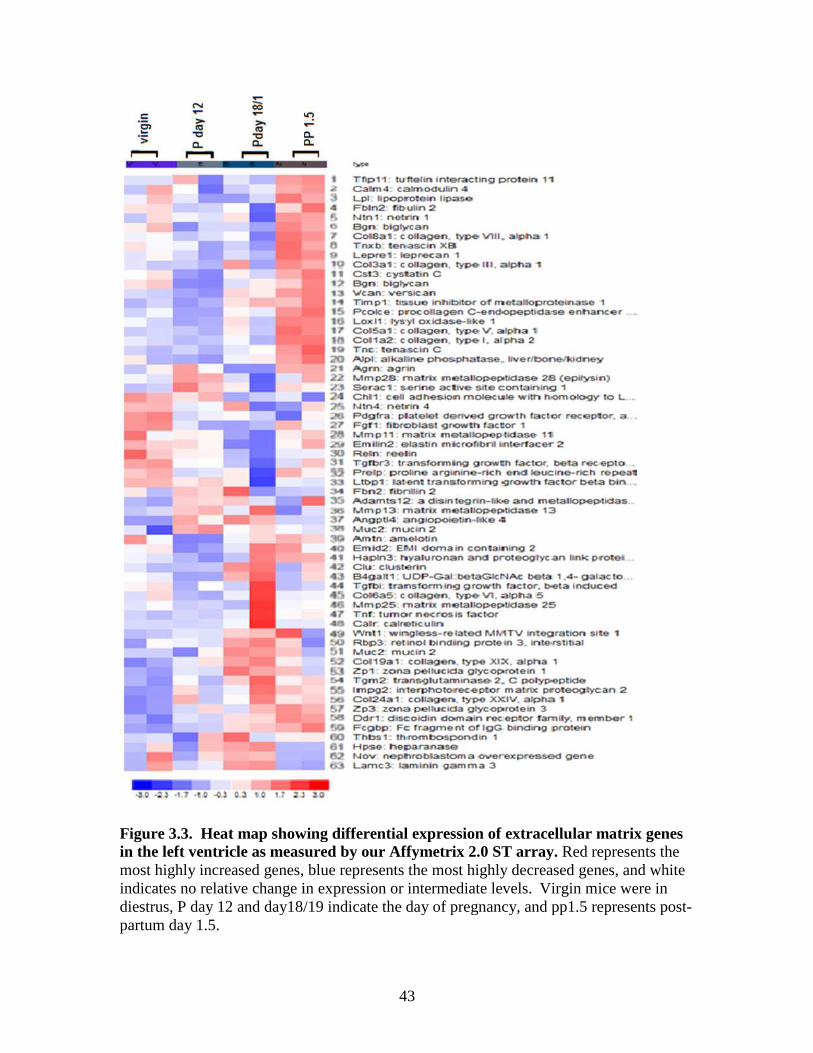
Figure 3.3. Heat map showing differential exprin the left ventricle as measured by our most highly increased genes, indicates no relative change in expressiondiestrus, P day 12 and day18/19 indicate the day of pregnancy, and pp1.5 represents postpartum day 1.5.
43
3.3. Heat map showing differential expression of extracellular min the left ventricle as measured by our Affymetrix 2.0 ST array. Red represents the
blue represents the most highly decreased genes, and white change in expression or intermediate levels. Virgin mice
diestrus, P day 12 and day18/19 indicate the day of pregnancy, and pp1.5 represents post
matrix genes represents the
represents the most highly decreased genes, and white Virgin mice were in
diestrus, P day 12 and day18/19 indicate the day of pregnancy, and pp1.5 represents post-
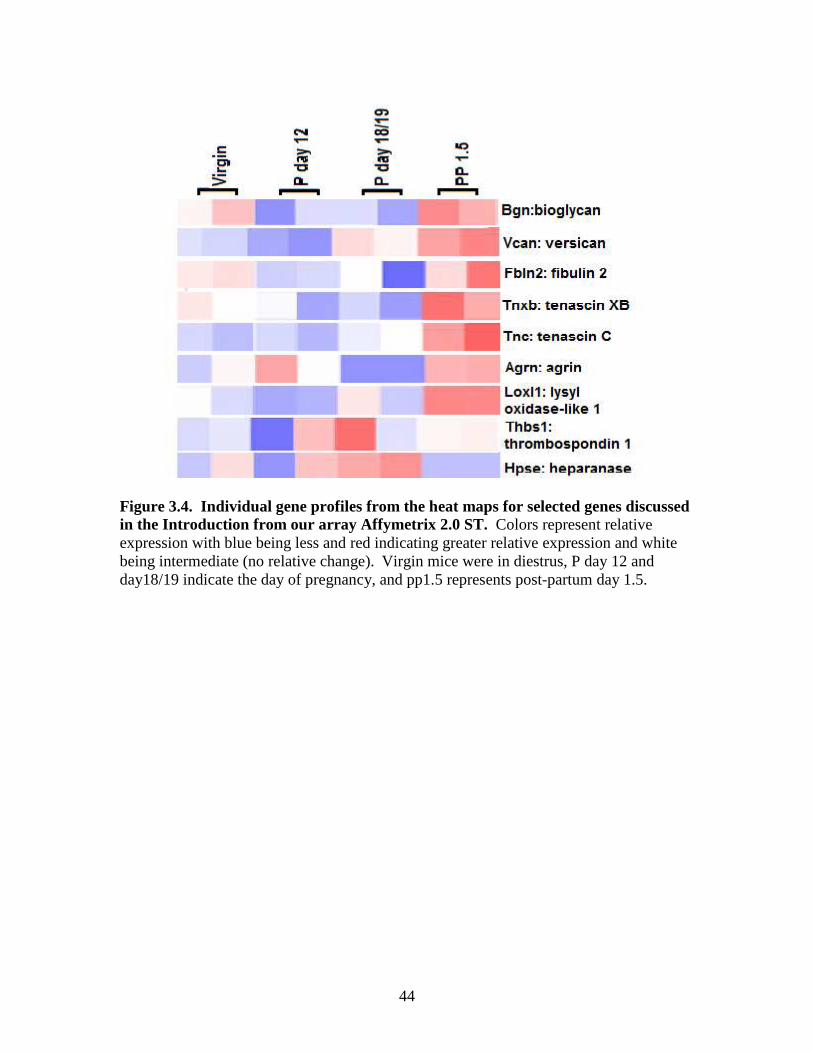
44
Figure 3.4. Individual gene profiles from the heat maps for selected genes discussed in the Introduction from our array Affymetrix 2.0 ST. Colors represent relative expression with blue being less and red indicating greater relative expression and white being intermediate (no relative change). Virgin mice were in diestrus, P day 12 and day18/19 indicate the day of pregnancy, and pp1.5 represents post-partum day 1.5.
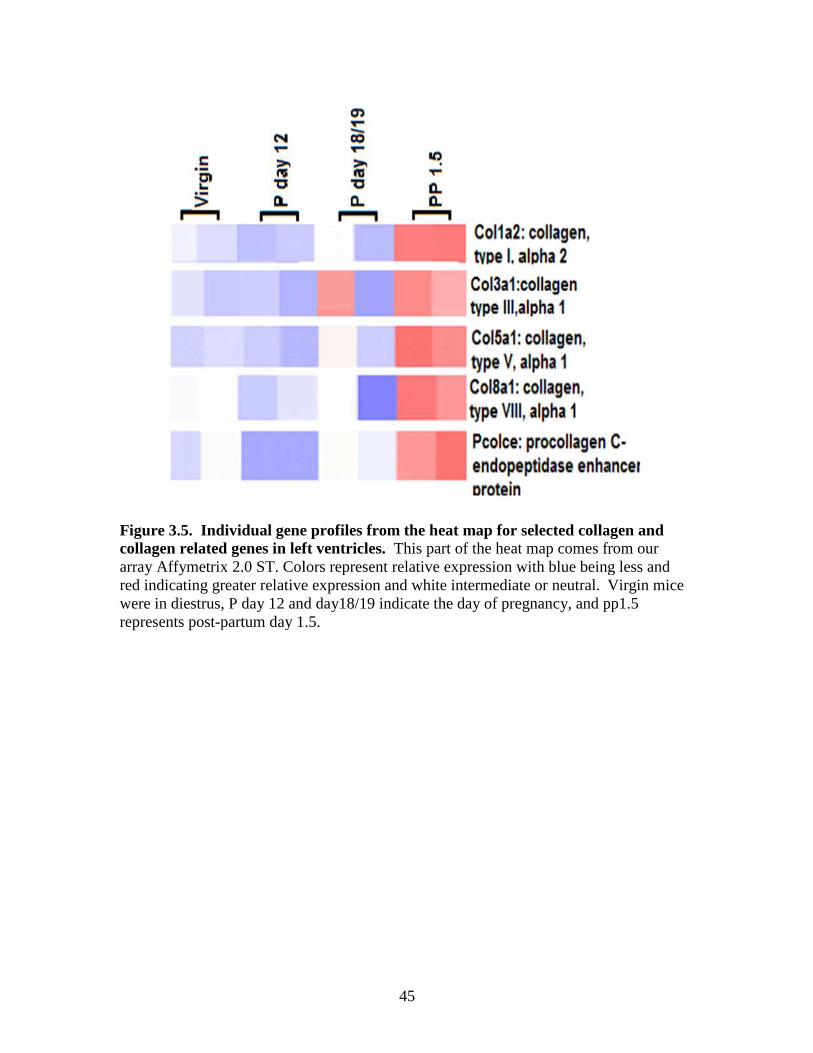
Figure 3.5. Individual gene profiles from the collagen related genes in left ventricles. array Affymetrix 2.0 ST. Colors represent relative expression with blue being less and red indicating greater relative expressionwere in diestrus, P day 12 and day18/19 indicate the day of pregnancy, and pp1.5 represents post-partum day 1.5.
45
gene profiles from the heat map for selected collagen and in left ventricles. This part of the heat map comes from our
Colors represent relative expression with blue being less and red indicating greater relative expression and white intermediate or neutral. Virgin mice
re in diestrus, P day 12 and day18/19 indicate the day of pregnancy, and pp1.5 partum day 1.5.
selected collagen and heat map comes from our
Colors represent relative expression with blue being less and Virgin mice
re in diestrus, P day 12 and day18/19 indicate the day of pregnancy, and pp1.5
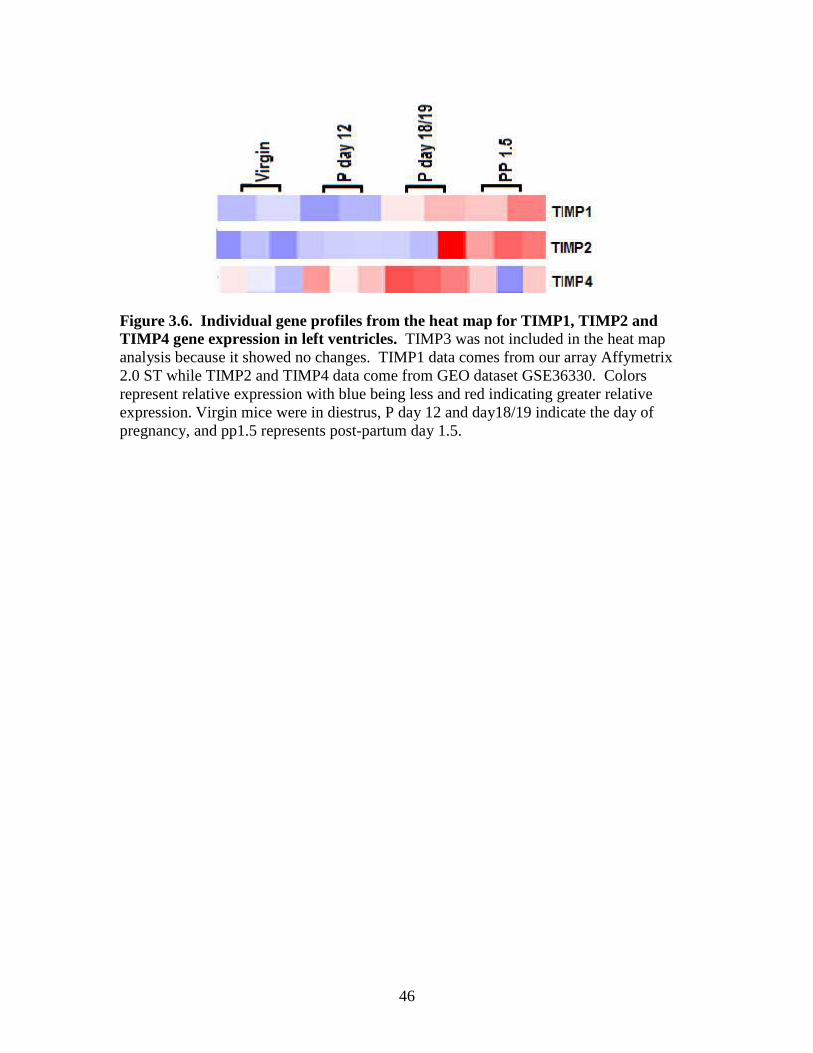
46
Figure 3.6. Individual gene profiles from the heat map for TIMP1, TIMP2 and TIMP4 gene expression in left ventricles. TIMP3 was not included in the heat map analysis because it showed no changes. TIMP1 data comes from our array Affymetrix 2.0 ST while TIMP2 and TIMP4 data come from GEO dataset GSE36330. Colors represent relative expression with blue being less and red indicating greater relative expression. Virgin mice were in diestrus, P day 12 and day18/19 indicate the day of pregnancy, and pp1.5 represents post-partum day 1.5.
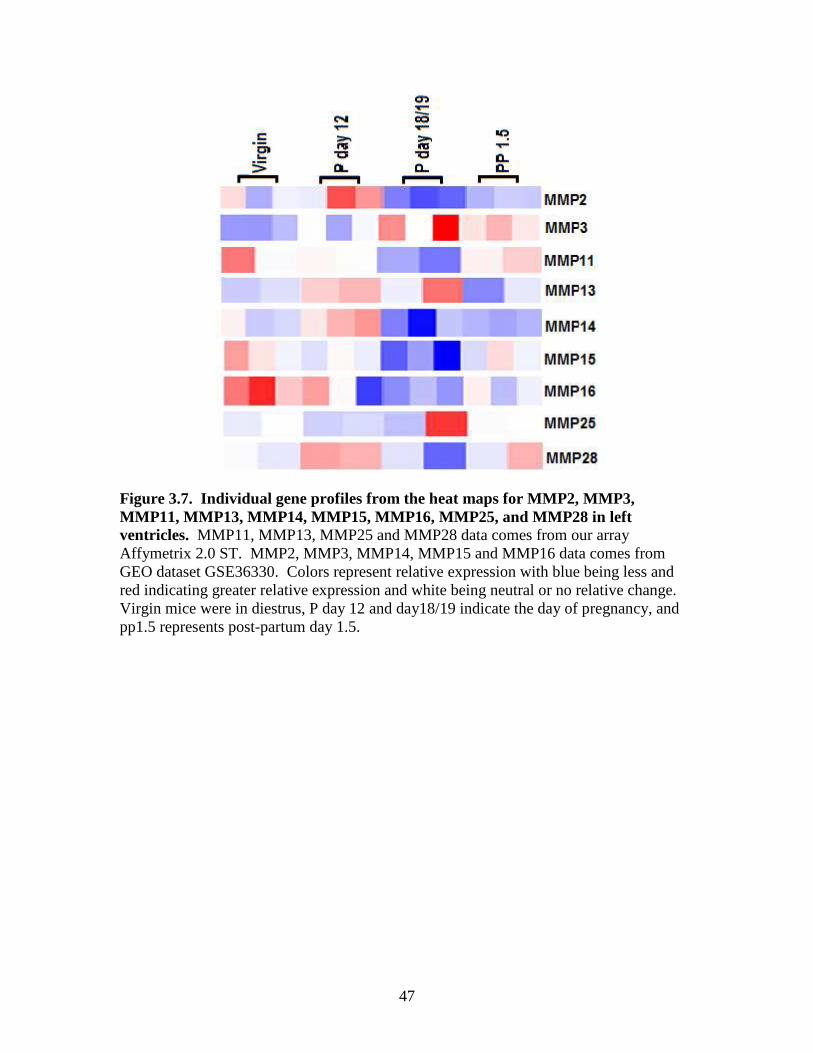
47
Figure 3.7. Individual gene profiles from the heat maps for MMP2, MMP3, MMP11, MMP13, MMP14, MMP15, MMP16, MMP25, and MMP28 in left ventricles. MMP11, MMP13, MMP25 and MMP28 data comes from our array Affymetrix 2.0 ST. MMP2, MMP3, MMP14, MMP15 and MMP16 data comes from GEO dataset GSE36330. Colors represent relative expression with blue being less and red indicating greater relative expression and white being neutral or no relative change. Virgin mice were in diestrus, P day 12 and day18/19 indicate the day of pregnancy, and pp1.5 represents post-partum day 1.5.
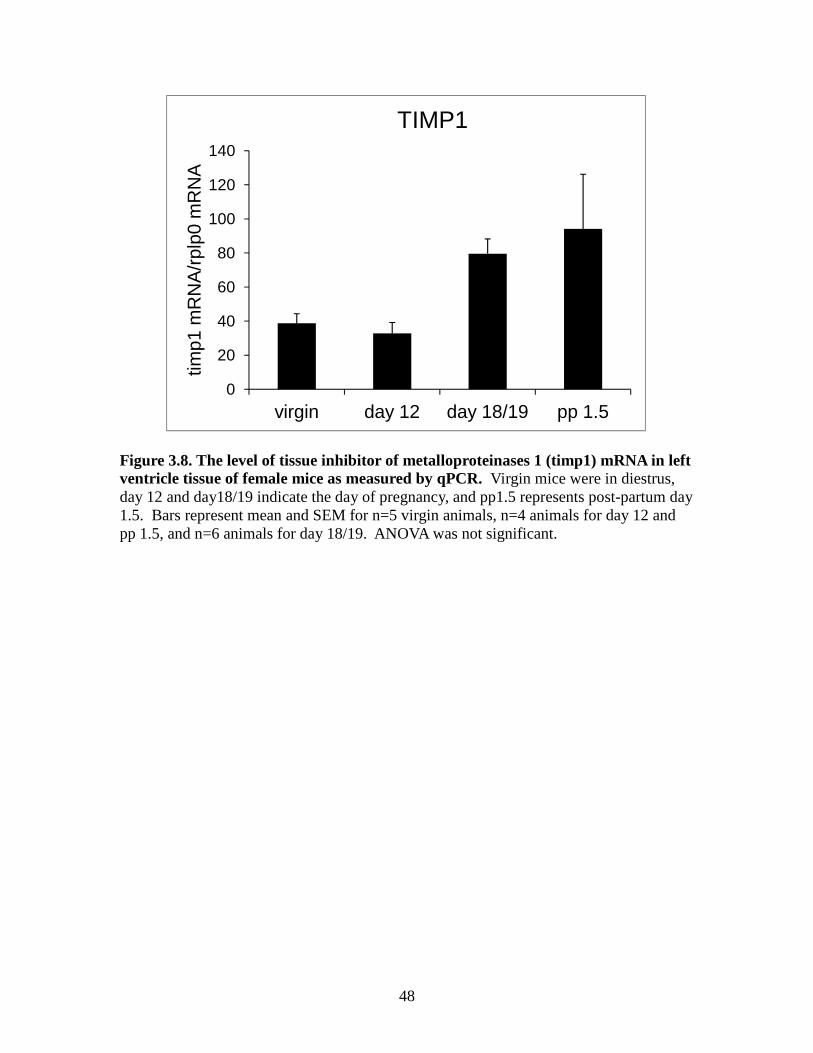
48
Figure 3.8. The level of tissue inhibitor of metalloproteinases 1 (timp1) mRNA in left ventricle tissue of female mice as measured by qPCR. Virgin mice were in diestrus, day 12 and day18/19 indicate the day of pregnancy, and pp1.5 represents post-partum day 1.5. Bars represent mean and SEM for n=5 virgin animals, n=4 animals for day 12 and pp 1.5, and n=6 animals for day 18/19. ANOVA was not significant.
0
20
40
60
80
100
120
140
virgin day 12 day 18/19 pp 1.5
timp1
mR
NA
/rpl
p0 m
RN
A
TIMP1
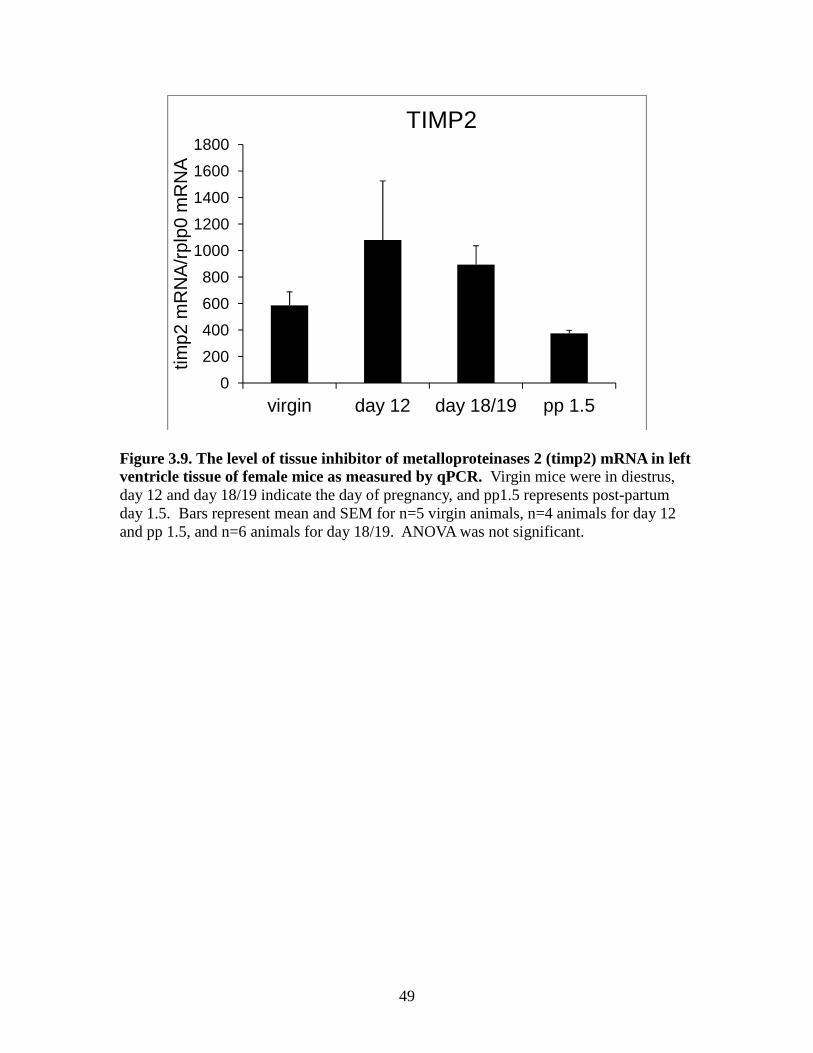
49
Figure 3.9. The level of tissue inhibitor of metalloproteinases 2 (timp2) mRNA in left ventricle tissue of female mice as measured by qPCR. Virgin mice were in diestrus, day 12 and day 18/19 indicate the day of pregnancy, and pp1.5 represents post-partum day 1.5. Bars represent mean and SEM for n=5 virgin animals, n=4 animals for day 12 and pp 1.5, and n=6 animals for day 18/19. ANOVA was not significant.
0
200
400
600
800
1000
1200
1400
1600
1800
virgin day 12 day 18/19 pp 1.5
timp2
mR
NA
/rpl
p0 m
RN
A
TIMP2
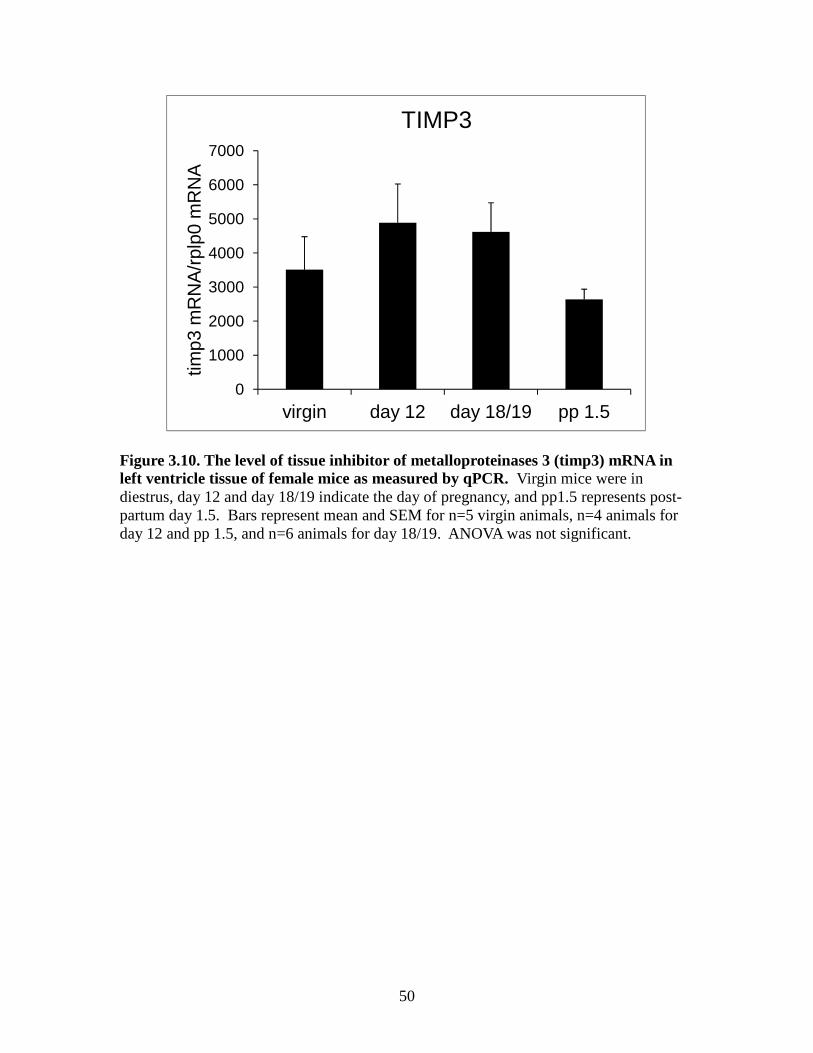
50
Figure 3.10. The level of tissue inhibitor of metalloproteinases 3 (timp3) mRNA in left ventricle tissue of female mice as measured by qPCR. Virgin mice were in diestrus, day 12 and day 18/19 indicate the day of pregnancy, and pp1.5 represents post-partum day 1.5. Bars represent mean and SEM for n=5 virgin animals, n=4 animals for day 12 and pp 1.5, and n=6 animals for day 18/19. ANOVA was not significant.
0
1000
2000
3000
4000
5000
6000
7000
virgin day 12 day 18/19 pp 1.5
timp3
mR
NA
/rpl
p0 m
RN
A
TIMP3
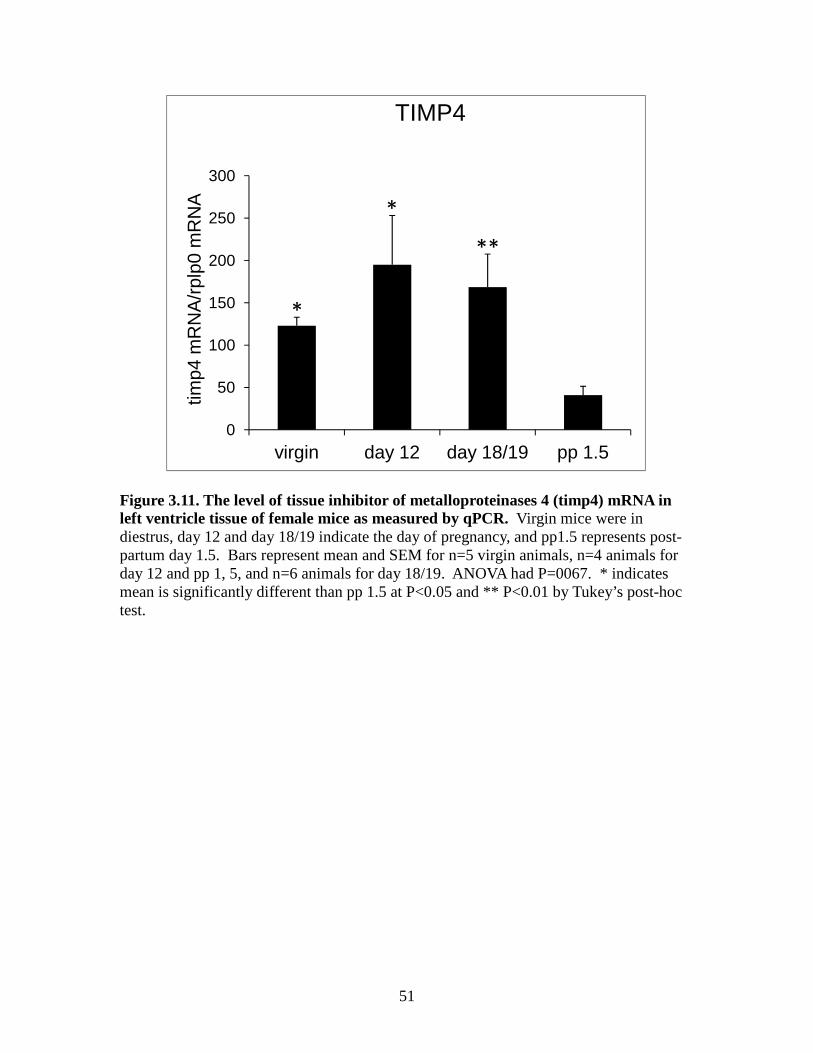
51
Figure 3.11. The level of tissue inhibitor of metalloproteinases 4 (timp4) mRNA in left ventricle tissue of female mice as measured by qPCR. Virgin mice were in diestrus, day 12 and day 18/19 indicate the day of pregnancy, and pp1.5 represents post-partum day 1.5. Bars represent mean and SEM for n=5 virgin animals, n=4 animals for day 12 and pp 1, 5, and n=6 animals for day 18/19. ANOVA had P=0067. * indicates mean is significantly different than pp 1.5 at P<0.05 and ** P<0.01 by Tukey’s post-hoc test.
0
50
100
150
200
250
300
virgin day 12 day 18/19 pp 1.5
timp4
mR
NA
/rpl
p0 m
RN
A
TIMP4
*
*
**
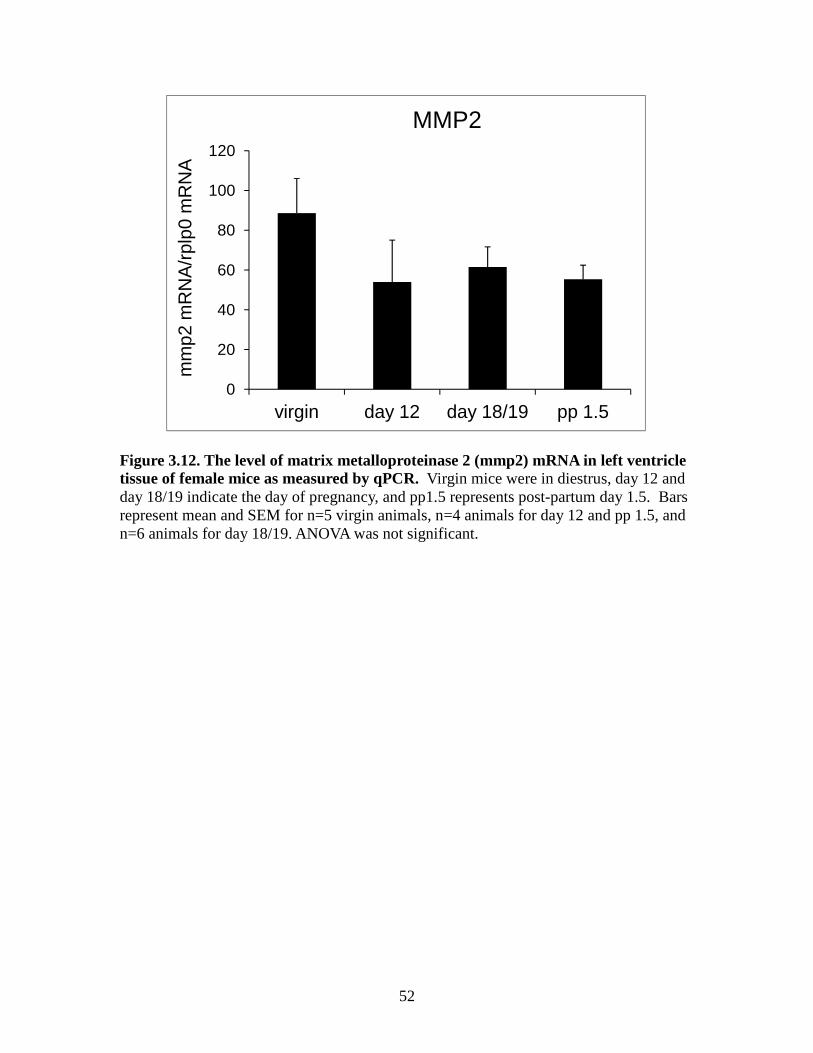
52
Figure 3.12. The level of matrix metalloproteinase 2 (mmp2) mRNA in left ventricle tissue of female mice as measured by qPCR. Virgin mice were in diestrus, day 12 and day 18/19 indicate the day of pregnancy, and pp1.5 represents post-partum day 1.5. Bars represent mean and SEM for n=5 virgin animals, n=4 animals for day 12 and pp 1.5, and n=6 animals for day 18/19. ANOVA was not significant.
0
20
40
60
80
100
120
virgin day 12 day 18/19 pp 1.5
mm
p2 m
RN
A/r
plp0
mR
NA
MMP2
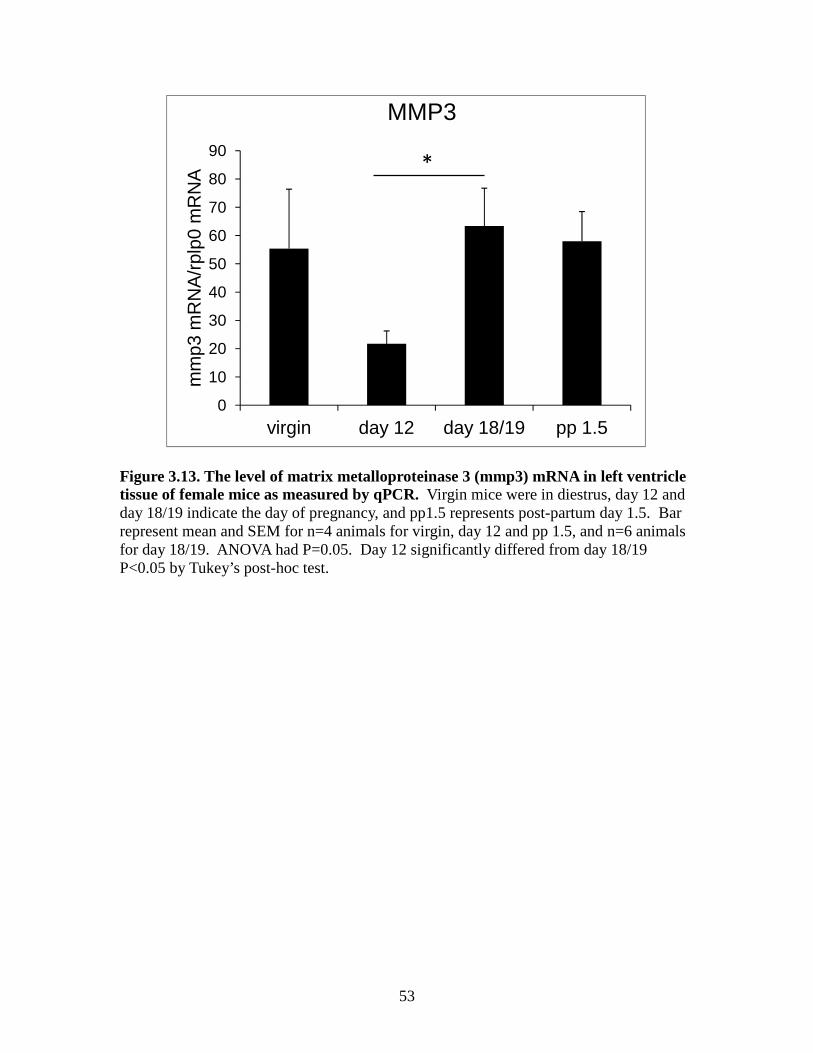
53
Figure 3.13. The level of matrix metalloproteinase 3 (mmp3) mRNA in left ventricle tissue of female mice as measured by qPCR. Virgin mice were in diestrus, day 12 and day 18/19 indicate the day of pregnancy, and pp1.5 represents post-partum day 1.5. Bar represent mean and SEM for n=4 animals for virgin, day 12 and pp 1.5, and n=6 animals for day 18/19. ANOVA had P=0.05. Day 12 significantly differed from day 18/19 P<0.05 by Tukey’s post-hoc test.
0
10
20
30
40
50
60
70
80
90
virgin day 12 day 18/19 pp 1.5
mm
p3 m
RN
A/r
plp0
mR
NA
MMP3
*
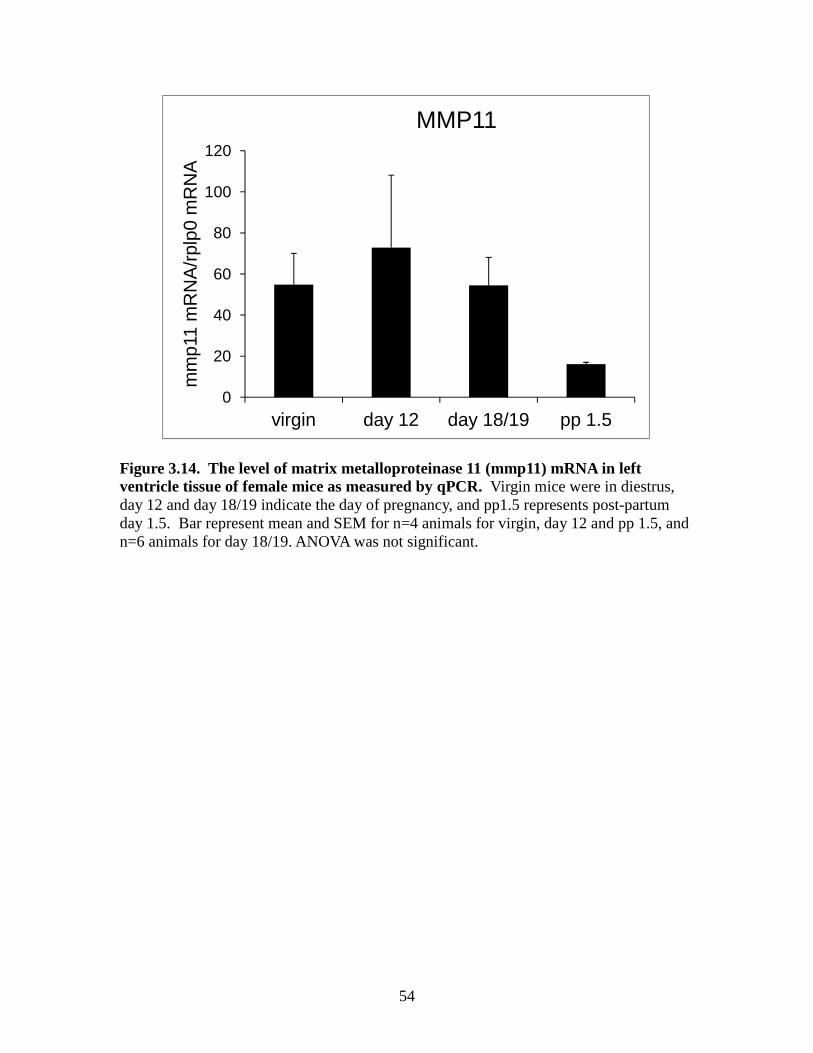
54
Figure 3.14. The level of matrix metalloproteinase 11 (mmp11) mRNA in left ventricle tissue of female mice as measured by qPCR. Virgin mice were in diestrus, day 12 and day 18/19 indicate the day of pregnancy, and pp1.5 represents post-partum day 1.5. Bar represent mean and SEM for n=4 animals for virgin, day 12 and pp 1.5, and n=6 animals for day 18/19. ANOVA was not significant.
0
20
40
60
80
100
120
virgin day 12 day 18/19 pp 1.5
mm
p11
mR
NA
/rpl
p0 m
RN
A
MMP11
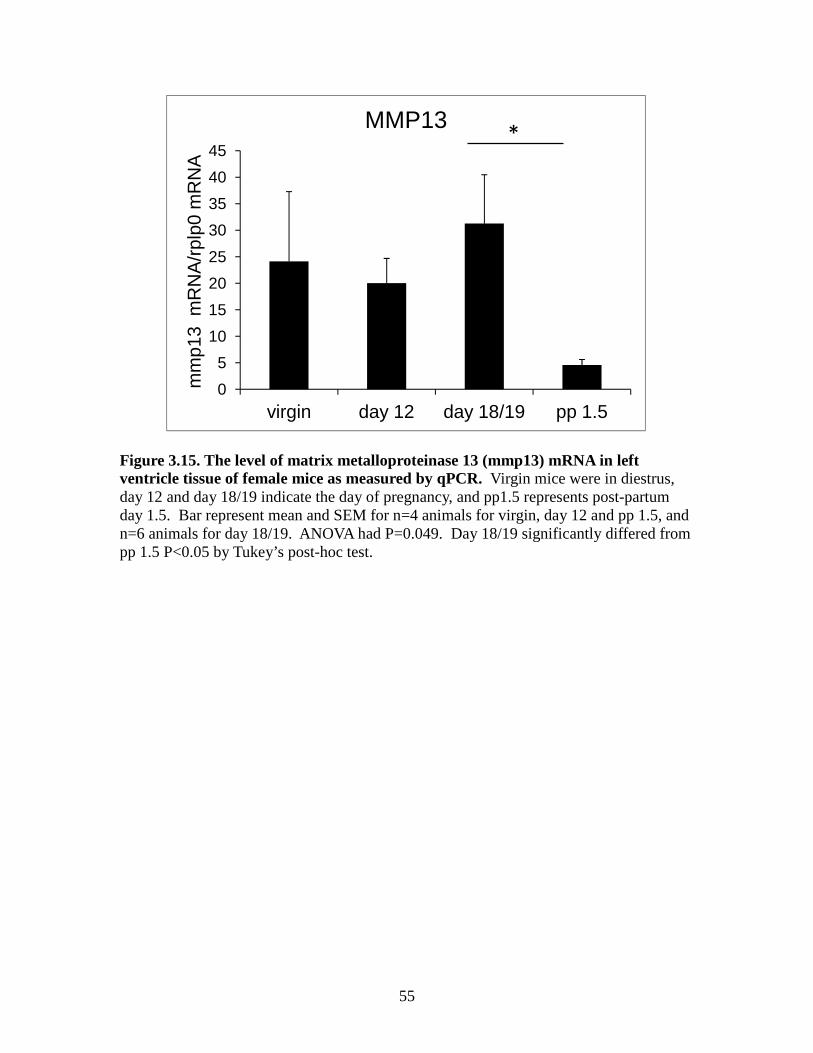
55
Figure 3.15. The level of matrix metalloproteinase 13 (mmp13) mRNA in left ventricle tissue of female mice as measured by qPCR. Virgin mice were in diestrus, day 12 and day 18/19 indicate the day of pregnancy, and pp1.5 represents post-partum day 1.5. Bar represent mean and SEM for n=4 animals for virgin, day 12 and pp 1.5, and n=6 animals for day 18/19. ANOVA had P=0.049. Day 18/19 significantly differed from pp 1.5 P<0.05 by Tukey’s post-hoc test.
0
5
10
15
20
25
30
35
40
45
virgin day 12 day 18/19 pp 1.5
mm
p13
mR
NA
/rpl
p0 m
RN
A
MMP13*
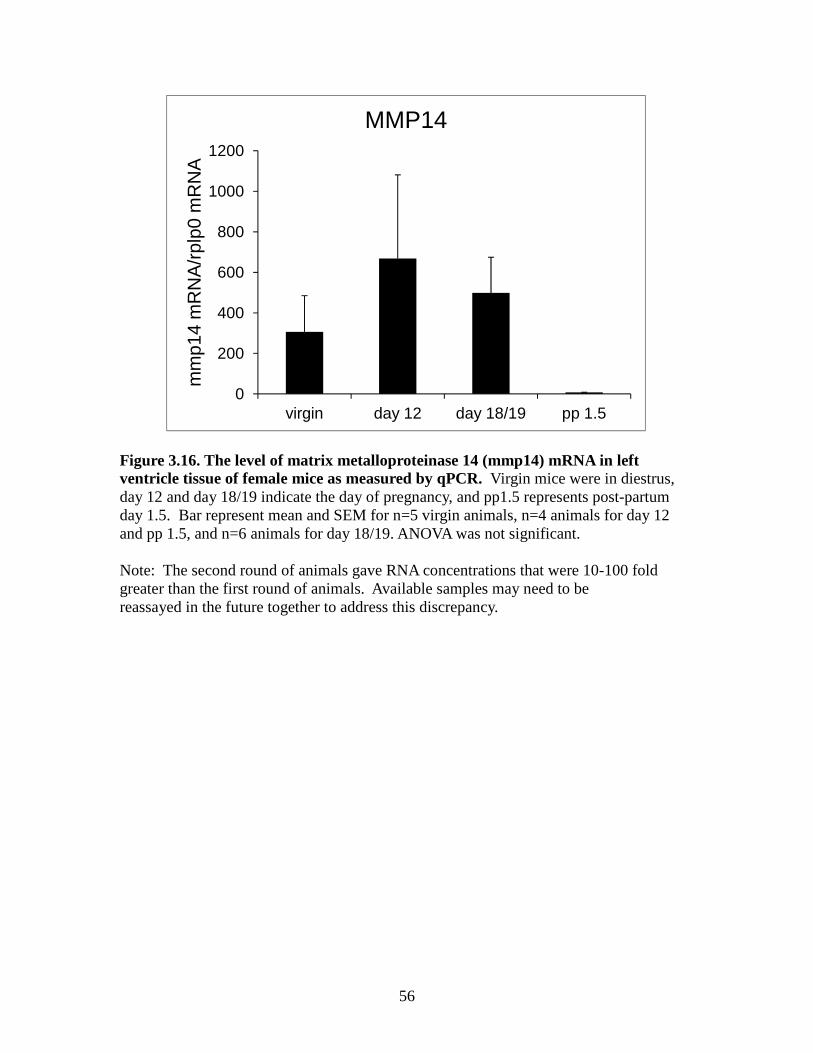
56
Figure 3.16. The level of matrix metalloproteinase 14 (mmp14) mRNA in left ventricle tissue of female mice as measured by qPCR. Virgin mice were in diestrus, day 12 and day 18/19 indicate the day of pregnancy, and pp1.5 represents post-partum day 1.5. Bar represent mean and SEM for n=5 virgin animals, n=4 animals for day 12 and pp 1.5, and n=6 animals for day 18/19. ANOVA was not significant. Note: The second round of animals gave RNA concentrations that were 10-100 fold greater than the first round of animals. Available samples may need to be reassayed in the future together to address this discrepancy.
0
200
400
600
800
1000
1200
virgin day 12 day 18/19 pp 1.5
mm
p14
mR
NA
/rpl
p0 m
RN
A
MMP14
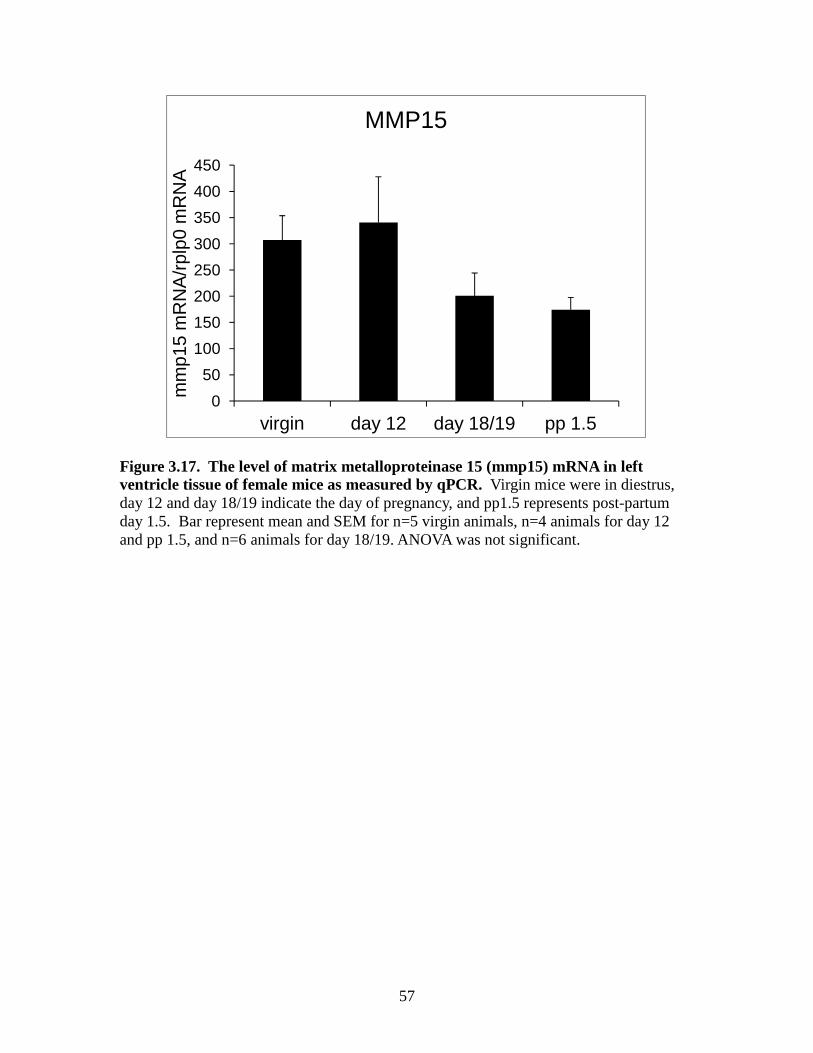
57
Figure 3.17. The level of matrix metalloproteinase 15 (mmp15) mRNA in left ventricle tissue of female mice as measured by qPCR. Virgin mice were in diestrus, day 12 and day 18/19 indicate the day of pregnancy, and pp1.5 represents post-partum day 1.5. Bar represent mean and SEM for n=5 virgin animals, n=4 animals for day 12 and pp 1.5, and n=6 animals for day 18/19. ANOVA was not significant.
0
50
100
150
200
250
300
350
400
450
virgin day 12 day 18/19 pp 1.5
mm
p15
mR
NA
/rpl
p0 m
RN
A
MMP15
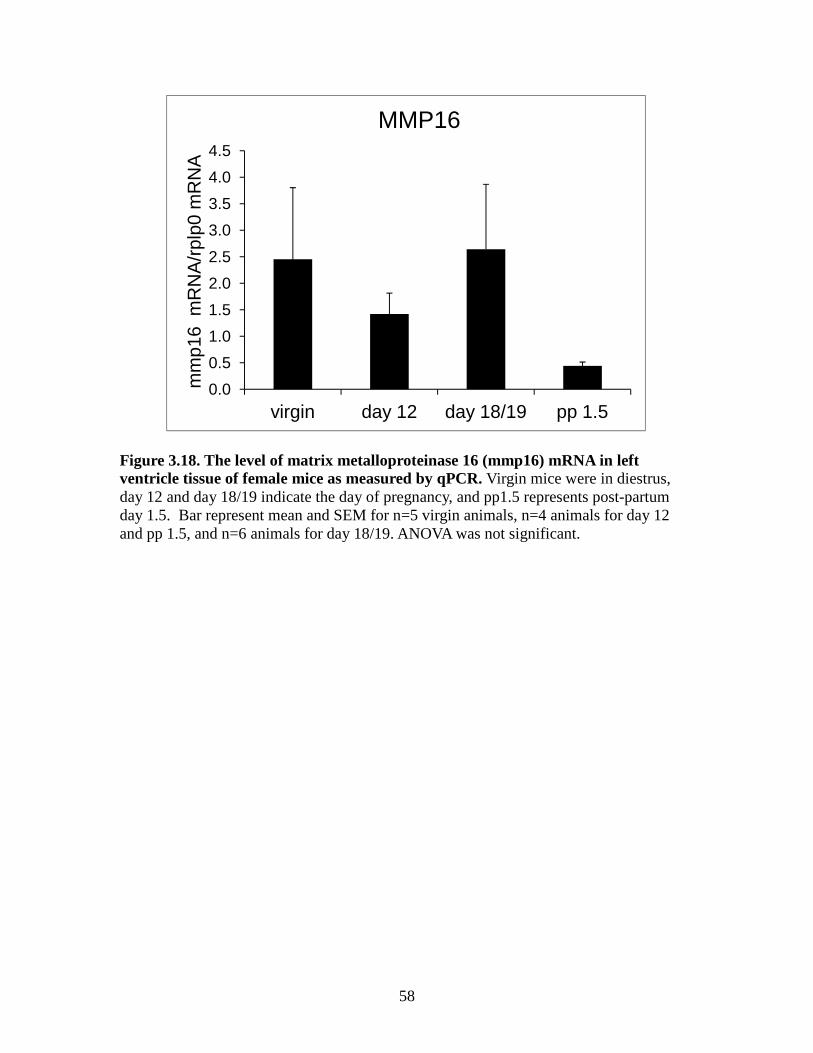
58
Figure 3.18. The level of matrix metalloproteinase 16 (mmp16) mRNA in left ventricle tissue of female mice as measured by qPCR. Virgin mice were in diestrus, day 12 and day 18/19 indicate the day of pregnancy, and pp1.5 represents post-partum day 1.5. Bar represent mean and SEM for n=5 virgin animals, n=4 animals for day 12 and pp 1.5, and n=6 animals for day 18/19. ANOVA was not significant.
0.0
0.5
1.0
1.5
2.0
2.5
3.0
3.5
4.0
4.5
virgin day 12 day 18/19 pp 1.5
mm
p16
mR
NA
/rpl
p0 m
RN
A
MMP16
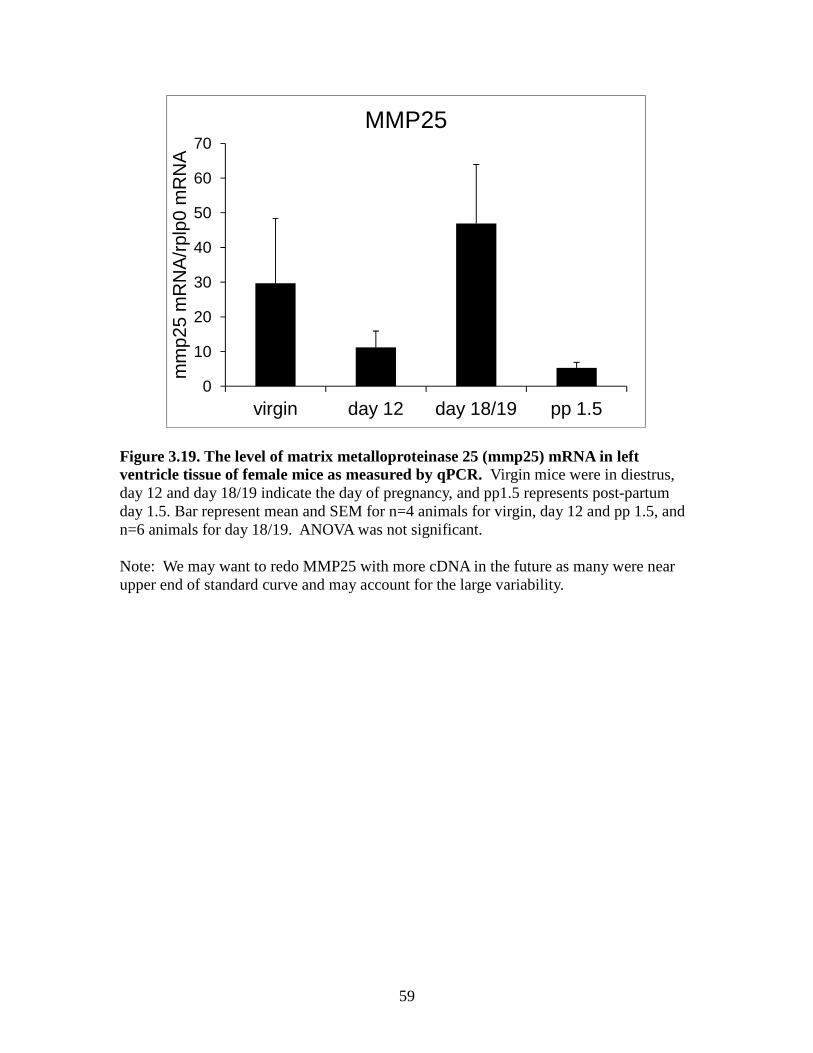
59
Figure 3.19. The level of matrix metalloproteinase 25 (mmp25) mRNA in left ventricle tissue of female mice as measured by qPCR. Virgin mice were in diestrus, day 12 and day 18/19 indicate the day of pregnancy, and pp1.5 represents post-partum day 1.5. Bar represent mean and SEM for n=4 animals for virgin, day 12 and pp 1.5, and n=6 animals for day 18/19. ANOVA was not significant. Note: We may want to redo MMP25 with more cDNA in the future as many were near upper end of standard curve and may account for the large variability.
0
10
20
30
40
50
60
70
virgin day 12 day 18/19 pp 1.5
mm
p25
mR
NA
/rpl
p0 m
RN
A
MMP25
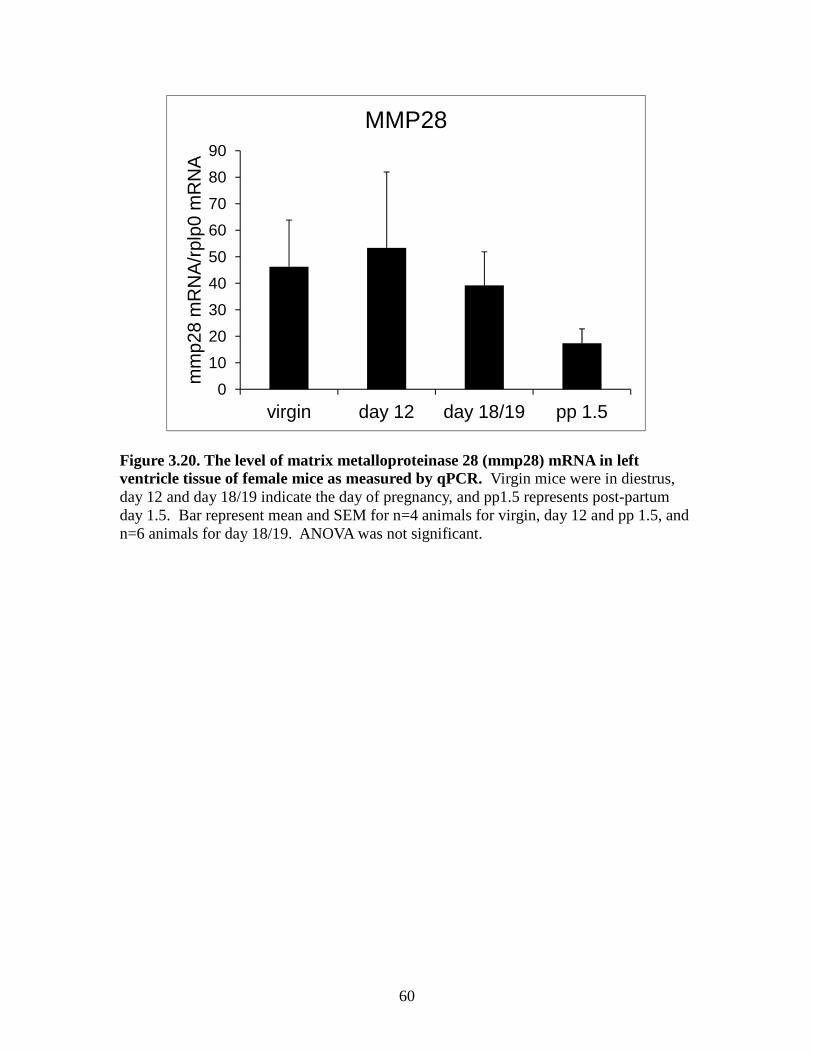
60
Figure 3.20. The level of matrix metalloproteinase 28 (mmp28) mRNA in left ventricle tissue of female mice as measured by qPCR. Virgin mice were in diestrus, day 12 and day 18/19 indicate the day of pregnancy, and pp1.5 represents post-partum day 1.5. Bar represent mean and SEM for n=4 animals for virgin, day 12 and pp 1.5, and n=6 animals for day 18/19. ANOVA was not significant.
0
10
20
30
40
50
60
70
80
90
virgin day 12 day 18/19 pp 1.5
mm
p28
mR
NA
/rpl
p0 m
RN
A
MMP28
61
CHAPTER 4
DISCUSSION
Pregnancy-induced cardiac hypertrophy is a physiological adaptation to a volume
overload situation which involves thickening of the ventricular wall (Eghbali et al, 2006).
The myocardial ECM and its integrity impact both cardiac structure and function and are
altered during the hypertrophy process. During the post-partum period there is a return of
the hypertrophied heart to its non-pregnant state. As ECM remodeling is important in the
process of hypertrophy and recovery from hypertrophy we examined the ECM gene
expression profile by microarray and followed up the expression of some genes by
quantitative PCR. This project has three major findings. First, the heart weight/tibial
length ratio was significantly increased in the late pregnancy and post-partum mice
versus the virgin mouse group, indicating significant heart hypertrophy. Second, the
hearts of late pregnant and post-partum mice versus the virgin mice when assessed by
microarray showed that 63 genes extracellular matrix gene probe sets from our
Affymetrix 2.0 ST array and 147 genes extracellular matrix genes probe sets from GEO
dataset GSE36330 array were differentially expressed depending on the state of cardiac
hypertrophy. Third, some TIMP and MMP mRNAs were significantly regulated when
assessed by qPCR whereas some were not consistent with the pattern observed by the
heat maps of the microarray data.
There was a significant increase in the HW/TL of the day 18/19 group and post-
partum 1.5 day group compared to the virgin group which is in agreement with the
62
concept that by late pregnancy there is a physiological adaptation that is not completely
reversed by day 1.5 post-partum in our animals (Umar et al, 2012; Xiao, et al,2014).
Sixty-three ECM genes by heat map (from our animals and our 2.0 ST array data)
showed had a significant difference in the expression between virgin, day 12 of
pregnancy, day 18/19 of pregnancy and post-partum 1.5 day animal groups. Twenty-five
of these genes were discussed in the Introduction. The heat map showed 8 of 25 mRNAs
were increased in late pregnant and immediately post-partum mice including Bgn, Vcan,
Fbln2, Tnxb, Tnc, Agrn, Loxl1 and Thbs1 and some collagen genes were also found to
have increased expression during the same period including Col1a2, Col3a1, Col5a1 and
Col8a1. However, Hpse was lowest-regulated on post-partum and highest-regulated on
day18/19 mice. The heat map showed that TIMP1, TIMP2, TIMP4 and MMP3 are
increased in the late pregnant or post-partum period, while MMP2, MMP11, MMP13,
MMP14, MMP15, MMP25 and MMP28 genes were as a whole lower during the same
period. Confirmation of many of these microarray changes still need to be validated by
quantitative PCR as we found that the qPCR data did not always agree with the
microarray heat map data.
Because TIMP and MMP protein activity balance each other and net MMP
activity determines matrix molecule turnover, we focused on the four members of the
TIMP and nine members of the MMPs gene families, all of which were detected by the
microarray as potentially regulated (with the exception of TIMP3). By PCR, TIMP4
mRNA was significantly lower in the early post-partum suggesting potentially lower
TIMP4 levels/activity. If TIMP4 protein and activity are consistent with the mRNA
change it would suggest that its targets MMP-1, -3, -7 and -9 were less inhibited during
63
this period. TIMP1 mRNA trended to be higher in late-pregnancy and the post-partum
period although it was not statistically significant. TIMP1 can inhibit all MMPs except
MMP-2 and MT1-MMP, suggesting that if protein levels/activity followed the pattern of
mRNA expression that many MMP targets would be inhibited. By PCR, overall at post-
partum day 1.5 there was a trend for MMP11, MMP13, MMP14, MMP16, MMP25,
MMP28 to have their lowest mean (although not statistically significant in most cases).
MMP3 mRNA was decreased in the day 12 mid-pregnancy group and MMP13 was
decreased in post-partum group than day 18/19 groups, suggesting that their protein
targets would have lower turnover at these times. One must keep in mind that mRNA
levels do not necessarily reflect protein levels or protein activity levels and so caution
must be taken in interpreting mRNA exclusively. Although there were trends in TIMP
and MMP mRNA expression, much of our qPCR data turned out not to be statistically
significant. As there was a lot of variability between animals it may be necessary to
increase the number of animals per group to reduce the variability of the small group size.
Our data showed there are changes in gene expression in the left ventricle during
pregnancy and in the early post-partum period compared to virgin mice. Other studies
have showed shown gene changes in the heart with pregnancy (Bernardo et al, 2010).
Umar et al. (2012) found MMP2 mRNA was lower in the hearts of late pregnant mice
than in virgin animals and the GEOset microarray data here are in support of this prior
finding. In contrast, pathological hypertrophy microarray analysis showed increased
expression of MMP-2 in the mouse LV after transverse aortic constriction (Wang et al,
2003). One interpretation of this difference is that the type of hypertrophy may influence
MMP2 mRNA increase or decrease. In addition, the stage of hypertrophy progression at
64
which the RNA level was assessed may influence the results. Our study identified
TIMP1 to be highest (not significant by qPCR) in late pregnancy and the early post-
partum period, TIMP2 was high in late pregnancy and lowest in post-partum animals, and
MMP3 was lowest in D12 animals and higher in virgin, late pregnant and post-partum
animals. Mori et al. (2006) using a pathological hypertrophy mouse model of TNF1.6
overexpression showed increased MMP3, TIMP1, andTIMP2 mRNA levels. Another
study showed the level of transcripts for TIMP1 and TIMP2 were increased in
pathological heart due to aortic stenosis (Heymans et al, 2005). Although the pattern of
MMP3, TIMP1, and TIMP2 was not identical between the pathological and physiological
hypertrophy models, the same genes showed differential expression.
Our animal data showed that mRNA expression by microarray for collagen I and
collagen III increased in the post-partum period possibly indicating the need for new
collagen synthesis and deposition during the return to the non-pregnant state. Collagen I
and collagen III in the left ventricle were increased in a myocardial infarction model.
This suggests a distinct pattern of cardiac gene expression induced by the physiological
load versus pathological load (Jin et al, 2000). Col1a2, Col3a1, Col5a1, Col8a1, Bgn,
Vcan, Fbln2, Tnxb, Tnc, Agrn, Loxl1 and Thbs1 showed changes on the heat map by
microarray. These gene changes in the left ventricle of pregnant mice suggest that the
extracellular matrix is being remodeled and may indicate changes in newly synthesized
collagen and other matrix proteins.
Another study in mice showed that there was a significant increase during the late
pregnant and the post-partum period in MMP3 and TIMP1 mRNA expression (Chung et
al, 2012). Our results are fairly consistent with this prior study. The MMP mRNAs
65
examined here showed a tendency as a whole to be decreased during late pregnancy and
the post-partum period, suggesting the possibility of decreased MMP level/activity in the
left ventricle during this time.
The physiological hypertrophy of pregnancy is reversed during the post-partum
period although in our case it was not completely reversed by post-partum day 1.5. In
contrast, pathological hypertrophy is associated with development of heart failure. The
most significant distinction between physiological and pathological hypertrophy is the
reversible nature of physiological hypertrophy. In future studies it will be interesting to
compare the pregnancy gene profile we analyzed with that for models of volume
overload that progress to pathological hypertrophy. Future studies will determine if the
changes in some TIMPs and MMPs are observed at the protein and activity level. In
addition, it will be interesting to determine if the changes are regulated by pregnancy
hormones and whether pregnancy hormones could be protective to the heart in animal
model of pathological cardiac hypertrophy.
66
REFERENCES
Aggeli C., Pietri P., Felekos I., Rautopoulos L., Toutouzas K., Tsiamis E., Stefanadis C. (2012). Myocardial structure and matrix metalloproteinases. Curr. Top. Med. Chem. 12, 1113-1131.
Ahmed M.S., Oie E., Vinge L.E., Yndestad A., Andersen G.G., Andersson Y., Attramadal T., Attramadal H. (2003). Induction of myocardial biglycan in heart failure in rats--an extracellular matrix component targeted by AT(1) receptor antagonism. Cardiovasc. Res. 60, 557-568.
Ahumada G.G., Rennard S.I., Figueroa A.A., Silver M.H. (1981). Cardiac fibronectin: developmental distribution and quantitative comparison of possible sites of synthesis. J. Mol. Cell Cardiol. 13, 667-678.
Ashworth J.L., Murphy G., Rock M.J., Sherratt M.J., Shapiro S.D., Shuttleworth C.A., Kielty C.M. (1999). Fibrillin degradation by matrix metalloproteinases: implications for connective tissue remodelling. Biochem. J. 340 ( Pt 1), 171-181.
Azeloglu E.U., Albro M.B., Thimmappa V.A., Ateshian G.A., Costa K.D. (2008). Heterogeneous transmural proteoglycan distribution provides a mechanism for regulating residual stresses in the aorta. Am. J. Physiol Heart Circ. Physiol. 294, H1197-H1205.
Baicu C.F., Stroud J.D., Livesay V.A., Hapke E., Holder J., Spinale F.G., Zile M.R. (2003). Changes in extracellular collagen matrix alter myocardial systolic performance. Am. J. Physiol Heart Circ. Physiol. 284, H122-H132.
Banerjee I., Fuseler J.W., Price R.L., Borg T.K., Baudino T.A. (2007). Determination of cell types and numbers during cardiac development in the neonatal and adult rat and mouse. Am. J. Physiol Heart Circ. Physiol. 293, H1883-H1891.
Barrasa J.I., Olmo N., Santiago-Gomez A., Lecona E., Anglard P., Turnay J., Lizarbe M.A. (2012). Histone deacetylase inhibitors upregulate MMP11 gene expression through Sp1/Smad complexes in human colon adenocarcinoma cells. Biochim. Biophys. Acta. 1823, 570-581.
Baudino T.A., Carver W., Giles W., Borg T.K. (2006). Cardiac fibroblasts: friend or foe? Am. J. Physiol Heart Circ. Physiol. 291, H1015-H1026.
Beck K., Brodsky B. (1998). Supercoiled protein motifs: the collagen triple-helix and the alpha-helical coiled coil. J. Struct. Biol. 122, 17-29.
67
Bereczki E., Gonda S., Csont T., Korpos E., Zvara A., Ferdinandy P., Santha M. (2007). Overexpression of biglycan in the heart of transgenic mice: an antibody microarray study. J. Proteome. Res. 6, 854-861.
Berk B.C., Fujiwara K., Lehoux S. (2007). ECM remodeling in hypertensive heart disease. J. Clin. Invest. 117, 568-575.
Bernardo B.C., Weeks K.L., Pretorius L., McMullen J.R. (2010). Molecular distinction between physiological and pathological cardiac hypertrophy: experimental findings and therapeutic strategies. Pharmacol. Ther. 128, 191-227.
Bing O.H., Matsushita S., Fanburg B.L., Levine H.J. (1971). Mechanical properties of rat cardiac muscle during experimental hypertrophy. Circ. Res. 28, 234-245.
Bishop J.E., Laurent G.J. (1995). Collagen turnover and its regulation in the normal and hypertrophying heart. Eur. Heart J. 16 Suppl C, 38-44.
Dynamics of cardiac wound healing following myocardial infarction: observations in genetically altered mice. Acta Physiol Scand. Sep;173(1):75–82. Borg T.K., Baudino T.A. (2011). Dynamic interactions between the cellular components of the heart and the extracellular matrix. Pflugers Arch. 462, 69-74.
Borg T.K., Ranson W.F., Moslehy F.A., Caulfield J.B. (1981). Structural basis of ventricular stiffness. Lab Invest. 44, 49-54.
Bowers S.L., Banerjee I., Baudino T.A. (2010). The extracellular matrix: at the center of it all. J. Mol. Cell Cardiol. 48, 474-482.
Braunhut S.J., Moses M.A. (1994). Retinoids modulate endothelial cell production of matrix-degrading proteases and tissue inhibitors of metalloproteinases (TIMP). J. Biol. Chem. 269, 13472-13479.
Caulfield J.B., Borg T.K. (1979). The collagen network of the heart. Lab Invest. 40, 364-372.
Champlin A.K., Dorr D.L., Gates A.H. (1973). Determining the stage of the estrous cycle in the mouse by the appearance of the vagina. Biol. Reprod. 8, 491-494.
Chapman D., Weber K.T., Eghbali M. (1990). Regulation of fibrillar collagen types I and III and basement membrane type IV collagen gene expression in pressure overloaded rat myocardium. Circ. Res. 67, 787-794.
Cheng X.W., Obata K., Kuzuya M., Izawa H., Nakamura K., Asai E., Nagasaka T., Saka M., Kimata T., Noda A., Nagata K., Jin H., Shi G.P., Iguchi A., Murohara T., Yokota M. (2006). Elastolytic cathepsin induction/activation system exists in myocardium and is upregulated in hypertensive heart failure. Hypertension. 48, 979-987.
68
Chung E., Heimiller J., Leinwand L.A. (2012). Distinct cardiac transcriptional profiles defining pregnancy and exercise. PLoS. One. 7, e42297.
Cohn J.N., Bristow M.R., Chien K.R., Colucci W.S., Frazier O.H., Leinwand L.A., Lorell B.H., Moss A.J., Sonnenblick E.H., Walsh R.A., Mockrin S.C., Reinlib L. (1997). Report of the National Heart, Lung, and Blood Institute Special Emphasis Panel on Heart Failure Research. Circulation. 95, 766-770.
Cohn J.N., Ferrari R., Sharpe N. (2000). Cardiac remodeling--concepts and clinical implications: a consensus paper from an international forum on cardiac remodeling. Behalf of an international forum on cardiac remodeling. J. Am. Coll. Cardiol. 35, 569-582.
Coker M.L., Doscher M.A., Thomas C.V., Galis Z.S., Spinale F.G. (1999). Matrix metalloproteinase synthesis and expression in isolated LV myocyte preparations. Am. J. Physiol. 277, H777-H787.
Crawford S.E., Stellmach V., Murphy-Ullrich J.E., Ribeiro S.M., Lawler J., Hynes R.O., Boivin G.P., Bouck N. (1998). Thrombospondin-1 is a major activator of TGF-beta1 in vivo. Cell. 93, 1159-1170.
Creemers EE., Davis JN., Parkhurst AM., Leenders P., Dowdy KB., Hapke E., et al.(2003).Deficiency of TIMP-1 exacerbates LV remodeling after myocardial infarction in mice. Am J Physiol, Heart Circ Physiol ;284:H364–71.
Cui H., Shao C., Liu Q., Yu W., Fang J., Yu W., Ali A., Ding K. (2011). Heparanase enhances nerve-growth-factor-induced PC12 cell neuritogenesis via the p38 MAPK pathway. Biochem. J. 440, 273-282.
Daley W.P., Peters S.B., Larsen M. (2008). Extracellular matrix dynamics in development and regenerative medicine. J. Cell Sci. 121, 255-264.
Daniels S.R., Meyer R.A., Liang Y.C., Bove K.E. (1988). Echocardiographically determined left ventricular mass index in normal children, adolescents and young adults. J. Am. Coll. Cardiol. 12, 703-708.
Dhanaraj V., Ye Q.Z., Johnson L.L., Hupe D.J., Ortwine D.F., Dunbar J.B., Jr., Rubin J.R., Pavlovsky A., Humblet C., Blundell T.L. (1996). X-ray structure of a hydroxamate inhibitor complex of stromelysin catalytic domain and its comparison with members of the zinc metalloproteinase superfamily. Structure. 4, 375-386.
Dorn G.W., Robbins J., Sugden P.H. (2003). Phenotyping hypertrophy: eschew obfuscation. Circ. Res. 92, 1171-1175.
Egging D., van den B.F., Taylor G., Bristow J., Schalkwijk J. (2007). Interactions of human tenascin-X domains with dermal extracellular matrix molecules. Arch. Dermatol. Res. 298, 389-396.
69
Eghbali M., Blumenfeld O.O., Seifter S., Buttrick P.M., Leinwand L.A., Robinson T.F., Zern M.A., Giambrone M.A. (1989). Localization of types I, III and IV collagen mRNAs in rat heart cells by in situ hybridization. J. Mol. Cell Cardiol. 21, 103-113.
Eghbali M., Wang Y., Toro L., Stefani E. (2006). Heart hypertrophy during pregnancy: a better functioning heart? Trends Cardiovasc. Med. 16, 285-291.
Elkington P.T., O'Kane C.M., Friedland J.S. (2005). The paradox of matrix metalloproteinases in infectious disease. Clin. Exp. Immunol. 142, 12-20.
English W.R., Holtz B., Vogt G., Knauper V., Murphy G. (2001). Characterization of the role of the "MT-loop": an eight-amino acid insertion specific to progelatinase A (MMP2) activating membrane-type matrix metalloproteinases. J. Biol. Chem. 276, 42018-42026.
Fagard R.H. (1997). Impact of different sports and training on cardiac structure and function. Cardiol. Clin. 15, 397-412.
Fan D., Takawale A., Lee J., Kassiri Z. (2012). Cardiac fibroblasts, fibrosis and extracellular matrix remodeling in heart disease. Fibrogenesis. Tissue Repair. 5, 15.
Fassler R., Sasaki T., Timpl R., Chu M.L., Werner S. (1996). Differential regulation of fibulin, tenascin-C, and nidogen expression during wound healing of normal and glucocorticoid-treated mice. Exp. Cell Res. 222, 111-116.
Fedak PW., Moravec CS., McCarthy PM., Altamentova SM., Wong AP., Skrtic M., Verma S., Weisel RD., Li RK.(2006). Altered expression of disintegrin metalloproteinases and their inhibitor in human dilated cardiomyopathy. Circulation 113: 238–245.
Fedak PW., Moravec CS., McCarthy PM., Altamentova SM., Wong AP., Skrtic M., Verma S., Weisel RD., Li RK.(2006). Altered expression of disintegrin metalloproteinases and their inhibitor in human dilated cardiomyopathy. Circulation 113: 238–245.
Fedak P.W., Smookler D.S., Kassiri Z., Ohno N., Leco K.J., Verma S., Mickle D.A., Watson K.L., Hojilla C.V., Cruz W., Weisel R.D., Li R.K., Khokha R. (2004). TIMP-3 deficiency leads to dilated cardiomyopathy. Circulation. 110, 2401-2409.
Finan K.M., Hodge G., Reynolds A.M., Hodge S., Holmes M.D., Baker A.H., Reynolds P.N. (2006). In vitro susceptibility to the pro-apoptotic effects of TIMP-3 gene delivery translates to greater in vivo efficacy versus gene delivery for TIMPs-1 or -2. Lung Cancer. 53, 273-284.
Fingleton B. (2007). Matrix metalloproteinases as valid clinical targets. Curr. Pharm. Des. 13, 333-346.
Fomovsky G.M., Thomopoulos S., Holmes J.W. (2010). Contribution of extracellular matrix to the mechanical properties of the heart. J. Mol. Cell Cardiol. 48, 490-496.
70
Frangogiannis N.G. (2012). Matricellular proteins in cardiac adaptation and disease. Physiol Rev. 92, 635-688.
Frantz C., Stewart K.M., Weaver V.M. (2010). The extracellular matrix at a glance. J. Cell Sci. 123, 4195-4200.
Friehs I., Margossian R.E., Moran A.M., Cao-Danh H., Moses M.A., del Nido P.J. (2006). Vascular endothelial growth factor delays onset of failure in pressure-overload hypertrophy through matrix metalloproteinase activation and angiogenesis. Basic Res. Cardiol. 101, 204-213.
Fux L., Ilan N., Sanderson R.D., Vlodavsky I. (2009). Heparanase: busy at the cell surface. Trends Biochem. Sci. 34, 511-519.
Gao Y., Liu S., Huang J., Guo W., Chen J., Zhang L., Zhao B., Peng J., Wang A., Wang Y., Xu W., Lu S., Yuan M., Guo Q. (2014). The ECM-Cell Interaction of Cartilage Extracellular Matrix on Chondrocytes. Biomed. Res. Int. 2014, 648459.
Giudici C., Raynal N., Wiedemann H., Cabral W.A., Marini J.C., Timpl R., Bachinger H.P., Farndale R.W., Sasaki T., Tenni R. (2008). Mapping of SPARC/BM-40/osteonectin-binding sites on fibrillar collagens. J. Biol. Chem. 283, 19551-19560.
Go A.S., Mozaffarian D., Roger V.L., Benjamin E.J., Berry J.D., Blaha M.J., Dai S., Ford E.S., Fox C.S., Franco S., Fullerton H.J., Gillespie C., Hailpern S.M., Heit J.A., Howard V.J., Huffman M.D., Judd S.E., Kissela B.M., Kittner S.J., Lackland D.T., Lichtman J.H., Lisabeth L.D., Mackey R.H., Magid D.J., Marcus G.M., Marelli A., Matchar D.B., McGuire D.K., Mohler E.R., III, Moy C.S., Mussolino M.E., Neumar R.W., Nichol G., Pandey D.K., Paynter N.P., Reeves M.J., Sorlie P.D., Stein J., Towfighi A., Turan T.N., Virani S.S., Wong N.D., Woo D., Turner M.B. (2014). Heart disease and stroke statistics--2014 update: a report from the American Heart Association. Circulation. 129, e28-e292.
Goldsmith E.C., Hoffman A., Morales M.O., Potts J.D., Price R.L., McFadden A., Rice M., Borg T.K. (2004). Organization of fibroblasts in the heart. Dev. Dyn. 230, 787-794.
Goldsmith E.C., Carver W., McFadden A., Goldsmith J.G., Price R.L., Sussman M., Lorell B.H .,Cooper G and BorgT.K.(2003). Integrin shedding as a mechanism of cellular adaptation during cardiac growth. Am J. Physiol. Heart Circ Physiol . 284:H2227-2234.
Gonzalez A.M., Osorio J.C., Manlhiot C., Gruber D., Homma S., Mital S. (2007). Hypertrophy signaling during peripartum cardiac remodeling. Am. J. Physiol Heart Circ. Physiol. 293, H3008-H3013.
Graham H.K., Horn M., Trafford A.W. (2008). Extracellular matrix profiles in the progression to heart failure. European Young Physiologists Symposium Keynote Lecture-Bratislava 2007. Acta Physiol (Oxf). 194, 3-21.
71
Greenspan D.S., Byers M.G., Eddy R.L., Cheng W., Jani-Sait S., Shows T.B. (1992). Human collagen gene COL5A1 maps to the q34.2----q34.3 region of chromosome 9, near the locus for nail-patella syndrome. Genomics. 12, 836-837.
Grimm D., Kromer E.P., Bocker W., Bruckschlegel G., Holmer S.R., Riegger G.A., Schunkert H. (1998). Regulation of extracellular matrix proteins in pressure-overload cardiac hypertrophy: effects of angiotensin converting enzyme inhibition. J. Hypertens. 16, 1345-1355.
Gu Y.C., Nilsson K., Eng H., Ekblom M. (2000). Association of extracellular matrix proteins fibulin-1 and fibulin-2 with fibronectin in bone marrow stroma. Br. J. Haematol. 109, 305-313.
Hamalainen E.R., Jones T.A., Sheer D., Taskinen K., Pihlajaniemi T., Kivirikko K.I. (1991). Molecular cloning of human lysyl oxidase and assignment of the gene to chromosome 5q23.3-31.2. Genomics. 11, 508-516.
Hay E.D. (1991). Cell Biology of Extracellular Matrix. Second edition. New York. Plenum Press
Hein S., Schaper J. (2001). The extracellular matrix in normal and diseased myocardium. J. Nucl. Cardiol. 8, 188-196.
Heling A., Zimmermann R., Kostin S., Maeno Y., Hein S., Devaux B., Bauer E., Klovekorn W.P., Schlepper M., Schaper W., Schaper J. (2000). Increased expression of cytoskeletal, linkage, and extracellular proteins in failing human myocardium. Circ. Res. 86, 846-853.
Hellman U., Hellström M., Mörner S., Engström-Laurent A., Aberg AM., Oliviero P., Samuel JL., Waldenström A.(2008).Parallel upregulation of FGF-2 and hyaluronan during development of cardiac hypertrophy in rat,” Cell and Tissue Research, vol. 332,no. 1, pp. 49–56.
Hellström M.,Johansson B., Engström-Laurent A.(2006).Hyaluronan and its receptor CD44 in the heart of newborn and adult rats.Anatomical Record—Part A, vol. 288, no. 6, pp. 587–592.
Henderson B.C., Sen U., Reynolds C., Moshal K.S., Ovechkin A., Tyagi N., Kartha G.K., Rodriguez W.E., Tyagi S.C. (2007). Reversal of systemic hypertension-associated cardiac remodeling in chronic pressure overload myocardium by ciglitazone. Int. J. Biol. Sci. 3, 385-392.
Heymans S., Luttun A., Nuyens D., Theilmeier G., Creemers E., Moons L., Dyspersin G.D., Cleutjens J.P., Shipley M., Angellilo A., Levi M., Nube O., Baker A., Keshet E., Lupu F., Herbert J.M., Smits J.F., Shapiro S.D., Baes M., Borgers M., Collen D., Daemen M.J., Carmeliet P. (1999). Inhibition of plasminogen activators or matrix
72
metalloproteinases prevents cardiac rupture but impairs therapeutic angiogenesis and causes cardiac failure. Nat. Med. 5, 1135-1142.
Heymans,S. Schroen,B.Vermeersch,P. Milting,H. Gao,F. Kassner,A. Gillijns,H. Herijgers,P. Flameng,W. Carmeliet,P. Van de,Werf F. Pinto,Y.M. Janssens,S.(2005).Increased cardiac expression of tissue inhibitor of metalloproteinase-1 and tissue inhibitor of metalloproteinase-2 is related to cardiac fibrosis and dysfunction in the chronic pressure-overloaded human heart PM:16103240.
Hilgenberg L.G., Pham B., Ortega M., Walid S., Kemmerly T., O'Dowd D.K., Smith M.A. (2009). Agrin regulation of alpha3 sodium-potassium ATPase activity modulates cardiac myocyte contraction. J. Biol. Chem. 284, 16956-16965.
Hodgson J. (1995). Remodeling MMPIs. Biotechnology (N. Y. ). 13, 554-557.
Humphries M.J., Travis M.A., Clark K., Mould A.P. (2004). Mechanisms of integration of cells and extracellular matrices by integrins. Biochem. Soc. Trans. 32, 822-825.
Iorga A., Dewey S., Partow-Navid R., Gomes A.V., Eghbali M. (2012). Pregnancy is associated with decreased cardiac proteasome activity and oxidative stress in mice. PLoS. One. 7, e48601.
Iruela-Arispe M.L., Sage E.H. (1991). Expression of type VIII collagen during morphogenesis of the chicken and mouse heart. Dev. Biol. 144, 107-118.
Jane-Lise S., Corda S., Chassagne C., Rappaport L. (2000). The extracellular matrix and the cytoskeleton in heart hypertrophy and failure. Heart Fail. Rev. 5, 239-250.
Janeczko R.A., Ramirez F. (1989). Nucleotide and amino acid sequences of the entire human alpha 1 (III) collagen. Nucleic Acids Res. 17, 6742.
Jin H, Yang R, LiW, Lu H, Ryan AM, Ogasawara AK (2000)Effects of exercise training on cardiac function, gene expression, and apoptosis in rats. Am J Physiol Heart Circ Physiol ;279:H2994–H3002.
Jing L., Zhou L.J., Zhang F.M., Li W.M., Sang Y. (2011). Tenascin-x facilitates myocardial fibrosis and cardiac remodeling through transforming growth factor-beta1 and peroxisome proliferator-activated receptor gamma in alcoholic cardiomyopathy. Chin Med. J. (Engl. ). 124, 390-395.
Kallio J.P., Hopkins-Donaldson S., Baker A.H., Kahari V.M. (2011). TIMP-3 promotes apoptosis in nonadherent small cell lung carcinoma cells lacking functional death receptor pathway. Int. J. Cancer. 128, 991-996.
Kanaki T., Morisaki N., Bujo H., Takahashi K., Ishii I., Saito Y. (2000). The regulatory expression of procollagen COOH-terminal proteinase enhancer in the proliferation of vascular smooth muscle cells. Biochem. Biophys. Res. Commun. 270, 1049-1054.
73
Kanji S., Das M., Aggarwal R., Lu J., Joseph M., Pompili V.J., Das H. (2014). Nanofiber-expanded human umbilical cord blood-derived CD34(+) cell therapy accelerates cutaneous wound closure in NOD/SCID mice. J. Cell Mol. Med. 18, 685-697.
Karsenty G., de C.B. (1991). Conservation of binding sites for regulatory factors in the coordinately expressed alpha 1 (I) and alpha 2 (I) collagen promoters. Biochem. Biophys. Res. Commun. 177, 538-544.
Kassiri Z., Oudit G.Y., Sanchez O., Dawood F., Mohammed F.F., Nuttall R.K., Edwards D.R., Liu P.P., Backx P.H., Khokha R. (2005). Combination of tumor necrosis factor-alpha ablation and matrix metalloproteinase inhibition prevents heart failure after pressure overload in tissue inhibitor of metalloproteinase-3 knock-out mice. Circ. Res. 97, 380-390.
Kenagy R.D., Plaas A.H., Wight T.N. (2006). Versican degradation and vascular disease. Trends Cardiovasc. Med. 16, 209-215.
Kern C.B., Twal W.O., Mjaatvedt C.H., Fairey S.E., Toole B.P., Iruela-Arispe M.L., Argraves W.S. (2006). Proteolytic cleavage of versican during cardiac cushion morphogenesis. Dev. Dyn. 235, 2238-2247.
Kessler-Icekson G., Schlesinger H., Freimann S., Kessler E. (2006). Expression of procollagen C-proteinase enhancer-1 in the remodeling rat heart is stimulated by aldosterone. Int. J. Biochem. Cell Biol. 38, 358-365.
Khoshnoodi J., Pedchenko V., Hudson B.G. (2008). Mammalian collagen IV. Microsc. Res. Tech. 71, 357-370.
Kielty C.M. (2006). Elastic fibres in health and disease. Expert. Rev. Mol. Med. 8, 1-23.
Kitamura M., Shimizu M., Ino H., Okeie K., Yamaguchi M., Funjno N., Mabuchi H., Nakanishi I. (2001). Collagen remodeling and cardiac dysfunction in patients with hypertrophic cardiomyopathy: the significance of type III and VI collagens. Clin. Cardiol. 24, 325-329.
Kizaki K., Okada M., Ito R., Yoshioka K., Hashizume K., Mutoh K., Hara Y. (2005). Induction of heparanase gene expression in ventricular myocardium of rats with isoproterenol-induced cardiac hypertrophy. Biol. Pharm. Bull. 28, 2331-2334.
Klawitter M., Quero L., Bertolo A., Mehr M., Stoyanov J., Nerlich A.G., Klasen J., Aebli N., Boos N., Wuertz K. (2011). Human MMP28 expression is unresponsive to inflammatory stimuli and does not correlate to the grade of intervertebral disc degeneration. J. Negat. Results Biomed. 10, 9.
Krenning G., Zeisberg E.M., Kalluri R. (2010). The origin of fibroblasts and mechanism of cardiac fibrosis. J. Cell Physiol. 225, 631-637.
74
Kuo H.J., Maslen C.L., Keene D.R., Glanville R.W. (1997). Type VI collagen anchors endothelial basement membranes by interacting with type IV collagen. J. Biol. Chem. 272, 26522-26529.
Kuula H., Salo T., Pirila E., Hagstrom J., Luomanen M., Gutierrez-Fernandez A., Romanos G.E., Sorsa T. (2008). Human beta-defensin-1 and -2 and matrix metalloproteinase-25 and -26 expression in chronic and aggressive periodontitis and in peri-implantitis. Arch. Oral Biol. 53, 175-186.
Lebbink R.J., Raynal N., de R.T., Bihan D.G., Farndale R.W., Meyaard L. (2009). Identification of multiple potent binding sites for human leukocyte associated Ig-like receptor LAIR on collagens II and III. Matrix Biol. 28, 202-210.
LeBleu V.S., Macdonald B., Kalluri R. (2007). Structure and function of basement membranes. Exp. Biol. Med. (Maywood. ). 232, 1121-1129.
Lee S.K., Yi C.H., Kim M.H., Cheong J.Y., Cho S.W., Yang S.J., Kwack K. (2008). Genetic association between functional haplotype of collagen type III alpha 1 and chronic hepatitis B and cirrhosis in Koreans. Tissue Antigens. 72, 539-548.
Leitinger B., Hohenester E. (2007). Mammalian collagen receptors. Matrix Biol. 26, 146-155.
Levy D., Garrison R.J., Savage D.D., Kannel W.B., Castelli W.P. (1990). Prognostic implications of echocardiographically determined left ventricular mass in the Framingham Heart Study. N. Engl. J. Med. 322, 1561-1566.
Li J., Umar S., Amjedi M., Iorga A., Sharma S., Nadadur R.D., Regitz-Zagrosek V., Eghbali M. (2012). New frontiers in heart hypertrophy during pregnancy. Am. J. Cardiovasc. Dis. 2, 192-207.
Li Y.Y., McTiernan C.F., Feldman A.M. (2000). Interplay of matrix metalloproteinases, tissue inhibitors of metalloproteinases and their regulators in cardiac matrix remodeling. Cardiovasc. Res. 46, 214-224.
Lindsey M.L., Zamilpa R. (2012). Temporal and spatial expression of matrix metalloproteinases and tissue inhibitors of metalloproteinases following myocardial infarction. Cardiovasc. Ther. 30, 31-41.
Lockhart M., Wirrig E., Phelps A., Wessels A. (2011). Extracellular matrix and heart development. Birth Defects Res. A Clin. Mol. Teratol. 91, 535-550.
Lodish Freeman. (2007). The Extracellular Matrix. 820.
Lohi J., Wilson C.L., Roby J.D., Parks W.C. (2001). Epilysin, a novel human matrix metalloproteinase (MMP-28) expressed in testis and keratinocytes and in response to injury. J. Biol. Chem. 276, 10134-10144.
75
Ma Y., Halade G.V., Zhang J., Ramirez T.A., Levin D., Voorhees A., Jin Y.F., Han H.C., Manicone A.M., Lindsey M.L. (2013). Matrix metalloproteinase-28 deletion exacerbates cardiac dysfunction and rupture after myocardial infarction in mice by inhibiting M2 macrophage activation. Circ. Res. 112, 675-688.
Malfait F., Symoens S., Coucke P., Nunes L., De A.S., De P.A. (2006). Total absence of the alpha2(I) chain of collagen type I causes a rare form of Ehlers-Danlos syndrome with hypermobility and propensity to cardiac valvular problems. J. Med. Genet. 43, e36.
Manabe I., Shindo T., Nagai R. (2002). Gene expression in fibroblasts and fibrosis: involvement in cardiac hypertrophy. Circ. Res. 91, 1103-1113.
Marchenko G.N., Strongin A.Y. (2001). MMP-28, a new human matrix metalloproteinase with an unusual cysteine-switch sequence is widely expressed in tumors. Gene. 265, 87-93.
Marieb E.N.&.H.k. (2013). Human Anatomy and Physiology. Ninth edition.18,659-671 Benjamin-Cummings Publishing Company. 9780321743268.
Masuda M., Igarashi H., Kano M., Yoshikura H. (1998). Effects of procollagen C-proteinase enhancer protein on the growth of cultured rat fibroblasts revealed by an excisable retroviral vector. Cell Growth Differ. 9, 381-391.
Matsumura S., Iwanaga S., Mochizuki S., Okamoto H., Ogawa S., Okada Y. (2005). Targeted deletion or pharmacological inhibition of MMP-2 prevents cardiac rupture after myocardial infarction in mice. J. Clin. Invest. 115, 599-609.
Mercado M.L., Amenta A.R., Hagiwara H., Rafii M.S., Lechner B.E., Owens R.T., McQuillan D.J., Froehner S.C., Fallon J.R. (2006). Biglycan regulates the expression and sarcolemmal localization of dystrobrevin, syntrophin, and nNOS. FASEB J. 20, 1724-1726.
Mishra P.K., Givvimani S., Chavali V., Tyagi S.C. (2013). Cardiac matrix: a clue for future therapy. Biochim. Biophys. Acta. 1832, 2271-2276.
Mone S.M., Sanders S.P., Colan S.D. (1996). Control mechanisms for physiological hypertrophy of pregnancy. Circulation. 94, 667-672.
Mori S, Gibson G, McTiernan CF(2006).Differential expression of MMPs and TIMPs in moderate and severe heart failure in a transgenic model. J Card Fail ;12:314–325.
Motrescu E.R., Blaise S., Etique N., Messaddeq N., Chenard M.P., Stoll I., Tomasetto C., Rio M.C. (2008). Matrix metalloproteinase-11/stromelysin-3 exhibits collagenolytic function against collagen VI under normal and malignant conditions. Oncogene. 27, 6347-6355.
76
Mujumdar V.S., Tyagi S.C. (1999). Temporal regulation of extracellular matrix components in transition from compensatory hypertrophy to decompensatory heart failure. J. Hypertens. 17, 261-270.
Nakajima M., Irimura T., Di F.D., Di F.N., Nicolson G.L. (1983). Heparan sulfate degradation: relation to tumor invasive and metastatic properties of mouse B16 melanoma sublines. Science. 220, 611-613.
Ngo S.T., Noakes P.G., Phillips W.D. (2007). Neural agrin: a synaptic stabiliser. Int. J. Biochem. Cell Biol. 39, 863-867.
Ogata I., Auster A.S., Matsui A., Greenwel P., Geerts A., D'Amico T., Fujiwara K., Kessler E., Rojkind M. (1997). Up-regulation of type I procollagen C-proteinase enhancer protein messenger RNA in rats with CCl4-induced liver fibrosis. Hepatology. 26, 611-617.
Okuyama K. (2008). Revisiting the molecular structure of collagen. Connect. Tissue Res. 49, 299-310.
Olin A.I., Morgelin M., Sasaki T., Timpl R., Heinegard D., Aspberg A. (2001). The proteoglycans aggrecan and Versican form networks with fibulin-2 through their lectin domain binding. J. Biol. Chem. 276, 1253-1261.
Padmavati P., Savita S., Shivaprasad B.M., Kripal K., Rithesh K. (2013). mRNA expression of MMP-28 (Epilysin) in gingival tissues of chronic and aggressive periodontitis patients: a reverse transcriptase PCR study. Dis. Markers. 35, 113-118.
Pan T.C., Sasaki T., Zhang R.Z., Fassler R., Timpl R., Chu M.L. (1993). Structure and expression of fibulin-2, a novel extracellular matrix protein with multiple EGF-like repeats and consensus motifs for calcium binding. J. Cell Biol. 123, 1269-1277.
Pankov R., Yamada K.M. (2002). Fibronectin at a glance. J. Cell Sci. 115, 3861-3863.
Pelouch V., Dixon I.M., Golfman L., Beamish R.E., Dhalla N.S. (1993). Role of extracellular matrix proteins in heart function. Mol. Cell Biochem. 129, 101-120.
Pillarisetti S., Paka L., Sasaki A., Vanni-Reyes T., Yin B., Parthasarathy N., Wagner W.D., Goldberg I.J. (1997). Endothelial cell heparanase modulation of lipoprotein lipase activity. Evidence that heparan sulfate oligosaccharide is an extracellular chaperone. J. Biol. Chem. 272, 15753-15759.
Planutiene M., Planutis K., Holcombe R.F. (2011). Lymphoid enhancer-binding factor 1, a representative of vertebrate-specific Lef1/Tcf1 sub-family, is a Wnt-beta-catenin pathway target gene in human endothelial cells which regulates matrix metalloproteinase-2 expression and promotes endothelial cell invasion. Vasc. Cell. 3, 28.
Pluim B.M., Zwinderman A.H., van der L.A., van der Wall E.E. (2000). The athlete's heart. A meta-analysis of cardiac structure and function. Circulation. 101, 336-344.
77
Potts J.R., Campbell I.D. (1996). Structure and function of fibronectin modules. Matrix Biol. 15, 313-320.
Powell D.W., Mifflin R.C., Valentich J.D., Crowe S.E., Saada J.I., West A.B. (1999). Myofibroblasts. I. Paracrine cells important in health and disease. Am. J. Physiol. 277, C1-C9.
Raugi G.J., Mullen J.S., Bark D.H., Okada T., Mayberg M.R. (1990). Thrombospondin deposition in rat carotid artery injury. Am. J. Pathol. 137, 179-185.
Retief E., Parker M.I., Retief A.E. (1985). Regional chromosome mapping of human collagen genes alpha 2(I) and alpha 1(I) (COLIA2 and COLIA1). Hum. Genet. 69, 304-308.
Ritelli M., Dordoni C., Venturini M., Chiarelli N., Quinzani S., Traversa M., Zoppi N., Vascellaro A., Wischmeijer A., Manfredini E., Garavelli L., Calzavara-Pinton P., Colombi M. (2013). Clinical and molecular characterization of 40 patients with classic Ehlers-Danlos syndrome: identification of 18 COL5A1 and 2 COL5A2 novel mutations. Orphanet. J. Rare. Dis. 8, 58.
Rod R.Seeley, Trent D.Stephens, Philip Tate. (2007). Heart. 323-335.
Ross R.S., Borg T.K. (2001). Integrins and the myocardium. Circ. Res. 88, 1112-1119.
Roulet M., Ruggiero F., Karsenty G., LeGuellec D.(2007).A comprehensive study of the spatial and temporal expression of the col5a1 gene in mouse embryos: a clue for understanding collagen V function in developing connective tissues.Cell Tissue Res. Feb;327(2):323-32.
Rupp F., Payan D.G., Magill-Solc C., Cowan D.M., Scheller R.H. (1991). Structure and expression of a rat agrin. Neuron. 6, 811-823.
Sasaki T., Gohring W., Pan T.C., Chu M.L., Timpl R. (1995). Binding of mouse and human fibulin-2 to extracellular matrix ligands. J. Mol. Biol. 254, 892-899.
Sasaki T., Mann K., Wiedemann H., Gohring W., Lustig A., Engel J., Chu M.L., Timpl R. (1997). Dimer model for the microfibrillar protein fibulin-2 and identification of the connecting disulfide bridge. EMBO J. 16, 3035-3043.
Sato S., Ashraf M., Millard R.W., Fujiwara H., Schwartz A. (1983). Connective tissue changes in early ischemia of porcine myocardium: an ultrastructural study. J. Mol. Cell Cardiol. 15, 261-275.
Schannwell C.M., Zimmermann T., Schneppenheim M., Plehn G., Marx R., Strauer B.E. (2002). Left ventricular hypertrophy and diastolic dysfunction in healthy pregnant women. Cardiology. 97, 73-78.
78
Schellings MW., van Almen GC., Sage EH.,Heymans S.(2009).Thrombospondins in the heart:Potential functions in cardiac remodeling. J Cell Commun Signal ;3:201–213.
Schonherr E., Witsch-Prehm P., Harrach B., Robenek H., Rauterberg J., Kresse H. (1995). Interaction of biglycan with type I collagen. J. Biol. Chem. 270, 2776-2783.
Seo D.W., Li H., Guedez L., Wingfield P.T., Diaz T., Salloum R., Wei B.Y., Stetler-Stevenson W.G. (2003). TIMP-2 mediated inhibition of angiogenesis: an MMP-independent mechanism. Cell. 114, 171-180.
Seo D.W., Saxinger W.C., Guedez L., Cantelmo A.R., Albini A., Stetler-Stevenson W.G. (2011). An integrin-binding N-terminal peptide region of TIMP-2 retains potent angio-inhibitory and anti-tumorigenic activity in vivo. Peptides. 32, 1840-1848.
Severs N.J. (2000). The cardiac muscle cell. Bioessays. 22, 188-199.
Sezaki S., Hirohata S., Iwabu A., Nakamura K., Toeda K., Miyoshi T., Yamawaki H., Demircan K., Kusachi S., Shiratori Y., Ninomiya Y. (2005). Thrombospondin-1 is induced in rat myocardial infarction and its induction is accelerated by ischemia/reperfusion. Exp. Biol. Med. (Maywood. ). 230, 621-630.
Sharov V.G., Kostin S., Todor A., Schaper J., Sabbah H.N. (2005). Expression of cytoskeletal, linkage and extracellular proteins in failing dog myocardium. Heart Fail. Rev. 10, 297-303.
Sheibani N., Frazier W.A. (1998). Down-regulation of platelet endothelial cell adhesion molecule-1 results in thrombospondin-1 expression and concerted regulation of endothelial cell phenotype. Mol. Biol. Cell. 9, 701-713.
Shuttleworth C.A. (1997). Type VIII collagen. Int. J. Biochem. Cell Biol. 29, 1145-1148.
Souders C.A., Bowers S.L., Baudino T.A. (2009). Cardiac fibroblast: the renaissance cell. Circ. Res. 105, 1164-1176.
Spoto B., Testa A., Parlongo R.M., Tripepi G., D'Arrigo G., Mallamaci F., Zoccali C. (2012). Tissue inhibitor of metalloproteinases (TIMP-1), genetic markers of insulin resistance and cardiomyopathy in patients with kidney failure. Nephrol. Dial. Transplant. 27, 2440-2445.
Strom A., Olin A.I., Aspberg A., Hultgardh-Nilsson A. (2006). Fibulin-2 is present in murine vascular lesions and is important for smooth muscle cell migration. Cardiovasc. Res. 69, 755-763.
Stroud J.D., Baicu C.F., Barnes M.A., Spinale F.G., Zile M.R. (2002). Viscoelastic properties of pressure overload hypertrophied myocardium: effect of serine protease treatment. Am. J. Physiol Heart Circ. Physiol. 282, H2324-H2335.
79
Superti-Furga A., Gugler E., Gitzelmann R., Steinmann B. (1988). Ehlers-Danlos syndrome type IV: a multi-exon deletion in one of the two COL3A1 alleles affecting structure, stability, and processing of type III procollagen. J. Biol. Chem. 263, 6226-6232.
Sweeney S.M., Guy C.A., Fields G.B., San Antonio J.D. (1998). Defining the domains of type I collagen involved in heparin- binding and endothelial tube formation. Proc. Natl. Acad. Sci. U. S. A. 95, 7275-7280.
Swynghedauw B. (1999). Molecular mechanisms of myocardial remodeling. Physiol Rev. 79, 215-262.
Tee M.K., Thomson A.A., Bristow J., Miller W.L. (1995). Sequences promoting the transcription of the human XA gene overlapping P450c21A correctly predict the presence of a novel, adrenal-specific, truncated form of tenascin-X. Genomics. 28, 171-178.
Tian H., Cimini M., Fedak P.W., Altamentova S., Fazel S., Huang M.L., Weisel R.D., Li R.K. (2007). TIMP-3 deficiency accelerates cardiac remodeling after myocardial infarction. J. Mol. Cell Cardiol. 43, 733-743.
Toole B.P. (2004). Hyaluronan: from extracellular glue to pericellular cue. Nat. Rev. Cancer. 4, 528-539.
Traupe H., van den Ouweland A.M., van Oost B.A., Vogel W., Vetter U., Warren S.T., Rocchi M., Darlison M.G., Ropers H.H. (1992). Fine mapping of the human biglycan (BGN) gene within the Xq28 region employing a hybrid cell panel. Genomics. 13, 481-483.
Truter S.L., Catanzaro D.F., Supino P.G., Gupta A., Carter J., Herrold E.M., Dumlao T.F., Borer J.S. (2009). Differential expression of matrix metalloproteinases and tissue inhibitors and extracellular matrix remodeling in aortic regurgitant hearts. Cardiology. 113, 161-168.
Tryggvason K. (1993). The laminin family. Curr. Opin. Cell Biol. 5, 877-882.
Tsuda,T., Wang,H.,Timpl,R., Chu,M.L.(2001).Fibulin-2 expression marks transformed mesenchymal cells in developing cardiac valves, aortic arch vessels, and coronary vessels.Sep;222(1):89-100.
Tyagi S.C., Ratajska A., Weber K.T. (1993). Myocardial matrix metalloproteinase(s): localization and activation. Mol. Cell Biochem. 126, 49-59.
Umar S., Hessel M., Steendijk P., Bax W., Schutte C., Schalij M., van der W.E., Atsma D., van der L.A. (2007). Activation of signaling molecules and matrix metalloproteinases in right ventricular myocardium of rats with pulmonary hypertension. Pathol. Res. Pract. 203, 863-872.
80
Umar S, Nadadur R, Iorga A, Amjedi M, Matori H, Eghbali M. (2012).Cardiac structural and hemodynamic changes associated with physiological heart hypertrophy of pregnancy are reversed postpartum. J Appl Physiol.113,1253–1259.
van der Slot-Verhoeven AJ, van Dura E.A., Attema J., Blauw B., Degroot J., Huizinga T.W., Zuurmond A.M., Bank R.A. (2005). The type of collagen cross-link determines the reversibility of experimental skin fibrosis. Biochim. Biophys. Acta. 1740, 60-67.
Vanhoutte D., Heymans S. (2010). TIMPs and cardiac remodeling: 'Embracing the MMP-independent-side of the family'. J. Mol. Cell Cardiol. 48, 445-453.
Vanhoutte D., Schellings M., Pinto Y., Heymans S. (2006). Relevance of matrix metalloproteinases and their inhibitors after myocardial infarction: a temporal and spatial window. Cardiovasc. Res. 69, 604-613.
Villarreal F.J., Griffin M., Omens J., Dillmann W., Nguyen J., Covell J. (2003). Early short-term treatment with doxycycline modulates postinfarction left ventricular remodeling. Circulation. 108, 1487-1492.
Visse R., Nagase H. (2003). Matrix metalloproteinases and tissue inhibitors of metalloproteinases: structure, function, and biochemistry. Circ. Res. 92, 827-839.
Voss B., Rauterberg J. (1986). Localization of collagen types I, III, IV and V, fibronectin and laminin in human arteries by the indirect immunofluorescence method. Pathol. Res. Pract. 181, 568-575.
Walsh L.A., Cooper C.A., Damjanovski S. (2007). Soluble membrane-type 3 matrix metalloprioteinase causes changes in gene expression and increased gelatinase activity during Xenopus laevis development. Int. J. Dev. Biol. 51, 389-395.
Wang,D. Oparil,S.Feng,J.A.Li,P. Perry,G. Chen,L.B. Dai,M. John,S.W.Chen,Y.F.(2003)Effects of pressure overload on extracellular matrix expression in the heart of the atrial natriuretic peptide-null mouse.Hypertension.PM:12756220
Wayne D.Comper.(1996). Extracellular. Matrix. Harwood Academic, Reading.UK. 23-67.
Weber K.T. (1989). Cardiac interstitium in health and disease: the fibrillar collagen network. J. Am. Coll. Cardiol. 13, 1637-1652.
Weber K.T., Brilla C.G., Janicki J.S. (1993). Myocardial fibrosis: functional significance and regulatory factors. Cardiovasc. Res. 27, 341-348.
Weber K.T., Janicki J.S., Shroff S.G., Pick R., Chen R.M., Bashey R.I. (1988). Collagen remodeling of the pressure-overloaded, hypertrophied nonhuman primate myocardium. Circ. Res. 62, 757-765.
81
Wei J.Y., Spurgeon H.A., Lakatta E.G. (1984). Excitation-contraction in rat myocardium: alterations with adult aging. Am. J. Physiol. 246, H784-H791.
Werner S.R., Dotzlaf J.E., Smith R.C. (2008). MMP-28 as a regulator of myelination. BMC. Neurosci. 9, 83.
Werner S.R., Mescher A.L., Neff A.W., King M.W., Chaturvedi S., Duffin K.L., Harty M.W., Smith R.C. (2007). Neural MMP-28 expression precedes myelination during development and peripheral nerve repair. Dev. Dyn. 236, 2852-2864.
Wight T.N., Merrilees M.J. (2004). Proteoglycans in atherosclerosis and restenosis: key roles for versican. Circ. Res. 94, 1158-1167.
Wolf F.W., Eddy R.L., Shows T.B., Dixit V.M. (1990). Structure and chromosomal localization of the human thrombospondin gene. Genomics. 6, 685-691.
Wolfgang Kühnel.(2003). Color atlas of cytology, histology, and microscopic anatomy. 4th edition .122. Thieme .9781588901750.
Xiao J., Li J., Xu T., Lv D., Shen B., Song Y., Xu J. (2014).Pregnancy-induced physiological hypertrophy protects against cardiac ischemia-reperfusion injury. PM:24427343.
Xin M., Olson E.N., Bassel-Duby R. (2013). Mending broken hearts: cardiac development as a basis for adult heart regeneration and repair. Nat. Rev. Mol. Cell Biol. 14, 529-541.
Yabluchanskiy A., Chilton R.J., Lindsey M.L. (2013). Left ventricular remodeling: one small step for the extracellular matrix will translate to a giant leap for the myocardium. Congest. Heart Fail. 19, E5-E8.
Yin F.C., Spurgeon H.A., Rakusan K., Weisfeldt M.L., Lakatta E.G. (1982). Use of tibial length to quantify cardiac hypertrophy: application in the aging rat. Am. J. Physiol. 243, H941-H947.
Yoneyama T., Kasuya H., Onda H., Akagawa H., Hashiguchi K., Nakajima T., Hori T., Inoue I. (2004). Collagen type I alpha2 (COL1A2) is the susceptible gene for intracranial aneurysms. Stroke. 35, 443-448.
Yu Q., Vazquez R., Zabadi S., Watson R.R., Larson D.F. (2010). T-lymphocytes mediate left ventricular fibrillar collagen cross-linking and diastolic dysfunction in mice. Matrix Biol. 29, 511-518.
Zetser A., Levy-Adam F., Kaplan V., Gingis-Velitski S., Bashenko Y., Schubert S., Flugelman M.Y., Vlodavsky I., Ilan N. (2004). Processing and activation of latent heparanase occurs in lysosomes. J. Cell Sci. 117, 2249-2258.
82
Zhang, H.Y., Chu, M.L., Pan, T.C., Sasaki, T., Timpl, R. & Ekblom, P. (1995) Extracellular matrix protein fibulin-2 is expressed in the embryonic endocardial cushion tissue and is a prominent component of valves in adult heart. Dev. Biol., 167, 18–26. Zhang R.Z., Pan T.C., Zhang Z.Y., Mattei M.G., Timpl R., Chu M.L. (1994). Fibulin-2 (FBLN2): human cDNA sequence, mRNA expression, and mapping of the gene on human and mouse chromosomes. Genomics. 22, 425-430.
Zhao Y., Jia L., Mao X., Xu H., Wang B., Liu Y. (2009). siRNA-targeted COL8A1 inhibits proliferation, reduces invasion and enhances sensitivity to D-limonence treatment in hepatocarcinoma cells. IUBMB. Life. 61, 74-79.
Zhu S., Zhou Y., Wang L., Zhang J., Wu H., Xiong J., Zhang J., Tian Y., Wang C., Wu H. (2011). Transcriptional upregulation of MT2-MMP in response to hypoxia is promoted by HIF-1alpha in cancer cells. Mol. Carcinog. 50, 770-780.
Zimmermann D.R., Dours-Zimmermann M.T. (2008). Extracellular matrix of the central nervous system: from neglect to challenge. Histochem. Cell Biol. 130, 635-653.