Embed Size (px)
Citation preview
Notes to PF Financial Statements
1
GGEENNEERRAALL INFORMATION ABOUT THE PROVIDENT FUND Description of the Provident Fund
The UNRWA Provident Fund (PF) is a retirement benefit plan, which applies to all eligible
area staff members; the participation in the provident fund is mandatory, the PF benefit
becomes eligible to participate after 6 months of service. It is a defined contribution plan,
whereby the amounts to be paid as retirement benefits are determined by contributions paid to
the fund together with investment earnings thereon. The PF had 31,714 members as at 31
December 2013. Staff contribution is a mandatory 7.5% of basic salary and is matched by
the Agency contribution of 15%. Staff members can also make additional voluntary
contributions that can reach a maximum limit of 50% of the basic salary. As at 31 December
2013 the PF had 1,105 members enrolled in the voluntary contribution scheme. The PF is
administered by the Provident Fund Secretariat (PFS) and two committees, the Provident
Fund Committee (PFC) and the Investment Advisory Committee (IAC), which provide
additional governance. The Commissioner-General has the ultimate authority over the
Provident Fund.
Provident Fund Benefits
A staff member who is a participant in the Provident Fund shall, upon separation from the
Agency's service, be paid Provident Fund benefits as follows:
(A) A staff Provident Fund benefit equal to the balance of staff credits in his/her account
current to the date of separation including both mandatory and voluntary
contributions; and
(B) An Agency Provident Fund benefit equal to the balance of Agency credits in his/her
account current to the date of separation; and
(C) In addition, the income earned each year by the Provident Fund assets, which is
credited to the participants account.
Notes to PF Financial Statements
2
AAddooppttiioonn ooff NNeeww aanndd RReevviisseedd SSttaannddaarrddss
UNRWA is adopting all of the new and revised Standards and Interpretations issued by the
International Accounting Standards Board (the IASB) and the International Financial
Reporting Interpretations Committee (the IFRIC) of the IASB that are relevant to its
operations and effective for annual reporting periods beginning on 1 January 2013.
IInnvveessttmmeennttss aanndd AAsssseett AAllllooccaattiioonn
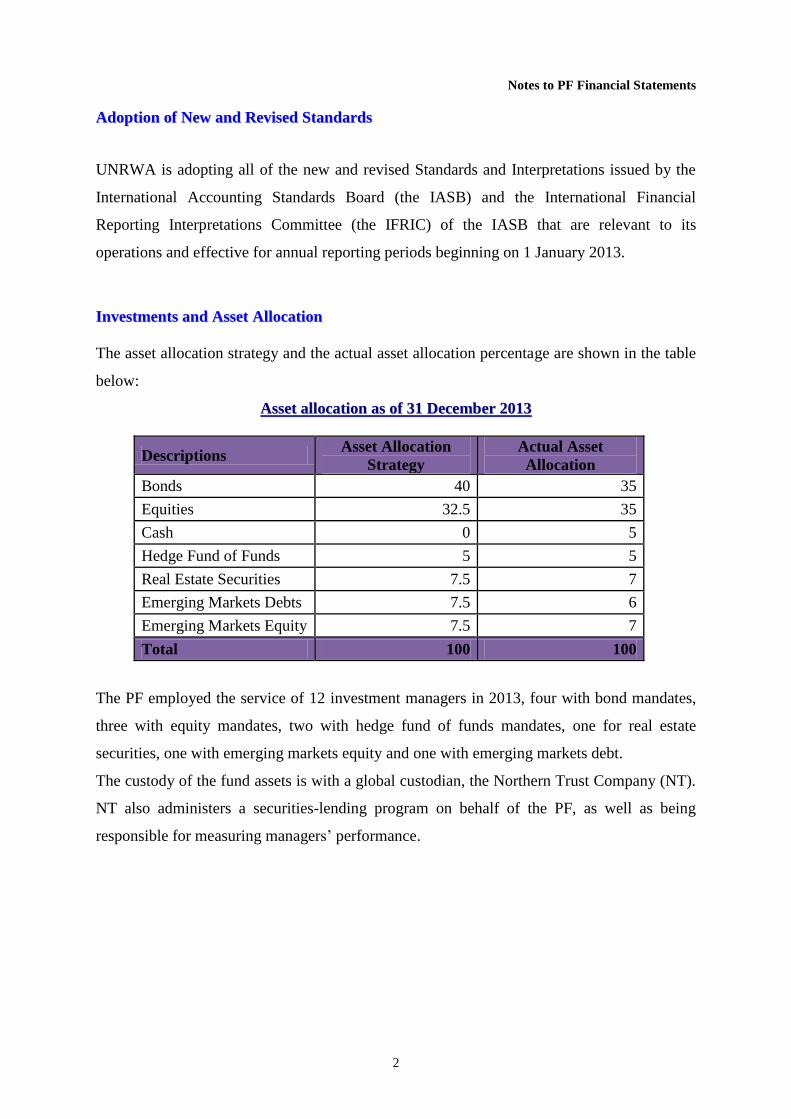
The asset allocation strategy and the actual asset allocation percentage are shown in the table
below:
AAsssseett aallllooccaattiioonn aass ooff 3311 DDeecceemmbbeerr 22001133
Descriptions Asset Allocation
Strategy
Actual Asset
Allocation
Bonds 40 35
Equities 32.5 35
Cash 0 5
Hedge Fund of Funds 5 5
Real Estate Securities 7.5 7
Emerging Markets Debts 7.5 6
Emerging Markets Equity 7.5 7
Total 100 100
The PF employed the service of 12 investment managers in 2013, four with bond mandates,
three with equity mandates, two with hedge fund of funds mandates, one for real estate
securities, one with emerging markets equity and one with emerging markets debt.
The custody of the fund assets is with a global custodian, the Northern Trust Company (NT).
NT also administers a securities-lending program on behalf of the PF, as well as being
responsible for measuring managers’ performance.
Notes to PF Financial Statements
3
IInnvveessttmmeenntt OObbjjeeccttiivvee::
The fund managers’ investment performance is measured against UNRWA customization of
market benchmarks. The construction of these benchmarks is as follow:
-- CCoommbbiinneedd CCuussttoomm BBeenncchhmmaarrkk:: 40% Fixed Income , 32.5% Equities, 5% Hedge fund of
Funds, 7.5% Real Estate securities ,7.5% Emerging Markets Equity and 7.5% Emerging
market Debt.
-- FFiixxeedd IInnccoommee CCuussttoomm BBeenncchhmmaarrkk: Barclays Global Investors Management 40 %Hedged
to USD.
-- EEqquuiittyy CCuussttoomm BBeenncchhmmaarrkk: MSCI World Index.
-- HHeeddggee FFuunndd ooff FFuunndd BBeenncchhmmaarrkk: HFRI Fund of Fund Composite Index.
-- RReeaall EEssttaattee SSeeccuurriittiieess: UBS Global Investors Total Return Index (USD)
-- EEmmeerrggiinngg MMaarrkkeettss EEqquuiittyy BBeenncchhmmaarrkk:: MSCI Emerging Markets GDR fully unhedged
in US dollars
- EEmmeerrggiinngg MMaarrkkeettss DDeebbtt BBeenncchhmmaarrkk:: JP Morgan GBI-EM Global Diversified index.
The fixed income managers Baring Asset Managements, BlackRock International
Investments, Western Asset Management and Fiduciary Trust are expected to achieve returns
equivalent to UNRWA Fixed Income custom benchmark. The global equity managers State
Street Global Advisors, J.P. Morgan Asset Management and Cantillon Capital Management
are expected to achieve performance equivalent to the return from the UNRWA Equity
custom benchmark. Whereas the hedge fund of funds managers UBS Global Asset
Management and Kottmann Analytics are expected to achieve performance equivalent to the
return from Hedge Fund of Funds benchmark. The Real Estate Securities fund manager AMP
Capital Investment Management is expected to achieve performance equivalent to the return
from UBS Global Investors Total Return Index (USD).
Lazard Asset Management is expected to achieve returns equivalent to UNRWA emerging
markets equities benchmark and Pictet & Cie is expected to achieve returns equivalent to
UNRWA emerging markets debt benchmark. For all managers preservation of capital is
considered of primary importance with liquidity as secondary.
Notes to PF Financial Statements
4
IInnvveessttmmeenntt PPeerrffoorrmmaannccee
FFuunndd PPeerrffoorrmmaannccee
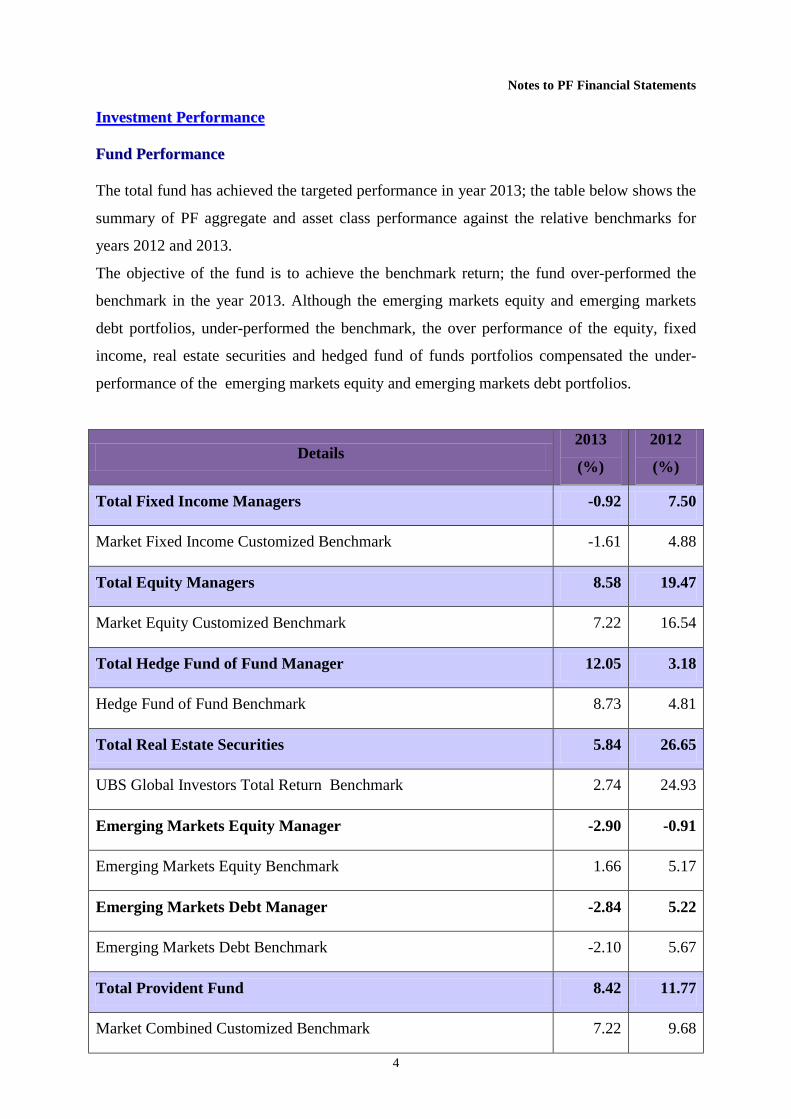
The total fund has achieved the targeted performance in year 2013; the table below shows the
summary of PF aggregate and asset class performance against the relative benchmarks for
years 2012 and 2013.
The objective of the fund is to achieve the benchmark return; the fund over-performed the
benchmark in the year 2013. Although the emerging markets equity and emerging markets
debt portfolios, under-performed the benchmark, the over performance of the equity, fixed
income, real estate securities and hedged fund of funds portfolios compensated the under-
performance of the emerging markets equity and emerging markets debt portfolios.
Details 2013
(%)
2012
(%)
Total Fixed Income Managers -0.92 7.50
Market Fixed Income Customized Benchmark -1.61 4.88
Total Equity Managers 8.58 19.47
Market Equity Customized Benchmark 7.22 16.54
Total Hedge Fund of Fund Manager 12.05 3.18
Hedge Fund of Fund Benchmark 8.73 4.81
Total Real Estate Securities 5.84 26.65
UBS Global Investors Total Return Benchmark 2.74 24.93
Emerging Markets Equity Manager -2.90 -0.91
Emerging Markets Equity Benchmark 1.66 5.17
Emerging Markets Debt Manager -2.84 5.22
Emerging Markets Debt Benchmark -2.10 5.67
Total Provident Fund 8.42 11.77
Market Combined Customized Benchmark 7.22 9.68
Notes to PF Financial Statements
5
The investment environment in 2013 was good for most of the financial asset classes. Hence
the Provident Fund experienced good returns for the equity portfolios, real estate securities
portfolio and hedged fund of funds portfolios in 2013.
Though the return for fixed income portfolios was above the benchmark, the return is minus.
However the return for the emerging markets debt was below the benchmark index and the
performance of the emerging markets equity was very disappointing in the year of 2013.
The UNRWA PF required no specific hedging techniques to be considered by the Fund
Managers. The guidelines provided to Fund Managers by UNRWA provide that Fund
Managers may use hedging instruments such as equity options and futures as well as
derivatives, based on certain conditions for return augmentation and index replication.
For investments in fixed income and equity portfolios, the manager may invest only in the
currencies listed in the performance benchmark specified.
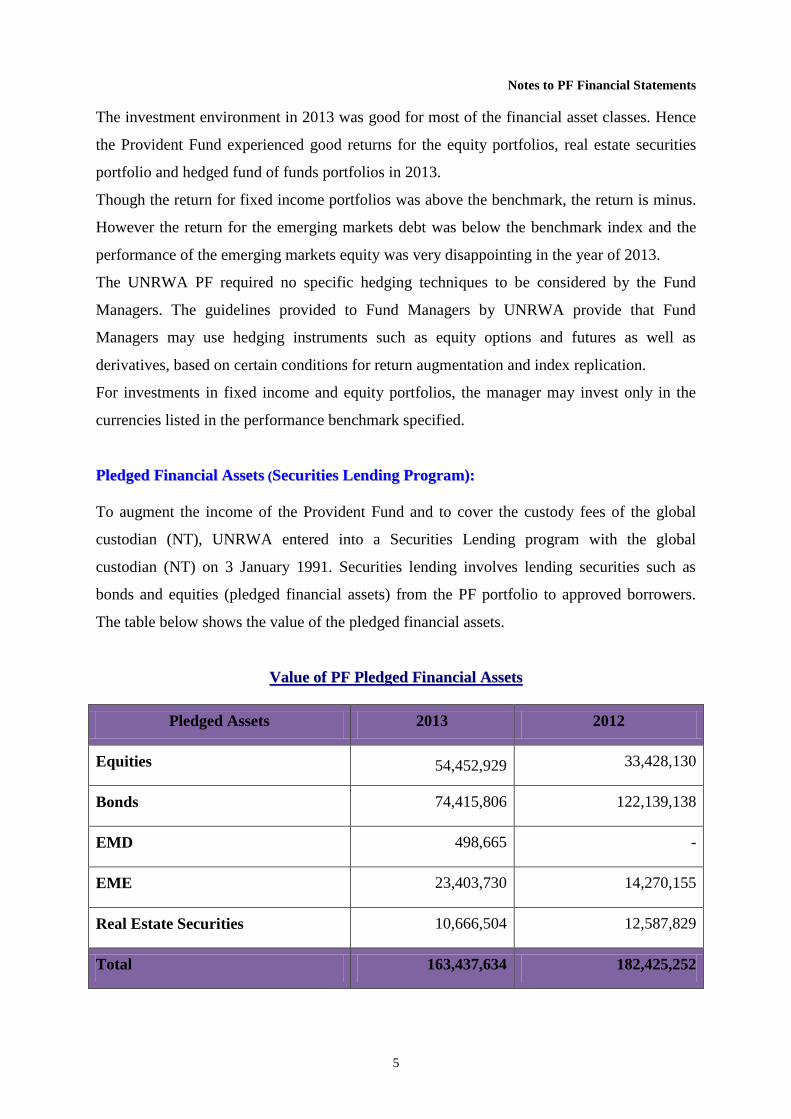
PPlleeddggeedd FFiinnaanncciiaall AAsssseettss ((SSeeccuurriittiieess LLeennddiinngg PPrrooggrraamm))::
To augment the income of the Provident Fund and to cover the custody fees of the global
custodian (NT), UNRWA entered into a Securities Lending program with the global
custodian (NT) on 3 January 1991. Securities lending involves lending securities such as
bonds and equities (pledged financial assets) from the PF portfolio to approved borrowers.
The table below shows the value of the pledged financial assets.
VVaalluuee ooff PPFF PPlleeddggeedd FFiinnaanncciiaall AAsssseettss
Pledged Assets 2013 2012
Equities 54,452,929 33,428,130
Bonds 74,415,806 122,139,138
EMD 498,665 -
EME 23,403,730 14,270,155
Real Estate Securities 10,666,504 12,587,829
Total 163,437,634 182,425,252
Notes to PF Financial Statements
6
The creditworthiness of these borrowers is monitored by Northern Trust Company loans
which includes both US and non–US dollar securities and is protected by taking collateral
from the borrowers.
The collateral could be cash, government securities or irrevocable bank letters of credit or
others. The collateral has to cover up to 102% of the value for US securities and 105% for
non–US securities. On a daily basis the current market value of the securities plus accrued
interest is compared to the collateral level and additional collateral is requested from, or
excess collateral is returned to the borrower. The collateral is pooled.
Earnings in the case of cash collateral are derived from investing the cash collateral in short-
term money market funds. Earnings in the case of other forms of collateral are derived from a
loan fee paid by the borrower. The risks involved with securities lending are managed by the
global custodian (NT). The credit standing of the borrower is reviewed periodically. The
investment of the cash collateral is subject to strict guidelines concerning credit rating,
maturity, liquidity, diversification and type of investment.
The Provident Fund Secretariat has imposed further control on the securities lending program
by restricting the size of the securities lending to 40 % of the total fund.
EEssttaabblliisshhmmeenntt ooff tthhee CCoonnsseerrvvaattiivvee FFuunndd
In view of the recent financial market turmoil, it has been decided to introduce a new fund
called “conservative fund” for PF members approaching retirement, the assets of the new
fund will be invested in a very low risk asset classes, the main goal for the conservative fund
is to provide better protection for members who are participating in the this fund.
The age to transfer to the new conservative fund will be by element of choice upon turning 55
years of age and the transfer will be in one direction only, eligible PF members when he/she
reaches age 55, will be given an option to transfer up to 20% of his/her balance currently in
the main fund to the newly established conservative fund.
The new two funds structure will allow PF members to make 5 partial movements into the
conservative fund, eligible PF members who select to participate in the conservative fund can
exercise their option when he/she reaches age 55 only, eligible PF members will be given an
option every year to transfer around 20% of his/her balance currently in the main fund to be
invested in the new conservative fund or to keep their balances in the main fund if they chose
not to participate in the conservative fund.
Notes to PF Financial Statements
7
The blow shows how PF eligible members can transfer their balances from the main to the
conservative fund:
Age 55 and above 20%
Age 56 and above 25%
Age 57 and above 30%
Age 58 and above 35%
Age 59 and above up to 100%
Eligible PF members will have the choice every year in December to freeze their
participation in the conservative fund, or transfer up to all of their remaining balance in the
main fund to the conservative fund one year from their retirement, separated staff will get one
chance to transfer 50% or 100% of their balances in the main fund to the conservative fund
regardless of age.
The Conservative Fund had 737 members as at 31 December 2013 and 79 members enrolled
in the voluntary contribution scheme.
FFiinnaanncciiaall RRiisskk MMaannaaggeemmeenntt
IInnttrroodduuccttiioonn
The investments of the PF similar to any other investment in the financial markets are subject
to many risks. These risks include market risk, currency risk, price risk, credit risk, liquidity
risk, concentration risk and interest rate risk. The PF seeks to minimize the effects of these
risks by adopting a conservative investment benchmark and by diversifying the PF
investment through various asset classes, currencies, locations, durations, markets, issuers
etc. In addition, the PF manages mitigate the risk by allocating the investment to various
portfolios managed by different reputable fund managers with various investment approaches
(active, passive and replication).
The PF financial assets would have the following particular risks:
1. The PF investment in bonds is subject to liquidity risk, credit risk, concentration risk
and market risk.
2. The PF investment in equities is exposed to market risk and concentration risk.
3. The PF investment in hedge fund of funds is subject to liquidity risk, credit risk,
market risk, and manager’s risk.

Notes to PF Financial Statements
8
4. The PF investment in emerging markets equity is subject to credit risk, corporate risk,
currency risk and market risk.
5. The PF investment in emerging market debt is subject to credit risk, corporate risk,
currency risk and market risk.
RRiisskk MMaannaaggeemmeenntt OObbjjeeccttiivvee
The PF risk management objective is to maintain the portfolio risks around the relevant
benchmark risk levels. At the longer term, the portfolio is not expected to exceed the
benchmark risk levels unless justified by additional returns.
PPoorrttffoolliioo MMoonniittoorriinngg aanndd CCoonnttrrooll PPrroocceessss
The investment service agreements with the fund managers identify the relevant benchmarks
and the risk measures, as well as it identifies the maximum approved risk levels.
The Portfolio risk is monitored on a number of levels. In the first instance, the fund managers
risk monitoring and control specialist teams have responsibility for ensuring that portfolios
reflect the relevant investment strategy and the benchmark risk levels. This involves a
combination of pre and post-trade checking.
In addition, the PFS closely and extensively monitors the risk of the portfolio and compare it
with relevant benchmark on a daily basis by using the custodian on line systems. Further, the
Investment Advisory Committee (IAC) reviews the risk measures of the fund managers on a
semi-annual basis based on the reports and the live presentations of the fund manager and the
performance evaluator. Also the Provident Fund Committee (PFC) reviews the performance
of the fund managers on semi-annual basis based on the reports and the live presentations of
the fund manager and the performance evaluator.
If the fund manager exceeds the risk measures as identified in the investment guidelines an
immediate process of follow up is initiated by the PFS. If the risk was unjustified the fund
manager will be asked to reduce the additional risk and to compensate the portfolio for any
loss.
Notes to PF Financial Statements
9
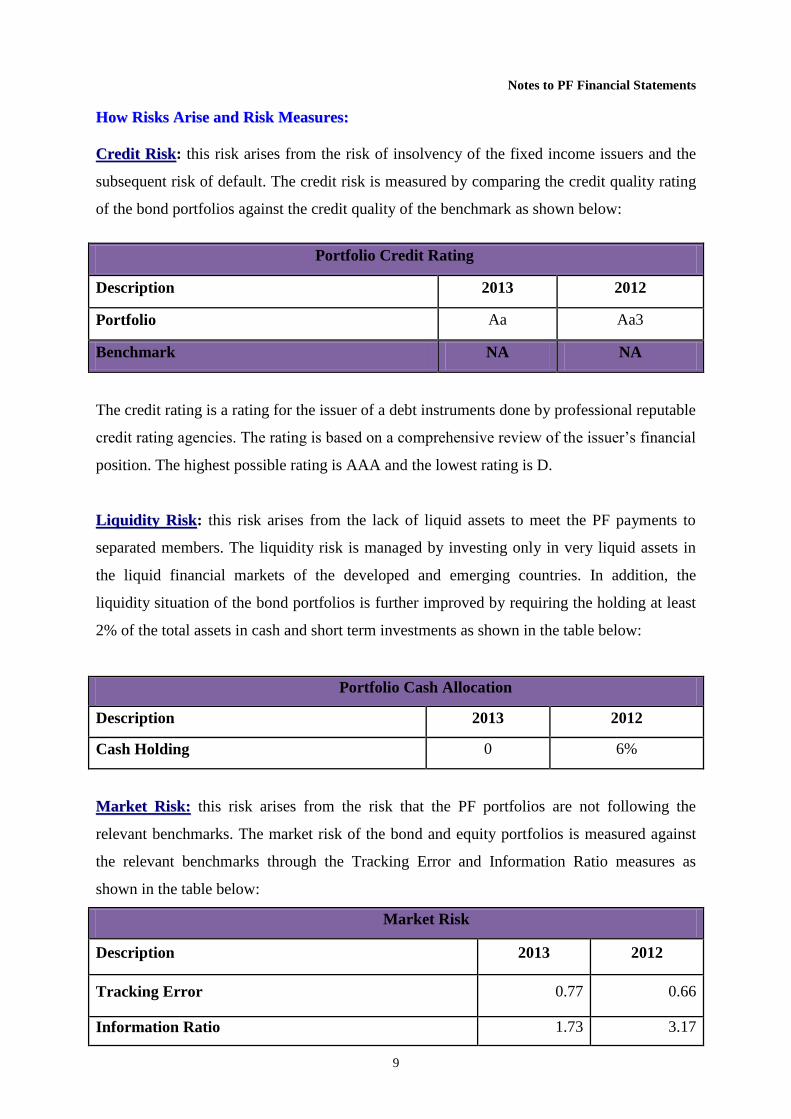
HHooww RRiisskkss AArriissee aanndd RRiisskk MMeeaassuurreess::
CCrreeddiitt RRiisskk: this risk arises from the risk of insolvency of the fixed income issuers and the
subsequent risk of default. The credit risk is measured by comparing the credit quality rating
of the bond portfolios against the credit quality of the benchmark as shown below:
The credit rating is a rating for the issuer of a debt instruments done by professional reputable
credit rating agencies. The rating is based on a comprehensive review of the issuer’s financial
position. The highest possible rating is AAA and the lowest rating is D.
LLiiqquuiiddiittyy RRiisskk: this risk arises from the lack of liquid assets to meet the PF payments to
separated members. The liquidity risk is managed by investing only in very liquid assets in
the liquid financial markets of the developed and emerging countries. In addition, the
liquidity situation of the bond portfolios is further improved by requiring the holding at least
2% of the total assets in cash and short term investments as shown in the table below:
Portfolio Cash Allocation
Description 2013 2012
Cash Holding 0 6%
MMaarrkkeett RRiisskk:: this risk arises from the risk that the PF portfolios are not following the
relevant benchmarks. The market risk of the bond and equity portfolios is measured against
the relevant benchmarks through the Tracking Error and Information Ratio measures as
shown in the table below:
Market Risk
Description 2013 2012
Tracking Error 0.77 0.66
Information Ratio 1.73 3.17
Portfolio Credit Rating
Description 2013 2012
Portfolio Aa Aa3
Benchmark NA NA
Notes to PF Financial Statements
10
The tracking error measures the extent to which a portfolio tracks its benchmark. The higher
the tracking error, the higher the variability of the portfolio returns around the benchmark.
The tracking error will always be greater than zero, unless the portfolio is exactly tracking the
benchmark.
The information ratio is a measure of risk adjusted return over the benchmark returns. The
higher the information ratio, the higher the risk adjusted return.
CCoonncceennttrraattiioonn RRiisskk: this risk arises from over concentrating the portfolio in few portfolios
or asset classes which may expose the portfolio to the individual risks of these portfolios or
assets. This risk is managed by diversifying the portfolio at the fund manager level as well as
the underlying asset classes.
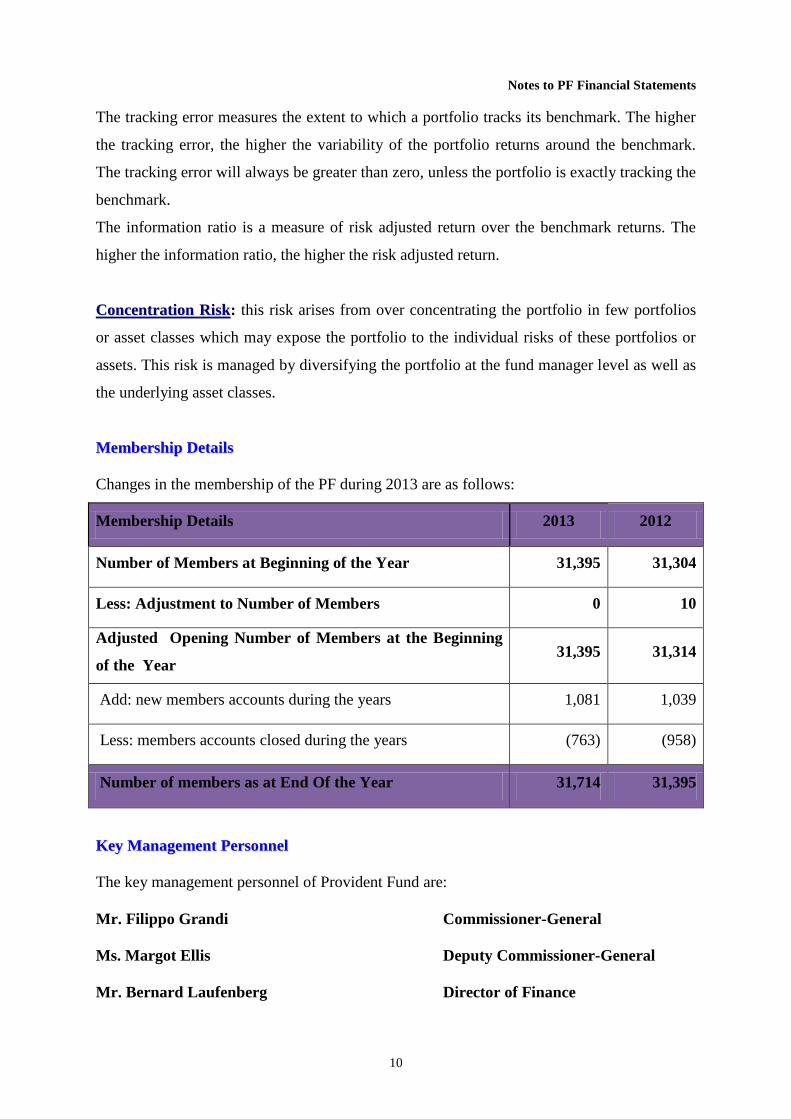
MMeemmbbeerrsshhiipp DDeettaaiillss
Changes in the membership of the PF during 2013 are as follows:
Membership Details 2013 2012
Number of Members at Beginning of the Year 31,395 31,304
Less: Adjustment to Number of Members 0 10
Adjusted Opening Number of Members at the Beginning
of the Year 31,395 31,314
Add: new members accounts during the years 1,081 1,039
Less: members accounts closed during the years (763) (958)
Number of members as at End Of the Year 31,714 31,395
KKeeyy MMaannaaggeemmeenntt PPeerrssoonnnneell
The key management personnel of Provident Fund are:
Mr. Filippo Grandi Commissioner-General
Ms. Margot Ellis Deputy Commissioner-General
Mr. Bernard Laufenberg Director of Finance
Notes to PF Financial Statements
11
NNootteess ttoo tthhee AAnnnnuuaall FFiinnaanncciiaall SSttaatteemmeennttss
NNoottee 11:: BBaassiiss ooff PPrreeppaarraattiioonn
((aa)) SSttaatteemmeenntt ooff ccoommpplliiaannccee
The annual financial statements have been prepared in accordance with International
Financial Reporting Standards.
The financial statements were approved by the Commissioner General on [31 March 2014].
BBaassiiss ooff PPrreesseennttaattiioonn
The fundamental accounting assumptions of going concern, consistency and accrual are
followed in the annual financial statement presentation.
((bb)) FFuunnccttiioonnaall ccuurrrreennccyy aanndd pprreesseennttaattiioonn ccuurrrreennccyy
The annual financial statements are prepared in United States Dollars (USD) which is the
entity’s functional currency. All financial information presented in USD has been rounded to
the nearest dollar.
((cc)) BBaassiiss ooff mmeeaassuurreemmeenntt
The financial statements have been prepared on the historical cost basis, with the exception of
held for trading investments, which are reported at fair value. The principal accounting
policies are set out below.
NNoottee 22:: SSiiggnniiffiiccaanntt AAccccoouunnttiinngg PPoolliicciieess
The accounting policies set out below have been applied consistently to all periods presented
in these financial statements and have been applied consistently throughout the period.
((aa)) FFiinnaanncciiaall aasssseettss hheelldd ffoorr ttrraaddiinngg iinnvveessttmmeennttss
The PF investment in Bonds, Equities, Hedge Fund of Funds, Real Estate Securities
Emerging Markets Debt and Emerging Markets Equity are classified as financial assets held
for trading.
Securities are classified as held for trading securities if their carrying amount will be
recovered principally through a sale transaction rather than through continuing use. This
condition is regarded as met only when the sale is highly probable and the asset is available
Notes to PF Financial Statements
12
for immediate sale in its present condition. The investments have been valued as at 31
December 2013 on the current fair value. The fair value is determined based on the financial
market pricing for the bonds, equities, hedge fund of funds, real estate securities, emerging
markets debt and emerging markets equity.
The PF financial assets held for trading are classified as Level (1) according to IFRS 7 (Level
1: quoted prices (unadjusted) in active markets for identical assets or liabilities).
Investments are recognized and de-recognized on a trade date where the purchase or sale of
an investment is under a contract whose terms require delivery of the investment within the
timeframe established by the market concerned. The financial assets classified as held for
trading securities are initially measured at fair value.
((bb)) FFoorreeiiggnn ccuurrrreennccyy
(1) Investment Manager’s transactions executed in other currencies are translated to USD at
the spot market rates of exchange prevailing at the time of the transaction.
(2) PF transactions related to liabilities and expenses in other currencies are translated to
USD at the United Nations operational rates of exchange prevailing at the time of the
transaction.
((cc)) DDeerriivvaattiivvee ffiinnaanncciiaall iinnssttrruummeennttss
The PF allows the fund managers to invest in derivative financial instruments to augment the
return and to achieve the ultimate objective of attaining the benchmark return. Derivatives are
initially recognized at fair value at the date the derivative contract is entered into and are
subsequently measured to their fair value at the end of each reporting period. The resulting
gain or loss is recognized in the income statement.
((dd)) CCaasshh aanndd CCaasshh EEqquuiivvaalleenntt
The cash and invested cash kept by the custodian The Northern Trust which is related to the
fund manager’s portfolio.
((ee)) PPrrooppeerrttyy,, PPllaanntt aanndd EEqquuiippmmeenntt’’ss
Equipment and fixtures are stated at cost less accumulated depreciation and any accumulated
impairment losses.
Notes to PF Financial Statements
13
Depreciation is recognized on a straight-line basis over the estimated useful life of an item of
property, plant and equipment. The estimated useful lives, residual values and depreciation
method are reviewed at each year-end, with the effect of any changes in estimate accounted
for on a prospective basis.
The estimated useful life of equipment and fixtures is 4 years, with residual value estimated
at zero USD.
((ff)) IInnvveessttmmeenntt iinnccoommee
Investment income comprises interest income on funds invested, dividend income, gains on
the disposal of held for trading securities, changes in the fair value of financial assets at fair
value through profit or loss. Interest income is recognized as it accrues using the effective
interest method. Dividend income is recognized on the date that the Fund’s right to receive
payment is established.
((gg)) MMaannaaggeemmeenntt ffeeeess
The Provident Fund has two investments styles i.e. segregated portfolio and commingled
(Pool) investments, accordingly, the calculation of management fees will differ based on the
style of investment.
The fee will be paid semi-annually or quarterly in arrears and is recognized when service are
rendered to the fund. In case of Barings, Fiduciary, BlackRock, Western Assets, State Street,
Barclays, J.P. Morgan, Cantillon, Pictet, Lazard and AMP, these are segregated portfolios
where the investment management fees are calculated and then paid from the relevant
portfolio.
In case of Kottmann Analytics and UBS, PF invests in commingled pooled investment. The
fees in these pools are calculated across the pool and deducted directly from the pool
portfolio.
The different approach of fee deduction is owed to different investment styles.
Transaction Cost: The Brokers' fees and other transactions charges in connection with
transactions executed on the Provident Fund’s behalf are charged to the Provident Fund and
any brokerage discounts or re-allowances are passed on to the Provident Fund.
Notes to PF Financial Statements
14
((hh)) PPrroovviissiioonn ffoorr WWiitthhddrraawwaall LLiiaabbiilliittyy
The provision for withdrawal liability by separated members is an obligation in which
UNRWA-PF would become liable for an amount equal to the separated member’s credit in
the Provident Fund. The recognition of provision would be as a result of a past event which
required settlement of the obligation and a reliable estimate can be made for the amount of
the obligation.
Since it is unusual and in actuality unlikely that all the separated members would withdraw
all their credits within any certain year, the amount recognized as a provision is calculated
based on the best estimate of UNRWA-PF. The provision is based on the average of
withdrawals made by separated members during the most recent five years, including the
current year.
II)) PPrroovviissiioonn SSeevveerraannccee BBeenneeffiittss
The provision for severance by separated members is an obligation in which UNRWA-PF
would become liable for an amount equal to the severance benefit in the Provident Fund. The
recognition of provision would be as a result of a past event which required settlement of the
obligation and a reliable estimate can be made for the amount of the obligation.
NNoottee 33:: PPrrooppeerrttyy,, PPllaanntt aanndd EEqquuiippmmeenntt
Based on the Provident Fund accounting policy for property, plant and equipment starting
2013, the following conditions must be met for an item to be capitalized as an asset:
The asset has a useful life of more than one year.
The asset has a total cost of USD 2,000 per unit or above.
Notes to PF Financial Statements
15
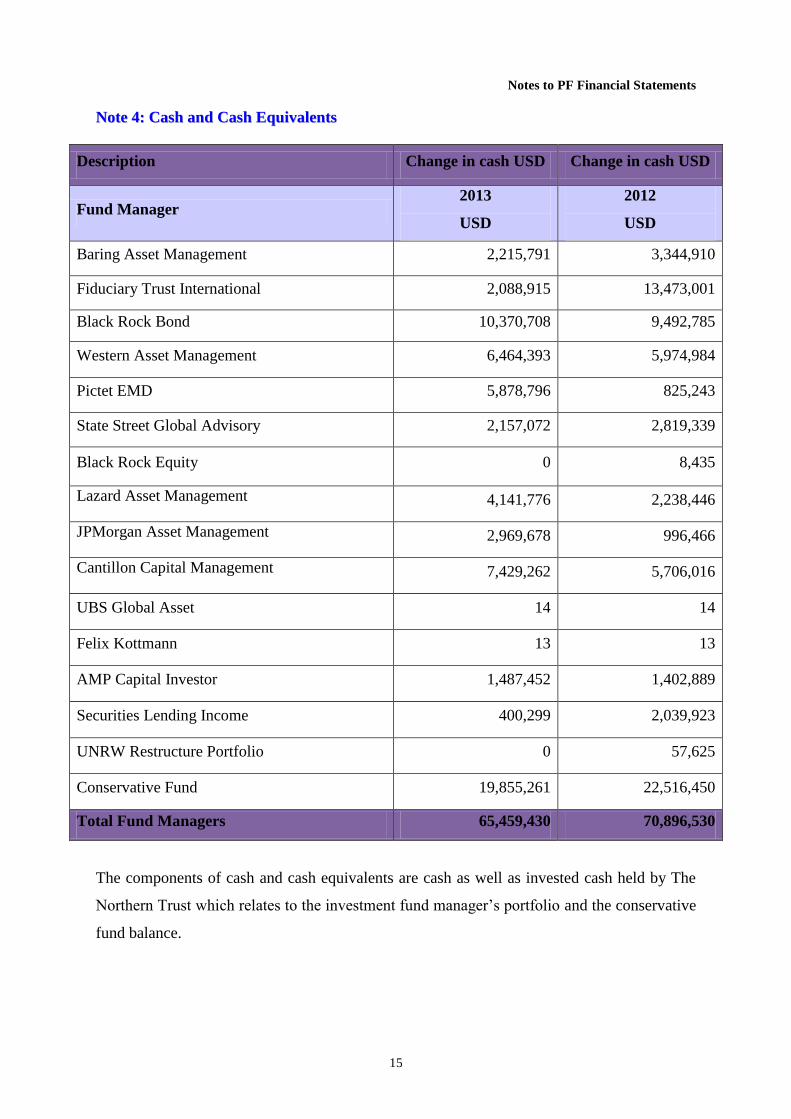
NNoottee 44:: CCaasshh aanndd CCaasshh EEqquuiivvaalleennttss
Description Change in cash USD Change in cash USD
Fund Manager 2013
USD
2012
USD
Baring Asset Management 2,215,791 3,344,910
Fiduciary Trust International 2,088,915 13,473,001
Black Rock Bond 10,370,708 9,492,785
Western Asset Management 6,464,393 5,974,984
Pictet EMD 5,878,796 825,243
State Street Global Advisory 2,157,072 2,819,339
Black Rock Equity 0 8,435
Lazard Asset Management 4,141,776 2,238,446
JPMorgan Asset Management 2,969,678 996,466
Cantillon Capital Management 7,429,262 5,706,016
UBS Global Asset 14 14
Felix Kottmann 13 13
AMP Capital Investor 1,487,452 1,402,889
Securities Lending Income 400,299 2,039,923
UNRW Restructure Portfolio 0 57,625
Conservative Fund 19,855,261 22,516,450
Total Fund Managers 65,459,430 70,896,530
The components of cash and cash equivalents are cash as well as invested cash held by The
Northern Trust which relates to the investment fund manager’s portfolio and the conservative
fund balance.
Notes to PF Financial Statements
16
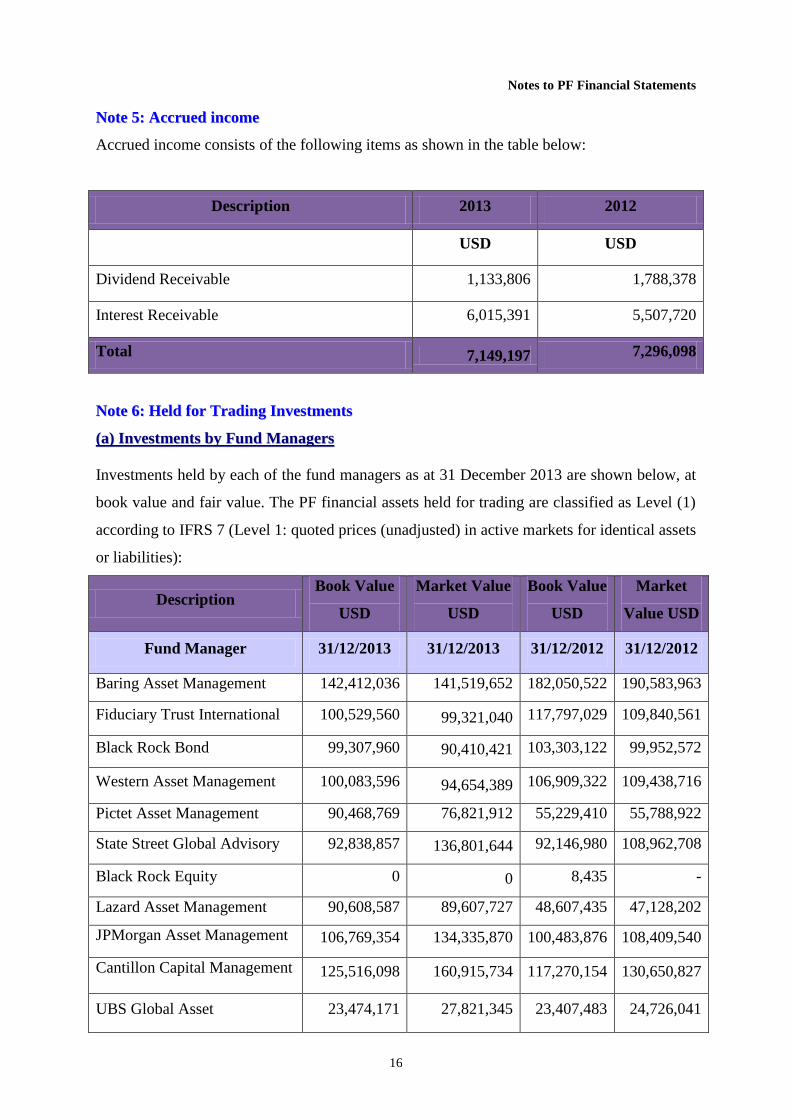
NNoottee 55:: AAccccrruueedd iinnccoommee
Accrued income consists of the following items as shown in the table below:
Description 2013 2012
USD USD
Dividend Receivable 1,133,806 1,788,378
Interest Receivable 6,015,391 5,507,720
Total 7,149,197 7,296,098
NNoottee 66:: HHeelldd ffoorr TTrraaddiinngg IInnvveessttmmeennttss
((aa)) IInnvveessttmmeennttss bbyy FFuunndd MMaannaaggeerrss
Investments held by each of the fund managers as at 31 December 2013 are shown below, at
book value and fair value. The PF financial assets held for trading are classified as Level (1)
according to IFRS 7 (Level 1: quoted prices (unadjusted) in active markets for identical assets
or liabilities):
Description Book Value
USD
Market Value
USD
Book Value
USD
Market
Value USD
Fund Manager 31/12/2013 31/12/2013 31/12/2012 31/12/2012
Baring Asset Management 142,412,036 141,519,652 182,050,522 190,583,963
Fiduciary Trust International 100,529,560 99,321,040 117,797,029 109,840,561
Black Rock Bond 99,307,960 90,410,421 103,303,122 99,952,572
Western Asset Management 100,083,596 94,654,389 106,909,322 109,438,716
Pictet Asset Management 90,468,769 76,821,912 55,229,410 55,788,922
State Street Global Advisory 92,838,857 136,801,644 92,146,980 108,962,708
Black Rock Equity 0 0 8,435 -
Lazard Asset Management 90,608,587 89,607,727 48,607,435 47,128,202
JPMorgan Asset Management 106,769,354 134,335,870 100,483,876 108,409,540
Cantillon Capital Management 125,516,098 160,915,734 117,270,154 130,650,827
UBS Global Asset 23,474,171 27,821,345 23,407,483 24,726,041
Notes to PF Financial Statements
17
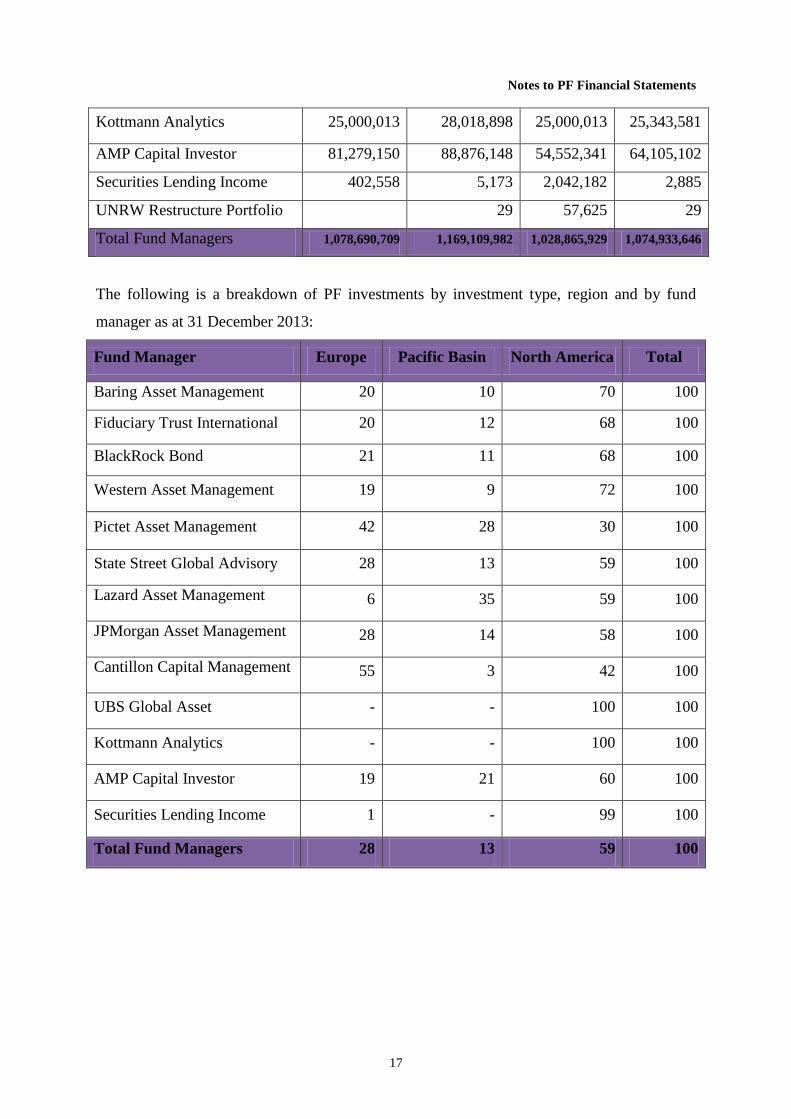
Kottmann Analytics 25,000,013 28,018,898 25,000,013 25,343,581
AMP Capital Investor 81,279,150 88,876,148 54,552,341 64,105,102
Securities Lending Income 402,558 5,173 2,042,182 2,885
UNRW Restructure Portfolio 29 57,625 29
Total Fund Managers 1,078,690,709 1,169,109,982 1,028,865,929 1,074,933,646
The following is a breakdown of PF investments by investment type, region and by fund
manager as at 31 December 2013:
Fund Manager Europe Pacific Basin North America Total
Baring Asset Management 20 10 70 100
Fiduciary Trust International 20 12 68 100
BlackRock Bond 21 11 68 100
Western Asset Management 19 9 72 100
Pictet Asset Management 42 28 30 100
State Street Global Advisory 28 13 59 100
Lazard Asset Management 6 35 59 100
JPMorgan Asset Management 28 14 58 100
Cantillon Capital Management 55 3 42 100
UBS Global Asset - - 100 100
Kottmann Analytics - - 100 100
AMP Capital Investor 19 21 60 100
Securities Lending Income 1 - 99 100
Total Fund Managers 28 13 59 100
Notes to PF Financial Statements
18
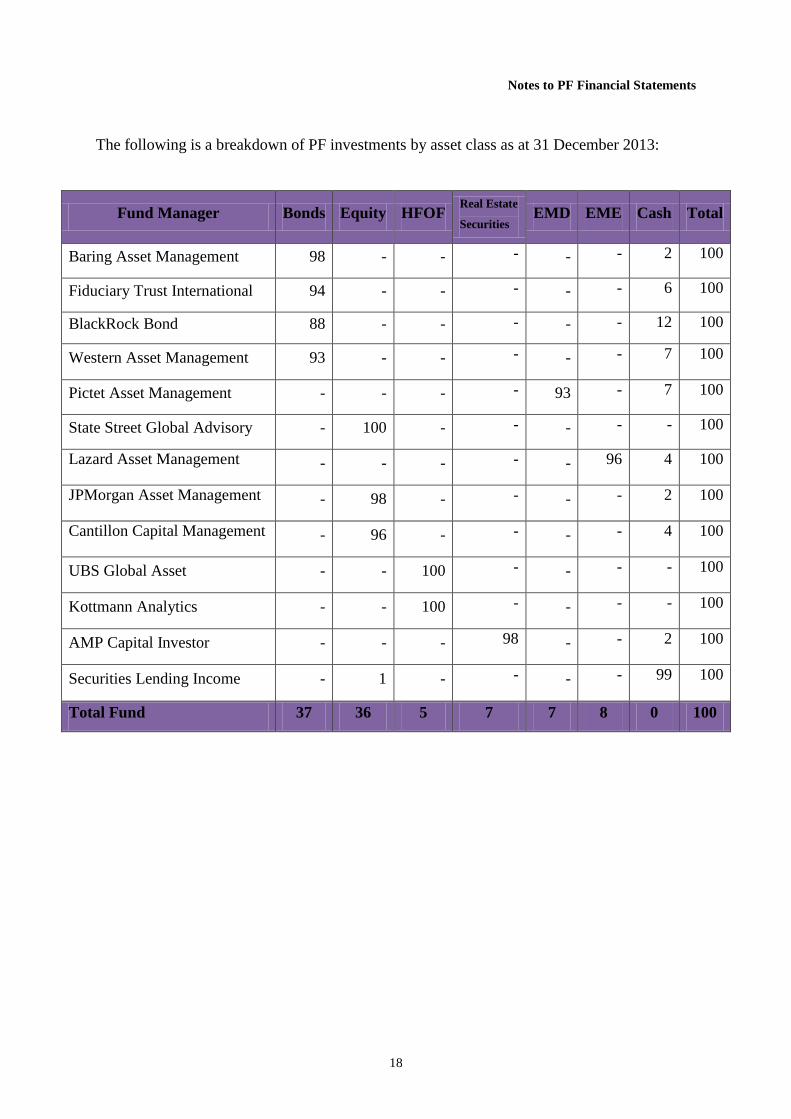
The following is a breakdown of PF investments by asset class as at 31 December 2013:
Fund Manager Bonds Equity HFOF Real Estate
Securities EMD EME Cash Total
Baring Asset Management 98 - - - - - 2 100
Fiduciary Trust International 94 - - - - - 6 100
BlackRock Bond 88 - - - - - 12 100
Western Asset Management 93 - - - - - 7 100
Pictet Asset Management - - - - 93 - 7 100
State Street Global Advisory - 100 - - - - - 100
Lazard Asset Management - - - - - 96 4 100
JPMorgan Asset Management - 98 - - - - 2 100
Cantillon Capital Management - 96 - - - - 4 100
UBS Global Asset - - 100 - - - - 100
Kottmann Analytics - - 100 - - - - 100
AMP Capital Investor - - - 98 - - 2 100
Securities Lending Income - 1 - - - - 99 100
Total Fund 37 36 5 7 7 8 0 100
Notes to PF Financial Statements
19
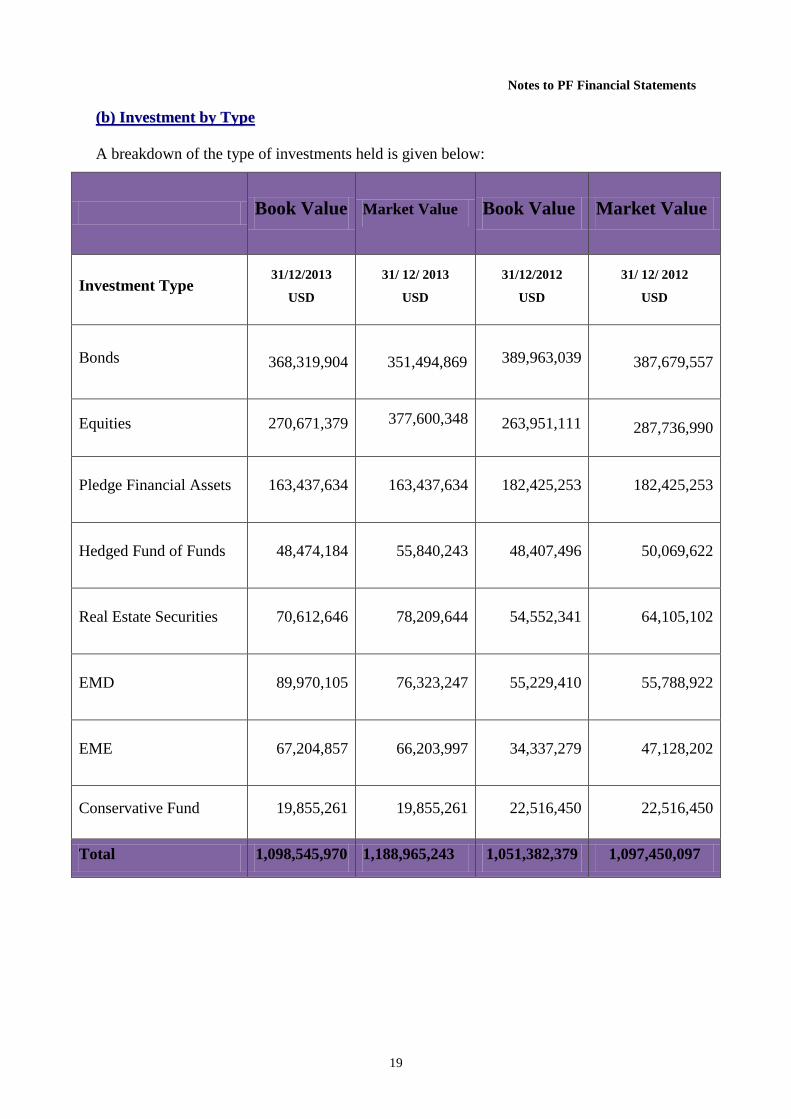
((bb)) IInnvveessttmmeenntt bbyy TTyyppee
A breakdown of the type of investments held is given below:
Book Value Market Value Book Value Market Value
Investment Type 31/12/2013
USD
31/ 12/ 2013
USD
31/12/2012
USD
31/ 12/ 2012
USD
Bonds
368,319,904
351,494,869 389,963,039 387,679,557
Equities 270,671,379 377,600,348
263,951,111 287,736,990
Pledge Financial Assets 163,437,634 163,437,634 182,425,253 182,425,253
Hedged Fund of Funds 48,474,184 55,840,243 48,407,496 50,069,622
Real Estate Securities 70,612,646 78,209,644 54,552,341 64,105,102
EMD 89,970,105 76,323,247 55,229,410 55,788,922
EME 67,204,857 66,203,997 34,337,279 47,128,202
Conservative Fund 19,855,261 19,855,261 22,516,450 22,516,450
Total 1,098,545,970 1,188,965,243 1,051,382,379 1,097,450,097
Notes to PF Financial Statements
20
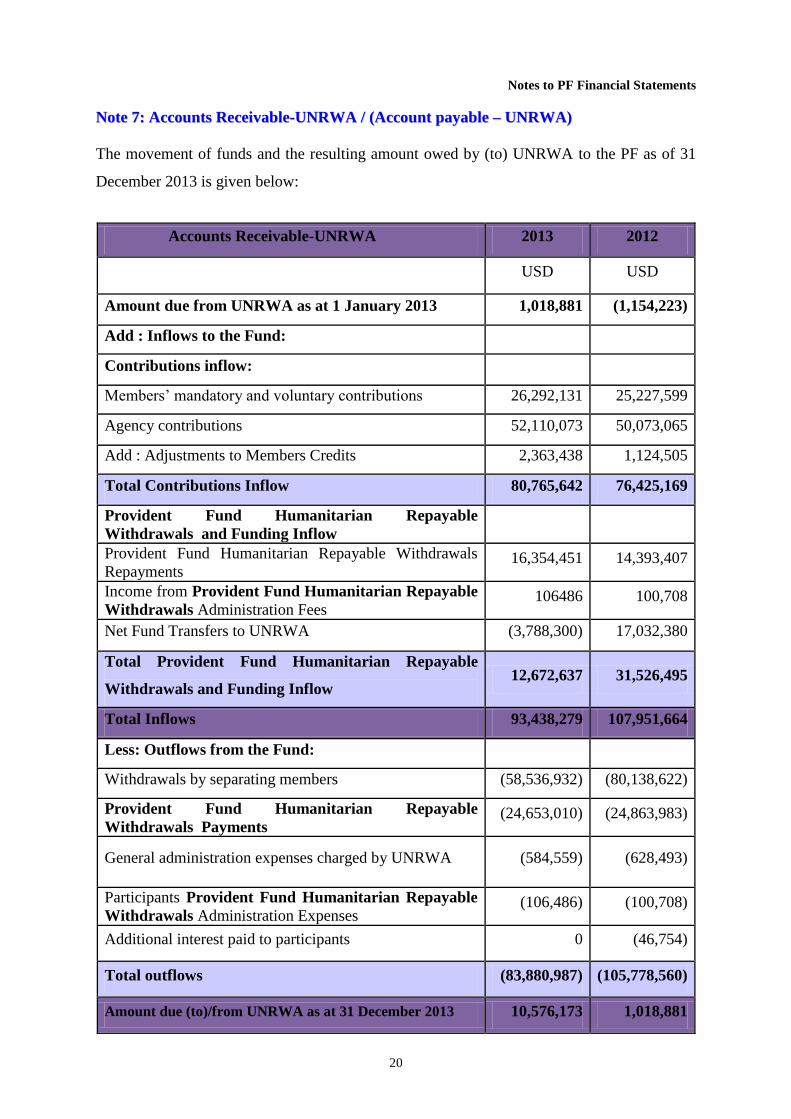
NNoottee 77:: AAccccoouunnttss RReecceeiivvaabbllee--UUNNRRWWAA // ((AAccccoouunntt ppaayyaabbllee –– UUNNRRWWAA))
The movement of funds and the resulting amount owed by (to) UNRWA to the PF as of 31
December 2013 is given below:
Accounts Receivable-UNRWA 2013 2012
USD USD
Amount due from UNRWA as at 1 January 2013 1,018,881 (1,154,223)
Add : Inflows to the Fund:
Contributions inflow:
Members’ mandatory and voluntary contributions 26,292,131 25,227,599
Agency contributions 52,110,073 50,073,065
Add : Adjustments to Members Credits 2,363,438 1,124,505
Total Contributions Inflow 80,765,642 76,425,169
Provident Fund Humanitarian Repayable
Withdrawals and Funding Inflow
Provident Fund Humanitarian Repayable Withdrawals
Repayments 16,354,451 14,393,407
Income from Provident Fund Humanitarian Repayable
Withdrawals Administration Fees 106486 100,708
Net Fund Transfers to UNRWA (3,788,300) 17,032,380
Total Provident Fund Humanitarian Repayable
Withdrawals and Funding Inflow 12,672,637 31,526,495
Total Inflows 93,438,279 107,951,664
Less: Outflows from the Fund:
Withdrawals by separating members (58,536,932) (80,138,622)
Provident Fund Humanitarian Repayable
Withdrawals Payments (24,653,010) (24,863,983)
General administration expenses charged by UNRWA (584,559) (628,493)
Participants Provident Fund Humanitarian Repayable
Withdrawals Administration Expenses (106,486) (100,708)
Additional interest paid to participants 0 (46,754)
Total outflows (83,880,987) (105,778,560)
Amount due (to)/from UNRWA as at 31 December 2013 10,576,173 1,018,881
Notes to PF Financial Statements
21
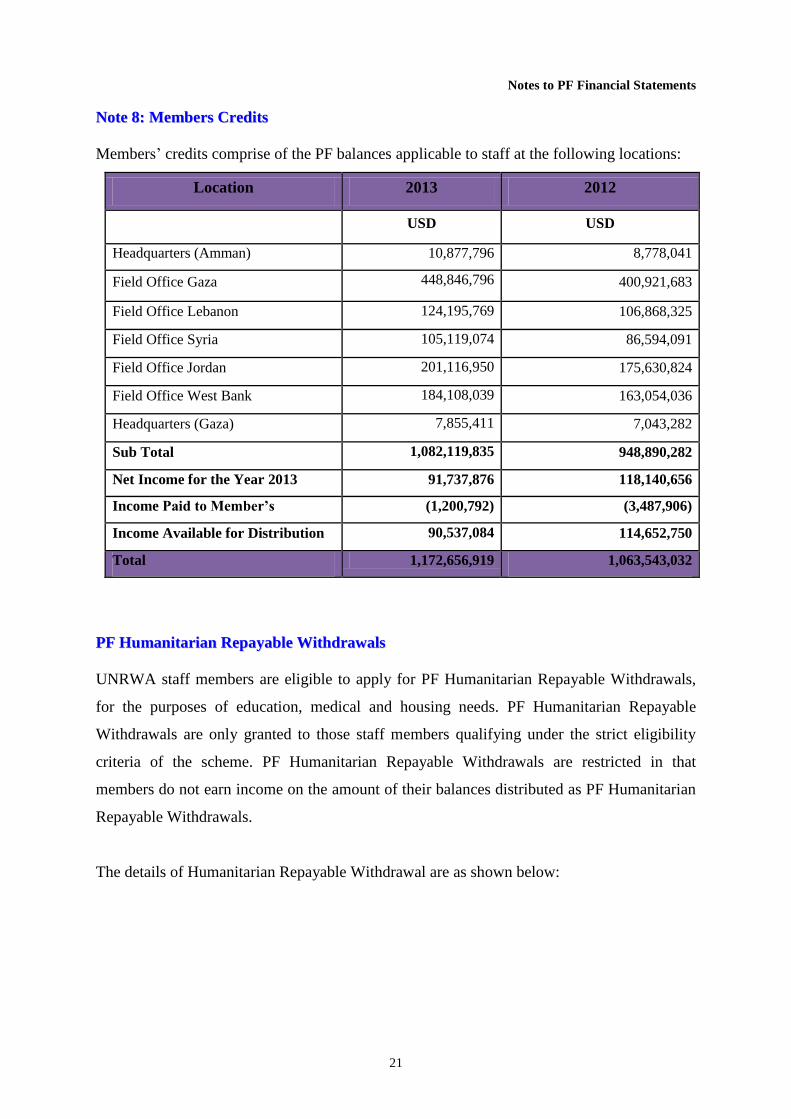
NNoottee 88:: MMeemmbbeerrss CCrreeddiittss
Members’ credits comprise of the PF balances applicable to staff at the following locations:
Location 2013 2012
USD USD
Headquarters (Amman) 10,877,796 8,778,041
Field Office Gaza 448,846,796 400,921,683
Field Office Lebanon 124,195,769 106,868,325
Field Office Syria 105,119,074 86,594,091
Field Office Jordan 201,116,950 175,630,824
Field Office West Bank 184,108,039 163,054,036
Headquarters (Gaza) 7,855,411 7,043,282
Sub Total 1,082,119,835 948,890,282
Net Income for the Year 2013 91,737,876 118,140,656
Income Paid to Member’s (1,200,792) (3,487,906)
Income Available for Distribution 90,537,084 114,652,750
Total 1,172,656,919 1,063,543,032
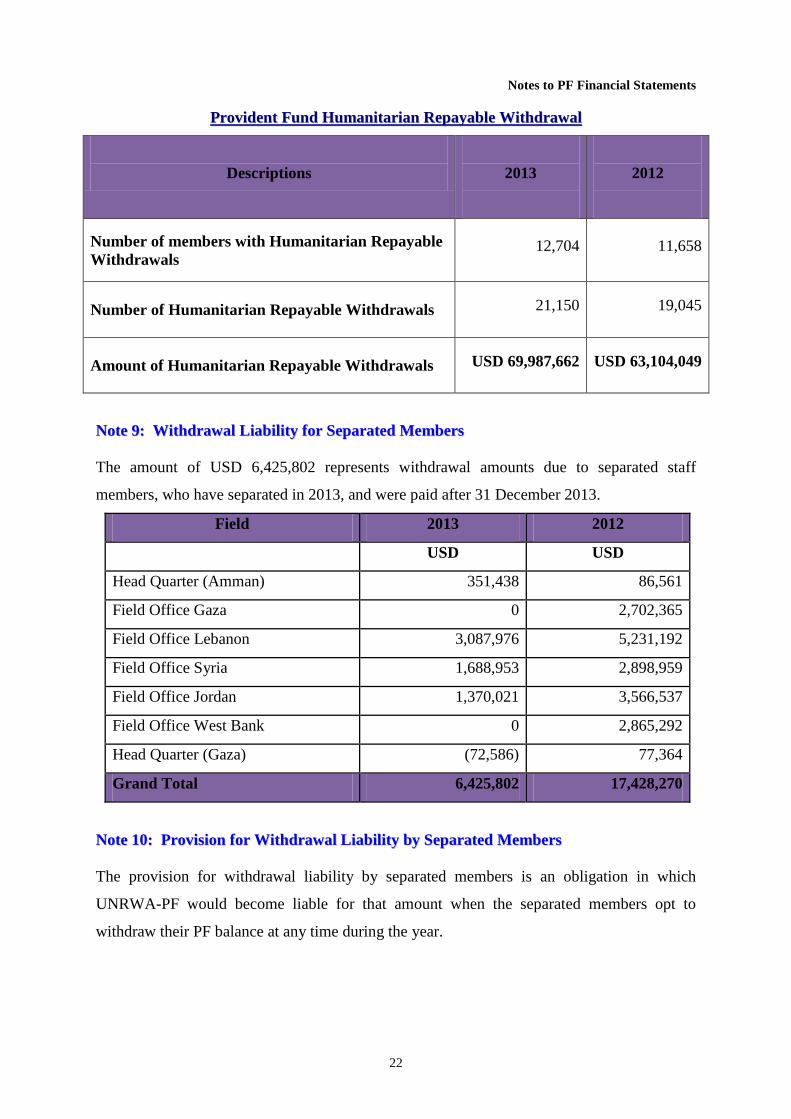
PPFF HHuummaanniittaarriiaann RReeppaayyaabbllee WWiitthhddrraawwaallss
UNRWA staff members are eligible to apply for PF Humanitarian Repayable Withdrawals,
for the purposes of education, medical and housing needs. PF Humanitarian Repayable
Withdrawals are only granted to those staff members qualifying under the strict eligibility
criteria of the scheme. PF Humanitarian Repayable Withdrawals are restricted in that
members do not earn income on the amount of their balances distributed as PF Humanitarian
Repayable Withdrawals.
The details of Humanitarian Repayable Withdrawal are as shown below:
Notes to PF Financial Statements
22
PPrroovviiddeenntt FFuunndd HHuummaanniittaarriiaann RReeppaayyaabbllee WWiitthhddrraawwaall
Descriptions
2013
2012
Number of members with Humanitarian Repayable
Withdrawals 12,704 11,658
Number of Humanitarian Repayable Withdrawals
21,150 19,045
Amount of Humanitarian Repayable Withdrawals USD 69,987,662 USD 63,104,049
NNoottee 99:: WWiitthhddrraawwaall LLiiaabbiilliittyy ffoorr SSeeppaarraatteedd MMeemmbbeerrss
The amount of USD 6,425,802 represents withdrawal amounts due to separated staff
members, who have separated in 2013, and were paid after 31 December 2013.
Field 2013 2012
USD USD
Head Quarter (Amman) 351,438 86,561
Field Office Gaza 0 2,702,365
Field Office Lebanon 3,087,976 5,231,192
Field Office Syria 1,688,953 2,898,959
Field Office Jordan 1,370,021 3,566,537
Field Office West Bank 0 2,865,292
Head Quarter (Gaza) (72,586) 77,364
Grand Total 6,425,802 17,428,270
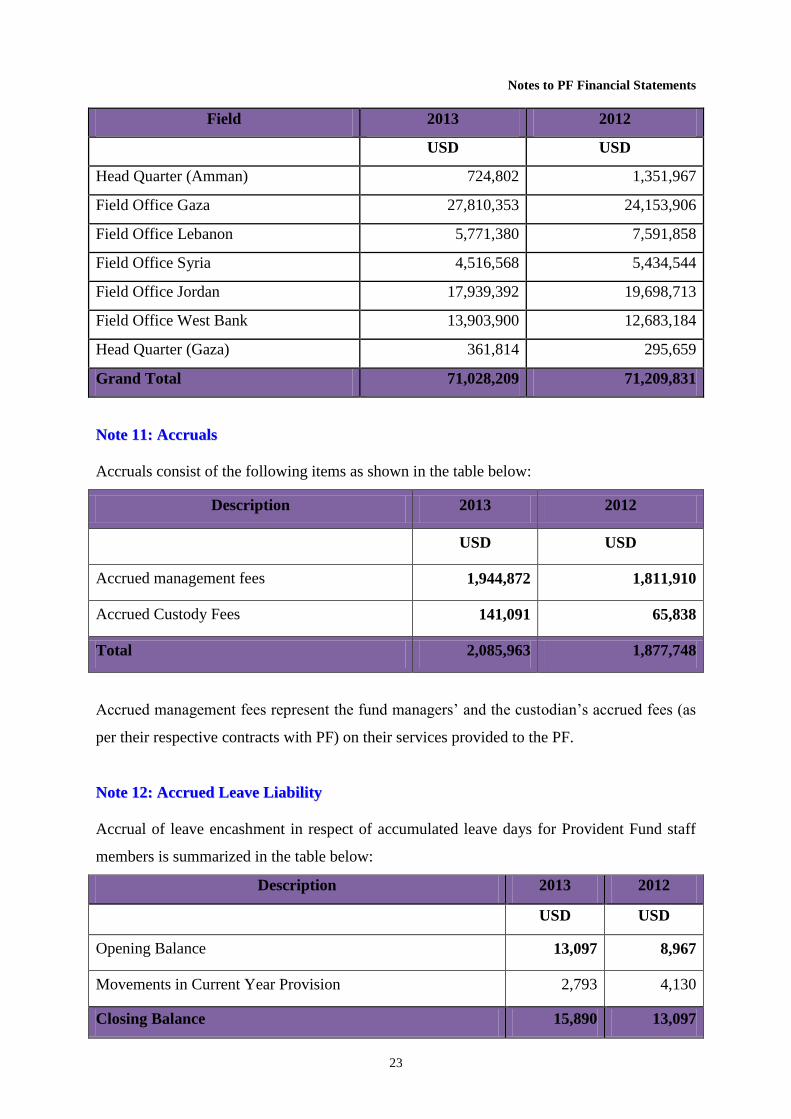
NNoottee 1100:: PPrroovviissiioonn ffoorr WWiitthhddrraawwaall LLiiaabbiilliittyy bbyy SSeeppaarraatteedd MMeemmbbeerrss
The provision for withdrawal liability by separated members is an obligation in which
UNRWA-PF would become liable for that amount when the separated members opt to
withdraw their PF balance at any time during the year.
Notes to PF Financial Statements
23
Field 2013 2012
USD USD
Head Quarter (Amman) 724,802 1,351,967
Field Office Gaza 27,810,353 24,153,906
Field Office Lebanon 5,771,380 7,591,858
Field Office Syria 4,516,568 5,434,544
Field Office Jordan 17,939,392 19,698,713
Field Office West Bank 13,903,900 12,683,184
Head Quarter (Gaza) 361,814 295,659
Grand Total 71,028,209 71,209,831
NNoottee 1111:: AAccccrruuaallss
Accruals consist of the following items as shown in the table below:
Description 2013 2012
USD USD
Accrued management fees 1,944,872 1,811,910
Accrued Custody Fees 141,091 65,838
Total 2,085,963 1,877,748
Accrued management fees represent the fund managers’ and the custodian’s accrued fees (as
per their respective contracts with PF) on their services provided to the PF.
NNoottee 1122:: AAccccrruueedd LLeeaavvee LLiiaabbiilliittyy
Accrual of leave encashment in respect of accumulated leave days for Provident Fund staff
members is summarized in the table below:
Description 2013 2012
USD USD
Opening Balance 13,097 8,967
Movements in Current Year Provision 2,793 4,130
Closing Balance 15,890 13,097
Notes to PF Financial Statements
24
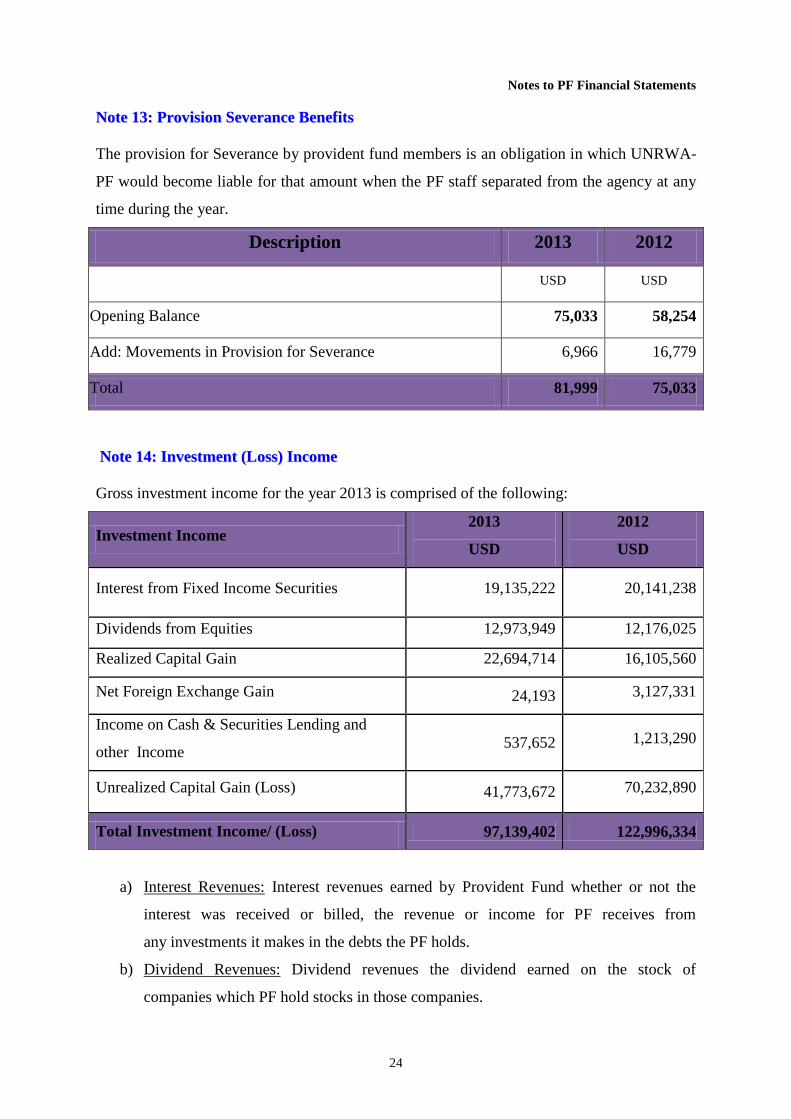
NNoottee 1133:: PPrroovviissiioonn SSeevveerraannccee BBeenneeffiittss
The provision for Severance by provident fund members is an obligation in which UNRWA-
PF would become liable for that amount when the PF staff separated from the agency at any
time during the year.
Description 2013 2012
USD USD
Opening Balance 75,033 58,254
Add: Movements in Provision for Severance 6,966 16,779
Total 81,999 75,033
NNoottee 1144:: IInnvveessttmmeenntt ((LLoossss)) IInnccoommee
Gross investment income for the year 2013 is comprised of the following:
Investment Income 2013
USD
2012
USD
Interest from Fixed Income Securities 19,135,222 20,141,238
Dividends from Equities 12,973,949 12,176,025
Realized Capital Gain 22,694,714 16,105,560
Net Foreign Exchange Gain 24,193 3,127,331
Income on Cash & Securities Lending and
other Income 537,652 1,213,290
Unrealized Capital Gain (Loss) 41,773,672 70,232,890
Total Investment Income/ (Loss) 97,139,402 122,996,334
a) Interest Revenues: Interest revenues earned by Provident Fund whether or not the
interest was received or billed, the revenue or income for PF receives from
any investments it makes in the debts the PF holds.
b) Dividend Revenues: Dividend revenues the dividend earned on the stock of
companies which PF hold stocks in those companies.
Notes to PF Financial Statements
25
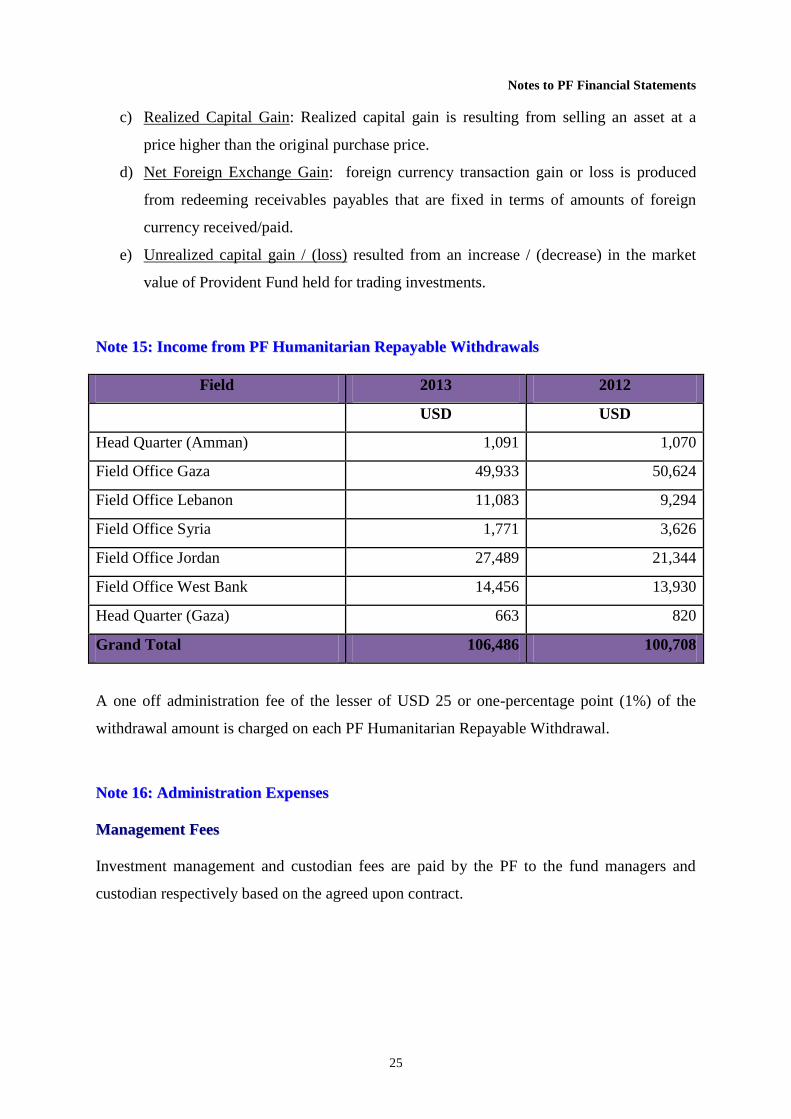
c) Realized Capital Gain: Realized capital gain is resulting from selling an asset at a
price higher than the original purchase price.
d) Net Foreign Exchange Gain: foreign currency transaction gain or loss is produced
from redeeming receivables payables that are fixed in terms of amounts of foreign
currency received/paid.
e) Unrealized capital gain / (loss) resulted from an increase / (decrease) in the market
value of Provident Fund held for trading investments.
NNoottee 1155:: IInnccoommee ffrroomm PPFF HHuummaanniittaarriiaann RReeppaayyaabbllee WWiitthhddrraawwaallss
Field 2013 2012
USD USD
Head Quarter (Amman) 1,091 1,070
Field Office Gaza 49,933 50,624
Field Office Lebanon 11,083 9,294
Field Office Syria 1,771 3,626
Field Office Jordan 27,489 21,344
Field Office West Bank 14,456 13,930
Head Quarter (Gaza) 663 820
Grand Total 106,486 100,708
A one off administration fee of the lesser of USD 25 or one-percentage point (1%) of the
withdrawal amount is charged on each PF Humanitarian Repayable Withdrawal.
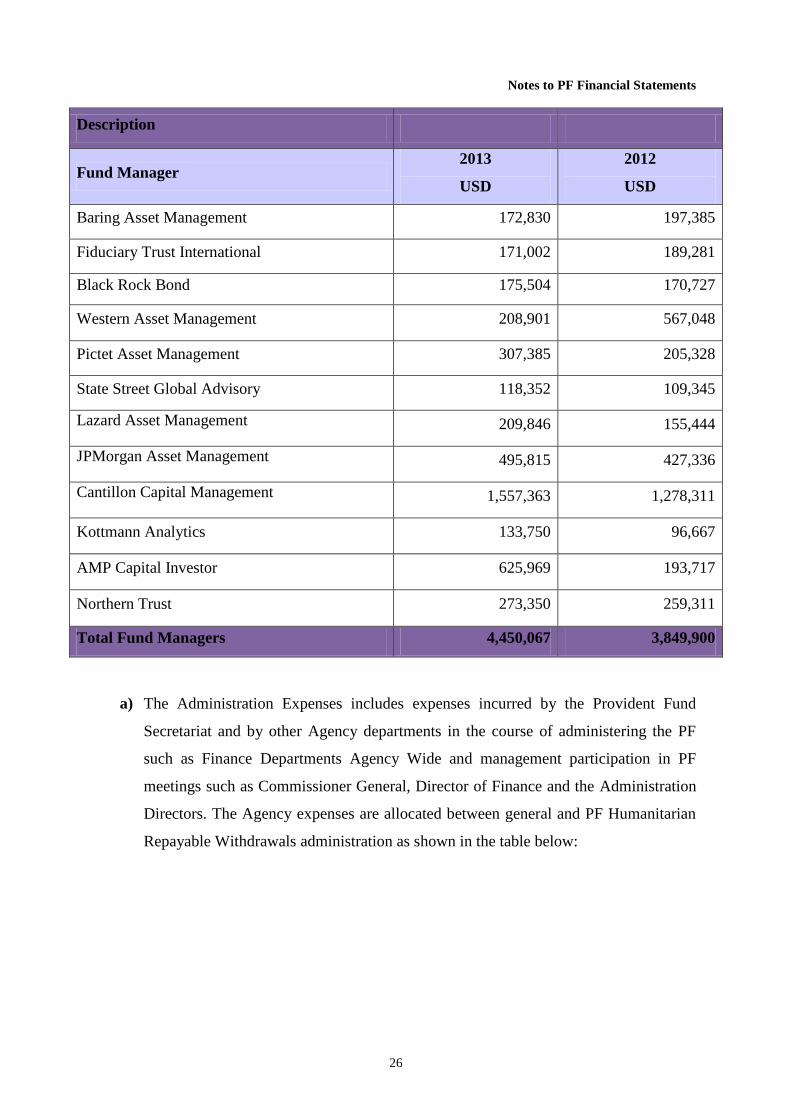
NNoottee 1166:: AAddmmiinniissttrraattiioonn EExxppeennsseess
MMaannaaggeemmeenntt FFeeeess
Investment management and custodian fees are paid by the PF to the fund managers and
custodian respectively based on the agreed upon contract.
Notes to PF Financial Statements
26
Description
Fund Manager 2013
USD
2012
USD
Baring Asset Management 172,830 197,385
Fiduciary Trust International 171,002 189,281
Black Rock Bond 175,504 170,727
Western Asset Management 208,901 567,048
Pictet Asset Management 307,385 205,328
State Street Global Advisory 118,352 109,345
Lazard Asset Management 209,846 155,444
JPMorgan Asset Management 495,815 427,336
Cantillon Capital Management 1,557,363 1,278,311
Kottmann Analytics 133,750 96,667
AMP Capital Investor 625,969 193,717
Northern Trust 273,350 259,311
Total Fund Managers 4,450,067 3,849,900
a) The Administration Expenses includes expenses incurred by the Provident Fund
Secretariat and by other Agency departments in the course of administering the PF
such as Finance Departments Agency Wide and management participation in PF
meetings such as Commissioner General, Director of Finance and the Administration
Directors. The Agency expenses are allocated between general and PF Humanitarian
Repayable Withdrawals administration as shown in the table below:
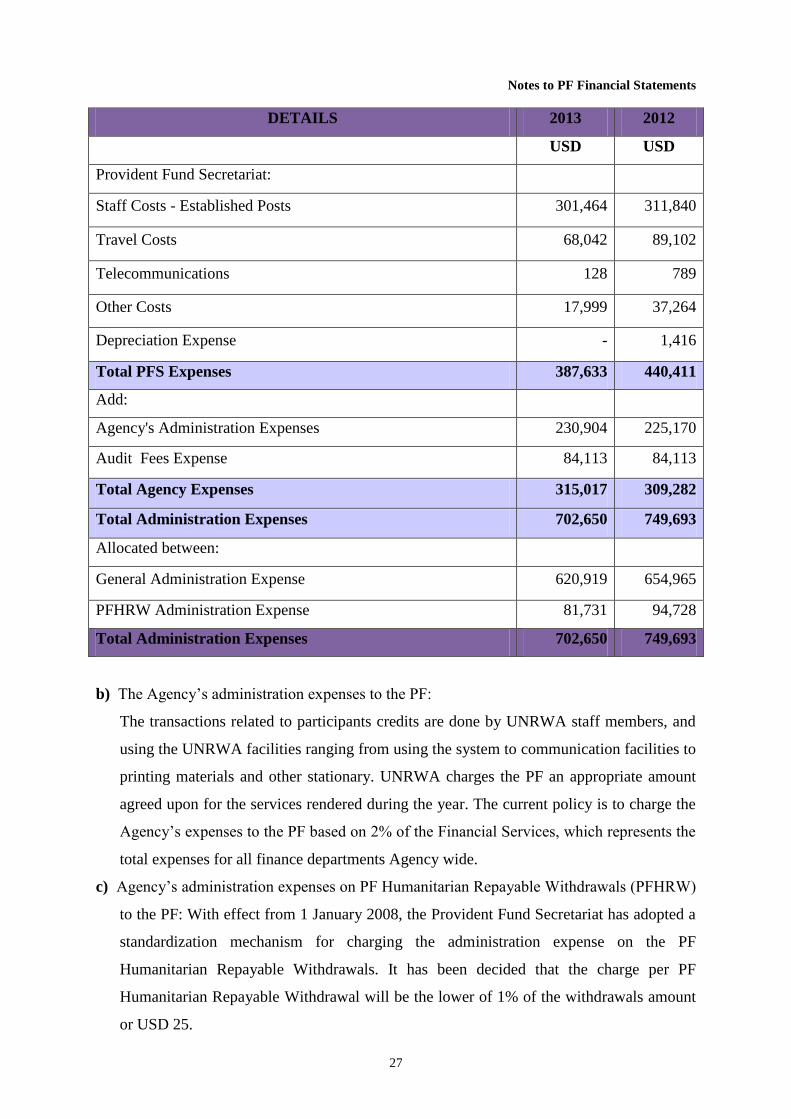
Notes to PF Financial Statements
27
DETAILS 2013 2012
USD USD
Provident Fund Secretariat:
Staff Costs - Established Posts 301,464 311,840
Travel Costs 68,042 89,102
Telecommunications 128 789
Other Costs 17,999 37,264
Depreciation Expense - 1,416
Total PFS Expenses 387,633 440,411
Add:
Agency's Administration Expenses 230,904 225,170
Audit Fees Expense 84,113 84,113
Total Agency Expenses 315,017 309,282
Total Administration Expenses 702,650 749,693
Allocated between:
General Administration Expense 620,919 654,965
PFHRW Administration Expense 81,731 94,728
Total Administration Expenses 702,650 749,693
b) The Agency’s administration expenses to the PF:
The transactions related to participants credits are done by UNRWA staff members, and
using the UNRWA facilities ranging from using the system to communication facilities to
printing materials and other stationary. UNRWA charges the PF an appropriate amount
agreed upon for the services rendered during the year. The current policy is to charge the
Agency’s expenses to the PF based on 2% of the Financial Services, which represents the
total expenses for all finance departments Agency wide.
c) Agency’s administration expenses on PF Humanitarian Repayable Withdrawals (PFHRW)
to the PF: With effect from 1 January 2008, the Provident Fund Secretariat has adopted a
standardization mechanism for charging the administration expense on the PF
Humanitarian Repayable Withdrawals. It has been decided that the charge per PF
Humanitarian Repayable Withdrawal will be the lower of 1% of the withdrawals amount
or USD 25.
Notes to PF Financial Statements
28
d) The administration of the conservative fund is within the main fund, the amount of USD
1,686 was charged to the conservative fund to cover the administration of the fund.
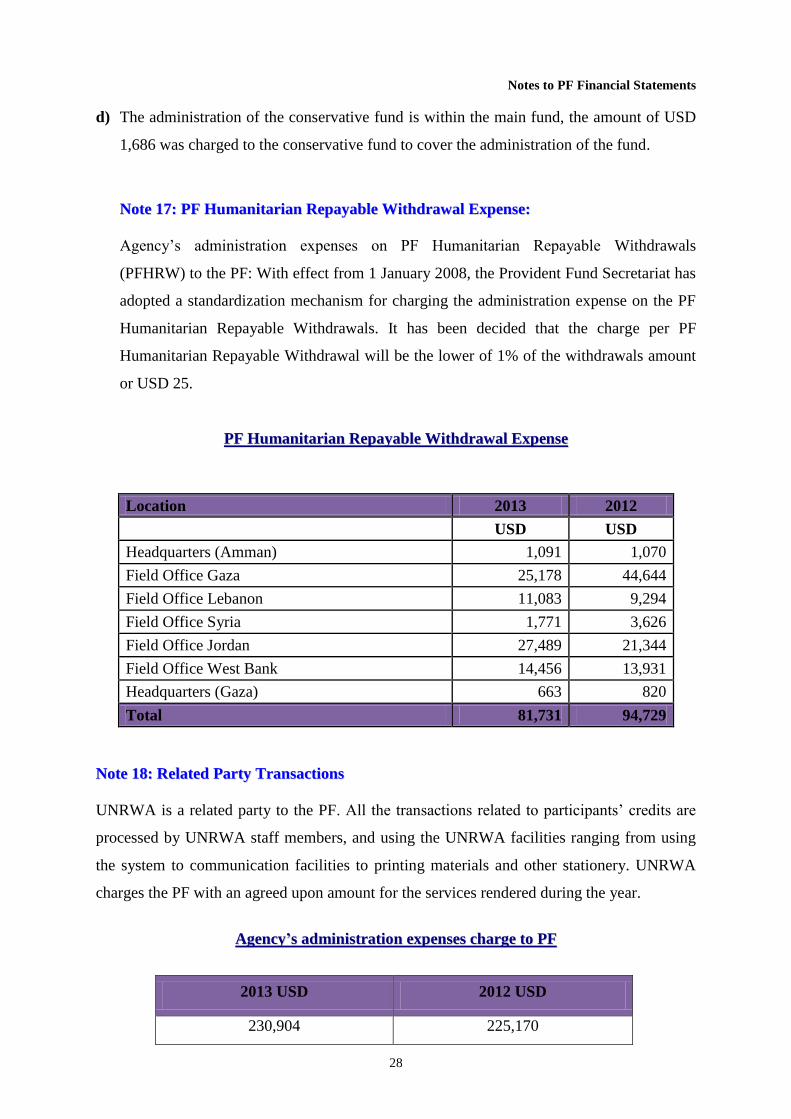
NNoottee 1177:: PPFF HHuummaanniittaarriiaann RReeppaayyaabbllee WWiitthhddrraawwaall EExxppeennssee::
Agency’s administration expenses on PF Humanitarian Repayable Withdrawals
(PFHRW) to the PF: With effect from 1 January 2008, the Provident Fund Secretariat has
adopted a standardization mechanism for charging the administration expense on the PF
Humanitarian Repayable Withdrawals. It has been decided that the charge per PF
Humanitarian Repayable Withdrawal will be the lower of 1% of the withdrawals amount
or USD 25.
PPFF HHuummaanniittaarriiaann RReeppaayyaabbllee WWiitthhddrraawwaall EExxppeennssee
Location 2013 2012
USD USD
Headquarters (Amman) 1,091 1,070
Field Office Gaza 25,178 44,644
Field Office Lebanon 11,083 9,294
Field Office Syria 1,771 3,626
Field Office Jordan 27,489 21,344
Field Office West Bank 14,456 13,931
Headquarters (Gaza) 663 820
Total 81,731 94,729
NNoottee 1188:: RReellaatteedd PPaarrttyy TTrraannssaaccttiioonnss
UNRWA is a related party to the PF. All the transactions related to participants’ credits are
processed by UNRWA staff members, and using the UNRWA facilities ranging from using
the system to communication facilities to printing materials and other stationery. UNRWA
charges the PF with an agreed upon amount for the services rendered during the year.
AAggeennccyy’’ss aaddmmiinniissttrraattiioonn eexxppeennsseess cchhaarrggee ttoo PPFF
2013 USD 2012 USD
230,904 225,170
Notes to PF Financial Statements
29
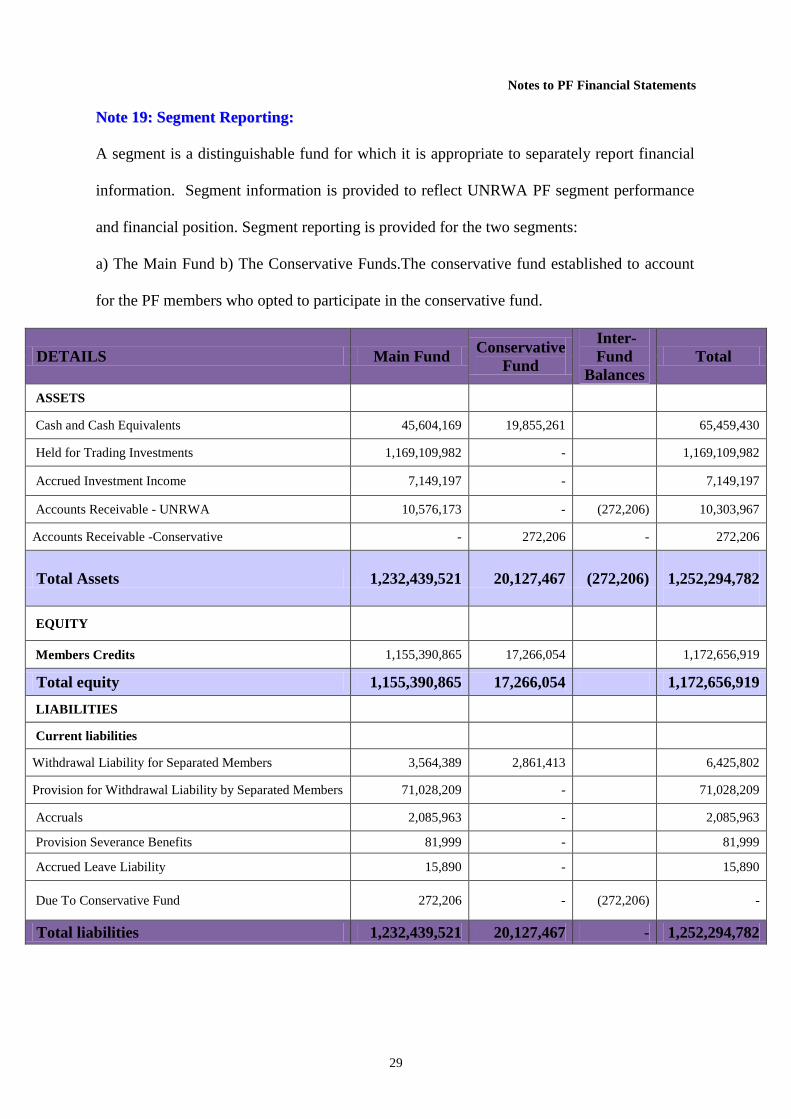
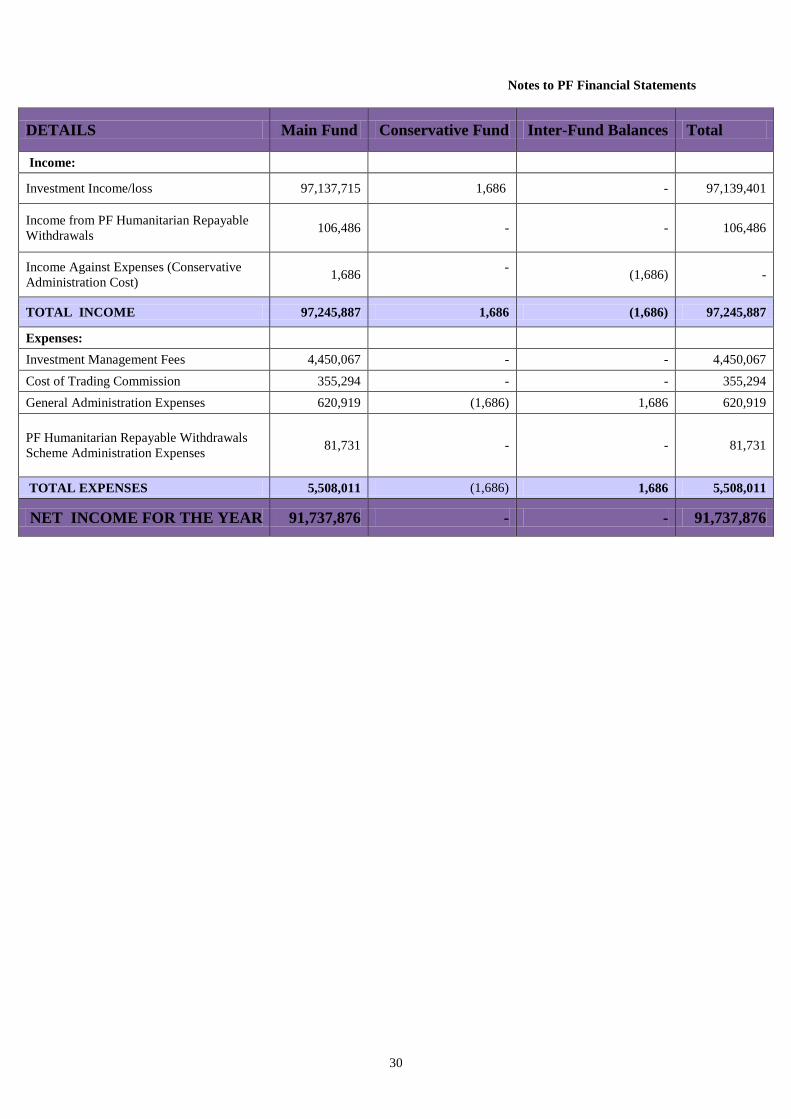
NNoottee 1199:: SSeeggmmeenntt RReeppoorrttiinngg::
A segment is a distinguishable fund for which it is appropriate to separately report financial
information. Segment information is provided to reflect UNRWA PF segment performance
and financial position. Segment reporting is provided for the two segments:
a) The Main Fund b) The Conservative Funds.The conservative fund established to account
for the PF members who opted to participate in the conservative fund.
DETAILS Main Fund Conservative
Fund
Inter-
Fund
Balances
Total
ASSETS
Cash and Cash Equivalents 45,604,169 19,855,261 65,459,430
Held for Trading Investments 1,169,109,982 - 1,169,109,982
Accrued Investment Income 7,149,197 - 7,149,197
Accounts Receivable - UNRWA 10,576,173 - (272,206) 10,303,967
Accounts Receivable -Conservative - 272,206 - 272,206
Total Assets 1,232,439,521 20,127,467 (272,206)
1,252,294,782
EQUITY
Members Credits 1,155,390,865 17,266,054 1,172,656,919
Total equity 1,155,390,865 17,266,054 1,172,656,919
LIABILITIES
Current liabilities
Withdrawal Liability for Separated Members 3,564,389 2,861,413 6,425,802
Provision for Withdrawal Liability by Separated Members 71,028,209 - 71,028,209
Accruals 2,085,963 - 2,085,963
Provision Severance Benefits 81,999 - 81,999
Accrued Leave Liability 15,890 - 15,890
Due To Conservative Fund 272,206 - (272,206) -
Total liabilities 1,232,439,521 20,127,467 - 1,252,294,782
Notes to PF Financial Statements
30
DETAILS Main Fund Conservative Fund Inter-Fund Balances Total
Income:
Investment Income/loss 97,137,715 1,686 - 97,139,401
Income from PF Humanitarian Repayable
Withdrawals 106,486 - - 106,486
Income Against Expenses (Conservative
Administration Cost) 1,686
-
(1,686) -
TOTAL INCOME 97,245,887 1,686 (1,686) 97,245,887
Expenses:
Investment Management Fees 4,450,067 - - 4,450,067
Cost of Trading Commission 355,294 - - 355,294
General Administration Expenses 620,919 (1,686) 1,686 620,919
PF Humanitarian Repayable Withdrawals
Scheme Administration Expenses 81,731 - - 81,731
TOTAL EXPENSES 5,508,011 (1,686) 1,686 5,508,011
NET INCOME FOR THE YEAR 91,737,876 - - 91,737,876


![Provident Fund [1]](https://img.pdfslide.us/doc/110x75/577d29e31a28ab4e1ea82754/provident-fund-1.jpg)