Embed Size (px)
Citation preview
Generic and robust method for automatic segmentation of PET imagesusing an active contour model
Mingzan ZhuangDepartment of Nuclear Medicine and Molecular Imaging, University of Groningen, University Medical CenterGroningen, 9700 RB Groningen, The Netherlands; Department of Radiation Oncology, Tumor Hospitalof Shantou University Medical College, Shantou, Guangdong 515000, China; and The Key Laboratoryof Digital Signal and Image Processing of Guangdong Province, Shantou University, Shantou,Guangdong 515000, China
Rudi A. J. O. DierckxDepartment of Nuclear Medicine and Molecular Imaging, University of Groningen, University Medical CenterGroningen, 9700 RB Groningen, The Netherlands
Habib Zaidia)
Division of Nuclear Medicine and Molecular Imaging, Geneva University Hospital,CH-1211 Geneva, Switzerland; Geneva Neuroscience Center, Geneva University,CH-1205 Geneva, Switzerland; and Department of Nuclear Medicine and Molecular Imaging,University of Groningen, University Medical Center Groningen, 9700 RB Groningen, The Netherlands
(Received 22 January 2016; revised 26 May 2016; accepted for publication 10 June 2016;published 14 July 2016)
Purpose: Although positron emission tomography (PET) images have shown potential to improvethe accuracy of targeting in radiation therapy planning and assessment of response to treatment, theboundaries of tumors are not easily distinguishable from surrounding normal tissue owing to the lowspatial resolution and inherent noisy characteristics of PET images. The objective of this study isto develop a generic and robust method for automatic delineation of tumor volumes using an activecontour model and to evaluate its performance using phantom and clinical studies.Methods: MASAC, a method for automatic segmentation using an active contour model, incorporatesthe histogram fuzzy C-means clustering, and localized and textural information to constrain the activecontour to detect boundaries in an accurate and robust manner. Moreover, the lattice Boltzmannmethod is used as an alternative approach for solving the level set equation to make it fasterand suitable for parallel programming. Twenty simulated phantom studies and 16 clinical studies,including six cases of pharyngolaryngeal squamous cell carcinoma and ten cases of nonsmall celllung cancer, were included to evaluate its performance. Besides, the proposed method was alsocompared with the contourlet-based active contour algorithm (CAC) and Schaefer’s thresholdingmethod (ST). The relative volume error (RE), Dice similarity coefficient (DSC), and classificationerror (CE) metrics were used to analyze the results quantitatively.Results: For the simulated phantom studies (PSs), MASAC and CAC provide similar segmenta-tions of the different lesions, while ST fails to achieve reliable results. For the clinical datasets(2 cases with connected high-uptake regions excluded) (CSs), CAC provides for the lowest mean RE(−8.38%±27.49%), while MASAC achieves the best mean DSC (0.71±0.09) and mean CE(53.92%±12.65%), respectively. MASAC could reliably quantify different types of lesions as-sessed in this work with good accuracy, resulting in a mean RE of −13.35%±11.87% and−11.15%±23.66%, a mean DSC of 0.89±0.05 and 0.71±0.09, and a mean CE of 19.19%±7.89%and 53.92%±12.65%, for PSs and CSs, respectively.Conclusions: The authors’ results demonstrate that the developed novel PET segmentation algo-rithm is applicable to various types of lesions in the authors’ study and is capable of producingaccurate and consistent target volume delineations, potentially resulting in reduced intraobserverand interobserver variabilities observed when using manual delineation and improved accuracy intreatment planning and outcome evaluation. C 2016 American Association of Physicists in Medicine.[http://dx.doi.org/10.1118/1.4954844]
Key words: PET, segmentation, active contour models, fuzzy C-means clustering, quantification
1. INTRODUCTION
Hybrid molecular positron emission tomography/comput-erized tomography (PET/CT) imaging-guided radiationtherapy makes use of advanced imaging technology for
improved definition of tumor target volumes, thus relatingthe absorbed dose information to image-based patientrepresentations. The information provided by PET imagesregarding metabolic activity and the spatial location oflesions is helpful in delineating the target tumor required
4483 Med. Phys. 43 (8), August 2016 0094-2405/2016/43(8)/4483/12/$30.00 © 2016 Am. Assoc. Phys. Med. 4483
4484 Zhuang, Dierckx, and Zaidi: Automated PET image segmentation 4484
for assessment of response to treatment or radiation therapytreatment planning. However, one of the challenges ofPET/CT imaging-guided target volume delineation is the lackof accurate standardized algorithms enabling the segmentationof target volumes, which is caused by the low spatial resolutionand intrinsic noisy properties of PET images.
A number of PET segmentation algorithms have beendeveloped during the last 15 years. These algorithms can beroughly divided into four categories: thresholding techniques,variational approaches, learning methods, and stochasticmodeling-based methods. At the present time, there is noconsensus on the best performing algorithm that can beadopted as standard for all or a number of indications.1–3
Previous studies have shown a large variability in terms ofcomputational complexity and amount of user interactionrequired by the various image segmentation techniques.4–6
Recent reviews of state-of-the-art PET image segmentationtechniques indicate that there is no optimal solution for alltypes of clinical oncology indications with respect to accuracy,precision, and efficiency.7–9 As such, PET image segmentationremains an active and open research topic, leading to anambient tendency toward yapetism (yet another PET imagesegmentation method).9
In this work, we focus on combining existing algorithmsinto a novel region-based method for automatic segmentationusing an active contour model (MASAC) to enhancerobustness and generalness rather than proposing yet anotherPET segmentation method. This algorithm incorporates bothhistogram fuzzy C-means (FCM) clustering and textural infor-mation to constrain the active contour to detect the boundariesin an accurate and robust way, without requiring the settingof user-defined parameters. Moreover, we make the algorithmmore efficient and appropriate for parallel programming bytaking the lattice Boltzmann method (LBM) as an alternativeto solve the level set equation. The proposed model is quitegeneral and can be applied in many clinical scenarios.
2. MATERIALS AND METHODS2.A. PET image segmentation algorithm
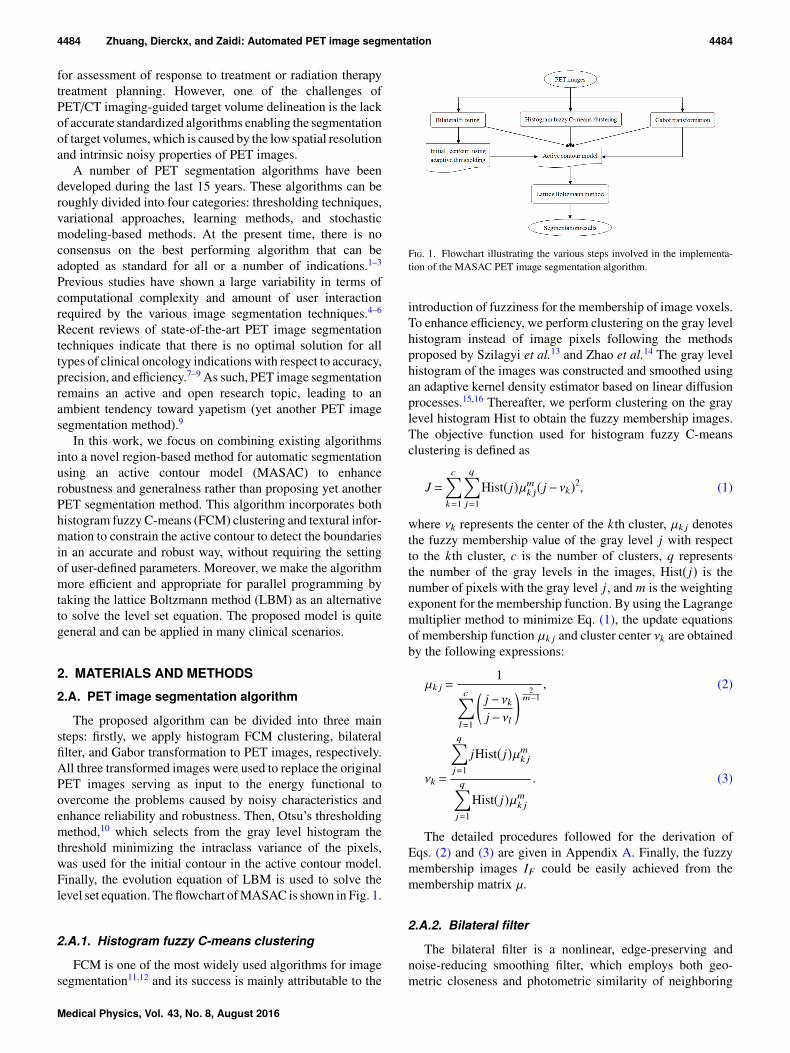
The proposed algorithm can be divided into three mainsteps: firstly, we apply histogram FCM clustering, bilateralfilter, and Gabor transformation to PET images, respectively.All three transformed images were used to replace the originalPET images serving as input to the energy functional toovercome the problems caused by noisy characteristics andenhance reliability and robustness. Then, Otsu’s thresholdingmethod,10 which selects from the gray level histogram thethreshold minimizing the intraclass variance of the pixels,was used for the initial contour in the active contour model.Finally, the evolution equation of LBM is used to solve thelevel set equation. The flowchart of MASAC is shown in Fig. 1.
2.A.1. Histogram fuzzy C-means clustering
FCM is one of the most widely used algorithms for imagesegmentation11,12 and its success is mainly attributable to the
F. 1. Flowchart illustrating the various steps involved in the implementa-tion of the MASAC PET image segmentation algorithm.
introduction of fuzziness for the membership of image voxels.To enhance efficiency, we perform clustering on the gray levelhistogram instead of image pixels following the methodsproposed by Szilagyi et al.13 and Zhao et al.14 The gray levelhistogram of the images was constructed and smoothed usingan adaptive kernel density estimator based on linear diffusionprocesses.15,16 Thereafter, we perform clustering on the graylevel histogram Hist to obtain the fuzzy membership images.The objective function used for histogram fuzzy C-meansclustering is defined as
J =c
k=1
qj=1
Hist( j)µmk j( j− νk)2, (1)
where νk represents the center of the kth cluster, µk j denotesthe fuzzy membership value of the gray level j with respectto the kth cluster, c is the number of clusters, q representsthe number of the gray levels in the images, Hist( j) is thenumber of pixels with the gray level j, and m is the weightingexponent for the membership function. By using the Lagrangemultiplier method to minimize Eq. (1), the update equationsof membership function µk j and cluster center νk are obtainedby the following expressions:
µk j =1
cl=1
(j− νkj− νl
) 2m−1
, (2)
νk =
qj=1
jHist( j)µmk jqj=1
Hist( j)µmk j. (3)
The detailed procedures followed for the derivation ofEqs. (2) and (3) are given in Appendix A. Finally, the fuzzymembership images IF could be easily achieved from themembership matrix µ.
2.A.2. Bilateral filter
The bilateral filter is a nonlinear, edge-preserving andnoise-reducing smoothing filter, which employs both geo-metric closeness and photometric similarity of neighboring
Medical Physics, Vol. 43, No. 8, August 2016
4485 Zhuang, Dierckx, and Zaidi: Automated PET image segmentation 4485
pixels to construct its filter kernel.17,18 The intensity value ofeach image pixel would be substituted by a weighted averageintensity value from neighborhood pixels. This weight canbe based on a Gaussian distribution. More specifically, theweights depend not only on the geometric distance betweenpixels, but also on the radiometric differences, such asthe intensity differences in PET images. By systematicallysweeping through image pixels, the bilateral filter couldreduce noise while preserving sharp edges in images.Considering a gray-level image I, the output IB of the bilateralfilter is given by
IB(p) = 1q∈S
Gσs(∥p−q∥)Gσr(|I(p)− I(q)|)
×q∈S
Gσs(∥p−q∥)Gσr(|I(p)− I(q)|)I(q), (4)
where S is a spatial neighborhood of p, σs is the parametercontrolling the decay of the geometric factor, and σr to controlthe decay of the radiometric factor, while Gσs and Gσr areGaussian smoothing functions for the spatial kernel and rangekernel, respectively. Lee et al.19 studied in detail the bilateralfilter and gave some indications regarding the setting of theparameters σs and σr . In this work, we simply derive thetotal variance from the smoothed histogram of the images todetermine the values of σs and σr by default, 3 for the imageswith low variance and 1 for images with high variance.
2.A.3. 3D Gabor function
The Gabor function has often been used in imageprocessing. It has been demonstrated that it is particularlyappropriate for texture representation and discrimination,because it is similar to the human visual system, as explainedin the work of Kamarainen et al.20 With the orientation anglesϕ set to 90, θ to 0, the 3D Gabor function in our work isdefined as
G(x,y,z)= S×exp(− 1
2σ2
x2+ y2+ z2
)×cos(2π f x), (5)
where S is the normalization scale factor, σ is the size of theGaussian window, and f is the frequency of the sinusoidal.The detailed procedure for implementation of the Gabor filterare given in Appendix B.
2.A.4. The energy function
Let φ :Ω→ R be a level set function defined on a domain,the commonly used region-based energy, the Chan–Veseenergy,21 was used as the energy term E to minimize, whichis given as follows:
E (φ) ,Ω
(H (φ)(I− µ)2+ (1−H (φ))(I−υ)2) dxdydz, (6)
where H is the Heaviside function, φ is the level set function,which is here a signed distance function, and µ and υ are the
mean values defined as
µ=
Ω
I (x,y,z)H (φ)dxdydzΩ
H (φ)dxdydz, (7)
υ =
Ω
I (x,y,z)(1−H (φ))dxdydzΩ(1−H (φ))dxdydz
. (8)
This energy E models the foreground and background asconstant intensities represented by their means, µ and υ.
By using the histogram FCM membership images IF,the bilateral smoothed images IB, and the averaged Gabortransform images IG as input in Eq. (6), we obtain thefollowing energy function:
E (φ) ,Ω
(H (φ)(IF (x,y,z)− µF)2
+ (1−H (φ))(IF (x,y,z)−υF)2)
dxdydz
+
Ω
(H (φ)(IB(x,y,z)− µB)2
+ (1−H (φ))(IB(x,y,z)−υB)2)
dxdydz
+
Ω
(H (φ)(IG(x,y,z)− µG)2
+ (1−H (φ))(IG(x,y,z)−υG)2)
dxdydz. (9)
Thus the level set function φ can be obtained from theabove defined energy functional by differentiation using thegradient descent method,
∂φ
∂t=−∂E
∂φ. (10)
According to Eq. (9), Eq. (10) is equivalent to the followingevolution equation:
∂φ
∂t= −δ(φ) ((IF− µF)2− (IF−υF)2
)−δ(φ) ((IB− µB)2− (IB−υB)2
)−δ(φ) ((IG− µG)2− (IG−υG)2) , (11)
where δ(φ) is the Dirac delta function, defined as the derivativeof the Heaviside function with respect to φ.
2.A.5. Lattice Boltzmann method
LBM is a relatively new simulation technique forcomplex fluid systems, which is solved to simulate theflow of a Newtonian fluid with collision models, such asBhatnagar–Gross–Krook (BGK). By simulating streamingand propagation processes across a limited number ofparticles, the interaction of internal particles evinces amicrocosm of this macroviscous fluid flow. This modelhas attracted the interest of image segmentation researchersbecause of its simplicity and highly parallelizable nature.22,23
In our model, the D3Q19 LBM lattice structure, where D isthe dimension and Q is the number of velocity directions,representing the three-dimensional 19 velocity lattice, wasused to solve the level set equation.24 The evolution equationof LBM is given by
f i (r+ ei,t+1)− f i (r ,t)=ΩBGK, (12)
Medical Physics, Vol. 43, No. 8, August 2016
4486 Zhuang, Dierckx, and Zaidi: Automated PET image segmentation 4486
where f i is the function for the particle distribution, ei is thedirectional unit vector, and ΩBGK is the BGK model, as givenbelow,
ΩBGK=1τ
f eqi (r ,t)− f i (r ,t)+ 2×τ−1
2×τ× F× ei, (13)
where τ is the relaxation time and f eqi is the local equilibriumparticle distribution, which is defined as follows whenmodeling the diffusion phenomenon:
f eqi (ρ)= ρAi, (14)
where ρ=
f i, and Ai is the weighting factor. The body forceF in Eq. (13) can be defined as
F , λ∂φ
∂t= −λδ(φ) ((IF− µF)2− (IF−υF)2
)−λδ(φ) ((IB− µB)2− (IB−υB)2
)−λδ(φ) ((IG− µG)2− (IG−υG)2) , (15)
where λ is the parameter used to modulate the strength of Fon the active contour motion. The larger the value of λ, thelarger the segmentation contours. In this study, λ was set as 1for all studies acquired on different PET scanners and usingdifferent protocols to test the generalness and robustness ofthe MASAC algorithm. To achieve better results in specificsetting, the parameter λ in MASAC could be used to calibratethe algorithm for a specific scanner/data acquisition orreconstruction protocols by trial-and-error experiments usingphantom studies. The proposed level set equation can thus besolved to obtain the final active contour segmentation resultsusing the following lattice Boltzmann evolution equation:
f i (r+ ei,t+1) = f i (r ,t)+ 1τ
f eqi (r ,t)− f i (r ,t)
−λδ(φ) 2×τ−12×τ
((IF− µF)2− (IF−υF)2)
−λδ(φ) 2×τ−12×τ
((IB− µB)2− (IB−υB)2)
−λδ(φ) 2×τ−12×τ
((IG− µG)2− (IG−υG)2) .(16)
2.B. Phantom and clinical studies
To evaluate the proposed method’s performance, the algo-rithm was evaluated using phantom and clinical studies.Phantom studies were performed using the 4D extendedcardiac-torso (XCAT) phantom, a realistic whole-body com-puter model based on nonuniform rational B-spline surfacesrepresenting the human anatomy and physiology.25 Realisticlesion shapes with three different levels of tracer uptake,heterogeneous within the tumor, were modeled based on clin-ical PET images and incorporated within the XCAT phantomaccording to the procedures proposed by Le Maitre et al.26
In our study, thresholding was used to delineate differentirregularly shaped heterogeneities within tumors extractedfrom clinical images. Thereafter, the 3D mesh of segmentedstructures was reconstructed using software (FEI, USA)and converted into nonuniform rational B-spline (NURBS)
surfaces using software (CADLINK, France). Fi-nally, different NURBS surfaces, each representing a specificactivity level, were created to model the heterogeneities withinthe tumor. In our study, three levels of activity concentrationwere modeled as it was deemed to represent more realisticallytumors than two levels of heterogeneities adopted by Le Maitreet al.26 The levels of the uptake ratio within the lesions were10:9:8, with the background outside the lesions set to 1. Theseratios were observed in many clinical studies and are also inagreement with contrast levels adopted by other groups.27–30
Ten different lesions were simulated in two different lung loca-tions, without or with high activity in the nearby myocardium(volume range 3.26–41.44 cm3). Respiration motion was notconsidered for the simulated studies in this work. The atten-uation maps generated at 511 keV were used for attenuationcorrection during image reconstruction. The matrix size of allimages (both activity and attenuation maps) was 288× 288with a voxel size of 2.13×2.13×3.27 mm. For PET simulation,we used an analytical projector and ordered subsets expec-tation maximization reconstruction algorithm implementedwithin the software for tomographic image reconstruction() modeling a GE Discovery RX PET/CT scanner.31 The511-keV attenuation maps were applied to model attenuationduring the simulation process.
The clinical studies include six cases of pharyngo-laryngeal squamous cell carcinoma (PH), volume range(4.03–32.92 cm3) and ten cases of nonsmall cell lung cancer(LU), volume range (1.12–46.28 cm3), where the ground truth3D contours were derived from the macroscopic specimen ob-tained after surgery.32,33 The mean tumor to background ratioin the clinical studies is 7.98±5.83 (range 2.20–21.10). Gatedimage acquisition was performed for the LU datasets. Twopatients in LU had lesions connected with a high activity areanearby, which are difficult to distinguish and separate. Thesetwo lesions were carefully cropped to exclude the nearby highactivity region as performed in our previous work.34
2.C. Comparative study and evaluation metrics
This proposed method was compared with the contourlet-based active contour algorithm (CAC)34 and Schaefer’s thresh-olding method (ST).35 Widely adopted image segmentationmetrics including the relative volume error (RE), Dicesimilarity coefficient (DSC), and classification error (CE)were used to evaluate quantitatively the performance of thesePET image segmentation algorithms. They are defined as
RE=(volume(SM)−volume(GT))
volume(GT) ×100%, (17)
DSC=2× |SM∩GT||SM|+ |GT| , (18)
CE=FN+FP
TP×100%, (19)
where SM and GT represent the output of PET imagesegmentation method and the ground truth, respectively,FN and FP are the false negative and false positive errors,respectively, and TP is total number of voxels within the
Medical Physics, Vol. 43, No. 8, August 2016
4487 Zhuang, Dierckx, and Zaidi: Automated PET image segmentation 4487
ground truth volume.36–38 An additional metric, K , reportingthe ratio of FN/TP is also added to split CE into contributionsfrom FN and FP,
K =FNTP×100%. (20)
The results are expressed as means with standard devia-tions, and presented as box-and-whisker plots as appropriate,providing lower to upper quartile (25–75 percentile, centralbox), the median (middle line of the box), and the minimumto maximum value.
3. RESULTS
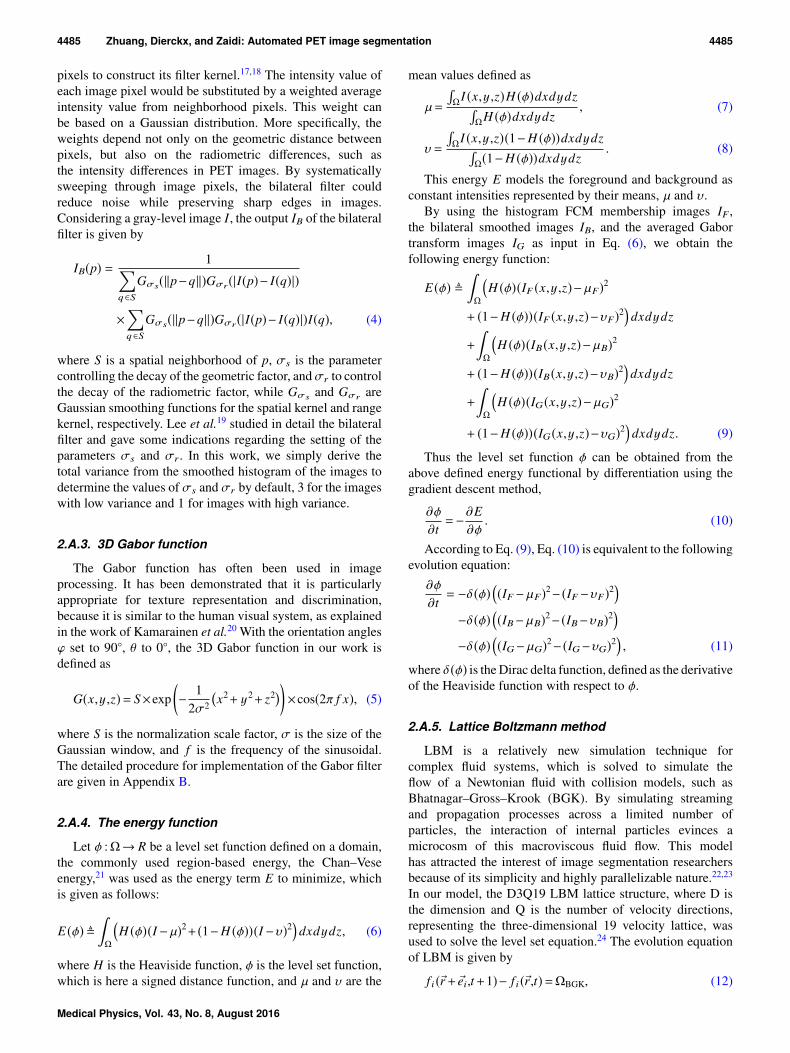
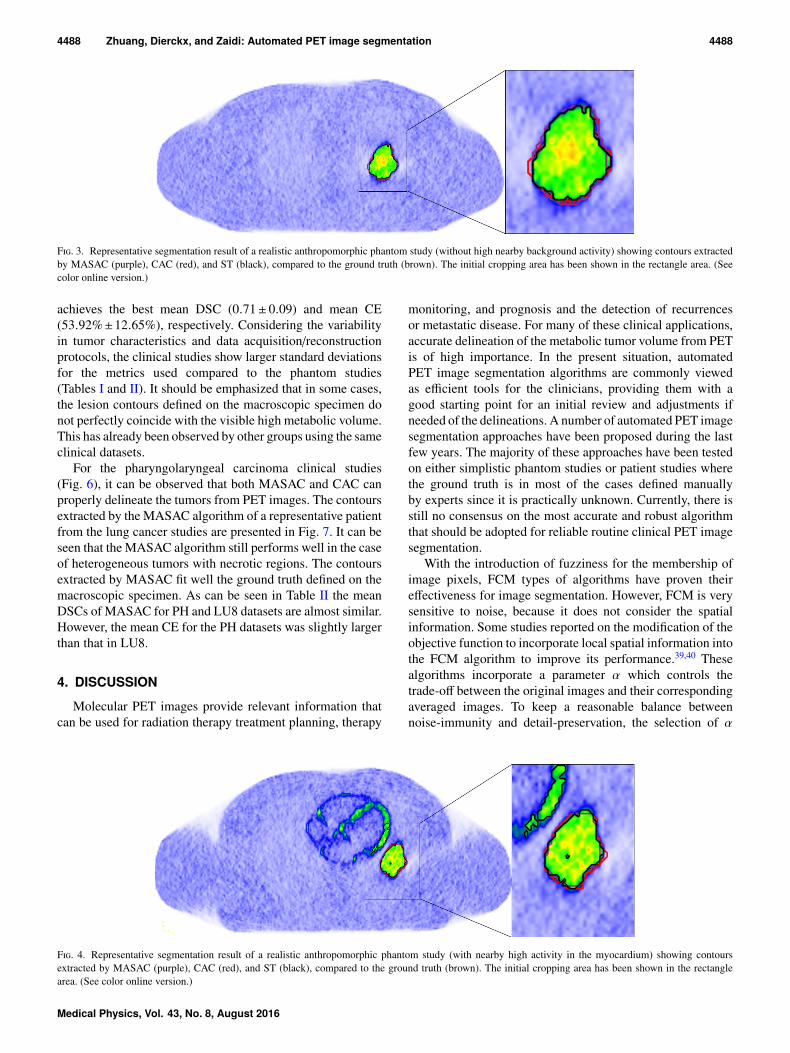
Figure 2 summarizes the performance metrics of thesegmentations for the phantom studies. The means andstandard deviations of the metrics for all phantom studies arepresented in Table I. For the simulated XCAT phantom studies(PSs), MASAC and CAC provide similar segmentations ofthe different lesions, while ST fails to achieve reliable results.For MASAC, it can be seen that there is no major differencebetween the mean values of the metrics between phantomstudies without high nearby activity (PS1) and phantomstudies with nearby high background activity (PS2), indicatingthe robustness of MASAC in different clinical scenarios.Figures 3 and 4 show representative contours on realisticanthropomorphic phantom studies without and with nearbyhigh background activity, respectively.
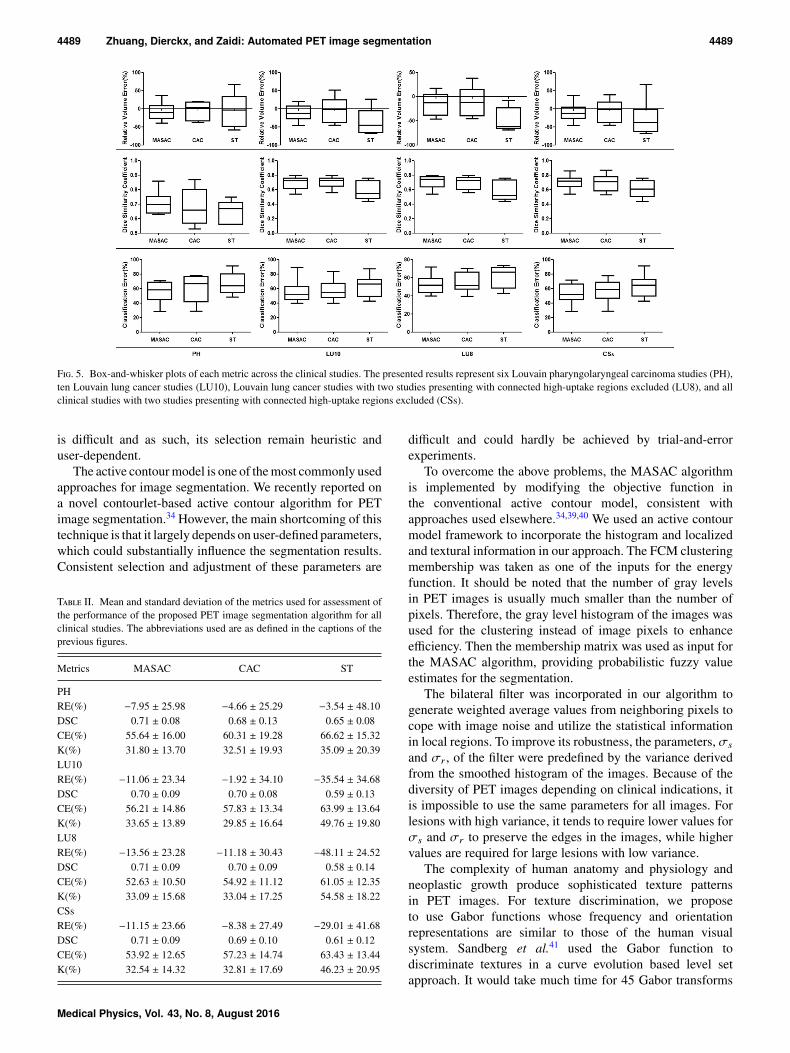
Figure 5 shows box-and-whisker plots for all metricsacross the clinical studies. For patients involved in the study
T I. Mean and standard deviation of the metrics used for assessment ofthe performance of the proposed PET image segmentation algorithm for allphantom studies. The abbreviations used are as defined in the captions of theprevious figures.
Metrics MASAC CAC ST
PS1RE(%) −12.60 ± 11.66 14.78 ± 8.40 −25.10 ± 13.78DSC 0.90 ± 0.04 0.92 ± 0.03 0.85 ± 0.08CE(%) 18.23 ± 7.24 17.35 ± 7.92 25.60 ± 13.00K(%) 15.41 ± 9.21 1.28 ± 1.88 25.35 ± 13.39PS2RE(%) −14.10 ± 12.65 19.97 ± 14.24 8.69 ± 28.06DSC 0.89 ± 0.06 0.90 ± 0.06 0.67 ± 0.12CE(%) 20.15 ± 8.78 22.51 ± 16.00 68.87 ± 29.76K(%) 17.13 ± 10.47 1.27 ± 1.88 30.09 ± 15.54PSsRE(%) −13.35 ± 11.87 17.37 ± 11.69 −8.21 ± 27.63DSC 0.89 ± 0.05 0.91 ± 0.05 0.76 ± 0.14CE(%) 19.19 ± 7.89 19.93 ± 12.57 47.24 ± 31.50K(%) 16.27 ± 9.64 1.28 ± 1.83 27.72 ± 14.32
protocol with those presenting with connected high-uptakeregions excluded (CSs), the mean DSC for MASAC wasfound to be larger than 0.70, with a DSC larger than 0.60(13 of 14 patients) in most of the cases, indicating a goodquality of segmentation of the clinical studies. Table IIlists the mean and standard deviations of the metrics forthe clinical studies. It can be seen that CAC provides forthe lowest mean RE (−8.38%± 27.49%), while MASAC
F. 2. Box-and-whisker plots of each metric across the phantom studies. The presented results represent phantom studies without nearby high activity (PS1),phantom studies with nearby high activity (PS2), and all phantom studies (PSs).
Medical Physics, Vol. 43, No. 8, August 2016
4488 Zhuang, Dierckx, and Zaidi: Automated PET image segmentation 4488
F. 3. Representative segmentation result of a realistic anthropomorphic phantom study (without high nearby background activity) showing contours extractedby MASAC (purple), CAC (red), and ST (black), compared to the ground truth (brown). The initial cropping area has been shown in the rectangle area. (Seecolor online version.)
achieves the best mean DSC (0.71± 0.09) and mean CE(53.92%±12.65%), respectively. Considering the variabilityin tumor characteristics and data acquisition/reconstructionprotocols, the clinical studies show larger standard deviationsfor the metrics used compared to the phantom studies(Tables I and II). It should be emphasized that in some cases,the lesion contours defined on the macroscopic specimen donot perfectly coincide with the visible high metabolic volume.This has already been observed by other groups using the sameclinical datasets.
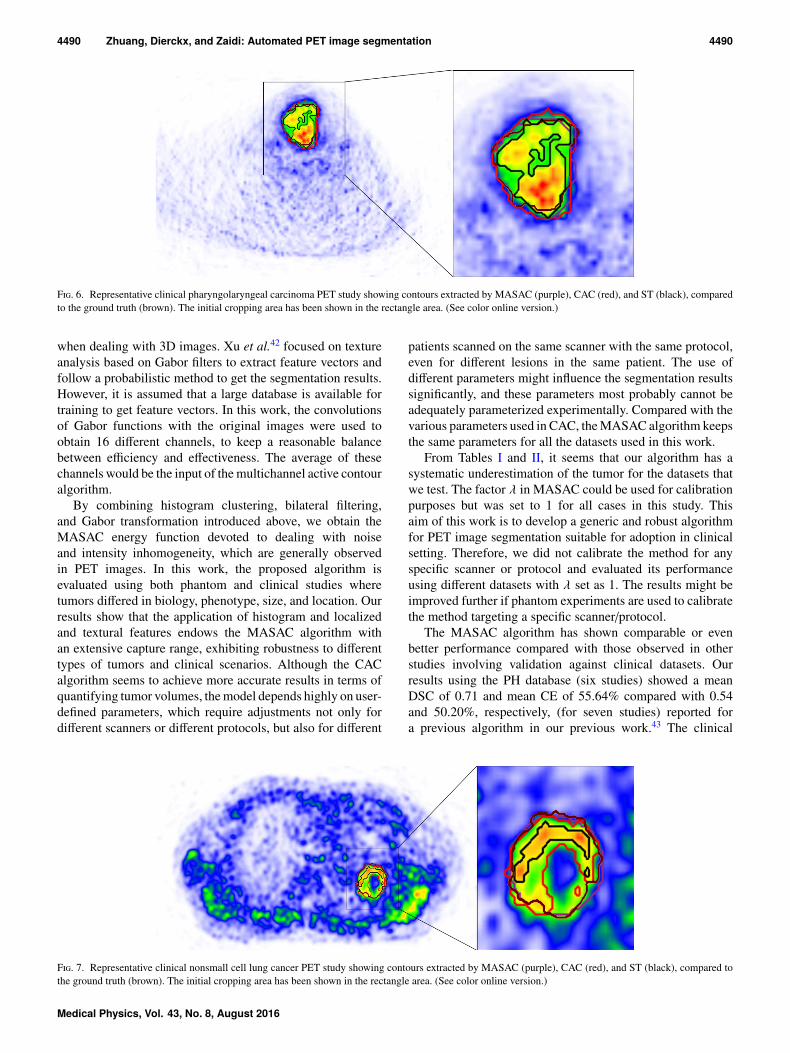
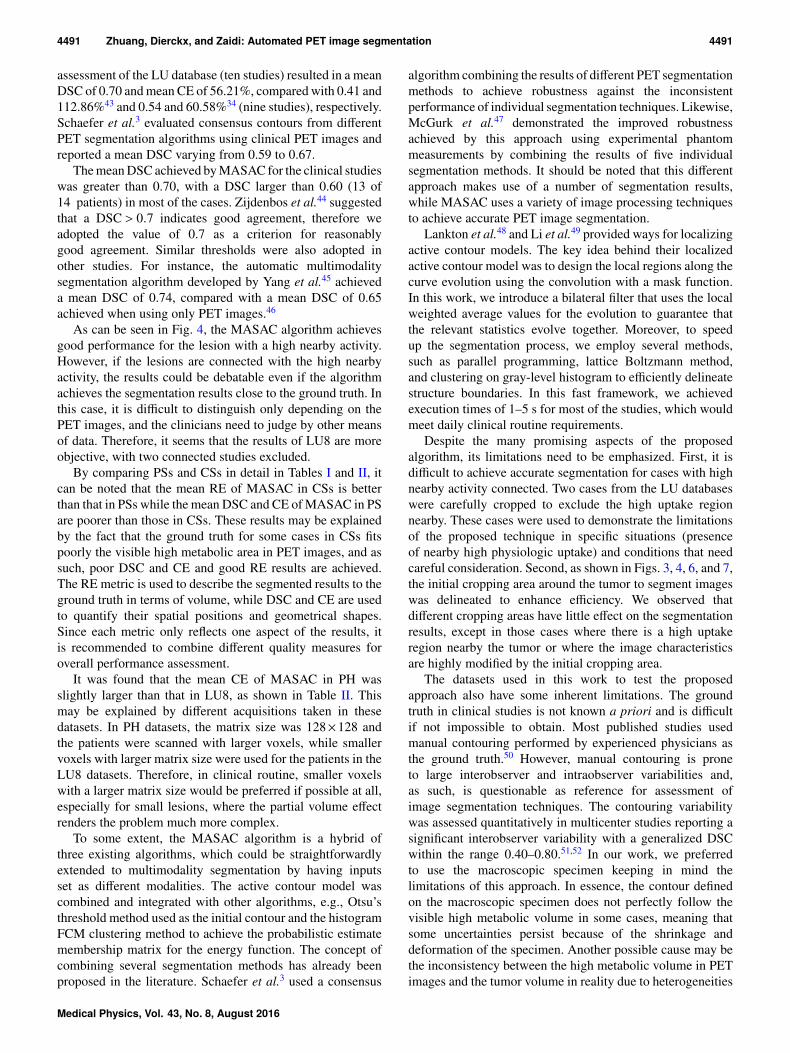
For the pharyngolaryngeal carcinoma clinical studies(Fig. 6), it can be observed that both MASAC and CAC canproperly delineate the tumors from PET images. The contoursextracted by the MASAC algorithm of a representative patientfrom the lung cancer studies are presented in Fig. 7. It can beseen that the MASAC algorithm still performs well in the caseof heterogeneous tumors with necrotic regions. The contoursextracted by MASAC fit well the ground truth defined on themacroscopic specimen. As can be seen in Table II the meanDSCs of MASAC for PH and LU8 datasets are almost similar.However, the mean CE for the PH datasets was slightly largerthan that in LU8.
4. DISCUSSION
Molecular PET images provide relevant information thatcan be used for radiation therapy treatment planning, therapy
monitoring, and prognosis and the detection of recurrencesor metastatic disease. For many of these clinical applications,accurate delineation of the metabolic tumor volume from PETis of high importance. In the present situation, automatedPET image segmentation algorithms are commonly viewedas efficient tools for the clinicians, providing them with agood starting point for an initial review and adjustments ifneeded of the delineations. A number of automated PET imagesegmentation approaches have been proposed during the lastfew years. The majority of these approaches have been testedon either simplistic phantom studies or patient studies wherethe ground truth is in most of the cases defined manuallyby experts since it is practically unknown. Currently, there isstill no consensus on the most accurate and robust algorithmthat should be adopted for reliable routine clinical PET imagesegmentation.
With the introduction of fuzziness for the membership ofimage pixels, FCM types of algorithms have proven theireffectiveness for image segmentation. However, FCM is verysensitive to noise, because it does not consider the spatialinformation. Some studies reported on the modification of theobjective function to incorporate local spatial information intothe FCM algorithm to improve its performance.39,40 Thesealgorithms incorporate a parameter α which controls thetrade-off between the original images and their correspondingaveraged images. To keep a reasonable balance betweennoise-immunity and detail-preservation, the selection of α
F. 4. Representative segmentation result of a realistic anthropomorphic phantom study (with nearby high activity in the myocardium) showing contoursextracted by MASAC (purple), CAC (red), and ST (black), compared to the ground truth (brown). The initial cropping area has been shown in the rectanglearea. (See color online version.)
Medical Physics, Vol. 43, No. 8, August 2016
4489 Zhuang, Dierckx, and Zaidi: Automated PET image segmentation 4489
F. 5. Box-and-whisker plots of each metric across the clinical studies. The presented results represent six Louvain pharyngolaryngeal carcinoma studies (PH),ten Louvain lung cancer studies (LU10), Louvain lung cancer studies with two studies presenting with connected high-uptake regions excluded (LU8), and allclinical studies with two studies presenting with connected high-uptake regions excluded (CSs).
is difficult and as such, its selection remain heuristic anduser-dependent.
The active contour model is one of the most commonly usedapproaches for image segmentation. We recently reported ona novel contourlet-based active contour algorithm for PETimage segmentation.34 However, the main shortcoming of thistechnique is that it largely depends on user-defined parameters,which could substantially influence the segmentation results.Consistent selection and adjustment of these parameters are
T II. Mean and standard deviation of the metrics used for assessment ofthe performance of the proposed PET image segmentation algorithm for allclinical studies. The abbreviations used are as defined in the captions of theprevious figures.
Metrics MASAC CAC ST
PHRE(%) −7.95 ± 25.98 −4.66 ± 25.29 −3.54 ± 48.10DSC 0.71 ± 0.08 0.68 ± 0.13 0.65 ± 0.08CE(%) 55.64 ± 16.00 60.31 ± 19.28 66.62 ± 15.32K(%) 31.80 ± 13.70 32.51 ± 19.93 35.09 ± 20.39LU10RE(%) −11.06 ± 23.34 −1.92 ± 34.10 −35.54 ± 34.68DSC 0.70 ± 0.09 0.70 ± 0.08 0.59 ± 0.13CE(%) 56.21 ± 14.86 57.83 ± 13.34 63.99 ± 13.64K(%) 33.65 ± 13.89 29.85 ± 16.64 49.76 ± 19.80LU8RE(%) −13.56 ± 23.28 −11.18 ± 30.43 −48.11 ± 24.52DSC 0.71 ± 0.09 0.70 ± 0.09 0.58 ± 0.14CE(%) 52.63 ± 10.50 54.92 ± 11.12 61.05 ± 12.35K(%) 33.09 ± 15.68 33.04 ± 17.25 54.58 ± 18.22CSsRE(%) −11.15 ± 23.66 −8.38 ± 27.49 −29.01 ± 41.68DSC 0.71 ± 0.09 0.69 ± 0.10 0.61 ± 0.12CE(%) 53.92 ± 12.65 57.23 ± 14.74 63.43 ± 13.44K(%) 32.54 ± 14.32 32.81 ± 17.69 46.23 ± 20.95
difficult and could hardly be achieved by trial-and-errorexperiments.
To overcome the above problems, the MASAC algorithmis implemented by modifying the objective function inthe conventional active contour model, consistent withapproaches used elsewhere.34,39,40 We used an active contourmodel framework to incorporate the histogram and localizedand textural information in our approach. The FCM clusteringmembership was taken as one of the inputs for the energyfunction. It should be noted that the number of gray levelsin PET images is usually much smaller than the number ofpixels. Therefore, the gray level histogram of the images wasused for the clustering instead of image pixels to enhanceefficiency. Then the membership matrix was used as input forthe MASAC algorithm, providing probabilistic fuzzy valueestimates for the segmentation.
The bilateral filter was incorporated in our algorithm togenerate weighted average values from neighboring pixels tocope with image noise and utilize the statistical informationin local regions. To improve its robustness, the parameters, σs
and σr , of the filter were predefined by the variance derivedfrom the smoothed histogram of the images. Because of thediversity of PET images depending on clinical indications, itis impossible to use the same parameters for all images. Forlesions with high variance, it tends to require lower values forσs and σr to preserve the edges in the images, while highervalues are required for large lesions with low variance.
The complexity of human anatomy and physiology andneoplastic growth produce sophisticated texture patternsin PET images. For texture discrimination, we proposeto use Gabor functions whose frequency and orientationrepresentations are similar to those of the human visualsystem. Sandberg et al.41 used the Gabor function todiscriminate textures in a curve evolution based level setapproach. It would take much time for 45 Gabor transforms
Medical Physics, Vol. 43, No. 8, August 2016
4490 Zhuang, Dierckx, and Zaidi: Automated PET image segmentation 4490
F. 6. Representative clinical pharyngolaryngeal carcinoma PET study showing contours extracted by MASAC (purple), CAC (red), and ST (black), comparedto the ground truth (brown). The initial cropping area has been shown in the rectangle area. (See color online version.)
when dealing with 3D images. Xu et al.42 focused on textureanalysis based on Gabor filters to extract feature vectors andfollow a probabilistic method to get the segmentation results.However, it is assumed that a large database is available fortraining to get feature vectors. In this work, the convolutionsof Gabor functions with the original images were used toobtain 16 different channels, to keep a reasonable balancebetween efficiency and effectiveness. The average of thesechannels would be the input of the multichannel active contouralgorithm.
By combining histogram clustering, bilateral filtering,and Gabor transformation introduced above, we obtain theMASAC energy function devoted to dealing with noiseand intensity inhomogeneity, which are generally observedin PET images. In this work, the proposed algorithm isevaluated using both phantom and clinical studies wheretumors differed in biology, phenotype, size, and location. Ourresults show that the application of histogram and localizedand textural features endows the MASAC algorithm withan extensive capture range, exhibiting robustness to differenttypes of tumors and clinical scenarios. Although the CACalgorithm seems to achieve more accurate results in terms ofquantifying tumor volumes, the model depends highly on user-defined parameters, which require adjustments not only fordifferent scanners or different protocols, but also for different
patients scanned on the same scanner with the same protocol,even for different lesions in the same patient. The use ofdifferent parameters might influence the segmentation resultssignificantly, and these parameters most probably cannot beadequately parameterized experimentally. Compared with thevarious parameters used in CAC, the MASAC algorithm keepsthe same parameters for all the datasets used in this work.
From Tables I and II, it seems that our algorithm has asystematic underestimation of the tumor for the datasets thatwe test. The factor λ in MASAC could be used for calibrationpurposes but was set to 1 for all cases in this study. Thisaim of this work is to develop a generic and robust algorithmfor PET image segmentation suitable for adoption in clinicalsetting. Therefore, we did not calibrate the method for anyspecific scanner or protocol and evaluated its performanceusing different datasets with λ set as 1. The results might beimproved further if phantom experiments are used to calibratethe method targeting a specific scanner/protocol.
The MASAC algorithm has shown comparable or evenbetter performance compared with those observed in otherstudies involving validation against clinical datasets. Ourresults using the PH database (six studies) showed a meanDSC of 0.71 and mean CE of 55.64% compared with 0.54and 50.20%, respectively, (for seven studies) reported fora previous algorithm in our previous work.43 The clinical
F. 7. Representative clinical nonsmall cell lung cancer PET study showing contours extracted by MASAC (purple), CAC (red), and ST (black), compared tothe ground truth (brown). The initial cropping area has been shown in the rectangle area. (See color online version.)
Medical Physics, Vol. 43, No. 8, August 2016
4491 Zhuang, Dierckx, and Zaidi: Automated PET image segmentation 4491
assessment of the LU database (ten studies) resulted in a meanDSC of 0.70 and mean CE of 56.21%, compared with 0.41 and112.86%43 and 0.54 and 60.58%34 (nine studies), respectively.Schaefer et al.3 evaluated consensus contours from differentPET segmentation algorithms using clinical PET images andreported a mean DSC varying from 0.59 to 0.67.
The mean DSC achieved by MASAC for the clinical studieswas greater than 0.70, with a DSC larger than 0.60 (13 of14 patients) in most of the cases. Zijdenbos et al.44 suggestedthat a DSC > 0.7 indicates good agreement, therefore weadopted the value of 0.7 as a criterion for reasonablygood agreement. Similar thresholds were also adopted inother studies. For instance, the automatic multimodalitysegmentation algorithm developed by Yang et al.45 achieveda mean DSC of 0.74, compared with a mean DSC of 0.65achieved when using only PET images.46
As can be seen in Fig. 4, the MASAC algorithm achievesgood performance for the lesion with a high nearby activity.However, if the lesions are connected with the high nearbyactivity, the results could be debatable even if the algorithmachieves the segmentation results close to the ground truth. Inthis case, it is difficult to distinguish only depending on thePET images, and the clinicians need to judge by other meansof data. Therefore, it seems that the results of LU8 are moreobjective, with two connected studies excluded.
By comparing PSs and CSs in detail in Tables I and II, itcan be noted that the mean RE of MASAC in CSs is betterthan that in PSs while the mean DSC and CE of MASAC in PSare poorer than those in CSs. These results may be explainedby the fact that the ground truth for some cases in CSs fitspoorly the visible high metabolic area in PET images, and assuch, poor DSC and CE and good RE results are achieved.The RE metric is used to describe the segmented results to theground truth in terms of volume, while DSC and CE are usedto quantify their spatial positions and geometrical shapes.Since each metric only reflects one aspect of the results, itis recommended to combine different quality measures foroverall performance assessment.
It was found that the mean CE of MASAC in PH wasslightly larger than that in LU8, as shown in Table II. Thismay be explained by different acquisitions taken in thesedatasets. In PH datasets, the matrix size was 128×128 andthe patients were scanned with larger voxels, while smallervoxels with larger matrix size were used for the patients in theLU8 datasets. Therefore, in clinical routine, smaller voxelswith a larger matrix size would be preferred if possible at all,especially for small lesions, where the partial volume effectrenders the problem much more complex.
To some extent, the MASAC algorithm is a hybrid ofthree existing algorithms, which could be straightforwardlyextended to multimodality segmentation by having inputsset as different modalities. The active contour model wascombined and integrated with other algorithms, e.g., Otsu’sthreshold method used as the initial contour and the histogramFCM clustering method to achieve the probabilistic estimatemembership matrix for the energy function. The concept ofcombining several segmentation methods has already beenproposed in the literature. Schaefer et al.3 used a consensus
algorithm combining the results of different PET segmentationmethods to achieve robustness against the inconsistentperformance of individual segmentation techniques. Likewise,McGurk et al.47 demonstrated the improved robustnessachieved by this approach using experimental phantommeasurements by combining the results of five individualsegmentation methods. It should be noted that this differentapproach makes use of a number of segmentation results,while MASAC uses a variety of image processing techniquesto achieve accurate PET image segmentation.
Lankton et al.48 and Li et al.49 provided ways for localizingactive contour models. The key idea behind their localizedactive contour model was to design the local regions along thecurve evolution using the convolution with a mask function.In this work, we introduce a bilateral filter that uses the localweighted average values for the evolution to guarantee thatthe relevant statistics evolve together. Moreover, to speedup the segmentation process, we employ several methods,such as parallel programming, lattice Boltzmann method,and clustering on gray-level histogram to efficiently delineatestructure boundaries. In this fast framework, we achievedexecution times of 1–5 s for most of the studies, which wouldmeet daily clinical routine requirements.
Despite the many promising aspects of the proposedalgorithm, its limitations need to be emphasized. First, it isdifficult to achieve accurate segmentation for cases with highnearby activity connected. Two cases from the LU databaseswere carefully cropped to exclude the high uptake regionnearby. These cases were used to demonstrate the limitationsof the proposed technique in specific situations (presenceof nearby high physiologic uptake) and conditions that needcareful consideration. Second, as shown in Figs. 3, 4, 6, and 7,the initial cropping area around the tumor to segment imageswas delineated to enhance efficiency. We observed thatdifferent cropping areas have little effect on the segmentationresults, except in those cases where there is a high uptakeregion nearby the tumor or where the image characteristicsare highly modified by the initial cropping area.
The datasets used in this work to test the proposedapproach also have some inherent limitations. The groundtruth in clinical studies is not known a priori and is difficultif not impossible to obtain. Most published studies usedmanual contouring performed by experienced physicians asthe ground truth.50 However, manual contouring is proneto large interobserver and intraobserver variabilities and,as such, is questionable as reference for assessment ofimage segmentation techniques. The contouring variabilitywas assessed quantitatively in multicenter studies reporting asignificant interobserver variability with a generalized DSCwithin the range 0.40–0.80.51,52 In our work, we preferredto use the macroscopic specimen keeping in mind thelimitations of this approach. In essence, the contour definedon the macroscopic specimen does not perfectly follow thevisible high metabolic volume in some cases, meaning thatsome uncertainties persist because of the shrinkage anddeformation of the specimen. Another possible cause may bethe inconsistency between the high metabolic volume in PETimages and the tumor volume in reality due to heterogeneities
Medical Physics, Vol. 43, No. 8, August 2016
4492 Zhuang, Dierckx, and Zaidi: Automated PET image segmentation 4492
within the tumor. Although no reference is perfect, we believethat the macroscopic specimen may offer a better approximateof the boundary of the tumor. A large database of test imagesacquired with different acquisition/reconstruction protocolson various PET scanners, presenting with various lesionsizes and contrasts located in various regions in the body,with different background activity as well as individualanatomical variations, would be required to draw reliableconclusions.
Another issue to emphasize is that all segmentationsare derived from image characteristics. Therefore, providedthat a reliable data acquisition/reconstruction protocolis used to produce good quality images, the proposedmethod is likely to produce accurate segmentation oftarget volumes. For example, the long acquisition timeof oncological PET studies might induce motion artifacts,thus degrading PET image quality. One of the majorproblems is respiratory artifacts caused by patients’ freebreathing during PET scanning. Lesions located in thethorax or upper abdomen would spread throughout alongwith respiratory motion, leading to an underestimation of thetracer uptake and an overestimation of lesions’ volume. Anumber of strategies including 4D PET/CT data acquisitiontechniques were devised to reduce the impact of respiratorymotion.
5. CONCLUSION
We developed a novel generic and robust methodfor fully automated PET image segmentation using anactive contour model. Besides, its performance wasevaluated using phantom and clinical studies, comparedwith other algorithms. Our results demonstrate that theproposed method is applicable to various types of lesionsassessed in our work and could generate accurate andconsistent target volume delineations, potentially resultingin reduced interobserver variability of manual delineationand improved accuracy in treatment planning and outcomeevaluation.
ACKNOWLEDGMENTS
This work was supported by the Swiss National ScienceFoundation under Grant No. SNSF 31003A-149957, an OpenGrant (No. 2014GDDSIPL-06) from the Key Laboratoryof Digital Signal and Image Processing of GuangdongProvince, Shantou University, and Shantou Medical ScienceTechnology Project [No. (2014)62]. The authors wouldlike to thank Dr. John Lee (Université Catholique deLouvain, Brussels) for providing the clinical PET datasetsand Nicolas A. Karakatsanis and Zemian Chen for theirassistance.
CONFLICT OF INTEREST DISCLOSURE
The authors have no COI to report.
APPENDIX A: HISTOGRAM FUZZY C-MEANSCLUSTERING
The objective function to minimize is given as
J =c
k=1
qj=1
Hist( j)µmk j( j− νk)2 (A1)
withc
k=1
µk j = 1, (A2)
where νk represents the center of the kth cluster, µk j denotesthe fuzzy membership value of the gray level j as to the kthcluster, c is the number of clusters, q represents the number ofthe gray levels in the images, Hist( j) is the number of pixelswith the gray level j, and m is the weighting exponent for themembership function.
In order to minimize Eq. (A1), a new objective functioncould be constructed using the Lagrange multiplier method,
F =c
k=1
qj=1
Hist( j)µmk j( j− νk)2−λ*,
ck=1
µk j−1+-. (A3)
The minimization of the new objective function Eq. (A3)leads to
∂F∂λ=
ck=1
µk j−1= 0, (A4)
∂F∂µk j
=Hist( j)mµm−1k j ( j− νk)2−λ = 0, (A5)
∂F∂νi=
qj=1
Hist( j)µmk j [−2( j− νk)]= 0. (A6)
To solve Eqs. (A4)–(A6), the update equations ofmembership function µk j and cluster center νk could beobtained using the following expressions:
µk j =1
cl=1
(j− νkj− νl
) 2m−1
, (A7)
νk =
qj=1
jHist( j)µmk jqj=1
Hist( j)µmk j. (A8)
APPENDIX B: 3D GABOR FILTER
A 3D Gabor filter is a 3D Gaussian kernel functionmodulated by a sinusoidal wave, which is defined as
G(x,y,z) = S×exp*,−1
2*,
(x ′
σx
)2
+
(y ′
σy
)2
+
(z′
σz
)2+-+-
× exp( j2π(xu+ yv + zw)) (B1)
Medical Physics, Vol. 43, No. 8, August 2016
4493 Zhuang, Dierckx, and Zaidi: Automated PET image segmentation 4493
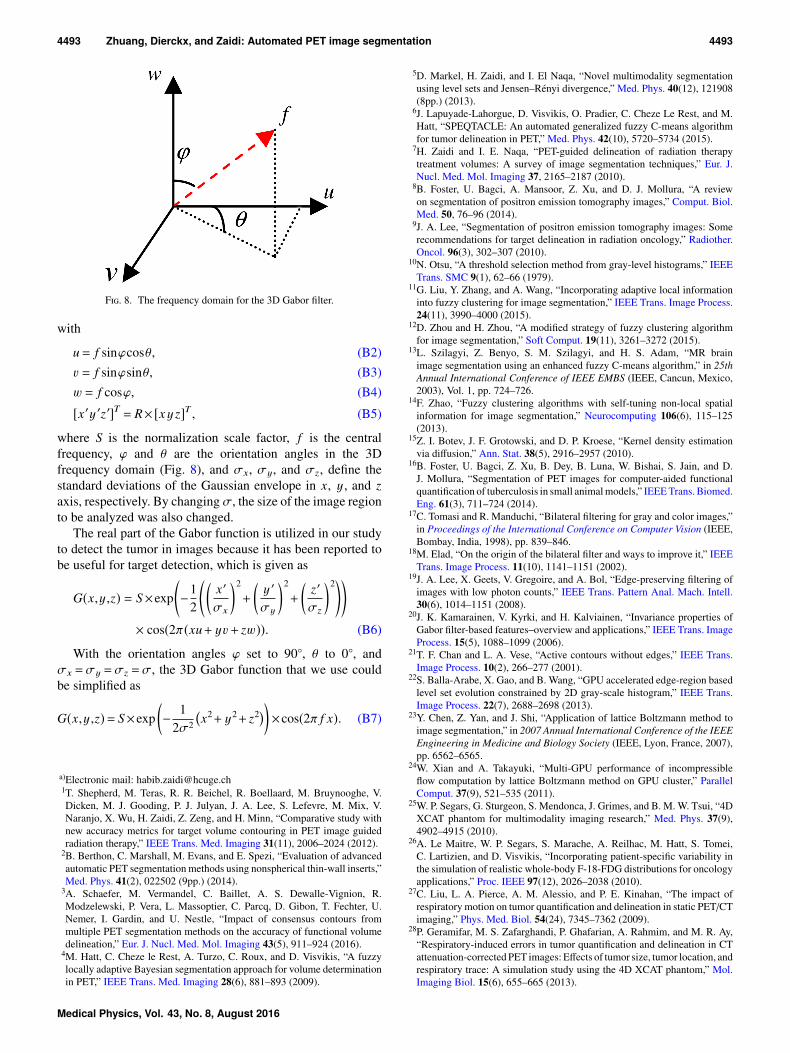
F. 8. The frequency domain for the 3D Gabor filter.
with
u= f sinϕcosθ, (B2)v = f sinϕsinθ, (B3)w = f cosϕ, (B4)
[x ′y ′z′]T = R× [x y z]T , (B5)
where S is the normalization scale factor, f is the centralfrequency, ϕ and θ are the orientation angles in the 3Dfrequency domain (Fig. 8), and σx, σy, and σz, define thestandard deviations of the Gaussian envelope in x, y , and zaxis, respectively. By changing σ, the size of the image regionto be analyzed was also changed.
The real part of the Gabor function is utilized in our studyto detect the tumor in images because it has been reported tobe useful for target detection, which is given as
G(x,y,z) = S×exp*,−1
2*,
(x ′
σx
)2
+
(y ′
σy
)2
+
(z′
σz
)2+-+-
× cos(2π(xu+ yv + zw)). (B6)
With the orientation angles ϕ set to 90, θ to 0, andσx =σy =σz =σ, the 3D Gabor function that we use couldbe simplified as
G(x,y,z)= S×exp(− 1
2σ2
x2+ y2+ z2
)×cos(2π f x). (B7)
a)Electronic mail: [email protected]. Shepherd, M. Teras, R. R. Beichel, R. Boellaard, M. Bruynooghe, V.Dicken, M. J. Gooding, P. J. Julyan, J. A. Lee, S. Lefevre, M. Mix, V.Naranjo, X. Wu, H. Zaidi, Z. Zeng, and H. Minn, “Comparative study withnew accuracy metrics for target volume contouring in PET image guidedradiation therapy,” IEEE Trans. Med. Imaging 31(11), 2006–2024 (2012).
2B. Berthon, C. Marshall, M. Evans, and E. Spezi, “Evaluation of advancedautomatic PET segmentation methods using nonspherical thin-wall inserts,”Med. Phys. 41(2), 022502 (9pp.) (2014).
3A. Schaefer, M. Vermandel, C. Baillet, A. S. Dewalle-Vignion, R.Modzelewski, P. Vera, L. Massoptier, C. Parcq, D. Gibon, T. Fechter, U.Nemer, I. Gardin, and U. Nestle, “Impact of consensus contours frommultiple PET segmentation methods on the accuracy of functional volumedelineation,” Eur. J. Nucl. Med. Mol. Imaging 43(5), 911–924 (2016).
4M. Hatt, C. Cheze le Rest, A. Turzo, C. Roux, and D. Visvikis, “A fuzzylocally adaptive Bayesian segmentation approach for volume determinationin PET,” IEEE Trans. Med. Imaging 28(6), 881–893 (2009).
5D. Markel, H. Zaidi, and I. El Naqa, “Novel multimodality segmentationusing level sets and Jensen–Rényi divergence,” Med. Phys. 40(12), 121908(8pp.) (2013).
6J. Lapuyade-Lahorgue, D. Visvikis, O. Pradier, C. Cheze Le Rest, and M.Hatt, “SPEQTACLE: An automated generalized fuzzy C-means algorithmfor tumor delineation in PET,” Med. Phys. 42(10), 5720–5734 (2015).
7H. Zaidi and I. E. Naqa, “PET-guided delineation of radiation therapytreatment volumes: A survey of image segmentation techniques,” Eur. J.Nucl. Med. Mol. Imaging 37, 2165–2187 (2010).
8B. Foster, U. Bagci, A. Mansoor, Z. Xu, and D. J. Mollura, “A reviewon segmentation of positron emission tomography images,” Comput. Biol.Med. 50, 76–96 (2014).
9J. A. Lee, “Segmentation of positron emission tomography images: Somerecommendations for target delineation in radiation oncology,” Radiother.Oncol. 96(3), 302–307 (2010).
10N. Otsu, “A threshold selection method from gray-level histograms,” IEEETrans. SMC 9(1), 62–66 (1979).
11G. Liu, Y. Zhang, and A. Wang, “Incorporating adaptive local informationinto fuzzy clustering for image segmentation,” IEEE Trans. Image Process.24(11), 3990–4000 (2015).
12D. Zhou and H. Zhou, “A modified strategy of fuzzy clustering algorithmfor image segmentation,” Soft Comput. 19(11), 3261–3272 (2015).
13L. Szilagyi, Z. Benyo, S. M. Szilagyi, and H. S. Adam, “MR brainimage segmentation using an enhanced fuzzy C-means algorithm,” in 25thAnnual International Conference of IEEE EMBS (IEEE, Cancun, Mexico,2003), Vol. 1, pp. 724–726.
14F. Zhao, “Fuzzy clustering algorithms with self-tuning non-local spatialinformation for image segmentation,” Neurocomputing 106(6), 115–125(2013).
15Z. I. Botev, J. F. Grotowski, and D. P. Kroese, “Kernel density estimationvia diffusion,” Ann. Stat. 38(5), 2916–2957 (2010).
16B. Foster, U. Bagci, Z. Xu, B. Dey, B. Luna, W. Bishai, S. Jain, and D.J. Mollura, “Segmentation of PET images for computer-aided functionalquantification of tuberculosis in small animal models,” IEEE Trans. Biomed.Eng. 61(3), 711–724 (2014).
17C. Tomasi and R. Manduchi, “Bilateral filtering for gray and color images,”in Proceedings of the International Conference on Computer Vision (IEEE,Bombay, India, 1998), pp. 839–846.
18M. Elad, “On the origin of the bilateral filter and ways to improve it,” IEEETrans. Image Process. 11(10), 1141–1151 (2002).
19J. A. Lee, X. Geets, V. Gregoire, and A. Bol, “Edge-preserving filtering ofimages with low photon counts,” IEEE Trans. Pattern Anal. Mach. Intell.30(6), 1014–1151 (2008).
20J. K. Kamarainen, V. Kyrki, and H. Kalviainen, “Invariance properties ofGabor filter-based features–overview and applications,” IEEE Trans. ImageProcess. 15(5), 1088–1099 (2006).
21T. F. Chan and L. A. Vese, “Active contours without edges,” IEEE Trans.Image Process. 10(2), 266–277 (2001).
22S. Balla-Arabe, X. Gao, and B. Wang, “GPU accelerated edge-region basedlevel set evolution constrained by 2D gray-scale histogram,” IEEE Trans.Image Process. 22(7), 2688–2698 (2013).
23Y. Chen, Z. Yan, and J. Shi, “Application of lattice Boltzmann method toimage segmentation,” in 2007 Annual International Conference of the IEEEEngineering in Medicine and Biology Society (IEEE, Lyon, France, 2007),pp. 6562–6565.
24W. Xian and A. Takayuki, “Multi-GPU performance of incompressibleflow computation by lattice Boltzmann method on GPU cluster,” ParallelComput. 37(9), 521–535 (2011).
25W. P. Segars, G. Sturgeon, S. Mendonca, J. Grimes, and B. M. W. Tsui, “4DXCAT phantom for multimodality imaging research,” Med. Phys. 37(9),4902–4915 (2010).
26A. Le Maitre, W. P. Segars, S. Marache, A. Reilhac, M. Hatt, S. Tomei,C. Lartizien, and D. Visvikis, “Incorporating patient-specific variability inthe simulation of realistic whole-body F-18-FDG distributions for oncologyapplications,” Proc. IEEE 97(12), 2026–2038 (2010).
27C. Liu, L. A. Pierce, A. M. Alessio, and P. E. Kinahan, “The impact ofrespiratory motion on tumor quantification and delineation in static PET/CTimaging,” Phys. Med. Biol. 54(24), 7345–7362 (2009).
28P. Geramifar, M. S. Zafarghandi, P. Ghafarian, A. Rahmim, and M. R. Ay,“Respiratory-induced errors in tumor quantification and delineation in CTattenuation-corrected PET images: Effects of tumor size, tumor location, andrespiratory trace: A simulation study using the 4D XCAT phantom,” Mol.Imaging Biol. 15(6), 655–665 (2013).
Medical Physics, Vol. 43, No. 8, August 2016
4494 Zhuang, Dierckx, and Zaidi: Automated PET image segmentation 4494
29S. A. Nehmeh, H. El-Zeftawy, C. Greco, J. Schwartz, Y. E. Erdi, A. Kirov,C. R. Schmidtlein, A. B. Gyau, S. M. Larson, and J. L. Humm, “An iterativetechnique to segment PET lesions using a Monte Carlo based mathematicalmodel,” Med. Phys. 36(10), 4803–4809 (2009).
30F. Lamare, T. Cresson, J. Savean, C. C. Le Rest, A. J. Reader, and D.Visvikis, “Respiratory motion correction for PET oncology applications us-ing affine transformation of list mode data,” Phys. Med. Biol. 52(1), 121–140(2007).
31K. Thielemans, C. Tsoumpas, S. Mustafovic, T. Beisel, P. Aguiar,N. Dikaios, and M. W. Jacobson, “STIR: Software for tomographicimage reconstruction release 2,” Phys. Med. Biol. 57(4), 867–883(2012).
32J. F. Daisne, V. Gregoire, T. Duprez, M. Lonneux, M. Hamoir, H. Reych-ler, and V. Gregoire, “Tumor volume in pharyngolaryngeal squamous cellcarcinoma: Comparison at CT, MR imaging, and FDG PET and validationwith surgical specimen,” Radiology 233, 93–100 (2004).
33M. Wanet, J. A. Lee, B. Weynand, M. De Bast, A. Poncelet, V. Lacroix,E. Coche, V. Gregoire, and X. Geets, “Gradient-based delineation of theprimary GTV on FDG-PET in non-small cell lung cancer: A comparisonwith threshold-based approaches, CT and surgical specimens,” Radiother.Oncol. 98, 117–125 (2011).
34M. Abdoli, R. A. J. O. Dierckx, and H. Zaidi, “Contourlet-based activecontour model for PET image segmentation,” Med. Phys. 40(8), 082507(12pp.) (2013).
35A. Schaefer, S. Kremp, D. Hellwig, C. Rübe, C. M. Kirsch, and U. Nestle,“A contrast-oriented algorithm for FDG-PET-based delineation of tumourvolumes for the radiotherapy of lung cancer: Derivation from phantommeasurements and validation in patient data,” Eur. J. Nucl. Med. Mol.Imaging 35(11), 1989–1999 (2008).
36L. R. Dice, “Measures of the amount of ecologic association betweenspecies,” Ecology 26(3), 297–302 (1945).
37K. H. Zou, S. K. Warfield, A. Bharatha, C. M. Tempany, M. R. Kaus, S. J.Haker, W. M. Wells III, F. A. Jolesz, and R. Kikinis, “Statistical validation ofimage segmentation quality based on a spatial overlap index,” Acad. Radiol.11(2), 178–189 (2004).
38M. Hatt, C. Cheze le Rest, P. Descourt, A. Dekker, D. De Ruysscher, M.Oellers, P. Lambin, O. Pradier, and D. Visvikis, “Accurate automatic delinea-tion of heterogeneous functional volumes in positron emission tomographyfor oncology applications,” Int. J. Radiat. Oncol., Biol., Phys. 77, 301–308(2010).
39S. Chen and D. Zhang, “Robust image segmentation using FCM withspatial constraints based on new kernel-induced distance measure,”IEEE Trans. Syst. Man. Cybern., Part B (Cybern.) 34(4), 1907–1916(2004).
40S. Belhassen and H. Zaidi, “A novel fuzzy C-means algorithm for unsu-pervised heterogeneous tumor quantification in PET,” Med. Phys. 37(3),1309–1324 (2010).
41B. Sandberg, T. Chan, and L. Vese, “A level-set and Gabor-based activecontour algorithm for segmenting textured images,” UCLA Department ofMathematics CAM Report, 2002.
42Z. Xu, W. M. Allen, R. B. Baucom, B. K. Poulose, and B. A. Landman,“Texture analysis improves level set segmentation of the anterior abdominalwall,” Med. Phys. 40(12), 121901 (11pp.) (2013).
43H. Zaidi, M. Abdoli, C. L. Fuentes, and I. M. E. Naqa, “Comparativemethods for PET image segmentation in pharyngolaryngeal squamous cellcarcinoma,” Eur. J. Nucl. Med. Mol. Imaging 39, 881–891 (2012).
44A. P. Zijdenbos, B. M. Dawant, R. A. Margolin, and A. C. Palmer, “Mor-phometric analysis of white matter lesions in MR images: Method andvalidation,” IEEE Trans. Med. Imaging 13(4), 716–724 (1994).
45J. Yang, B. M. Beadle, A. S. Garden, D. L. Schwartz, and M. Aristophanous,“A multimodality segmentation framework for automatic target delineationin head and neck radiotherapy,” Med. Phys. 42(9), 5310–5320 (2015).
46M. Aristophanous, B. C. Penney, M. K. Martel, and C. A. Pelizzari, “AGaussian mixture model for definition of lung tumor volumes in positronemission tomography,” Med. Phys. 34(11), 4223–4235 (2007).
47R. J. McGurk, J. Bowsher, J. A. Lee, and S. K. Das, “Combining multipleFDG-PET radiotherapy target segmentation methods to reduce the effectof variable performance of individual segmentation methods,” Med. Phys.40(4), 042501 (9pp.) (2013).
48S. Lankton and A. Tannenbaum, “Localizing region-based active contours,”IEEE Trans. Image Process. 17(11), 2029–2039 (2008).
49C. Li, C. Y. Kao, J. C. Gore, and Z. Ding, “Minimization of region-scalablefitting energy for image segmentation,” IEEE Trans. Image Process. 17(10),1940–1949 (2008).
50M. Soufi, A. Kamali-Asl, P. Geramifar, M. Abdoli, and A. Rahmim, “Com-bined fuzzy logic and random walker algorithm for PET image tumordelineation,” Nucl. Med. Commun. 37(2), 171–181 (2016).
51C. J. Tao, J. L. Yi, N. Y. Chen, W. Ren, J. Cheng, S. Tung, L. Kong, S. J.Lin, J. J. Pan, G. S. Zhang, J. Hu, Z. Y. Qi, J. Ma, J. D. Lu, D. Yan, andY. Sun, “Multi-subject atlas-based auto-segmentation reduces interobservervariation and improves dosimetric parameter consistency for organs at riskin nasopharyngeal carcinoma: A multi-institution clinical study,” Radiother.Oncol. 115(3), 407–411 (2015).
52V. Carillo, C. Cozzarini, L. Perna, M. Calandra, S. Gianolini, T. Rancati, A.E. Spinelli, V. Vavassori, S. Villa, R. Valdagni, and C. Fiorino, “Contouringvariability of the penile bulb on CT images: Quantitative assessment usinga generalized concordance index,” Int. J. Radiat. Oncol., Biol., Phys. 84(3),841–846 (2012).
Medical Physics, Vol. 43, No. 8, August 2016

![Robust Statistical Estimation and Segmentation of …cs294-6/fa06/papers/RANSAC25-Yang-A… · Robust Statistical Estimation and Segmentation of Multiple Subspaces ... [5,16,34]](https://img.pdfslide.us/doc/110x75/5ad8473b7f8b9a991b8d1c81/robust-statistical-estimation-and-segmentation-of-cs294-6fa06papersransac25-yang-arobust.jpg)