Embed Size (px)
Citation preview
Generation Z – impact on life insurance and pension industry: UK and Poland
Karol Raźniewski
Jason Whyte
May 2019
2
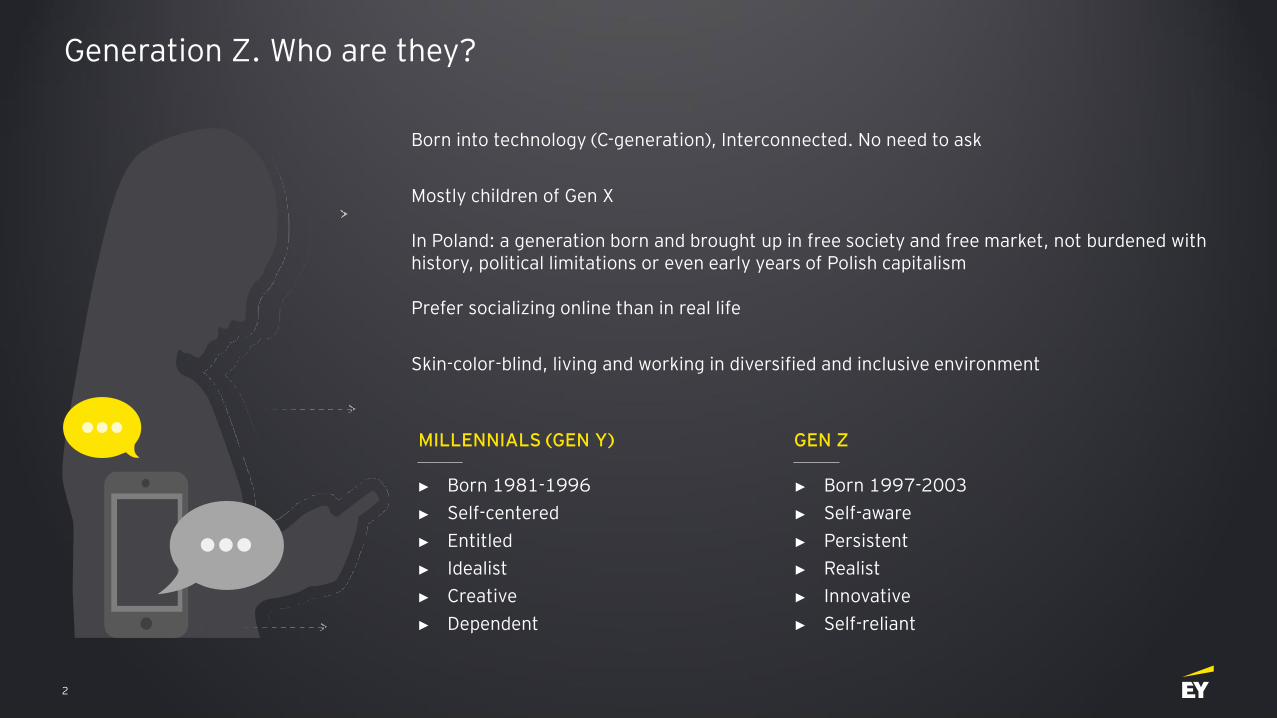
Generation Z. Who are they?
► Born 1981-1996
► Self-centered
► Entitled
► Idealist
► Creative
► Dependent
Skin-color-blind, living and working in diversified and inclusive environment
Born into technology (C-generation), Interconnected. No need to ask
Mostly children of Gen X
In Poland: a generation born and brought up in free society and free market, not burdened with history, political limitations or even early years of Polish capitalism
Prefer socializing online than in real life
MILLENNIALS (GEN Y) GEN Z
► Born 1997-2003
► Self-aware
► Persistent
► Realist
► Innovative
► Self-reliant
3
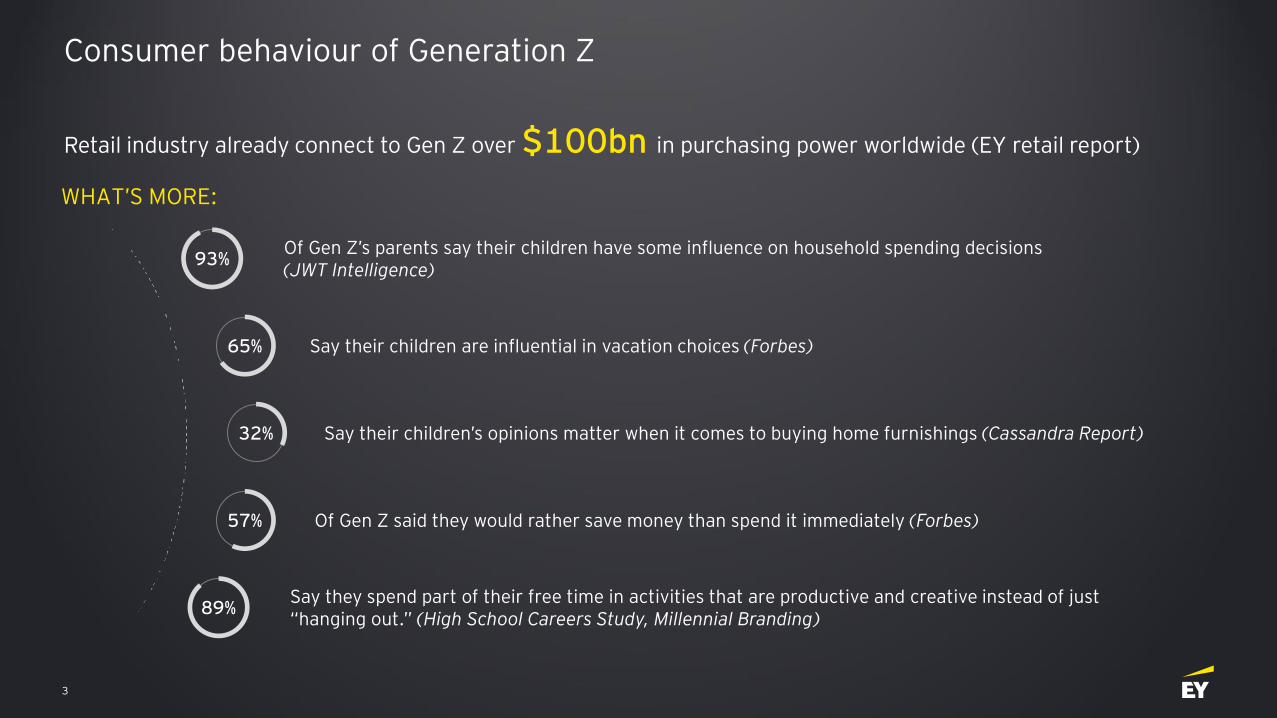
Consumer behaviour of Generation Z
Retail industry already connect to Gen Z over $100bn in purchasing power worldwide (EY retail report)
Of Gen Z’s parents say their children have some influence on household spending decisions (JWT Intelligence)
93%
WHAT’S MORE:
Say their children are influential in vacation choices (Forbes)65%
32% Say their children’s opinions matter when it comes to buying home furnishings (Cassandra Report)
57% Of Gen Z said they would rather save money than spend it immediately (Forbes)
89%Say they spend part of their free time in activities that are productive and creative instead of just “hanging out.” (High School Careers Study, Millennial Branding)
4
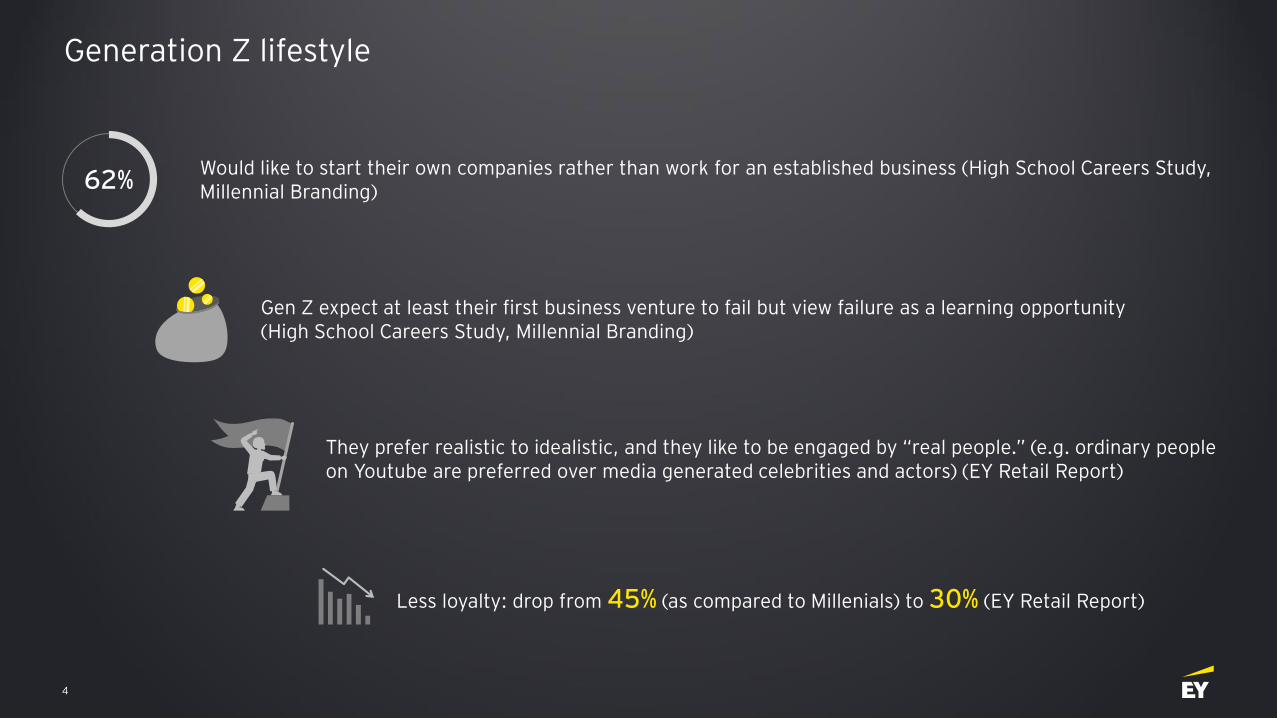
Generation Z lifestyle
Would like to start their own companies rather than work for an established business (High School Careers Study, Millennial Branding)
Gen Z expect at least their first business venture to fail but view failure as a learning opportunity (High School Careers Study, Millennial Branding)
They prefer realistic to idealistic, and they like to be engaged by “real people.” (e.g. ordinary people on Youtube are preferred over media generated celebrities and actors) (EY Retail Report)
62%
Less loyalty: drop from 45% (as compared to Millenials) to 30% (EY Retail Report)
5
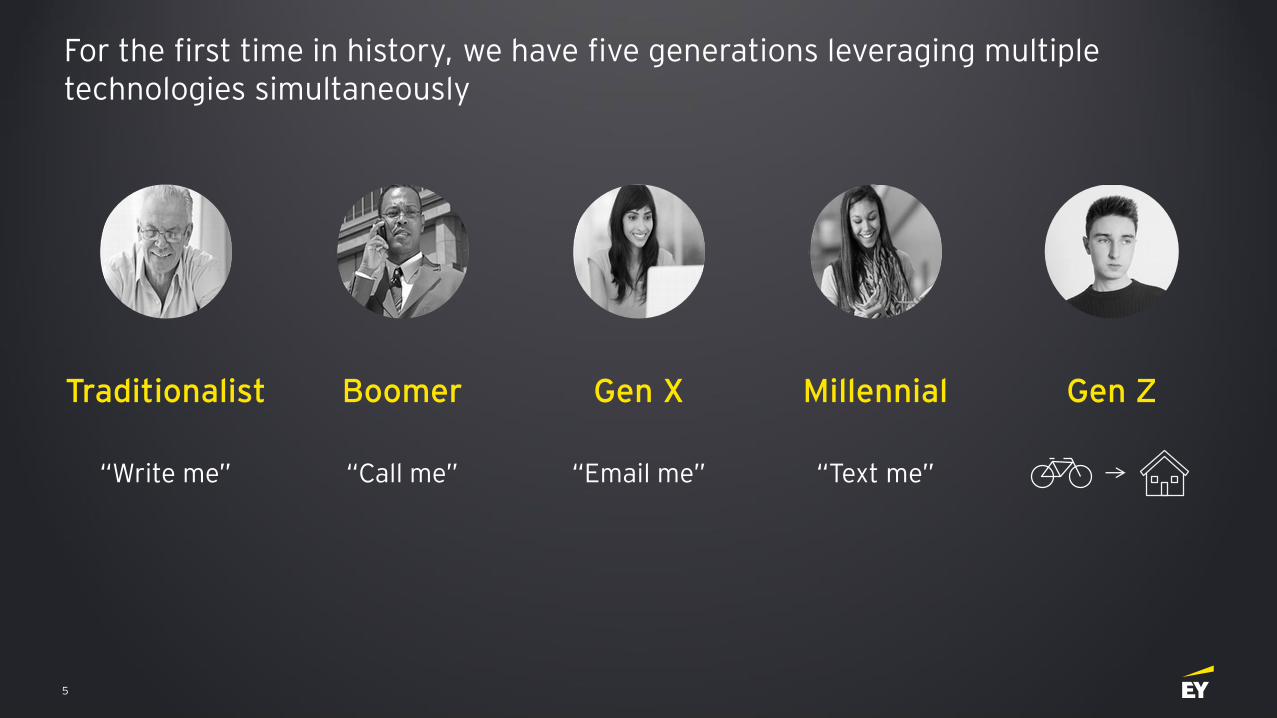
“Write me” “Call me” “Email me” “Text me”
MillennialBoomer Gen XTraditionalist Gen Z
For the first time in history, we have five generations leveraging multiple technologies simultaneously
6
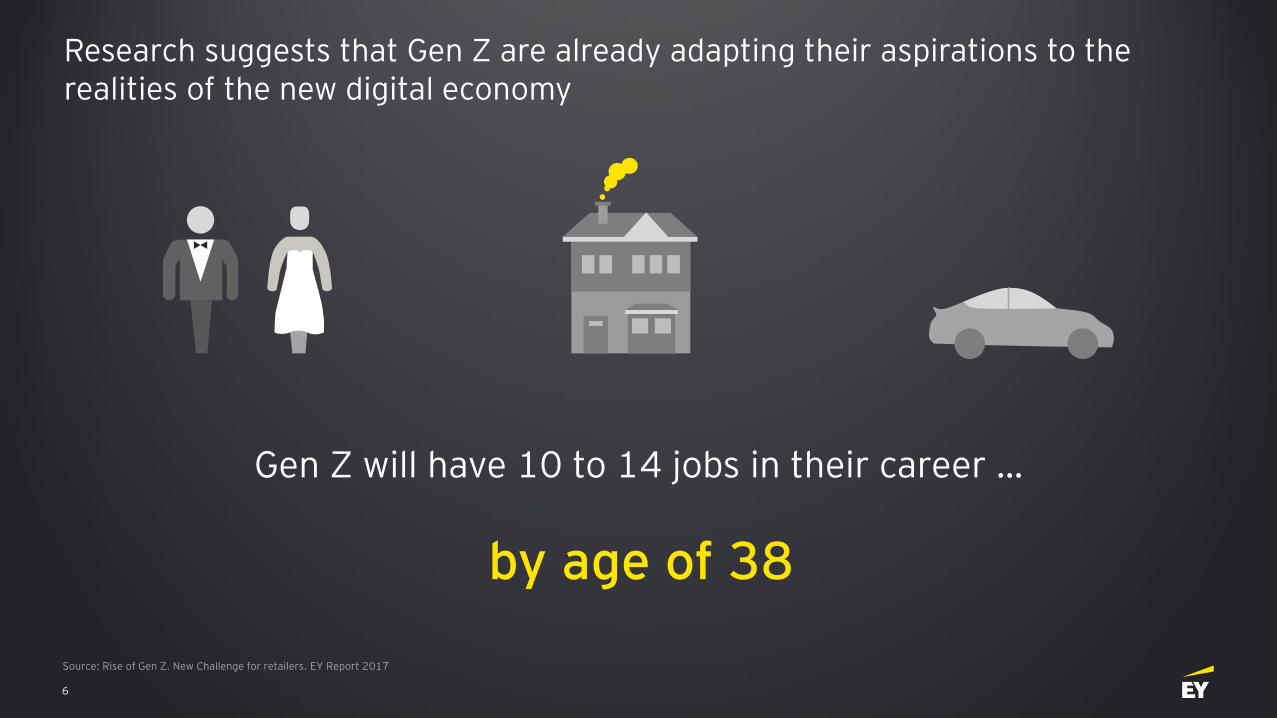
Gen Z will have 10 to 14 jobs in their career …
Source: Rise of Gen Z. New Challenge for retailers. EY Report 2017
by age of 38
Research suggests that Gen Z are already adapting their aspirations to the realities of the new digital economy
7
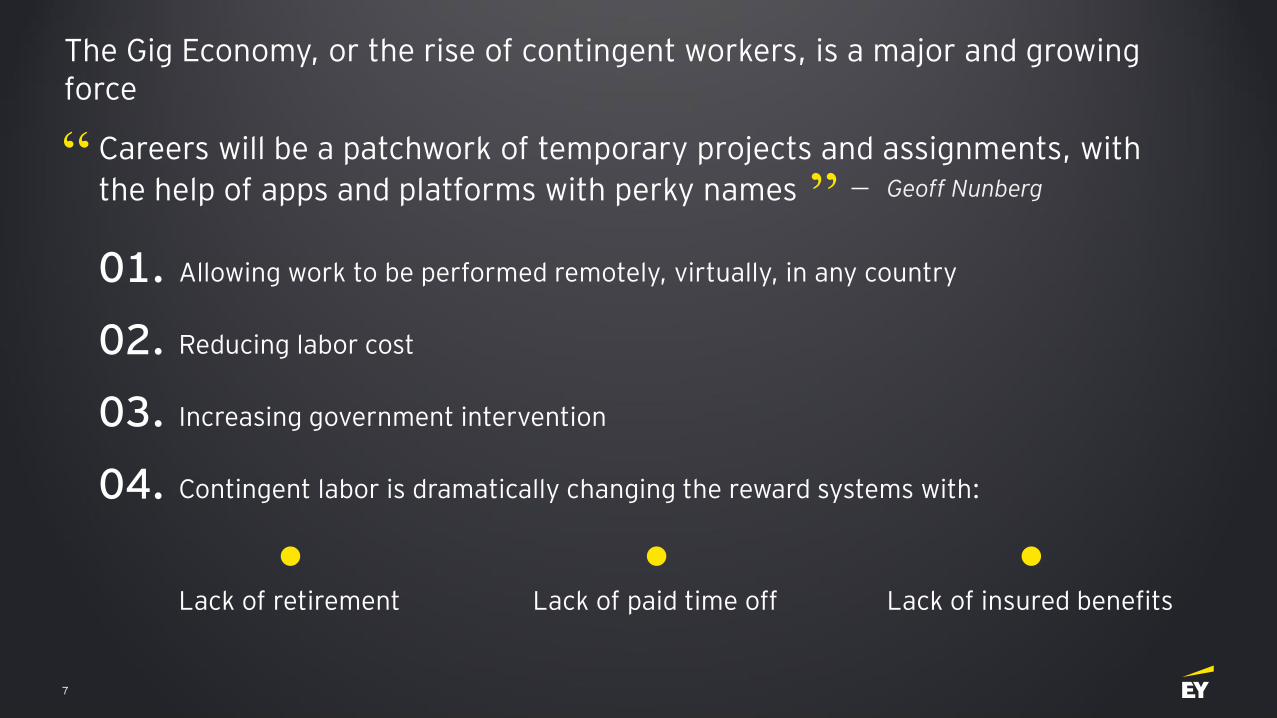
The Gig Economy, or the rise of contingent workers, is a major and growing force
Careers will be a patchwork of temporary projects and assignments, with
the help of apps and platforms with perky names “
” Geoff Nunberg
01. Allowing work to be performed remotely, virtually, in any country
02. Reducing labor cost
03. Increasing government intervention
04. Contingent labor is dramatically changing the reward systems with:
Lack of retirement Lack of insured benefitsLack of paid time off
8
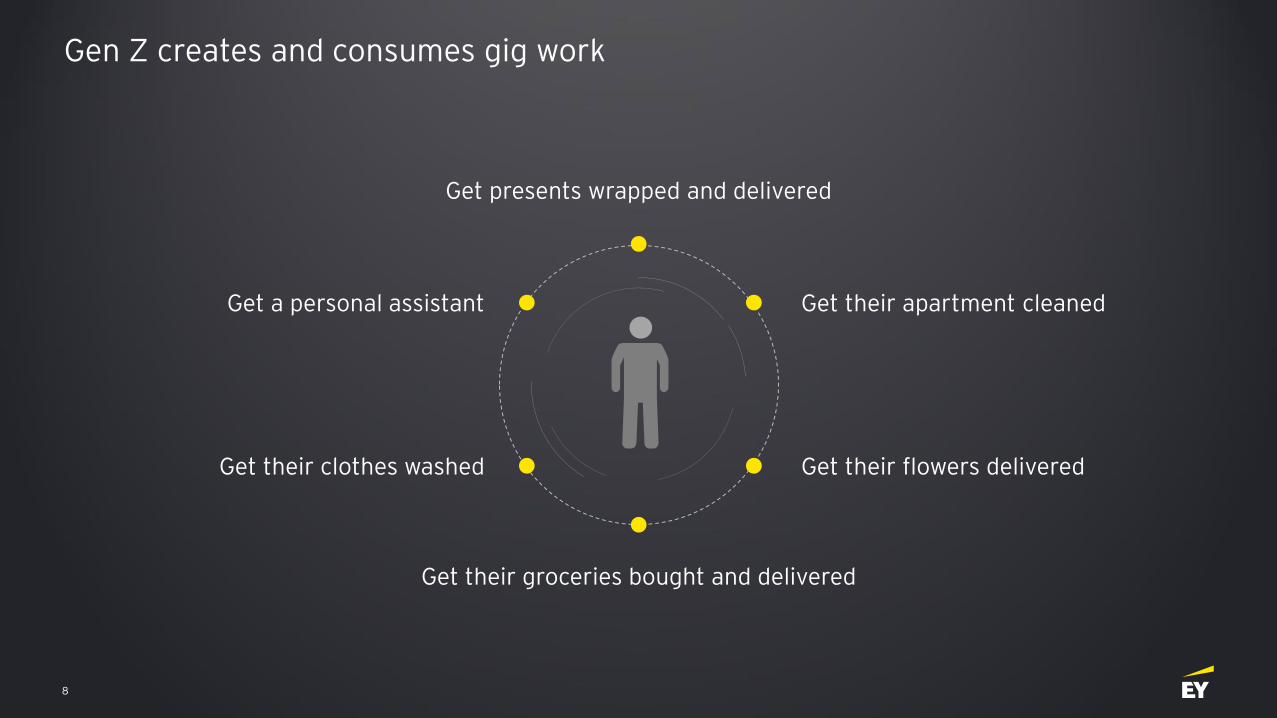
Get their apartment cleaned
Get their groceries bought and delivered
Get their clothes washed Get their flowers delivered
Get a personal assistant
Get presents wrapped and delivered
Gen Z creates and consumes gig work
9
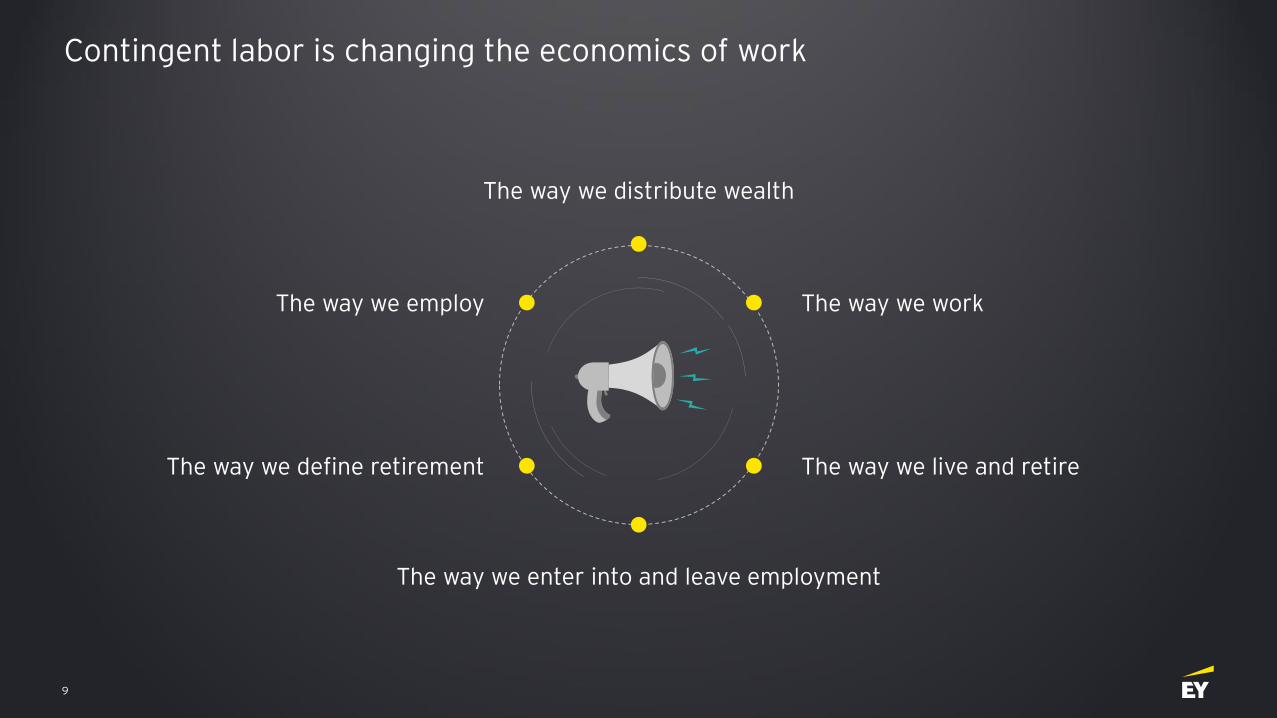
Contingent labor is changing the economics of work
The way we work
The way we enter into and leave employment
The way we define retirement The way we live and retire
The way we employ
The way we distribute wealth
10
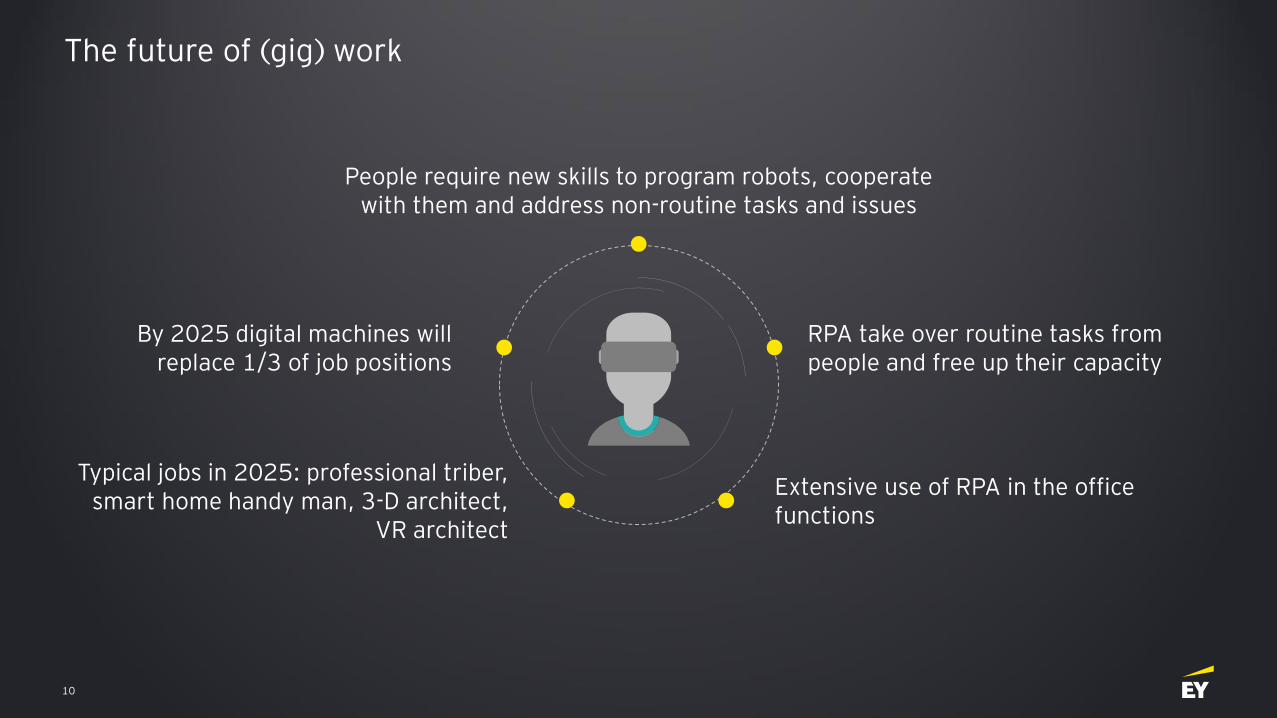
The future of (gig) work
RPA take over routine tasks from people and free up their capacity
Typical jobs in 2025: professional triber, smart home handy man, 3-D architect,
VR architect
Extensive use of RPA in the office functions
By 2025 digital machines will replace 1/3 of job positions
People require new skills to program robots, cooperate with them and address non-routine tasks and issues
11
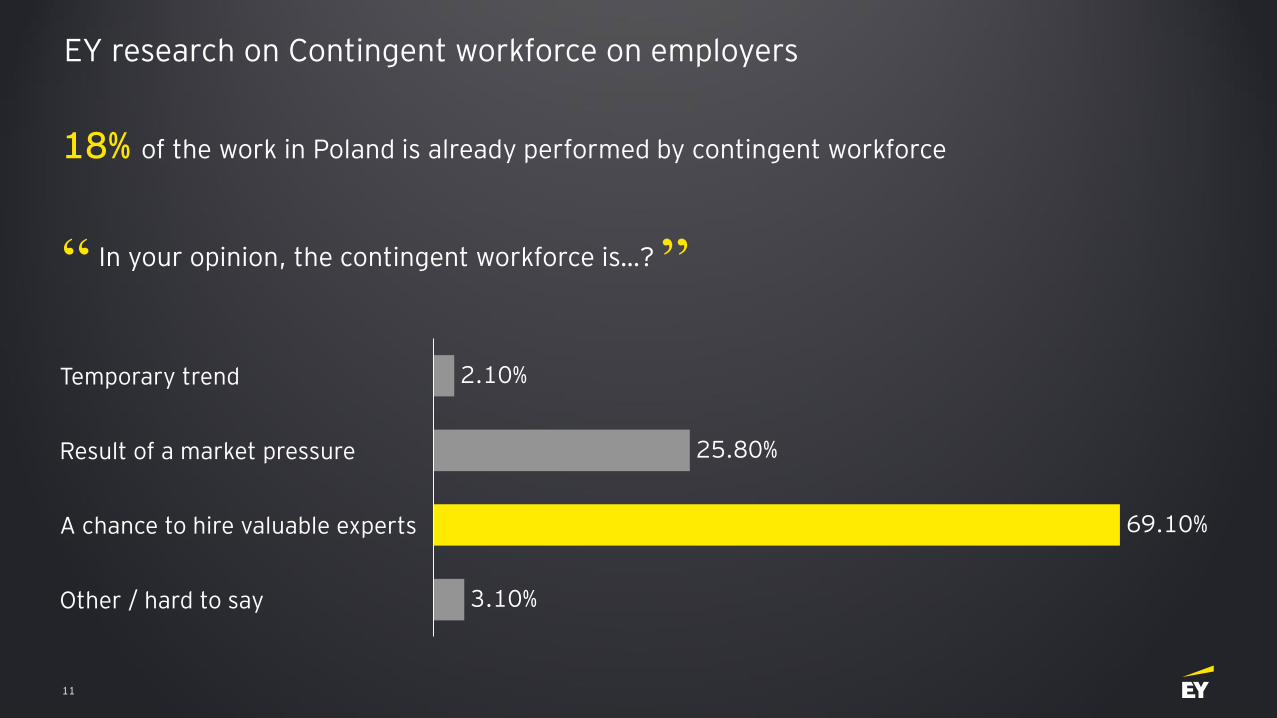
EY research on Contingent workforce on employers
18% of the work in Poland is already performed by contingent workforce
In your opinion, the contingent workforce is…?“ ”
69.10%A chance to hire valuable experts
Temporary trend
3.10%
Result of a market pressure
Other / hard to say
25.80%
2.10%
12
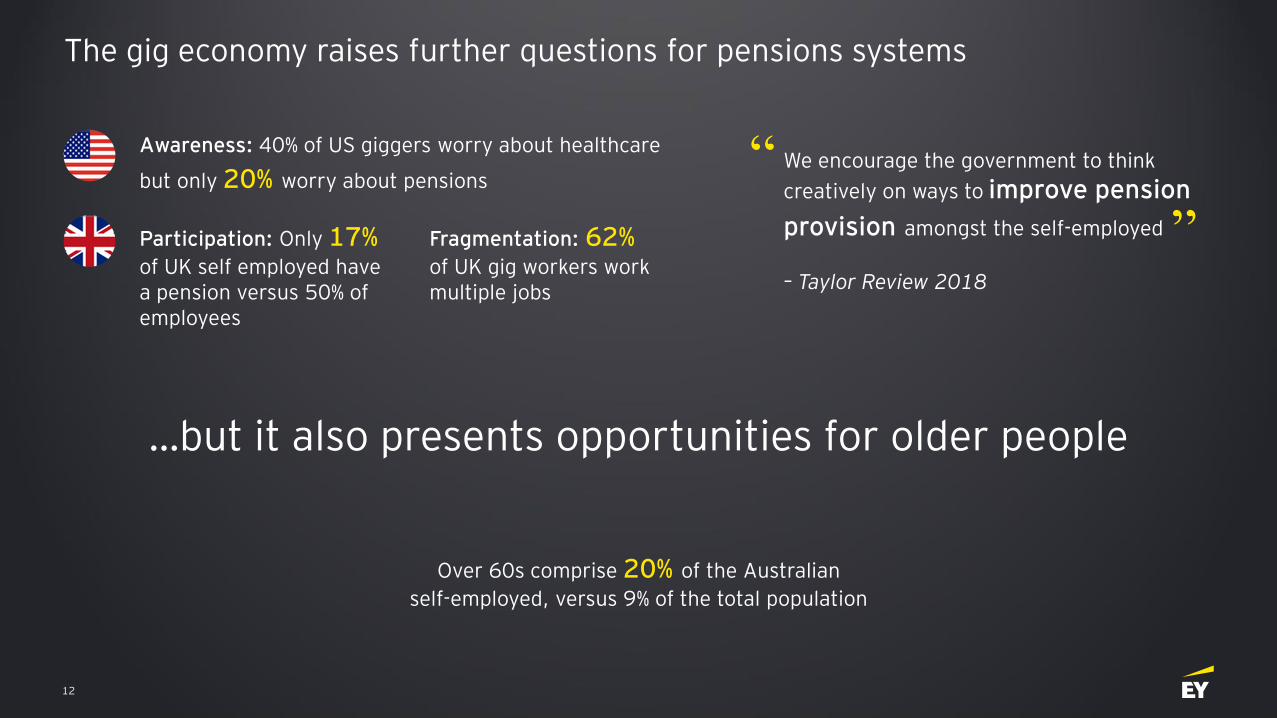
The gig economy raises further questions for pensions systems
Fragmentation: 62%of UK gig workers work multiple jobs
Awareness: 40% of US giggers worry about healthcare
but only 20% worry about pensions
Over 60s comprise 20% of the Australian
self-employed, versus 9% of the total population
Participation: Only 17%of UK self employed have a pension versus 50% of employees
…but it also presents opportunities for older people
We encourage the government to think
creatively on ways to improve pension
provision amongst the self-employed
– Taylor Review 2018
“
”
13
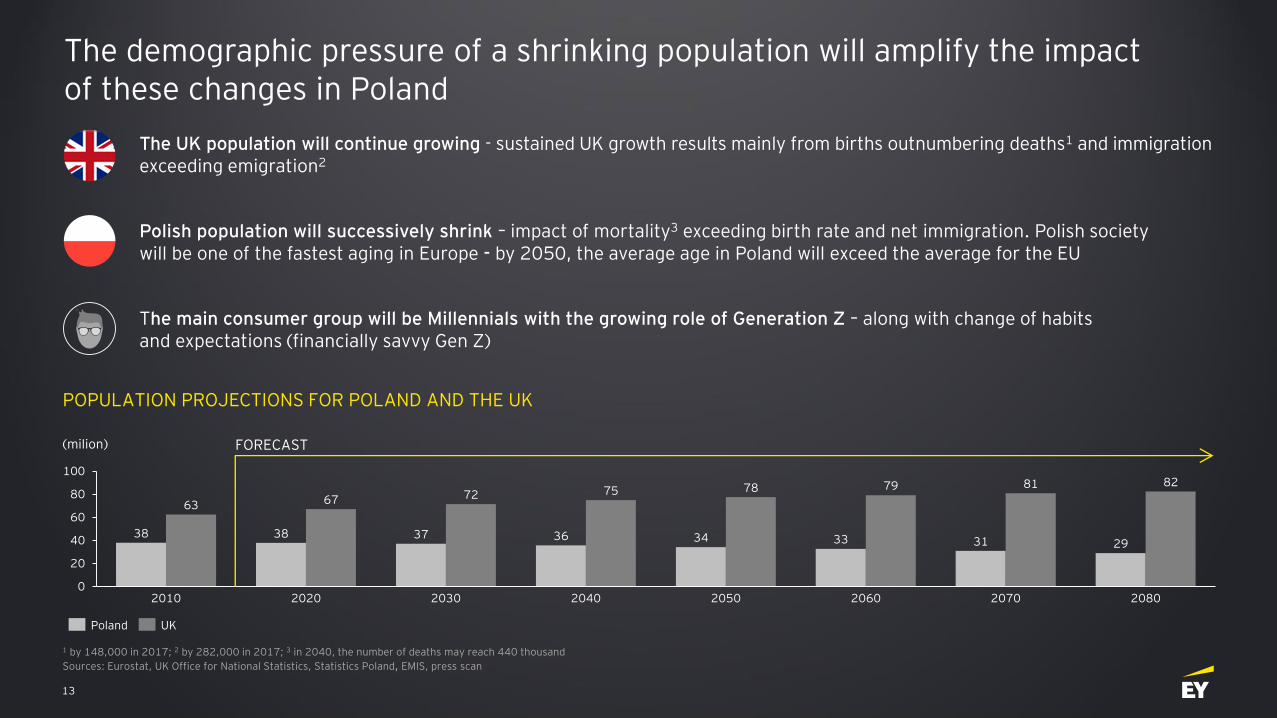
The demographic pressure of a shrinking population will amplify the impact of these changes in Poland
38 38 37 36 34 33 31 29
63 67 72 75 78 79 81 82
0
20
40
60
80
100
2060 208020702010 2020 2030 2040 2050
POPULATION PROJECTIONS FOR POLAND AND THE UK
Sources: Eurostat, UK Office for National Statistics, Statistics Poland, EMIS, press scan
Poland UK
The main consumer group will be Millennials with the growing role of Generation Z – along with change of habits and expectations (financially savvy Gen Z)
Polish population will successively shrink – impact of mortality3 exceeding birth rate and net immigration. Polish society will be one of the fastest aging in Europe - by 2050, the average age in Poland will exceed the average for the EU
The UK population will continue growing - sustained UK growth results mainly from births outnumbering deaths1 and immigration exceeding emigration2
(milion)
1 by 148,000 in 2017; 2 by 282,000 in 2017; 3 in 2040, the number of deaths may reach 440 thousand
FORECAST
14
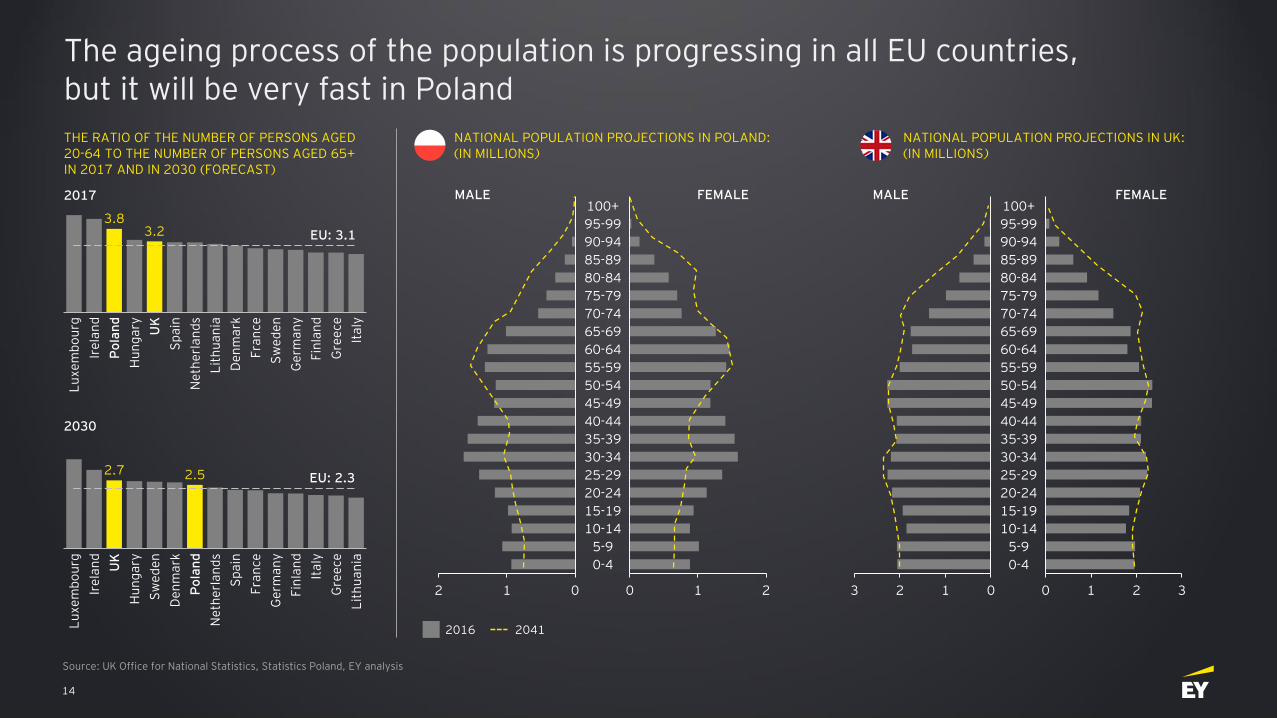
The ageing process of the population is progressing in all EU countries, but it will be very fast in Poland
Lit
hu
an
ia
Po
lan
d
Lu
xe
mb
ou
rg
Ire
lan
d
Hu
ng
ary
Sp
ain
3.2
UK
Ne
the
rla
nd
s
De
nm
ark
Fra
nce
Sw
ed
en
Gre
ece
Ge
rma
ny
Fin
lan
d
EU: 3.1
Ita
ly
3.8
Sw
ed
en
Hu
ng
ary
Lu
xe
mb
ou
rg
Fra
nce
Ne
the
rla
nd
s
Ire
lan
d
2.7
UK
De
nm
ark
Po
lan
d
Sp
ain
Ge
rma
ny
Fin
lan
d
Ita
ly
Gre
ece
EU: 2.3
Lit
hu
an
ia
2.5
THE RATIO OF THE NUMBER OF PERSONS AGED 20-64 TO THE NUMBER OF PERSONS AGED 65+ IN 2017 AND IN 2030 (FORECAST)
2017
2030
NATIONAL POPULATION PROJECTIONS IN POLAND:(IN MILLIONS)
NATIONAL POPULATION PROJECTIONS IN UK:(IN MILLIONS)
012
5-9
90-94
50-54
100+
80-84
95-99
85-89
75-79
70-74
65-69
60-64
55-59
45-49
40-44
35-39
30-34
25-29
20-24
15-19
10-14
0-4
0 1 2 2 013
50-54
45-49
90-94
100+
20-24
85-89
95-99
30-34
80-84
75-79
70-74
65-69
60-64
55-59
25-29
40-44
35-39
15-19
10-14
5-9
0-4
10 2 3
MALE FEMALE MALE FEMALE
2016 2041
Source: UK Office for National Statistics, Statistics Poland, EY analysis
15
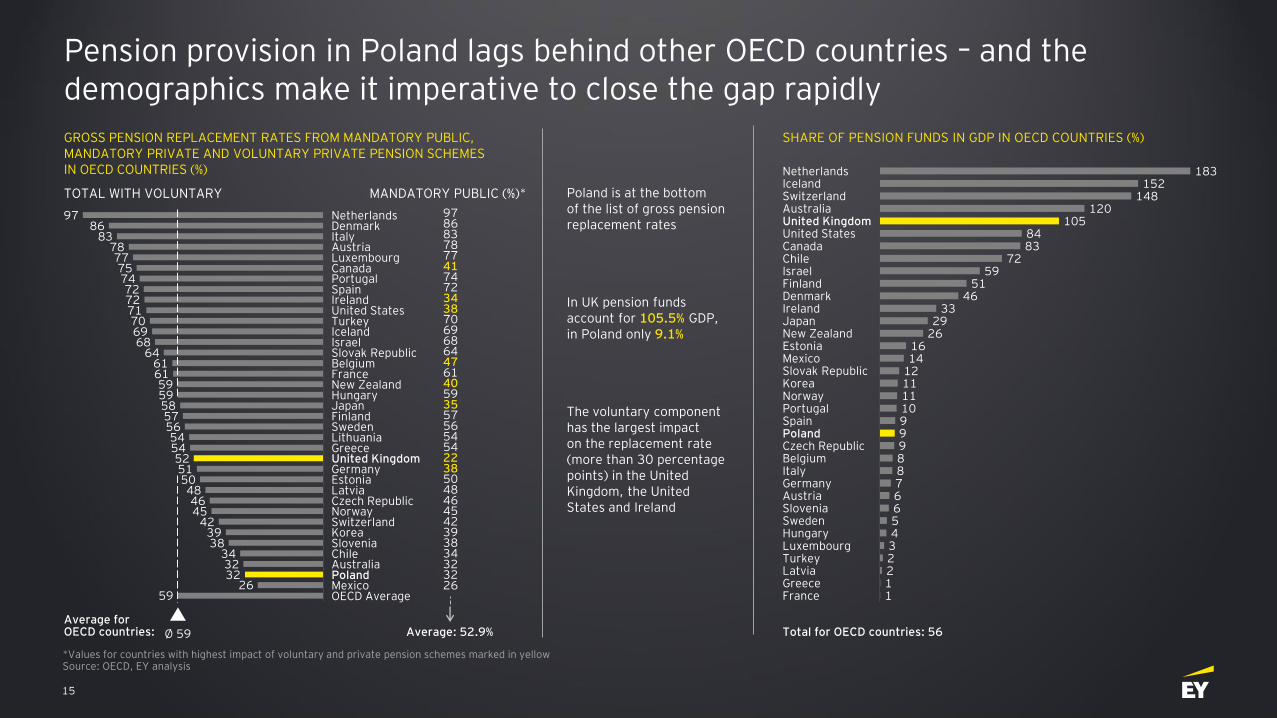
Pension provision in Poland lags behind other OECD countries – and the demographics make it imperative to close the gap rapidly
Average for OECD countries:
183152
148120
1058483
7259
5146
3329
261614
12111110999887665432211
Denmark
NetherlandsIceland
Hungary
SwitzerlandAustralia
Canada
United Kingdom
Israel
United States
Chile
Japan
Finland
Turkey
Czech Republic
Ireland
New Zealand
France
Slovenia
Estonia
Luxembourg
MexicoSlovak RepublicKoreaNorwayPortugalSpainPoland
BelgiumItaly
Greece
GermanyAustria
Sweden
Latvia
Total for OECD countries: 56
MANDATORY PUBLIC (%)* Poland is at the bottom of the list of gross pension replacement rates
In UK pension funds account for 105.5% GDP, in Poland only 9.1%
The voluntary component has the largest impact on the replacement rate (more than 30 percentage points) in the United Kingdom, the United States and Ireland
978683787741747234387069686447614059355756545422385048464542393834323226
Average: 52.9%
TOTAL WITH VOLUNTARY
9786
8378777574727271706968
64616159595857565454525150484645
423938
343232
2659
Denmark
Ø 59
Spain
OECD Average
United Kingdom
Italy
Portugal
Luxembourg
France
Canada
IrelandUnited States
Norway
Turkey
Mexico
Australia
Czech Republic
IcelandIsraelSlovak RepublicBelgium
New ZealandHungaryJapanFinlandSwedenLithuania
Austria
Greece
GermanyEstonia
Korea
Latvia
Chile
Poland
Switzerland
Netherlands
Slovenia
GROSS PENSION REPLACEMENT RATES FROM MANDATORY PUBLIC, MANDATORY PRIVATE AND VOLUNTARY PRIVATE PENSION SCHEMES IN OECD COUNTRIES (%)
SHARE OF PENSION FUNDS IN GDP IN OECD COUNTRIES (%)
Source: OECD, EY analysis*Values for countries with highest impact of voluntary and private pension schemes marked in yellow
16
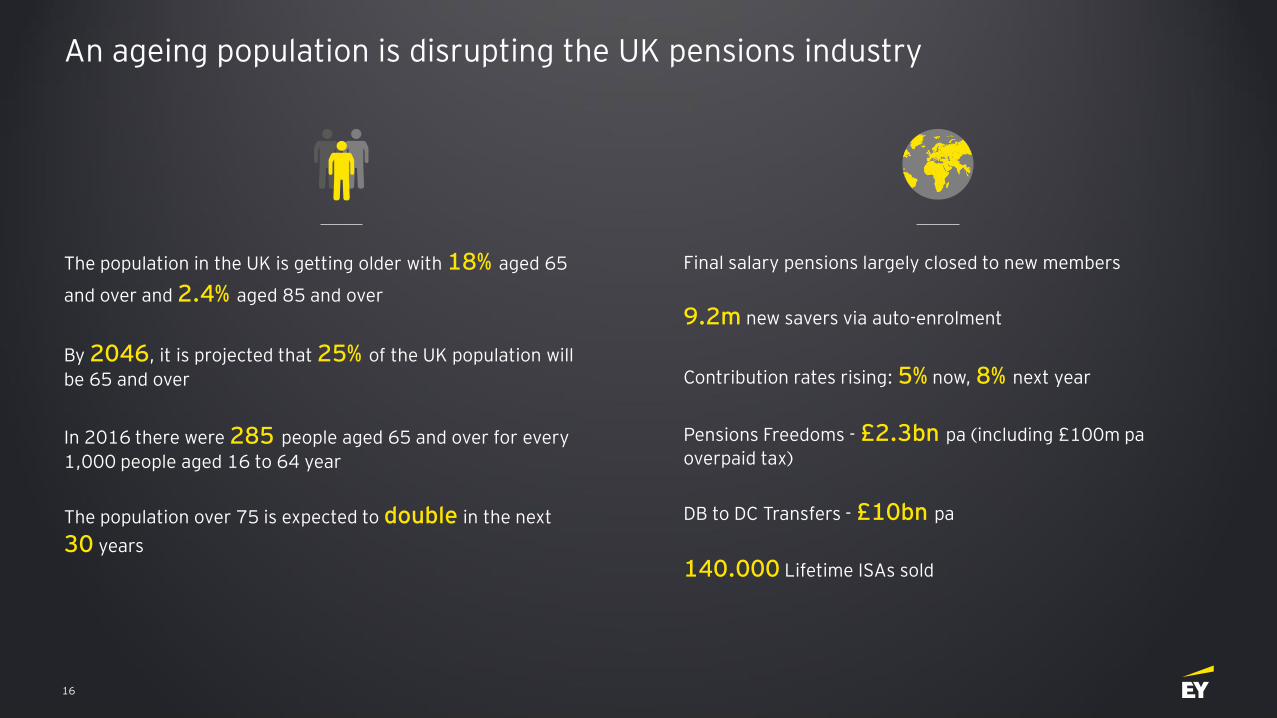
An ageing population is disrupting the UK pensions industry
The population in the UK is getting older with 18% aged 65
and over and 2.4% aged 85 and over
By 2046, it is projected that 25% of the UK population will
be 65 and over
In 2016 there were 285 people aged 65 and over for every
1,000 people aged 16 to 64 year
The population over 75 is expected to double in the next
30 years
Final salary pensions largely closed to new members
9.2m new savers via auto-enrolment
Contribution rates rising: 5% now, 8% next year
Pensions Freedoms - £2.3bn pa (including £100m pa
overpaid tax)
DB to DC Transfers - £10bn pa
140.000 Lifetime ISAs sold
17
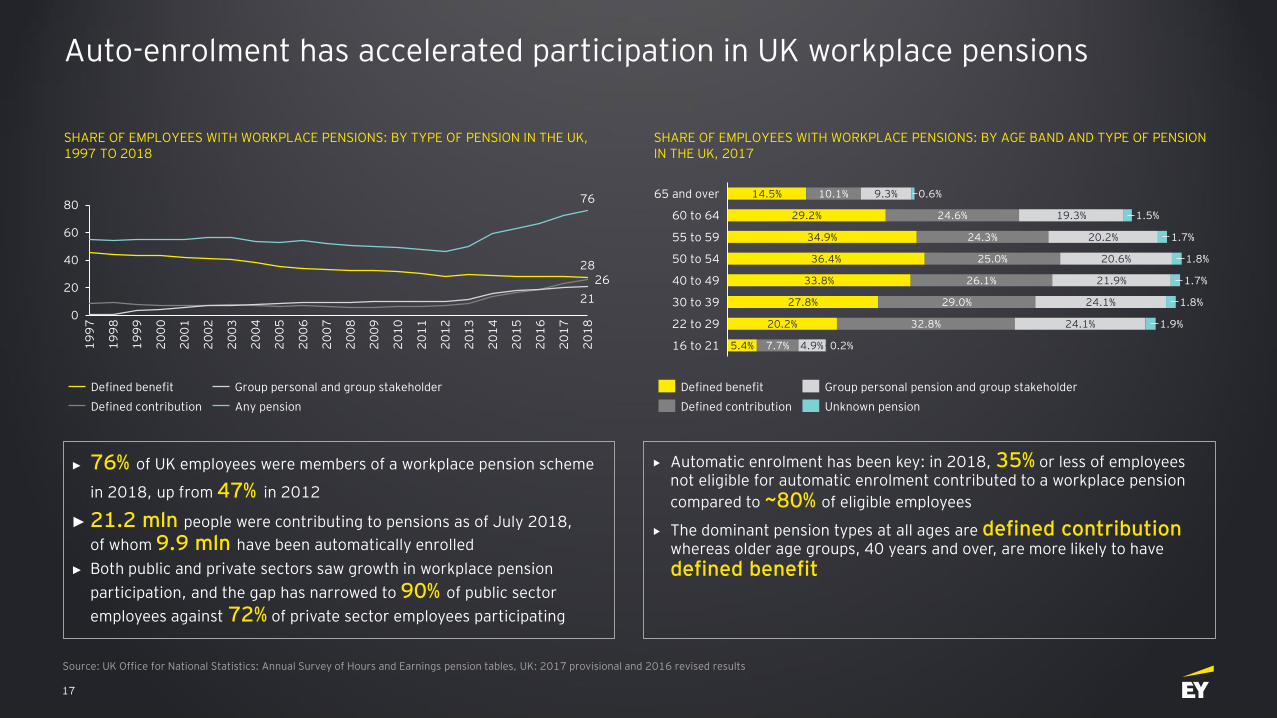
Auto-enrolment has accelerated participation in UK workplace pensions
2826
21
76
0
20
40
60
802
00
2
20
00
19
97
20
14
19
98
19
99
20
04
20
17
20
01
20
03
20
07
20
05
20
06
20
08
20
09
20
10
20
11
20
12
20
13
20
15
20
16
20
18
Any pension
Defined benefit Group personal and group stakeholder
Defined contribution
► 76% of UK employees were members of a workplace pension scheme
in 2018, up from 47% in 2012
► 21.2 mln people were contributing to pensions as of July 2018,
of whom 9.9 mln have been automatically enrolled
► Both public and private sectors saw growth in workplace pension
participation, and the gap has narrowed to 90% of public sector
employees against 72% of private sector employees participating
1.8%
24.3%
65 and over
5.4%
9.3%10.1%
19.3%24.6%
16 to 21
29.2%60 to 64
1.7%20.2%34.9%55 to 59
20.2%
1.5%
14.5%
20.6%25.0%
24.1%
24.1%
36.4%50 to 54
26.1% 1.7%33.8%40 to 49
1.8%
1.9%
29.0%27.8%30 to 39
21.9%
22 to 29
4.9%
0.6%
0.2%7.7%
32.8%
Defined benefit
Unknown pensionDefined contribution
Group personal pension and group stakeholder
SHARE OF EMPLOYEES WITH WORKPLACE PENSIONS: BY TYPE OF PENSION IN THE UK, 1997 TO 2018
SHARE OF EMPLOYEES WITH WORKPLACE PENSIONS: BY AGE BAND AND TYPE OF PENSION IN THE UK, 2017
Automatic enrolment has been key: in 2018, 35% or less of employees not eligible for automatic enrolment contributed to a workplace pension
compared to ~80% of eligible employees
The dominant pension types at all ages are defined contribution whereas older age groups, 40 years and over, are more likely to have
defined benefit
Source: UK Office for National Statistics: Annual Survey of Hours and Earnings pension tables, UK: 2017 provisional and 2016 revised results
18
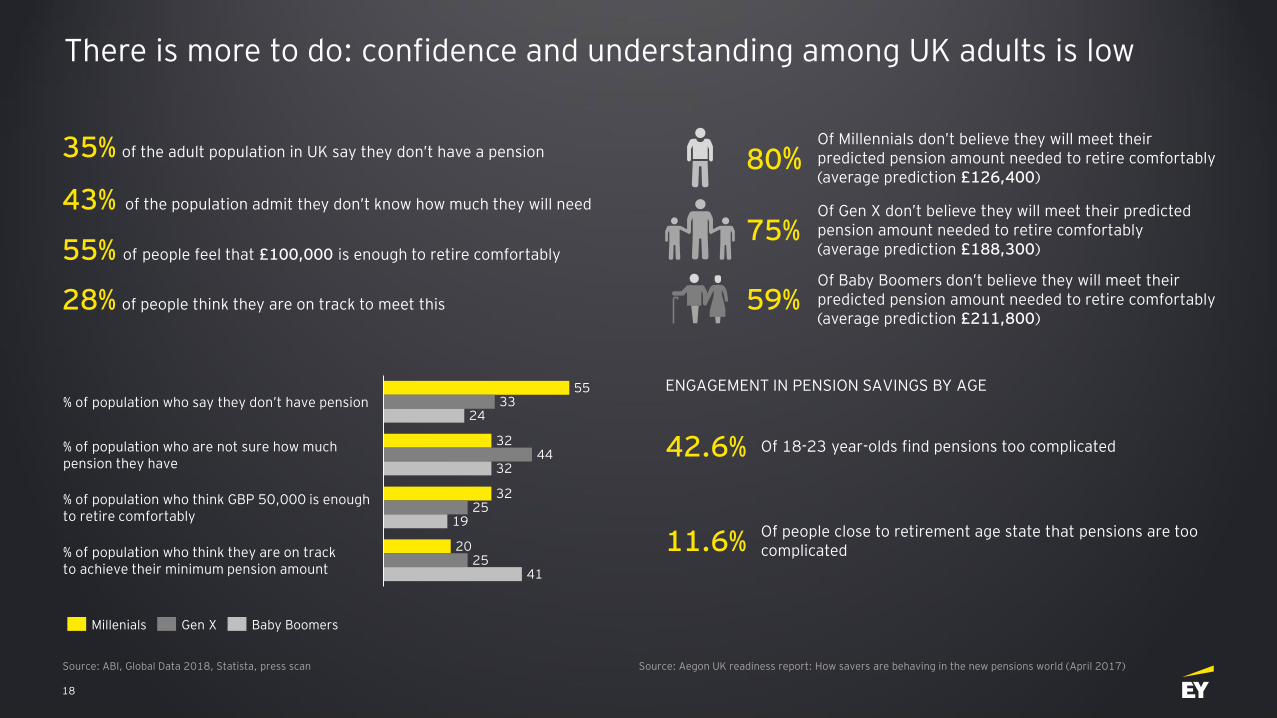
There is more to do: confidence and understanding among UK adults is low
35% of the adult population in UK say they don’t have a pension
43% of the population admit they don’t know how much they will need
55% of people feel that £100,000 is enough to retire comfortably
28% of people think they are on track to meet this
80%Of Millennials don’t believe they will meet their predicted pension amount needed to retire comfortably (average prediction £126,400)
59%Of Baby Boomers don’t believe they will meet their predicted pension amount needed to retire comfortably (average prediction £211,800)
55
32
32
20
33
44
25
25
24
32
19
41
% of population who say they don’t have pension
% of population who think GBP 50,000 is enough to retire comfortably
% of population who are not sure how much pension they have
% of population who think they are on track to achieve their minimum pension amount
Millenials Baby BoomersGen X
ENGAGEMENT IN PENSION SAVINGS BY AGE
75%Of Gen X don’t believe they will meet their predicted pension amount needed to retire comfortably (average prediction £188,300)
42.6% Of 18-23 year-olds find pensions too complicated
11.6% Of people close to retirement age state that pensions are too complicated
Source: ABI, Global Data 2018, Statista, press scan Source: Aegon UK readiness report: How savers are behaving in the new pensions world (April 2017)
19
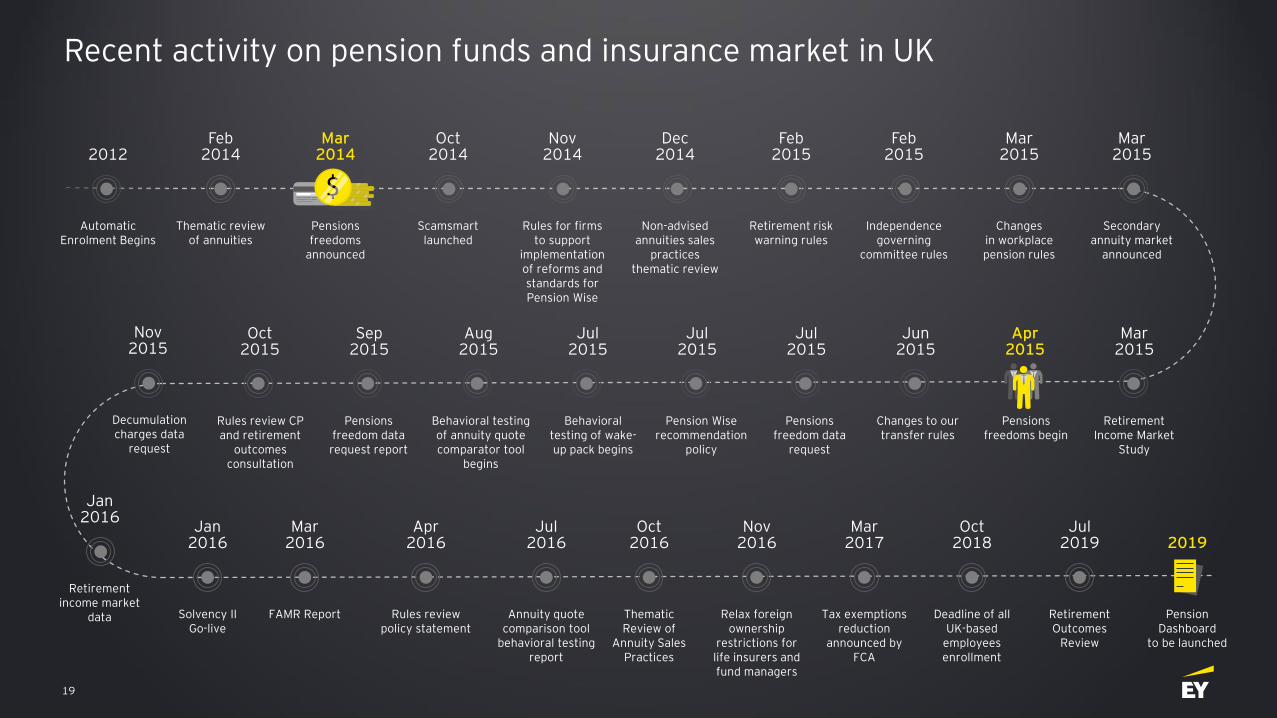
Recent activity on pension funds and insurance market in UK
Automatic Enrolment Begins
Thematic review of annuities
2012Feb
2014
Pensions freedoms
announced
Scamsmartlaunched
Mar 2014
Oct 2014
Rules for firms to support
implementation of reforms and standards for Pension Wise
Non-advised annuities sales
practices thematic review
Nov 2014
Dec 2014
Retirement risk warning rules
Independence governing
committee rules
Feb 2015
Feb 2015
Changes in workplace pension rules
Secondary annuity market
announced
Mar 2015
Mar 2015
Retirement Income Market
Study
Mar 2015
Pensions freedoms begin
Apr 2015
Changes to our transfer rules
Jun 2015
Pensions freedom data
request
Jul 2015
Pension Wise recommendation
policy
Jul 2015
Behavioral testing of wake-up pack begins
Jul 2015
Behavioral testing of annuity quote comparator tool
begins
Aug 2015
Pensions freedom data request report
Sep 2015
Rules review CP and retirement
outcomes consultation
Oct 2015
Decumulationcharges data
request
Retirement income market
data
Nov 2015
Jan 2016
Solvency II Go-live
FAMR Report
Jan 2016
Mar 2016
Rules review policy statement
Apr 2016
Thematic Review of
Annuity Sales Practices
Oct 2016
Pension Dashboard
to be launched
2019
Relax foreign ownership
restrictions for life insurers and fund managers
Nov 2016
Tax exemptions reduction
announced by FCA
Mar2017
Deadline of all UK-based
employees enrollment
Oct 2018
Retirement Outcomes
Review
Jul 2019
Annuity quote comparison tool
behavioral testing report
Jul 2016
20
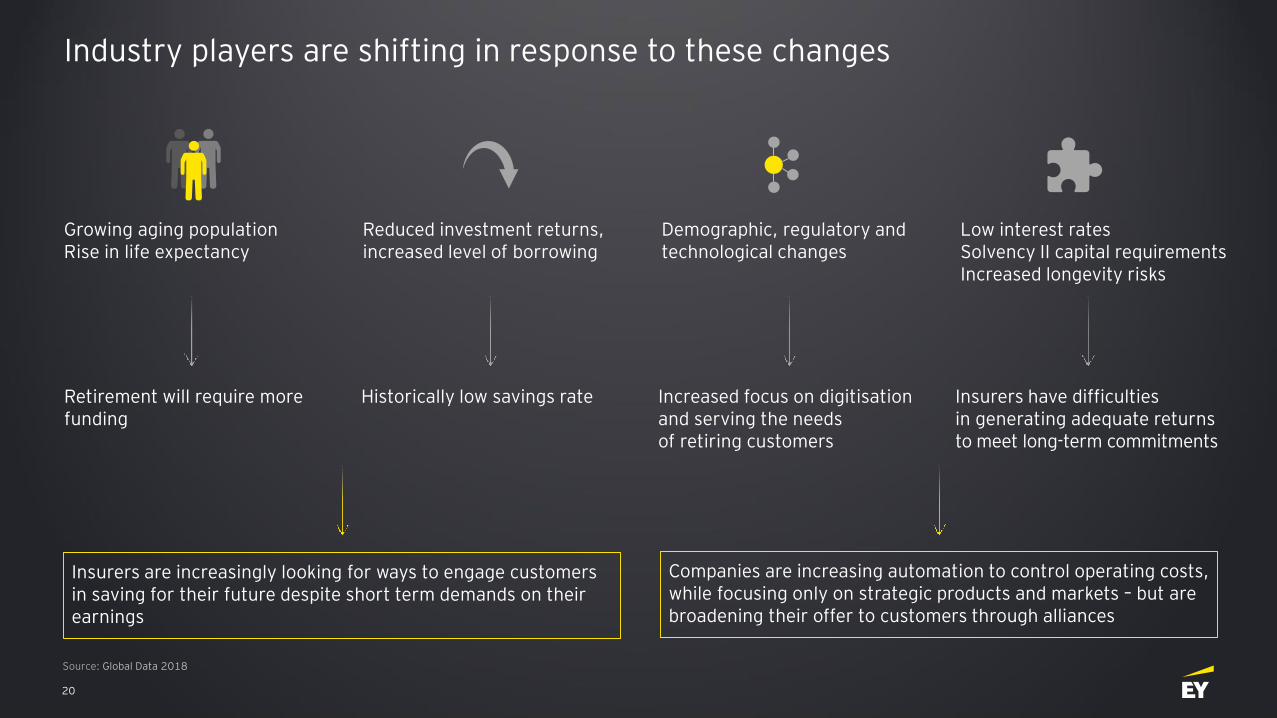
Industry players are shifting in response to these changes
Insurers are increasingly looking for ways to engage customers in saving for their future despite short term demands on their earnings
Companies are increasing automation to control operating costs, while focusing only on strategic products and markets – but are broadening their offer to customers through alliances
Demographic, regulatory and technological changes
Low interest rates Solvency II capital requirements Increased longevity risks
Growing aging populationRise in life expectancy
Reduced investment returns, increased level of borrowing
Retirement will require more funding
Historically low savings rate Increased focus on digitisationand serving the needs of retiring customers
Insurers have difficulties in generating adequate returns to meet long-term commitments
Source: Global Data 2018
21
Participation of Polish employees in III pillar pensions
454.6
NA565.5
274.0
309.8
673.0
412.3
277.7
512.0
329.7
330.2
322.2350.7
314.0314.4
302.1290.6
307.2
280.3 555.3
251.9
275.0
291.2
277.3
551.7
NA
821.8
784.8
742.0
628.4
592.7
543.1
584.5
2017
NA
5.3
2018
7.7
12.6 9.8
2.2
11.4
2011
2016
13.8
10.6
6.6
6.2 2015
10.3 2014
9.4 4.4 2013
8.3 20123.6
2.8
6.3 2.7
2009
2010
5.0
3.6
15.6
1.6
11.0NA
9.0
22.4
19.1
2008
9.4
11.9
7.2
5.2
16.8
IKE IKZE PPE
51-60
>60
46
41-50
31-40
<30
177
225
259
206
230
221
151
179
32
Women Men
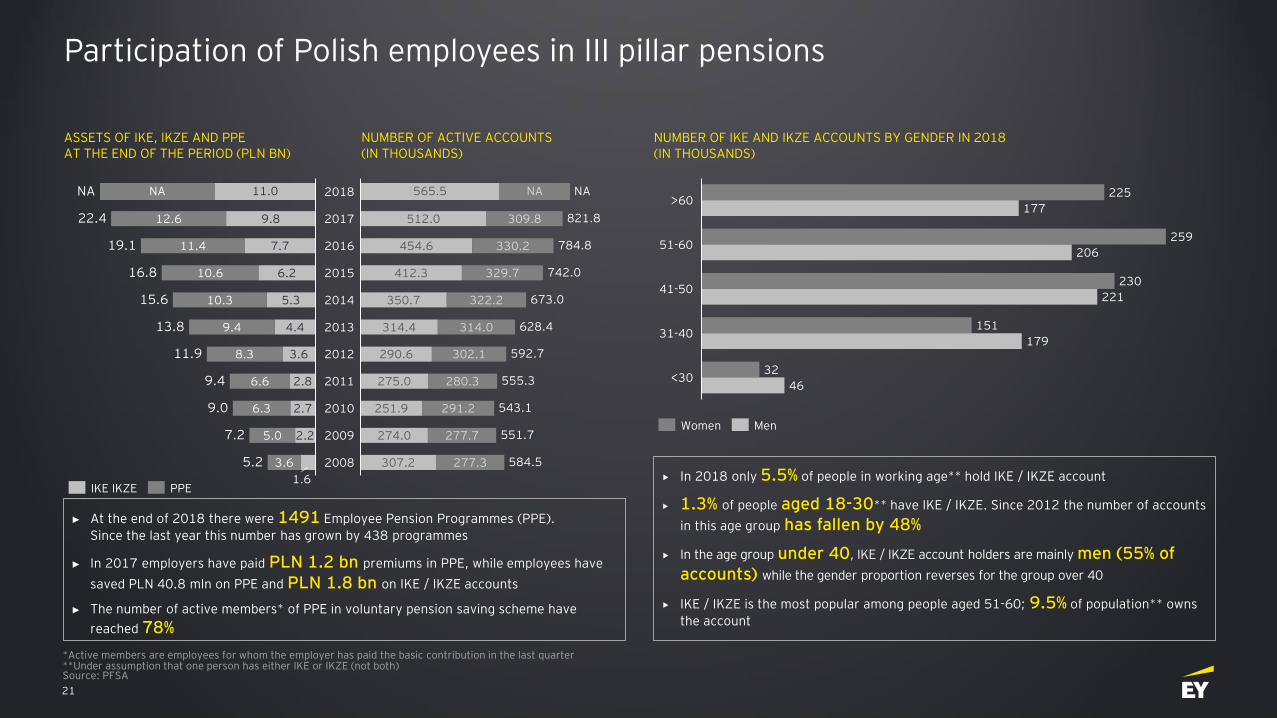
► At the end of 2018 there were 1491 Employee Pension Programmes (PPE).
Since the last year this number has grown by 438 programmes
► In 2017 employers have paid PLN 1.2 bn premiums in PPE, while employees have
saved PLN 40.8 mln on PPE and PLN 1.8 bn on IKE / IKZE accounts
► The number of active members* of PPE in voluntary pension saving scheme have
reached 78%
In 2018 only 5.5% of people in working age** hold IKE / IKZE account
1.3% of people aged 18-30** have IKE / IKZE. Since 2012 the number of accounts
in this age group has fallen by 48%
In the age group under 40, IKE / IKZE account holders are mainly men (55% of accounts) while the gender proportion reverses for the group over 40
IKE / IKZE is the most popular among people aged 51-60; 9.5% of population** owns
the account
ASSETS OF IKE, IKZE AND PPEAT THE END OF THE PERIOD (PLN BN)
NUMBER OF IKE AND IKZE ACCOUNTS BY GENDER IN 2018 (IN THOUSANDS)
NUMBER OF ACTIVE ACCOUNTS (IN THOUSANDS)
*Active members are employees for whom the employer has paid the basic contribution in the last quarter**Under assumption that one person has either IKE or IKZE (not both)Source: PFSA
22
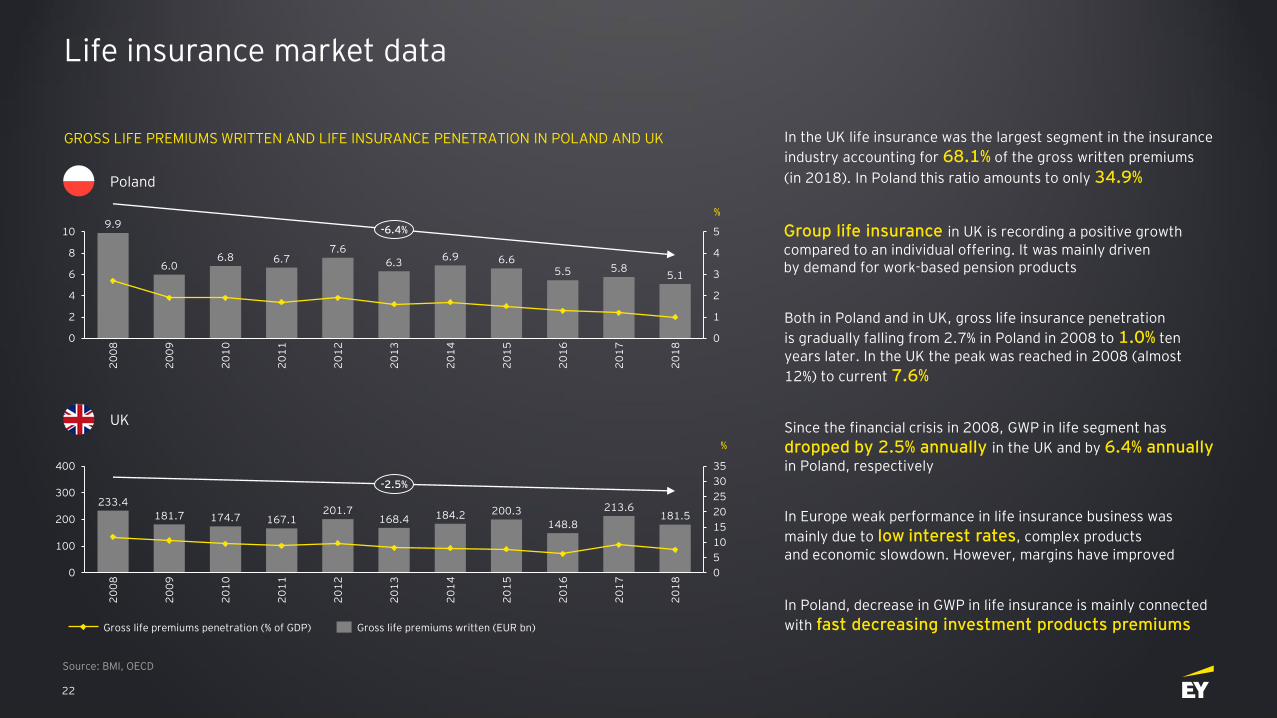
Life insurance market data
GROSS LIFE PREMIUMS WRITTEN AND LIFE INSURANCE PENETRATION IN POLAND AND UK
Source: BMI, OECD
0
1
2
3
4
5
0
2
4
6
8
102
01
0
20
11
20
09
20
08
6.0
20
12
5.1
%
6.7
20
13
20
14
6.8
20
15
20
16
6.9
20
17
20
18
9.9
7.6
6.3 6.65.5 5.8
-6.4%
Gross life premiums penetration (% of GDP) Gross life premiums written (EUR bn)
Poland
0
5
10
15
20
25
30
35
0
100
200
300
400
20
08
213.6
%
20
12
20
09
20
14
20
10
20
11
20
13
20
15
20
16
20
17
148.8
20
18
233.4
174.7181.7 167.1201.7
168.4 184.2 200.3 181.5
-2.5%
UK
In the UK life insurance was the largest segment in the insurance
industry accounting for 68.1% of the gross written premiums
(in 2018). In Poland this ratio amounts to only 34.9%
Both in Poland and in UK, gross life insurance penetration
is gradually falling from 2.7% in Poland in 2008 to 1.0% ten years later. In the UK the peak was reached in 2008 (almost
12%) to current 7.6%
Since the financial crisis in 2008, GWP in life segment has
dropped by 2.5% annually in the UK and by 6.4% annually in Poland, respectively
In Europe weak performance in life insurance business was
mainly due to low interest rates, complex products and economic slowdown. However, margins have improved
Group life insurance in UK is recording a positive growth compared to an individual offering. It was mainly driven by demand for work-based pension products
In Poland, decrease in GWP in life insurance is mainly connected
with fast decreasing investment products premiums
23
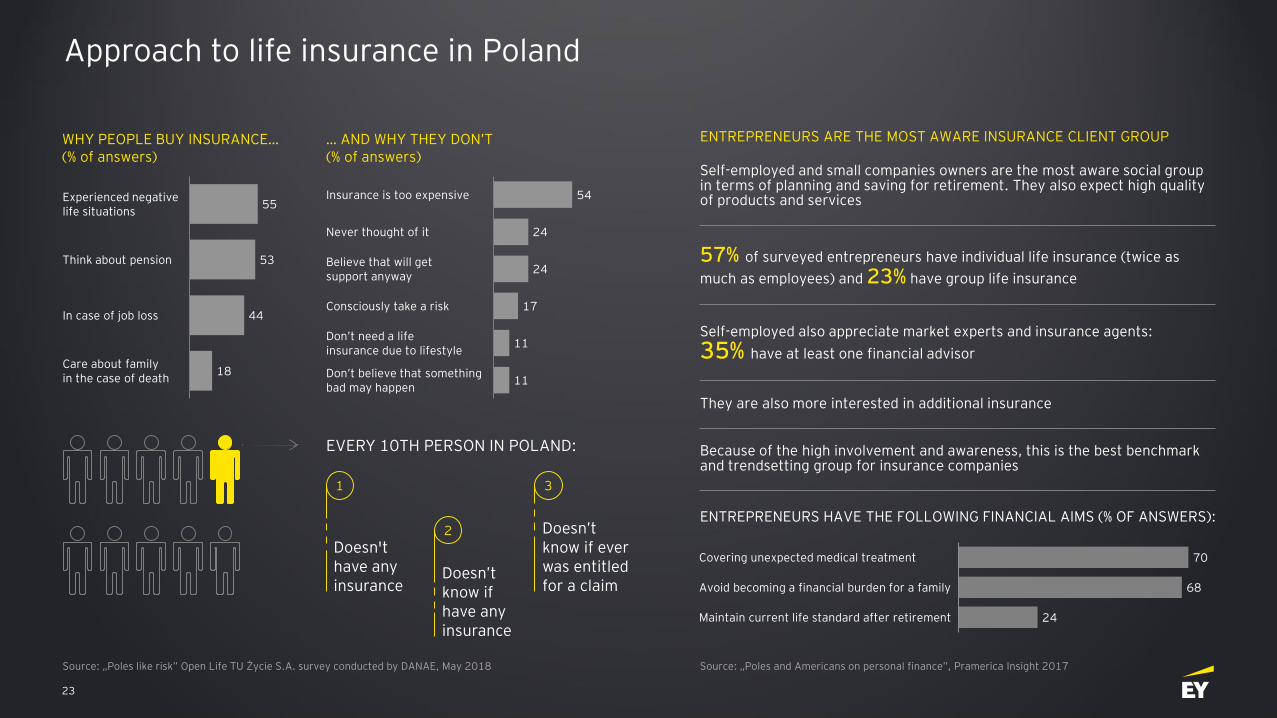
Approach to life insurance in Poland
WHY PEOPLE BUY INSURANCE…(% of answers)
55
53
44
18
Experienced negative life situations
Think about pension
Care about family in the case of death
In case of job loss
… AND WHY THEY DON’T(% of answers)
54
24
24
17
11
11
Consciously take a risk
Insurance is too expensive
Never thought of it
Believe that will get support anyway
Don’t need a life insurance due to lifestyle
Don’t believe that something bad may happen
EVERY 10TH PERSON IN POLAND:
70
68
24Maintain current life standard after retirement
Covering unexpected medical treatment
Avoid becoming a financial burden for a family
Doesn'thave any insurance
1
Doesn’t know if have any insurance
2 Doesn’t know if ever was entitled for a claim
3
ENTREPRENEURS HAVE THE FOLLOWING FINANCIAL AIMS (% OF ANSWERS):
Self-employed and small companies owners are the most aware social group in terms of planning and saving for retirement. They also expect high quality of products and services
57% of surveyed entrepreneurs have individual life insurance (twice as
much as employees) and 23% have group life insurance
Self-employed also appreciate market experts and insurance agents:
35% have at least one financial advisor
They are also more interested in additional insurance
Because of the high involvement and awareness, this is the best benchmark and trendsetting group for insurance companies
Source: „Poles like risk” Open Life TU Życie S.A. survey conducted by DANAE, May 2018 Source: „Poles and Americans on personal finance”, Pramerica Insight 2017
ENTREPRENEURS ARE THE MOST AWARE INSURANCE CLIENT GROUP
24
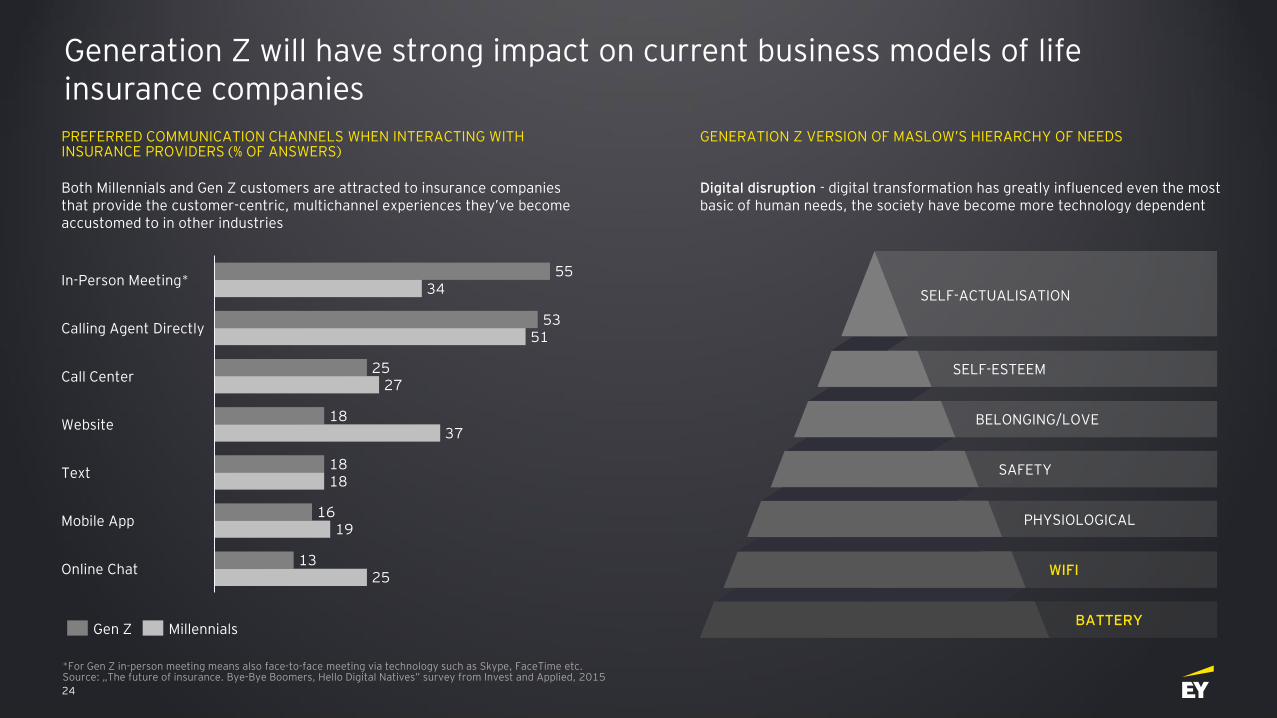
Generation Z will have strong impact on current business models of lifeinsurance companies
PREFERRED COMMUNICATION CHANNELS WHEN INTERACTING WITH INSURANCE PROVIDERS (% OF ANSWERS)
Both Millennials and Gen Z customers are attracted to insurance companies that provide the customer-centric, multichannel experiences they’ve become accustomed to in other industries
55
53
25
18
18
16
13
34
51
27
37
18
19
25Online Chat
Mobile App
Call Center
Calling Agent Directly
Website
In-Person Meeting*
Text
Gen Z Millennials
*For Gen Z in-person meeting means also face-to-face meeting via technology such as Skype, FaceTime etc.Source: „The future of insurance. Bye-Bye Boomers, Hello Digital Natives” survey from Invest and Applied, 2015
Digital disruption - digital transformation has greatly influenced even the most basic of human needs, the society have become more technology dependent
SELF-ACTUALISATION
SELF-ESTEEM
BELONGING/LOVE
SAFETY
PHYSIOLOGICAL
WIFI
BATTERY
GENERATION Z VERSION OF MASLOW’S HIERARCHY OF NEEDS
25
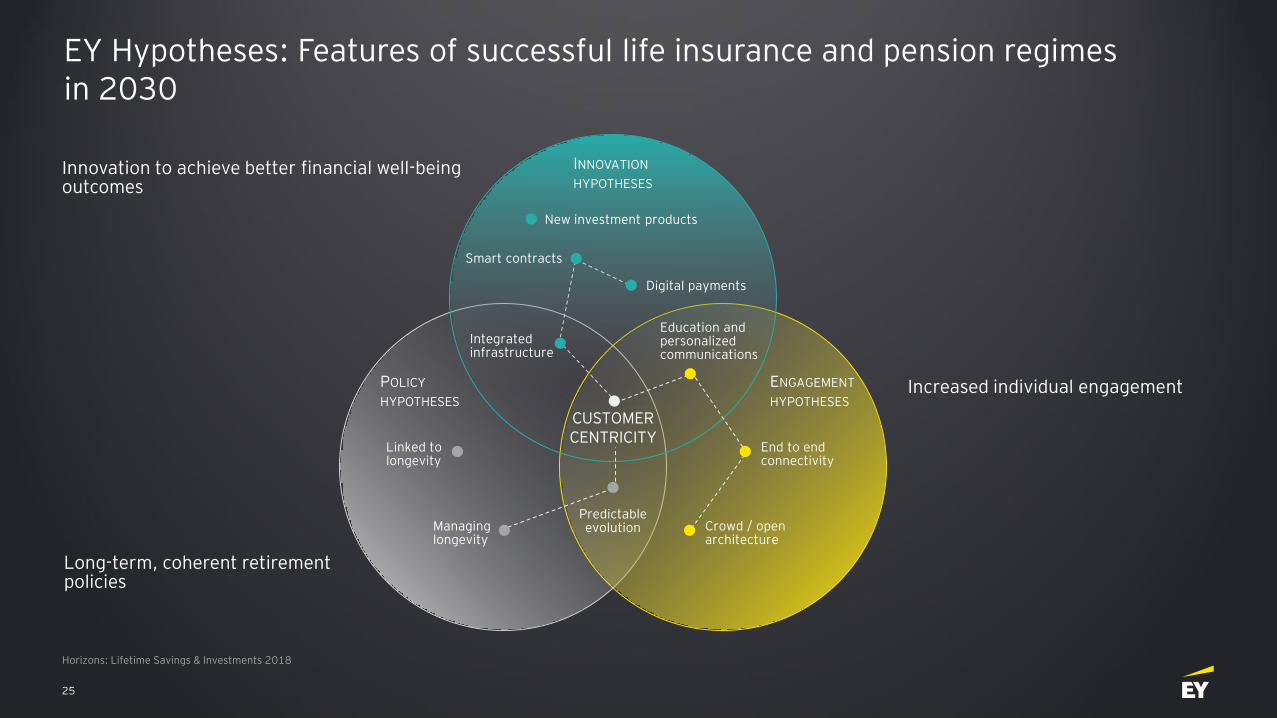
EY Hypotheses: Features of successful life insurance and pension regimesin 2030
Horizons: Lifetime Savings & Investments 2018
Innovation to achieve better financial well-being outcomes
Increased individual engagement
Long-term, coherent retirement policies
POLICY
HYPOTHESES
INNOVATION
HYPOTHESES
Digital payments
New investment products
Smart contracts
Integrated infrastructure
CUSTOMER CENTRICITY
Education and personalized communications
Linked to longevity
ENGAGEMENT
HYPOTHESES
End to end connectivity
Crowd / open architecture
Predictable evolutionManaging
longevity

26
Karol RaźniewskiAssociate Partner
[email protected]+48 504 112 771
Jason WhyteAssociate Partner
[email protected]+44 7973 193 715
Wojciech SoleniecPartner
[email protected]+48 660 440 085
Marcin SadekPartner
[email protected]+48 519 404 991
Contact: