Embed Size (px)
Citation preview
Generation of stable transgenic hTERT-RPE1 cell lines for imaging analysis of cilia tip proteins at high
temporal and spatial resolution
Sania Gilani
Master thesis in Molecular Bioscience
UNIVERSITY OF OSLO
June 2018

II
III
© Author
Year: 2018
Title: Generation of stable transgenic hTERT-RPE1 cell lines for imaging analysis of cilia tip
proteins at high temporal and spatial resolution
Author: Sania Gilani
http://www.duo.uio.no/
Print: Reprosentralen, University of Oslo

IV
Acknowledgements
The presented work was carried out in the Molecular Radiation Biology group at the
Department of Radiation Biology, Institute for Cancer Research, Norwegian Radium Hospital
and Oslo University Hospital from January 2017 to May 2018.
Firstly, I would like to thank my supervisor Sebastian for his expert guidance and
encouragement throughout this work; you have been a role model I look up to. Secondly, I am
grateful to Kari-Anne for being there to help whenever I have needed, it has been immensely
appreciated.
A special thanks to Trond, Idun, Monica and Heidi for their support and expertise in flow
cytometry. I would also like to thank Kay Oliver Schink for guidance at the virus lab and with
microscopy. Further, I would like to thank everyone at the Department of Radiation Biology.
Last, but not least, my heartiest gratitude to my family who have been an unimaginable
support and help throughout my years as a student and with this thesis.
It has been inspiring to work with all of you, and I am thankful for all the assistance you have
all given me in each your way.
Sania Gilani
Drammen, May 2018
V
Abstract
The primary cilium is a signaling organelle present on the cell surface of most eukaryotic
cells. The organelle integrates several signaling pathways important for biological processes
such as tissue homeostasis and embryonic development. Disruption of the primary cilium
structure and/or function leads to a wide range of developmental diseases termed ciliopathies.
Joubert syndrome is an autosomal recessive ciliopathy with mutations found in several ciliary
protein encoding genes, including CSPP1 and CEP104. CSPP-L (predominant isoform of
CSPP1) and CEP104 interact biochemically and are involved in cilia formation, but their
ciliary function is not clarified at molecular level. In the present study, hTERT-RPE1 cell
lines were generated that stably express mNeonGreen-CSPP-L or mNeonGreen-CEP104,
respectively, at levels not interfering with cell cycle progression or cilia formation. The
mNeonGreen-CEP104 cell line is of particular importance since immunofluorescence
compatible CEP104 specific antibodies are no longer commercially available. Study of the
ciliary localization of CSPP-L and CEP104 fusion proteins by 3D-Structured Illumination
Microscopy resolved previously undetermined structural details of CEP104 and CSPP-L at
the centrosome and the ciliary tip, and identified co-localization of endogenous CSPP-L and
mNeonGreen-CEP104 at the cilia tip. Ciliary entry of mNeonGreen-CEP104 was found to be
CSPP-L independent, supporting the hypothesis that intra-ciliary interaction of CEP104 and
CSPP-L is required for formation of cilia of normal length. Finally, this thesis lays foundation
for advanced live cell imaging studies of the potential dynamic behavior of these important
proteins at the centrosome and the cilia tip.
VI
Abbreviations
Ser Serum (FBS)
3D-SIM 3-Dimentional Structured Illumination Microscopy
ARL13B ADP ribosylation factor like GTPase 13
ATP Adenosine triphosphate
BBS Bardet-Biedl syndrome
BSL-2 Biosafety Level 2
CEP104 Centrosomal protein of 104 kDa
CEP164 Centrosomal protein of 164 kDa
CEP290 Centrosomal protein of 290 kDa
CEP83 Centrosomal protein of 83 kDa
CEP89 Centrosomal protein of 89 kDa
CEP97 Centrosomal protein of 97 kDa
CLEM Correlative light and electron microscopy
CMV Cytomegalovirus
CP110 Centrosomal protein of 110 kDa
CS Centriolar satellites
CSPP1 Centrosome, spindle pole and cilia associated protein 1
CSPP-L Predominant isoform of CSPP1
DAPI 4’,6-diamidino-2-phenylinole
DAs Distal appendages
DAVs Distal appendage vesicles
ddNTP Dideoxyribonucloside triphosphate
DMSO dimethylsulphoxide
DNA Deoxyribonucleic acid
dNTP Deoxynucloside triphosphate
VII
dsDNA Double stranded deoxyribonucleic acid
ECT2 Epithelial cell transforming sequence 2 oncogene
EDTA Ethylenediaminetetraacetic acid
EF-1α Elongation factor 1α
EGFP Green fluorescent protein
EHD1 EH domain-containing protein 1
FACS Fluorescence-activated cell sorting
FAP256 Homolog of CEP104 in Chlamyomonas
FBF1 Fas Binding Factor 1
FBS Fetal Bovine Serum
FL Full length
G0 Quiescent cells
G1 Gap phase 1 of the cell cycle
G2 Gap phase 2 of the cell cycle
GCP2 Gamma-tubulin complex component 2
GCP3 Gamma-tubulin complex component 3
GDP Guanosine diphosphate
GFP Green fluorescent protein
GLI1 Zinc finger protein GLI1
GLI2 Zinc finger protein GLI1
GLI3 Transcriptional activator GLI3
GTP Guanosine triphosphate
HEK293T Cell line; Human embryonic kidney
Hh Hedgehog
HRP Horseradish Peroxidase
hTERT-RPE1 Cell line; Human retinal pigmented epithelium, hTERT immortalized
ICR Institute of Cancer Research
VIII
IFM Immunofluorescense microscopy
IFT Intraflagellar transport
IFT20 Intraflagellar transport protein 20
IFT-A Intraflagellar transport complex A (retrograde transport)
IFT-B Intraflagellar transport complex A (anterograd transport)
IRES Internal Ribosome Entry site
JBTS Joubert syndrome
kDa Kilodaltons
KIAA0556 Protein KIAA0556
KIF7 Kinesin-like protein KIF7
LAF Laminar flow cabinet
LB Luria Bertani growth medium
LentiX HEK293T cell line
LTR Long terminal repeats
M Mitosis, phase of the cell cycle
mNG mNeonGreen
MOI Multiplicity of infection
MRI Magnetic resonance imaging
MT Microtubule
MTOC Microtubule-organizing center
MyoGEF Myosin GTPase exchange factor
NA Numerical Aperture
NEK1 Serine/threonine-protein kinase Nek1
NPHP8 Nephrocystin 8
ORF Open reading frame
OUH Oslo University Hospital
PBS Phosphate buffered saline
IX
PBS-AT PBS with albumin and triton added
PC Primary cilium
PCM Pericentriolar material
PCM1 Percentriolar material 1
PCR Polymerase chain reaction
PCV The primary ciliary vesicle
PDGFRα Platelet-derived growth factor receptor alpha
PFA Paraformaldehyde
PGK Phosphoglycerate kinase
PS Penicillin/Streptamycin
PTCH Patched
PVDF Polyvinylidene difluoride
Rab8a Ras-related protein Rab-8A
RPE1 WT hTERT-RPE1 cell line
RPGRIP1L See NPHP8
Rpm Rotations per minute
RRE Reverse Response Element
S Synthesis phase of the cell cycle
SAP Shrimp alkaline phosphatase
SCC-A Side scatter areal (in flow cytometry)
SD Standard deviation
SDAs Subdistal appendages
SDS Sodium dodecylsulfate
SDS-PAGE Sodium dodecylsulfate polyacrylamide gel electrophoresis
SEM Standard error of the mean
SIN Self-inactivating
SLS Senior-Løken syndrome
X
SMO Smoothened
ssDNA Single stranded deoxyribonucleic acid
SUFU Suppressor of Fused
TAE buffer Tris Acetate-EDTA buffer
TBST buffer Tris buffered saline with Tween
TFs Transition fibers
TOG Tumor overexpressed gene
TTBK2 Tau tubulin kinase 2
TZ Transition zone
UBR5 Ubiquitin protein ligase E3 component N-recognin 5
UV Ultra Violet
VSV-G Vesicular stomatitis G glycoprotein
WB Western Blot
Wnt Wingless/Integrated
WT Wild type
xg Times gravity
γ-TuRC γ-tubulin ring complex
XI
Table of contents
1 Introduction ........................................................................................................................ 1
1.1 Primary cilia – an overview ......................................................................................... 1
1.1.1 Structure ............................................................................................................... 1
1.1.2 Ciliogenesis .......................................................................................................... 7
1.1.3 Function ................................................................................................................ 9
1.1.4 Ciliopathies ......................................................................................................... 11
1.2 Main proteins in the study ......................................................................................... 13
1.2.1 CSPP-L ............................................................................................................... 13
1.2.2 CEP104 ............................................................................................................... 15
2 Background and aims ....................................................................................................... 17
2.1 Background of the study ............................................................................................ 17
2.2 Aim of the study ........................................................................................................ 19
3 Methods ............................................................................................................................ 20
3.1 Restriction endonuclease and gateway cloning ......................................................... 22
3.1.1 Primer design ...................................................................................................... 23
3.1.2 Polymerase chain reaction .................................................................................. 25
3.1.3 Agarose gel electrophoresis ............................................................................... 26
3.1.4 Restriction digestion ........................................................................................... 27
3.1.5 Ligation .............................................................................................................. 28
3.1.6 Transformation ................................................................................................... 29
3.1.7 Miniprep and midiprep ....................................................................................... 30
3.1.8 Sanger sequencing .............................................................................................. 30
3.1.9 Gateway cloning – LR reaction .......................................................................... 32
3.2 Cell culture ................................................................................................................ 34
3.3 Lentivirus particle production and hTERT-RPE1 transduction .............................. 36
3.4 Flow cytometry and cell cycle analysis ..................................................................... 38
3.5 SDS-PAGE and western blot ..................................................................................... 42
3.6 Fluorescence microscopy and live-cell imaging ....................................................... 44
4 Results .............................................................................................................................. 49
4.2 Transduction and selection of transformed hTERT-RPE1 cells ............................... 55
4.3 Western blot and fluorescence microscopy ............................................................... 58
XII
4.4 Analysis of cilia formation ........................................................................................ 62
4.5 Cell cycle progression ............................................................................................... 66
4.6 Fine-localization ........................................................................................................ 72
5 Discussion ........................................................................................................................ 77
5.1 Generation of stable cell lines ................................................................................... 77
5.2 Consequences of viral expression .............................................................................. 80
5.3 Fine-localization by microscopy ............................................................................... 82
5.3.1 Methodological considerations of localization analysis ..................................... 85
6 Conclusion ........................................................................................................................ 87
7 Future perspectives ........................................................................................................... 88
Appendix .................................................................................................................................. 89
References .............................................................................................................................. 102
1
1 Introduction
Cilia are membrane-enclosed organelles found on the cell surface of most eukaryotic cells.
The organelle is grouped into motile and non-motile cilia, where the latter is also known as
primary cilia [1]. Motile cilia and primary cilia are microtubule-based structures that originate
from the centrosome. Cilia are formed when cells are in G0/G1 phase of the cell cycle [2]. The
primary cilium functions as a specialized sensory organelle. It mediates several key signaling
pathways controlling processes such as cell proliferation and tissue homeostasis. For instance,
the Hegdehog (Hh) and Wnt pathway. Structural and/or functional defects in the cilium lead
to a collection of diseases termed ciliopathies. CSPP-L and CEP104 are two cilia proteins
found mutated in the ciliopathy Joubert syndrome [3-6]. CSPP-L and CEP104 are involved in
cilia formation, but their ciliary function is not clarified at a molecular level.
1.1 Primary cilia – an overview
1.1.1 Structure
The primary cilium is a microtubule-based structure extending from the centrosome. In the
case of primary cilia, the mother centriole is modified into a so called basal body to allow
formation of the cilia axoneme. The organelle is engulfed by a membrane distinct from the
rest of the cell body, allowing specialized signaling function.
Microtubules
Microtubules are cytoskeletal filaments found in the cytoplasm of the cell. They are involved
in a diverse set of cellular processes such as transport of organelles and proteins, formation of
bipolar mitotic spindle during cell division and formation of cilia [7]. Microtubules are
formed in an energy dependent manner by the polymerization of tubulin heterodimers. The
tubulin superfamily consist of several globular proteins such as α, β, γ, δ, ε, and ζ [8]. α-
tubulin and β-tubulin form the tubulin heterodimers that constitute the microtubule, whereas
γ-tubulin is involved in the nucleation of the microtubule [1]. A microtubule consists of 13
parallel protofilaments which gives rise to the characteristic hollow cylindrical structure of
microtubules. Protofilaments are formed when α-tubulin and β-tubulin heterodimers are
2
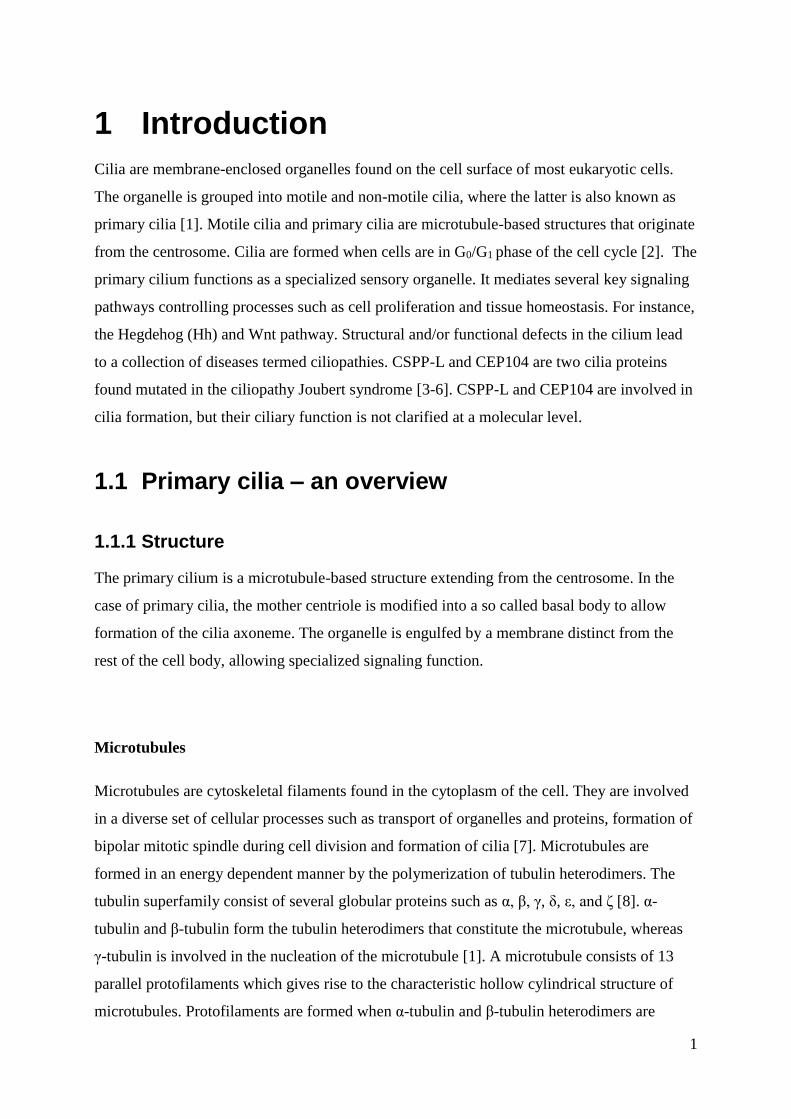
stacked on top of each other in a vertical line (figure 1). The tubulin subunits are placed in an
orderly fashion with α-tubulin always towards the minus end and β-tubulin towards the plus
end.
Figure 1. The organization of microtubule. The tubulin heterodimer, α-tubulin and β-
tubulin. are shown as blue and orange circles, respectively. Several tubulin heterodimers are
stacked on top of each other to form a protofilament, which in turn constitutes the
microtubule. Figure adapted from [9].
Microtubules are dynamic structures which constantly polymerize and depolymerize, a
phenomenon known as dynamic instability [10]. Nucleation of microtubules occurs from a
microtubule-organizing center (MTOC). The MTOC is enriched with γ-tubulin. Two γ-
tubulin proteins form a γ-tubulin small complex (γ-TuSC) with one molecule each of GCP2
and GCP3 [11]. Several γ-TuSC form a γ-tubulin ring complex (γ-TuRC), which serve as a
nucleation site for the minus end of microtubule and confer stability to the microtubule by
preventing depolymerization [12]. Several proteins are implicated in the attachment of γ-
TuRC to the centrosome such as Ninein (subdistal appendage protein of the mother centriole)
and Pericentrin [13, 14]. There are several known MTOC in animals, such as the Golgi
complex and the centrosome [15].
3
Centrosome
The centrosome is the prominent MTOC in most animal cells. The organelle regulates cell
shape, polarity and spindle pole organization. In quiescent cells, the centrosome can also form
cilia. The centrosome consists of two orthogonally arranged unequal centrioles, a mother and
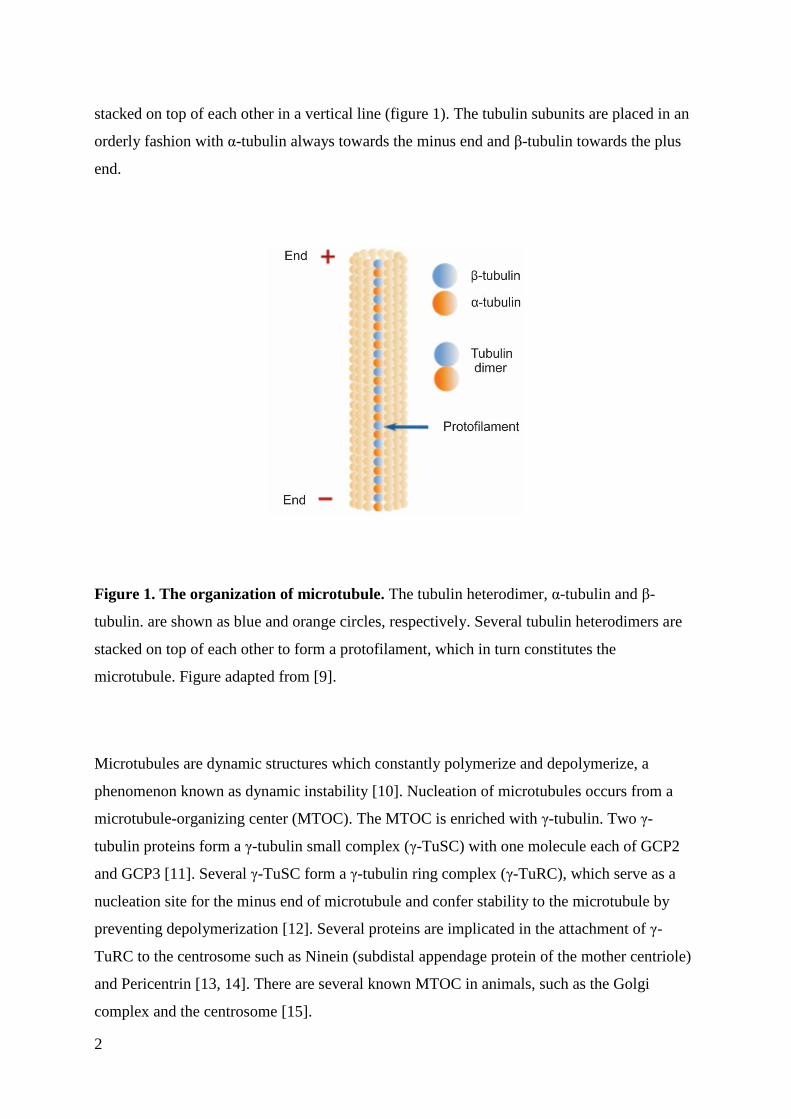
a daughter centriole, surrounded by pericentriolar material (PCM) (figure 2A) [2].
Figure 2. Structure of the centrosome. A) The centrosome is composed of a mother
centriole and a daughter centriole surrounded by pericentriolar matrix. The mother centriole
has distal appendages and subdistal appendages. The centrioles are connected by linkage
proteins. The centrosome is a microtubule organizing center indicated by the microtubules
radiating from the structure. B) Protofilaments can be arranged in singlet, doublet, and triplet
microtubules. Centrosomes contain nine sets of triplet microtubules. A singlet microtubule of
thirteen protofilaments is called A-tubules. A microtubule singlet fused with B-tubules, which
is an addition of ten protofilaments, makes a microtubule doublet. Further, fusion of a
microtubule doublet with C-tubules generates a triplet microtubule. Figure adapted from [21,
22].
The microtubule nucleation site γ-TuRC is embedded in the PCM. Centrioles are cylindrical
structures of ~200 × 400 nm size which are composed of nine sets of triplet microtubules
(figure 2B) [16]. A singlet microtubule of thirteen protofilaments is fused with two following
sets of ten protofilaments to create a triplet structure. The mother and daughter centrioles are
held together by linkage proteins [17]. The mother centriole is distinguished from the
4
daughter centriole by the presence of distal appendages (DAs) and subdistal appendages
(SDAs). SDAs have been implicated in a variety of processes such as anchoring of
microtubule minus-ends to the centrosome [18] and regulating vesicle trafficking [19],
whereas DAs are involved in membrane docking and ciliogenesis [20].
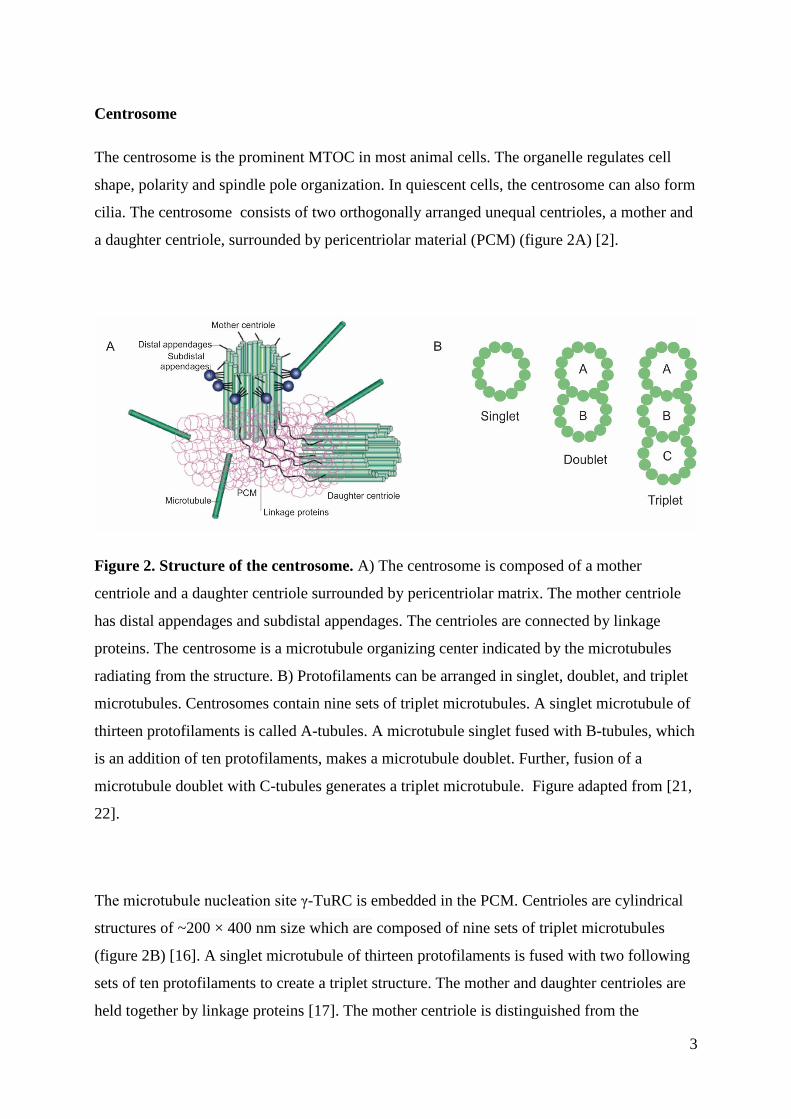
In most animal cells, the centrosome exists as one single copy in G1/G0 [21]. However, prior
to mitosis, the centrosome is duplicated and separated to promote bipolar spindle formation.
During the initial stages of centrosome duplication a new centriole is formed at the proximal
part of both the mother centriole and the daughter centriole, resulting in duplication of the
existing centrosome in the cell. Centrosome duplication is divided into four consecutive
stages synchronized with the cell cycle: centriole disengagement (G1), centriole duplication
(S), centriole elongation (G2) and centrosome separation (G2/M) [11]. The separated
centrosomes end up in two individual cells after cytokinesis with the potential to form a
cilium in G1/G0. A schematic outline of the centrosome duplication cycle is given in figure 3.
Figure 3. Centrosome duplication. The four stages of centrosome duplication include
centriole disengagement (G1), centriole duplication (S), centriole elongation (G2) and
centrosome separation and maturation. Cells in G0/G1 can form cilia. Figure from [23].
5
As the centrosome has a variety of roles in the cell, such as cilia formation in interphase cells
and spindle pole organization in mitosis, it requires recruitment and exchange of its protein
composition. Centriolar satellites (CS) are one way of achieving this. CS are small protein
complexes, 70 -100 nm in diameter, dispersed around the centrosome [24, 25]. CS are
believed to function as platforms and storage units that provide the centrosome with
appropriate proteins. The motor protein cytoplasmic dynein 1 transports CS along the minus
end of microtubules towards the centrosome [26]. CS are present in interphase cells, but not
during mitosis. Pericentriolar material 1 (PCM1) was the first discovered CS associated
protein, and it localizes proteins such as Pericentrin and Ninein to the centrosome [27].
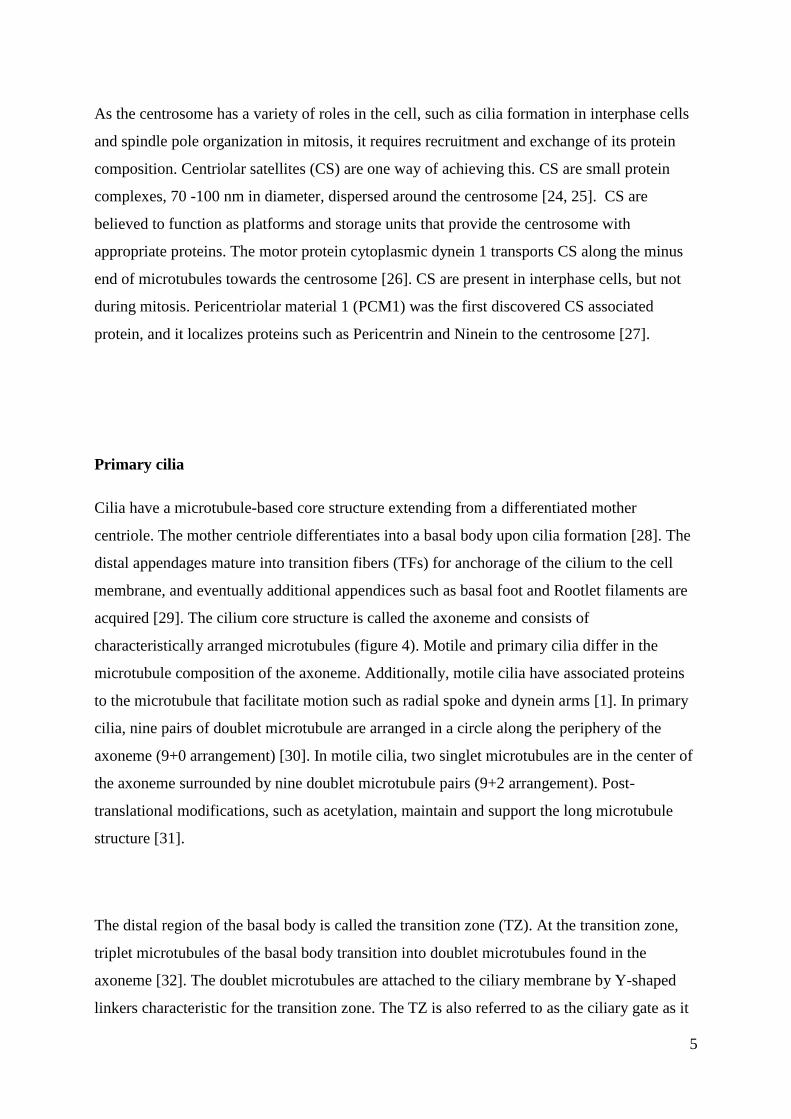
Primary cilia
Cilia have a microtubule-based core structure extending from a differentiated mother
centriole. The mother centriole differentiates into a basal body upon cilia formation [28]. The
distal appendages mature into transition fibers (TFs) for anchorage of the cilium to the cell
membrane, and eventually additional appendices such as basal foot and Rootlet filaments are
acquired [29]. The cilium core structure is called the axoneme and consists of
characteristically arranged microtubules (figure 4). Motile and primary cilia differ in the
microtubule composition of the axoneme. Additionally, motile cilia have associated proteins
to the microtubule that facilitate motion such as radial spoke and dynein arms [1]. In primary
cilia, nine pairs of doublet microtubule are arranged in a circle along the periphery of the
axoneme (9+0 arrangement) [30]. In motile cilia, two singlet microtubules are in the center of
the axoneme surrounded by nine doublet microtubule pairs (9+2 arrangement). Post-
translational modifications, such as acetylation, maintain and support the long microtubule
structure [31].
The distal region of the basal body is called the transition zone (TZ). At the transition zone,
triplet microtubules of the basal body transition into doublet microtubules found in the
axoneme [32]. The doublet microtubules are attached to the ciliary membrane by Y-shaped
linkers characteristic for the transition zone. The TZ is also referred to as the ciliary gate as it
6
controls the protein and lipid composition of the cilium and distinguishes the cilium as a
separate compartment than rest of the cell body. The primary cilium is a specialized sensory
organelle and it implements several signaling pathways that control processes such as
proliferation, tissue homeostasis and embryonic development. The cilia membrane is enriched
with a specific variety of proteins, and its composition is distinct from the cell membrane.
Figure 4. The structure of the primary cilium. The basal body and daughter centriole form
the base of the cilium. The axoneme extends from the basal body. The basal body has two
types of appendages termed transition fibers and subdistal appendages. The transition zone is
formed at the distal region of the basal body. Centriolar satellites are dispersed around the
centrosome. Figure adapted from [33].
7
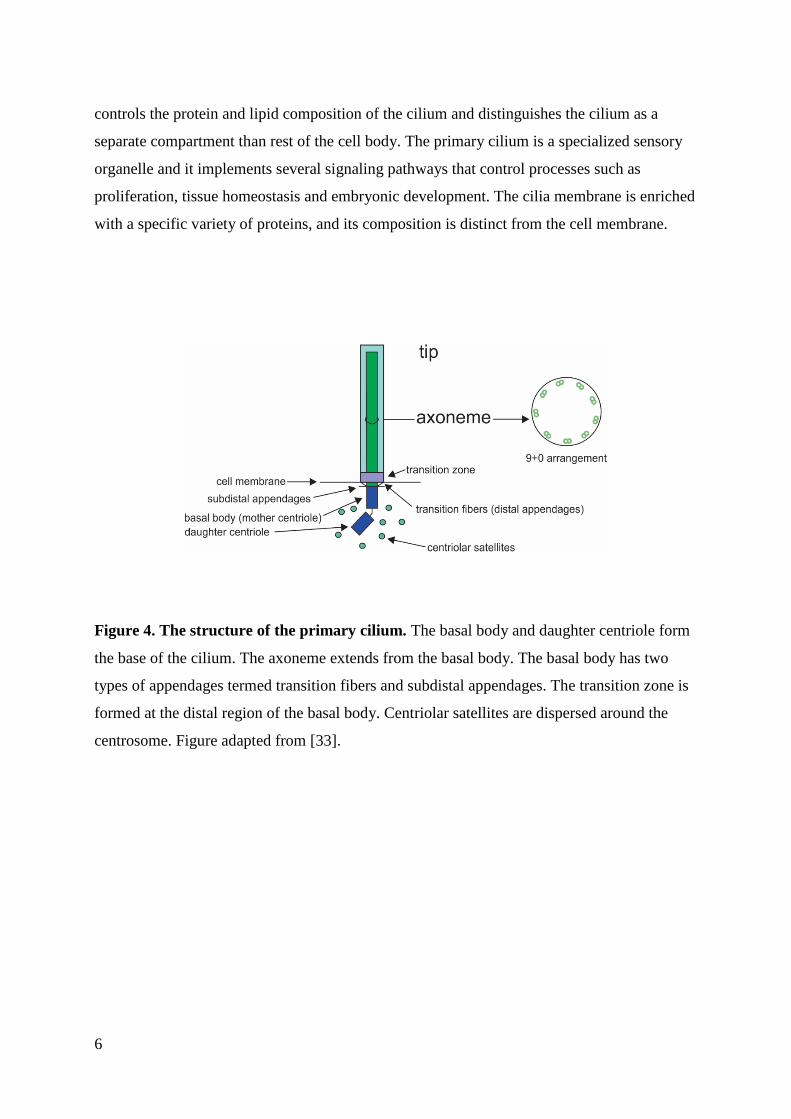
1.1.2 Ciliogenesis
Ciliogenesis, the process of cilia formation, occurs in quiescent cells [2]. Cilia assembly is
initiated during G1 or G0-phase upon mitogen deprivation or differentiation cues. Cilia
disassembly takes place prior to mitosis [34]. Ciliogenesis can be induced in cell lines, such
as hTERT-RPE1, by serum starvation. The process of ciliogenesis is outlines in figure 5. The
mother centriole transforms into its axoneme nucleating shape the basal body. Initiation of
cilia assembly is marked by the accumulation of small cytoplasmic vesicles around the distal
appendages of the mother centriole. These small cytoplasmic vesicles, called distal appendage
vesicles (DAVs), are believed to originate from the Golgi apparatus and recycling endosomes.
The primary ciliary vesicle (PCV), a membranous cap, is formed when DAVs dock and fuse
to the mother centriole (fusion by EHD1 protein). The growing microtubules of the mother
centriole and fusion with additional small vesicles, elongates the PCV. The basal body, with
the growing PCV, is translocated and anchored to the plasma membrane by the transition
fibers. Further elongation and maturation of the cilium occurs by recruitment of axonemal and
membrane proteins. However, different cell types display differences in cilia assembly as
some, for example baso-lateral polarized epithelial cells anchor the basal body to the plasma
membrane prior to axoneme extension.
The GTPase Rab8a is involved in trafficking of vesicles to the mother centriole [35, 36]. In
RPE1 cells, Rab8a decorates cytoplasmic vesicles and the Golgi network. However, upon
serum starvation, Rab8a localizes to the distal appendages of the mother centriole. The PCV
elongates and forms the primary cilium membrane by continuous fusion with Rab8-positive
vesicles [37]. Consequently, Rab8a is often used as a ciliary membrane marker for
fluorescence microscopy, as well as ARL13B. ARL13B is another small GTPase involved in
ciliary trafficking and cilia formation [38, 39].
Two centriolar proteins, CP110 and CEP97, have been implicated in regulation of centriole
length [40]. In non-ciliated cells, CP110 and CEP97 are observed on the distal ends of the
mother and daughter centriole. However, in ciliated cells, CP110 and CEP97 localize only to
the daughter centriole. The axoneme extends from a CP110 and CEP97 liberated mother
centriole. Thereby, indicating that CP110 and CEP97 function as capping proteins that inhibit
ciliogenesis by restricting microtubule extension from the mother centriole. The capping
proteins on the mother centriole are released after phosphorylation by Tau tubulin kinase 2
(TTBK2) [41, 42].
8
The distal appendages are essential for ciliogenesis as they anchor the basal body to the
plasma membrane. Five proteins have been identified in the core structure of DAs (CEP83,
CEP89, SCT1, CEP164 and FBF1) [20]. Loss of distal appendage proteins inhibits anchoring
of the basal body and consequently blocks ciliogenesis [43]. DA proteins have been
implicated in recruitment of Rab8a-decorated small cytoplasmic vesicles for elongation of the
primary ciliary vesicle. Specifically, CEP164 is shown to interact with Rab8a and thereby
mediating docking of vesicles to the DAs [44]. Further, CEP164 recruits TTBK2 [41, 42].
The transition zone is formed after the capping proteins are removed from the basal body. The
cilium is dependent on intraflagellar transport (IFT) for growth and maintenance of the
axoneme[45]. IFT transport cargo from the base and the tip of the cilium travelling along the
axoneme. The transport is direction specific, IFT-B moves along the B tubules and IFT-A
moves along the A tubules [46]. The IFT-B complex associates with the motor protein
Kinesin-2 and transport proteins towards the cilium tip (anterograde), whereas IFT-A
complex associates with Dynein-2 and return proteins to the cell body (retrograde). The
axoneme does not elongate any further after the cilium has matured. However, it relies on a
continuous influx of tubulin due to the dynamic nature of the microtubule core structure.
Further, IFT regulates the import and export of signaling components to the cilium.
Figure 5. Simplified stages of ciliogenesis. In the initial steps of ciliogenesis, TTBK2 is
recruited and CP110/CEP97 are removed from the mother centriole. The primary ciliary
vesicle is formed and subsequently docked to the plasma membrane. Elongation and
maturation of the cilium occurs by recruitment of axonemal and membrane proteins and
results in a matured signaling-competent primary cilium. Figure adapted from [33].
9
1.1.3 Function
Motile cilia are primarily involved in movement of fluids or motility of the cell itself, such as
movement of mucus in airway lining and sperm cells motility, respectively. In contrast,
primary cilia (PC) are specialized environmental sensors which detect and transmit signals to
the cell body. The cilium membrane is enriched with a diverse set of signaling receptors and
thus partakes in a variety of signaling pathways such as Hedgehog (Hh), Wnt and PDGFRα
[47]. The signaling pathways regulate processes such as embryonic development and tissue
homeostasis in adults [48, 49]. Upon stimuli, the corresponding receptor and down-stream
effector molecules are translocated to the cilium, presumably by IFT. The confined
localization of receptors in the cilium allow for specific and efficient pathway activation and
renders the signaling independent of cell surface area [50]. Consequently, smaller and larger
cells will have similar signal transduction. In addition, the PC orients the cell in the tissue,
and the signal detection is orientation dependent [51, 52]. Taken together, the PC structure
and localization renders the organelle a prime fit for its function as a signaling platform, such
as the specialization and compartmentalization conferred by the transition zone through
selective protein trafficking [53].
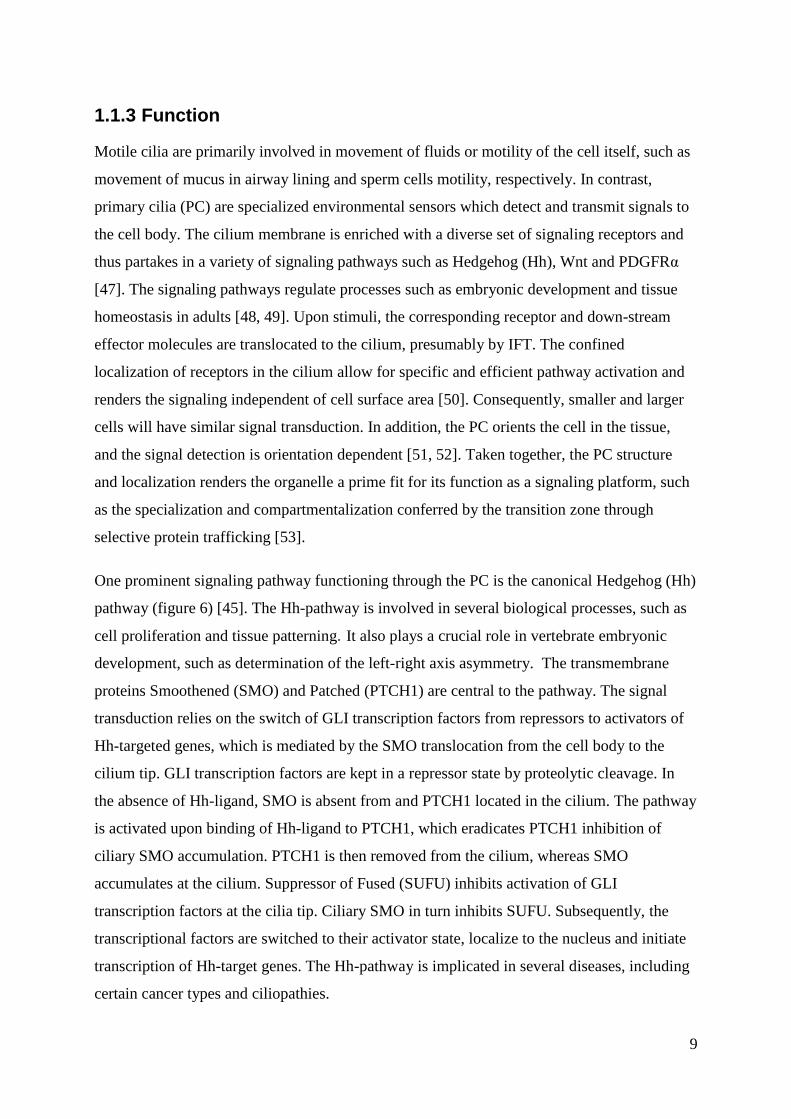
One prominent signaling pathway functioning through the PC is the canonical Hedgehog (Hh)
pathway (figure 6) [45]. The Hh-pathway is involved in several biological processes, such as
cell proliferation and tissue patterning. It also plays a crucial role in vertebrate embryonic
development, such as determination of the left-right axis asymmetry. The transmembrane
proteins Smoothened (SMO) and Patched (PTCH1) are central to the pathway. The signal
transduction relies on the switch of GLI transcription factors from repressors to activators of
Hh-targeted genes, which is mediated by the SMO translocation from the cell body to the
cilium tip. GLI transcription factors are kept in a repressor state by proteolytic cleavage. In
the absence of Hh-ligand, SMO is absent from and PTCH1 located in the cilium. The pathway
is activated upon binding of Hh-ligand to PTCH1, which eradicates PTCH1 inhibition of
ciliary SMO accumulation. PTCH1 is then removed from the cilium, whereas SMO
accumulates at the cilium. Suppressor of Fused (SUFU) inhibits activation of GLI
transcription factors at the cilia tip. Ciliary SMO in turn inhibits SUFU. Subsequently, the
transcriptional factors are switched to their activator state, localize to the nucleus and initiate
transcription of Hh-target genes. The Hh-pathway is implicated in several diseases, including
certain cancer types and ciliopathies.
10
Figure 6. The Hedgehog signaling pathway. In the absence of Hh-stimuli, PTCH1 is located
at the ciliary membrane and SMO to the cell body. Gli activators (GLIA) are inhibited, and Gli
transcription repressors (GLIR) locate to the nucleus where transcription of Hh-target genes
are switched off. Upon initiation of the pathway, Hh-ligand bound PTCH1 is translocated
from the cilium to cytoplasm for lysosomal degradation. Consequently, SMO enters the
cilium and GLIA localize to the nucleus where Hh-target genes are switched on. GLI, PTCH1
and SMO are transported by IFT. Cargo towards the ciliary tip is moved by kinesin 2,
whereas dynein 2 transports cargo towards the cell body. Figure from [29].
11
1.1.4 Ciliopathies
Mutations in ciliary/centrosomal protein encoding genes can cause defect in the structure
and/or function of the primary cilium. Ciliopathies is a collective term for genetic diseases
that arise from defects in the primary cilium. Examples are Bardet-Biedl syndrome (BBS),
Senior-Løken syndrome (SLS) and Joubert syndrome (JBTS) [54]. These diseases affect a
large variety of organs, for example liver, kidneys, eyes and brain, as proper transduction of
cilia mediated signaling pathways is necessary for development and organ differentiation. The
Hh-pathway is a well-known primary cilium mediated pathway found disrupted in
ciliopathies [55].
The primary cilium is also linked to cancer by dysregulation of its mediated signaling
pathways. Medulloblastoma and basal cell carcinoma are two cancer types associated with
constitutive activation of the Hh-pathway that lead to increased cell proliferation [56]. Joubert
syndrome (JBTS) is an autosomal recessive ciliopathy associated with a defective Hh-
signaling pathway. The disease is characterized by malformation of the brain, which is
observed as a “molar tooth sign” by magnetic resonance imaging (MRI) [57]. Among many
other symptoms, the disease manifests in skeleton abnormalities, difficulties in coordinating
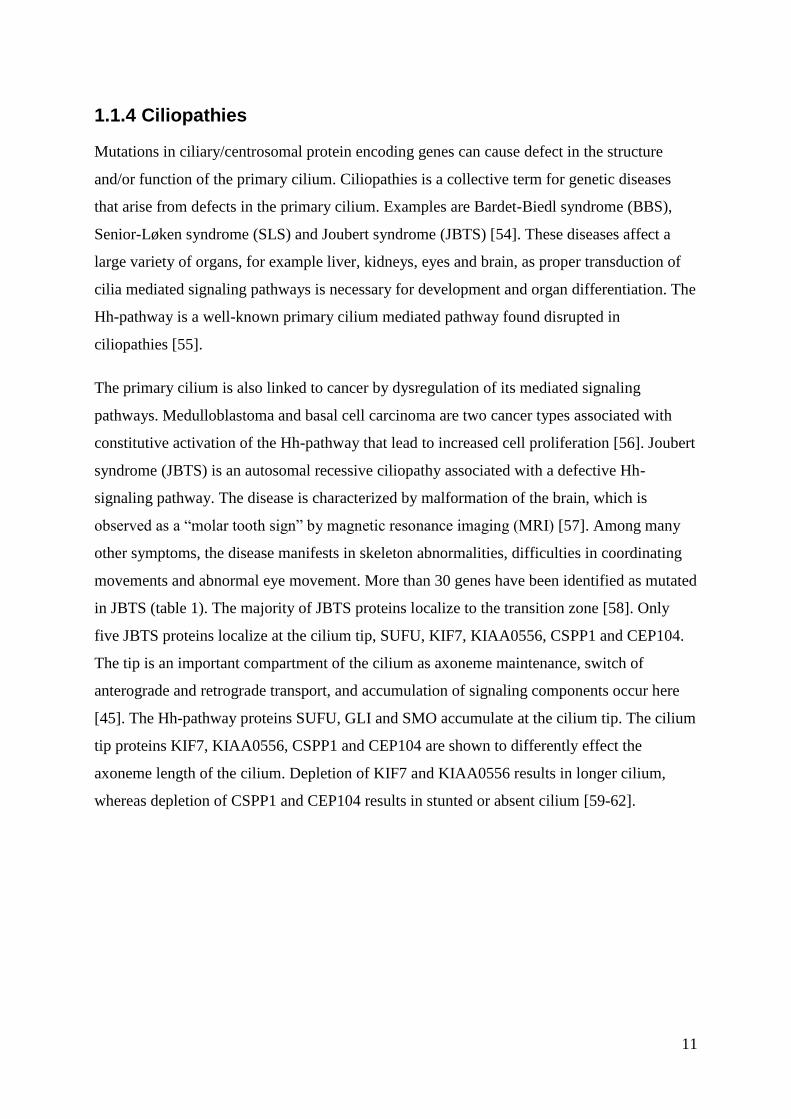
movements and abnormal eye movement. More than 30 genes have been identified as mutated
in JBTS (table 1). The majority of JBTS proteins localize to the transition zone [58]. Only
five JBTS proteins localize at the cilium tip, SUFU, KIF7, KIAA0556, CSPP1 and CEP104.
The tip is an important compartment of the cilium as axoneme maintenance, switch of
anterograde and retrograde transport, and accumulation of signaling components occur here
[45]. The Hh-pathway proteins SUFU, GLI and SMO accumulate at the cilium tip. The cilium
tip proteins KIF7, KIAA0556, CSPP1 and CEP104 are shown to differently effect the
axoneme length of the cilium. Depletion of KIF7 and KIAA0556 results in longer cilium,
whereas depletion of CSPP1 and CEP104 results in stunted or absent cilium [59-62].
12
Table 1. Mutated genes in Joubert-syndrome (OMIM Phenotypic series 213300
http://omim.org/phenotypicSeries/PS213300). The localization of the proteins is implied by
a cross. The majority of the proteins localize to the transition zone, whereas only five proteins
localize to the tip of the cilium (highlighted in green).
13
1.2 Main proteins in the study
CSPP-L and CEP104 are two centrosome and cilia proteins. CSPP-L was linked to Joubert
syndrome (JBTS) by three different studies in 2014, and patient fibroblasts showed reduced
cilia frequency and shortened axoneme [46-48]. The following year, CEP104 was linked to
JBTS upon discovery of mutations in the CEP104 gene in three independent families of a
french-canadian patient cohort [49]. The majority of the more than thirty genes mutated in
JBTS encode proteins that localize to the transition zone (table 1). CSPP-L and CEP104 are
unique in regard to JBTS, as they belong to a small group of five proteins localizing to the
cilia tip. Recently, CEP104 and CSPP-L were identified as interaction partners [38]. It was
shown that the C-terminal domain of CSPP-L interacts/binds to the N-terminal domain of
CEP104. Further, formation of the complex of CSPP-L and CEP104 was shown to be
required for normal axonemal length regulation and for ciliary accumulation of Smoothened
(SMO) receptor in response to Hh-pathway activation.
1.2.1 CSPP-L
Centrosome and Spindle Pole associated Protein 1 (CSPP1) encodes for two known MT
associated protein isoforms, CSPP (26 exons) and CSPP-L (29 exons) [63]. CSPP-L is the
predominantly expressed isoform. Initially, the protein isoforms were observed at the
centrosome and spindle poles but later shown to also localize to the primary cilium in
quiescent cells [63, 64].
CSPP1 proteins have a tripartite structure divided into an N-terminal domain with a bipartite
nuclear localization signal, followed by a proline-rich region, a central domain of three coiled-
coil regions, and a C-terminal domain [64]. CSPP-L diverges from CSPP by having an
extension of 294 amino acids at the N-terminus and an additional 51 amino acids stretch
between the first two coiled-coil regions of the central domain [63]. Both CSPP1 proteins
associate with centrosomes and microtubules. The central domain confers localization to and
stabilization of microtubules, whereas the C-terminal domain targets the proteins to the
centrosome. The function of the N-terminal domain is unknown.
CSPP-L is involved in cell-cycle progression, spindle organization and cytokinesis [63-65]. In
mitotic cells, CSPP-L is observed at the spindle apparatus and at the duplicated centrosomes
in metaphase [63]. In anaphase, CSPP-L is enriched at the midspindle. CSPP-L is observed at
14
the midbody during telophase and cytokinesis. CSPP-L is implicated in cytokinesis by
recruiting myosin GTPase exchange factor (MyoGEF) to the midspindle, and depletion of
CSPP-L is associated with cleavage furrow regression of the dividing cells [65]. The
epithelial cell transforming sequence 2 oncogene (ECT2) is recruited by MyoGEF, which
leads to assembly of myosin contractile ring, furrow ingression and formation of two identical
daughter cells.
In interphase CSPP-L localizes to centriolar satellites and the centrosome in G0/G1. In ciliated
cells, additional localization to the transition zone, axoneme and cilium tip is observed (figure
7) [61]. Knockdown of CSPP-L in RPE1 cells resulted in stunted or absent cilia, implying a
role in ciliogenesis and/or axonemal microtubule stabilization [33, 61]. The transition zone
protein RPGRIP1L (NPHP8/JBTS7) is one of several known CSPP-L interaction partners
[61]. Depletion of CSPP-L lead to decrease in ciliary localization of RPGRIP1L. Thereby,
suggesting recruitment or stabilization of RPGRIP1L at the transition zone by CSPP-L. In
contrast, depletion of RPGRIP1L, alike over-expression of CSPP-L, resulted in elongated
cilia. The opposing effects on cilia length suggested an antagonistic activity of these proteins
[61], but left the intra-ciliary function of CSPP-L unsolved. Recently, the manuscript by
Frikstad et al. identified CEP104 and CSPP-L as interaction partners [33]. As mentioned
above, in that study intra-ciliary interaction of CSPP-L and CEP104 is shown to be required
for axonemal length regulation and ciliary accumulation of Smoothend (SMO) upon
Hedgehog pathway stimulation [33].
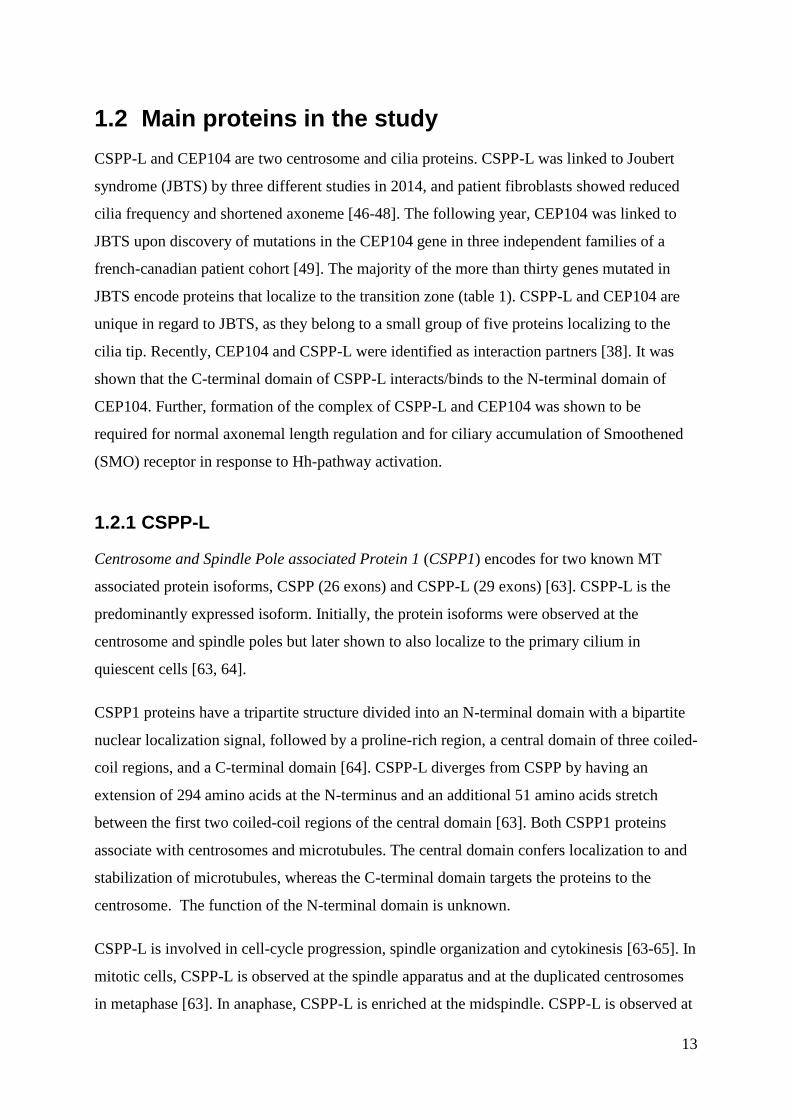
Figure 7. Localization of CSPP-L in ciliated RPE1 cells. Magnified images of two cilia
showing CSPP-L localization to the centrosome, transition zone, axoneme and cilium tip. The
RPE1 cells were stained with the centrosome and axoneme marker acetylated tubulin (red)
and polyclonal antibody against CSPP-L (green). Figure adapted from [61].
15
1.2.2 CEP104
CEP104 (centrosomal protein of 104 kDa) is an evolutionary well conserved centrosome and
cilia associated protein [66]. FAP256, the homolog of CEP104 in Chlamydomonas flagella,
shows the same localization as CEP104 to MT(+) end of the axoneme (flagellum in
Chlamydomonas) [62]. The flagellar tip region shows distinct abnormalities in the FAP256
mutant. For instance, the axonemal microtubules are of different length and the tip structure is
more rounded than the usual cone-shaped bulge. These abnormalities suggest that FAP256 is
important for the structural organization of the flagellar tip. Likewise, CEP104 may have an
important function at the tip structure of mammalian primary cilia.
Initially, co-immunoprecipitation and transient transfections for co-localization analysis,
identified CEP97 and CP110 (the capping complex of the centrioles) as interaction partners of
CEP104 [66]. The capping complex proteins inhibit MT elongation at the distal ends of the
mother and daughter centriole (described in section 1.1.2) [40]. CEP104 bridges CEP97 and
CP110 via binding of its N-terminal domain to CEP97 and its C-terminal domain to CP110.
Upon initiation of cilia formation, CEP104 and the capping complex are released from the
mother centriole but stay localized at the daughter centriole. In contrast to CEP97/CP110,
CEP104 is observed at the tip of the MT axoneme throughout cilia formation, homeostasis
and resorption, though the potentially dynamic behavior of CEP104 at this site is unknown
(figure 8 and [62]). Of note, the localization pattern of CEP104 was initially described by
staining with a mouse polyclonal antibody against CEP104 (figure 7 and [62]). However, the
second production batch by the manufacturer did not stain CEP104 (J Rosenbaum, personal
communication). Unfortunately, no alternative reagent is currently commercially available.
A third interaction partner of CEP104 has also been identified, the kinase NEK1 [67]. NEK1
is believed to be involved in stabilization of the axoneme, as mutated protein or its depletion
lead to structural deformities of the cilium [67]. Structural analysis of CEP104 revealed a
tubulin-binding TOG (tumor overexpressed gene) domain in the central part of the protein
and a zinc finger array in its C-terminal domain [67, 68]. CP110 and NEK1 bind to the zinc
finger array. Alike other proteins with TOG domains, it is speculated whether CEP104
facilitates tubulin addition to microtubule ends for stabilization of microtubules [67]. The
proteins localization pattern (distal end of centrioles and cilium tip) and consequences of
depletion (shortened or absent cilia) are indicative of this speculated function.
16
Most recently, CSPP-L was identified as the first axonemal interaction partner of CEP104
[33]. Depletion of CEP104 in RPE1 cells is manifested in reduced cilia frequency and/or
formation of a shorter cilium [62, 66], phenotypically reminiscent of CSPP1 (CSPP-L)
depletion [61]. Using CRISPR generated CSPP1-/- and hypomorphic CEP104mut RPE1 cell
lines, Frikstad and colleagues showed that CEP104 is dispensable for ciliary localization of
CSPP-L and that co-depletion of CEP104 in CSPP1-/- cells almost completely abolished
axoneme formation. These results suggested that intra-ciliary interaction of CEP104 with
CSPP-L is critical for normal axoneme formation [33]. This hypothesis involves/presumes
CSPP-L independent ciliary localization of CEP104 – which, due to lack IFM compatible
CEP104 antibodies, is challenging to test.
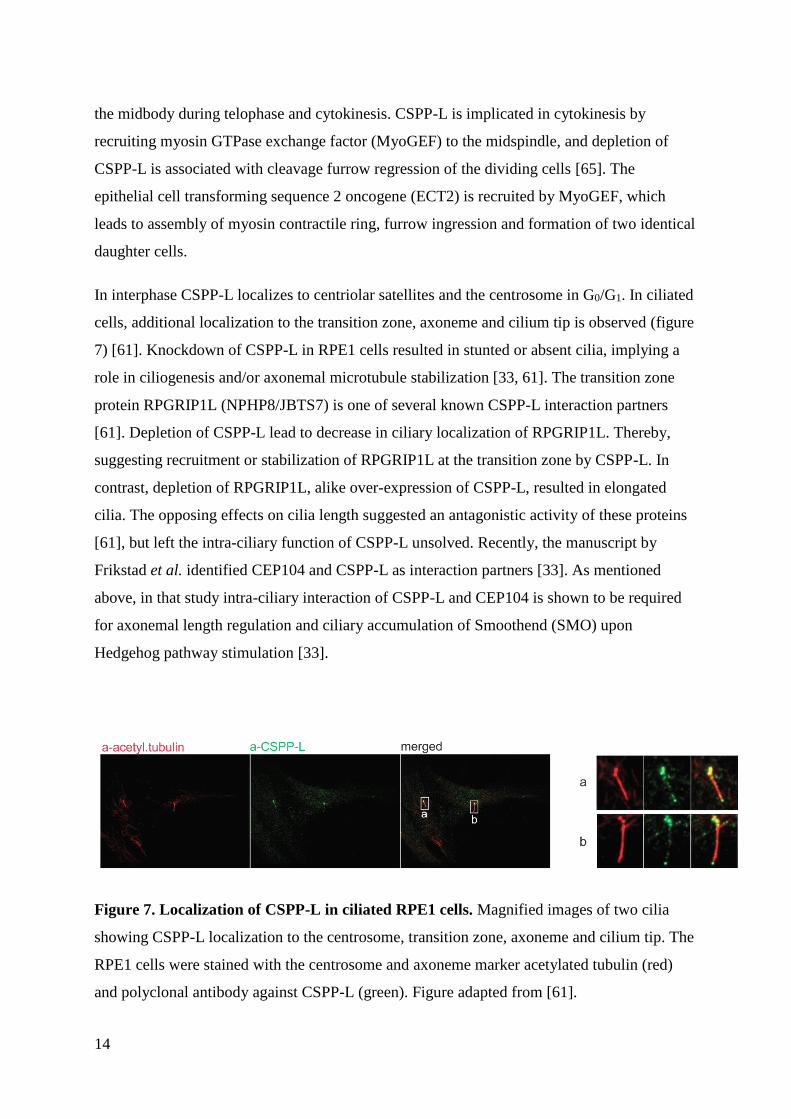
Figure 8. Localization of CEP104 at the primary cilium. CEP104 localizes to the daughter
centriole and to the tip of the cilium. The RPE1 cells were stained with the cilia membrane
marker ARL13B, centrosome marker gamma-tubulin (γ- tubulin) and DNA marker DAPI.
The scale bar is 5 µm. Figure modified from [62].
17
2 Background and aims
2.1 Background of the study
The tip is an important compartment of the primary cilium. Several significant events occur at
this site: proteins involved in signaling pathways are enriched at the tip, anterograde cargo by
IFT-B and retrograde cargo by IFT-A are exchanged, and axonemal microtubule maintenance
occurs [45]. Structural defects of the tip can disrupt the function of the cilium [59]. CSPP-L
and CEP104 are two tip and JBTS proteins, which’s interaction is likely required for cilia
formation and Hh-signaling competence [3-6, 33].
As stated above, to date, CEP104 localization analysis is limited by lack of specific,
commercially available immunofluorescence compatible antibodies. Transient transfection
experiments using fluorescent protein tagged CEP104/CSPP-L fusion protein expression
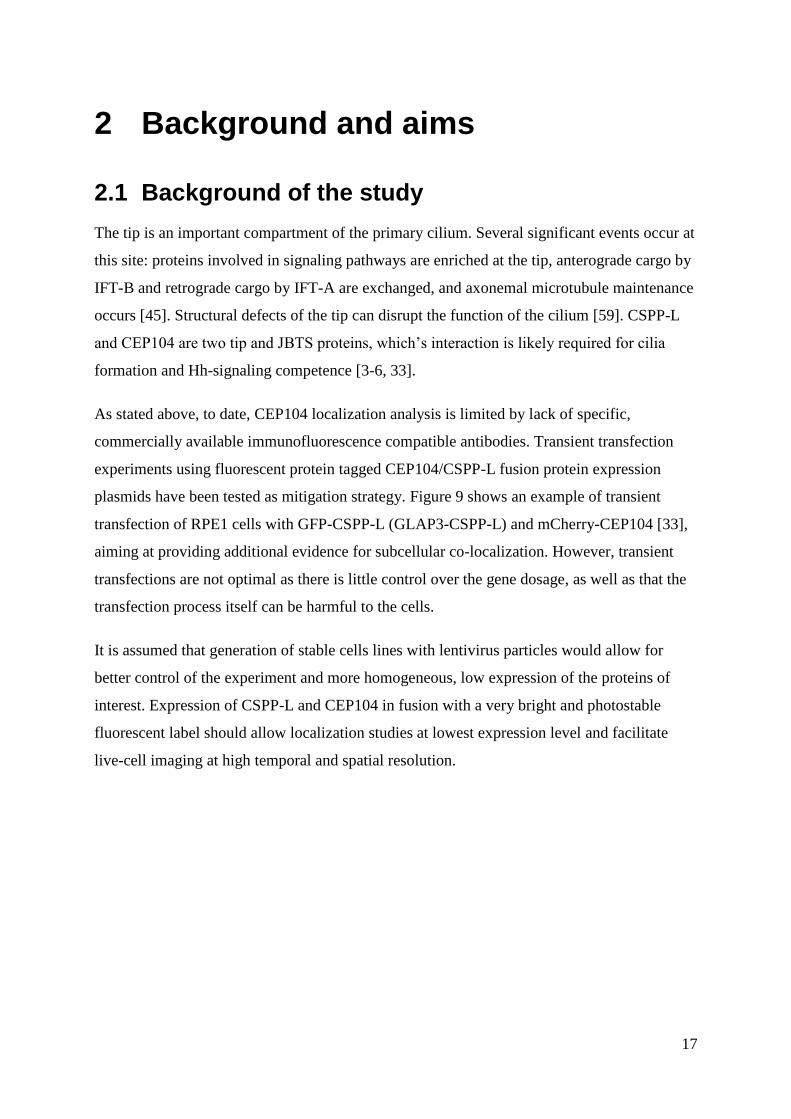
plasmids have been tested as mitigation strategy. Figure 9 shows an example of transient
transfection of RPE1 cells with GFP-CSPP-L (GLAP3-CSPP-L) and mCherry-CEP104 [33],
aiming at providing additional evidence for subcellular co-localization. However, transient
transfections are not optimal as there is little control over the gene dosage, as well as that the
transfection process itself can be harmful to the cells.
It is assumed that generation of stable cells lines with lentivirus particles would allow for
better control of the experiment and more homogeneous, low expression of the proteins of
interest. Expression of CSPP-L and CEP104 in fusion with a very bright and photostable
fluorescent label should allow localization studies at lowest expression level and facilitate
live-cell imaging at high temporal and spatial resolution.
18
Figure 9. Co-localization of GFP-CSPP-L and mCherry-CEP104. RPE1 cells were
transiently transfected with GFP-CSPP-L and mCherry-CEP104. The cells were fixed and
stained with two cilia markers, ARL13B (cilia membrane) and CEP164 (distal appendages on
mother centriole). A) Co-localization of GFP-CSPP-L and mCherry-CEP104 was observed at
the cilium tip. B) Additional co-localization was observed along the axoneme. Figure from
[33].
19
2.2 Aim of the study
The aim of this master project is to generate stable hTERT-RPE1 cell lines with the ciliary tip
proteins CSPP-L and CEP104 labeled with mNeonGreen. The fine-localization of these
ciliary proteins will be investigated by imaging analysis at high temporal and spatial
resolution.
The specific methodological aims are:
1. Design and construction of plasmids, entry vectors and transfer vectors, for lentivirus
particle production
2. Lentivirus particle production and hTERT-RPE1 transduction
3. Characterization of generated cell lines and investigation of fine-localization of the
fusion proteins
20
3 Methods
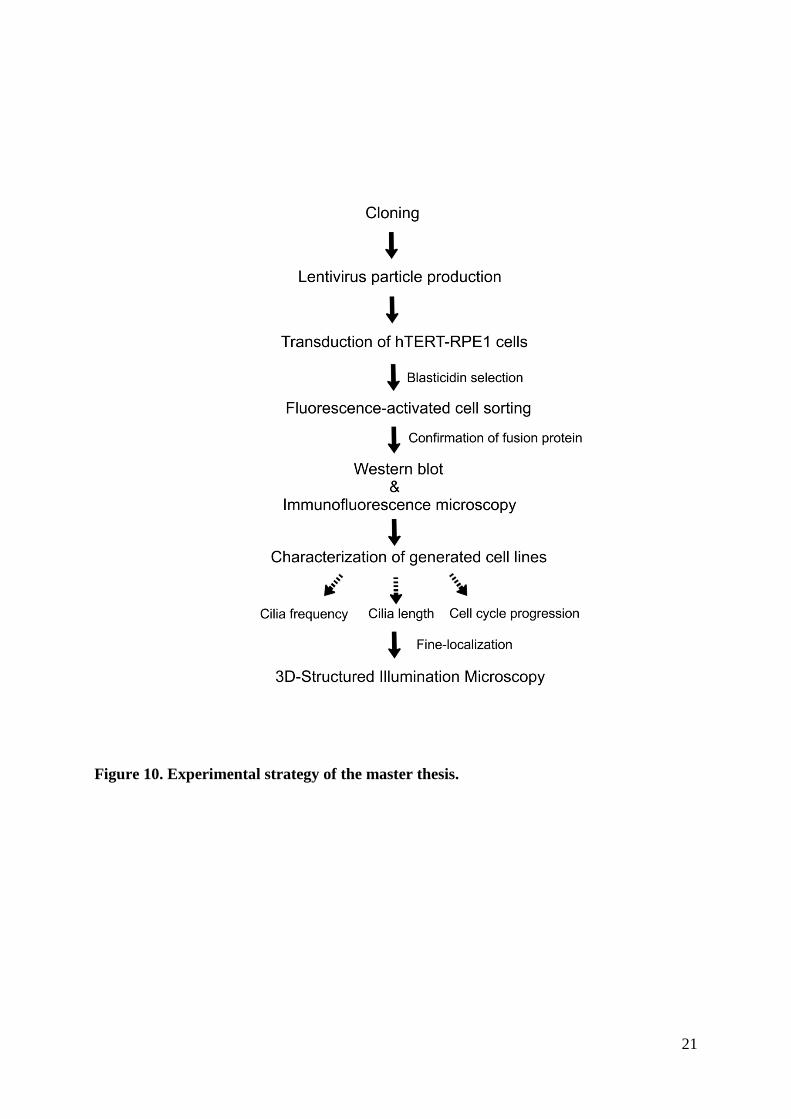
Experimental strategy
The generation of stable RPE1 cell lines expressing mNeonGreen-CSPP-L and mNeonGreen-
CEP104 requires multiple steps in which an open reading frame has to be sub-cloned into a
suitable vector for virus production. The overall strategy is laid out in figure 10. First,
mNeonGreen-CSPP-L and mNeonGreen-CEP104 fusion genes were generated in plasmids
required for lentivirus particle production. mNeonGreen is a monomeric yellow-green
fluorescent protein reported as an outstanding photostable fusion tag [69]. Next, hTERT-
RPE1 cells (hereafter, referred as RPE1 WT cells) were transduced with lentivirus particles,
selected with blasticidin and sorted into distinct populations by fluorescence-activated cell
sorting. Further, the expression and localization of the fusion proteins were assessed by
western blot and immunofluorescence microscopy. Thereafter, consequences of expression of
the fusion proteins was investigated by analysis of cilia formation and cell cycle progression.
Cell cycle progression was examined by flow cytometry, growth curves and live-cell imaging.
Finally, the fine-localization of mNeonGreen-CSPP-L and mNeonGreen-CEP104 was
investigated by 3D-Structured Illumination Microscopy (3D-SIM). All materials, cell lines
and equipment are listed in appendix.
21
Figure 10. Experimental strategy of the master thesis.
22
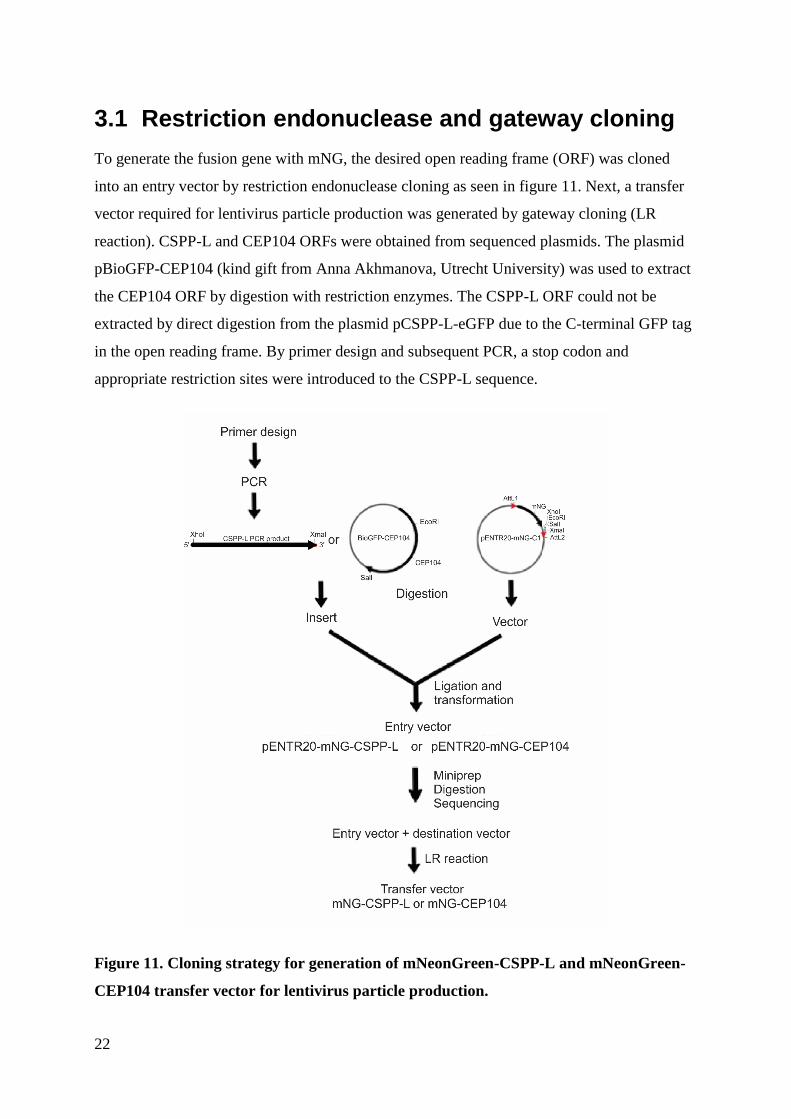
3.1 Restriction endonuclease and gateway cloning
To generate the fusion gene with mNG, the desired open reading frame (ORF) was cloned
into an entry vector by restriction endonuclease cloning as seen in figure 11. Next, a transfer
vector required for lentivirus particle production was generated by gateway cloning (LR
reaction). CSPP-L and CEP104 ORFs were obtained from sequenced plasmids. The plasmid
pBioGFP-CEP104 (kind gift from Anna Akhmanova, Utrecht University) was used to extract
the CEP104 ORF by digestion with restriction enzymes. The CSPP-L ORF could not be
extracted by direct digestion from the plasmid pCSPP-L-eGFP due to the C-terminal GFP tag
in the open reading frame. By primer design and subsequent PCR, a stop codon and
appropriate restriction sites were introduced to the CSPP-L sequence.
Figure 11. Cloning strategy for generation of mNeonGreen-CSPP-L and mNeonGreen-
CEP104 transfer vector for lentivirus particle production.
23
3.1.1 Primer design
Theory
Primers are designed as complementary sequences for amplification of DNA of interest by
Polymerase chain reaction (PCR). The forward primer is complementary to the start of the
gene (5’ → 3’) and the reverse primer is complementary to the end of the gene (3’ → 5’).
Generally, primers are between 18 and 30 nucleotides (nt) long [70]. A sufficient length
ensures specificity to target sequence and decreases the probability of non-specific primer
binding. The melting point (Tm) of the primers is kept within 5°C of each other and the GC
content between 40 and 60 % [71]. This allows for selection of an annealing temperature for
PCR that suits both primers. Primer design provides the opportunity to introduce restriction
sites and stop codon to the gene of interest. To ensure efficient digestion, a couple of
nucleotides are added before the restriction enzyme site at the 5’ end of the primer sequence.
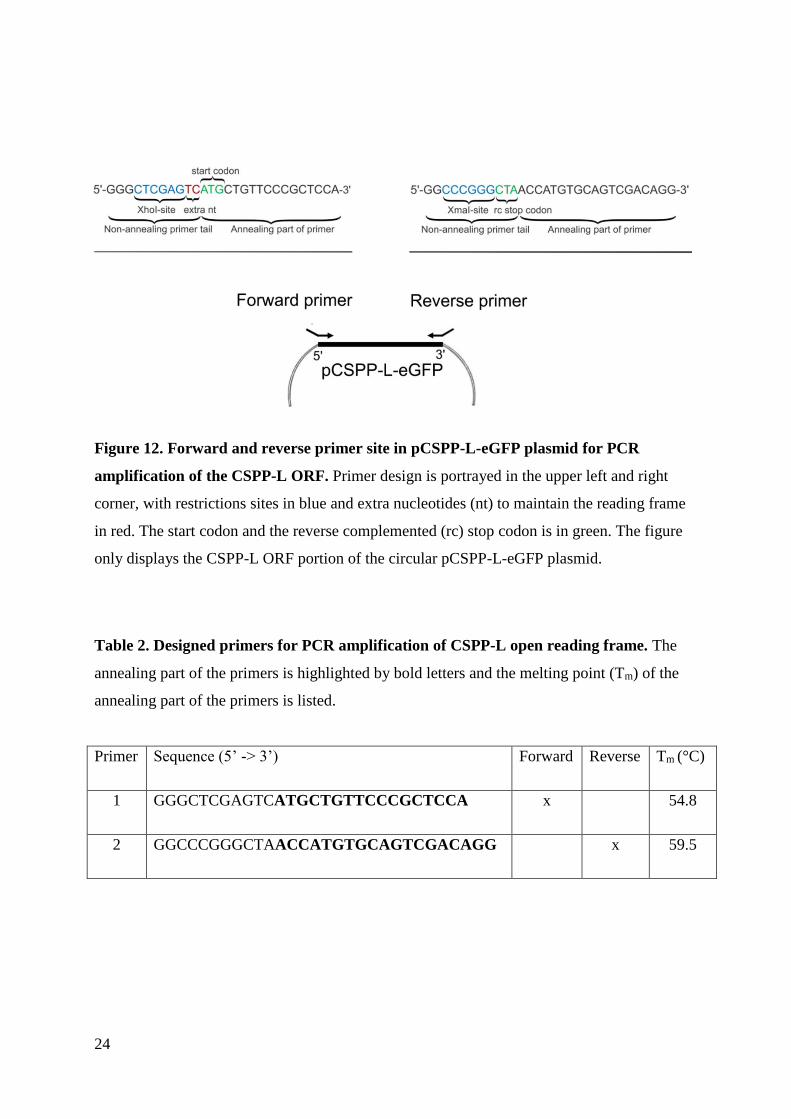
Protocol
Forward and reverse primers were designed using the virtual cloning program SerialCloner
2.6.1. The open reading frame (ORF) corresponding to the CSPP-L gene in the pEGFP-N3-
CSPP-L plasmid was selected. For the forward primer, the first 17 nt from the ORF were
chosen and a restriction site for XhoI (CTC GAG) was introduced. Three guanines were
added 5’ of the restriction enzyme site. Two extra nucleotides of choice (TC) were added after
the restriction site for XhoI to maintain the reading frame after ligation of the CSPP-L ORF
into the pENTR20-mNeonGreen-C1 vector. The reverse primer was designed to be reverse
complement to the sense strand, such that the primer sequence was in 5’ → 3’ direction. For
the reverse primer, the last 19 nt from the ORF were chosen. Two guanines were added to the
5’end followed by a restriction site for XmaI (CCC GGF) and a reverse complement stop
codon (CTA). A virtual PCR was run to test the primers. The primers were ordered through
Eurofins genomics.
24
Figure 12. Forward and reverse primer site in pCSPP-L-eGFP plasmid for PCR
amplification of the CSPP-L ORF. Primer design is portrayed in the upper left and right
corner, with restrictions sites in blue and extra nucleotides (nt) to maintain the reading frame
in red. The start codon and the reverse complemented (rc) stop codon is in green. The figure
only displays the CSPP-L ORF portion of the circular pCSPP-L-eGFP plasmid.
Table 2. Designed primers for PCR amplification of CSPP-L open reading frame. The
annealing part of the primers is highlighted by bold letters and the melting point (Tm) of the
annealing part of the primers is listed.
Primer Sequence (5’ -> 3’) Forward Reverse Tm (°C)
1 GGGCTCGAGTCATGCTGTTCCCGCTCCA x 54.8
2 GGCCCGGGCTAACCATGTGCAGTCGACAGG x 59.5
25
3.1.2 Polymerase chain reaction
Theory
Polymerase chain reaction (PCR) is a DNA amplification method that requires a thermostable
DNA polymerase, deoxynucleotide triphosphates (dNTPs) and a set of reverse and forward
primers [72]. In addition, DNA templates with high GC-content are added dimethylsulfoxide
(DMSO) as it aids in denaturing of GC pairs. The temperature is raised by a thermo cycler
machine to denature the double stranded DNA (dsDNA). Next, the temperature is lowered to
allow annealing of primers to the single stranded DNA (ssDNA). The forward primer anneals
to the anti-sense strand and the reverse primer to the sense strand. The temperature is raised
again allowing thermostable DNA polymerase to generate dsDNA by extending the primer
with addition of dNTPs to the 3’ end of the DNA. There is an exponential amplification of
target DNA, where the copy of the original sequence is doubled during each cycle (2n, where
n is the number of cycles) [73].
Protocol
An initial test reaction was first performed to determine annealing temperature, extension
time and requirement of DMSO for the CSPP-L PCR reaction. Annealing temperature was
determined as 52°C, extension for 90 seconds and DMSO as beneficial for the DNA template.
The Phusion High-Fidelity PCR Kit from ThermoFisher Scientific was used. A 50 µl PCR
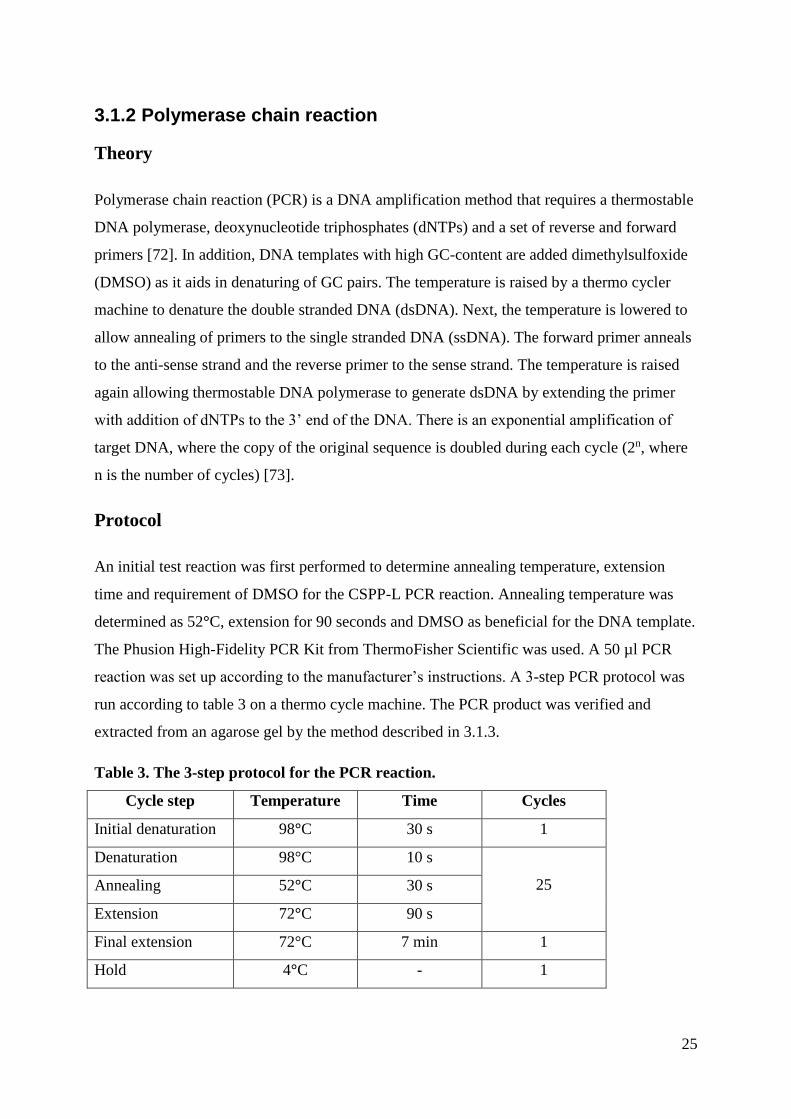
reaction was set up according to the manufacturer’s instructions. A 3-step PCR protocol was
run according to table 3 on a thermo cycle machine. The PCR product was verified and
extracted from an agarose gel by the method described in 3.1.3.
Table 3. The 3-step protocol for the PCR reaction.
Cycle step Temperature Time Cycles
Initial denaturation 98°C 30 s 1
Denaturation 98°C 10 s
25 Annealing 52°C 30 s
Extension 72°C 90 s
Final extension 72°C 7 min 1
Hold 4°C - 1
26
3.1.3 Agarose gel electrophoresis
Theory
Agarose gel electrophoresis is a technique for separation of DNA molecules based on size.
Isolated DNA from methods such as PCR, restriction digestion and miniprep can be base pair
(bp) size verified and/or extracted from an agarose gel. The gel electrophoresis chamber
consists of a negative and positive pole. When an electric current is applied, DNA will
migrate towards the positive pole due to the negative charge on the phosphate group.
Moreover, larger molecules will migrate slower than smaller molecules in the gel, thus
separation is based on size. Migration of the DNA is affected by agarose percentage of the
gel. Low percentage agarose is used for separation of larger fragments, while high percentage
is used for separation of smaller DNA fragments. In addition, DNA conformation affects
migration pattern. Plasmids (circular DNA) will migrate faster than linear DNA due to
supercoiling.
Samples for gel electrophoresis are added a loading buffer with glycerol and dyes. The
density of the sample is increased by addition of glycerol. Consequently, the sample will sink
to the bottom of the well. The loading dye, such as bromophenol blue and/or xylene xylol,
function as trackers for migration distance of the sample during the electrophoresis. Further,
the sample is added a DNA dye which allows the visualization of the DNA by illumination
with UV light.
Protocols
Agarose gel electrophoresis – casting and running the gel
All gels were cast with 1 % agarose percentage as separation was desired of fragments
between 250 bp and 12 kb. Agarose gel was prepared by adding 0.4 agarose to 40 ml 1x TAE
buffer (1 % = 1.0g/100ml). In a microwave, the gel-buffer mixture was brought to the boiling
point, gently mixed and heated again until a uniform solution was obtained. 4 µl of the DNA
dye SybrSafe (1:10 000) was added to the solution when it had cooled down to approximately
50°C. The solution was transferred to a gel mold and a well-comb was added. Bubbles were
removed with a pipette tip. The gel solidified at room temperature for about 45 min. The
comb was gently removed, and the gel was placed in a gel electrophoresis chamber
submerged in 1xTAE buffer. Gel loading dye purple (6x) was added to the sample before
27
loading to the gel. The gel was run at 100 V (constant voltage, variable current) until the
loading dye was seen towards the end of the gel (approximately 30 min). The DNA fragments
were visualized by using a Chemidoc system equipped with a CCD-camera and a UV light
table for excitation of the DNA dye.
Extraction from agarose gel
Thermo Scientific GeneJet Gel Extraction kit was used to extract DNA from agarose gel. The
kit was used according to the manufacture’s instructions.
3.1.4 Restriction digestion
Theory
Restriction enzymes, also called restriction endonucleases, recognize and cleave specific sites
in a nucleotide sequence. Restriction enzymes are frequently used in cloning to generate new
constructs and to verify isolated DNA from methods such as miniprep. A DNA sequence may
have one unique restriction site or several restriction sites for a specific enzyme. Often in
cloning experiments, two restriction enzymes with unique restriction sites are used. The
optimal temperature and buffer requirement is investigated for both enzymes to determine
their compatibility in a reaction. Shrimp alkaline phosphatase (SAP), which dephosphorylates
the 5’ end of DNA and thereby prevent re-ligation of the vector, is optionally added to
digestion reactions.
Protocol
In this thesis, restriction digestion was used to generate a vector fragment from pENTR20-
mNeonGreen-C1 and insert fragments from CSPP-L PCR product and pBioGFP-CEP104 The
CSPP-L PCR product was digested with the enzymes XhoI and XmaI, whereas pBioGFP-
CEP104 was digested with SalI and EcoRI. The pENTR20-mNeonGreen-C1 plasmid was
digested with XhoI/XmaI and SalI/EcoRI, respectively. In addition, digestion with the same
enzymes was used for initial verification of isolated entry vectors from miniprep before
sequencing. Furthermore, digestion was used to verify generated transfer vectors. The mNG-
CSPP-L transfer vector was digested with BsrGI, whereas mNG-CEP104 was digested with
28
NcoI. Selection of restriction enzymes for generation of entry vectors was based on their
quality of harboring one unique restriction site in the vector and none in the insert gene.
Restriction enzymes with multiple restriction sites in the plasmid, including the insert gene,
were selected for digestion of transfer vector.
Restriction digestion was performed based on the New England Biolabs protocol. To a final
reaction volume of 50 µl, 1 µg DNA, 5 µl NEB CutSmart buffer (10x), MQH2O and lastly 1
µl restriction enzymes were added. In addition, 1 µl SAP was added to digestion of the vector
pENTR20-mNeonGreen-C1. The reaction was incubated on a heating block at 37°C for 2
hours. Gel loading dye (6x) was added to the reaction tube and stored at -20°C.
3.1.5 Ligation
Theory
Ligation is catalyzed by a DNA ligase which covalently joins two compatible DNA
fragments. A phosphodiester bond is formed between the 3’-hydroxyl group of one strand and
the 5’-phosphate group of another strand [1]. In cloning procedures, T4 DNA ligase is often
used and it requires ATP for its catalytic function. Ligation reactions are usually designed
with an excess of insert to vector, such as a molar ratio of 5:1 of insert to vector. In this thesis,
ligations were designed according to the practice in the project group of Kay Oliver Schink
(Department of Molecular Cell Biology, Institute of Cancer Research (ICR), Oslo University
Hospital (OUH)) where they use a fixed amount of vector and insert to ensure an excess of
insert to vector. After ligation, the recombinant DNA molecule is amplified by transformation
into bacterial cells.
Protocol
Two µl of vector, 7 µl of insert and 10 µl of 2x Quick ligase buffer was added in an
Eppendorf tube. Lastly, 1 µl of the enzyme Quick ligase was added. The 20 µl ligation
reaction was incubated at room temperature for 15 min and stored at -20°C until further use.
A ligation control reaction was also prepared, where 7 µl mqH2O was added instead of insert.
29
3.1.6 Transformation
Theory
Transformation is the process of introducing plasmids into competent bacteria for
amplification of desired DNA. Bacteria have a short doubling time, for instance E. coli has a
doubling time of 20 min, which allows for rapid amplification of introduced plasmid [74].
Plasmids often have a selective marker such as ampicillin or kanamycin resistance that is
introduced to the transformed bacteria. Thereby, allowing growth of only transformed
bacteria in a medium with selected antibiotic. Subsequently, the plasmids are isolated by
lysing the bacterial cells in a process called miniprep.
Protocol
Transformation procedure was done on ice. Zymo 10B E.coli cells were brought from -80°C
and thawed on ice. 50 µl of bacteria solution was transferred to an Eppendorf tube, and 4 µl of
ligation mix or plasmid of choice was added. The solution was gently mixed by flicking the
tube. The tube was incubated on ice for 15-30 min. The cells were heat-shocked on a heating
block at 42°C for 60 sec and placed on ice right after for 2 min. 1 ml room tempered Luria-
Bertani (LB) growth medium was added to the tube. The tube was incubated at 37°C in a
shaking incubator with 225 rotations per minute (rpm) for 1 hour. Thereafter, the sample was
centrifuged for 2 min at 5000 rpm. The bacterial pellet was resuspended in 100 µl of the
supernatant, while the remaining supernatant was discarded. The transformed bacteria were
plated on agarose petri dishes containing selection corresponding to the plasmid of choice
(kanamycin or ampicillin). The petri dishes were incubated overnight at 37°C.
Colonies were picked and used to inoculate individual 15 ml conical tubes with 2 ml LB
medium and 2 µl selected antibiotic (kanamycin or ampicillin 1:1000). The inoculated tubes
were incubated overnight in a shaking water bath at 225 rpm and 37°C in preparation for
isolation of plasmid by miniprep. However, for midiprep, the overnight culture was expanded
from 2 ml solution to 2x25 ml in 250 ml baffled-based Erlenmeyer flasks. The 2 ml LB
medium was inoculated and incubated for about 6 hours, after which 1 ml bacteria solution
was transferred to each 250 ml Erlenmeyer flask with 24 ml LB medium and 24 µl antibiotic.
The Erlenmeyer flasks were incubated overnight in a shaking water bath at 225 rpm and
37°C.
30
3.1.7 Miniprep and midiprep
Theory
Miniprep and midiprep are methods to isolate and purify plasmid DNA from bacteria.
Midiprep requires a larger volume of bacterial culture than miniprep, and thus result in a
higher yield of plasmid DNA. The basic principle includes alkaline lysation of bacterial cells
to extract and denature plasmid and chromosomal DNA [75]. Further, a neutralization step
renatures plasmid DNA. The solution is centrifuged to acquire the plasmid DNA in the
supernatant and chromosomal DNA in the pellet. Moreover, purification of the plasmid DNA
is achieved by application of the supernatant to a spin column. The column is washed to
remove any contaminations, and finally plasmid DNA is eluted.
Protocol
The Macherey-Nagel miniprep kit and the Zymo research midiprep kit was used for isolation
of plasmid DNA. The kits were used according to the manufacturer’s instructions. The high-
copy plasmid DNA protocol was used for the miniprep kit, and the centrifugation protocol
was used for the midiprep kit.
Concentration and purification of isolated DNA plasmid was determined by using a Thermo
Scientific NanodropTM 2000 Spectrophotometer. The instrument was used following the
manufacturer’s instructions.
3.1.8 Sanger sequencing
Theory
Sanger sequencing, also called dideoxy sequencing, is a widespread sequencing method. It
utilizes DNA polymerase, deoxynucleoside triphosphates (dNTPs) and dideoxyribonucleoside
triphosphate (ddNTP) which lack the 3’ hydroxyl group [76]. When ddNTP is incorporated
into the sequence by a DNA polymerase, the reaction is terminated because further extension
is impossible. Electrophoresis is used to separate generated DNA fragments by loading the
sequencing reaction on a thin capillary gel. Each type of ddNTP is tagged with a different
fluorescent label (four different colors for the four bases). Registration of the colors that
correspond to a specific nucleotide allows merging of the DNA fragments to a final sequence.
31
Protocol
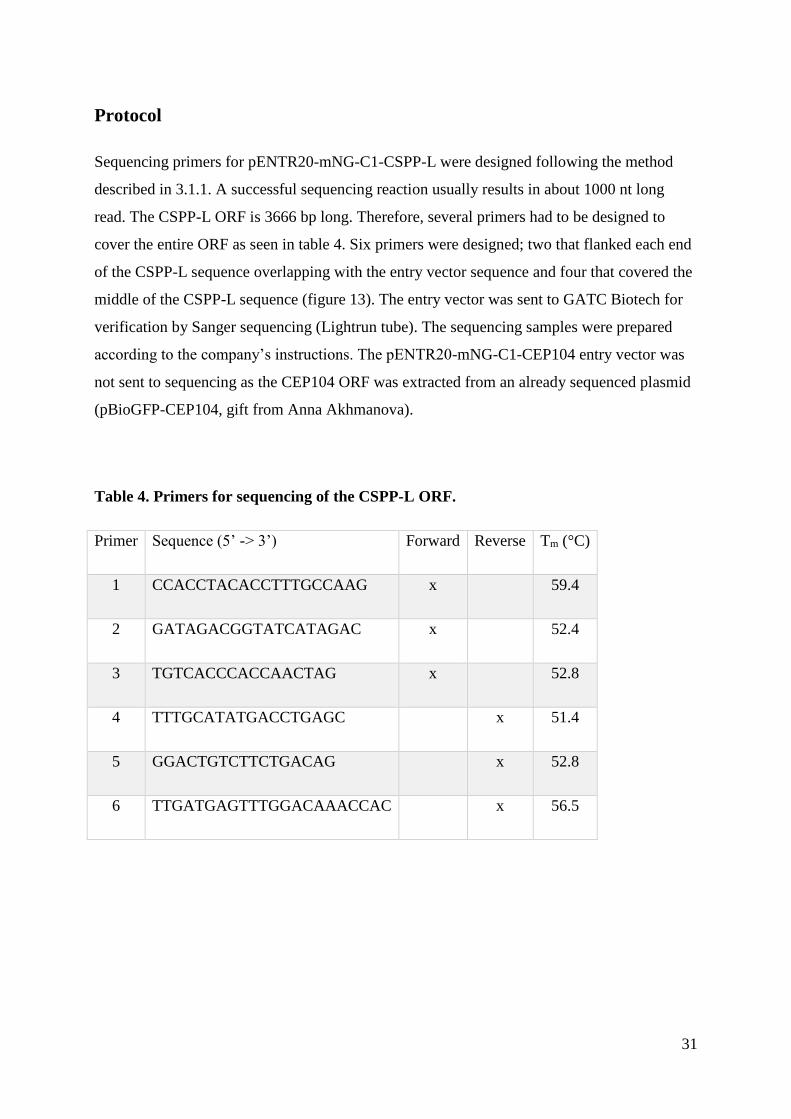
Sequencing primers for pENTR20-mNG-C1-CSPP-L were designed following the method
described in 3.1.1. A successful sequencing reaction usually results in about 1000 nt long
read. The CSPP-L ORF is 3666 bp long. Therefore, several primers had to be designed to
cover the entire ORF as seen in table 4. Six primers were designed; two that flanked each end
of the CSPP-L sequence overlapping with the entry vector sequence and four that covered the
middle of the CSPP-L sequence (figure 13). The entry vector was sent to GATC Biotech for
verification by Sanger sequencing (Lightrun tube). The sequencing samples were prepared
according to the company’s instructions. The pENTR20-mNG-C1-CEP104 entry vector was
not sent to sequencing as the CEP104 ORF was extracted from an already sequenced plasmid
(pBioGFP-CEP104, gift from Anna Akhmanova).
Table 4. Primers for sequencing of the CSPP-L ORF.
Primer Sequence (5’ -> 3’) Forward Reverse Tm (°C)
1 CCACCTACACCTTTGCCAAG x 59.4
2 GATAGACGGTATCATAGAC x 52.4
3 TGTCACCCACCAACTAG x 52.8
4 TTTGCATATGACCTGAGC x 51.4
5 GGACTGTCTTCTGACAG x 52.8
6 TTGATGAGTTTGGACAAACCAC x 56.5
32
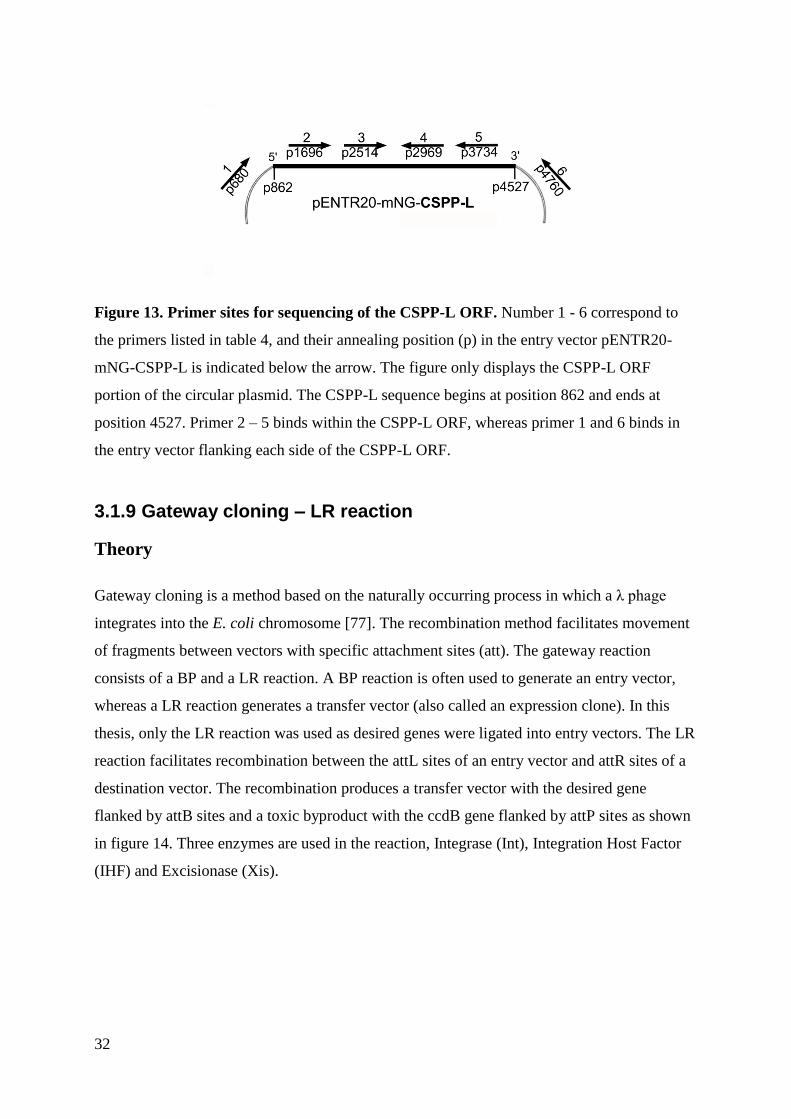
Figure 13. Primer sites for sequencing of the CSPP-L ORF. Number 1 - 6 correspond to
the primers listed in table 4, and their annealing position (p) in the entry vector pENTR20-
mNG-CSPP-L is indicated below the arrow. The figure only displays the CSPP-L ORF
portion of the circular plasmid. The CSPP-L sequence begins at position 862 and ends at
position 4527. Primer 2 – 5 binds within the CSPP-L ORF, whereas primer 1 and 6 binds in
the entry vector flanking each side of the CSPP-L ORF.
3.1.9 Gateway cloning – LR reaction
Theory
Gateway cloning is a method based on the naturally occurring process in which a λ phage
integrates into the E. coli chromosome [77]. The recombination method facilitates movement
of fragments between vectors with specific attachment sites (att). The gateway reaction
consists of a BP and a LR reaction. A BP reaction is often used to generate an entry vector,
whereas a LR reaction generates a transfer vector (also called an expression clone). In this
thesis, only the LR reaction was used as desired genes were ligated into entry vectors. The LR
reaction facilitates recombination between the attL sites of an entry vector and attR sites of a
destination vector. The recombination produces a transfer vector with the desired gene
flanked by attB sites and a toxic byproduct with the ccdB gene flanked by attP sites as shown
in figure 14. Three enzymes are used in the reaction, Integrase (Int), Integration Host Factor
(IHF) and Excisionase (Xis).
33
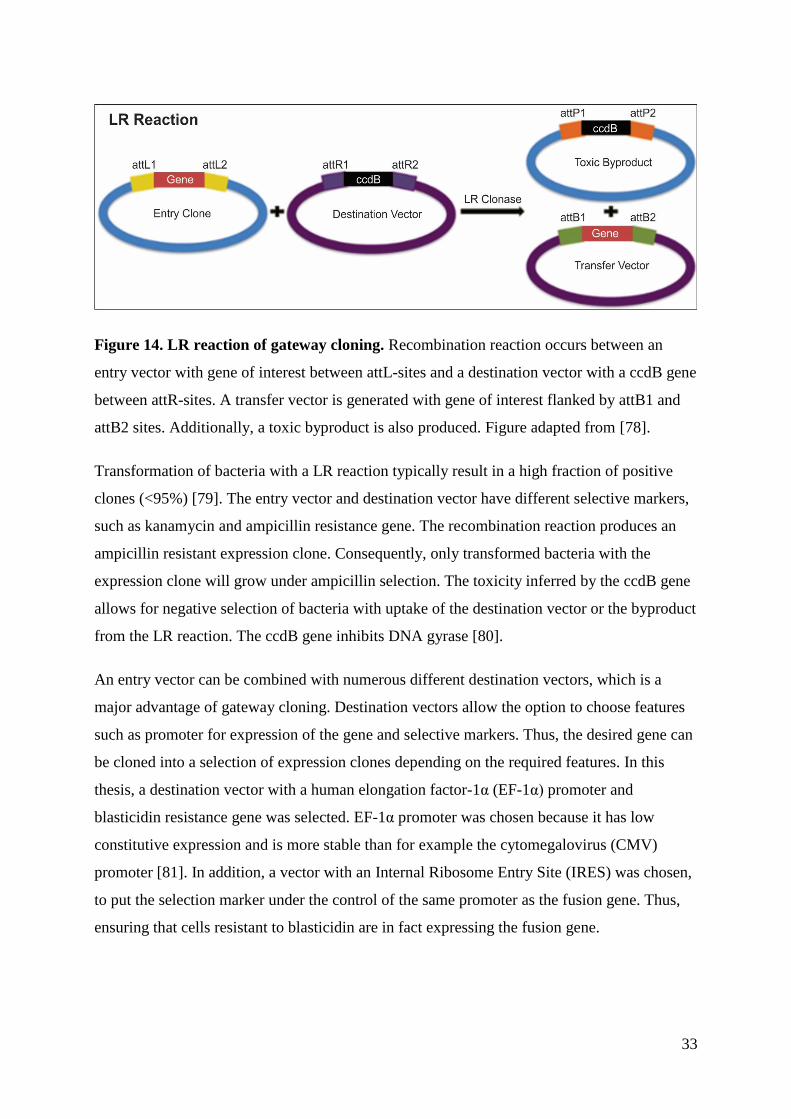
Figure 14. LR reaction of gateway cloning. Recombination reaction occurs between an
entry vector with gene of interest between attL-sites and a destination vector with a ccdB gene
between attR-sites. A transfer vector is generated with gene of interest flanked by attB1 and
attB2 sites. Additionally, a toxic byproduct is also produced. Figure adapted from [78].
Transformation of bacteria with a LR reaction typically result in a high fraction of positive
clones (<95%) [79]. The entry vector and destination vector have different selective markers,
such as kanamycin and ampicillin resistance gene. The recombination reaction produces an
ampicillin resistant expression clone. Consequently, only transformed bacteria with the
expression clone will grow under ampicillin selection. The toxicity inferred by the ccdB gene
allows for negative selection of bacteria with uptake of the destination vector or the byproduct
from the LR reaction. The ccdB gene inhibits DNA gyrase [80].
An entry vector can be combined with numerous different destination vectors, which is a
major advantage of gateway cloning. Destination vectors allow the option to choose features
such as promoter for expression of the gene and selective markers. Thus, the desired gene can
be cloned into a selection of expression clones depending on the required features. In this
thesis, a destination vector with a human elongation factor-1α (EF-1α) promoter and
blasticidin resistance gene was selected. EF-1α promoter was chosen because it has low
constitutive expression and is more stable than for example the cytomegalovirus (CMV)
promoter [81]. In addition, a vector with an Internal Ribosome Entry Site (IRES) was chosen,
to put the selection marker under the control of the same promoter as the fusion gene. Thus,
ensuring that cells resistant to blasticidin are in fact expressing the fusion gene.
34
Protocol
LR reaction was performed with the destination vector pCDH-EF1α-GW-IRES-BLAST and
the entry vector pENTR20-mNeonGreen-C1-CSPP-L or pENTR20-mNeonGreen-C1-
CEP104. The Invitrogen™ Gateway™ LR Clonase™ Enzyme Mix was used according to the
manufacturer’s instructions. However, the reaction was incubated at room temperature for 3-4
hours. Furthermore, addition of Proteinase K was omitted and the LR reaction was instead
terminated by storage at -20°C. Transformation of Zymo 10B E.coli with LR reaction was
done according to the method described in 3.1.6, but the petri dishes were instead incubated
overnight at 31°C.
3.2 Cell culture
Theory
Cell lines are grown and maintained in vitro by cell culturing. Growth medium requirement,
culturing conditions and degree of adherence to the growth surface vary between cell lines.
Consequently, the cell culture method differs between cell lines. Cultured cells are added
growth medium with fetal bovine serum (FBS) and antibiotics [82]. FBS supplies the cells
with growth factors, and antibiotics protects against infections. To prevent growth inhibition
due to nutrient depletion and/or contact inhibition, a portion of cells is transferred to fresh
medium in a process called subculturing or passaging. Adherent cells are tightly attached to
the growth surface, and detachment is facilitated by the protease trypsin. Prolonged
incubation with trypsin damages the cells by continuous degradation of cell surface proteins.
Trypsination is inhibited by α1-antitrypsin which is found in the FBS complemented growth
medium [83].
35
Protocol
In this study, experiments were done using the hTERT-RPE1 cell line, which are
immortalized pigmented epithelial cells from the retina of the eye. All work with the cell line
was performed in an aseptic LAF bench. Cells were cultured in Dulbecco’s Modified Eagle
Medium: Nutrient mixture F-12 (DMEM/F12) supplemented with 10 % FBS and 1 %
Penicillin/Streptomycin (P/S). In addition, the growth medium for transduced cell lines with
mNG-CSPP-L and mNG-CEP104 were added blasticidin (1:1000). Cells were grown in
vented tissue culture flasks (75cm2) and kept in a humidified incubator at 37°C with 5 % CO2.
The cells were subcultured when the confluency was estimated to be 80 % by examination
with a microscope. Old growth medium was removed, and the cells were washed with 10 ml
Dulbecco’s phosphate buffered saline (PBS). Further, 1.5 ml trypsin-EDTA was added and
the cells were incubated at 37°C for 5 min or until the cells were loose. Cells were re-
suspended in 8.5 ml DMEM/F12 with FBS and P/S (and also blasticidin for transduced cell
lines). A fraction of the cell suspension was transferred to a new flask and kept in the
incubator.
LentiX is a cell line derived from human embryonic kidney cells. It was used for production
of lentivirus particles. The cells were grown and maintained by the same method as for RPE1
cells. However, Dulbecco’s Modified Eagles Medium (DMEM) was used instead of
DMEM/F12. The cells were attached loosely to the tissue culture flask, and detachment was
achieved by flushing with 10 ml fresh medium instead trypsination.
Cells were seeded for experiments by the same method as subculturing. However, after re-
suspension of cells with growth medium, the cell concentration was measured using a
CoulterCounter (Beckman Coulter Z2). A particle radius of 8-24 µm was used for counting
cells on the machine. Thus, cells could be diluted to achieve desired concentration for the
experiment.
36
3.3 Lentivirus particle production and hTERT-RPE1
transduction
Theory
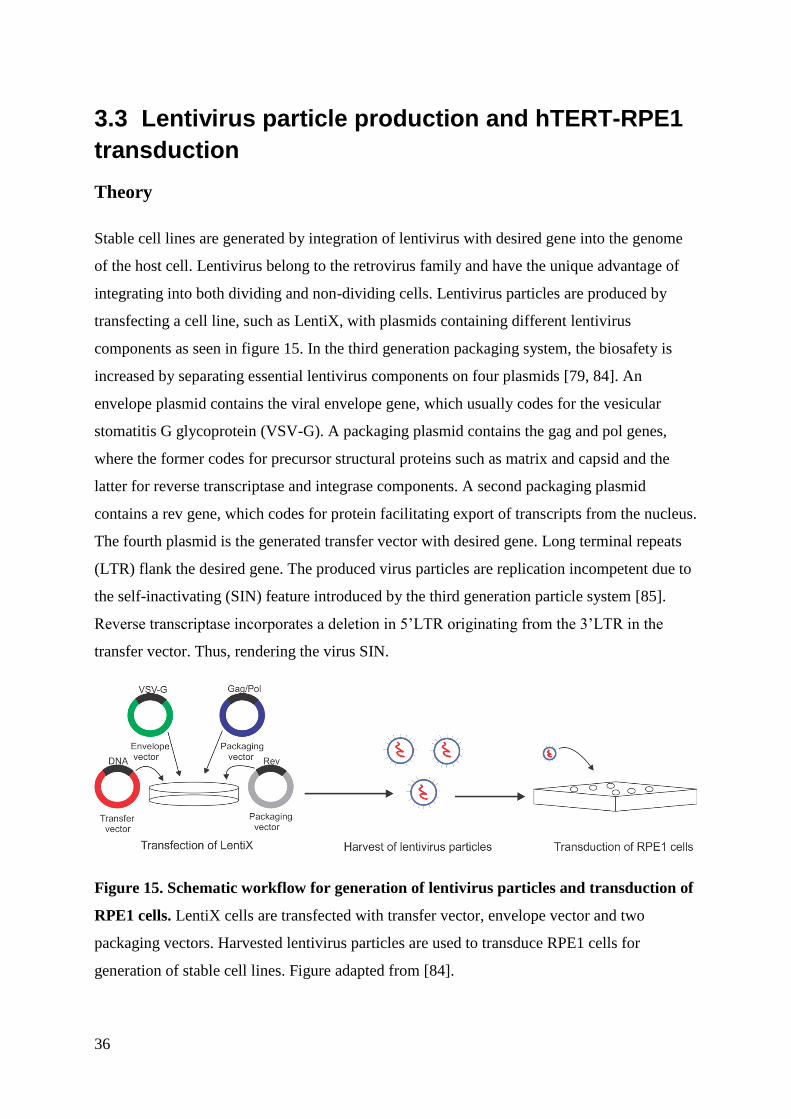
Stable cell lines are generated by integration of lentivirus with desired gene into the genome
of the host cell. Lentivirus belong to the retrovirus family and have the unique advantage of
integrating into both dividing and non-dividing cells. Lentivirus particles are produced by
transfecting a cell line, such as LentiX, with plasmids containing different lentivirus
components as seen in figure 15. In the third generation packaging system, the biosafety is
increased by separating essential lentivirus components on four plasmids [79, 84]. An
envelope plasmid contains the viral envelope gene, which usually codes for the vesicular
stomatitis G glycoprotein (VSV-G). A packaging plasmid contains the gag and pol genes,
where the former codes for precursor structural proteins such as matrix and capsid and the
latter for reverse transcriptase and integrase components. A second packaging plasmid
contains a rev gene, which codes for protein facilitating export of transcripts from the nucleus.
The fourth plasmid is the generated transfer vector with desired gene. Long terminal repeats
(LTR) flank the desired gene. The produced virus particles are replication incompetent due to
the self-inactivating (SIN) feature introduced by the third generation particle system [85].
Reverse transcriptase incorporates a deletion in 5’LTR originating from the 3’LTR in the
transfer vector. Thus, rendering the virus SIN.
Figure 15. Schematic workflow for generation of lentivirus particles and transduction of
RPE1 cells. LentiX cells are transfected with transfer vector, envelope vector and two
packaging vectors. Harvested lentivirus particles are used to transduce RPE1 cells for
generation of stable cell lines. Figure adapted from [84].
37
Protocol
Production of lentivirus particles
On the first day of lentivirus particle production, a 10 cm dish was coated with 2 ml poly-L-
lysine and incubated at room temperature for 5 min. The poly-L-lysine was removed, and the
dish was air-dried in the LAF bench for 2 hours. 5x10⁶ LentiX cells were seeded in
DMEM/F12 growth medium complemented with FBS and PS. All work after seeding of
LentiX was done in a BSL-2 virus lab. On the second day, 15 µg of transfer vector, 15 µg
pMDLg/pRRE (packaging plasmid with gag and pol), 6 µg pRSV-Rev (packaging plasmid
with rev) and 3 µg of pMD2.G (envelope plasmid with VSV-G) were mixed in 600 µl OPTI-
MEM growth medium in a 1.5 ml Eppendorf tube. In another Eppendorf tube, 50 µl
Lipofectamine 3000 and 50 µl p3000 reagent were mixed in 600 µl OPTI-MEM growth
medium. The lentivirus plasmids and lipofectamine solutions were mixed and incubated for
25 min at room temperature. The DNA-liposome complex was drop-wise added to the LentiX
cells. The transfected cells were incubated overnight at 37°C with 5 % CO2. On the third day,
the old medium was removed from the dish, added 10 % chlorine and discarded in the risk
waste. 10 ml fresh DMEM/F12 complemented with FBS and PS was added to the transfected
cells, and the dish was incubated at 37°C with 5 % CO2 for 48 hours. On the fifth day, 72
hours post-transfection, the medium with lentivirus particles were collected in a syringe. The
syringe was attached to a 0.45 µm filter. The medium was gently pushed through the filter and
into a 50 ml conical tube. The tube was wiped clean with 10 % chlorine and placed in 4°C for
short-term storage. All equipment used for virus production was submerged in Virkon before
being discarded in the risk waste. When working with virus, it is important to properly discard
equipment and clean the work space for protection against potential contamination.
Transduction of RPE1 cells
In a 6-well plate, 100 000 RPE1 cells were seeded into each well. The second day, the 6-well
plate was transferred from the general cell lab to the virus lab. Well 1 to 5 were added the
following amount of virus containing medium: 50 µl, 10 µl, 200 µl and 500 µl. The last well
with cells was a control without virus added. Ideally, cells are transduced with one virus
particle per cell to achieve only a single integration event. Therefore, several virus particle
38
concentrations were used, where the well with lowest virus concentration was assumed to
have one integration event. The cells were incubated at 37°C with 5 % CO2 for 48 hours. On
the fourth day, the medium was removed, and the cells were washed with 2 ml PBS. 0.5 ml
trypsin was added to each well and incubated at 37°C until the cells were loose. 2 ml
DMEM/F12 with FBS, PBS and blasticidin (1:1000) was added to each well. The cell
solution from each well was transferred to a corresponding culture flask (75cm2) with 8 ml
DMEM/F12 with FBS, PBS and blasticidin. The cells were incubated at 37°C with 5 % CO2
until subculturing was required.
Transduced cell lines were observed regularly to investigate cell death due to the blasticidin
selection. The medium was also changed after two days, even if the cells were not confluent,
to maintain the blasticidin selection pressure. The cells were kept at the virus lab for five
passages, to ensure that there were no virus particles left, before they were brought down to
the cell lab.
3.4 Flow cytometry and cell cycle analysis
Theory
Flow cytometry is a laser-based technology used to measure cell properties by analysis of
light scattering and emitted fluorescence light [86]. Cells are applied to a flow cytometer,
suspended in a fluid sheath (such as PBS) and passed through a laser light beam as single
cells. When cells are hit by a laser, the reflected light will scatter in different directions.
Forward scatter is mostly determined by cell size, whereas side scatter is a rough measure of
granularity of the cell. Samples can be stained with fluorochromes, such as the DNA marker
Hoechst 33258 or the mitotic marker anti-phospho-histone-H3 [87, 88]. These stains are used
to analyze cell cycle distribution and quantify mitotic cells. Fluorescence-activated cell
sorting (FACS) is a flow technique which allows the separation of cells by imposing different
electric charges to single cell comprising droplets that are generated once the cell has passed
the detector. Subsequently, the cells can be sorted into separate containers based on
fluorescent properties and/or light scatter.
39
Protocol
Cell cycle progression was investigated by flow cytometry, generating growth curves and by
live-cell imaging (described in 3.7). Growth curves were used to calculate the doubling time
of the generated cell lines. The method was used as complementary to cell cycle distribution
analysis by flow cytometry. The cell cycle distribution can be similar for two cell lines with
completely different doubling time. Therefore, assessing the doubling time in addition to flow
analysis is necessary.
In this thesis, flow cytometry was used to analyze the cell cycle distribution of the generated
cell lines compared to the RPE1 WT cell line in both asynchronous and serum starved cells.
For this purpose, the cells were stained with Hoechst which intercalates into minor groove of
the DNA. The DNA content of the cell varies throughout the cell cycle. In G1/G0 the cells are
diploid (2n) and in G2/M the cells are tetraploid (4n) as DNA is copied in the S phase. Thus,
the cell cycle distribution can be analyzed by flow cytometry after staining with a DNA-
specific dye. M phase cells were distinguished from G2 cells by staining with anti-phospho-
histone-H3. Samples were analyzed by a BD LSR II flow cytometer with assistance from
Kari-Anne Myrum Frikstad (Department of Radiation Biology, ICR, OUH). The cell cycle
distribution was analyzed by using the software FlowJo version 7.6.5 and version 10.
FACS was performed to separate generated RPE1 WT mNG-CSPP-L and mNG-CEP104 cell
lines into low, medium and high subpopulations based on the mNG expression level. The
initial observation by immunofluorescence microscopy indicated a heterogeneous mNG
expression level in each cell line. Thus, sorting enabled the selection/generation of polyclonal
cell populations at similar mNG fusion protein expression levels. FACS was performed by the
Flow Core Facility at the Radium hospital using a BD FACS Aria II Cell Sorter.
Seeding and serum starvation
The procedure was performed in an aseptic LAF bench. Two parallel 10 cm dishes were
prepared for flow analysis, one dish for asynchronous cells and the other for serum starved
cells. The dishes were seeded with 500 000 cells in 10 ml DMEM/F-12 with FBS and PS
(additionally blasticidin (1:1000) for transduced cell lines). 24 hours after cell seeding, one
40
dish was serum starved by washing twice with 10 ml DMEM/F-12 complemented with PS but
not FBS and adding 10 ml of the same serum free growth medium. The cells were incubated
at 37°C with 5 % CO2 for 48 hours.
Harvesting and fixation of cells
The asynchronous cell dish was harvested 24 hours after seeding, and the serum starved dish
48 hours after serum starvation. Cells were harvested at the lab bench in the cell lab in a non-
sterile environment and fixation was performed in a safety hood.
Growth medium from the dish was transferred to marked 15 ml tubes. Cells were washed
once in 8 ml PBS, and the PBS was transferred to marked 15 ml tubes. Cells were added 1 ml
trypsin, and the dishes were placed in the incubator until the cells were loose (approximately
5 min). The transferred growth medium in the 15 ml tube was centrifuged at 350xg for 5 min.
The supernatant was removed by suction until 3 ml solution was left in the 15 ml tube.
Trypsination was stopped by adding the previously saved 8 ml PBS. The PBS-trypsin-cell
solution was transferred to the 15 ml tube with 3 ml medium and centrifuged at 350xg for 5
min. The supernatant was removed by suction until 3 ml solution was left in the 15 ml tube.
The pellet was re-suspended by pipetting. The 3 ml cell solution was transferred to a flow
tube and centrifuged at 350xg rpm for 5 min. The supernatant was removed by suction until
the pellet was barely covered. In a safety hood, the cell pellet was re-suspended using the
vortex. The cells were added 1 ml ice cold (-20°C) MeOH drop wise while pressing the tube
briefly up and down from the vortex. Fixated cells were stored at -20°C until staining.
Staining for cell cycle analysis and mitosis
The flow tube, with fixed cells, was filled with 3 ml room tempered (r.t.) PBS and centrifuged
at 350xg for 5 min. The supernatant was removed by suction and the cell pellet was re-
suspended by vortexing. The wash step with PBS was repeated to remove any methanol
residue. A 4% fat free dry milk suspension was prepared in PBS for primary and secondary
antibody dilution. The suspension was vortexed and centrifuged at 350xg for 5 min. Only the
upper portion of the milk solution was used to avoid any milk powder that was not properly
dissolved. The flow tube was added 100 µl polyclonal rabbit anti-phospho-histone H3 diluted
1:500 in 4% fat free dry milk. The tube was vortexed and incubated on ice for 30 min. The
41
flow tube was filled with 4 ml PBS (r.t.) and centrifuged at 350xg for 5 min. The supernatant
was removed by suction. The cell pellet was resuspended by vortexing. 100 µl of Goat
F(ab’)2 anti-rabbit IgG, R-phycoerythrin (R-PE) conjugated was added to the sample in a
dilution of 1:500 in 4% fat free dry milk. The flow tube was vortexed and incubated on ice for
30 min. The flow tube was filled with 4 ml PBS (r.t.) and centrifuged at 350xg for 5 min. The
supernatant was removed by suction. The cell pellet was re-suspended by vortexing. Hoechst
33258 (1.5 µg/ml) solution was prepared in PBS (r.t), and 400 µl was added to the tube and
carefully vortexed. The cell sample was strained through a cell strainer lid. The flow tube was
sealed with parafilm and stored at +4°C until analysis by flow cytometry. 15 min prior to the
flow cytometer run, the flow samples were vortexed and placed back at +4°C. The samples
were vortexed again and strained through the cell strainer lid right before running the samples
on the flow cytometer.
Generation of growth curve
RPE1 WT, RPE1 WT mNG-CEP104 and RPE1 WT mNG-CSPP-L were seeded with two
parallels of 40 000 cells each in four 6-well plates. Cells were detached from one plate at 24,
48, 72 and 96 hours after seeding following the method described in 3.2. The cell
concentration was measured by Coulter counting. The doubling time (Dt) was calculated by
equation 1, where t0 and t is the first and last time point of measurement and N0 and N is the
first and last cell concentration measured.
𝐷𝑡 =(t − t0)log2
logN − logN0 Equation 1
Fluorescence-activated cell sorting
A culture flask (75cm2) with about 80% cell confluency was used for FACS. The cells were
detached and re-suspended in growth medium according to the subculturing method (3.2).
Further, the cells were transferred to a 15 ml tube and centrifuged at 350xg for 4 min. The cell
pellet was re-suspended in 3 ml supernatant. Remaining supernatant was discarded. A cell
strainer filter was attached to a flow polypropylene tube. The cell solution was filtered and
centrifuged at 350xgfor 4 min. The cell pellet was re-suspended in 1 ml supernatant by
42
vortexing. Remaining supernatant was discarded. The cells were sorted into low, medium and
high population based on the mNG expression level. Untransduced RPE1 WT cell line was
used as a control to distinguish background (autofluorescence) from mNG signal. The sorted
samples were centrifuged at 350xg for 4 min. The supernatant was removed. The cell pellet
was re-suspended in 10 ml conditioned DMEM/F12 with FBS, PS and blasticidin and
transferred to a culture flask (75 cm2). The cells were incubated at 37°C with 5 % CO2.
3.5 SDS-PAGE and western blot
Theory
Western blot is a technique that allows detection of protein of interest in a cell lysate by using
a specific antibody. A cell lysate is first prepared, followed by sodium dodecylsulfate
polyacrylamide gel electrophoresis (SDS-PAGE) and transfer of the gel to a western blot.
Protein of interest is detected by primary antibody staining and the primary antibody is
subsequently detected most often by a Horseradish Peroxidase (HRP)-conjugated secondary
antibody. Oxidation of HRP substrates creates a chemiluminescent signal which can be
detected by a ChemiDoc machine equipped with a high sensitivity camera. SDS-PAGE is
used to separate proteins based on molecular weight. The proteins are imposed a negative
charge by the denaturing agent SDS. Thereby, rendering size as the only determining factor of
migration speed through the pores of the gel. Western blot was utilized to confirm the
expression of the fusion protein in the generated cell lines, and also to compare the relative
expression of the fusion protein to the endogenous protein. RPE1 WT cell line was included
as a control.
Protocol
Preparation of lysates and SDS-PAGE
Two parallel 6 cm dishes were seeded with 250 000 cells, one dish for asynchronous cells and
the other for serum starved cells. One dish was serum starved 24 hours after seeding as
described in 3.4.1. Lysate was made 24 hours after seeding for asynchronous cells, and 48
hours after serum starvation for serum starved cells. Right before the lysation procedure, a
43
lysation/sample loading buffer was prepared with stock lysis buffer, complete phosphatase
inhibitor (25x), protease inhibitor cocktail II, protease inhibitor cocktail III and benzonase (10
000 units/µl). Medium was removed, and the cells were washed with 5 ml PBS (r.t). The dish
was placed on ice and added 300 µl lysis buffer drop wise. Cells were scraped loose with a
cell scraper. The lysate was pipetted into a 1.5 ml Eppendorf tube, vortexed for 30 sec and
incubated for 15 min at +4°C. The lysate was cooked at 95°C for 5 min, briefly centrifuged,
and stored at -20°C until loading on SDS-PAGE.
The electrophoresis chamber was assembled with Bio-Rad tgx 26 well 4-20% gel. Running
buffer (Tris/Glycine/SDS buffer 10x stock solution diluted in 1x MQH2O) was added to the
chambers. The lysates were incubated for 5 min at 95ºC and loaded onto the gel. A protein
molecular marker was used to follow the migration. The gel was run at 200V for about 40
min.
Western blot
The TransBlot Turbo system from Bio-Rad was used to transfer proteins separated by SDS-
PAGE to a polyvinylidene difluoride (PVDF) membrane. The gel from the SDS-PAGE was
placed briefly in MQH20. A PVDF membrane was placed in 50 ml MeOH for activation, and
then immediately after transferred to a container with 1x transfer buffer (prepared from 5x
stock solution in Trans-Blot Turbo RTA Mini PVDF Transfer kit). 2 x transfer stacks were
placed in 1x transfer buffer for equilibration. A transfer sandwich was assembled in the
following order from the bottom of a transfer cassette; transfer stack, PVDF membrane, gel,
transfer stack. Air bubbles were removed between the different layers using a small roller.
The Trans-Blot Turbo machine was turned on, and the transfer-program for mixed molecular
weights was run. The transfer sandwich was disassembled, and the membrane was rinsed in
MQH20.
Prior to staining with the primary antibody, the membrane was blocked for 1 hour with 5%
w/v fat free dry milk solution in 1x TBST buffer (tris-buffered saline with tween). The
membrane was then cut into strips, with help of the protein molecular marker, to separate the
RPE1 WT mNG-CSPP-L cell lines, RPE WT mNG-CEP104 cell lines and the corresponding
loading control. Primary antibody solutions were prepared in 5% w/v fat free dry milk: anti-
44
CSPP-L (rabbit 1:1000), anti-CEP104 (rabbit 1:500) and GTU88 (mouse 1:1000). The RPE1
WT mNG-CSPP-L cell lines were added anti-CSPP-L, and the RPE1 WT mNG-CEP104 cell
lines were added anti-CEP104. GTU88 primary antibody was added to all cell lines as a
loading control. Incubation with primary antibody was done overnight at 4ºC in a moist
chamber. The membrane strips were washed 3x5min in 1x TBST buffer before application of
secondary antibodies. HRP conjugated goat-anti-rabbit (GAR) and donkey-anti-mouse
(DAM) were diluted 1:10 000 in 5% w/v fat free dry milk. The membrane strips were
incubated at room temperature for 1 hour on a rotating bench followed by 3x5min wash in 1x
TBST buffer. The membrane strips were developed using the enhanced chemiluminescent
SuperSignal™ West Dura Extended Duration Substrate kit and a ChemiDoc machine.
3.6 Fluorescence microscopy and live-cell imaging
Theory
A fluorescence microscope can be used to detect proteins either directly fused with
fluorescent molecules or stained with antibodies coupled to fluorescent molecules.
Fluorescent molecules absorb and emit light at different wavelengths, where the emitted light
is of a longer wavelength. The difference between excitation and emission wavelength is
called the Stokes shift, and allows for visualization of proteins by fluorescence signal with
essentially no background. The fluorescence microscope contains an excitation filter, dichroic
mirror and an emission filter (figure 16) [1]. Light of selected wavelength passes through the
excitation filter and is reflected towards the sample by the dichroic mirror. The longer
wavelength light emitted from the fluorescent molecule is transmitted by the dichroic mirror
to the emission filter. Subsequently, the fluorescent signal corresponding to the protein of
interest can be detected through an ocular or with a digital camera.
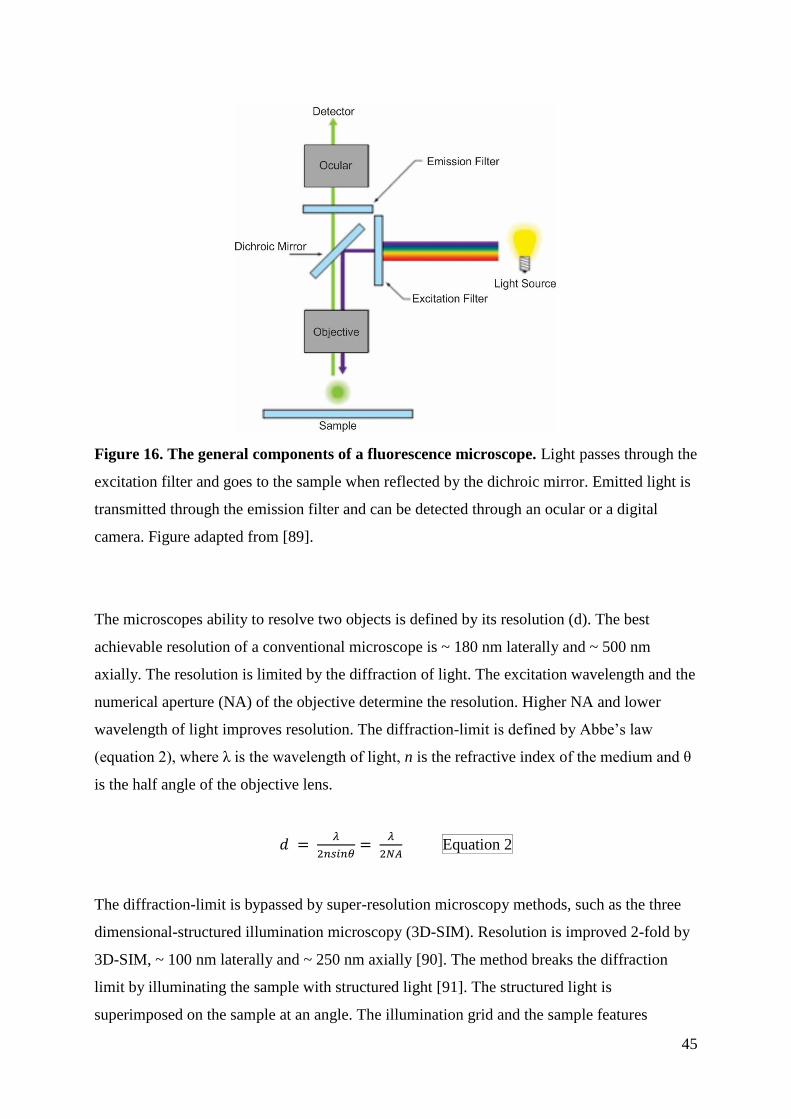
45
Figure 16. The general components of a fluorescence microscope. Light passes through the
excitation filter and goes to the sample when reflected by the dichroic mirror. Emitted light is
transmitted through the emission filter and can be detected through an ocular or a digital
camera. Figure adapted from [89].
The microscopes ability to resolve two objects is defined by its resolution (d). The best
achievable resolution of a conventional microscope is ~ 180 nm laterally and ~ 500 nm
axially. The resolution is limited by the diffraction of light. The excitation wavelength and the
numerical aperture (NA) of the objective determine the resolution. Higher NA and lower
wavelength of light improves resolution. The diffraction-limit is defined by Abbe’s law
(equation 2), where λ is the wavelength of light, n is the refractive index of the medium and θ
is the half angle of the objective lens.
𝑑 = 𝜆
2𝑛𝑠𝑖𝑛𝜃=
𝜆
2𝑁𝐴 Equation 2
The diffraction-limit is bypassed by super-resolution microscopy methods, such as the three
dimensional-structured illumination microscopy (3D-SIM). Resolution is improved 2-fold by
3D-SIM, ~ 100 nm laterally and ~ 250 nm axially [90]. The method breaks the diffraction
limit by illuminating the sample with structured light [91]. The structured light is
superimposed on the sample at an angle. The illumination grid and the sample features
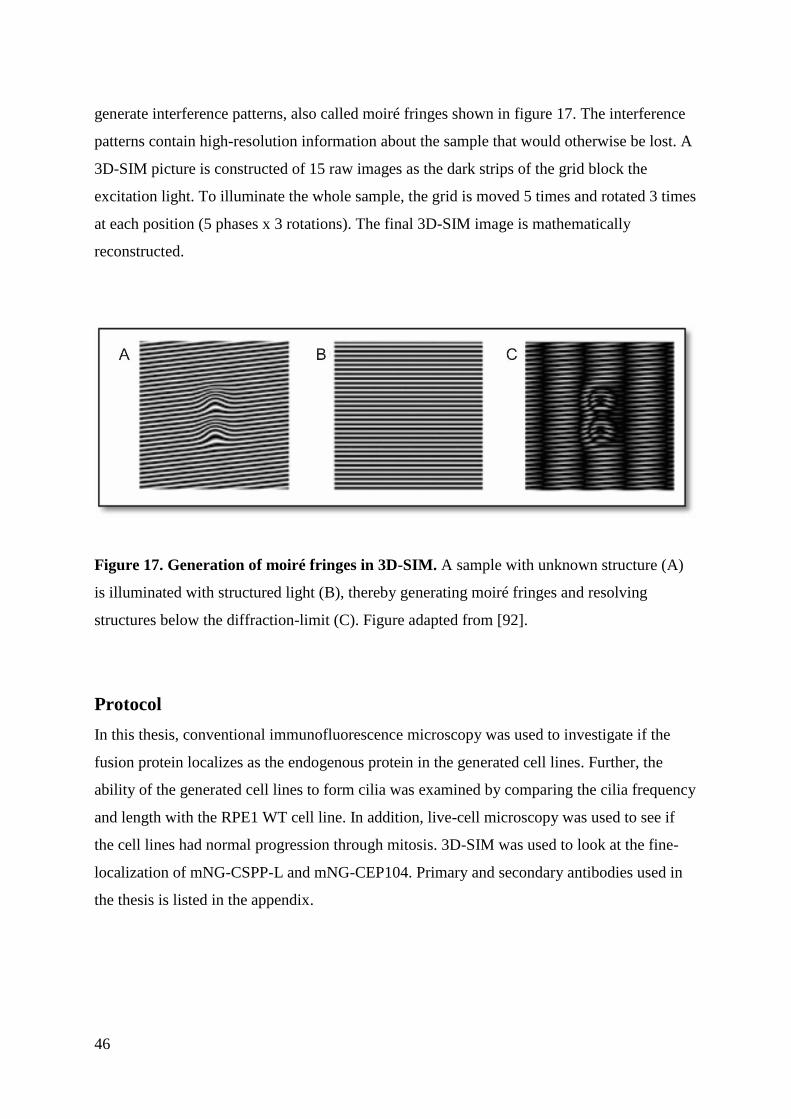
46
generate interference patterns, also called moiré fringes shown in figure 17. The interference
patterns contain high-resolution information about the sample that would otherwise be lost. A
3D-SIM picture is constructed of 15 raw images as the dark strips of the grid block the
excitation light. To illuminate the whole sample, the grid is moved 5 times and rotated 3 times
at each position (5 phases x 3 rotations). The final 3D-SIM image is mathematically
reconstructed.
Figure 17. Generation of moiré fringes in 3D-SIM. A sample with unknown structure (A)
is illuminated with structured light (B), thereby generating moiré fringes and resolving
structures below the diffraction-limit (C). Figure adapted from [92].
Protocol
In this thesis, conventional immunofluorescence microscopy was used to investigate if the
fusion protein localizes as the endogenous protein in the generated cell lines. Further, the
ability of the generated cell lines to form cilia was examined by comparing the cilia frequency
and length with the RPE1 WT cell line. In addition, live-cell microscopy was used to see if
the cell lines had normal progression through mitosis. 3D-SIM was used to look at the fine-
localization of mNG-CSPP-L and mNG-CEP104. Primary and secondary antibodies used in
the thesis is listed in the appendix.
47
Fixation
120 000 cells were seeded in 6-well plates with coverslips for analysis by
immunofluorescence microscopy. Cells were serum starved 48 hours before fixation. Cells
were fixated by incubation for 10 min at room temperature with 2 ml 1.6 % paraformaldehyde
(PFA) in PBS. PFA was removed, and the cells were washed with 2 ml PBS. The cells were
post-fixated in 2 ml ice-cold methanol (-20°C). The 6-well plate was covered with parafilm
and stored at -20°C until staining.
Staining
A Whatman paper was soaked in water and then covered with parafilm in a box with a lid.
PBS droplets, corresponding to the number of coverslips to be stained, were pipetted onto the
parafilm. The coverslips were moved to the PBS with the cell side facing the dome of the
droplet. PBS was removed by suction while adding a droplet of PBS-AT (PBS with % w/vol
Bovine serum albumin and 0.1 % vol/vol Triton-x-100) to the coverslips. The cells were
incubated for 15 min at r.t. PBS-AT was removed, and 30 µl of primary antibody diluted in
PBS-AT was added. The cells were incubated for 2 hours in room temperature. Each
coverslip was washed with 1 ml PBS. Secondary antibody was diluted in PBS-AT, and 30 µl
was added to each coverslip. The cells where incubated for 1 hour in r.t. Each coverslip was
washed with 1 ml PBS. The cells were added a droplet of Hoechst 33258 (0.6 µg/ml in PBS)
and incubated for 1 min at r.t. Each coverslip was washed with 1 ml PBS. The coverslips were
rinsed by immersion into a container with MQH2O. The coverslips were then gently dried by
dragging the corner along a paper towel. The coverslips were mounted with the cell side
facing down on a microscope slide. ProLong Gold was used as mounting medium. The
microscope slide was placed at 4°C for long-term storage.
Acquisition
Conventional immunofluorescence microscope
Samples were imaged using a CellObserver microscope system (Carl Zeiss) with a 40x lens, a
Hamamatsu ORCA-Flash4.0 v3 camera and a HXP120 Metal-Halide illumination unit.
Images were acquired at 10 positions per coverslip with a Z-stack of 11 slices (5 µm) per
position. Images were presented as maximal projections of z-stacks using Zeiss Zen Blue 2.3.
48
The images were analyzed to investigate if the fusion protein localized as expected in the
generated cell lines. Cilia frequency was determined by manually counting number of nucleus
and axoneme stained by Hoechst and glutamylated tubulin (GT335). Cilia length was
determined by manually measuring the length of the cilia membrane stained by ARL13B. The
length measuring tool in Zeiss Zen Blue 2.3 was used.
For live-cell microscopy, 10 000 cells were grown in 35-mm ibiTreat µ-culture dishes (Ibidi)
24 hours prior to imaging. Samples were imaged at 4 positions every 12 min for 10 hours
using a CellObserver microscope system (Carl Zeiss) with a 40x lens, a Hamamatsu ORCA-
Flash4.0 v3 camera, a temperature controlled XL-chamber at 37°C, humidity and CO2
controlled stage incubator, a motorized coded X,Y-stage and a HXP120 Metal-Halide
illumination unit. A Z-stack with 11 slices (6 µm) was acquired at each position.
3D-SIM
Samples were imaged using a Deltavision OMX V4 microscope (GE Healthcare, Little
Chalfont, UK) equipped with three water-cooled PCO.edge sCMOS cameras, 405 nm, 488
nm, 568 nm and 642 nm laserlines and a 60x 1.42NA Plan-Apochromat lense (Olympus,
Tokyo, JP). Z-stacks were acquired to cover the whole cell with sections spaced 0.125 mm
apart. 15 raw images were recorded for each z-section, and the final 3D-SIM images were
reconstructed using softWoRx software (GE Healthcare).
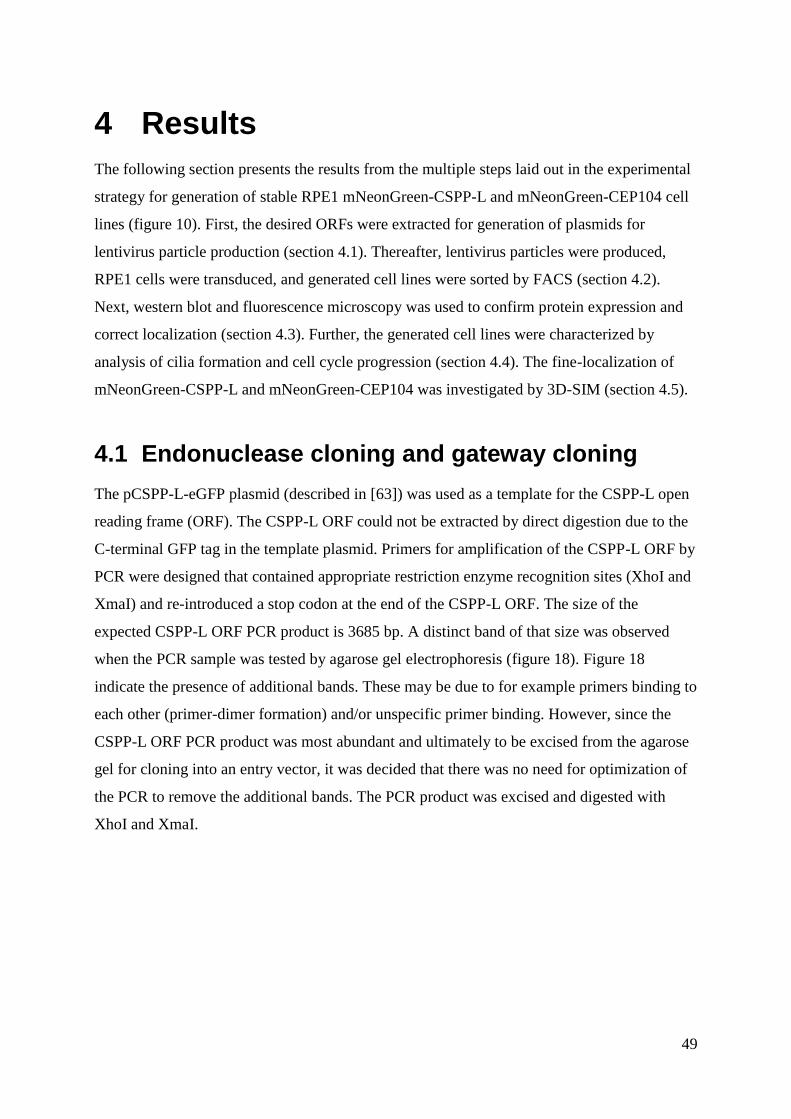
49
4 Results
The following section presents the results from the multiple steps laid out in the experimental
strategy for generation of stable RPE1 mNeonGreen-CSPP-L and mNeonGreen-CEP104 cell
lines (figure 10). First, the desired ORFs were extracted for generation of plasmids for
lentivirus particle production (section 4.1). Thereafter, lentivirus particles were produced,
RPE1 cells were transduced, and generated cell lines were sorted by FACS (section 4.2).
Next, western blot and fluorescence microscopy was used to confirm protein expression and
correct localization (section 4.3). Further, the generated cell lines were characterized by
analysis of cilia formation and cell cycle progression (section 4.4). The fine-localization of
mNeonGreen-CSPP-L and mNeonGreen-CEP104 was investigated by 3D-SIM (section 4.5).
4.1 Endonuclease cloning and gateway cloning
The pCSPP-L-eGFP plasmid (described in [63]) was used as a template for the CSPP-L open
reading frame (ORF). The CSPP-L ORF could not be extracted by direct digestion due to the
C-terminal GFP tag in the template plasmid. Primers for amplification of the CSPP-L ORF by
PCR were designed that contained appropriate restriction enzyme recognition sites (XhoI and
XmaI) and re-introduced a stop codon at the end of the CSPP-L ORF. The size of the
expected CSPP-L ORF PCR product is 3685 bp. A distinct band of that size was observed
when the PCR sample was tested by agarose gel electrophoresis (figure 18). Figure 18
indicate the presence of additional bands. These may be due to for example primers binding to
each other (primer-dimer formation) and/or unspecific primer binding. However, since the
CSPP-L ORF PCR product was most abundant and ultimately to be excised from the agarose
gel for cloning into an entry vector, it was decided that there was no need for optimization of
the PCR to remove the additional bands. The PCR product was excised and digested with
XhoI and XmaI.
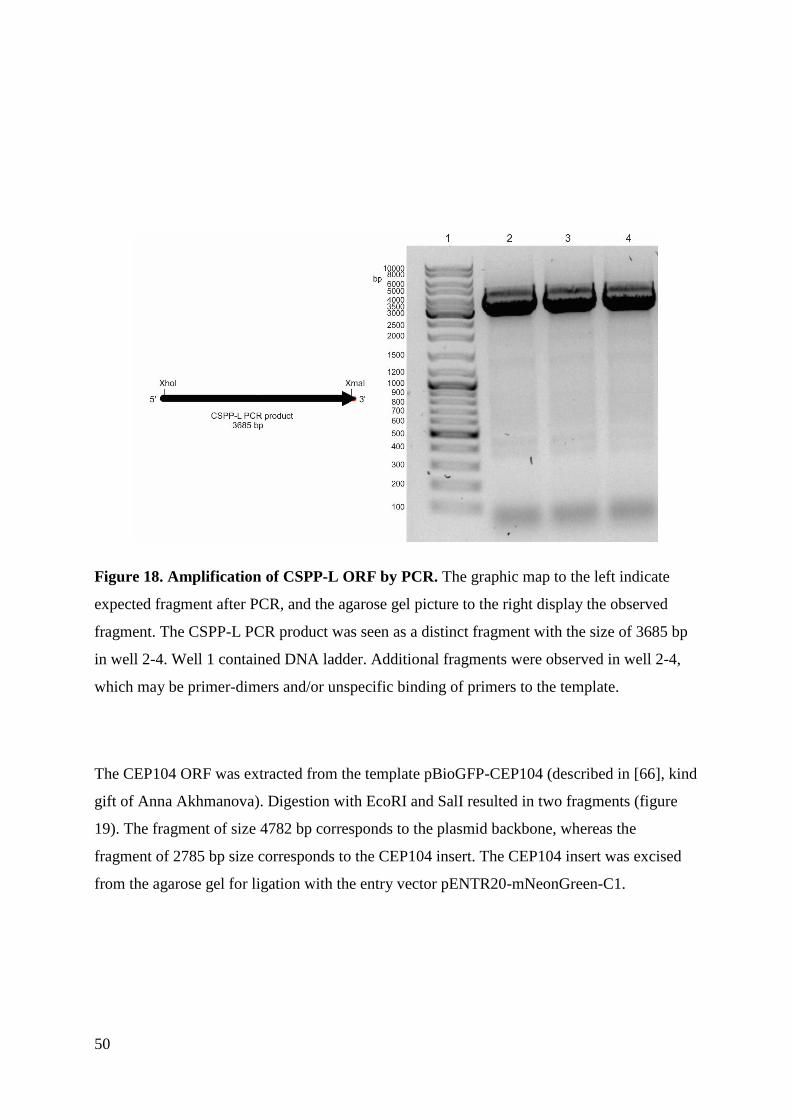
50
Figure 18. Amplification of CSPP-L ORF by PCR. The graphic map to the left indicate
expected fragment after PCR, and the agarose gel picture to the right display the observed
fragment. The CSPP-L PCR product was seen as a distinct fragment with the size of 3685 bp
in well 2-4. Well 1 contained DNA ladder. Additional fragments were observed in well 2-4,
which may be primer-dimers and/or unspecific binding of primers to the template.
The CEP104 ORF was extracted from the template pBioGFP-CEP104 (described in [66], kind
gift of Anna Akhmanova). Digestion with EcoRI and SalI resulted in two fragments (figure
19). The fragment of size 4782 bp corresponds to the plasmid backbone, whereas the
fragment of 2785 bp size corresponds to the CEP104 insert. The CEP104 insert was excised
from the agarose gel for ligation with the entry vector pENTR20-mNeonGreen-C1.
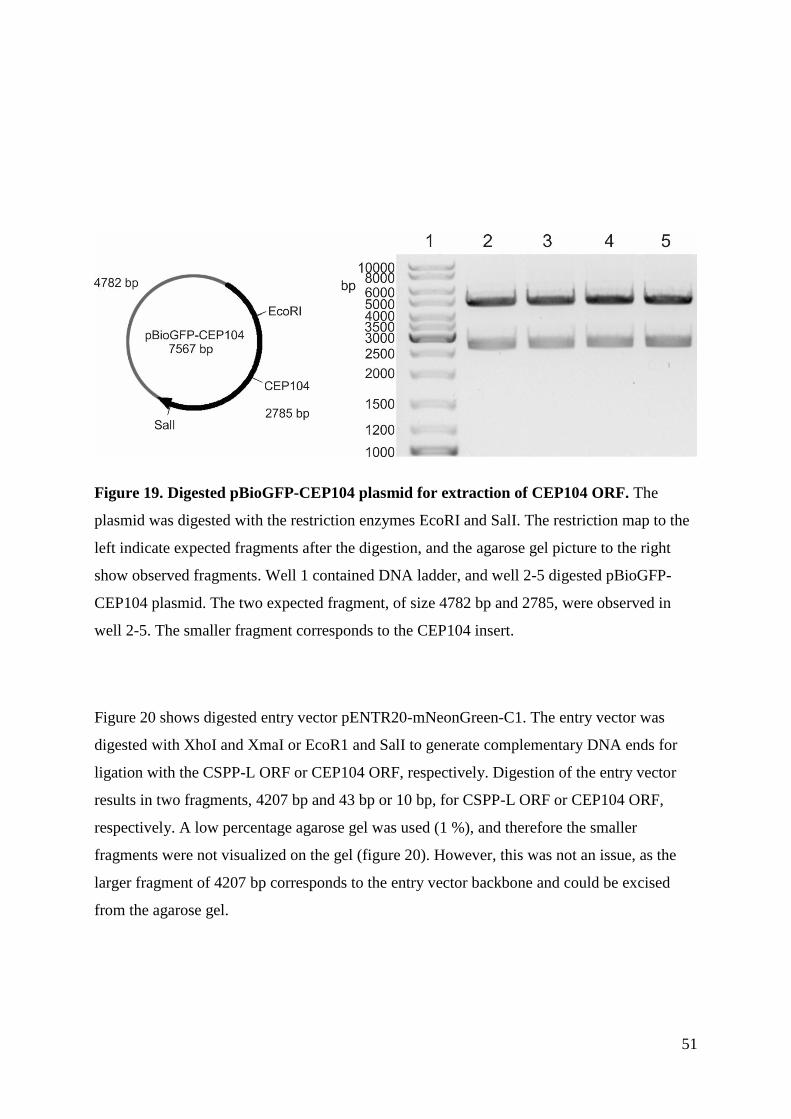
51
Figure 19. Digested pBioGFP-CEP104 plasmid for extraction of CEP104 ORF. The
plasmid was digested with the restriction enzymes EcoRI and SalI. The restriction map to the
left indicate expected fragments after the digestion, and the agarose gel picture to the right
show observed fragments. Well 1 contained DNA ladder, and well 2-5 digested pBioGFP-
CEP104 plasmid. The two expected fragment, of size 4782 bp and 2785, were observed in
well 2-5. The smaller fragment corresponds to the CEP104 insert.
Figure 20 shows digested entry vector pENTR20-mNeonGreen-C1. The entry vector was
digested with XhoI and XmaI or EcoR1 and SalI to generate complementary DNA ends for
ligation with the CSPP-L ORF or CEP104 ORF, respectively. Digestion of the entry vector
results in two fragments, 4207 bp and 43 bp or 10 bp, for CSPP-L ORF or CEP104 ORF,
respectively. A low percentage agarose gel was used (1 %), and therefore the smaller
fragments were not visualized on the gel (figure 20). However, this was not an issue, as the
larger fragment of 4207 bp corresponds to the entry vector backbone and could be excised
from the agarose gel.
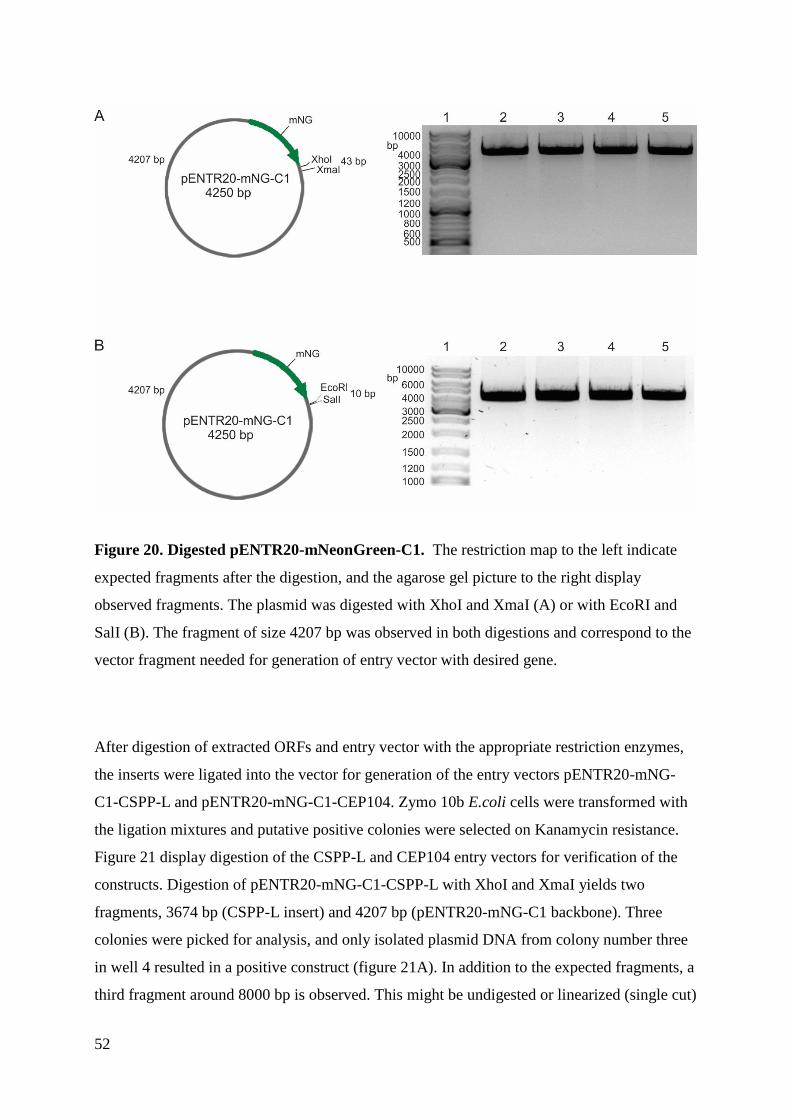
52
Figure 20. Digested pENTR20-mNeonGreen-C1. The restriction map to the left indicate
expected fragments after the digestion, and the agarose gel picture to the right display
observed fragments. The plasmid was digested with XhoI and XmaI (A) or with EcoRI and
SalI (B). The fragment of size 4207 bp was observed in both digestions and correspond to the
vector fragment needed for generation of entry vector with desired gene.
After digestion of extracted ORFs and entry vector with the appropriate restriction enzymes,
the inserts were ligated into the vector for generation of the entry vectors pENTR20-mNG-
C1-CSPP-L and pENTR20-mNG-C1-CEP104. Zymo 10b E.coli cells were transformed with
the ligation mixtures and putative positive colonies were selected on Kanamycin resistance.
Figure 21 display digestion of the CSPP-L and CEP104 entry vectors for verification of the
constructs. Digestion of pENTR20-mNG-C1-CSPP-L with XhoI and XmaI yields two
fragments, 3674 bp (CSPP-L insert) and 4207 bp (pENTR20-mNG-C1 backbone). Three
colonies were picked for analysis, and only isolated plasmid DNA from colony number three
in well 4 resulted in a positive construct (figure 21A). In addition to the expected fragments, a
third fragment around 8000 bp is observed. This might be undigested or linearized (single cut)
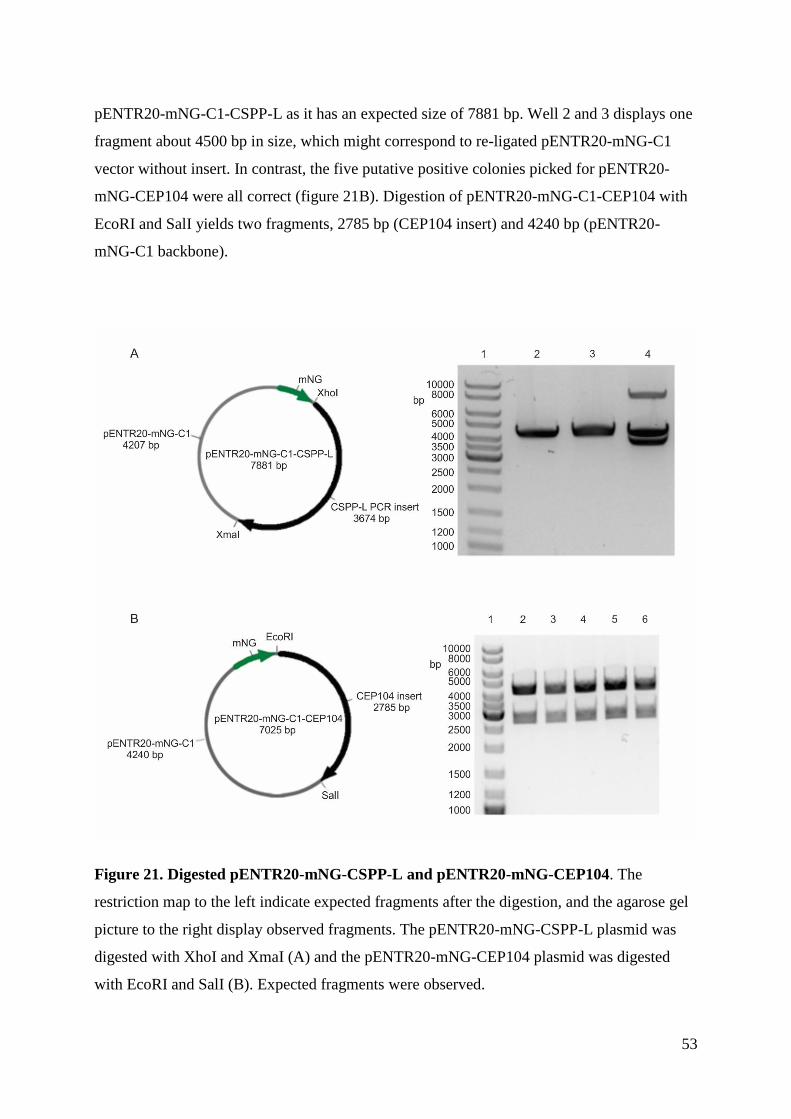
53
pENTR20-mNG-C1-CSPP-L as it has an expected size of 7881 bp. Well 2 and 3 displays one
fragment about 4500 bp in size, which might correspond to re-ligated pENTR20-mNG-C1
vector without insert. In contrast, the five putative positive colonies picked for pENTR20-
mNG-CEP104 were all correct (figure 21B). Digestion of pENTR20-mNG-C1-CEP104 with
EcoRI and SalI yields two fragments, 2785 bp (CEP104 insert) and 4240 bp (pENTR20-
mNG-C1 backbone).
Figure 21. Digested pENTR20-mNG-CSPP-L and pENTR20-mNG-CEP104. The
restriction map to the left indicate expected fragments after the digestion, and the agarose gel
picture to the right display observed fragments. The pENTR20-mNG-CSPP-L plasmid was
digested with XhoI and XmaI (A) and the pENTR20-mNG-CEP104 plasmid was digested
with EcoRI and SalI (B). Expected fragments were observed.
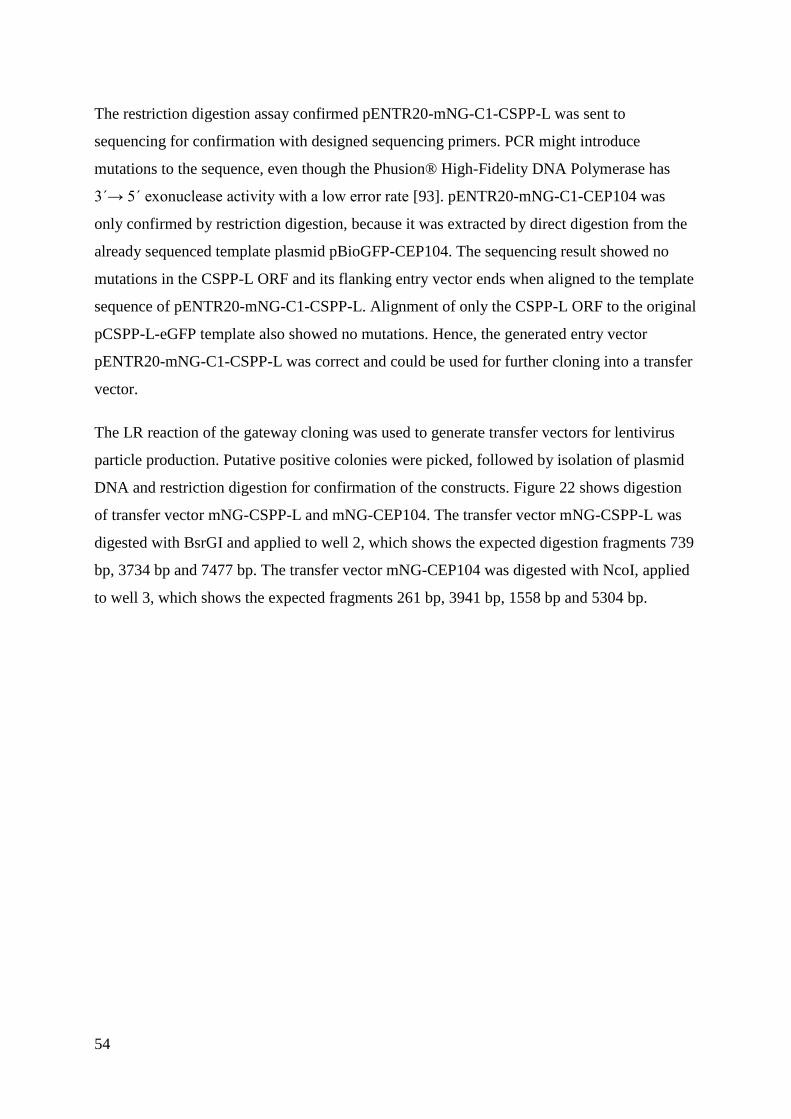
54
The restriction digestion assay confirmed pENTR20-mNG-C1-CSPP-L was sent to
sequencing for confirmation with designed sequencing primers. PCR might introduce
mutations to the sequence, even though the Phusion® High-Fidelity DNA Polymerase has
3´→ 5´ exonuclease activity with a low error rate [93]. pENTR20-mNG-C1-CEP104 was
only confirmed by restriction digestion, because it was extracted by direct digestion from the
already sequenced template plasmid pBioGFP-CEP104. The sequencing result showed no
mutations in the CSPP-L ORF and its flanking entry vector ends when aligned to the template
sequence of pENTR20-mNG-C1-CSPP-L. Alignment of only the CSPP-L ORF to the original
pCSPP-L-eGFP template also showed no mutations. Hence, the generated entry vector
pENTR20-mNG-C1-CSPP-L was correct and could be used for further cloning into a transfer
vector.
The LR reaction of the gateway cloning was used to generate transfer vectors for lentivirus
particle production. Putative positive colonies were picked, followed by isolation of plasmid
DNA and restriction digestion for confirmation of the constructs. Figure 22 shows digestion
of transfer vector mNG-CSPP-L and mNG-CEP104. The transfer vector mNG-CSPP-L was
digested with BsrGI and applied to well 2, which shows the expected digestion fragments 739
bp, 3734 bp and 7477 bp. The transfer vector mNG-CEP104 was digested with NcoI, applied
to well 3, which shows the expected fragments 261 bp, 3941 bp, 1558 bp and 5304 bp.
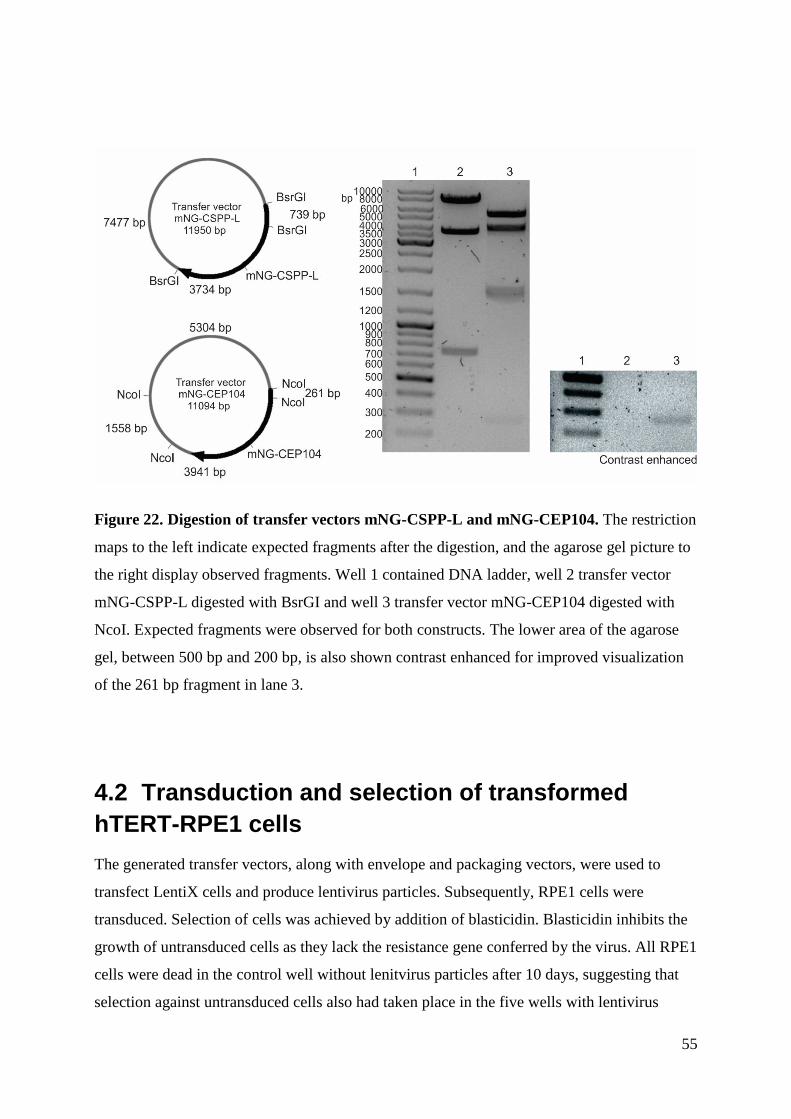
55
Figure 22. Digestion of transfer vectors mNG-CSPP-L and mNG-CEP104. The restriction
maps to the left indicate expected fragments after the digestion, and the agarose gel picture to
the right display observed fragments. Well 1 contained DNA ladder, well 2 transfer vector
mNG-CSPP-L digested with BsrGI and well 3 transfer vector mNG-CEP104 digested with
NcoI. Expected fragments were observed for both constructs. The lower area of the agarose
gel, between 500 bp and 200 bp, is also shown contrast enhanced for improved visualization
of the 261 bp fragment in lane 3.
4.2 Transduction and selection of transformed
hTERT-RPE1 cells
The generated transfer vectors, along with envelope and packaging vectors, were used to
transfect LentiX cells and produce lentivirus particles. Subsequently, RPE1 cells were
transduced. Selection of cells was achieved by addition of blasticidin. Blasticidin inhibits the
growth of untransduced cells as they lack the resistance gene conferred by the virus. All RPE1
cells were dead in the control well without lenitvirus particles after 10 days, suggesting that
selection against untransduced cells also had taken place in the five wells with lentivirus
56
particles. The RPE1 cells in the five cells were transduced with an increasing amount of
medium containing lentivirus particles, from well 1 to well 5: 10 µl, 50 µl, 100 µl, 200 µl and
500 µl. Forty to fifty percent of the cells in well 1 and 2 were dead after transduction, whereas
well 3 – 5 had approximately thirty percent dead cells. Fewer cells were transduced with
lentivirus particles in well 1 and 2, as indicated by the prominent cell death. Ideally, only one
integration event should occur per cell to limit expression and decrease chances of possible
alterations due to virus integration. RPE1 cells in well 1, with the least amount of lentivirus
particles, were selected for further analysis (hereafter referred to as RPE1 cells 10v).
However, the RPE1 cells in the other 4 wells were also taken care of and vials were later
frozen down for preservation in liquid Nitrogen.
After five passages, when it was safe to assume that there were no lentivirus particles in the
medium, the cell lines were transferred from the virus lab to the normal cell lab. Thereafter,
the RPE1 cells 10v were fixed and stained with the cilia markers acetylated tubulin (MT
modification on centrosome and axoneme) and ARL13B (cilia membrane) for observation by
fluorescence microscopy. Visual inspection indicated a varying level of mNG expression
between the cells, where some showed weak expression and others stronger expression.
Transduction of cells with lentivirus particles produces a polyclonal cell population, as
integration sites will vary, and some cells may have multiple integration events. Furthermore,
availability of the promoter region may depend on the integration site. Therefore, cells display
a varying expression level of the fusion protein is expected.
To obtain a polyclonal cell population with similar mNG-fusion protein expression, the RPE1
cells 10v were sorted by fluorescence-activated cell sorting (FACS) into low, medium and
highly fluorescent subpopulations (figure 23). The RPE1 WT cell line was used as a negative
control to distinguish potential background signal (autofluorescence) from mNG signal.
Figure 23 indicate that the majority of RPE1 WT mNG-CEP104 cells have a high mNG
expression level, whereas RPE1 WT mNG-CSPP-L indicate a broader distribution of mNG
expression level among the cells. Dot plot with side scatter-areal (SCC-A) versus mNG signal
was used to make regions for sorting of the subpopulations.
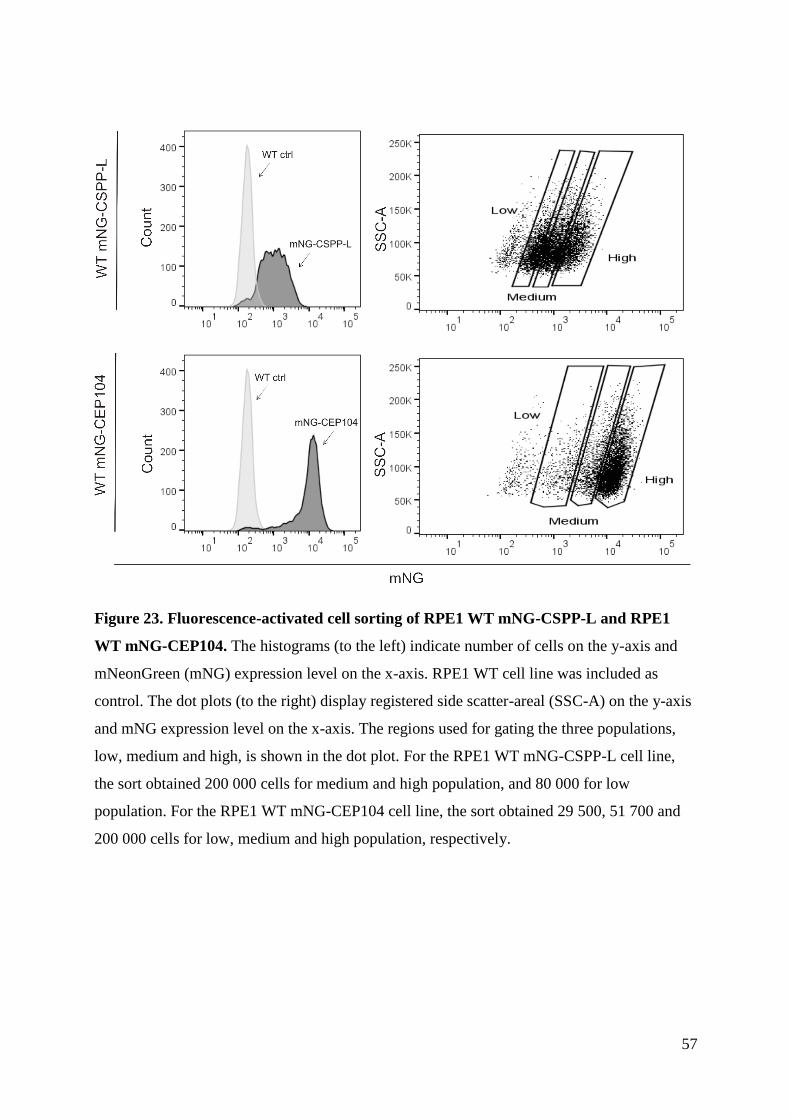
57
Figure 23. Fluorescence-activated cell sorting of RPE1 WT mNG-CSPP-L and RPE1
WT mNG-CEP104. The histograms (to the left) indicate number of cells on the y-axis and
mNeonGreen (mNG) expression level on the x-axis. RPE1 WT cell line was included as
control. The dot plots (to the right) display registered side scatter-areal (SSC-A) on the y-axis
and mNG expression level on the x-axis. The regions used for gating the three populations,
low, medium and high, is shown in the dot plot. For the RPE1 WT mNG-CSPP-L cell line,
the sort obtained 200 000 cells for medium and high population, and 80 000 for low
population. For the RPE1 WT mNG-CEP104 cell line, the sort obtained 29 500, 51 700 and
200 000 cells for low, medium and high population, respectively.
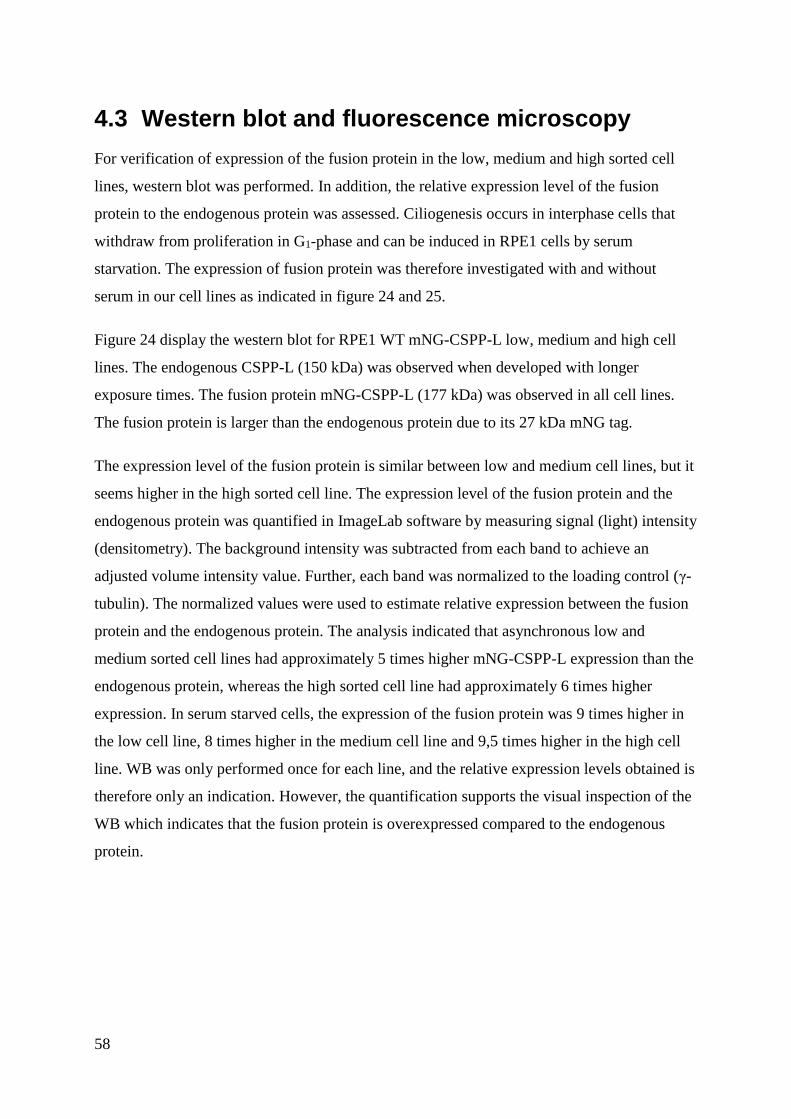
58
4.3 Western blot and fluorescence microscopy
For verification of expression of the fusion protein in the low, medium and high sorted cell
lines, western blot was performed. In addition, the relative expression level of the fusion
protein to the endogenous protein was assessed. Ciliogenesis occurs in interphase cells that
withdraw from proliferation in G1-phase and can be induced in RPE1 cells by serum
starvation. The expression of fusion protein was therefore investigated with and without
serum in our cell lines as indicated in figure 24 and 25.
Figure 24 display the western blot for RPE1 WT mNG-CSPP-L low, medium and high cell
lines. The endogenous CSPP-L (150 kDa) was observed when developed with longer
exposure times. The fusion protein mNG-CSPP-L (177 kDa) was observed in all cell lines.
The fusion protein is larger than the endogenous protein due to its 27 kDa mNG tag.
The expression level of the fusion protein is similar between low and medium cell lines, but it
seems higher in the high sorted cell line. The expression level of the fusion protein and the
endogenous protein was quantified in ImageLab software by measuring signal (light) intensity
(densitometry). The background intensity was subtracted from each band to achieve an
adjusted volume intensity value. Further, each band was normalized to the loading control (γ-
tubulin). The normalized values were used to estimate relative expression between the fusion
protein and the endogenous protein. The analysis indicated that asynchronous low and
medium sorted cell lines had approximately 5 times higher mNG-CSPP-L expression than the
endogenous protein, whereas the high sorted cell line had approximately 6 times higher
expression. In serum starved cells, the expression of the fusion protein was 9 times higher in
the low cell line, 8 times higher in the medium cell line and 9,5 times higher in the high cell
line. WB was only performed once for each line, and the relative expression levels obtained is
therefore only an indication. However, the quantification supports the visual inspection of the
WB which indicates that the fusion protein is overexpressed compared to the endogenous
protein.
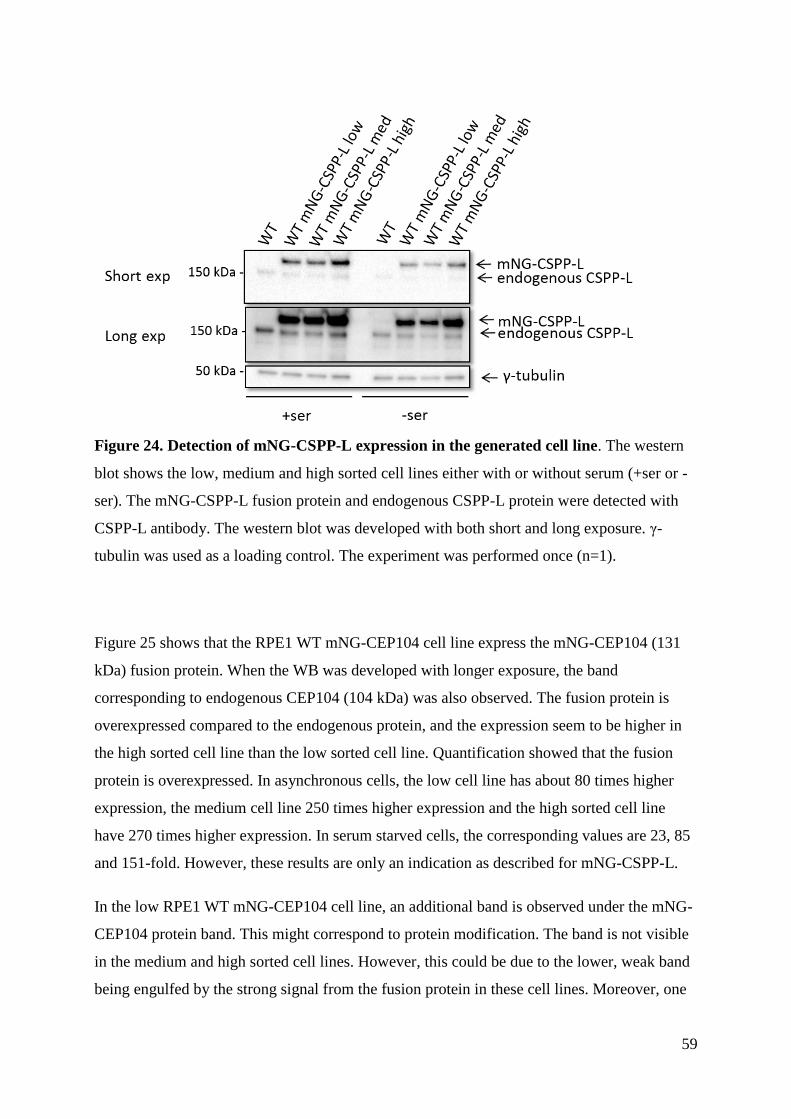
59
Figure 24. Detection of mNG-CSPP-L expression in the generated cell line. The western
blot shows the low, medium and high sorted cell lines either with or without serum (+ser or -
ser). The mNG-CSPP-L fusion protein and endogenous CSPP-L protein were detected with
CSPP-L antibody. The western blot was developed with both short and long exposure. γ-
tubulin was used as a loading control. The experiment was performed once (n=1).
Figure 25 shows that the RPE1 WT mNG-CEP104 cell line express the mNG-CEP104 (131
kDa) fusion protein. When the WB was developed with longer exposure, the band
corresponding to endogenous CEP104 (104 kDa) was also observed. The fusion protein is
overexpressed compared to the endogenous protein, and the expression seem to be higher in
the high sorted cell line than the low sorted cell line. Quantification showed that the fusion
protein is overexpressed. In asynchronous cells, the low cell line has about 80 times higher
expression, the medium cell line 250 times higher expression and the high sorted cell line
have 270 times higher expression. In serum starved cells, the corresponding values are 23, 85
and 151-fold. However, these results are only an indication as described for mNG-CSPP-L.
In the low RPE1 WT mNG-CEP104 cell line, an additional band is observed under the mNG-
CEP104 protein band. This might correspond to protein modification. The band is not visible
in the medium and high sorted cell lines. However, this could be due to the lower, weak band
being engulfed by the strong signal from the fusion protein in these cell lines. Moreover, one
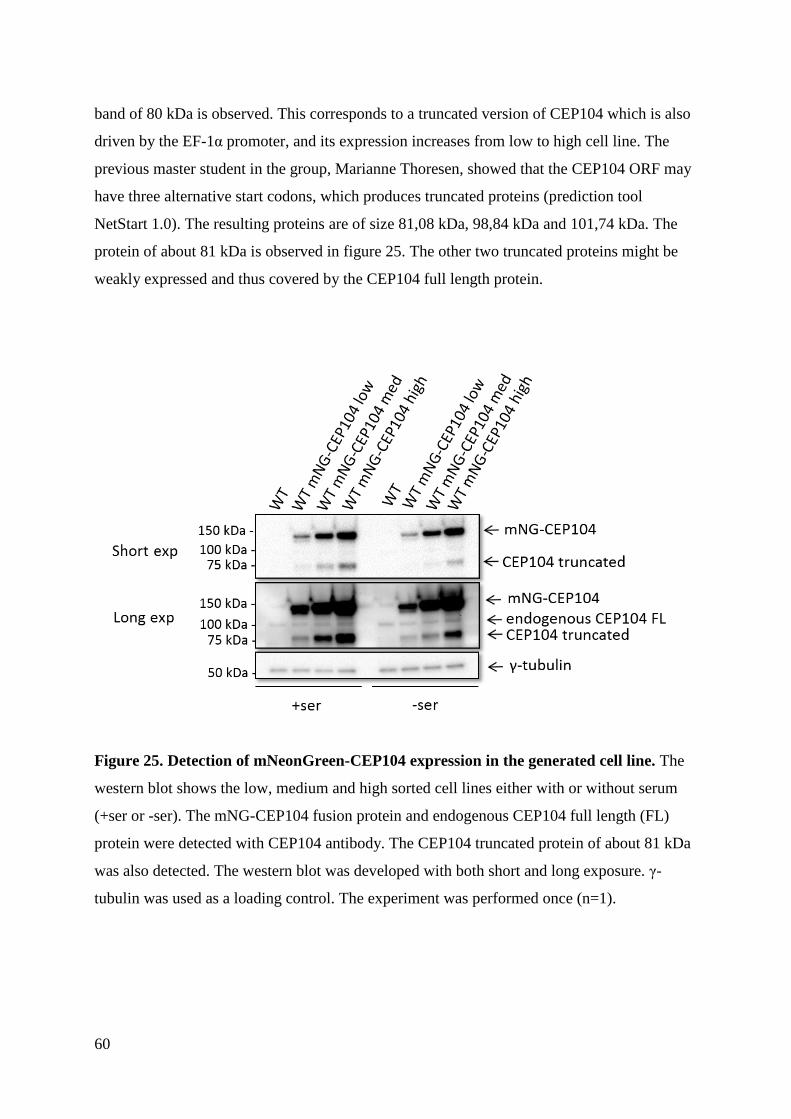
60
band of 80 kDa is observed. This corresponds to a truncated version of CEP104 which is also
driven by the EF-1α promoter, and its expression increases from low to high cell line. The
previous master student in the group, Marianne Thoresen, showed that the CEP104 ORF may
have three alternative start codons, which produces truncated proteins (prediction tool
NetStart 1.0). The resulting proteins are of size 81,08 kDa, 98,84 kDa and 101,74 kDa. The
protein of about 81 kDa is observed in figure 25. The other two truncated proteins might be
weakly expressed and thus covered by the CEP104 full length protein.
Figure 25. Detection of mNeonGreen-CEP104 expression in the generated cell line. The
western blot shows the low, medium and high sorted cell lines either with or without serum
(+ser or -ser). The mNG-CEP104 fusion protein and endogenous CEP104 full length (FL)
protein were detected with CEP104 antibody. The CEP104 truncated protein of about 81 kDa
was also detected. The western blot was developed with both short and long exposure. γ-
tubulin was used as a loading control. The experiment was performed once (n=1).
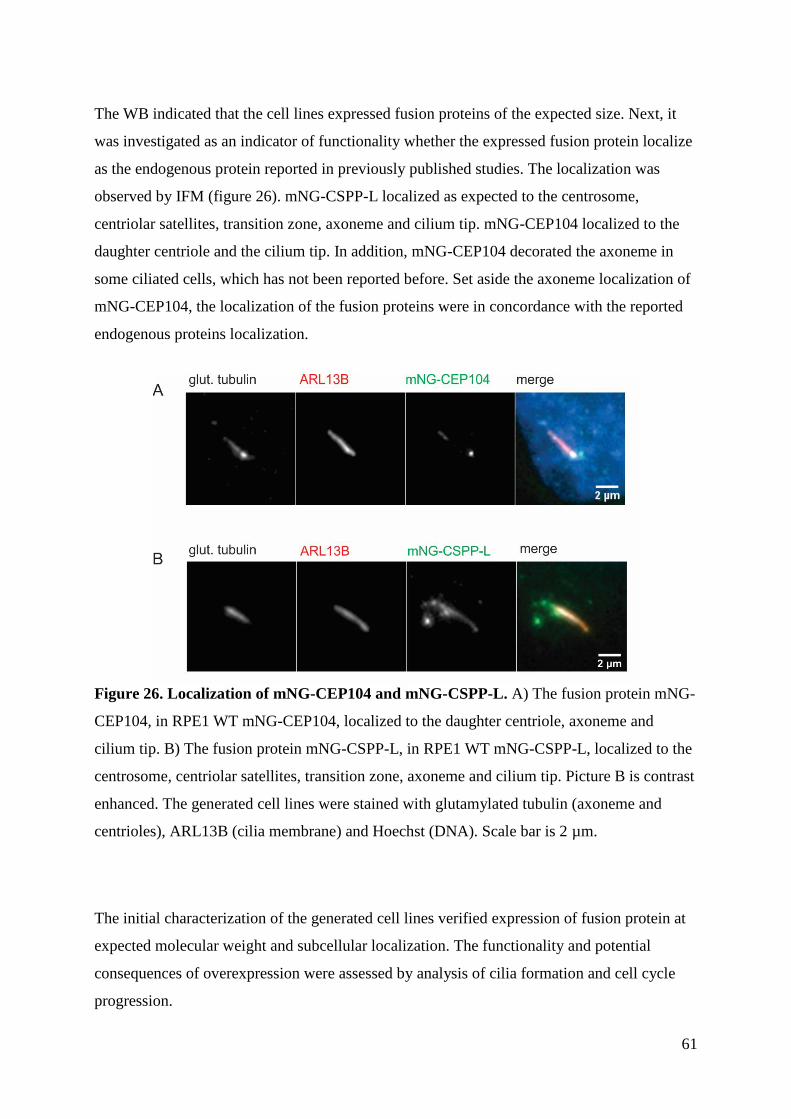
61
The WB indicated that the cell lines expressed fusion proteins of the expected size. Next, it
was investigated as an indicator of functionality whether the expressed fusion protein localize
as the endogenous protein reported in previously published studies. The localization was
observed by IFM (figure 26). mNG-CSPP-L localized as expected to the centrosome,
centriolar satellites, transition zone, axoneme and cilium tip. mNG-CEP104 localized to the
daughter centriole and the cilium tip. In addition, mNG-CEP104 decorated the axoneme in
some ciliated cells, which has not been reported before. Set aside the axoneme localization of
mNG-CEP104, the localization of the fusion proteins were in concordance with the reported
endogenous proteins localization.
Figure 26. Localization of mNG-CEP104 and mNG-CSPP-L. A) The fusion protein mNG-
CEP104, in RPE1 WT mNG-CEP104, localized to the daughter centriole, axoneme and
cilium tip. B) The fusion protein mNG-CSPP-L, in RPE1 WT mNG-CSPP-L, localized to the
centrosome, centriolar satellites, transition zone, axoneme and cilium tip. Picture B is contrast
enhanced. The generated cell lines were stained with glutamylated tubulin (axoneme and
centrioles), ARL13B (cilia membrane) and Hoechst (DNA). Scale bar is 2 µm.
The initial characterization of the generated cell lines verified expression of fusion protein at
expected molecular weight and subcellular localization. The functionality and potential
consequences of overexpression were assessed by analysis of cilia formation and cell cycle
progression.
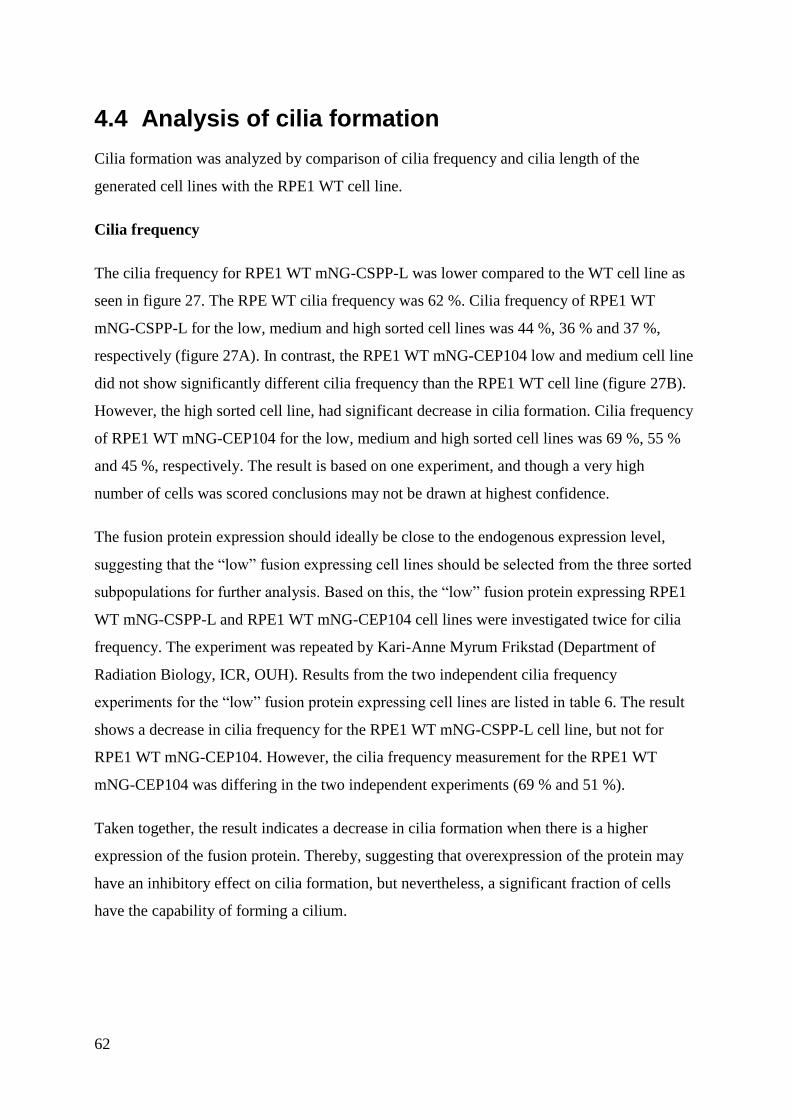
62
4.4 Analysis of cilia formation
Cilia formation was analyzed by comparison of cilia frequency and cilia length of the
generated cell lines with the RPE1 WT cell line.
Cilia frequency
The cilia frequency for RPE1 WT mNG-CSPP-L was lower compared to the WT cell line as
seen in figure 27. The RPE WT cilia frequency was 62 %. Cilia frequency of RPE1 WT
mNG-CSPP-L for the low, medium and high sorted cell lines was 44 %, 36 % and 37 %,
respectively (figure 27A). In contrast, the RPE1 WT mNG-CEP104 low and medium cell line
did not show significantly different cilia frequency than the RPE1 WT cell line (figure 27B).
However, the high sorted cell line, had significant decrease in cilia formation. Cilia frequency
of RPE1 WT mNG-CEP104 for the low, medium and high sorted cell lines was 69 %, 55 %
and 45 %, respectively. The result is based on one experiment, and though a very high
number of cells was scored conclusions may not be drawn at highest confidence.
The fusion protein expression should ideally be close to the endogenous expression level,
suggesting that the “low” fusion expressing cell lines should be selected from the three sorted
subpopulations for further analysis. Based on this, the “low” fusion protein expressing RPE1
WT mNG-CSPP-L and RPE1 WT mNG-CEP104 cell lines were investigated twice for cilia
frequency. The experiment was repeated by Kari-Anne Myrum Frikstad (Department of
Radiation Biology, ICR, OUH). Results from the two independent cilia frequency
experiments for the “low” fusion protein expressing cell lines are listed in table 6. The result
shows a decrease in cilia frequency for the RPE1 WT mNG-CSPP-L cell line, but not for
RPE1 WT mNG-CEP104. However, the cilia frequency measurement for the RPE1 WT
mNG-CEP104 was differing in the two independent experiments (69 % and 51 %).
Taken together, the result indicates a decrease in cilia formation when there is a higher
expression of the fusion protein. Thereby, suggesting that overexpression of the protein may
have an inhibitory effect on cilia formation, but nevertheless, a significant fraction of cells
have the capability of forming a cilium.
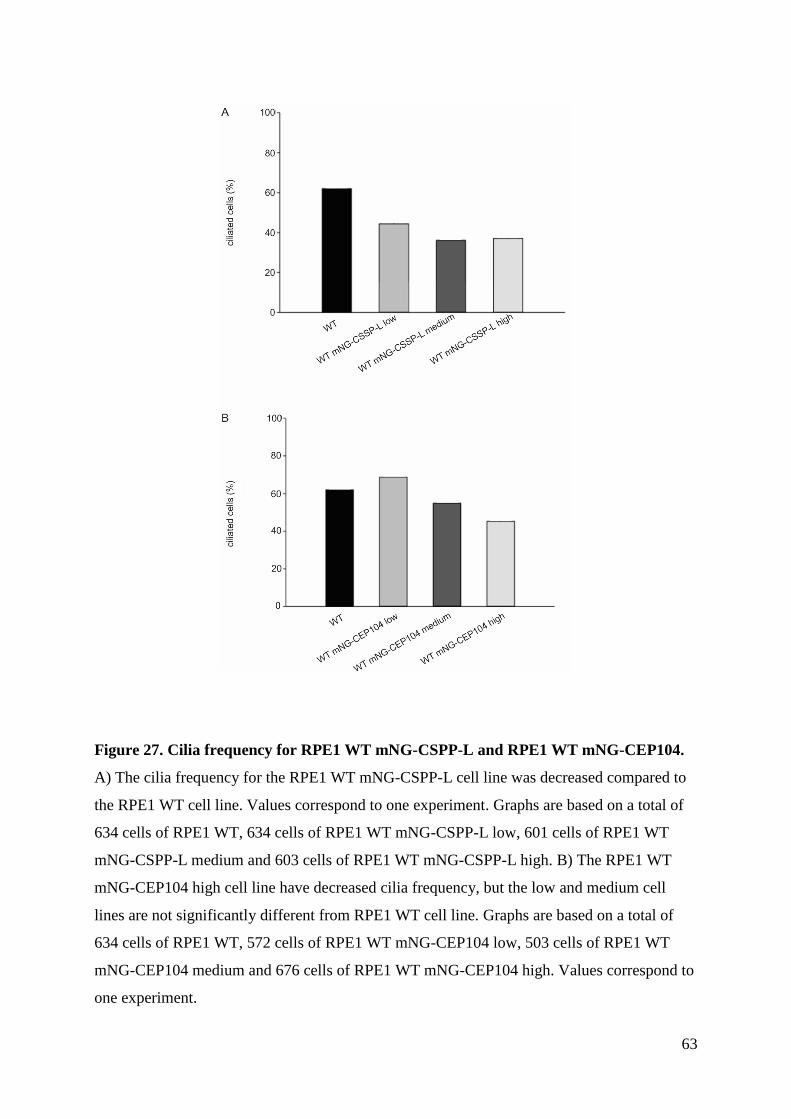
63
Figure 27. Cilia frequency for RPE1 WT mNG-CSPP-L and RPE1 WT mNG-CEP104.
A) The cilia frequency for the RPE1 WT mNG-CSPP-L cell line was decreased compared to
the RPE1 WT cell line. Values correspond to one experiment. Graphs are based on a total of
634 cells of RPE1 WT, 634 cells of RPE1 WT mNG-CSPP-L low, 601 cells of RPE1 WT
mNG-CSPP-L medium and 603 cells of RPE1 WT mNG-CSPP-L high. B) The RPE1 WT
mNG-CEP104 high cell line have decreased cilia frequency, but the low and medium cell
lines are not significantly different from RPE1 WT cell line. Graphs are based on a total of
634 cells of RPE1 WT, 572 cells of RPE1 WT mNG-CEP104 low, 503 cells of RPE1 WT
mNG-CEP104 medium and 676 cells of RPE1 WT mNG-CEP104 high. Values correspond to
one experiment.
64
Table 6. Cilia frequency for low sorted RPE1 WT mNG-CSPP-L and RPE1 WT mNG-
CEP104. The RPE1 wt mNG-CSPP-L cilia frequency was lower than the RPE1 WT. The
cilia frequency of RPE1 WT mNG-CEP104 was closer to the RPE1 WT, but the range was
larger between the two independent experiments. Values correspond to two independent
experiments.
Cilia frequency (%) Range
RPE1 WT 61 2
RPE1 WT mNG-CSPP-L low 42,5 1.5
RPE1 WT mNG-CEP104 low 60 18
Cilia length
Analysis of cilia frequency indicated that the generated cell lines were capable of cilia
formation. Further, the cilia length was analyzed as seen in figure 28. The mean cilia length
value of RPE1 WT was 2.7 µm. The RPE1 WT mNG-CSPP-L mean cilia length for low,
medium and high cell lines was approximately 2.6 µm, 2.5 µm and 2.9 µm, respectively. For
RPE1 WT mNG-CEP104, the mean cilia length for low, medium and high cell lines was
approximately 2.7 µm, 3.1 µm and 3.1 µm, respectively. Generally, the mean values of the
generated cell lines do not differ significantly from the RPE1 WT cell line. However, several
cilia with longer length were observed in the cell lines with higher expression, as indicated by
the outliers in figure 28. Just as for cilia frequency, the cilia length experiment was repeated
twice for the “low” expressing RPE1 WT mNG-CSPP-L and mNG-CEP104 cell lines. The
result from the two independent cilia length analysis are listed in table 7, and they indicate
that the “low” expressing generated cell lines are similar to the RPE1 WT cell line.
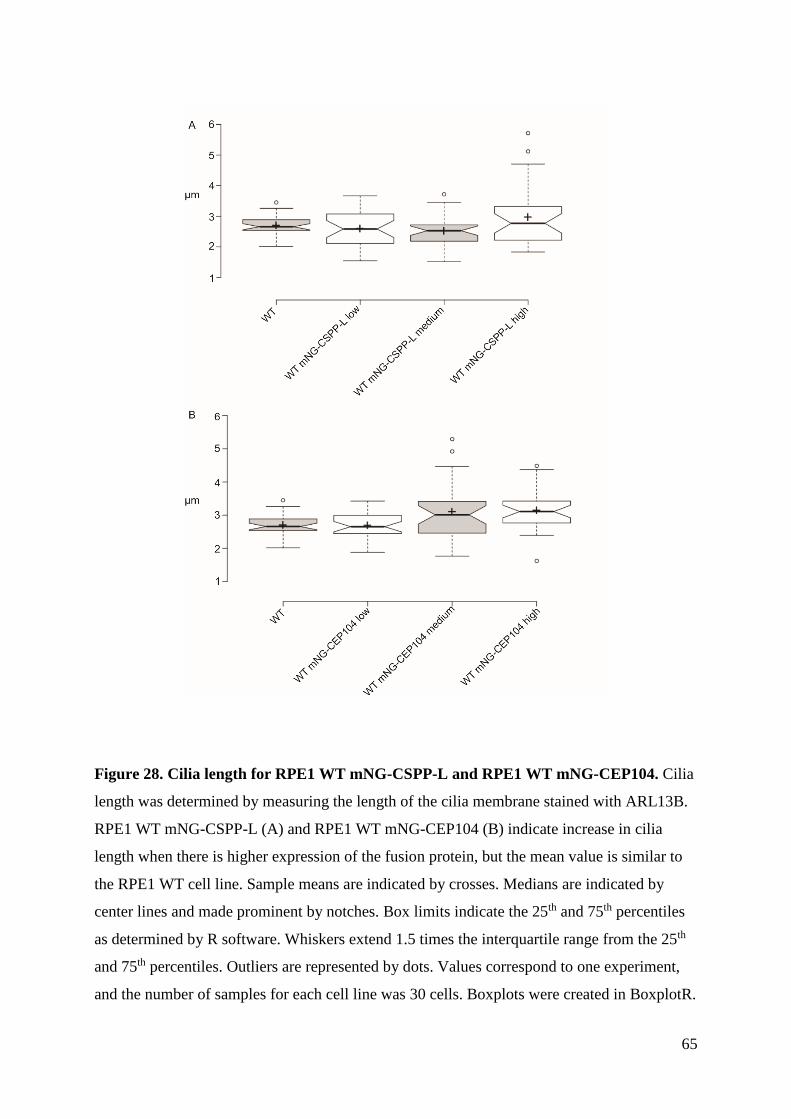
65
Figure 28. Cilia length for RPE1 WT mNG-CSPP-L and RPE1 WT mNG-CEP104. Cilia
length was determined by measuring the length of the cilia membrane stained with ARL13B.
RPE1 WT mNG-CSPP-L (A) and RPE1 WT mNG-CEP104 (B) indicate increase in cilia
length when there is higher expression of the fusion protein, but the mean value is similar to
the RPE1 WT cell line. Sample means are indicated by crosses. Medians are indicated by
center lines and made prominent by notches. Box limits indicate the 25th and 75th percentiles
as determined by R software. Whiskers extend 1.5 times the interquartile range from the 25th
and 75th percentiles. Outliers are represented by dots. Values correspond to one experiment,
and the number of samples for each cell line was 30 cells. Boxplots were created in BoxplotR.
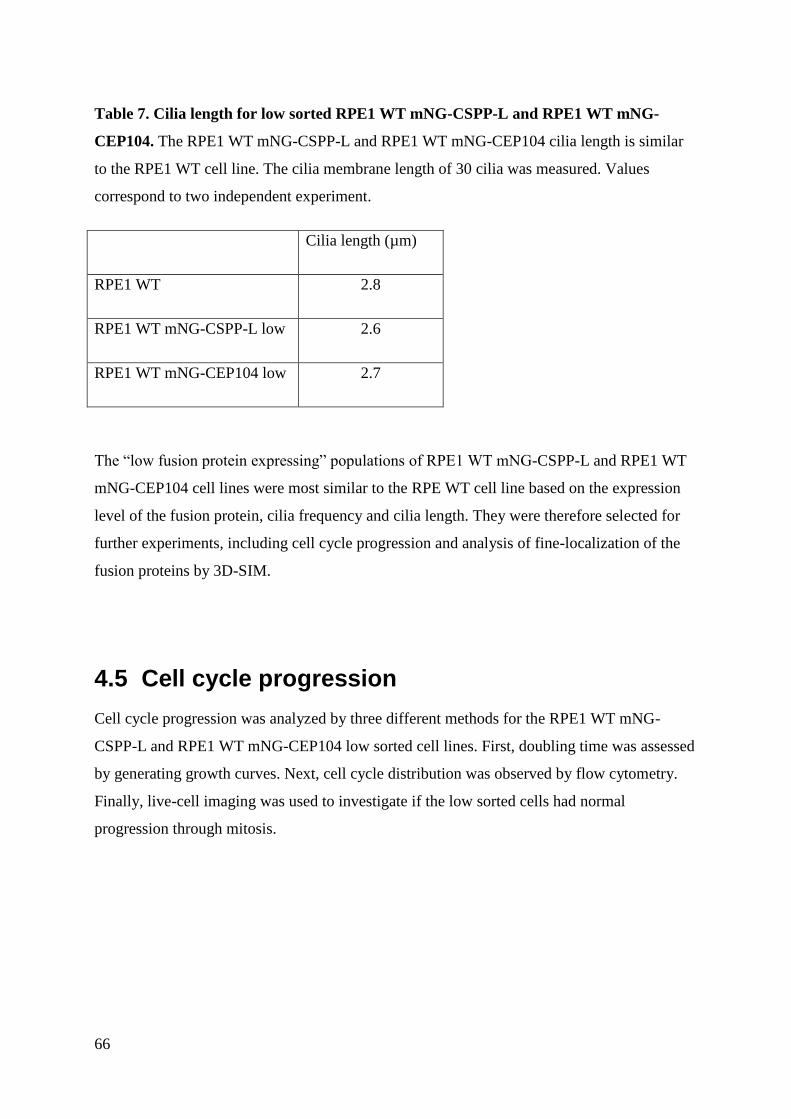
66
Table 7. Cilia length for low sorted RPE1 WT mNG-CSPP-L and RPE1 WT mNG-
CEP104. The RPE1 WT mNG-CSPP-L and RPE1 WT mNG-CEP104 cilia length is similar
to the RPE1 WT cell line. The cilia membrane length of 30 cilia was measured. Values
correspond to two independent experiment.
Cilia length (µm)
RPE1 WT 2.8
RPE1 WT mNG-CSPP-L low 2.6
RPE1 WT mNG-CEP104 low 2.7
The “low fusion protein expressing” populations of RPE1 WT mNG-CSPP-L and RPE1 WT
mNG-CEP104 cell lines were most similar to the RPE WT cell line based on the expression
level of the fusion protein, cilia frequency and cilia length. They were therefore selected for
further experiments, including cell cycle progression and analysis of fine-localization of the
fusion proteins by 3D-SIM.
4.5 Cell cycle progression
Cell cycle progression was analyzed by three different methods for the RPE1 WT mNG-
CSPP-L and RPE1 WT mNG-CEP104 low sorted cell lines. First, doubling time was assessed
by generating growth curves. Next, cell cycle distribution was observed by flow cytometry.
Finally, live-cell imaging was used to investigate if the low sorted cells had normal
progression through mitosis.
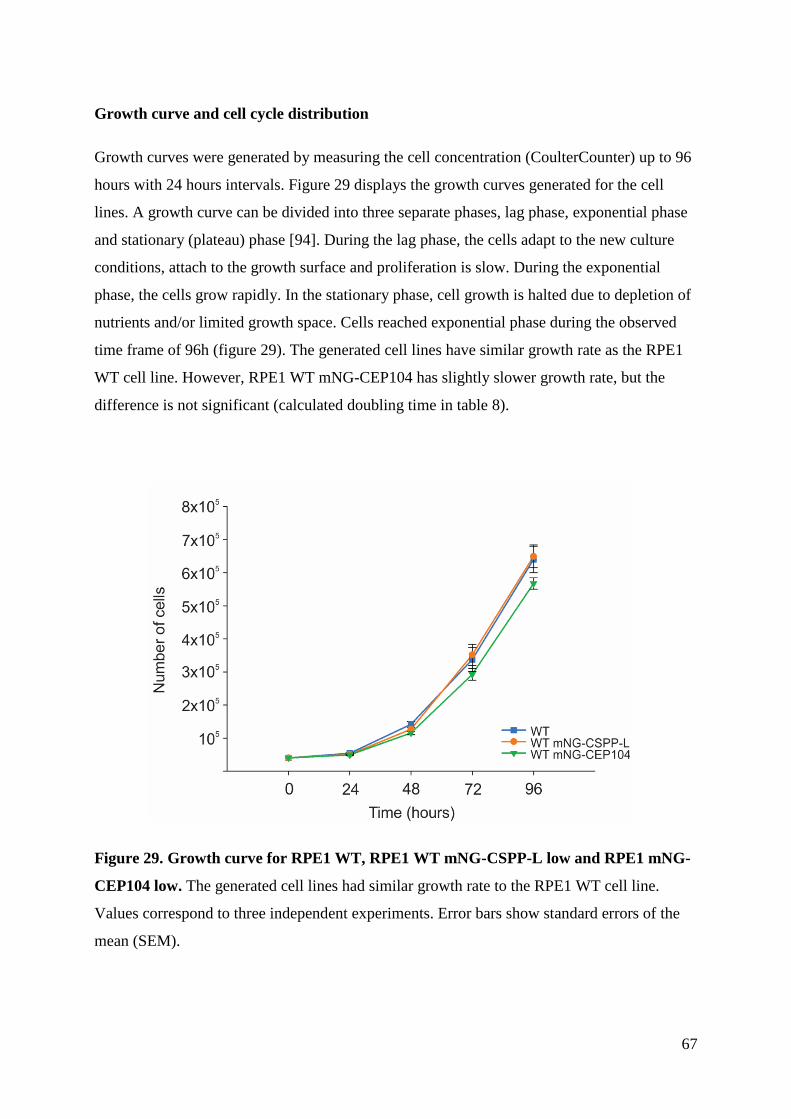
67
Growth curve and cell cycle distribution
Growth curves were generated by measuring the cell concentration (CoulterCounter) up to 96
hours with 24 hours intervals. Figure 29 displays the growth curves generated for the cell
lines. A growth curve can be divided into three separate phases, lag phase, exponential phase
and stationary (plateau) phase [94]. During the lag phase, the cells adapt to the new culture
conditions, attach to the growth surface and proliferation is slow. During the exponential
phase, the cells grow rapidly. In the stationary phase, cell growth is halted due to depletion of
nutrients and/or limited growth space. Cells reached exponential phase during the observed
time frame of 96h (figure 29). The generated cell lines have similar growth rate as the RPE1
WT cell line. However, RPE1 WT mNG-CEP104 has slightly slower growth rate, but the
difference is not significant (calculated doubling time in table 8).
Figure 29. Growth curve for RPE1 WT, RPE1 WT mNG-CSPP-L low and RPE1 mNG-
CEP104 low. The generated cell lines had similar growth rate to the RPE1 WT cell line.
Values correspond to three independent experiments. Error bars show standard errors of the
mean (SEM).
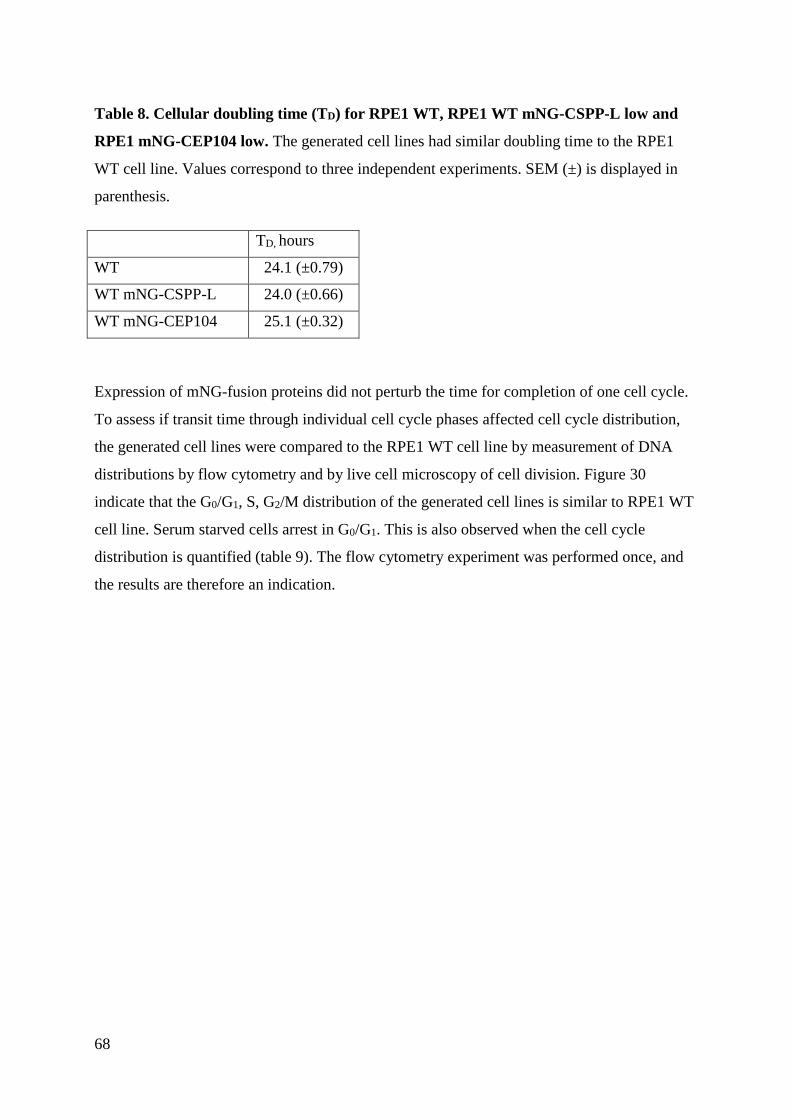
68
Table 8. Cellular doubling time (TD) for RPE1 WT, RPE1 WT mNG-CSPP-L low and
RPE1 mNG-CEP104 low. The generated cell lines had similar doubling time to the RPE1
WT cell line. Values correspond to three independent experiments. SEM (±) is displayed in
parenthesis.
TD, hours
WT 24.1 (±0.79)
WT mNG-CSPP-L 24.0 (±0.66)
WT mNG-CEP104 25.1 (±0.32)
Expression of mNG-fusion proteins did not perturb the time for completion of one cell cycle.
To assess if transit time through individual cell cycle phases affected cell cycle distribution,
the generated cell lines were compared to the RPE1 WT cell line by measurement of DNA
distributions by flow cytometry and by live cell microscopy of cell division. Figure 30
indicate that the G0/G1, S, G2/M distribution of the generated cell lines is similar to RPE1 WT
cell line. Serum starved cells arrest in G0/G1. This is also observed when the cell cycle
distribution is quantified (table 9). The flow cytometry experiment was performed once, and
the results are therefore an indication.
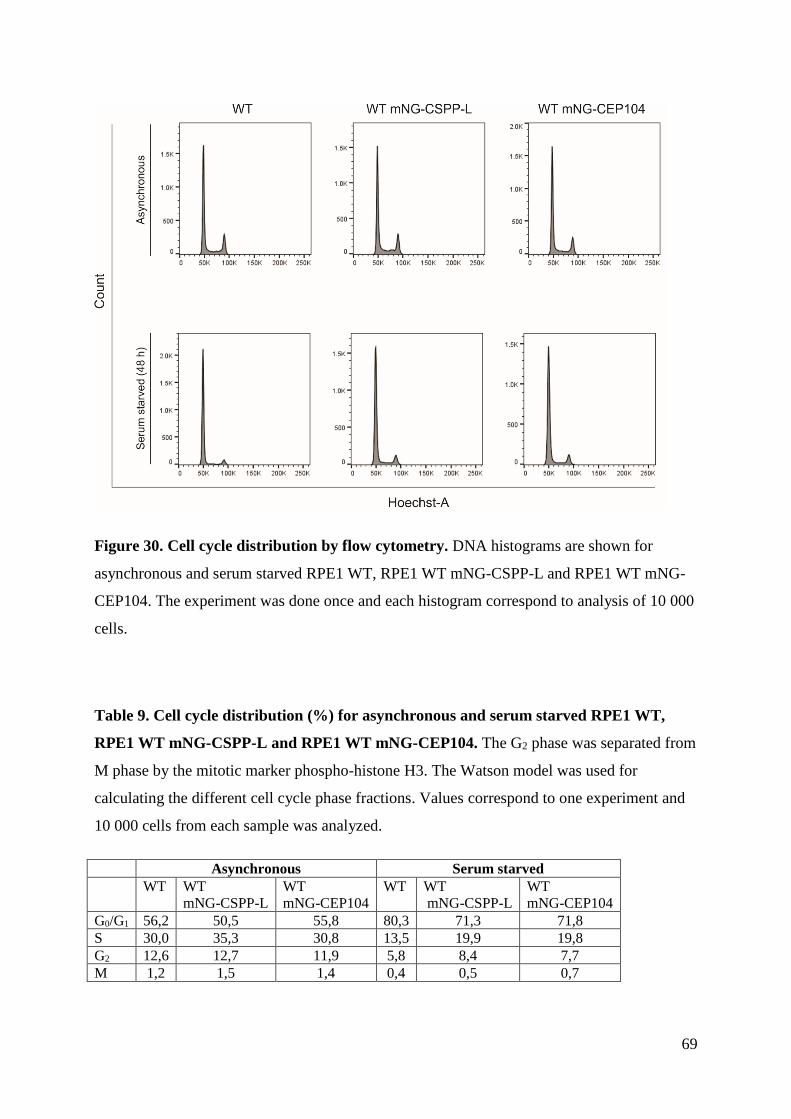
69
Figure 30. Cell cycle distribution by flow cytometry. DNA histograms are shown for
asynchronous and serum starved RPE1 WT, RPE1 WT mNG-CSPP-L and RPE1 WT mNG-
CEP104. The experiment was done once and each histogram correspond to analysis of 10 000
cells.
Table 9. Cell cycle distribution (%) for asynchronous and serum starved RPE1 WT,
RPE1 WT mNG-CSPP-L and RPE1 WT mNG-CEP104. The G2 phase was separated from
M phase by the mitotic marker phospho-histone H3. The Watson model was used for
calculating the different cell cycle phase fractions. Values correspond to one experiment and
10 000 cells from each sample was analyzed.
Asynchronous Serum starved
WT WT
mNG-CSPP-L
WT
mNG-CEP104
WT WT
mNG-CSPP-L
WT
mNG-CEP104
G0/G1 56,2 50,5 55,8 80,3 71,3 71,8
S 30,0 35,3 30,8 13,5 19,9 19,8
G2 12,6 12,7 11,9 5,8 8,4 7,7
M 1,2 1,5 1,4 0,4 0,5 0,7
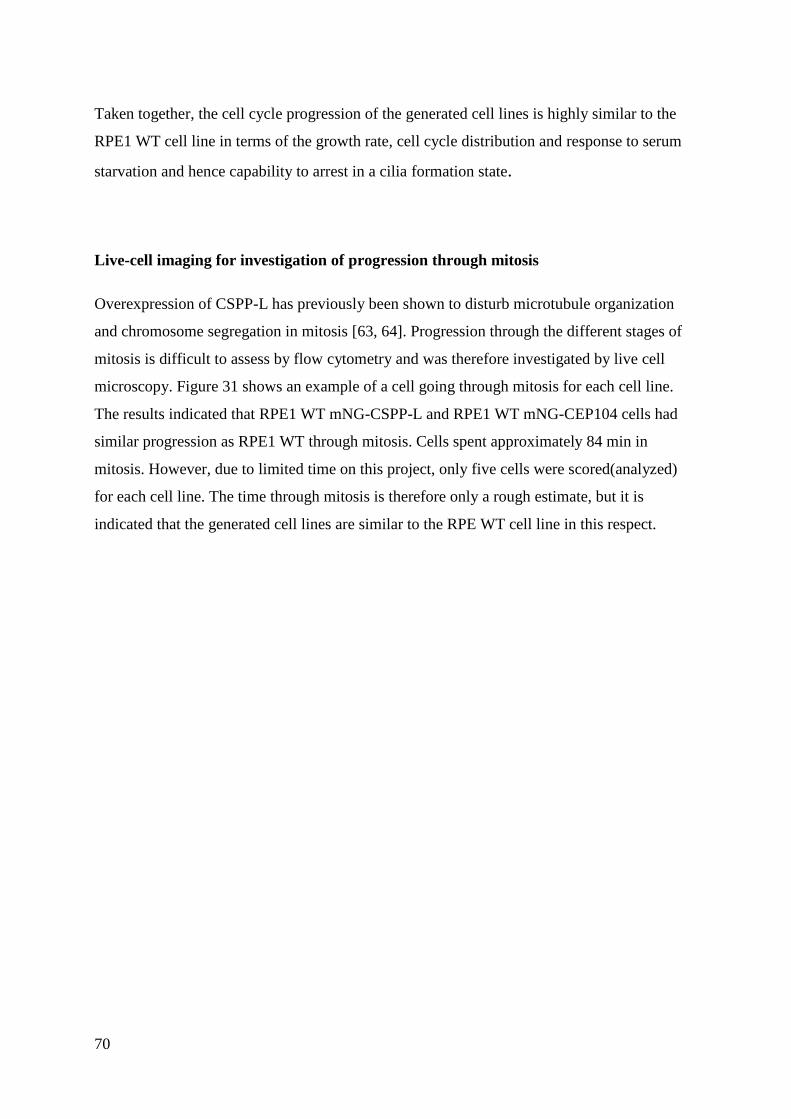
70
Taken together, the cell cycle progression of the generated cell lines is highly similar to the
RPE1 WT cell line in terms of the growth rate, cell cycle distribution and response to serum
starvation and hence capability to arrest in a cilia formation state.
Live-cell imaging for investigation of progression through mitosis
Overexpression of CSPP-L has previously been shown to disturb microtubule organization
and chromosome segregation in mitosis [63, 64]. Progression through the different stages of
mitosis is difficult to assess by flow cytometry and was therefore investigated by live cell
microscopy. Figure 31 shows an example of a cell going through mitosis for each cell line.
The results indicated that RPE1 WT mNG-CSPP-L and RPE1 WT mNG-CEP104 cells had
similar progression as RPE1 WT through mitosis. Cells spent approximately 84 min in
mitosis. However, due to limited time on this project, only five cells were scored(analyzed)
for each cell line. The time through mitosis is therefore only a rough estimate, but it is
indicated that the generated cell lines are similar to the RPE WT cell line in this respect.
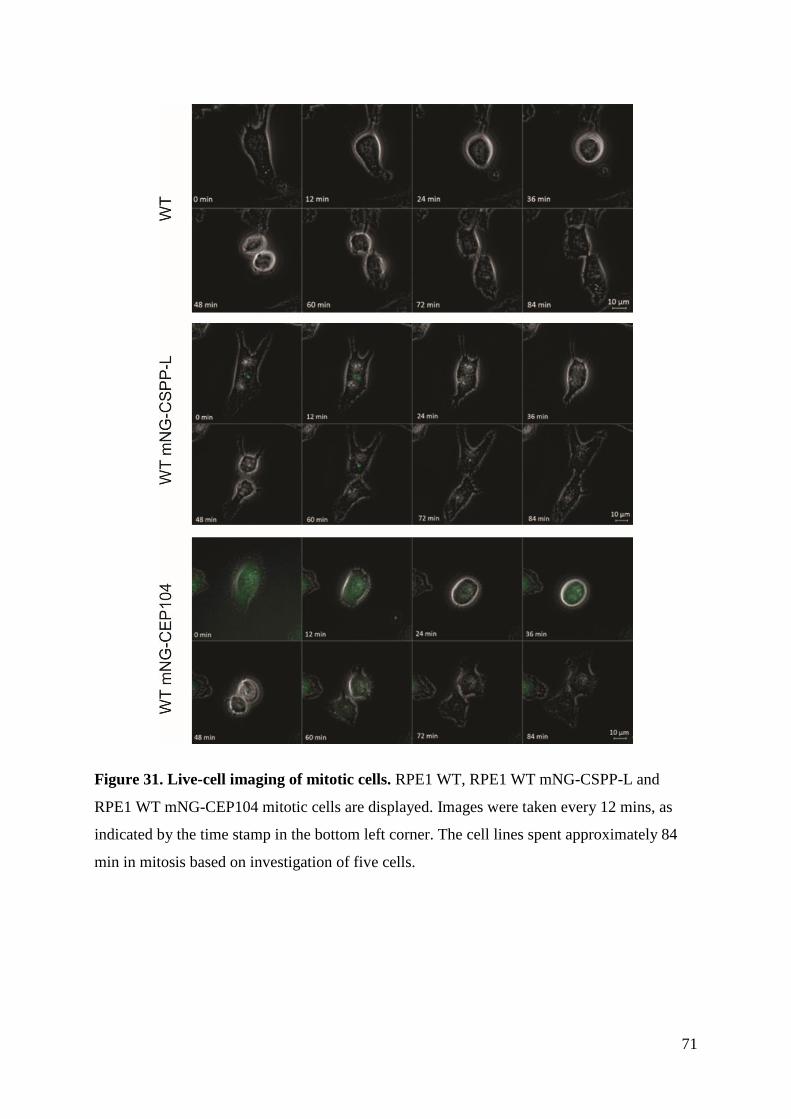
71
Figure 31. Live-cell imaging of mitotic cells. RPE1 WT, RPE1 WT mNG-CSPP-L and
RPE1 WT mNG-CEP104 mitotic cells are displayed. Images were taken every 12 mins, as
indicated by the time stamp in the bottom left corner. The cell lines spent approximately 84
min in mitosis based on investigation of five cells.
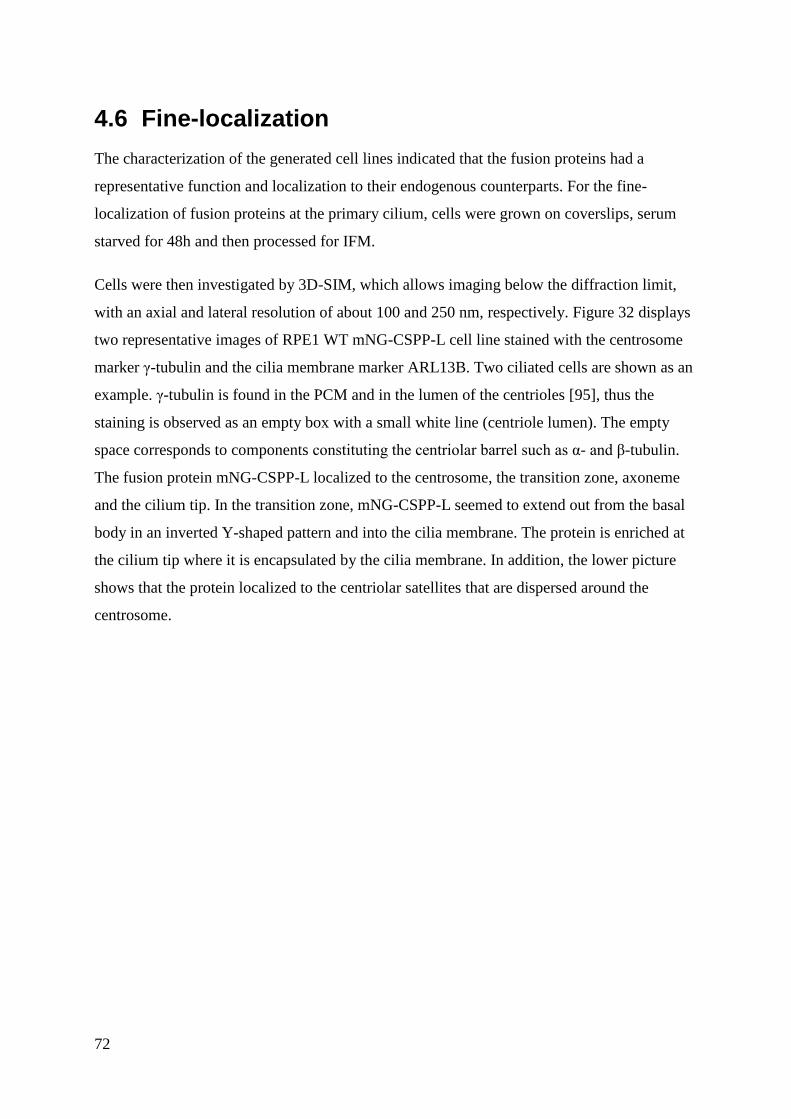
72
4.6 Fine-localization
The characterization of the generated cell lines indicated that the fusion proteins had a
representative function and localization to their endogenous counterparts. For the fine-
localization of fusion proteins at the primary cilium, cells were grown on coverslips, serum
starved for 48h and then processed for IFM.
Cells were then investigated by 3D-SIM, which allows imaging below the diffraction limit,
with an axial and lateral resolution of about 100 and 250 nm, respectively. Figure 32 displays
two representative images of RPE1 WT mNG-CSPP-L cell line stained with the centrosome
marker γ-tubulin and the cilia membrane marker ARL13B. Two ciliated cells are shown as an
example. γ-tubulin is found in the PCM and in the lumen of the centrioles [95], thus the
staining is observed as an empty box with a small white line (centriole lumen). The empty
space corresponds to components constituting the centriolar barrel such as α- and β-tubulin.
The fusion protein mNG-CSPP-L localized to the centrosome, the transition zone, axoneme
and the cilium tip. In the transition zone, mNG-CSPP-L seemed to extend out from the basal
body in an inverted Y-shaped pattern and into the cilia membrane. The protein is enriched at
the cilium tip where it is encapsulated by the cilia membrane. In addition, the lower picture
shows that the protein localized to the centriolar satellites that are dispersed around the
centrosome.
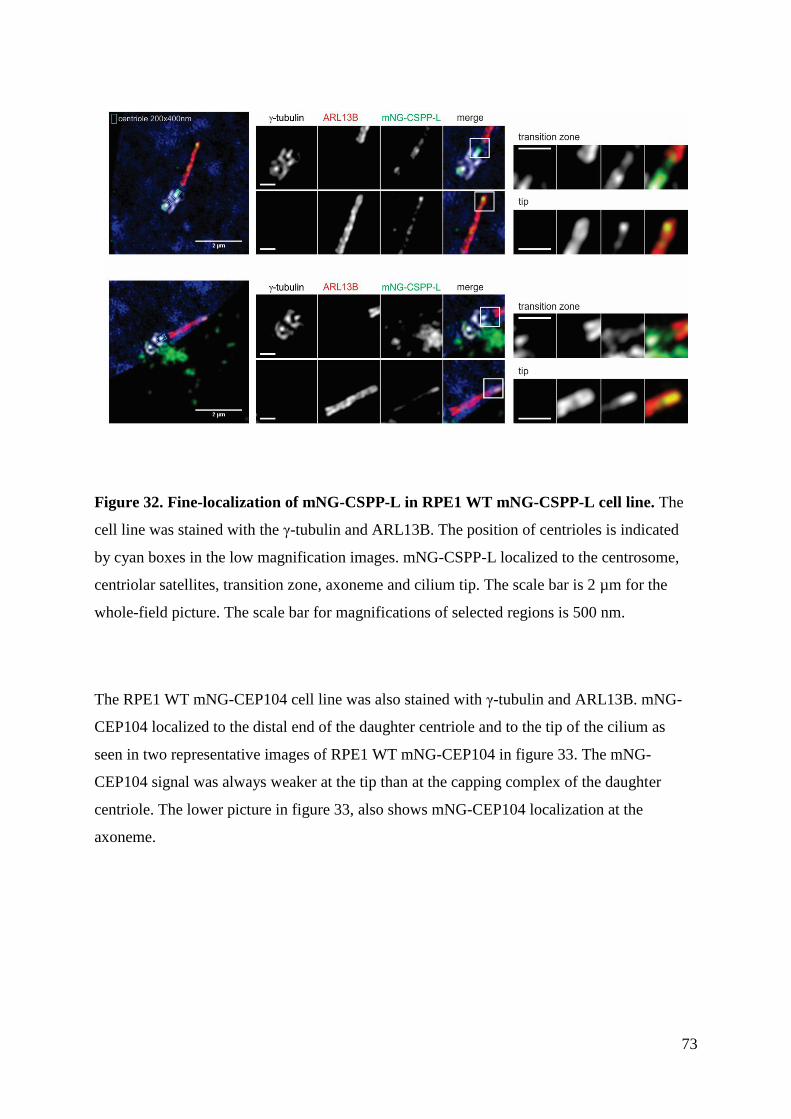
73
Figure 32. Fine-localization of mNG-CSPP-L in RPE1 WT mNG-CSPP-L cell line. The
cell line was stained with the γ-tubulin and ARL13B. The position of centrioles is indicated
by cyan boxes in the low magnification images. mNG-CSPP-L localized to the centrosome,
centriolar satellites, transition zone, axoneme and cilium tip. The scale bar is 2 µm for the
whole-field picture. The scale bar for magnifications of selected regions is 500 nm.
The RPE1 WT mNG-CEP104 cell line was also stained with γ-tubulin and ARL13B. mNG-
CEP104 localized to the distal end of the daughter centriole and to the tip of the cilium as
seen in two representative images of RPE1 WT mNG-CEP104 in figure 33. The mNG-
CEP104 signal was always weaker at the tip than at the capping complex of the daughter
centriole. The lower picture in figure 33, also shows mNG-CEP104 localization at the
axoneme.
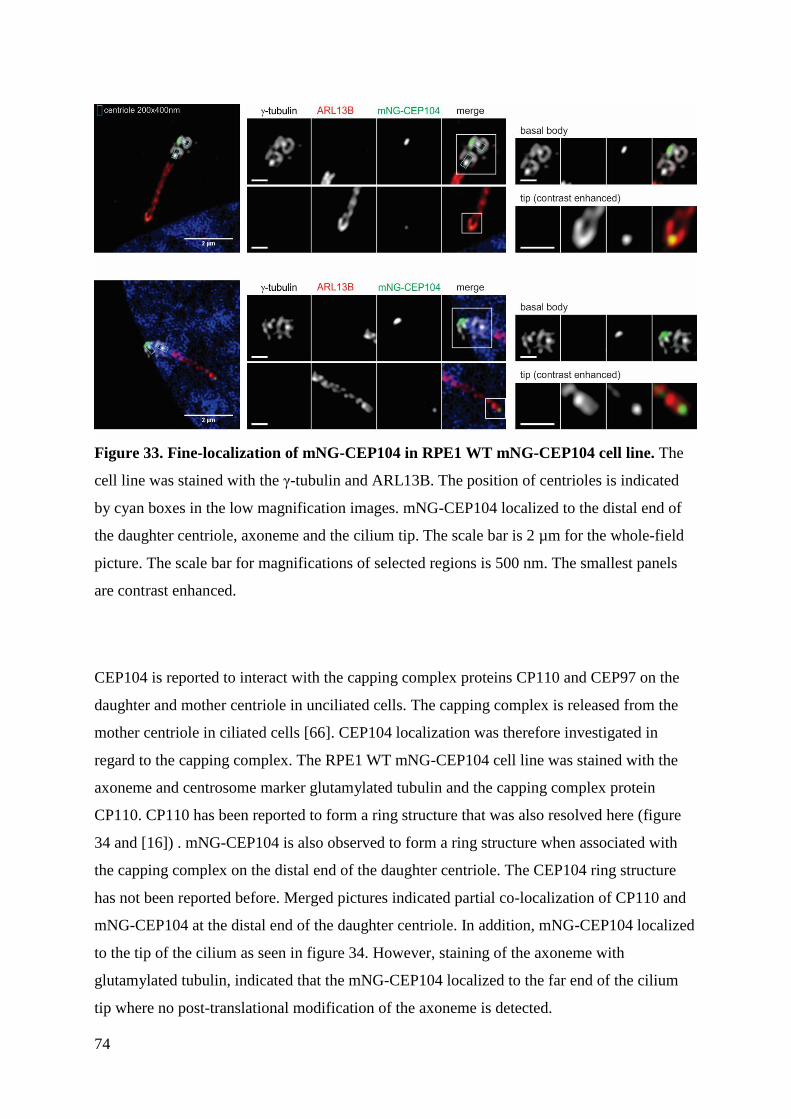
74
Figure 33. Fine-localization of mNG-CEP104 in RPE1 WT mNG-CEP104 cell line. The
cell line was stained with the γ-tubulin and ARL13B. The position of centrioles is indicated
by cyan boxes in the low magnification images. mNG-CEP104 localized to the distal end of
the daughter centriole, axoneme and the cilium tip. The scale bar is 2 µm for the whole-field
picture. The scale bar for magnifications of selected regions is 500 nm. The smallest panels
are contrast enhanced.
CEP104 is reported to interact with the capping complex proteins CP110 and CEP97 on the
daughter and mother centriole in unciliated cells. The capping complex is released from the
mother centriole in ciliated cells [66]. CEP104 localization was therefore investigated in
regard to the capping complex. The RPE1 WT mNG-CEP104 cell line was stained with the
axoneme and centrosome marker glutamylated tubulin and the capping complex protein
CP110. CP110 has been reported to form a ring structure that was also resolved here (figure
34 and [16]) . mNG-CEP104 is also observed to form a ring structure when associated with
the capping complex on the distal end of the daughter centriole. The CEP104 ring structure
has not been reported before. Merged pictures indicated partial co-localization of CP110 and
mNG-CEP104 at the distal end of the daughter centriole. In addition, mNG-CEP104 localized
to the tip of the cilium as seen in figure 34. However, staining of the axoneme with
glutamylated tubulin, indicated that the mNG-CEP104 localized to the far end of the cilium
tip where no post-translational modification of the axoneme is detected.
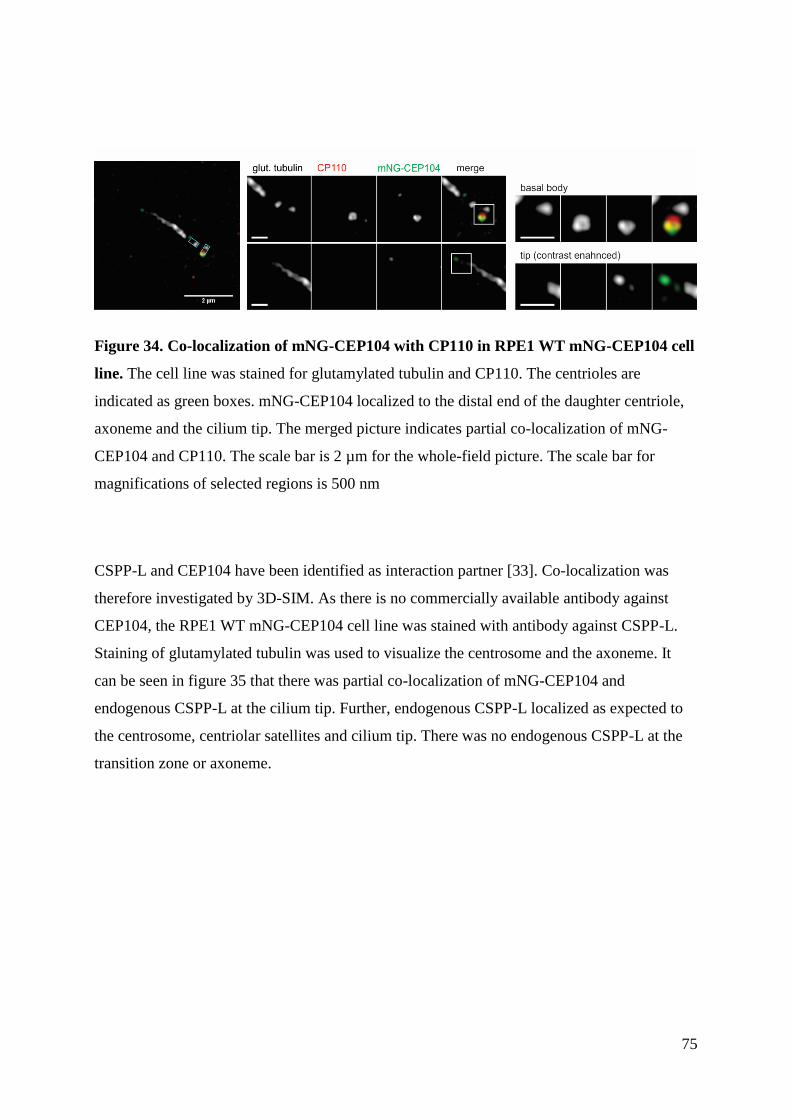
75
Figure 34. Co-localization of mNG-CEP104 with CP110 in RPE1 WT mNG-CEP104 cell
line. The cell line was stained for glutamylated tubulin and CP110. The centrioles are
indicated as green boxes. mNG-CEP104 localized to the distal end of the daughter centriole,
axoneme and the cilium tip. The merged picture indicates partial co-localization of mNG-
CEP104 and CP110. The scale bar is 2 µm for the whole-field picture. The scale bar for
magnifications of selected regions is 500 nm
CSPP-L and CEP104 have been identified as interaction partner [33]. Co-localization was
therefore investigated by 3D-SIM. As there is no commercially available antibody against
CEP104, the RPE1 WT mNG-CEP104 cell line was stained with antibody against CSPP-L.
Staining of glutamylated tubulin was used to visualize the centrosome and the axoneme. It
can be seen in figure 35 that there was partial co-localization of mNG-CEP104 and
endogenous CSPP-L at the cilium tip. Further, endogenous CSPP-L localized as expected to
the centrosome, centriolar satellites and cilium tip. There was no endogenous CSPP-L at the
transition zone or axoneme.
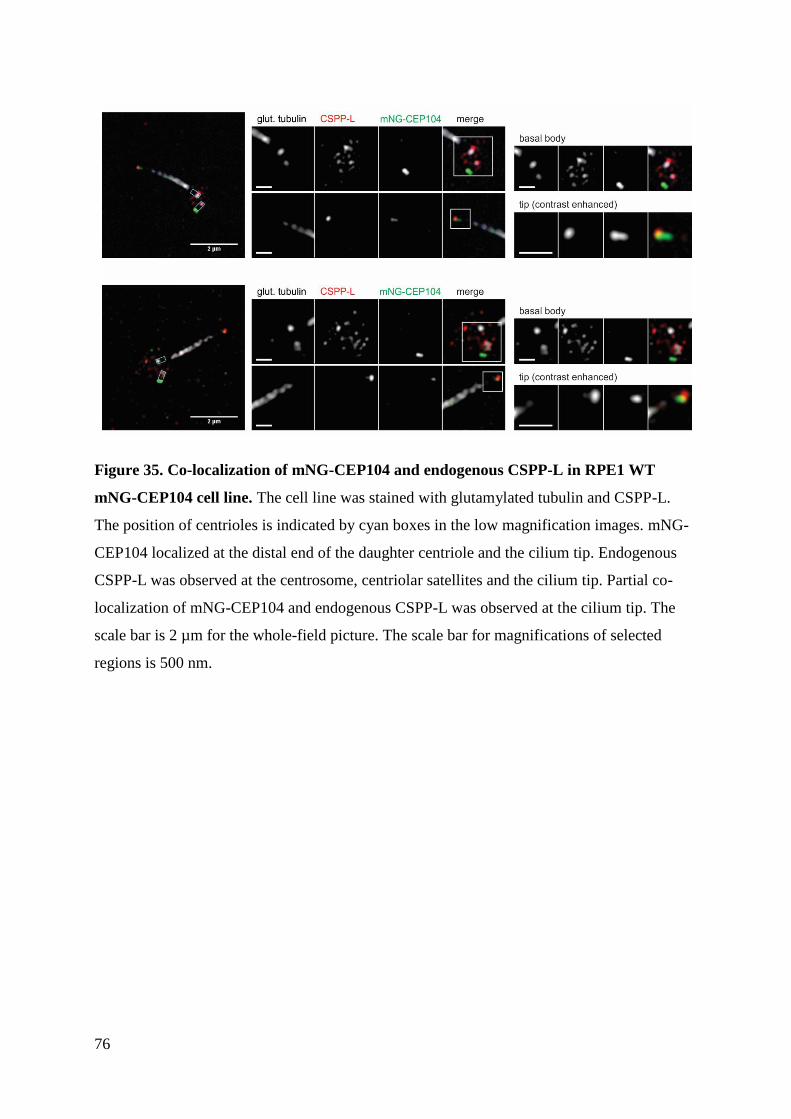
76
Figure 35. Co-localization of mNG-CEP104 and endogenous CSPP-L in RPE1 WT
mNG-CEP104 cell line. The cell line was stained with glutamylated tubulin and CSPP-L.
The position of centrioles is indicated by cyan boxes in the low magnification images. mNG-
CEP104 localized at the distal end of the daughter centriole and the cilium tip. Endogenous
CSPP-L was observed at the centrosome, centriolar satellites and the cilium tip. Partial co-
localization of mNG-CEP104 and endogenous CSPP-L was observed at the cilium tip. The
scale bar is 2 µm for the whole-field picture. The scale bar for magnifications of selected
regions is 500 nm.
77
5 Discussion
The primary cilium functions as a sensory platform implementing a variety of signaling
pathways, such as the Hh-pathway. The primary cilium is therefore a regulator of several
important biological processes, such as tissue homeostasis and embryonic development. The
organelle is compartmentalized, and its protein composition is distinct from the rest of the cell
body, which allows formation of a specialized signaling organelle. Aberrant function of
ciliary proteins may result in developmental diseases, termed ciliopathies. Joubert syndrome
(JBTS) is one such ciliopathy, with the majority of the JBTS proteins localizing to the
transition zone. CSPP-L and CEP104 are two JBTS proteins localized to the cilia tip. These
latter proteins are required for proper axoneme formation, but little is known about the
underlying molecular function(s) of these proteins, especially CEP104 [33]. Importantly, as of
now, there is no commercially available antibody for CEP104 that can be applied for
immunofluorescence microscopy. To overcome this problem, this project focused on
generating a stable RPE1 cell line with mNeonGreen tagged CEP104. A stable RPE1 cell line
with mNG-CSPP-L was also generated. The fine-localization of these proteins was
investigated by 3D-Structured Illumination Microscopy (3D-SIM).
5.1 Generation of stable cell lines
Transfer vectors for lentivirus particle production were produced by first generating a fusion
protein of mNG and desired protein (CEP104 ORF or CSPP-L ORF) and subsequently
cloning the fusion protein into the transfer vector of choice. Lentivirus particles were used to
transduce RPE1 cells. RPE1 cells are commonly used to study cilia biology, as they form the
organelle when depleted of serum. Moreover, the cell line has been used to describe CSPP-L
and CEP104 in previous studies [33, 61, 62]. Murine NIH3T3 and Madin Darby Canine
Kidney cell lines are other frequently used cell lines for study cilia biology in fibroblast and
epithelial cells, respectively. These were not considered in this study as they are of different
species, which would have required the cloning and characterization of CEP104 and CSPP-L
homologs, and eventually also required a different virus system.
78
The RPE1 cells were transduced with several different doses of lentivirus particles: 10 µl, 50
µl, 100 µl, 200 µl and 500 µl (of constant virus particle titer). The ratio between the number
of virus particles and target cells is referred to as multiplicity of infection (MOI) [96]. To
preferably achieve one integration event per cell, the MOI is selected as ≤ 1 [79, 97]. In our
experiments the RPE1 cells that were exposed to the lowest virus particle concentration were
likely to have satisfied this criterium. About 50 % cell death was observed in these wells
when initially selected with blasticidin. This is indicative for a lower virus to cell ratio and
consequently less probability of multiple integration events. However, occurrence of multiple
integration events cannot be excluded. In this project, MOI was not determined, but roughly
aimed for by transducing cells with limited amount of lentivirus supernatant.
The generated cell lines were sorted by fluorescence-activated cell sorting (FACS) since
initial observation with IFM showed a heterogenous expression level of the mNG-fusion
protein within the same population. Flow cytometry analysis indicated (figure 23) that the
cells could be divided into three subpopulations based on low, medium and high mNG
expression level. Sorting allows generation of subpopulations with a more homogenous fusion
gene expression level. Lentivirus integration occurs at different locations in the genome
within the same cell population. A polyclonal cell population is therefore produced. Varying
expression level of the fusion protein can be due to several factors. The cells in a population
can either have one integration event or multiple integration events if MOI is larger than 1
[98]. Availability of the promoter region may depend on the integration site of the virus, and
thus affect the expression level. Furthermore, expression of fusion gene can be low or high
based on selection of the promoter. Additionally, the transgene might be silenced by
methylation of the promoter driving the expression.
Generation of a monoclonal cell population can be advantageous, as a polyclonal cell
population may change transgene expression over time due to positive or negative selection
pressure exhibited by the fusion protein. Overexpression of the transgene can lead to reduced
growth rate, and cells with lower expression may eventually take over the polyclonal cell
population [98]. Moreover, overexpression can be toxic for the cell. A monoclonal cell
population can be generated by isolating single cells by limiting dilution or by sorting of
single cells into individual wells and then selecting the subsequent monoclonal cell
populations with desirable level of fusion protein expression [99]. This generates a
homogenous cell population with identical lentivirus integration site. However, in this project,
79
polyclonal cell populations of RPE1 WT mNG-CSPP-L and RPE1 WT mNG-CEP104 were
used. Due to limited time on the project, generation of monoclonal populations was not
prioritized.
In addition to confirming expression of the fusion proteins with expected size in RPE1 WT
mNG-CSPP-L and RPE1 WT mNG-CEP104, western blotting also revealed that the
expression levels of the fusion proteins were higher than that of the endogenous proteins. The
EF-1α promoter was selected for expression of the fusion proteins. This promoter was chosen
because it has low constitutive expression and is more robust against methylation driven
silencing than for example the cytomegalovirus (CMV) promoter [81]. CMV is a frequently
used promoter for overexpression of proteins. Further, the CMV promoter is often silenced by
methylation, leading to loss of transgene expression [81]. In contrast, EF-1α promoter results
in lower expression of the transgene and is reported to be silenced less frequently. The EF-1α
promoter was therefore regarded as a suitable candidate for this project.
The overexpressed fusion proteins localized as expected (figure 26). Investigation of the
effect of overexpression by analysis of cilia formation indicated lower cilia frequency and
longer cilia length with increasing mNG-CSPP-L and mNG-CEP104 expression level (figure
27 and figure 28). Further, analysis of cell cycle progression in “low”-expression level
populations indicated that the generated cell lines had similar growth rate (figure 29), cell
cycle distribution (figure 30) and sensitivity to serum starvation as the RPE1 WT cell line.
Taken together, the correct localization, ability to form cilia and unperturbed cell cycle
progression, indicate that the EF-1α driven expression of the fusion protein was tolerated
well. Other promoters can also be tested to try to achieve fusion protein expression closer to
endogenous level. However, if the expression level is too weak, the fusion protein may not be
detectable by fluorescence microscopy. However, one future candidate might be the
phosphoglycerate kinase (PGK) promoter. Alike the EF-1α promoter, PGK is reported to give
low constitutive expression and is less frequently silenced than the CMV promoter [100]. The
selected Gateway based cloning system for generation of lentivirus particles comprises
suitable destination vectors with respective low expression promoters, which will allow the
generation of such constructs. Knock-in of mNG into CEP104 or CSPP1 alleles was not
considered, as in the case of CEP104 signal intensities/expression levels are too weak to allow
time resolved imaging (Anna Akhmanova, Utrecht University, personal communication).
80
Generation of stable mNG-CSPP-L and mNG-CEP104 cell lines allow long-term expression
of the proteins as the corresponding genes are integrated into the genome of the cell. In
contrast, transient transfection produces short-term expression of the protein by introducing
nucleic acids temporarily to the target cells [101]. Transient transfection with a fluorescent
tagged CEP104 and/or CSPP-L have been previously tried in the research group. Figure 9
displays a transient transfection with GFP-CSPP-L (GLAP3-CSPP-L) and mCherry-CEP104
with lipofectamine transfection [33]. However, several factors render transient transfection
unsuitable for investigation of desired proteins. There is little control over the experiment and
the gene dosage. Frikstad and colleagues observed that the cell population had a varying level
of protein expression; either overexpression, too low expression or expression of only one
protein when co-transfecting with two proteins. The transfection method also introduces lipids
to the cell membrane which can be stressful for the cells and may result in increased cell
death, particularly relevant in live cell microscopy settings where light induced cell stress is
also induced. Further, overexpression of CSPP-L has been shown to perturb microtubule
organization, and it could thereby influence ciliogenesis [63, 64]. Transient transfection in
figure 9 indicate, but not undoubtedly support the notion of co-localization of CSPP-L and
CEP104 at the cilia tip. In contrast, generation of stable cells lines with lentivirus particles
allows for better control of the experiment since more homogeneous gene expression between
the cells can be achieved by fluorescence-activated cell sorting or generation of monoclonal
populations. Stable cell lines with mNG-CSPP-L and mNG-CEP104 expression may thus be
better suited for functional and descriptive studies than transiently transfected cells.
5.2 Consequences of viral expression
The western blots (figure 24 and figure 25) showed that mNG-CSPP-L and mNG-CEP104
were expressed at higher levels than the endogenous proteins. Potential consequences of
overexpression were assessed by analysis of cilia formation and cell cycle progression, in
addition to localization analysis of the fusion proteins.
Overexpression did not affect the presumably correct localization of mNG-CSPP-L. The
fusion protein localized to centriolar satellites, the centrosome, transition zone, axoneme and
the cilium tip as reported before for endogenous CSPP-L (figure 26B) [61, 63]. In ciliated
81
cells, mNG-CEP104 decorated the daughter centriole and the cilium tip as reported for
endogenous CEP104 (figure 26A) [62]. In addition, mNG-CEP104 was observed along the
axoneme in some cells. As of now, CEP104 has not been reported in the literature to localize
to the axoneme. The axoneme localization might therefore be an artifact due to
overexpression of mNG-CEP104 (section 5.3).
Analysis of cilia formation by investigating cilia frequency and cilia length, indicated that the
cilia frequency decreased and the cilia length increased with higher fusion protein expression
levels (figure 27 and figure 28). Overexpression of the fusion proteins may have an inhibitory
effect on cilia formation, but a significant fraction of cells have the capability of forming a
cilium. The average RPE1 WT cilia length was approximately 2.7 µm (figure 28). The
measured length is in concordance with previously reported RPE1 WT cilia length, such as in
the referred study where the length was reported to be approximately 2.4 µm [61]. The
average length was approximately 2.6 µm and 2.7 µm for the low sorted RPE1 WT mNG-
CSPP-L and RPE1 WT mNG-CEP104 cell lines, respectively. The cilia length of low sorted
cell lines was thus comparable to the RPE WT cell line. The expression levels and cilia
frequencies of low sorted cell lines were more similar to RPE1 WT cells than the medium and
high sorted cells. Hence, the low sorted RPE1 WT mNG-CSPP-L and RPE1 WT mNG-
CEP104 cell lines were selected for further experiments.
Analysis of cell cycle progression for the low sorted cell lines showed that they had similar
growth rate and doubling time (figure 29 and table 8), cell cycle distribution (figure 30 and
table 9) and sensitivity to serum starvation as the RPE1 WT cell line. Progression through
mitosis was investigated by live-cell microscopy as overexpression of CSPP-L is reported to
perturb microtubule organization in mitosis [63, 64]. The live-cell imaging indicated that the
expression of the fusion proteins in the transgenic cell lines did not impair the progression
through mitosis.
Investigation of cell cycle distribution is based on a single experiment. The western blot, for
estimation of expression level of the fusion proteins, was also performed once. In addition,
progression through mitosis was measured for only five cells per cell line. Unfortunately, due
to the time aspect of the project, experiments could not be repeated. Ideally, experiments
should have at least three biological replicates for verification of results. The subsequent
statistical analysis allows for interpretation of results with higher confidence. However, the
single experiments suggest that the generated cell lines overexpress the fusion proteins but
82
have normal cell cycle distribution, sensitivity to serum starvation and progression through
mitosis. Thereby, indicating that the generated cell lines could be used for investigation of
fine-localization by 3D-Structured Illumination Microscopy (3D-SIM).
5.3 Fine-localization by microscopy
The primary cilium is a small organelle and investigation by diffraction-limited microscopy is
not sufficient for resolving its fine-structure. The centrosome, which forms the cilium, is
approximately 200 nm in diameter and 400 nm in length [16]. The cilium diameter is
approximately 200 nm. Investigation of the primary cilium ideally requires super-resolution to
bypass the diffraction limit. In this project, 3D-SIM was used to investigate the fine-
localization of mNG-CSPP-L and mNG-CEP104. The method improves the resolution about
2-fold in each dimension compared to a conventional fluorescent microscope, lateral to
approximately 100 nm and axial to approximately 250 nm [90]. 3D-SIM significantly
improves the ability to investigate the fine-localization of ciliary proteins.
Investigation of localization may reveal important information for understanding the protein
function and mapping of potential interaction partners. Localization may also indicate
potential association with different ciliopathies, such as in Joubert syndrome, where the
majority of proteins localize to the transition zone. For instance, CSPP-L was first identified
as a centrosomal protein, but later observation of the protein at the cilium suggested
additional ciliary functions [61, 63]. Further, CSPP-L localization to and interaction with the
ciliopathy protein RPGRIP1L at the transition zone posed the question as to whether CSPP-L
(CSPP1) is involved in human ciliopathies [61]. This was later shown to be the case as
CSPP1 germline mutations were found in patients with Joubert syndrome [3, 4, 6].
High-resolution microscopy showed that mNG-CSPP-L localized to centriolar satellites and
the centrosome by simultaneous staining for the centrosome marker γ-tubulin and cilia
membrane marker ARL13B (figure 32). Further, the γ-tubulin staining of the lumen of the
centrioles indicated that mNG-CSPP-L extends from the lumen of the mother centriole into
the cilia compartment where it decorates the axoneme and cilium tip. This localization is in
concordance with the one observed by conventional IFM in figure 26, and previously
published studies of endogenous CSPP-L [61, 63]. The magnified regions of the transition
83
zone in figure 32 revealed that mNG-CSPP-L extended from the mother centriole (lumen
labeled by γ-tubulin) into the cilia compartment in an inverted Y-shaped pattern. The Y-
shaped pattern is not detectable by conventional IFM, and it has not been reported before.
This pattern is consistent with the hypothesis of CSPP-L being associated with axonemal
MTs, which are the extensions of the A and B tubules of the mother centriole. The Y-shape
might indicate the narrowing diameter of the nine doublets geometry and may be tested by
Correlative light-electron microscopy.
CSPP-L localizes to centriolar satellites, the centrosome and the cilium. Accordingly, several
interaction partners of known centrosomal/ciliary function have been identified for CSPP-L
such as PCM1, CEP290, UBR5 (ubiquitin protein ligase E3 component N-recognin 5) and
Nephrocystin 8 (NPHP8/RPGRIP1L) [61, 102], indicating the existence of distinct CSPP-L
sub-complexes. CSPP-L is believed to be targeted to centriolar satellites by modification by
UBR5 [102], where it interacts with the centriolar satellite associated proteins PCM1 and
CEP290. Further, at the transition zone, the protein interacts with and stabilizes NPHP8 which
is implicated in recruitment or maintenance of the cilium [61]. CSPP-L is involved in cilia
formation, as knockdown of the protein results in stunted or absent cilium [33, 61]. Most
recently, the MT tip protein CEP104 was shown to interact with CSPP-L [33], and their intra-
ciliary interaction is suggested to promote axonemal length regulation and ciliary
accumulation of Smoothend (SMO) upon Hedgehog pathway stimulation [33].
The localization pattern of mNG-CEP104 resembled the reported pattern of endogenous
CEP104 [62]. 3D-SIM refined the localization of mNG-CEP104 to the distal end of the
daughter centriole and the tip of the cilium (figure 33). CEP104 localization was investigated
in regard to the capping complex of the mother and daughter centriole. The capping complex
proteins, CP110 and CEP97, inhibit centriolar elongation and cilia formation from the mother
centriole [40]. CEP104 has been identified as interaction partner of CP110 and CEP97 [66,
68]. In unciliated cells, CEP104 co-localize with the capping complex at the distal end of both
mother and daughter centriole. However, upon cilia formation, the capping complex and
CEP104 are removed from the mother centriole. In agreement with published studies, partial
co-localization of mNG-CEP104 and CP110 was observed at the distal end of the daughter
centriole of ciliated cells (figure 34). Our 3D-SIM experiments revealed for the first time that
(mNG-) CEP104 forms a ring structure when associated with the capping complex at the
centrioles, which partially overlaps with the ring structure formed by CP110 [16]. In
84
unciliated cells (data not included), mNG-CEP104 localized to both the mother and daughter
centriole. Further, mNG-CEP104 also localized to the cilium tip. Notably, the tip signal was
always weaker than the signal at the daughter centriole, which may indicate a significantly
lower concentration of mNG-CEP104 at the axoneme tip than at the distal end of daughter
centriole.
Partial co-localization between mNG-CEP104 and endogenous CSPP-L was observed at the
cilium tip (figure 35). These results strongly support the idea that an intra-ciliary functional
complex of CSPP-L and CEP104 is formed at the tip. If the project was not time-restricted,
co-immunoprecipitation could also have been used as a complementary method to determine
the presence of mNG-CSPP-L x CEP104 and mNG-CEP104 x CSPP-L complexes,
respectively. A previous master student in the group generated RPE1 CSPP1 knock out and
RPE1 CEP104hypomorph cell lines, respectively [33]. Transduction of these cell lines with
the mNG-CEP104 or mNG-CSPP-L lentivirus generated in this thesis now allows for the
study of their interdependence for ciliary localization. We found ciliary localization to be
independent of each other (appendix figure A5 ), further strengthening the notion that both
proteins have to form an intraciliary complex to promote formation of cilia axonemes of
normal length [33].
The tip of the cilium is the site for axonemal microtubule maintenance, the switch between
anterograde and retrograde cargo transported by IFT-B and IFT-A occurs here and proteins
involved in signaling pathways are accumulated at the tip [45]. For instance, the GLI
transcription factors, involved in Hh-signaling, are accumulated at the ciliary tip. Structural
defects in the ciliary tip might disrupt the function of the cilium. The interaction of CEP104
and CSPP-L at the cilium tip is important for correct axonemal length regulation as loss of
one or both of them result in stunted or absent cilium [33]. Further, intra-ciliary interaction is
necessary for Hh-signaling [33]. As of now, SUFU, CEP104, CSPP-L, KIF7 and KIAA0556
are the only five ciliary tip proteins mutated in Joubert syndrome (table 1) and linked to the
Hh-pathway. In contrast to CEP104 and CSPP-L, cells depleted of KIF7 and KIAA0556
display longer axonemal length [59, 60]. CEP104 and CSPP-L may be positive regulators of
axonemal length, thereby opposing Kif7 and KIAA0556 in MT regulation. These proteins
may assist in shaping the ciliary tip and thereby forming a functional cilium.
85
5.3.1 Methodological considerations of localization analysis
The localization of endogenous CSPP-L is not always consistent with the localization of the
mNG-tagged protein as observed by immunofluorescence microscopy. Detection of the
protein of interest by fluorescence microscopy can depend on several factors such as the
fixation method, permeabilization and antibody. Immunofluorescence microscopy requires
fixation of the sample to preserve the cellular structure and permeabilization to facilitate
antibody penetration into the cell. Cross-linking reagents such as paraformaldehyde (PFA) or
dehydrating agents such as methanol are used for fixation. Generally, cross-linking reagents
give a higher degree of preservation of the cellular structure than dehydrating agents which
can lead to extraction of proteins and collapse of organelles. The selected fixation method can
affect detection of ciliary proteins [103]. For instance, PFA fixation is better suited for
immunolabeling of cilia membrane proteins (AC3 and ARL13B) than for axonemal proteins
(CSPP1 and IFT20) which benefit from a cytoskeletal buffer (stabilizes the cytoskeleton)
wash prior to the fixation [103]. Axonemal staining of CSPP-L is not always resolved (as in
figure 35), because it can be fixation condition dependent [61, 103]. Ideally, the
immunostaining method needs to be optimized for the protein of interest and the cell line. In
this project, cells were fixated with 1.4 % PFA followed by post-fixation in ice-cold
methanol.
The recognition and binding of the epitope by an antibody can also be influenced by a variety
of factors such as conformational changes of the protein leading to epitope masking, post-
translational modifications, and steric hindrance by adjacent proteins due to protein cross-
linking during fixation. Further, insufficient permeabilization can affect the degree of staining
by antibody and subsequent detection of protein of interest. The antibody used can be a
defining factor for the observed protein localization. CSPP was first observed at the centrioles
and the lower axoneme by a monoclonal antibody [61]. However, staining with a polyclonal
antibody against CSPP-L showed that the protein also localizes along the upper axoneme, the
tip and to the centriolar satellites around the centrosome. Generation of stable cell lines with
fluorescently tagged proteins allow investigation of protein localization independent of
antibody staining. RPE1 WT mNG-CSPP-L was stained with antibodies to CSPP-L and
glutamylated tubulin for IFM. Comparison of the endogenous CSPP-L and mNG-CSPP-L
localization revealed that the CSPP-L antibody did not stain the transition zone which might
be due to accessibility of the epitope (appendix figure A6). In contrast, the fusion protein
86
display distinct localization to the transition zone. However, it is of importance to consider
potential mis-localization of the fusion protein due to overexpression. The observed mNG-
CSPP-L localization to the transition zone is in agreement with reported endogenous
localization. On the other hand, mNG-CEP104 localized to the axoneme in some cells, which
has not been reported before (figure 33). Whether this is an artifact due to overexpression or
reminiscent of endogenous CEP104 localization is yet to be determined. As of now,
endogenous CEP104 cannot be investigated by IFM due to lack of an appropriate antibody.
Generation of stable cell lines with expression of mNG-CEP104 and mNG-CSPP-L facilitates
live-cell imaging of the proteins. A major advantage of live-cell microscopy is that cells are
not fixed and stained with antibody, hence overcoming detection of fixation- and antibody-
dependent limitations and/or aberrations and eliminating potential nonspecific labeling.
However, the advantage of immunobased techniques is the detection of endogenous protein.
Though fusion proteins are similarly genetically encoded, their overexpression can lead to
protein behavior not necessarily resembling the endogenous protein. This is particularly
important when studying protein dynamics in living cells.
One motivation behind generation of the stable cell lines is future investigations of mNG-
CSPP-L and CEP104 mobility. Intraflagellar transport (IFT) is required for growth and
maintenance of the axoneme. The cilium is dependent on transport of proteins from the
cytoplasm. The IFT-B complex, with the motor protein kinesin-2, transports cargo to the tip
of the cilium. Conversely, the IFT-A complex, with the motor protein dynein-2, transports
cargo from the tip to the base of the cilium. Investigation of mNG-CSPP-L and CEP104 in
regard to IFT and mobility can be achieved by the generated cell lines. The mNG fluorescent
tag is very bright and more photostable than GFP [69]. Consequently, the cells can be
followed for a longer time to observe protein dynamics.
87
6 Conclusion
In the present study, RPE1 cell lines were successfully generated that stably express
mNeonGreen-fusion proteins of CSPP-L and CEP104, respectively, closely resembling the
localization pattern of their endogenous counterparts and neither perturbing cell cycle
progression nor cilia formation. To that end, plasmids were designed and constructed for
lentivirus particle production and subsequent transduction. FACS allowed isolation of
subpopulations of similar fusion protein expression levels. The “low”-expression level
populations were most similar to the RPE1 WT cell line with respect to cell cycle progression
and cilia formation. The “low”-expression level populations were used for investigation of
fine-localization of mNG-CSPP-L and mNG-CEP104 by 3D-Structured Illumination
Microscopy.
Investigation of the fine-localization of mNG-CSPP-L showed localization to the centriolar
satellites, centrosome, transition zone, axoneme and the cilium tip. The mNG-CSPP-L
localization extended from the mother centriole through the TZ into the cilia compartment in
an inverted Y-shaped pattern. The Y-shaped pattern has not been reported before, likely due
to inaccessibility of the antigen in this protein dense region, impeding immunodetection.
In ciliated cells, mNG-CEP104 localized at the distal end of the daughter centriole and at the
cilium tip. Partial co-localization of mNG-CEP104 and the capping complex protein CP110
was observed at the distal end of the centrioles. It was revealed that mNG-CEP104 forms a
ring structure when associated with the capping complex. Formation of a ring structure by
CEP104 has not been reported before. Further, partial co-localization of mNG-CEP104 and
endogenous CSPP-L was observed at the cilium tip.
Taken together, this work establishes lentiviral-driven expression of mNeonGreen-fusion
proteins with centrosomal/ciliary proteins as a suitable technique to study their function at
high temporal and spatial resolution. In case of CSPP-L and in particular CEP104 the 3D-
SIM revealed structural organization and localization at unprecedented detail. Importantly, the
RPE1 WT mNG-CEP104 cell line resolved the limitation of unavailability of specific IFM
compatible antibodies, and thus contributes significantly to the understanding of the ciliary
complex of CSPP-L and CEP104 and will allow the study of their putative dynamic behavior
in this tiny but mighty organelle.
88
7 Future perspectives
Cell lines generated in this thesis are suitable for advanced fluorescence live cell microscopy
techniques, such as Fluorescence Recovery After Photobleaching (FRAP) and kinetic
analyses of potential motor protein associated transport. In the case of CSPP-L cilia are easily
recognized, while definite tip localization of CEP104 would require an additional live cell
marker for the primary cilium. This marker would not only allow for verification and
confident determination of protein localization in the cell but also serve as an interesting
comparison/control for cilia integrity in photobleaching experiments. Indeed, a transfer vector
with mCherry-Rab8a (cilia membrane marker) has already been generated for lentivirus
particle production and transduction of RPE1 WT mNG-CSPP-L and RPE1 WT mNG-
CEP104 in the near future (appendix figure A9). Furthermore, initial photobleaching
experiments without a cilia marker have already been successfully completed, indicating
feasibility of the approach. In addition, a transfer vector with mCherry-CEP104 has been
constructed for lentivirus particle production (appendix figure A9). Hence, transduction of
RPE1 WT mNG-CSPP-L with these virus particles will allow for live cell analysis of co-
localization of mNG-CSPP-L and mCherry-CEP104.
In addition to mNG-CSPP-L and mNG-CEP104 cell lines reported here, RPE1 WT mNG-
ARL13B and RPE1 WT mNG-Rab8a cell lines were generated in a side project, but not fully
characterized (appendix figure A8). ARL13B and Rab8a fusion proteins were confirmed to
decorate the cilia membrane. The generated cell lines will allow for investigation of
ciliogenesis in RPE1 WT cells as such, and virus particles with appropriate antibiotic
resistance capabilities allow stable co-expression of mCherry-fusions of ARL13B or Rab8a in
established mNG-CSPP-L and mNG-CEP104 expressing cells.
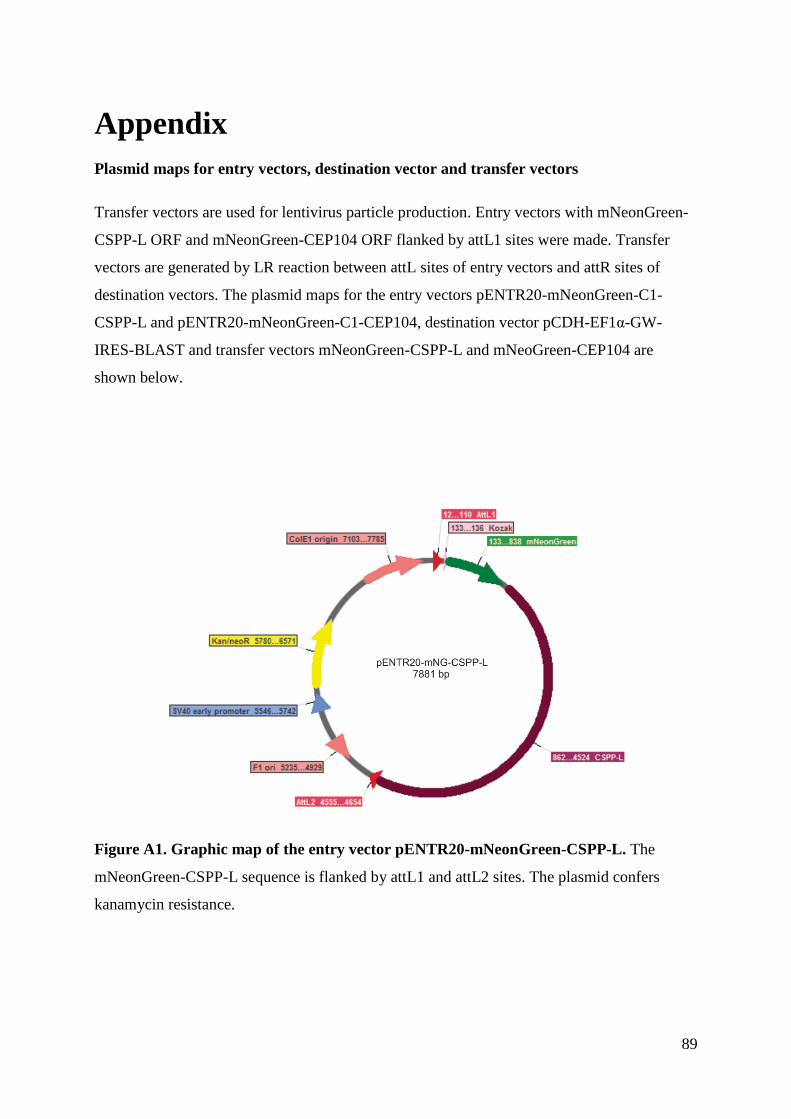
89
Appendix
Plasmid maps for entry vectors, destination vector and transfer vectors
Transfer vectors are used for lentivirus particle production. Entry vectors with mNeonGreen-
CSPP-L ORF and mNeonGreen-CEP104 ORF flanked by attL1 sites were made. Transfer
vectors are generated by LR reaction between attL sites of entry vectors and attR sites of
destination vectors. The plasmid maps for the entry vectors pENTR20-mNeonGreen-C1-
CSPP-L and pENTR20-mNeonGreen-C1-CEP104, destination vector pCDH-EF1α-GW-
IRES-BLAST and transfer vectors mNeonGreen-CSPP-L and mNeoGreen-CEP104 are
shown below.
Figure A1. Graphic map of the entry vector pENTR20-mNeonGreen-CSPP-L. The
mNeonGreen-CSPP-L sequence is flanked by attL1 and attL2 sites. The plasmid confers
kanamycin resistance.
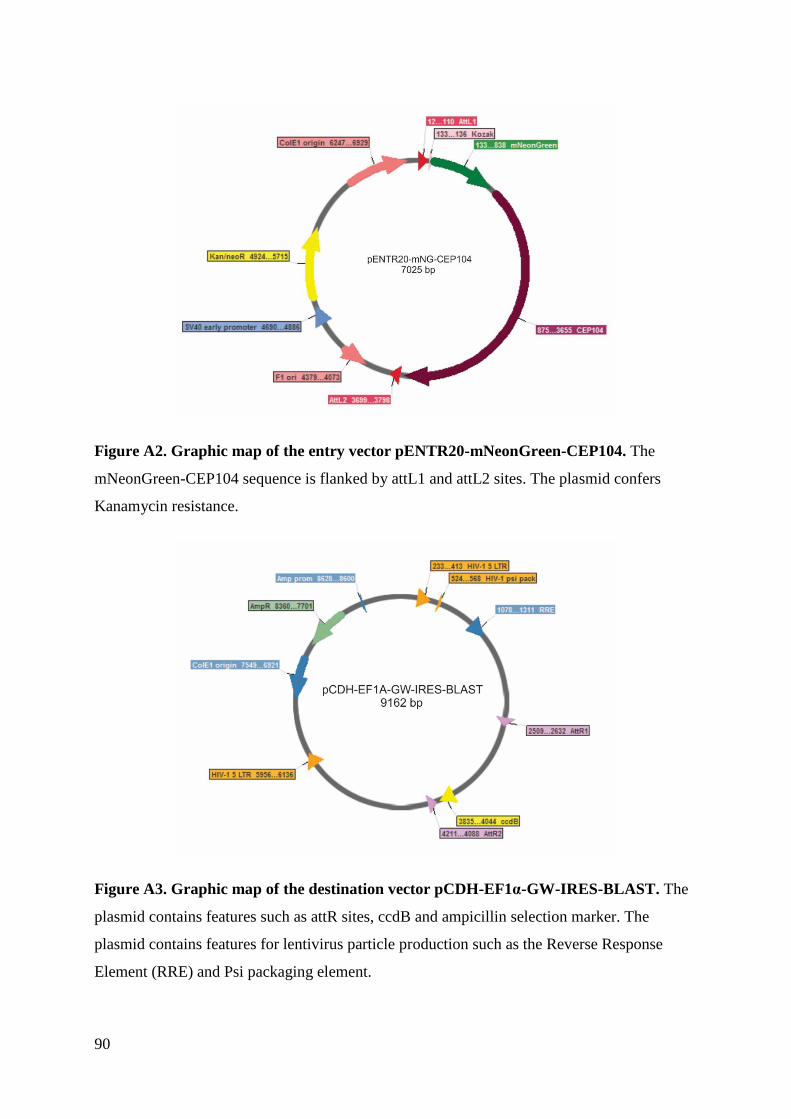
90
Figure A2. Graphic map of the entry vector pENTR20-mNeonGreen-CEP104. The
mNeonGreen-CEP104 sequence is flanked by attL1 and attL2 sites. The plasmid confers
Kanamycin resistance.
Figure A3. Graphic map of the destination vector pCDH-EF1α-GW-IRES-BLAST. The
plasmid contains features such as attR sites, ccdB and ampicillin selection marker. The
plasmid contains features for lentivirus particle production such as the Reverse Response
Element (RRE) and Psi packaging element.
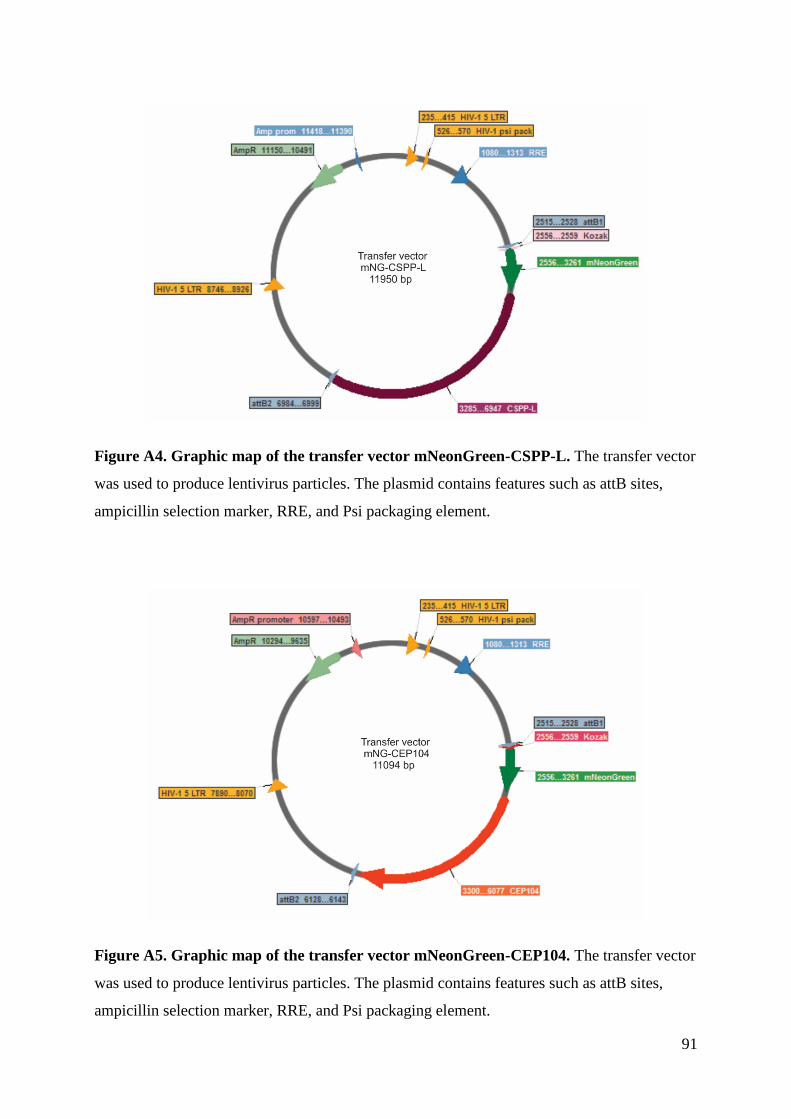
91
Figure A4. Graphic map of the transfer vector mNeonGreen-CSPP-L. The transfer vector
was used to produce lentivirus particles. The plasmid contains features such as attB sites,
ampicillin selection marker, RRE, and Psi packaging element.
Figure A5. Graphic map of the transfer vector mNeonGreen-CEP104. The transfer vector
was used to produce lentivirus particles. The plasmid contains features such as attB sites,
ampicillin selection marker, RRE, and Psi packaging element.
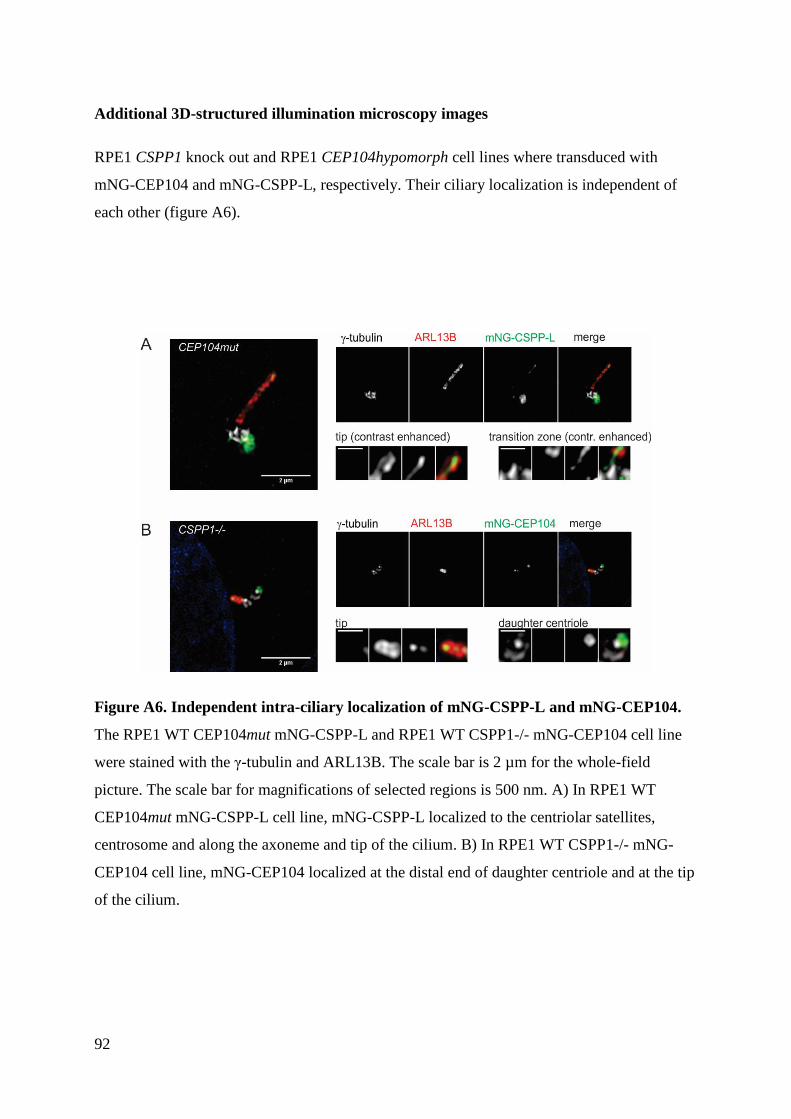
92
Additional 3D-structured illumination microscopy images
RPE1 CSPP1 knock out and RPE1 CEP104hypomorph cell lines where transduced with
mNG-CEP104 and mNG-CSPP-L, respectively. Their ciliary localization is independent of
each other (figure A6).
Figure A6. Independent intra-ciliary localization of mNG-CSPP-L and mNG-CEP104.
The RPE1 WT CEP104mut mNG-CSPP-L and RPE1 WT CSPP1-/- mNG-CEP104 cell line
were stained with the γ-tubulin and ARL13B. The scale bar is 2 µm for the whole-field
picture. The scale bar for magnifications of selected regions is 500 nm. A) In RPE1 WT
CEP104mut mNG-CSPP-L cell line, mNG-CSPP-L localized to the centriolar satellites,
centrosome and along the axoneme and tip of the cilium. B) In RPE1 WT CSPP1-/- mNG-
CEP104 cell line, mNG-CEP104 localized at the distal end of daughter centriole and at the tip
of the cilium.
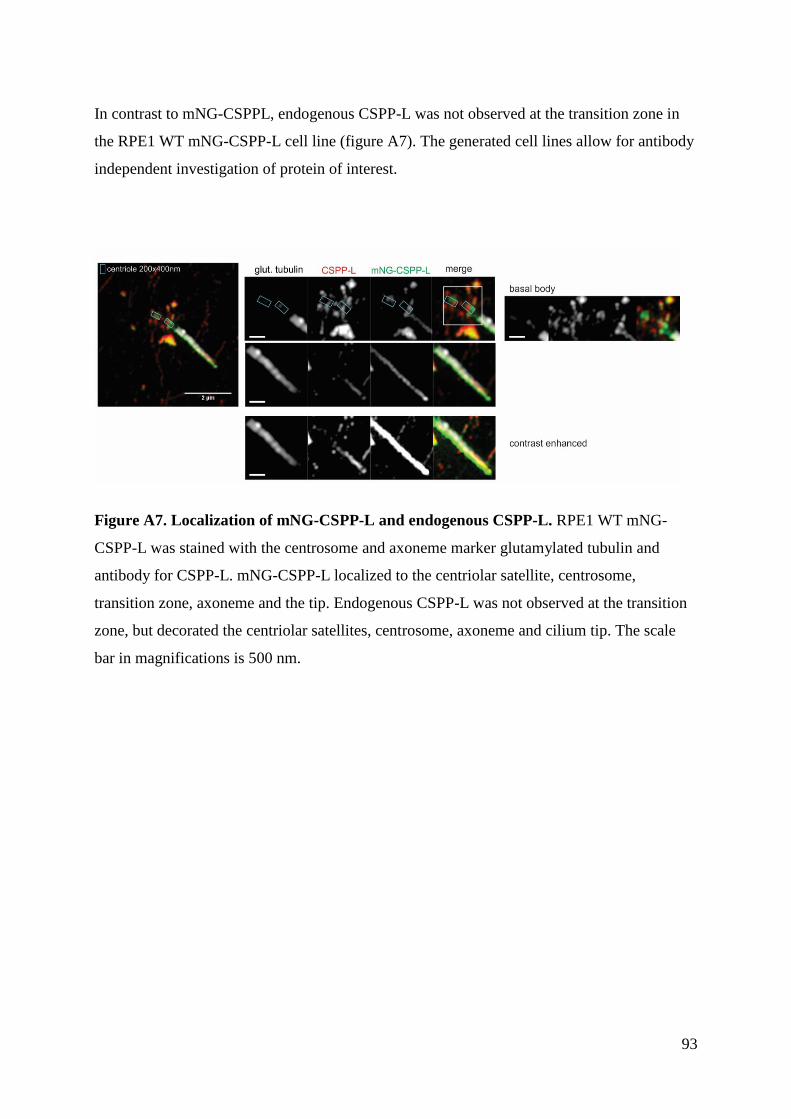
93
In contrast to mNG-CSPPL, endogenous CSPP-L was not observed at the transition zone in
the RPE1 WT mNG-CSPP-L cell line (figure A7). The generated cell lines allow for antibody
independent investigation of protein of interest.
Figure A7. Localization of mNG-CSPP-L and endogenous CSPP-L. RPE1 WT mNG-
CSPP-L was stained with the centrosome and axoneme marker glutamylated tubulin and
antibody for CSPP-L. mNG-CSPP-L localized to the centriolar satellite, centrosome,
transition zone, axoneme and the tip. Endogenous CSPP-L was not observed at the transition
zone, but decorated the centriolar satellites, centrosome, axoneme and cilium tip. The scale
bar in magnifications is 500 nm.
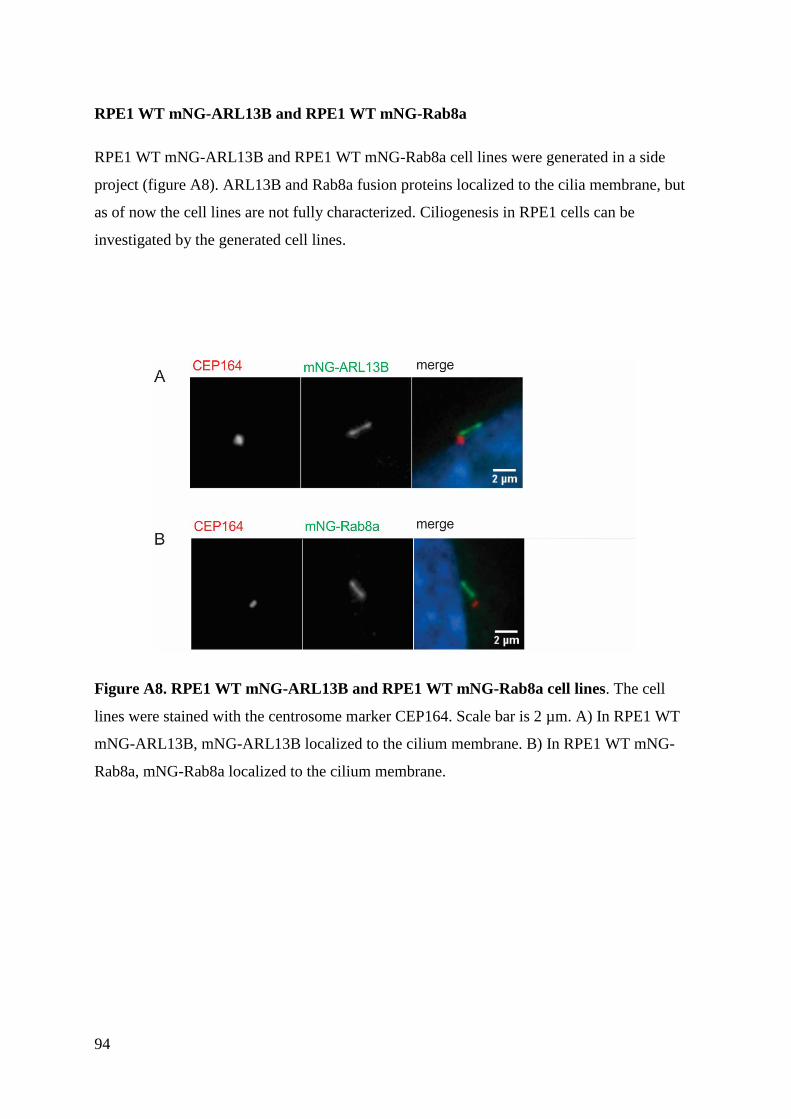
94
RPE1 WT mNG-ARL13B and RPE1 WT mNG-Rab8a
RPE1 WT mNG-ARL13B and RPE1 WT mNG-Rab8a cell lines were generated in a side
project (figure A8). ARL13B and Rab8a fusion proteins localized to the cilia membrane, but
as of now the cell lines are not fully characterized. Ciliogenesis in RPE1 cells can be
investigated by the generated cell lines.
Figure A8. RPE1 WT mNG-ARL13B and RPE1 WT mNG-Rab8a cell lines. The cell
lines were stained with the centrosome marker CEP164. Scale bar is 2 µm. A) In RPE1 WT
mNG-ARL13B, mNG-ARL13B localized to the cilium membrane. B) In RPE1 WT mNG-
Rab8a, mNG-Rab8a localized to the cilium membrane.
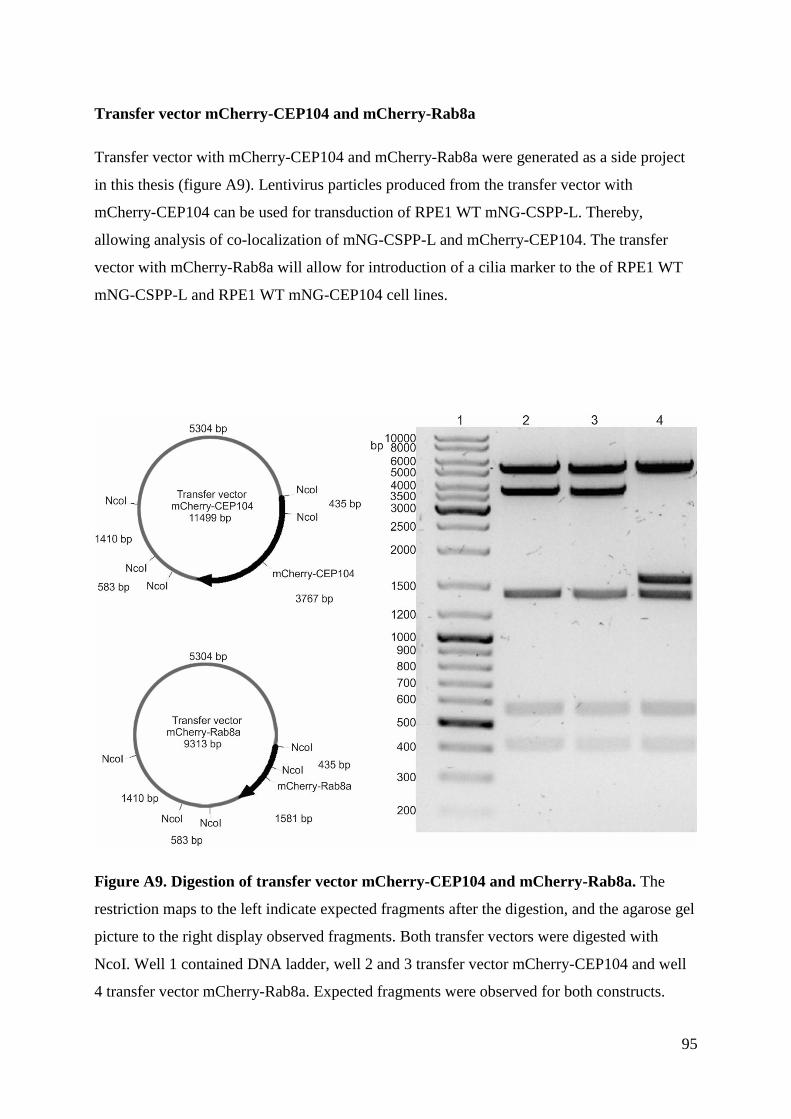
95
Transfer vector mCherry-CEP104 and mCherry-Rab8a
Transfer vector with mCherry-CEP104 and mCherry-Rab8a were generated as a side project
in this thesis (figure A9). Lentivirus particles produced from the transfer vector with
mCherry-CEP104 can be used for transduction of RPE1 WT mNG-CSPP-L. Thereby,
allowing analysis of co-localization of mNG-CSPP-L and mCherry-CEP104. The transfer
vector with mCherry-Rab8a will allow for introduction of a cilia marker to the of RPE1 WT
mNG-CSPP-L and RPE1 WT mNG-CEP104 cell lines.
Figure A9. Digestion of transfer vector mCherry-CEP104 and mCherry-Rab8a. The
restriction maps to the left indicate expected fragments after the digestion, and the agarose gel
picture to the right display observed fragments. Both transfer vectors were digested with
NcoI. Well 1 contained DNA ladder, well 2 and 3 transfer vector mCherry-CEP104 and well
4 transfer vector mCherry-Rab8a. Expected fragments were observed for both constructs.
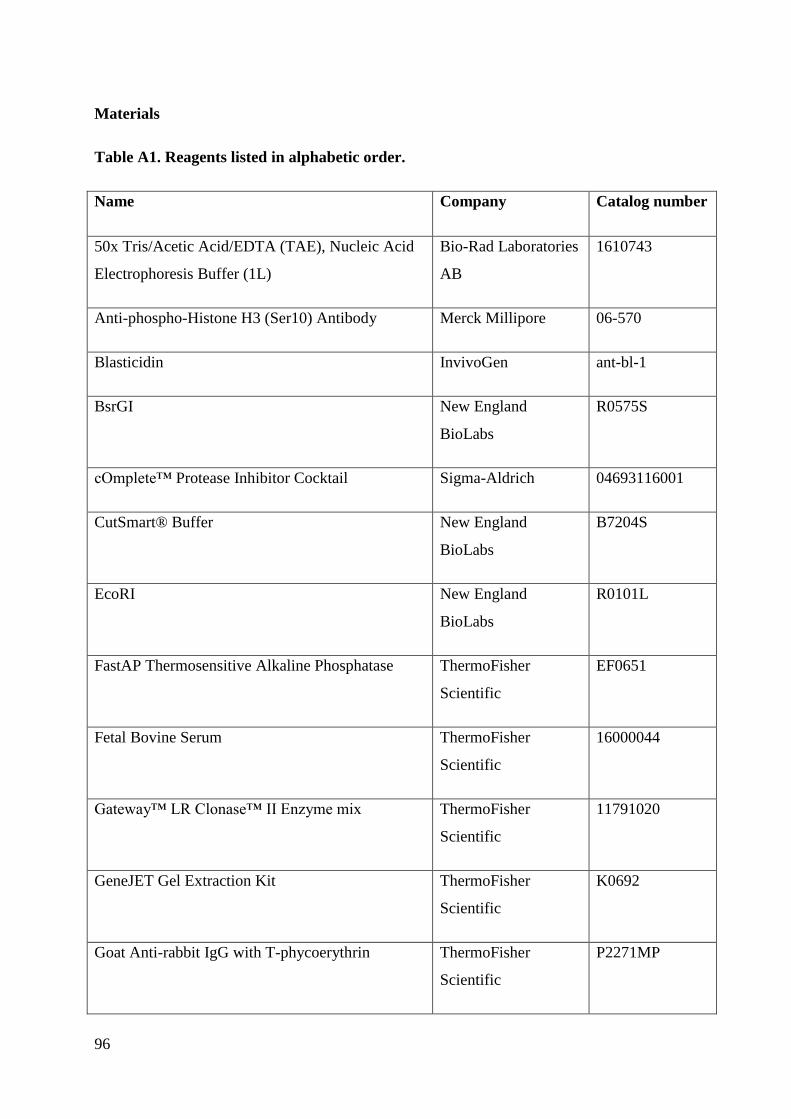
96
Materials
Table A1. Reagents listed in alphabetic order.
Name Company Catalog number
50x Tris/Acetic Acid/EDTA (TAE), Nucleic Acid
Electrophoresis Buffer (1L)
Bio-Rad Laboratories
AB
1610743
Anti-phospho-Histone H3 (Ser10) Antibody Merck Millipore 06-570
Blasticidin InvivoGen ant-bl-1
BsrGI New England
BioLabs
R0575S
cOmplete™ Protease Inhibitor Cocktail Sigma-Aldrich 04693116001
CutSmart® Buffer New England
BioLabs
B7204S
EcoRI New England
BioLabs
R0101L
FastAP Thermosensitive Alkaline Phosphatase ThermoFisher
Scientific
EF0651
Fetal Bovine Serum ThermoFisher
Scientific
16000044
Gateway™ LR Clonase™ II Enzyme mix ThermoFisher
Scientific
11791020
GeneJET Gel Extraction Kit ThermoFisher
Scientific
K0692
Goat Anti-rabbit IgG with T-phycoerythrin ThermoFisher
Scientific
P2271MP
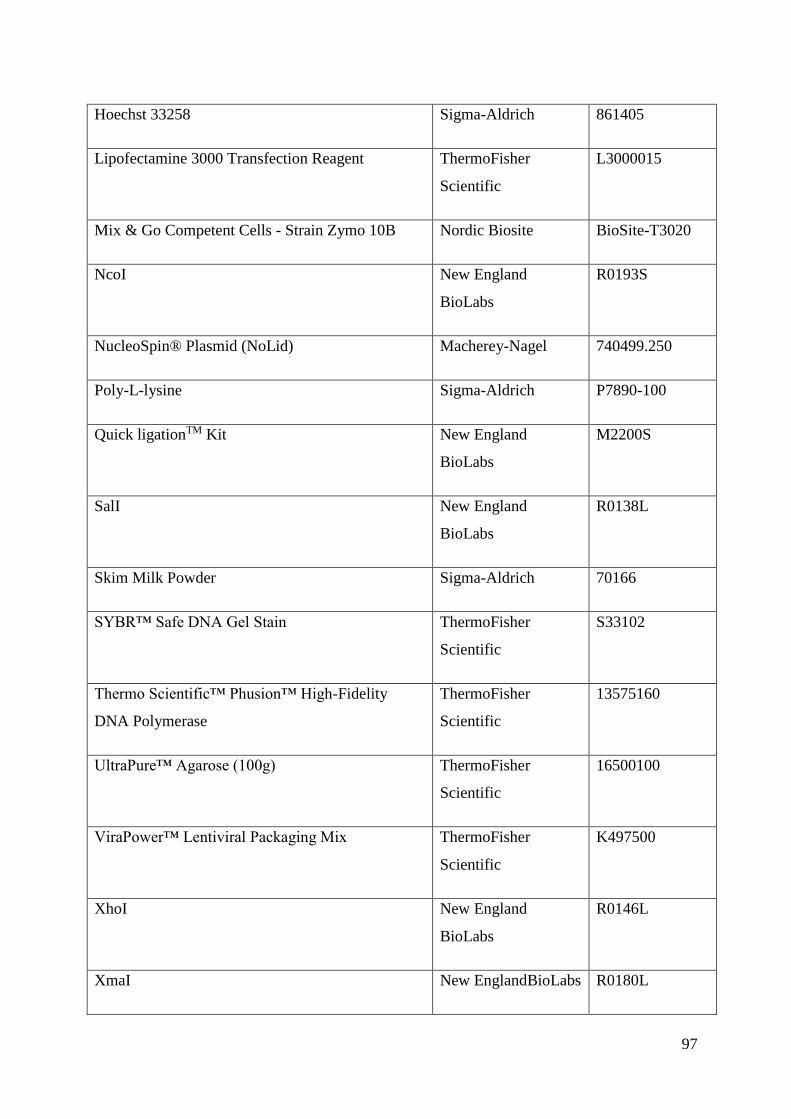
97
Hoechst 33258 Sigma-Aldrich 861405
Lipofectamine 3000 Transfection Reagent ThermoFisher
Scientific
L3000015
Mix & Go Competent Cells - Strain Zymo 10B Nordic Biosite BioSite-T3020
NcoI New England
BioLabs
R0193S
NucleoSpin® Plasmid (NoLid) Macherey-Nagel 740499.250
Poly-L-lysine Sigma-Aldrich P7890-100
Quick ligationTM Kit New England
BioLabs
M2200S
SalI New England
BioLabs
R0138L
Skim Milk Powder Sigma-Aldrich 70166
SYBR™ Safe DNA Gel Stain ThermoFisher
Scientific
S33102
Thermo Scientific™ Phusion™ High-Fidelity
DNA Polymerase
ThermoFisher
Scientific
13575160
UltraPure™ Agarose (100g) ThermoFisher
Scientific
16500100
ViraPower™ Lentiviral Packaging Mix ThermoFisher
Scientific
K497500
XhoI New England
BioLabs
R0146L
XmaI New EnglandBioLabs R0180L
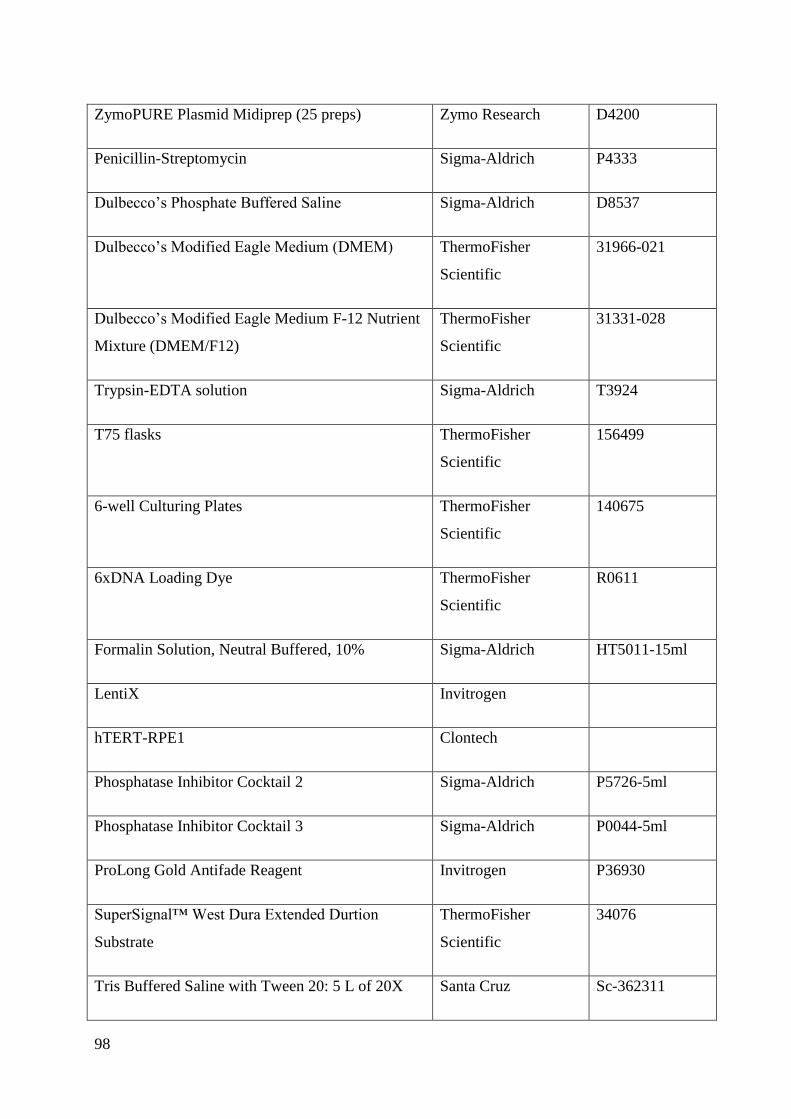
98
ZymoPURE Plasmid Midiprep (25 preps) Zymo Research D4200
Penicillin-Streptomycin Sigma-Aldrich P4333
Dulbecco’s Phosphate Buffered Saline Sigma-Aldrich D8537
Dulbecco’s Modified Eagle Medium (DMEM) ThermoFisher
Scientific
31966-021
Dulbecco’s Modified Eagle Medium F-12 Nutrient
Mixture (DMEM/F12)
ThermoFisher
Scientific
31331-028
Trypsin-EDTA solution Sigma-Aldrich T3924
T75 flasks ThermoFisher
Scientific
156499
6-well Culturing Plates ThermoFisher
Scientific
140675
6xDNA Loading Dye ThermoFisher
Scientific
R0611
Formalin Solution, Neutral Buffered, 10% Sigma-Aldrich HT5011-15ml
LentiX Invitrogen
hTERT-RPE1 Clontech
Phosphatase Inhibitor Cocktail 2 Sigma-Aldrich P5726-5ml
Phosphatase Inhibitor Cocktail 3 Sigma-Aldrich P0044-5ml
ProLong Gold Antifade Reagent Invitrogen P36930
SuperSignal™ West Dura Extended Durtion
Substrate
ThermoFisher
Scientific
34076
Tris Buffered Saline with Tween 20: 5 L of 20X Santa Cruz Sc-362311
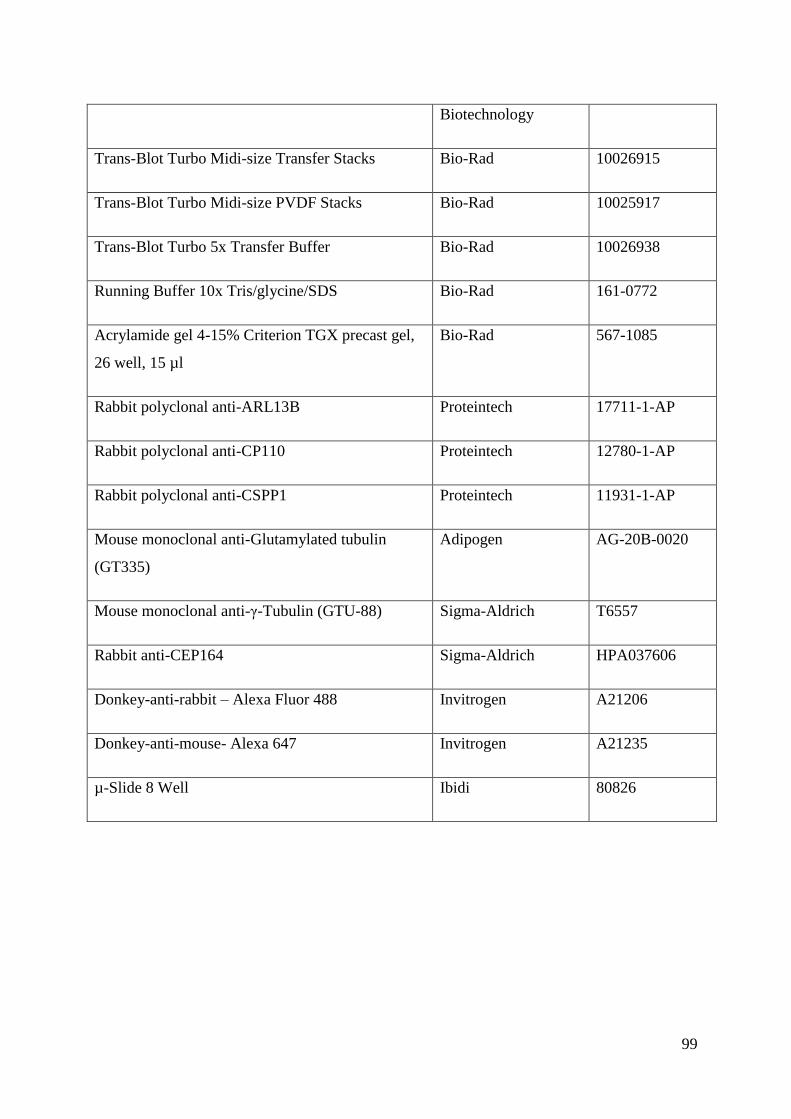
99
Biotechnology
Trans-Blot Turbo Midi-size Transfer Stacks Bio-Rad 10026915
Trans-Blot Turbo Midi-size PVDF Stacks Bio-Rad 10025917
Trans-Blot Turbo 5x Transfer Buffer Bio-Rad 10026938
Running Buffer 10x Tris/glycine/SDS Bio-Rad 161-0772
Acrylamide gel 4-15% Criterion TGX precast gel,
26 well, 15 µl
Bio-Rad 567-1085
Rabbit polyclonal anti-ARL13B Proteintech 17711-1-AP
Rabbit polyclonal anti-CP110 Proteintech 12780-1-AP
Rabbit polyclonal anti-CSPP1 Proteintech 11931-1-AP
Mouse monoclonal anti-Glutamylated tubulin
(GT335)
Adipogen AG-20B-0020
Mouse monoclonal anti-γ-Tubulin (GTU-88) Sigma-Aldrich T6557
Rabbit anti-CEP164 Sigma-Aldrich HPA037606
Donkey-anti-rabbit – Alexa Fluor 488 Invitrogen A21206
Donkey-anti-mouse- Alexa 647 Invitrogen A21235
µ-Slide 8 Well Ibidi 80826
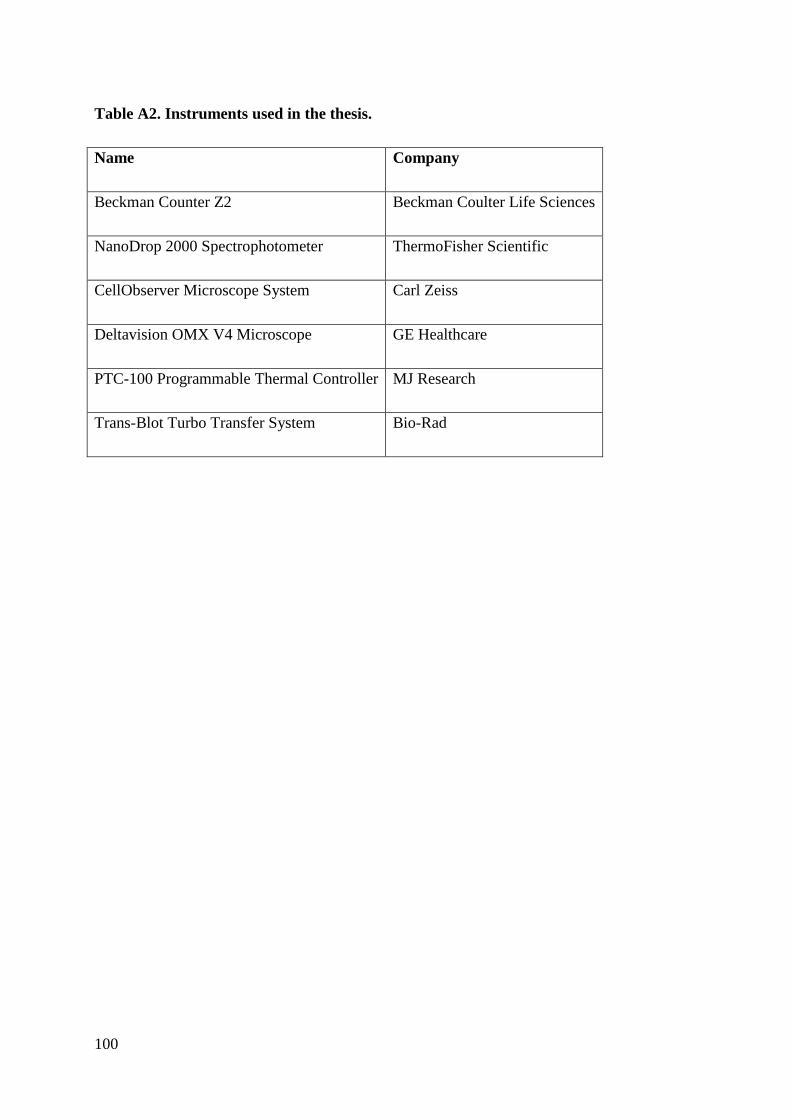
100
Table A2. Instruments used in the thesis.
Name Company
Beckman Counter Z2 Beckman Coulter Life Sciences
NanoDrop 2000 Spectrophotometer ThermoFisher Scientific
CellObserver Microscope System Carl Zeiss
Deltavision OMX V4 Microscope GE Healthcare
PTC-100 Programmable Thermal Controller MJ Research
Trans-Blot Turbo Transfer System Bio-Rad
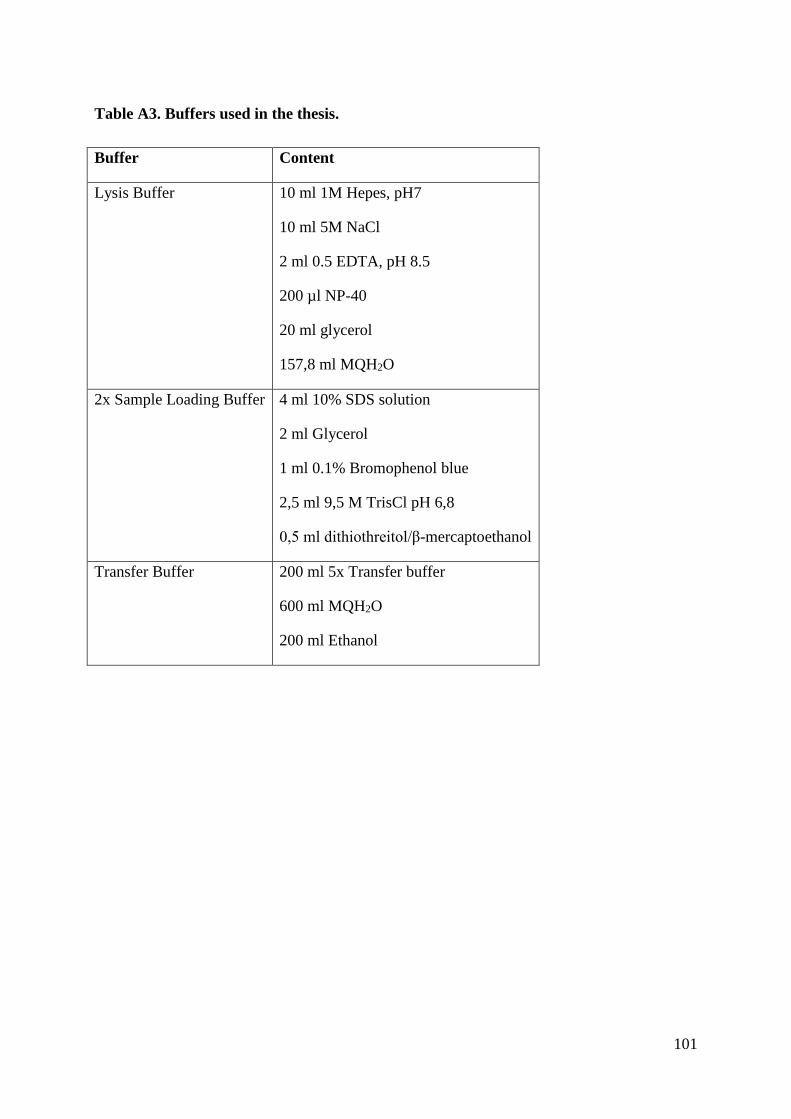
101
Table A3. Buffers used in the thesis.
Buffer Content
Lysis Buffer 10 ml 1M Hepes, pH7
10 ml 5M NaCl
2 ml 0.5 EDTA, pH 8.5
200 µl NP-40
20 ml glycerol
157,8 ml MQH2O
2x Sample Loading Buffer 4 ml 10% SDS solution
2 ml Glycerol
1 ml 0.1% Bromophenol blue
2,5 ml 9,5 M TrisCl pH 6,8
0,5 ml dithiothreitol/β-mercaptoethanol
Transfer Buffer 200 ml 5x Transfer buffer
600 ml MQH2O
200 ml Ethanol
102
References
1. Alberts, B., et al., Molecular Biology of the Cell. 6th ed. 2015: Garland Science
2. Sanchez, I. and B.D. Dynlacht, Cilium assembly and disassembly. Nat Cell Biol, 2016.
18(7): p. 711-7.
3. Akizu, N., et al., Mutations in CSPP1 lead to classical Joubert syndrome. Am J Hum
Genet, 2014. 94(1): p. 80-6.
4. Shaheen, R., et al., Mutations in CSPP1, encoding a core centrosomal protein, cause a
range of ciliopathy phenotypes in humans. Am J Hum Genet, 2014. 94(1): p. 73-9.
5. Srour, M., et al., Joubert Syndrome in French Canadians and Identification of
Mutations in CEP104. Am J Hum Genet, 2015. 97(5): p. 744-53.
6. Tuz, K., et al., Mutations in CSPP1 cause primary cilia abnormalities and Joubert
syndrome with or without Jeune asphyxiating thoracic dystrophy. Am J Hum Genet,
2014. 94(1): p. 62-72.
7. de Forges, H., A. Bouissou, and F. Perez, Interplay between microtubule dynamics
and intracellular organization. Int J Biochem Cell Biol, 2012. 44(2): p. 266-74.
8. Oakley, B.R., An abundance of tubulins. Trends Cell Biol, 2000. 10(12): p. 537-42.
9. Vigo, U.o. Microtubules. 2018 [cited 2018 May]; Available from:
https://mmegias.webs.uvigo.es/02-english/5-celulas/7-microtubulos.php.
10. Mitchison, T. and M. Kirschner, Microtubule assembly nucleated by isolated
centrosomes. Nature, 1984. 312(5991): p. 232-7.
11. Bettencourt-Dias, M. and D.M. Glover, Centrosome biogenesis and function:
centrosomics brings new understanding. Nat Rev Mol Cell Biol, 2007. 8(6): p. 451-
63.
12. Wiese, C. and Y. Zheng, A new function for the gamma-tubulin ring complex as a
microtubule minus-end cap. Nat Cell Biol, 2000. 2(6): p. 358-64.
13. Delgehyr, N., J. Sillibourne, and M. Bornens, Microtubule nucleation and anchoring
at the centrosome are independent processes linked by ninein function. J Cell Sci,
2005. 118(Pt 8): p. 1565-75.
14. Zimmerman, W.C., et al., Mitosis-specific Anchoring of γ Tubulin Complexes by
Pericentrin Controls Spindle Organization and Mitotic Entry. Mol Biol Cell, 2004.
15(8): p. 3642-57.
15. Luders, J. and T. Stearns, Microtubule-organizing centres: a re-evaluation. Nat Rev
Mol Cell Biol, 2007. 8(2): p. 161-7.
16. Sonnen, K.F., et al., 3D-structured illumination microscopy provides novel insight into
architecture of human centrosomes. Biol Open, 2012. 1(10): p. 965-76.
17. Vlijm, R., et al., STED nanoscopy of the centrosome linker reveals a CEP68-
organized, periodic rootletin network anchored to a C-Nap1 ring at centrioles. Proc
Natl Acad Sci U S A, 2018. 115(10): p. E2246-53.
18. Mogensen, M.M., et al., Microtubule minus-end anchorage at centrosomal and non-
centrosomal sites: the role of ninein. J Cell Sci, 2000. 113 ( Pt 17): p. 3013-23.
19. Hehnly, H., et al., The centrosome regulates the Rab11- dependent recycling
endosome pathway at appendages of the mother centriole. Curr Biol, 2012. 22(20): p.
1944-50.
20. Tanos, B.E., et al., Centriole distal appendages promote membrane docking, leading
to cilia initiation. Genes Dev, 2013. 27(2): p. 163-8.
21. Doxsey, S., Re-evaluating centrosome function. Nat Rev Mol Cell Biol, 2001. 2(9): p.
688-98.
22. Lodish H, e.a., Molecular Cell Biology. 4th ed. 2000: W. H. Freeman and Company.
103
23. Nigg, E.A. and J.W. Raff, Centrioles, centrosomes, and cilia in health and disease.
Cell, 2009. 139(4): p. 663-78.
24. Barenz, F., D. Mayilo, and O.J. Gruss, Centriolar satellites: busy orbits around the
centrosome. Eur J Cell Biol, 2011. 90(12): p. 983-9.
25. Tollenaere, M.A., N. Mailand, and S. Bekker-Jensen, Centriolar satellites: key
mediators of centrosome functions. Cell Mol Life Sci, 2015. 72(1): p. 11-23.
26. Kubo, A., Centriolar Satellites: Molecular Characterization, Atp-Dependent
Movement toward Centrioles and Possible Involvement in Ciliogenesis. 1999. 147(5):
p. 969-80.
27. Dammermann, A. and A. Merdes, Assembly of centrosomal proteins and microtubule
organization depends on PCM-1. J Cell Biol, 2002. 159(2): p. 255-66.
28. Wei, Q., K. Ling, and J. Hu, The essential roles of transition fibers in the context of
cilia. Curr Opin Cell Biol, 2015. 35: p. 98-105.
29. Dawe, H.R., H. Farr, and K. Gull, Centriole/basal body morphogenesis and migration
during ciliogenesis in animal cells. Journal of Cell Science, 2007. 120(1): p. 7-15.
30. Berbari, N.F., et al., The Primary Cilium as a Complex Signaling Center. Curr Biol,
2009. 19(13): p. R526.
31. Kathem, S.H., A.M. Mohieldin, and S.M. Nauli, The Roles of Primary cilia in
Polycystic Kidney Disease. AIMS Mol Sci, 2014. 1(1): p. 27-46.
32. Gonçalves, J., The Ciliary Transition Zone: Finding the Pieces and Assembling the
Gate. 2017. 40(4): p. 243-53.
33. Frikstad, K.M., et al., A CEP104-CSPP1 complex is required for formation of primary
cilia competent in Hegdehog-signaling. In revision, 2018.
34. Ishikawa, H. and W.F. Marshall, Ciliogenesis: building the cell's antenna. Nat Rev
Mol Cell Biol, 2011. 12(4): p. 222-34.
35. Westlake, C.J., et al., Primary cilia membrane assembly is initiated by Rab11 and
transport protein particle II (TRAPPII) complex-dependent trafficking of Rabin8 to
the centrosome. Proc Natl Acad Sci U S A, 2011. 108(7): p. 2759-64.
36. Yoshimura, S., et al., Functional dissection of Rab GTPases involved in primary
cilium formation. J Cell Biol, 2007. 178(3): p. 363-9.
37. Lu, Q., et al., Early steps in primary cilium assembly require EHD1/EHD3-dependent
ciliary vesicle formation. Nat Cell Biol, 2015. 17(3): p. 228-240.
38. Hsiao, Y.C., K. Tuz, and R.J. Ferland, Trafficking in and to the primary cilium. Cilia,
2012. 1: p. 4.
39. Larkins, C.E., et al., Arl13b regulates ciliogenesis and the dynamic localization of Shh
signaling proteins. Mol Biol Cell, 2011. 22(23): p. 4694-703.
40. Schmidt, T.I., et al., Control of centriole length by CPAP and CP110. Curr Biol, 2009.
19(12): p. 1005-11.
41. Čajánek, L. and E.A. Nigg, Cep164 triggers ciliogenesis by recruiting Tau tubulin
kinase 2 to the mother centriole. Proc Natl Acad Sci U S A, 2014. 111(28): p. E2841-
50.
42. Oda, T., et al., Binding to Cep164, but not EB1, is essential for centriolar localization
of TTBK2 and its function in ciliogenesis. Genes Cells, 2014. 19(12): p. 927-40.
43. Graser, S., et al., Cep164, a novel centriole appendage protein required for primary
cilium formation. J Cell Biol, 2007. 179(2): p. 321-30.
44. Schmidt, K.N., et al., Cep164 mediates vesicular docking to the mother centriole
during early steps of ciliogenesis. J Cell Biol, 2012. 199(7): p. 1083-101.
45. He, M., S. Agbu, and K.V. Anderson, Microtubule Motors Drive Hedgehog Signaling
in Primary Cilia. Trends Cell Biol, 2017. 27(2): p. 110-125.
104
46. Stepanek, L. and G. Pigino, Microtubule doublets are double-track railways for
intraflagellar transport trains. Science, 2016. 352(6286): p. 721-4.
47. Haycraft, C.J., et al., Gli2 and Gli3 localize to cilia and require the intraflagellar
transport protein polaris for processing and function. PLoS Genet, 2005. 1(4): p. e53.
48. Christensen, S.T., et al., Sensory cilia and integration of signal transduction in human
health and disease. Traffic, 2007. 8(2): p. 97-109.
49. Pazour, G.J. and G.B. Witman, The vertebrate primary cilium is a sensory organelle.
Curr Opin Cell Biol, 2003. 15(1): p. 105-10.
50. Mahjoub, M.R. and T. Stearns, Supernumerary centrosomes nucleate extra cilia and
compromise primary cilium signaling. Curr Biol, 2012. 22(17): p. 1628-34.
51. Veland, I.R., L. Lindbaek, and S.T. Christensen, Linking the Primary Cilium to Cell
Migration in Tissue Repair and Brain Development. Bioscience, 2014. 64(12): p.
1115-1125.
52. Farnum, C.E. and N.J. Wilsman, Axonemal positioning and orientation in three-
dimensional space for primary cilia: what is known, what is assumed, and what needs
clarification. Dev Dyn, 2011. 240(11): p. 2405-31.
53. Singla, V. and J.F. Reiter, The primary cilium as the cell's antenna: signaling at a
sensory organelle. Science, 2006. 313(5787): p. 629-33.
54. Gerhardt, C., et al., The cilia-regulated proteasome and its role in the development of
ciliopathies and cancer. Cilia, 2016. 5.
55. Bangs, F. and K.V. Anderson, Primary Cilia and Mammalian Hedgehog Signaling.
Cold Spring Harb Perspect Biol, 2017. 9(5).
56. Gupta, S., N. Takebe, and P. LoRusso, Targeting the Hedgehog pathway in cancer.
Ther Adv Med Oncol, 2010. 2(4): p. 237-50.
57. Brancati, F., B. Dallapiccola, and E.M. Valente, Joubert Syndrome and related
disorders. Orphanet J Rare Dis, 2010. 5: p. 20.
58. Yang, T.T., et al., Superresolution Pattern Recognition Reveals the Architectural Map
of the Ciliary Transition Zone. Sci Rep, 2015. 5: p. 14096.
59. He, M., et al., The kinesin-4 protein Kif7 regulates mammalian Hedgehog signalling
by organizing the cilium tip compartment. Nat Cell Biol, 2014. 16(7): p. 663-72.
60. Sanders, A.A., et al., KIAA0556 is a novel ciliary basal body component mutated in
Joubert syndrome. Genome Biol, 2015. 16: p. 293.
61. Patzke, S., et al., CSPP Is a Ciliary Protein Interacting with Nephrocystin 8 and
Required for Cilia Formation. Mol Biol Cell, 2010. 21(15): p. 2555-67.
62. Satish Tammana, T.V., et al., Centrosomal protein CEP104 (Chlamydomonas
FAP256) moves to the ciliary tip during ciliary assembly. J Cell Sci, 2013. 126(Pt 21):
p. 5018-29.
63. Patzke, S., T. Stokke, and H.C. Aasheim, CSPP and CSPP-L associate with
centrosomes and microtubules and differently affect microtubule organization. J Cell
Physiol, 2006. 209(1): p. 199-210.
64. Patzke, S., et al., Identification of a novel centrosome/microtubule-associated coiled-
coil protein involved in cell-cycle progression and spindle organization. Oncogene,
2005. 24(7): p. 1159-73.
65. Asiedu, M., et al., Centrosome/spindle pole-associated protein regulates cytokinesis
via promoting the recruitment of MyoGEF to the central spindle. Mol Biol Cell, 2009.
20(5): p. 1428-40.
66. Jiang, K., et al., A Proteome-wide screen for mammalian SxIP motif-containing
microtubule plus-end tracking proteins. Curr Biol, 2012. 22(19): p. 1800-7.
67. Al-Jassar, C., et al., The Ciliopathy-Associated Cep104 Protein Interacts with Tubulin
and Nek1 Kinase. Structure, 2017. 25(1): p. 146-56.
105
68. Rezabkova, L., et al., Biophysical and Structural Characterization of the Centriolar
Protein Cep104 Interaction Network. J Biol Chem, 2016. 291(35): p. 18496-504.
69. Shaner, N.C., et al., A bright monomeric green fluorescent protein derived from
Branchiostoma lanceolatum. Nat Methods, 2013. 10(5): p. 407-9.
70. McPherson, M.J., P. Quirke, and G.R. Taylor, PCR: A Practical Approach. 1991:
Oxford University Press.
71. Lorenz, T.C., Polymerase Chain Reaction: Basic Protocol Plus Troubleshooting and
Optimization Strategies. J Vis Exp, 2012(63).
72. Mullis, K.B., The unusual origin of the polymerase chain reaction. Sci Am, 1990.
262(4): p. 56-61, 64-5.
73. Garibyan, L. and N. Avashia, Research Techniques Made Simple: Polymerase Chain
Reaction (PCR). J Invest Dermatol, 2013. 133(3): p. e6.
74. Sezonov, G., D. Joseleau-Petit, and R. D'Ari, Escherichia coli Physiology in Luria-
Bertani Broth. J Bacteriol, 2007. 189(23): p. 8746-9.
75. Ehrt, S. and D. Schnappinger, Isolation of plasmids from E. coli by alkaline lysis.
Methods Mol Biol, 2003. 235: p. 75-8.
76. Sanger, F., S. Nicklen, and A.R. Coulson, DNA sequencing with chain-terminating
inhibitors. Proc Natl Acad Sci U S A, 1977. 74(12): p. 5463-7.
77. Throop, A.L. and J. LaBaer, Recombinational Cloning Using Gateway and In-Fusion
Cloning Schemes. Curr Protoc Mol Biol, 2015. 110: p. 3.20.1-3.20.23.
78. Addgene. Plasmids 101: Gateway Cloning. 2017 [cited 2018 May]; Available from:
https://blog.addgene.org/plasmids-101-gateway-cloning.
79. Campeau, E., A Versatile Viral System for Expression and Depletion of Proteins in
Mammalian Cells. 2009. 4(8).
80. De Jonge, N., et al., Alternative interactions define gyrase specificity in the CcdB
family. Mol Microbiol, 2012. 84(5): p. 965-78.
81. Qin, J.Y., Systematic Comparison of Constitutive Promoters and the Doxycycline-
Inducible Promoter. 2010. 5(5).
82. Brunner, D., et al., Serum-free cell culture: the serum-free media interactive online
database. Altex, 2010. 27(1): p. 53-62.
83. Chen, L., S.J. Mao, and W.J. Larsen, Identification of a factor in fetal bovine serum
that stabilizes the cumulus extracellular matrix. A role for a member of the inter-
alpha-trypsin inhibitor family. J Biol Chem, 1992. 267(17): p. 12380-6.
84. Addgene. Lentiviral Guide. [cited 2018 May]; Available from:
https://www.addgene.org/viral-vectors/lentivirus/lenti-guide/.
85. Zufferey, R., et al., Self-Inactivating Lentivirus Vector for Safe and Efficient In Vivo
Gene Delivery. J Virol, 1998. 72(12): p. 9873-80.
86. Ibrahim, S.F. and G. van den Engh, Flow cytometry and cell sorting. Adv Biochem
Eng Biotechnol, 2007. 106: p. 19-39.
87. Darzynkiewicz, Z., H.D. Halicka, and H. Zhao, Analysis of Cellular DNA Content by
Flow and Laser Scanning Cytometry. Adv Exp Med Biol, 2010. 676: p. 137-47.
88. Hendzel, M.J., et al., Mitosis-specific phosphorylation of histone H3 initiates
primarily within pericentromeric heterochromatin during G2 and spreads in an
ordered fashion coincident with mitotic chromosome condensation. Chromosoma,
1997. 106(6): p. 348-60.
89. Thorlabs, Laser Scanning Microscopy Tutorial. [cited 2018 May]; Available from:
https://www.thorlabs.com/tutorials.cfm?tabID=8ed9f76d-3bbd-4e6c-b2f5-
f6a89a2c4fc9.
90. Schermelleh, L., R. Heintzmann, and H. Leonhardt, A guide to super-resolution
fluorescence microscopy. J Cell Biol, 2010. 190(2): p. 165-75.
106
91. Gustafsson, M.G., Surpassing the lateral resolution limit by a factor of two using
structured illumination microscopy. J Microsc, 2000. 198(Pt 2): p. 82-7.
92. Leung, B.O. and K.C. Chou, Review of super-resolution fluorescence microscopy for
biology. Appl Spectrosc, 2011. 65(9): p. 967-80.
93. Biolabs, N.E., Phusion® High-Fidelity DNA Polymerase. [cited 2018 May]; Available
from: https://www.neb.com/products/m0530-phusion-high-fidelity-dna-
polymerase#Product%20Information_Properties%20and%20Usage.
94. Merck, Cell Types & Culture Characteristics. [cited 2018 May]; Available from:
https://www.sigmaaldrich.com/technical-documents/protocols/biology/cell-types-
culture.html.
95. Fuller, S.D., et al., The core of the mammalian centriole contains gamma-tubulin. Curr
Biol, 1995. 5(12): p. 1384-93.
96. Zhang, B., et al., The significance of controlled conditions in lentiviral vector titration
and in the use of multiplicity of infection (MOI) for predicting gene transfer events.
Genet Vaccines Ther, 2004. 2(1): p. 6.
97. Barry, S.C., et al., Lentivirus vectors encoding both central polypurine tract and
posttranscriptional regulatory element provide enhanced transduction and transgene
expression. Hum Gene Ther, 2001. 12(9): p. 1103-8.
98. Campeau, E., Expression Studies: A Versatile Viral System for Expression and
Depletion of Proteins in Mammalian Cells. 2010, Version 1.1.
99. Addgene, Isolating a Monoclonal Cell Population by Limiting Dilution. 2016 [cited
2018 May]; Available from: https://www.addgene.org/protocols/limiting-dilution/.
100. Xia, X., et al., Transgenes Delivered by Lentiviral Vector Are Suppressed in Human
Embryonic Stem Cells in a Promoter-Dependent Manner. Stem Cells Dev, 2007.
16(1): p. 167-76.
101. Scientific, T., Introduction to Transfection. [cited 2018 May]; Available from:
https://www.thermofisher.com/no/en/home/references/gibco-cell-culture-
basics/transfection-basics/introduction-to-transfection.html.
102. Shearer, R.F., et al., The E3 ubiquitin ligase UBR5 regulates centriolar satellite
stability and primary cilia. Mol Biol Cell, 2018: p. mbcE17040248.
103. Hua, K. and R.J. Ferland, Fixation methods can differentially affect ciliary protein
immunolabeling. Cilia, 2017. 6: p. 5.