Embed Size (px)
Citation preview
SUST Studies, Vol. 14, No. 2, 2011;P:56-68
Generation of Response Spectra Along With Time History
for Earthquake in Dhaka for Dynamic Analysis of
Structure
A.B.M. Saiful Islam1
, Syed Ishtiaq Ahmad2 and Mohammed Jameel
3
1Ph.D. Fellow, Dept. of Civil Engineering, University of Malaya, Kuala Lumpur, Malaysia, 2Dept. of Civil Engineering, BUET, Dhaka, Bangladesh.
3Dept. of Civil Engineering, University of Malaya, Kuala Lumpur, Malaysia. Email: [email protected]
and
(Submitted: February 11, 2010; Accepted for Publication: July 21, 2010)
Abstract
Earthquakes subject structures to time varying-forces which, in turn, produce time-varying displacements and stresses within the structures. From a design view point, only the maximum values of displacement and stress are of interest—the variation with time of these quantities is of little consequence. For survival the structure must withstand the peak value whenever that may occur. Therefore only the peak value is needed to be known to successfully design a building and this information is made available in the form of response spectra. In this study effort has been made to generate response spectra, which may be directly used in the dynamic analysis of structures in Dhaka. As there is a deficient in apposite earthquake data at Bangladesh especially for Dhaka region, time history of Dhaka Earthquake was at first generated here from recently occurred Natore Earthquake considering maximum ground acceleration of Dhaka soil and then from the time history response spectrum is developed. As response spectrum for a given earthquake is quite irregular and has a number of peaks and valleys, efforts have been made to construct smooth response spectra also. Statistical approach has been adopted to create a smoothed response spectrum to make it suitable for design. The study reveals a Time History Function as well as design Response Spectrum corresponding it for the detail dynamic analysis and proposes these as suitable for seismic design of buildings in Dhaka. Keywords: Peak displacements, response spectra, pseudo response spectra, natural frequency, spectral acceleration, Duhamel’s integral, damping ratio.
1. Introduction:
Earthquake resistant design is an evolutionary one and although great progress has been made since seismic design was made mandatory by various building codes, it is still not completely understood. So, structural engineers have been giving more and more attention to the design of buildings for earthquake resistance. Among various unknowns or less known factors, the conversion of dynamic forces to static forces is, perhaps, one of the areas where additional works may be conducted. The Dynamic analysis is however a more accurate method than the Equivalent Static Force method in seismic design suggested by the design codes. This type of analysis is carried out in the form of a response spectrum analysis or a time history analysis where an earthquake excitation of the ground is given in the form of response spectrum curve and tome history curve.
There is a lack of suitable earthquake result in Dhaka, Bangladesh. So for dynamic analysis for seismic design of structures, generation of response spectrum curve and time history curve is a burning matter. It is possible to generate curve which give peak displacements for any structure subject to a given earthquake. These curves are called response spectra because they give the response (e.g. maximum displacement) of a wide spectrum of
Generation of Response Spectra Along With Time History for Earthquake in Dhaka for Dynamic Analysis of Structure 57
structures as defined by their frequency (or period) and damping ratio. To generate spectra of real earthquake time histories, the procedure discussed following is used, where time history is generated first from a recently occurred real earthquake and by the course of action maximum values recoded and later plotted against period and damping ratio. Because there is no closed- form solution to the integral equation each point on each curve in the spectra is computed numerically (Ahmed, 1998). Efforts have also been made to construct the smooth response spectra for Dhaka soil. And the design response spectra were then compared with the spectra proposed in Uniform Building Code (UBC, 1997).
2. Methodology
As there is a lack of appropriate earthquake data, for generation of time history and response spectrum, recent collected data of earthquake Natore (Ansary, 2009) is chosen. Time history for earthquake data for Dhaka was generated first through scaling as per peak ground acceleration of Dhaka region according to Bangladesh National Building Code (BNBC, 1993). Then from these time history along with the soil characteristics of S3 soil, site location and seismic coefficients, seismic response coefficient 5% damped response spectrum for Dhaka has been generated following the stated procedure in the subsequent section.
2.1 Mode Superposition Method The basic mode superposition method, which is restricted to linearly elastic analysis, produces the complete time history response of joint displacements and member forces. The method involves the calculation of only the maximum values of the displacements and member forces in each mode using smooth design spectra. There are computational advantages in using the method for prediction of displacements, velocity and acceleration of ground subjected to structural systems. For this purpose equations of motion for linear analysis are transformed into the eigenvectors or normal coordinate system. Applying the normal coordinate transformation in accordance with Clough and Penzien (1993) the following decoupled equation of motion for individual modes leads to
Mn Ÿn(t)+CnÝ(t)+KnYn(t) = Pn(t) (1a)
Where the modal coordinate mass, damping, stiffness and load are defined as: Mn= Фn
TmФn , Cn= ФnTcФn, Kn= Фn
TkФn and Pn= ФnTpФn
For three dimensional seismic motions the typical modal equation can be rewritten as
ÿ(t)n +2ζωný(t)n + ωn2y(t)n = Pnx ü(t)gx + Pny ü(t)gy + Pnz ü(t)gz (1b)
where three mode participation factors are defined by Pni= -Фn
TMi in which i is equal to x, y or z, ζ is modal damping ratio and ωn is un-damped natural frequency. Two major problems must be solved in order to obtain an approximate response spectrum solution to this equation. First, for each direction of ground motion maximum peak forces and displacements must be estimated. Second, after the response for the three orthogonal directions is solved it is necessary to estimate the maximum response due to the three components of earthquake motion acting at the same time. Now the time integration can be carried out individually for each decoupled modal equation (1). This can be accomplished by numerical evaluation of the Duhamel Integral (Clough and Penzien,1993). For input in one direction only, Equation (1) is written as
ÿ(t)n +2ζωný(t)n + ωn
2y(t)n = Pni ü(t)g (2a) For a specified ground motion ü(t)g, damping value and assuming Pni = - 0.10 it is possible to solve Eq. (2) at various values of ω and plot a curve of the maximum peak response y(ω)max. Assigning Pni = -1.0 Eq. (2a) can be modified to
ÿ(t)n +2ζωný(t)n + ωn2y(t)n = - ü(t)g (2b)
To get the solution of y(t) Duhamel’s Integral is commonly used (Clough and Penzien,1975). Here a spreadsheet in excel has been developed for solution by Duhamel’s Integral (discussed at subsequent section) and relative displacement values have been obtained for corresponding time period. This curve is by definition the displacement response spectrum for the earthquake motion. A different curve will exist for each different value of damping. A plot of ωy(ω )max is defined as the pseudo-velocity spectrum and a plot of ω2y(ω )max is defined as the pseudo-acceleration spectrum. These three curves are normally plotted as one curve on special log paper. However, these pseudo- values have minimum physical significance and are not an essential part of a
58 A.B.M. Saiful Islam1, Syed Ishtiaq Ahmad2 and Mohammed Jameel3
response spectrum analysis. The true values for maximum velocity and acceleration are calculated from the solution of Eq. (2). There is a mathematical relationship, however, between the pseudo-acceleration spectrum and the total acceleration spectrum. The total acceleration of the unit mass, single degree-of-freedom system, governed by Eq. (2), is given by
ü(t)T = ÿ(t) + ü(t)g (3) Eq. (2) can be solved for ÿ(t) and substituted into Eq. (3) which yields
ü(t)T = -2ζωý(t) - ω2y(t) (4)
Therefore, for the special case of zero damping, the total acceleration of the system is equal to ω2 y(t) .For this reason, the displacement response spectrum curve is normally not plotted as modal displacement y(ω)MAX vs. ω It is standard to present the curve in terms of S(ω)a vs. a period T in seconds. Where
S(ω)a = ω2 y (ω)MAX (5a) and T = 2π/ ω (5b)
The pseudo-acceleration spectrum, S(ω)a, curve has the units of acceleration vs. period. It is apparent that all response spectrum curves represent the properties of the earthquake at a specific site and are not a function of the properties of the structural system. After an estimation of the linear viscous damping properties of the structure is made, a specific response spectrum curve is selected.
2.1.1 Duhamel’s Integral Duhamel’s Integral, solved in a piecewise exact fashion, idealizes the forcing function as a succession of short-impulse being followed by a free vibration response (Ebeling, 1992). Superposition is used to combine each of short duration impulse/free vibration response with the total response for the structural model. For a continuous forcing function, P(t) is divided into a series of duration dτ. The change in velocity of the SDOF system due to the impulsive load may be determined from Newton’s Law of motion:
(6) or
(7) Where p(τ) dτ is the impulse, and dx’ is the incremental velocity. This incremental velocity may be considered to be initial velocity of the SDOF system at time τ. The solution to the equation of motion for free vibration is
(8) Where
(9) Substituting the Eq. (7) for x’0 in the second term of Eq. (8) and assuming x0= 0 results in
(10) The total relative displacement can be determined by summing the differential responses, given by Eq. (10), over the entire loading interval:
(11) Using the trigonometric identity:
Generation of Response Spectra Along With Time History for Earthquake in Dhaka for Dynamic Analysis of Structure 59
(12) Eq. (11) may be written
(13)
(14a) and
(14b) The expressions in Eq. (14) can be solved by several techniques. For this study, the loading function P(τ) is assumed to be piecewise linear and an exact solution formulated.
(15) where
(16) When Eq. (15) is substituted into the expressions of Eq. (14) and the intermediate variables I1,I2,I3 and I4 given in Eq. (17) are used , Eq. (18) represents an exact solution.
(17)
Where I1’ and I2’ are the integrals for I1 and I2 before their evaluation at the limits. By introducing the following relationships
(18)
The relative displacement, velocity and acceleration may be determined using Eqs. (19), (20) and (21) respectively.
(19)
60 A.B.M. Saiful Islam1, Syed Ishtiaq Ahmad2 and Mohammed Jameel3
(20)
(21) (Green et al., 1997)
After getting the response spectrum uneven curve it was then smoothen to make it suitable to use in design.
3. Generation Of Time History
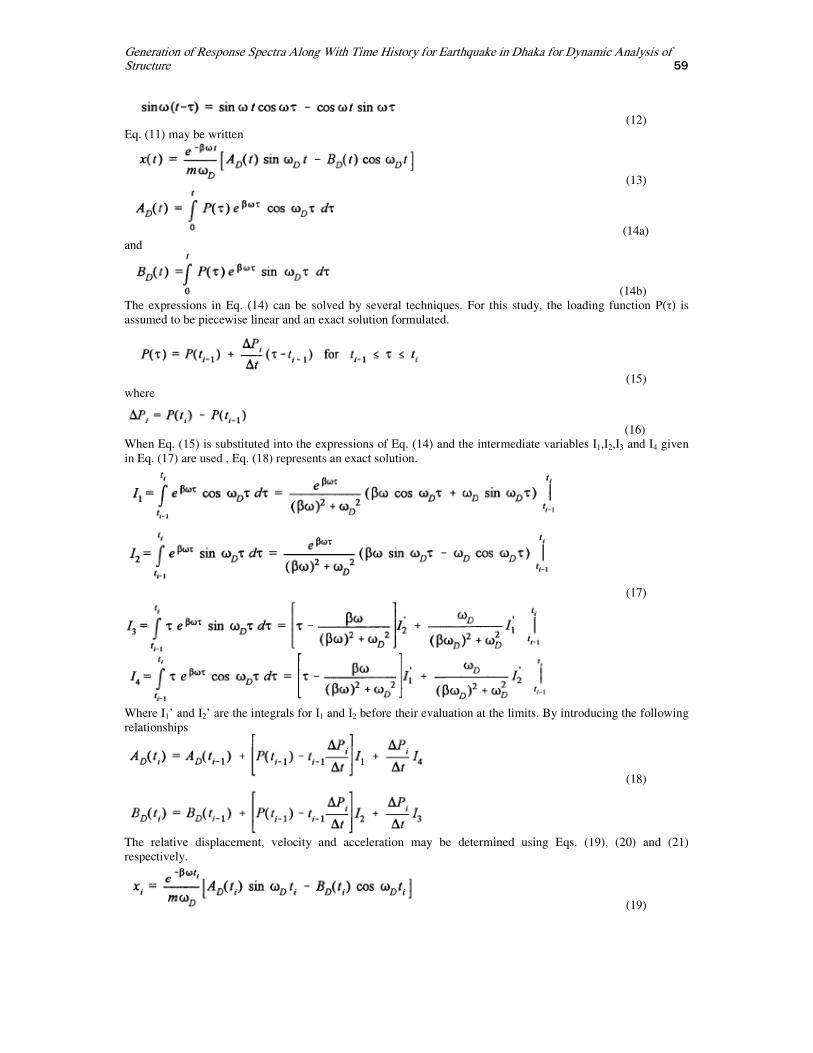
In this study an earthquake record obtained at Natore (Ansary, 2009) is taken which has been used to develop earthquake time history for Dhaka first after appropriate scaling. The acceleration data for recent earthquake at Station ID: ALTUS S/N 2928, 06th Jan 2009 16:04:03 (GMT), Magnitude 4.0, Place: Natore, Bangladesh is shown in Fig. 1. Displacements, Velocity data of this earthquake are shown as apt for Dhaka after scaling in Fig. 2.
EW direction
NS direction
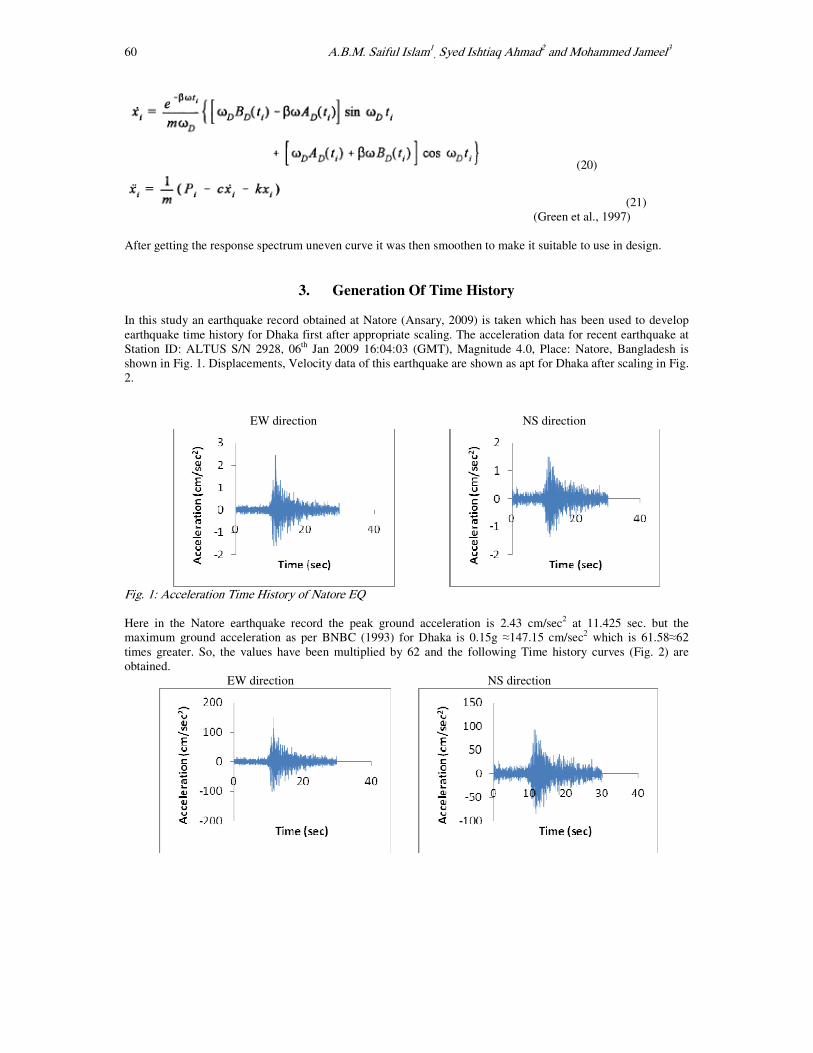
Fig. 1: Acceleration Time History of Natore EQ Here in the Natore earthquake record the peak ground acceleration is 2.43 cm/sec2 at 11.425 sec. but the maximum ground acceleration as per BNBC (1993) for Dhaka is 0.15g ≈147.15 cm/sec2 which is 61.58≈62 times greater. So, the values have been multiplied by 62 and the following Time history curves (Fig. 2) are obtained.
EW direction NS direction
Generation of Response Spectra Along With Time History for Earthquake in Dhaka for Dynamic Analysis of Structure 61
Fig. 2: Time History for Earthquake in Dhaka
4. Generation Of Response Spectrum
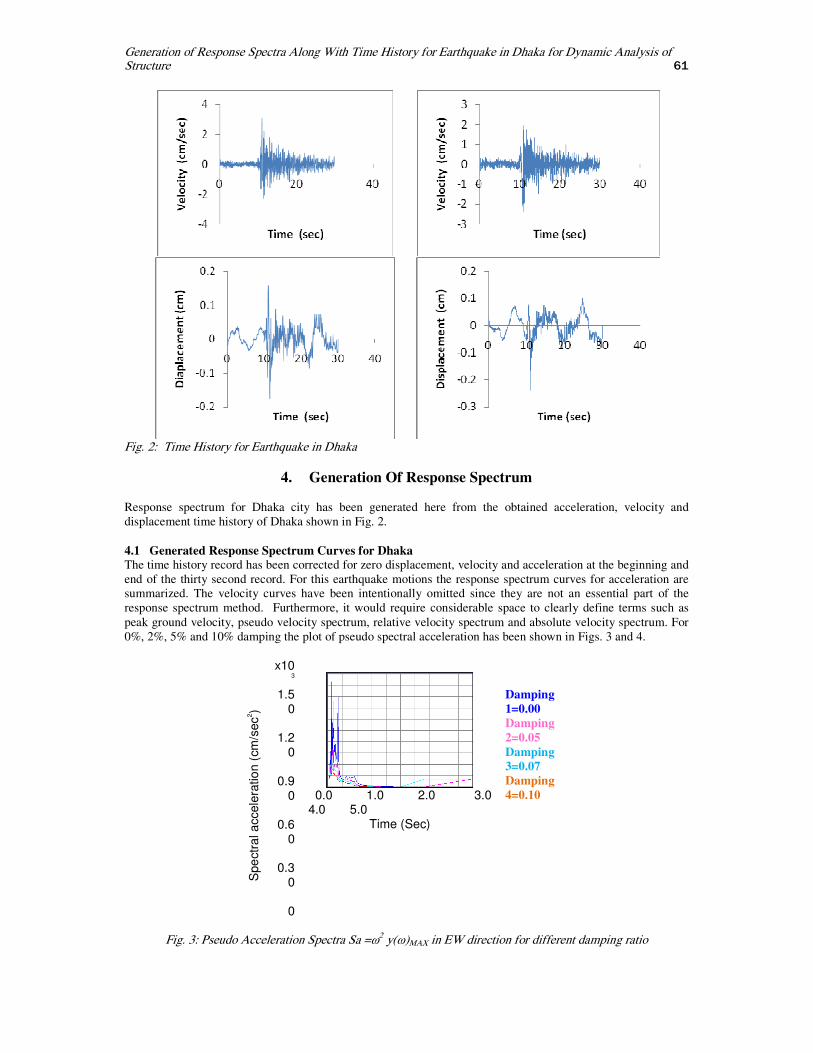
Response spectrum for Dhaka city has been generated here from the obtained acceleration, velocity and displacement time history of Dhaka shown in Fig. 2. 4.1 Generated Response Spectrum Curves for Dhaka The time history record has been corrected for zero displacement, velocity and acceleration at the beginning and end of the thirty second record. For this earthquake motions the response spectrum curves for acceleration are summarized. The velocity curves have been intentionally omitted since they are not an essential part of the response spectrum method. Furthermore, it would require considerable space to clearly define terms such as peak ground velocity, pseudo velocity spectrum, relative velocity spectrum and absolute velocity spectrum. For 0%, 2%, 5% and 10% damping the plot of pseudo spectral acceleration has been shown in Figs. 3 and 4.
Spe
ctr
al a
ccele
ratio
n (
cm
/sec
2)
x103
1.50
1.20
0.90
0.60
0.30
0
0.0 1.0 2.0 3.0 4.0 5.0
Time (Sec)
Damping
1=0.00
Damping
2=0.05
Damping
3=0.07
Damping
4=0.10
Fig. 3: Pseudo Acceleration Spectra Sa =ω2 y(ω)MAX in EW direction for different damping ratio
62 A.B.M. Saiful Islam1, Syed Ishtiaq Ahmad2 and Mohammed Jameel3
Spe
ctr
al a
cce
lera
tion (
cm
/sec
2)
x103
1.20
0.96
0.72
0.48
0.24
0
0.0 1.0 2.0 3.0 4.0 5.0
Time (Sec)
Damping
1=0.00
Damping
2=0.05
Damping
3=0.07
Damping
4=0.10
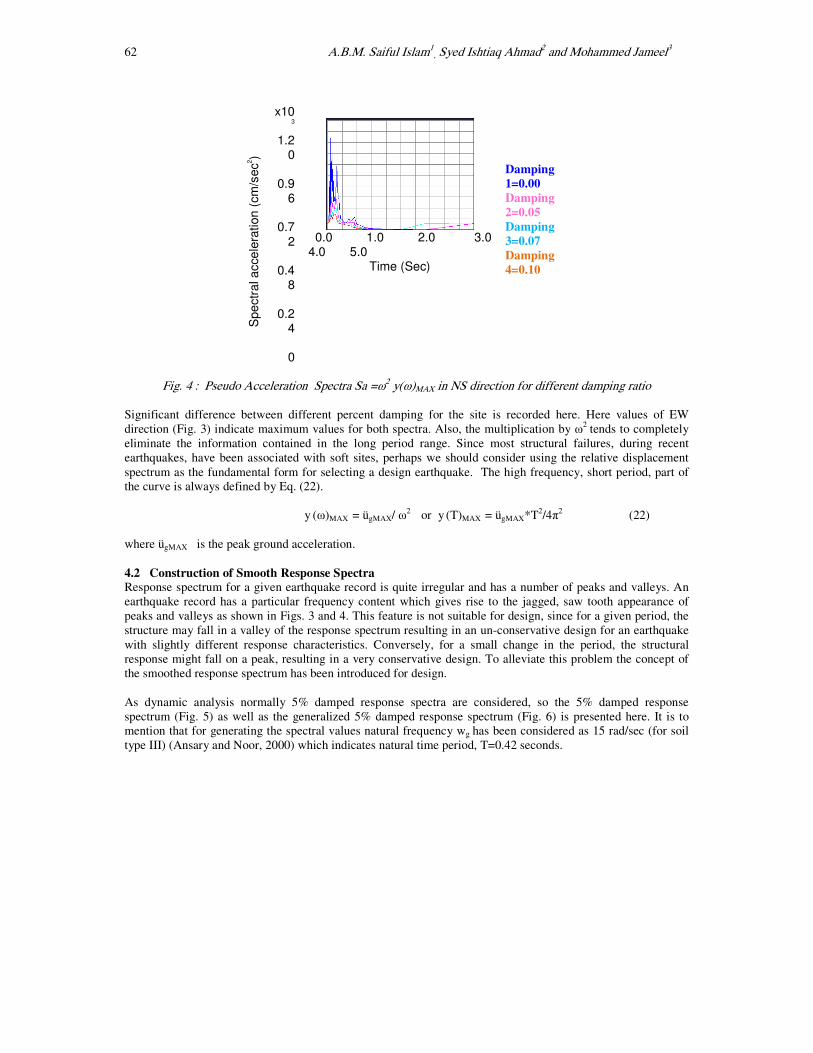
Fig. 4 : Pseudo Acceleration Spectra Sa =ω2 y(ω)MAX in NS direction for different damping ratio Significant difference between different percent damping for the site is recorded here. Here values of EW direction (Fig. 3) indicate maximum values for both spectra. Also, the multiplication by ω2 tends to completely eliminate the information contained in the long period range. Since most structural failures, during recent earthquakes, have been associated with soft sites, perhaps we should consider using the relative displacement spectrum as the fundamental form for selecting a design earthquake. The high frequency, short period, part of the curve is always defined by Eq. (22).
y (ω)MAX = ügMAX/ ω2 or y (T)MAX = ügMAX*T2/4π2 (22) where ügMAX is the peak ground acceleration.
4.2 Construction of Smooth Response Spectra
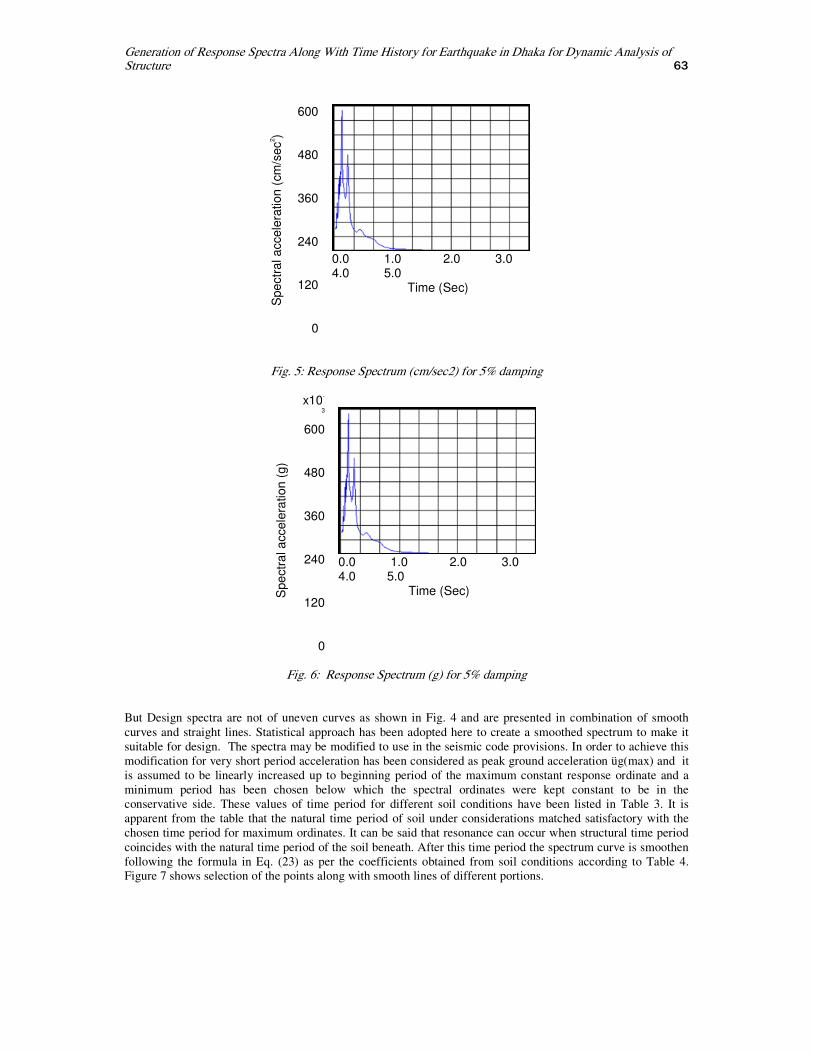
Response spectrum for a given earthquake record is quite irregular and has a number of peaks and valleys. An earthquake record has a particular frequency content which gives rise to the jagged, saw tooth appearance of peaks and valleys as shown in Figs. 3 and 4. This feature is not suitable for design, since for a given period, the structure may fall in a valley of the response spectrum resulting in an un-conservative design for an earthquake with slightly different response characteristics. Conversely, for a small change in the period, the structural response might fall on a peak, resulting in a very conservative design. To alleviate this problem the concept of the smoothed response spectrum has been introduced for design. As dynamic analysis normally 5% damped response spectra are considered, so the 5% damped response spectrum (Fig. 5) as well as the generalized 5% damped response spectrum (Fig. 6) is presented here. It is to mention that for generating the spectral values natural frequency wg has been considered as 15 rad/sec (for soil type III) (Ansary and Noor, 2000) which indicates natural time period, T=0.42 seconds.
Generation of Response Spectra Along With Time History for Earthquake in Dhaka for Dynamic Analysis of Structure 63
Spe
ctr
al a
ccele
ration
(cm
/sec
2)
600
480
360
240
120
0
0.0 1.0 2.0 3.0 4.0 5.0
Time (Sec)
Fig. 5: Response Spectrum (cm/sec2) for 5% damping
Spe
ctr
al a
ccele
ration
(g)
x10-
3
600
480
360
240
120
0
0.0 1.0 2.0 3.0 4.0 5.0
Time (Sec)
Fig. 6: Response Spectrum (g) for 5% damping
But Design spectra are not of uneven curves as shown in Fig. 4 and are presented in combination of smooth curves and straight lines. Statistical approach has been adopted here to create a smoothed spectrum to make it suitable for design. The spectra may be modified to use in the seismic code provisions. In order to achieve this modification for very short period acceleration has been considered as peak ground acceleration üg(max) and it is assumed to be linearly increased up to beginning period of the maximum constant response ordinate and a minimum period has been chosen below which the spectral ordinates were kept constant to be in the conservative side. These values of time period for different soil conditions have been listed in Table 3. It is apparent from the table that the natural time period of soil under considerations matched satisfactory with the chosen time period for maximum ordinates. It can be said that resonance can occur when structural time period coincides with the natural time period of the soil beneath. After this time period the spectrum curve is smoothen following the formula in Eq. (23) as per the coefficients obtained from soil conditions according to Table 4. Figure 7 shows selection of the points along with smooth lines of different portions.
64 A.B.M. Saiful Islam1, Syed Ishtiaq Ahmad2 and Mohammed Jameel3
Tb Tc= Tsm Spectral Acceleration Ta
Time (Sec)
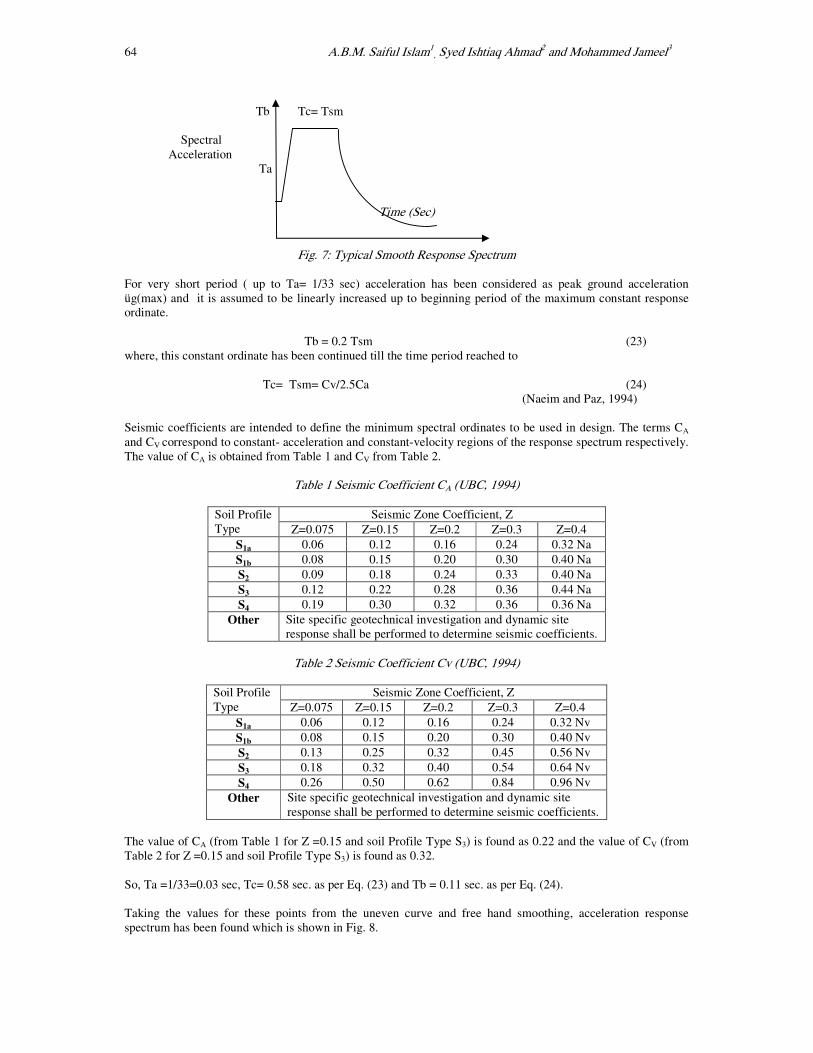
Fig. 7: Typical Smooth Response Spectrum For very short period ( up to Ta= 1/33 sec) acceleration has been considered as peak ground acceleration üg(max) and it is assumed to be linearly increased up to beginning period of the maximum constant response ordinate. Tb = 0.2 Tsm (23) where, this constant ordinate has been continued till the time period reached to Tc= Tsm= Cv/2.5Ca (24) (Naeim and Paz, 1994) Seismic coefficients are intended to define the minimum spectral ordinates to be used in design. The terms CA and CV correspond to constant- acceleration and constant-velocity regions of the response spectrum respectively. The value of CA is obtained from Table 1 and CV from Table 2.
Table 1 Seismic Coefficient CA (UBC, 1994)
Soil Profile Type
Seismic Zone Coefficient, Z Z=0.075 Z=0.15 Z=0.2 Z=0.3 Z=0.4
S1a 0.06 0.12 0.16 0.24 0.32 Na S1b 0.08 0.15 0.20 0.30 0.40 Na S2 0.09 0.18 0.24 0.33 0.40 Na S3 0.12 0.22 0.28 0.36 0.44 Na S4 0.19 0.30 0.32 0.36 0.36 Na
Other Site specific geotechnical investigation and dynamic site response shall be performed to determine seismic coefficients.
Table 2 Seismic Coefficient Cv (UBC, 1994)
Soil Profile Type
Seismic Zone Coefficient, Z Z=0.075 Z=0.15 Z=0.2 Z=0.3 Z=0.4
S1a 0.06 0.12 0.16 0.24 0.32 Nv S1b 0.08 0.15 0.20 0.30 0.40 Nv S2 0.13 0.25 0.32 0.45 0.56 Nv S3 0.18 0.32 0.40 0.54 0.64 Nv S4 0.26 0.50 0.62 0.84 0.96 Nv
Other Site specific geotechnical investigation and dynamic site response shall be performed to determine seismic coefficients.
The value of CA (from Table 1 for Z =0.15 and soil Profile Type S3) is found as 0.22 and the value of CV (from Table 2 for Z =0.15 and soil Profile Type S3) is found as 0.32.
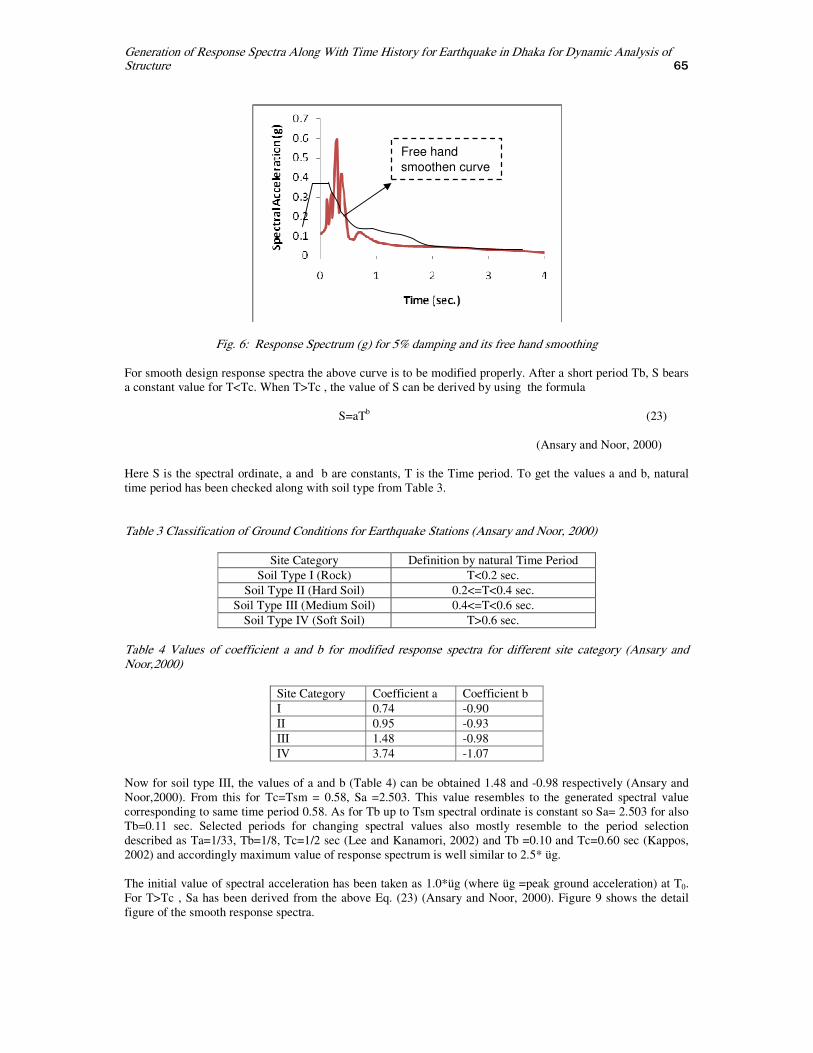
So, Ta =1/33=0.03 sec, Tc= 0.58 sec. as per Eq. (23) and Tb = 0.11 sec. as per Eq. (24). Taking the values for these points from the uneven curve and free hand smoothing, acceleration response spectrum has been found which is shown in Fig. 8.
Generation of Response Spectra Along With Time History for Earthquake in Dhaka for Dynamic Analysis of Structure 65
Fig. 6: Response Spectrum (g) for 5% damping and its free hand smoothing
For smooth design response spectra the above curve is to be modified properly. After a short period Tb, S bears a constant value for T<Tc. When T>Tc , the value of S can be derived by using the formula
S=aTb (23)
(Ansary and Noor, 2000) Here S is the spectral ordinate, a and b are constants, T is the Time period. To get the values a and b, natural time period has been checked along with soil type from Table 3. Table 3 Classification of Ground Conditions for Earthquake Stations (Ansary and Noor, 2000)
Site Category Definition by natural Time Period Soil Type I (Rock) T<0.2 sec.
Soil Type II (Hard Soil) 0.2<=T<0.4 sec. Soil Type III (Medium Soil) 0.4<=T<0.6 sec.
Soil Type IV (Soft Soil) T>0.6 sec. Table 4 Values of coefficient a and b for modified response spectra for different site category (Ansary and Noor,2000)
Site Category Coefficient a Coefficient b I 0.74 -0.90 II 0.95 -0.93 III 1.48 -0.98 IV 3.74 -1.07
Now for soil type III, the values of a and b (Table 4) can be obtained 1.48 and -0.98 respectively (Ansary and Noor,2000). From this for Tc=Tsm = 0.58, Sa =2.503. This value resembles to the generated spectral value corresponding to same time period 0.58. As for Tb up to Tsm spectral ordinate is constant so Sa= 2.503 for also Tb=0.11 sec. Selected periods for changing spectral values also mostly resemble to the period selection described as Ta=1/33, Tb=1/8, Tc=1/2 sec (Lee and Kanamori, 2002) and Tb =0.10 and Tc=0.60 sec (Kappos, 2002) and accordingly maximum value of response spectrum is well similar to 2.5* üg. The initial value of spectral acceleration has been taken as 1.0*üg (where üg =peak ground acceleration) at T0. For T>Tc , Sa has been derived from the above Eq. (23) (Ansary and Noor, 2000). Figure 9 shows the detail figure of the smooth response spectra.
Free hand
smoothen curve
66 A.B.M. Saiful Islam1, Syed Ishtiaq Ahmad2 and Mohammed Jameel3
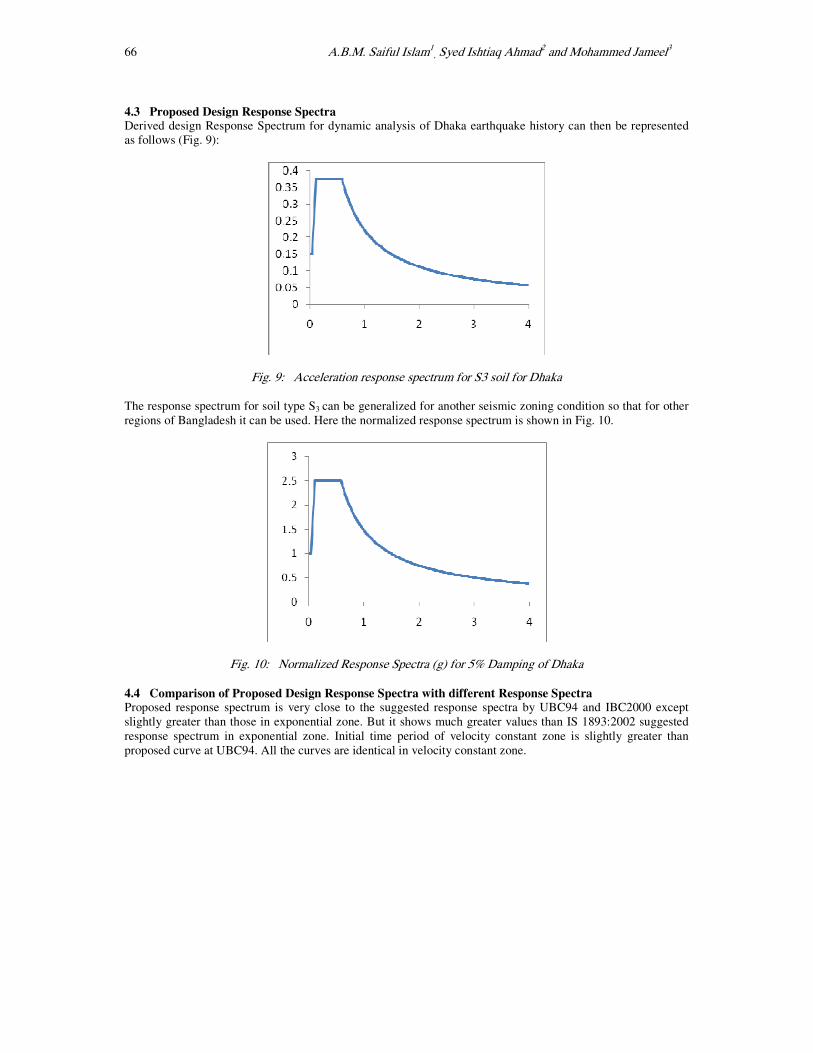
4.3 Proposed Design Response Spectra Derived design Response Spectrum for dynamic analysis of Dhaka earthquake history can then be represented as follows (Fig. 9):
Fig. 9: Acceleration response spectrum for S3 soil for Dhaka The response spectrum for soil type S3 can be generalized for another seismic zoning condition so that for other regions of Bangladesh it can be used. Here the normalized response spectrum is shown in Fig. 10.
Fig. 10: Normalized Response Spectra (g) for 5% Damping of Dhaka
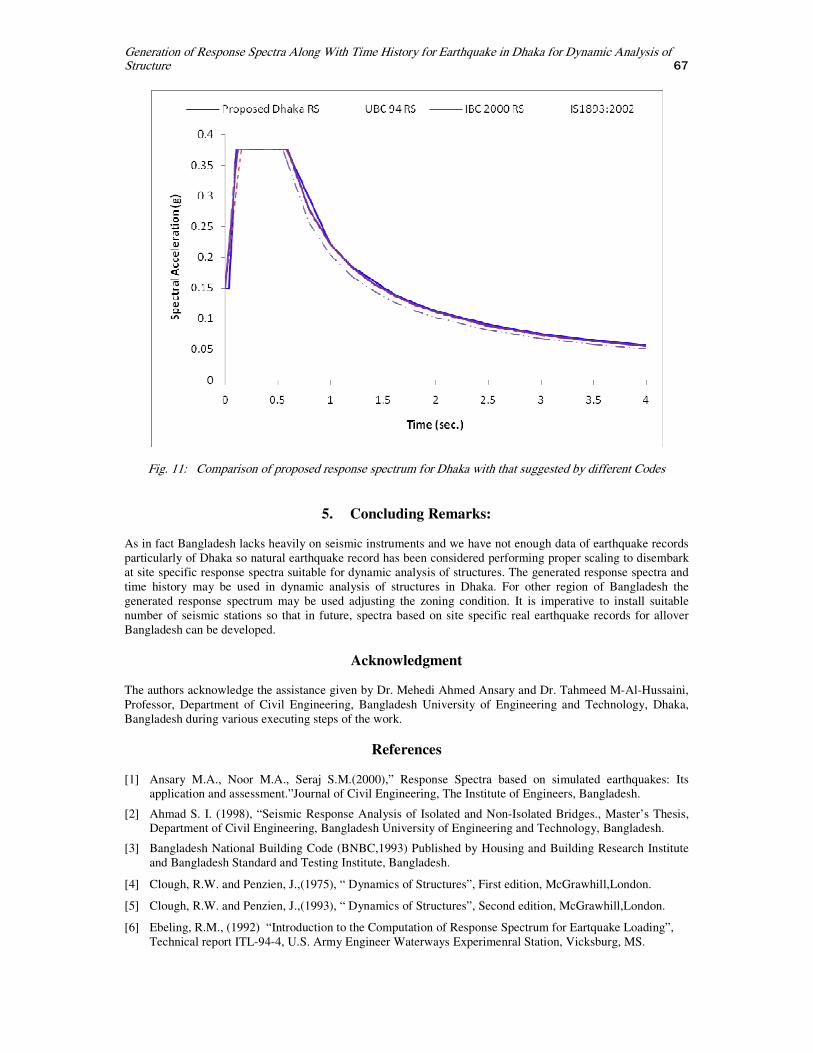
4.4 Comparison of Proposed Design Response Spectra with different Response Spectra Proposed response spectrum is very close to the suggested response spectra by UBC94 and IBC2000 except slightly greater than those in exponential zone. But it shows much greater values than IS 1893:2002 suggested response spectrum in exponential zone. Initial time period of velocity constant zone is slightly greater than proposed curve at UBC94. All the curves are identical in velocity constant zone.
Generation of Response Spectra Along With Time History for Earthquake in Dhaka for Dynamic Analysis of Structure 67
Fig. 11: Comparison of proposed response spectrum for Dhaka with that suggested by different Codes
5. Concluding Remarks:
As in fact Bangladesh lacks heavily on seismic instruments and we have not enough data of earthquake records particularly of Dhaka so natural earthquake record has been considered performing proper scaling to disembark at site specific response spectra suitable for dynamic analysis of structures. The generated response spectra and time history may be used in dynamic analysis of structures in Dhaka. For other region of Bangladesh the generated response spectrum may be used adjusting the zoning condition. It is imperative to install suitable number of seismic stations so that in future, spectra based on site specific real earthquake records for allover Bangladesh can be developed.
Acknowledgment The authors acknowledge the assistance given by Dr. Mehedi Ahmed Ansary and Dr. Tahmeed M-Al-Hussaini, Professor, Department of Civil Engineering, Bangladesh University of Engineering and Technology, Dhaka, Bangladesh during various executing steps of the work.
References
[1] Ansary M.A., Noor M.A., Seraj S.M.(2000),” Response Spectra based on simulated earthquakes: Its application and assessment.”Journal of Civil Engineering, The Institute of Engineers, Bangladesh.
[2] Ahmad S. I. (1998), “Seismic Response Analysis of Isolated and Non-Isolated Bridges., Master’s Thesis, Department of Civil Engineering, Bangladesh University of Engineering and Technology, Bangladesh.
[3] Bangladesh National Building Code (BNBC,1993) Published by Housing and Building Research Institute and Bangladesh Standard and Testing Institute, Bangladesh.
[4] Clough, R.W. and Penzien, J.,(1975), “ Dynamics of Structures”, First edition, McGrawhill,London.
[5] Clough, R.W. and Penzien, J.,(1993), “ Dynamics of Structures”, Second edition, McGrawhill,London.
[6] Ebeling, R.M., (1992) “Introduction to the Computation of Response Spectrum for Eartquake Loading”, Technical report ITL-94-4, U.S. Army Engineer Waterways Experimenral Station, Vicksburg, MS.
68 A.B.M. Saiful Islam1, Syed Ishtiaq Ahmad2 and Mohammed Jameel3
[7] Green R. A., French S. E., Ebeling R.M. (1997), “Accuracy of Response of single-degree-of freedom sustems to Ground motion”, Technical report ITL-97-7, US Army Corps of Engineers.
[8] International Building Code (2000), “International Code Council”, Falls Church,VA. Published in Spring 2000.
[9] IS 1893-Part 1(2002), “Criteria for earthquake resistant design of structures-General provisions and buildings”, Bureau of Indian standards, New Delhi.
[10] Jamuna Bridge Seismic Instrumentation Project: Natore Strong Motion Date 06th January,2009 (Prof. Ansary, Personal communication)
[11] Kappos A. J.(2002), “Dynamic Loading and design of structure”
[12] Lee W. HK., Kanamori H.(2002) . “International Handbook of Earthquake and Engineering Seismology”
[13] Naeim Farzad and Paz M. (1994), “ Seismic Response and Design Spectra”, International Hand book of earthquake Engineering.
[14] Newmark, N.M. (1959), “A Method of Computation of Structural dynamics”, Journal of the Engineering Mechanics Division, ASCE, Vol. 85. p 67-94.
[15] Uniform Building Code (1994), Chapter 23, Part III, Earthquake Design, U.S.A.
NOTATIONS CA = Seismic Coefficient correspond to the constant-acceleration region CV = Seismic Coefficient correspond to the constant-velocity region g = Acceleration due to gravity Na = Near Source Factor at constant acceleration Nv = Near Source Factor at constant velocity S(ω)a = Psedu Acceleration Spectrum = ω2 y(ω)MAX T = Time period Tsm = Time period corresponding to the maximum response üg = Peak ground acceleration ü(t)g = Specified ground motion ü(t)T = Total acceleration of the unit mass, single degree-of-freedom system ωy(ω)MAX = Pseudo-velocity spectrum ω = Natural Frequency ωD = Damped Natural Frequency ωn = Un-damped Natural Frequency ζ = Modal damping ratio
ABBREVIATIONS
BNBC = Bangladesh National Building Code UBC = Uniform National Building Code IS = Indian seismic Code IBC = International Building Code


![A Study on Window Configuration to Enhance Daylight ... · 2.1 Present daylight situation in apartments in Dhaka ... (BNBC) Guideline the ... [BNBC, chapter 8, Table 8.1.5] -Based](https://img.pdfslide.us/doc/110x75/5b51a70b7f8b9a7b648c3ff5/a-study-on-window-configuration-to-enhance-daylight-21-present-daylight.jpg)