Embed Size (px)
Citation preview
Generation of Realistic Social Network Datasets
for Testing of Analysis and Simulation Tools
Maksim Tsvetovat Kathleen M. Carley
Sept 26, 2005CMU-ISRI-05-130
School of Computer ScienceCarnegie Mellon University
Pittsburgh, PA 15213
To appear in CMU ISRI Technical Reports Series
This work was supported in part by the DOD, and National Science Foundation(MKIDS: IIS0218466), the Office of Naval Research under Dynamic Network Analysisprogram (N00014-02-1-0973) and the National Science Foundation under the IGERT pro-gram for training and research in CASOS, NSF ITR 1040059. Additional support wasprovided by CASOS - the center for Computational Analysis of Social and OrganizationalSystems at Carnegie Mellon University. The views and conclusions contained in this doc-ument are those of the authors and should not be interpreted as representing the officialpolicies, either expressed or implied, of the Office of Naval Research, the DOD, the NSFor the U.S. government.
Abstract
Testing large-scale dynamic network simulation packages such asNetWatch[34] requires a large quantity of test data to be available for eachof the experiments. The test data includes initial topologies of agents’ socialnetworks and specification of knowledge networks for each of the agents tofit an empirically derived distribution of knowledge.Testing the software on machine-generated data, as opposed to empiricaldata only, allows the user to conduct repeatable tests that stress certainaspects of the software and help in debugging and optimization of softwareperformance.
Keywords: Social Networks, social simulation, scale-free networks, cel-lular networks, random graphs, software testing
1 Introduction
Testing large-scale dynamic network simulation packages such as NetWatch[34]requires a large quantity of test data to be available for each of the exper-iments. The test data includes initial topologies of agents’ social networksand specification of knowledge networks for each of the agents to fit an empir-ically derived distribution of knowledge. Another task is creation of realistictask structures that could be used to simulate performance of complex inter-dependent projects by groups of agents.
The main concern in generation of artificial data is its realism. Basedon open-source empirical data (such as described in sec. 4), the artificialdatasets need to approximate certain qualities or parameters found in theempirical data. However, it is unclear at the outset what parameters needto be emulated to achieve highest fidelity simulation.
Frequently, theories of network topologies in a particular setting are pro-posed. For example, large amount of social network research relies on as-sumptions made by Erdos [15] regarding topology and distances in ran-dom graphs. As an elaboration of Erdos networks, small-world networktopologies[37] retain many properties of random graphs, yet providing adegree of structural realism that maps to macro-level structures of socialnetworks and communities[27] .
However, it is now clear that purely random graphs are not a good approx-imation of topology of social networks. Other proposed topologies includescale-free networks[3], whose role in modeling social networks we discuss insection 2.
While none of these theories has emerged as a clear winner and new ideasof network topologies in large-scale social networks are frequently published,it is important to make simulation tools independent of the models and theo-ries of initial network topology. Furthermore, a simulation tool that is provenand validated through docking and comparison with empirical results can beused as a means to test validity of multiple theories of network topology - ortest its own assumptions against all possible networks.
Testing the software on machine-generated data, as opposed to empiricaldata only, allows the user to conduct repeatable tests that stress certainaspects of the software and help in debugging and optimization of softwareperformance.
As number and complexity of social network analysis algorithms grows,it becomes more and more important to test these algorithms for accuracy,
1
scalability, robustness. We define robustness of a measurement algorithm asa function of degradation of quality of measurements with decay of the datamodelled as introduction of noise into inputs of the algorithms.
Robustness studies such as [6] and [11] measure impact of decay in ran-dom networks on accuracy of computation of standard social network analysismetrics. Such rigorous tests require large amounts of data which can be easilymanipulated to introduce errors. Networks used as input to the robustnessstudy need to span different sizes and topologies, and be easily manipulatedto introduce a quantifiable amount of noise for robustness testing. This prob-lem is much easier to solve using synthetic (generated) data, where size andtopology of the network are controlled by generation functions[9]. SNA algo-rithms need to be then tested against multiple network topologies. Moreover,parameters of the network generator can be manipulated in a scientific fash-ion, thus allowing the measurement algorithm to be also tested on possiblevariation of the topology.
2
2 Terrorist Organizations and Scale-Free Net-
works
An argument has been made[30] that terrorist networks may exhibit fea-tures of scale-free networks and can thus be treated as such in analysis andderivation of attack scenarios.
Scale-free networks have been observed in many contexts ranging fromnetworks of airline traffic to sexual networks and Web link patterns. Thehigh probability of emergence of scale-free networks, as opposed to evenlydistributed random networks, is due to a number of factors, including:
• Rapid growth confers preference to early entrants. The longer a nodehas been in place the greater the number of links to it. First moveradvantage is very important.
• In an environment of too much information people link to nodes that areeasier to find - thus nodes that are highly connected. Thus preferentiallinking is self-reinforcing.
• The greater the capacity of the hub (bandwidth, work ethic, etc.) thefaster its growth.
It has also been observed that scale-free networks are extremely tolerant ofrandom failures. In a random network, a small number of random failures cancollapse the network. A scale-free network can absorb random failures up to80% of its nodes before it collapses. The reason for this is the inhomogeneityof the nodes on the network – failures are much more likely to occur onrelatively small nodes.
However, scale-free networks are extremely vulnerable to intentional at-tacks on their hubs. Attacks that simultaneously eliminate as few as 5-15% ofa scale-free network’s hubs can collapse the network. Simultaneity of an at-tack on hubs is important. Scale-free networks can heal themselves rapidly ifan insufficient number of hubs necessary for a systemic collapse are removed.
Scale-free networks are also very vulnerable to epidemics. In randomnetworks, epidemics need to surpass a critical threshold (a number of nodesinfected) before it propagates system-wide. Below the threshold, the epi-demic dies out. Above the threshold, the epidemic spreads exponentially.Recent evidence[28] indicates that the threshold for epidemics on scale-freenetworks is zero.
3
However, the reality of terrorist networks does not fit neatly into thescale-free network model. It has been observed[31] that non-state terroristnetworks are not only scale-free but also exhibit small world properties. Thismeans that while large hubs still dominate the network, the presence oftight clusters (cells) continue to provide local connectivity when the hubs areremoved.
For example, attack on Al Qaeda’s Afghanistan training camps did notcollapse its network in any meaningful way. Rather, it atomized the networkinto anonymous clusters of connectivity until the hubs could reassert theirpriority again. Many of these clusters will still be able to conduct attackseven without the global connectivity provided by the hubs.
Furthermore, critical terrorist social network hubs cannot be identifiedbased on the number of links alone. For example, Krebs observed[25] thatstrong face-to-face social history is extremely important for trust develop-ment in covert networks. Of similar importance is the relevance of skillsand training of agents inside a cell to the task at hand. Thus, importanceof any individual within the network should be rated on a vector of factorspertaining to its qualities as an individual as well as types and qualities ofits links.
Rothenberg[31] notes that postulating a path of a set length from every-one in the global network to everyone else (i.e. scale-free nature of a terroristnetwork) runs contrary to the instructions for communication infrastructureset forth in the Al Qaeda training manual[1]. Thus, if a terrorist networkwas observed to be scale-free, it can be argued that its scale-free nature isnot a matter of design and can possibly be an artifact of the data collectionroutines. For example, snowball sampling[19] is biased toward highly con-nected nodes, so extensive use of this technique may result in observation ofscale-free core-periphery structures where none exist[5].
3 Developing the Formalism of a Cellular Net-
work
Given the case studies of Al Qaeda and other terrorist networks, it is clearthat terrorist organizations cannot be adequately described as random graphsor as scale-free networks. Therefore, a different model of terrorist networkshas emerged, namely cellular networks [31][10][12]. While this model may
4

not fit a simple mathematical definition such as scale-free or small-worldnetwork, its base is in empirical and field data[18]. In section 5.3, I will showthat cellular networks in fact are not characterized by a lack of a formalrepresentation but are defined through a more complex process which takesas a goal improvement of fit between the model network and empirical data.
Cellular networks[7] are different from traditional organizational forms asthey replace a hierarchical structure and chain of command with sets of quasi-independent cells, distributed command, and rapid ability to build larger cellsfrom sub-cells as the task or situation demands. In these networks, the cellsare often small and are only marginally connected to each other. The cellsare distributed geographically, and may take on tasks independently of anycentral authority[8].
Rothenberg[31] observed a number of properties of a cellular network:
• The entire network is a connected component.
...It is likely that on the local level, individual ties are verystrong...On the higher level, individual ties are likely to beweaker but the strength of association [people known in com-mon, doctrine] is likely to remain high...
• The network is redundant on every level: Each person can reach otherpeople by multiple routes - which can be used for both transmissionof information as well as material. On the local level, there will be aconsiderable structural equivalence[35], which will ameliorate the lossof an individual. The redundancy in communication channels may alsobe mirrored in the redundance of groups engaged in a particular task.
• On the local level, the network is small and dynamic, consisting ofsmall cells (4-6 people) that operate with relative independence andlittle oversight on the operational level.
• The network is not managed in a top-down fashion. Instead, its com-mand structure depends on vague directives and religious decrees, whileleaving local leaders the latitude to make operational decisions on theirown.
• The organizational structure of a terrorist network was not planned,but emerged from the local constraints that mandated maintenance ofsecrecy balanced with operational efficiency.
5
Each cell is, at least in part, functionally self-sufficient and is capable ofexecuting a task independently. Cells are loosely interconnected with eachother for purposes of exchanging information and resources. However, theinformation is usually distributed on a need-to-know basis and new cell mem-bers rarely have the same exact skills as current members. This essentiallymakes each individual cell expendable. The removal of a cell generally doesnot inflict permanent damage on the overall organization or convey signifi-cant information about other cells. Essentially, the cellular network appearsto morph and evolve fluidly in response to anti-terrorist activity[32].
This leads to a hypothesis that cells throughout the network contain struc-turally equivalent[17] and essential roles, such as ideological or charismaticleaders, strategic leaders, resource concentrators and specialized experts.
Given this hypothesis, one can further reason that operations of a partic-ular cell will be affected in a negative way by the removal of an individualfilling one of these roles. I further posit that a further development of a cellu-lar network formalism as an empirically driven and yet mathematically soundconcept, is necessary for creation of computational models that combine facevalidity towards real-world data as well as veridicality towards formal modelsof organizational evolution.
6
4 Open-Source Data on Terrorist Networks
Social network datasets were extremely difficult to obtain and limited in sizeand scope, until recently. The prevailing methodology for collecting socialnetwork data was by survey, either administered to an entire group of peopleor collected in a snowball fashion. Collection of social network data was donein a way reminiscent of anthropological data collection - by a human observerembedded into an organization to be studied.
This presented a number of problems. First of all, it was very costlyto collect all but the smallest of datasets. While a number of samplingstrategies were investigated, it was difficult or infeasible to canvass a largerorganization or population. Furthermore, presence of an observer or a surveyinstrument in an organization inevitably altered the behaviour of individualsin the organization.
Finally, for some networks, especially terrorist networks, it is physicallyimpossible to collect a dataset via direct survey administration. The modusoperandi of such networks is covertness and this necessarily limits the datathat can be collected on them.
Thus, for study of terrorist organizations, one must obtain informationvia indirect means. One approach to gathering indirect social network datais via analysis of texts. Originally used as manual coding technique, textanalysis has now been automated to extract network structure from corporaof text based on co-appearance of people, organizations and other entities.An example of such text coding is the representation of the Hamas net-work (figure 1), extracted by AutoMap from a set of documents describingorganizational structure and operational constraints of the Hamas terroristorganization.
Between September 14, 2001 and November, 2001 Valdis Krebs[25] assem-bled a corpus of texts regarding events preceding September 11th attacks.Manual analysis of these texts yielded a dataset which became one of thedefinitive sources of data on terrorist organizations and structure of a terror-ist plot.
Since 2001, much larger datasets on covert networks are available due toboth increased interest in the research and improvements in tools for machinecollection of network data.
Some of the newer more complete datasets include these collected byIntelCenter[23], R. Renfro[29] and M. Sageman[32]
In the aftermath of the September 11th attacks, it was noted that coher-
7
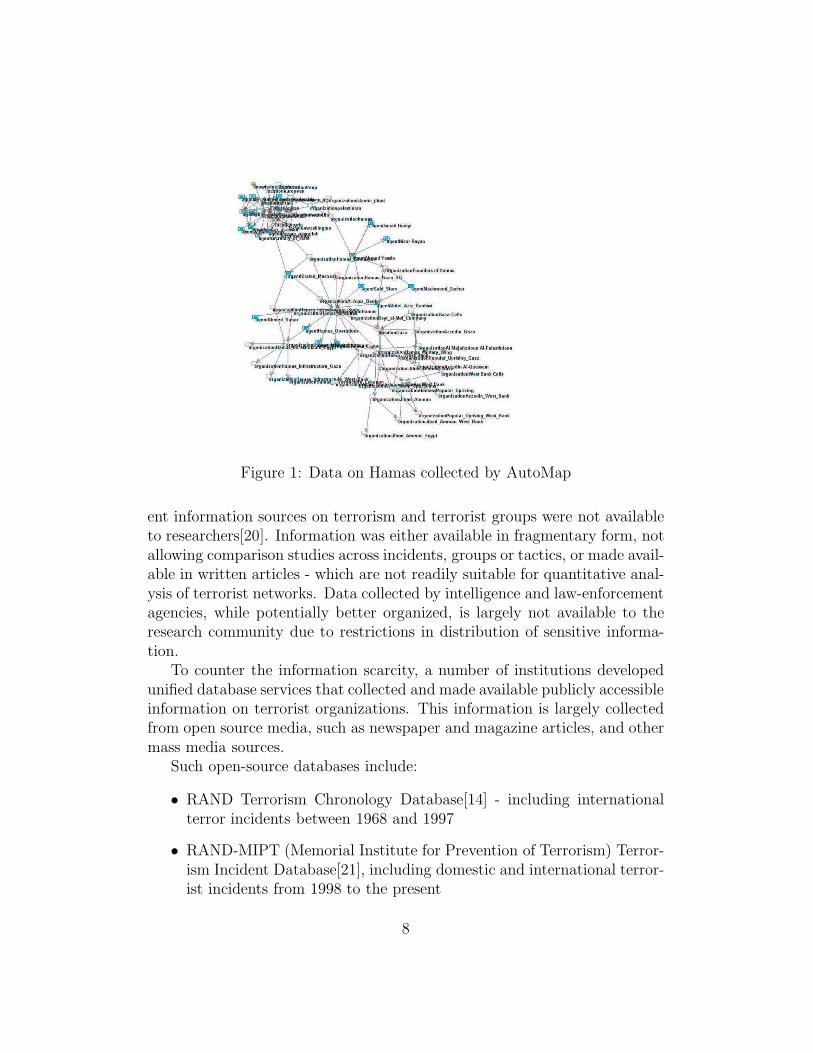
Figure 1: Data on Hamas collected by AutoMap
ent information sources on terrorism and terrorist groups were not availableto researchers[20]. Information was either available in fragmentary form, notallowing comparison studies across incidents, groups or tactics, or made avail-able in written articles - which are not readily suitable for quantitative anal-ysis of terrorist networks. Data collected by intelligence and law-enforcementagencies, while potentially better organized, is largely not available to theresearch community due to restrictions in distribution of sensitive informa-tion.
To counter the information scarcity, a number of institutions developedunified database services that collected and made available publicly accessibleinformation on terrorist organizations. This information is largely collectedfrom open source media, such as newspaper and magazine articles, and othermass media sources.
Such open-source databases include:
• RAND Terrorism Chronology Database[14] - including internationalterror incidents between 1968 and 1997
• RAND-MIPT (Memorial Institute for Prevention of Terrorism) Terror-ism Incident Database[21], including domestic and international terror-ist incidents from 1998 to the present
8
• MIPT Indictment Database[33] - Terrorist indictments in the UnitedStates since 1978.
Both RAND and MIPT databases rely on publicly available informa-tion from reputable information sources, such as newspapers, radio andtelevision.
• IntelCenter Database (ICD)[22] includes information on terrorist inci-dents, groups and individuals collected from public sources, includingnot only traditional media outlets and public information (such as in-dictments), but also information learned from Middle East-based newswire services. Separately, IntelCenter also collects information fromArabic chat-rooms and Internet-based publications - although value ofsuch data is questionable and data may be tainted by propaganda.
9
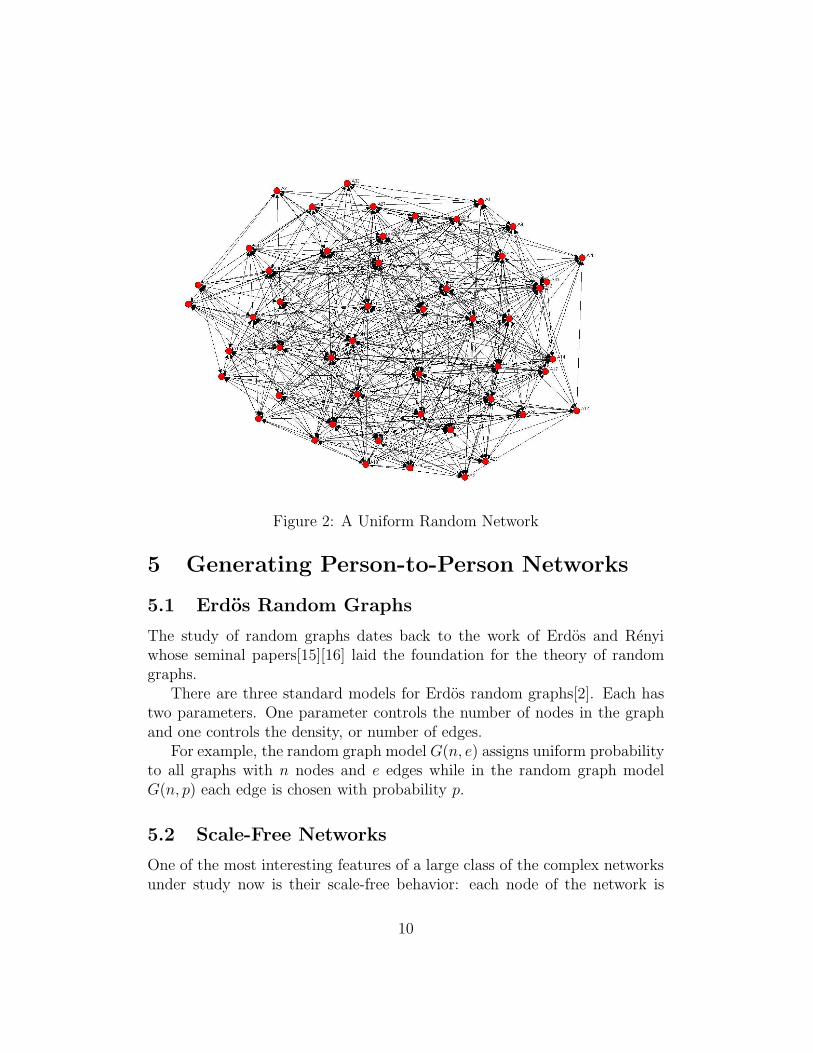
Figure 2: A Uniform Random Network
5 Generating Person-to-Person Networks
5.1 Erdos Random Graphs
The study of random graphs dates back to the work of Erdos and Renyiwhose seminal papers[15][16] laid the foundation for the theory of randomgraphs.
There are three standard models for Erdos random graphs[2]. Each hastwo parameters. One parameter controls the number of nodes in the graphand one controls the density, or number of edges.
For example, the random graph model G(n, e) assigns uniform probabilityto all graphs with n nodes and e edges while in the random graph modelG(n, p) each edge is chosen with probability p.
5.2 Scale-Free Networks
One of the most interesting features of a large class of the complex networksunder study now is their scale-free behavior: each node of the network is
10
21 25 29 33 37 41 45 49 530.00
0.01
0.02
0.03
0.04
0.05
0.06
0.07
0.08
0.400 0.829 1.257 1.686 2.114 2.543 2.971 3.4000.00
0.22
0.44
0.66
0.88
1.10
(a) (b)
56 58 60 62 64 66 680.000
0.021
0.042
0.063
0.084
0.105
0.126
0.147
0.168
0.189
0.210
11 13 15 17 19 21 23 25 27 290
1
2
3
4
5
6
(c) (d)
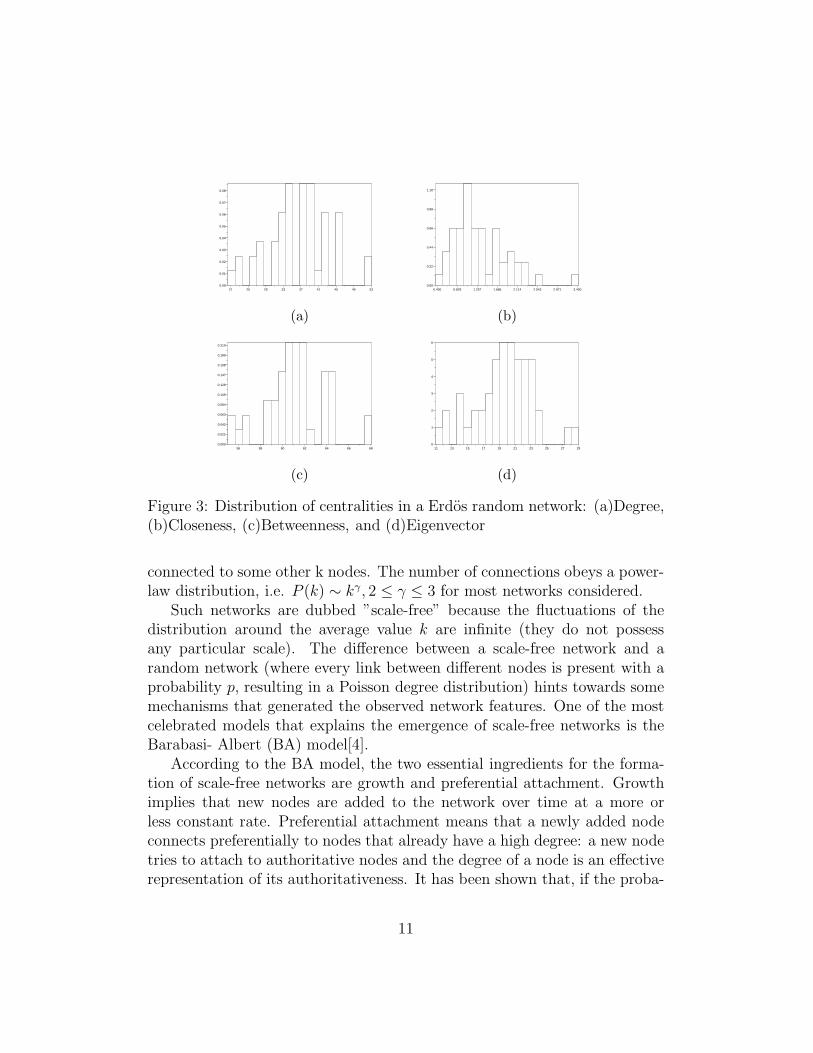
Figure 3: Distribution of centralities in a Erdos random network: (a)Degree,(b)Closeness, (c)Betweenness, and (d)Eigenvector
connected to some other k nodes. The number of connections obeys a power-law distribution, i.e. P (k) ∼ kγ, 2 ≤ γ ≤ 3 for most networks considered.
Such networks are dubbed ”scale-free” because the fluctuations of thedistribution around the average value k are infinite (they do not possessany particular scale). The difference between a scale-free network and arandom network (where every link between different nodes is present with aprobability p, resulting in a Poisson degree distribution) hints towards somemechanisms that generated the observed network features. One of the mostcelebrated models that explains the emergence of scale-free networks is theBarabasi- Albert (BA) model[4].
According to the BA model, the two essential ingredients for the forma-tion of scale-free networks are growth and preferential attachment. Growthimplies that new nodes are added to the network over time at a more orless constant rate. Preferential attachment means that a newly added nodeconnects preferentially to nodes that already have a high degree: a new nodetries to attach to authoritative nodes and the degree of a node is an effectiverepresentation of its authoritativeness. It has been shown that, if the proba-
11
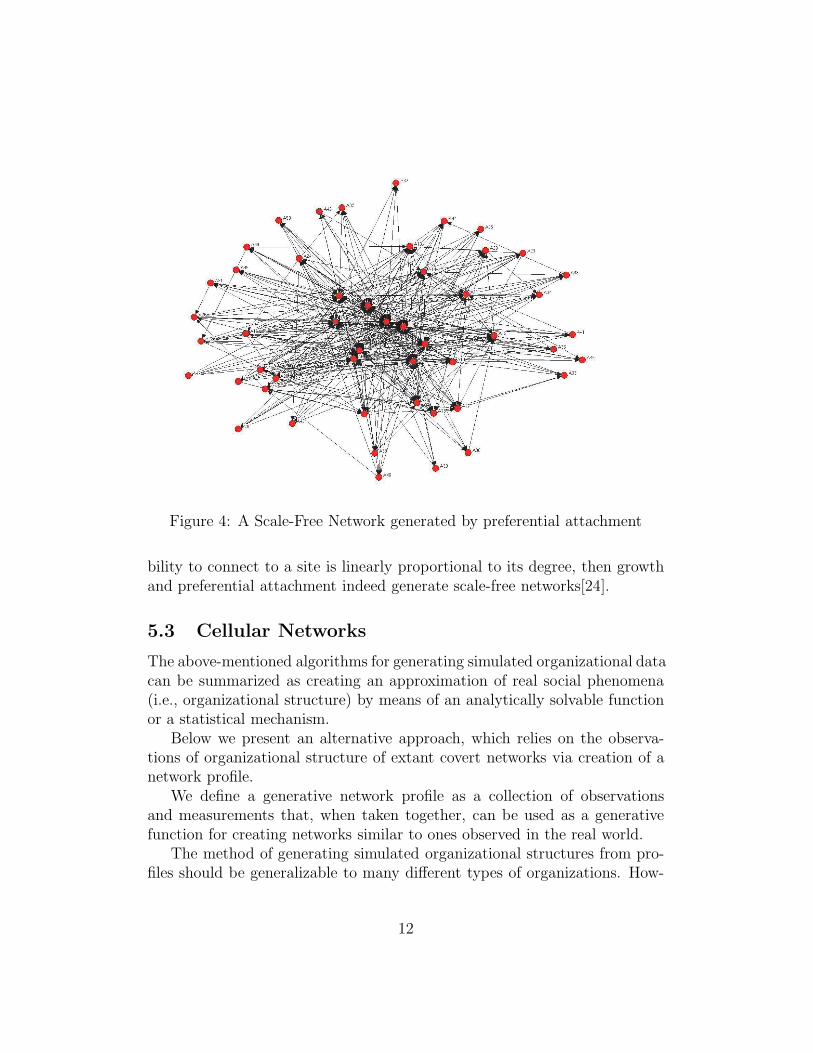
Figure 4: A Scale-Free Network generated by preferential attachment
bility to connect to a site is linearly proportional to its degree, then growthand preferential attachment indeed generate scale-free networks[24].
5.3 Cellular Networks
The above-mentioned algorithms for generating simulated organizational datacan be summarized as creating an approximation of real social phenomena(i.e., organizational structure) by means of an analytically solvable functionor a statistical mechanism.
Below we present an alternative approach, which relies on the observa-tions of organizational structure of extant covert networks via creation of anetwork profile.
We define a generative network profile as a collection of observationsand measurements that, when taken together, can be used as a generativefunction for creating networks similar to ones observed in the real world.
The method of generating simulated organizational structures from pro-files should be generalizable to many different types of organizations. How-
12
10 20 30 40 50 60 70 80 90 1000
2
4
6
8
10
12
60 70 80 90 1000
2
4
6
8
10
12
14
16
18
20
(a) (b)
0.00 2.17 4.33 6.50 8.67 10.83 13.000.00
4.22
8.44
12.67
16.89
21.11
25.33
29.56
33.78
38.00
7 11 15 19 23 27 31 35 390
1
2
3
4
5
6
7
8
(c) (d)
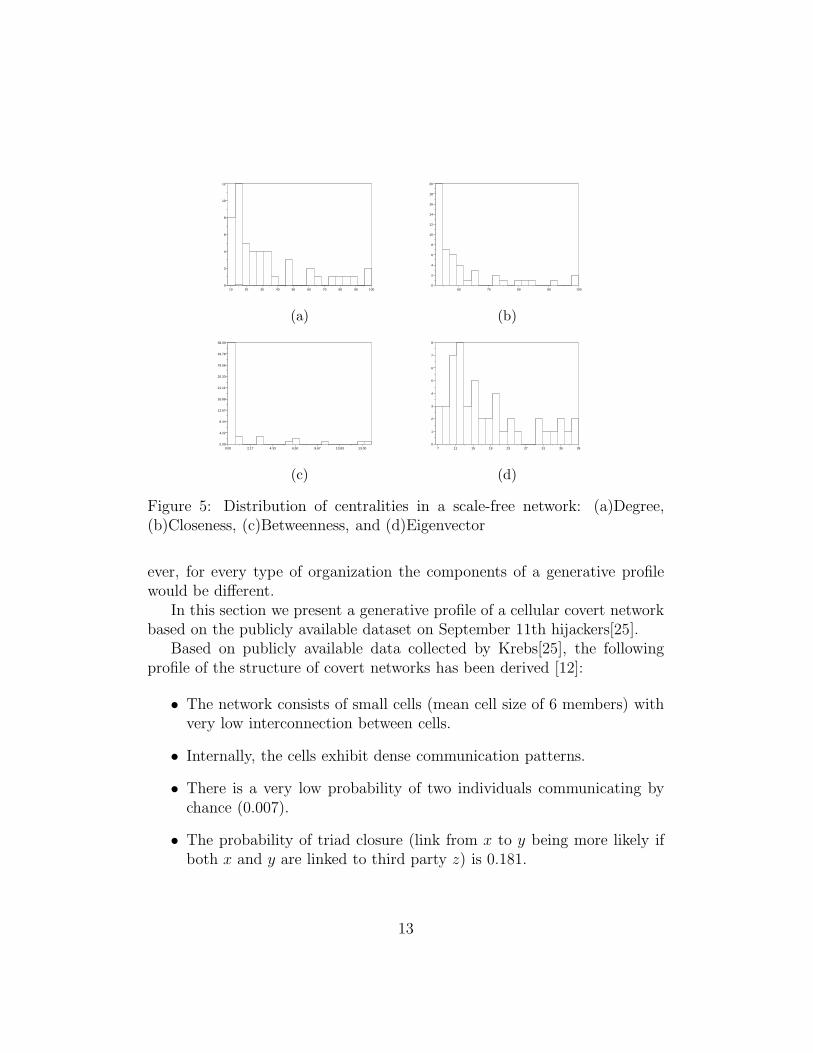
Figure 5: Distribution of centralities in a scale-free network: (a)Degree,(b)Closeness, (c)Betweenness, and (d)Eigenvector
ever, for every type of organization the components of a generative profilewould be different.
In this section we present a generative profile of a cellular covert networkbased on the publicly available dataset on September 11th hijackers[25].
Based on publicly available data collected by Krebs[25], the followingprofile of the structure of covert networks has been derived [12]:
• The network consists of small cells (mean cell size of 6 members) withvery low interconnection between cells.
• Internally, the cells exhibit dense communication patterns.
• There is a very low probability of two individuals communicating bychance (0.007).
• The probability of triad closure (link from x to y being more likely ifboth x and y are linked to third party z) is 0.181.
13
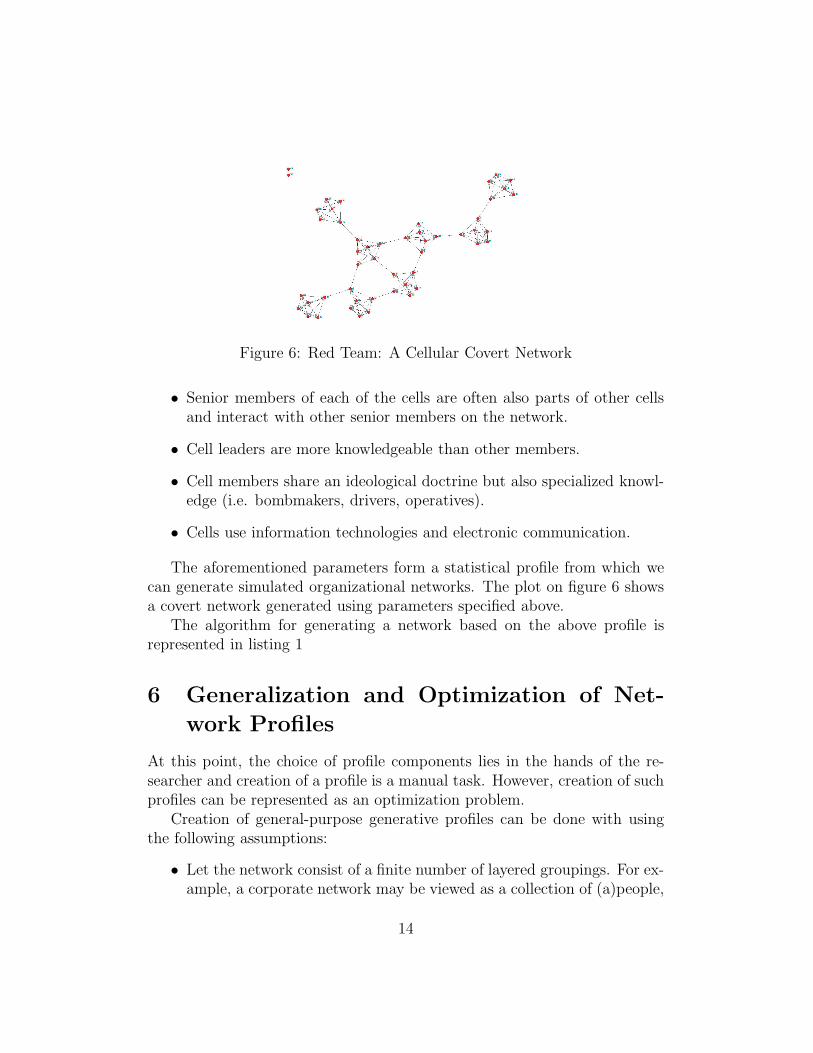
Figure 6: Red Team: A Cellular Covert Network
• Senior members of each of the cells are often also parts of other cellsand interact with other senior members on the network.
• Cell leaders are more knowledgeable than other members.
• Cell members share an ideological doctrine but also specialized knowl-edge (i.e. bombmakers, drivers, operatives).
• Cells use information technologies and electronic communication.
The aforementioned parameters form a statistical profile from which wecan generate simulated organizational networks. The plot on figure 6 showsa covert network generated using parameters specified above.
The algorithm for generating a network based on the above profile isrepresented in listing 1
6 Generalization and Optimization of Net-
work Profiles
At this point, the choice of profile components lies in the hands of the re-searcher and creation of a profile is a manual task. However, creation of suchprofiles can be represented as an optimization problem.
Creation of general-purpose generative profiles can be done with usingthe following assumptions:
• Let the network consist of a finite number of layered groupings. For ex-ample, a corporate network may be viewed as a collection of (a)people,
14

Listing 1: ”Generating Cellular Networks”� �
//Generate Ce l l sCREATE c e l l s with
c e l l s i z e ( )=normal ly d i s t r i b u t e d random va r i a b l e(mean=average c e l l s i z e , s td . dev = 0.17∗mean) ;
//Ass ign agents to c e l l sFOR a l l agents DO
c u r r e n t c e l l=random c e l lIF c u r r e n t c e l l i s not f u l l THEN
a s s i g n an agent to c u r r e n t c e l lELSE pick a new c e l l ; repeat this ope ra t i on .END IF
END FOR
// F i l l in connec t i ons i n s i d e c e l l sFOR a l l c e l l s DO
PICK a random agent i n s i d e the c e l l to s e rve as a l e ad e r
// In t e r na l l y , generate a uniform networkFOR a l l agents i n s i d e the c e l l DO
generate l i n k s with in c e l l with the g iven dens i tyEND FOR
//Bring the p r obab i l i t y o f t r i a d c l o s u r e in l i n e with themeasurements
IF p r obab i l i t y o f t r i a d c l o s u r e s i g n i f i c a n t l y l e s s then
measured va lueAdd a smal l random number o f edges ; repeat the measurements
ELSE
Drop a smal l random number o f edges ; repeat the measurementsEND IF
END FOR
FOR a l l c e l l l e a d e r s picked in pr ev ious s tepGenerate l i n k s among c e l l l e a d e r s to produce r equ i r ed in te r−
c e l l dens i tyEND FOR� �
15
3.00 7.60 12.20 16.80 21.40 26.000.0000
0.0217
0.0433
0.0650
0.0867
0.1083
0.1300
3 4 5 6 7 8 9 10 110.0
0.1
0.2
0.3
0.4
0.5
0.6
(a) (b)
0 4 8 12 16 20 24 28 320.0
0.1
0.2
0.3
0.4
0 10 20 30 400.0000
0.0214
0.0429
0.0643
0.0857
0.1071
0.1286
0.1500
(c) (d)
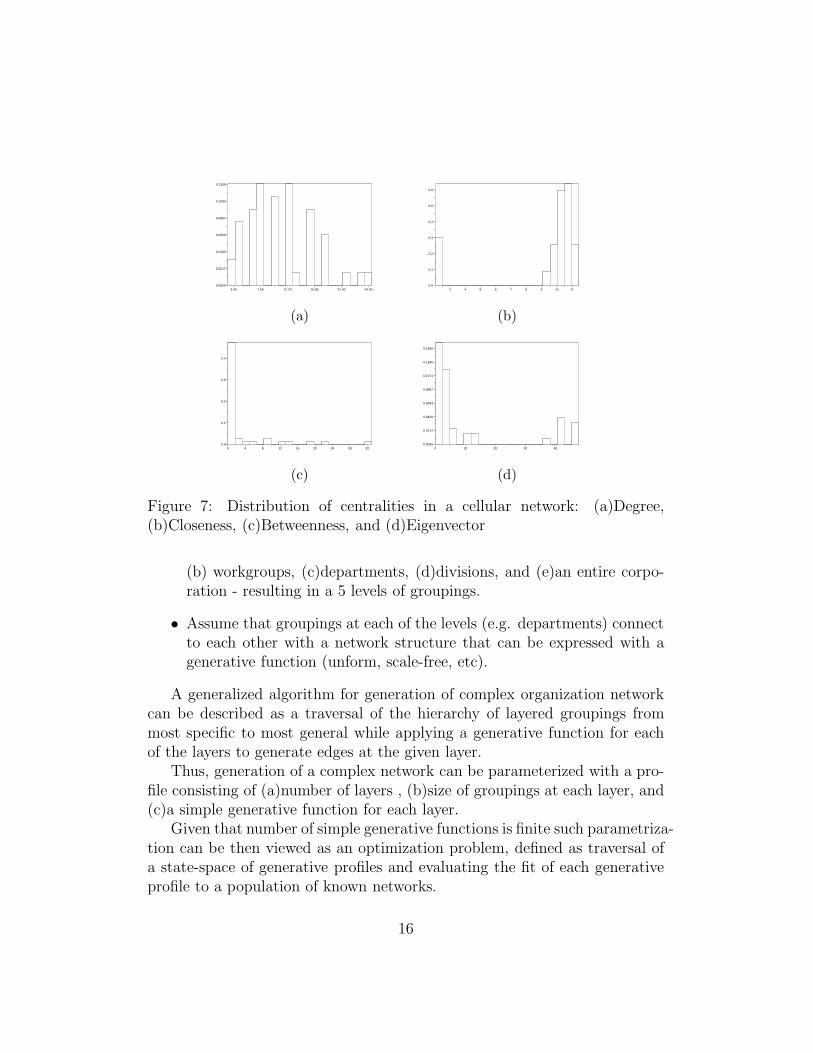
Figure 7: Distribution of centralities in a cellular network: (a)Degree,(b)Closeness, (c)Betweenness, and (d)Eigenvector
(b) workgroups, (c)departments, (d)divisions, and (e)an entire corpo-ration - resulting in a 5 levels of groupings.
• Assume that groupings at each of the levels (e.g. departments) connectto each other with a network structure that can be expressed with agenerative function (unform, scale-free, etc).
A generalized algorithm for generation of complex organization networkcan be described as a traversal of the hierarchy of layered groupings frommost specific to most general while applying a generative function for eachof the layers to generate edges at the given layer.
Thus, generation of a complex network can be parameterized with a pro-file consisting of (a)number of layers , (b)size of groupings at each layer, and(c)a simple generative function for each layer.
Given that number of simple generative functions is finite such parametriza-tion can be then viewed as an optimization problem, defined as traversal ofa state-space of generative profiles and evaluating the fit of each generativeprofile to a population of known networks.
16
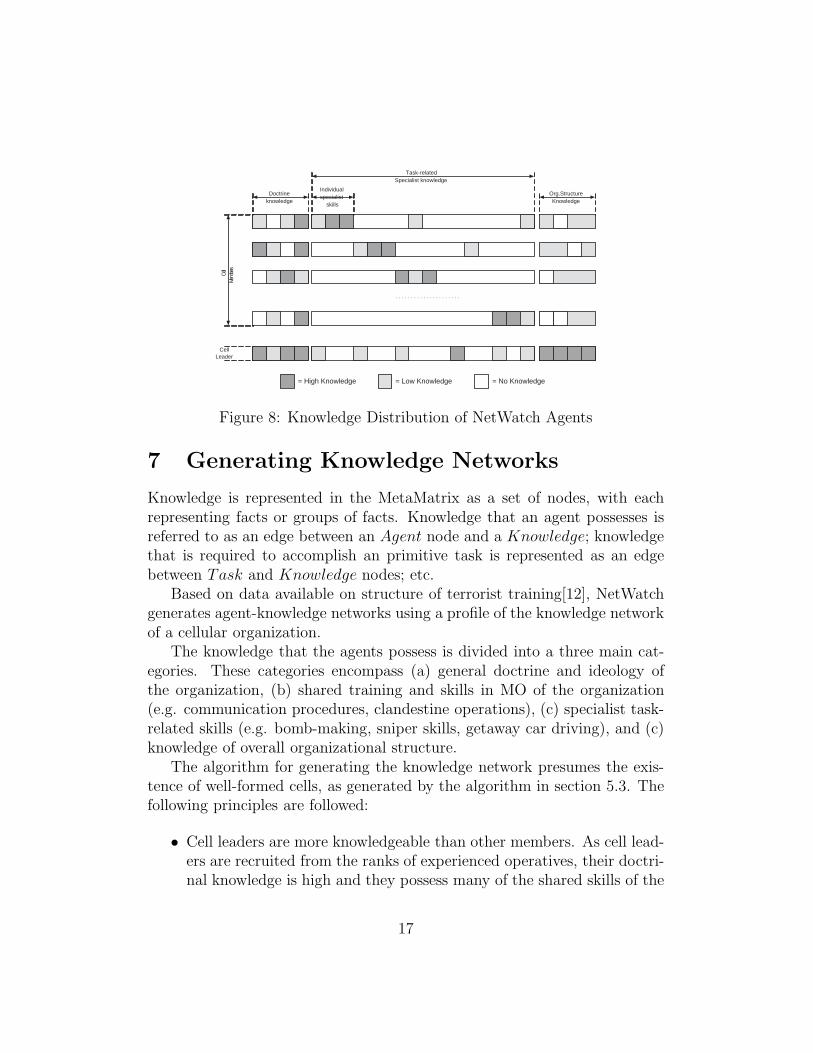
Doctrine knowledge
Individual specialist
skills
Task-related Specialist knowledge
Org.Structure Knowledge
C e
l l M
e m
b e
r s
Cell Leader
. . . . . . . . . . . . . . . . . . . . .
= High Knowledge = Low Knowledge = No Knowledge
Figure 8: Knowledge Distribution of NetWatch Agents
7 Generating Knowledge Networks
Knowledge is represented in the MetaMatrix as a set of nodes, with eachrepresenting facts or groups of facts. Knowledge that an agent possesses isreferred to as an edge between an Agent node and a Knowledge; knowledgethat is required to accomplish an primitive task is represented as an edgebetween Task and Knowledge nodes; etc.
Based on data available on structure of terrorist training[12], NetWatchgenerates agent-knowledge networks using a profile of the knowledge networkof a cellular organization.
The knowledge that the agents possess is divided into a three main cat-egories. These categories encompass (a) general doctrine and ideology ofthe organization, (b) shared training and skills in MO of the organization(e.g. communication procedures, clandestine operations), (c) specialist task-related skills (e.g. bomb-making, sniper skills, getaway car driving), and (c)knowledge of overall organizational structure.
The algorithm for generating the knowledge network presumes the exis-tence of well-formed cells, as generated by the algorithm in section 5.3. Thefollowing principles are followed:
• Cell leaders are more knowledgeable than other members. As cell lead-ers are recruited from the ranks of experienced operatives, their doctri-nal knowledge is high and they possess many of the shared skills of the
17
other agents. They also possess a small amount of knowledge in eachof the specialist areas. This knowledge is not sufficient to replace spe-cialist agents but is sufficient to proficiently delegate subtasks duringexecution of a complex operation.
• Cell members share an ideological doctrine and a modus operandi, fur-ther referred to as ”shared knowledge”. Adherence to a militant ideol-ogy is a driving factor in recruiting of operatives in terrorist organiza-tions and is further amplified during training of studies in an a militantreligious academy.
Shared M.O. skills are derived from shared training camp experiencesthat terrorist organization recruits undergo. Shared skills include com-munication procedures, clandestine operation skills, preservation of se-crecy during planning and preparation of operations.
• Cell members possess specialized knowledge that outlines their specificfunction within a cell; these facts are further referred to as ”specialistknowledge”.
• A specialized portion of the knowledge network deals with overall knowl-edge of the organizational structure and policies. This knowledge isprivileged information distributed only to cell leaders and is furtherreferred to as privileged knowledge. However, rank-and-file cell mem-bers may obtain small amounts of the privileged information throughinteraction with other agents outside the primary cell.
The algorithm that generates knowledge networks as outlined above isfairly simple. The knowledge network is divided into portions based on pur-pose of each fact(e.g. shared knowledge, specialist knowledge, privilegedknowledge)(see figure 8).
Then, for each agent ai and fact fk the algorithm generates a probabilityPi,k of existence of a an edge ai−fk based on the group that the agent belongsto (i.e. cell leader vs. rank-and-file) and what group the fact belongs to (i.e.shared, specialist or privileged).
The edges are then instantiated with a roll of the dice.
7.0.1 Algorithm Parameters
The knowledge network generator depends on the following parameters:
18
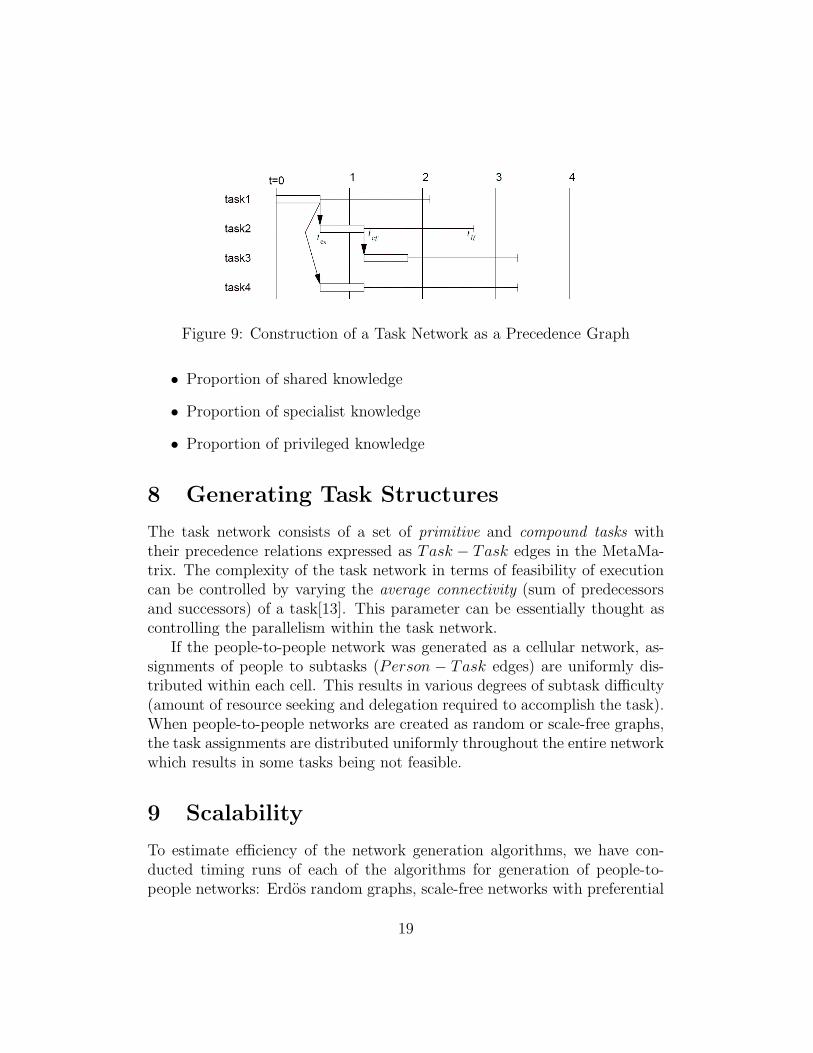
Figure 9: Construction of a Task Network as a Precedence Graph
• Proportion of shared knowledge
• Proportion of specialist knowledge
• Proportion of privileged knowledge
8 Generating Task Structures
The task network consists of a set of primitive and compound tasks withtheir precedence relations expressed as Task − Task edges in the MetaMa-trix. The complexity of the task network in terms of feasibility of executioncan be controlled by varying the average connectivity (sum of predecessorsand successors) of a task[13]. This parameter can be essentially thought ascontrolling the parallelism within the task network.
If the people-to-people network was generated as a cellular network, as-signments of people to subtasks (Person − Task edges) are uniformly dis-tributed within each cell. This results in various degrees of subtask difficulty(amount of resource seeking and delegation required to accomplish the task).When people-to-people networks are created as random or scale-free graphs,the task assignments are distributed uniformly throughout the entire networkwhich results in some tasks being not feasible.
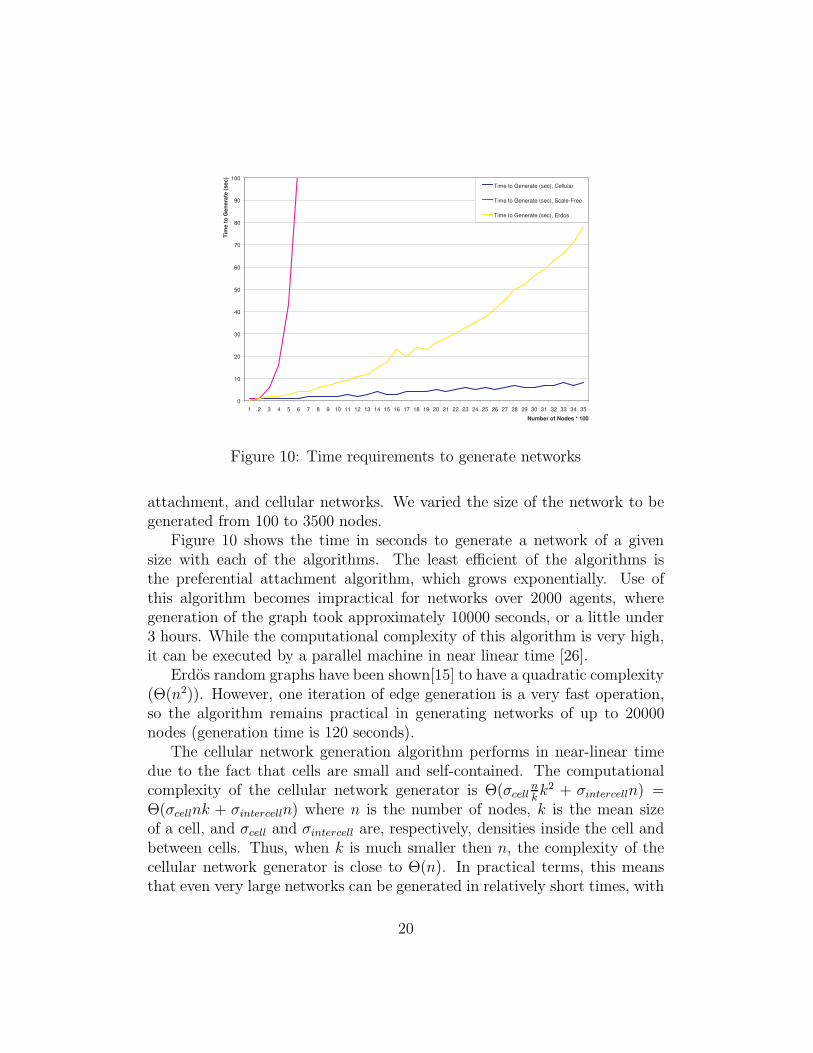
9 Scalability
To estimate efficiency of the network generation algorithms, we have con-ducted timing runs of each of the algorithms for generation of people-to-people networks: Erdos random graphs, scale-free networks with preferential
19
0
10
20
30
40
50
60
70
80
90
100
1 2 3 4 5 6 7 8 9 10 11 12 13 14 15 16 17 18 19 20 21 22 23 24 25 26 27 28 29 30 31 32 33 34 35
Number of Nodes * 100
Tim
e t
o G
en
era
te (
sec)
Time to Generate (sec), Cellular
Time to Generate (sec), Scale-Free
Time to Generate (sec), Erdos
Figure 10: Time requirements to generate networks
attachment, and cellular networks. We varied the size of the network to begenerated from 100 to 3500 nodes.
Figure 10 shows the time in seconds to generate a network of a givensize with each of the algorithms. The least efficient of the algorithms isthe preferential attachment algorithm, which grows exponentially. Use ofthis algorithm becomes impractical for networks over 2000 agents, wheregeneration of the graph took approximately 10000 seconds, or a little under3 hours. While the computational complexity of this algorithm is very high,it can be executed by a parallel machine in near linear time [26].
Erdos random graphs have been shown[15] to have a quadratic complexity(Θ(n2)). However, one iteration of edge generation is a very fast operation,so the algorithm remains practical in generating networks of up to 20000nodes (generation time is 120 seconds).
The cellular network generation algorithm performs in near-linear timedue to the fact that cells are small and self-contained. The computationalcomplexity of the cellular network generator is Θ(σcell
nkk2 + σintercelln) =
Θ(σcellnk + σintercelln) where n is the number of nodes, k is the mean sizeof a cell, and σcell and σintercell are, respectively, densities inside the cell andbetween cells. Thus, when k is much smaller then n, the complexity of thecellular network generator is close to Θ(n). In practical terms, this meansthat even very large networks can be generated in relatively short times, with
20
a 20,000 node network taking less then 20 seconds to generate.
10 Conclusion
All of the network generation algorithms described above are used as a meansof testing NetWatch, a large-scale multi-agent simulation of covert networks.
While realism of data generated by any of these algorithms can be dis-puted and nothing is more realistic then empirical data, the use of diversetechniques for generating initial data allows the simulation researcher to testthe multi-agent system on networks of widely varying sizes and topologies.Due to small quantities of available empirical data, this is currently not pos-sible to do without resorting to artificially generated data.
This report is not comprehensive in regards to generation of all possiblenetwork topologies. In this work, we did not consider small-world networks,as generation of small-world topologies is addressed well in [27] and [37].Further, we did not consider issues of generating hierarchical networks.
In the field of modeling social and organizational networks, it is importantto address organizations as comprehensive network structures, incorporatingstructures of task interdependency, information and resource requirementsas well as person-to-person structures. This comprehensive approach wouldallow modeling organizations based on their form, e.g. departmental, func-tional, or matrix organizations.
While the generalized generative approach described in section 6 allowsfor wide flexibility in the topology of generated networks, it is not designedfor modeling organically emerging network forms, such as these of markets.For example, market-driven network may exhibit emergent segmentationprocesses[36], which, due to the complexity of the market process, can beonly generated via simulation of the market environment.
As a software engineering tool, the network generation package providesa consistent interface to all of its generation functions - therefore enablingthe user (e.g. NetWatch) to test performance of the simulation tools on awide variety of source networks. This also forces the simulation to remainindependent of the initial network topology and thus allow for multi-theorytesting of simulation tools.
21
References
[1] Al-Quaeda. Al quaeda training manual: Declaration of jihad against un-holy tyrants. URL: http://www.usdoj.gov/ag/trainingmanual.htm,2001.
[2] N. Alon and J. H. Spencer. The Probabilistic Method. Wiley and Sons,New York, 1992.
[3] A. Barabasi. Linked: The New Science of Networks. Perseus Publishing,Cambridge, 2002.
[4] Albert-Laszlo Barabasi and Reka Albert. Emergence of scaling in ran-dom networks. Science, 286(5439):509–512, Oct 1999.
[5] P. Biernacki and D. Waldorf. Snowball samplong. problems andtechniques of chain referral sampling. Sociological Methods Research,10(2):141–163, 1981.
[6] S. Borgatti, K.M. Carley, and D. Krackhardt. On the robust-ness of centrality measures under conditions of imperfect data.http://www.casos.cs.cmu.edu/publications/papers/CentralityRobustness5b.pdf,2004.
[7] Kathleen M. Carley. Dynamic Network Analysis, pages 133–145. Dy-namic Social Network Modeling and Analysis: Workshop Summary andPapers. Comittee on Human Factors and National Research Council,ronald breiger and kathleen m. carley and philippa pattison, (eds.) edi-tion, 2003.
[8] Kathleen M. Carley. Dynamic network analysis. In K. Carley R. Breigerand P. Pattison, editors, Dynamic Social Network Modeling and Anal-ysis: Workshop Summary and Papers, pages 361–370. Committee onHuman Factors, National Research Council, 2003.
[9] Kathleen M. Carley. Linking capabilities to needs. In K. CarleyR. Breiger and P. Pattison, editors, Dynamic Social Network Modelingand Analysis: Workshop Summary and Papers, pages 361–370. Com-mittee on Human Factors, National Research Council, 2003.
22
[10] Kathleen M. Carley, Matthew Dombroski, Maksim Tsvetovat, JeffreyReminga, and Natasha Kamneva. Destabilizing dynamic covert net-works. Proceedings of the 8th International Command and Control Re-search and Technology Symposium, 2003.
[11] Kathleen M. Carley, Jeffrey Reminga, and Steve Borgatti. Destabilizingdynamic networks under conditions of uncertainty. In IEEE KIMAS,Boston, MA, 2003.
[12] K.M. Carley, J.S. Lee, and D. Krackhardt. Destabilizing networks. Con-nections, 24(3):79–92, 2002.
[13] John Collins, Maksim Tsvetovat, Bamshad Mobasher, and Maria Gini.Magnet: A multi-agent contracting system for plan execution. In Pro-ceedings of SIGMAN 98, 1998.
[14] RAND Corporation. Purpose and description of information found inthe incident databases, 2003. http://www.tkb.org/RandSummary.jsp.
[15] Erdos and Renyi. On the evolution of random graphs. Publication ofMathematics Institute of Hungian Academy of Sciences, 5:1761, 1960.
[16] Erdos and Renyi. On the strength of connectedness of random graphs.Acta Math. Acad. Sci. Hungar, 12:261–267, 1961.
[17] F.Lorrain and H.C. White. Structural equivalence of individuals in socialnetworks. Journal of Mathematical Sociology, 1, 1971.
[18] Rebecca Goolsby. Combating terrorist networks: An evolutionary ap-proach. In Proceedings of the 8th International Command and ControlResearch and Technology Symposium. Conference held at National De-fence War College Washington DC, Evidence Based Research ViennaVA, 2003.
[19] M. Granovetter. Network sampling: Some first steps. American Journalof Sociology, 81:1267–1303, 1976.
[20] Le Gruenwald, Gary McNutt, and Adrien Mercier. Using an ontology toimprove search in a terrorism database system. Proceedings of the 14thInternational Workshop on Database and Expert System Applications(DEXA’03), 2003.
23
[21] Brian Houghton. Understanding the terrorism database. NationalMemorial Institute for Prevention of Terrorism Quarterly Bulletin, 2002.
[22] IntelCenter. Intelcenter database (icd), 2005.http://www.intelcenter.com/icd/index.html.
[23] IntelCenter.com. Mapping al-qaeda v1.0. www.intelcenter.com, 2003.
[24] P. L. Krapivsky, S. Redner, and F. Leyvraz. Connectivity of growingrandom networks. Physics Review Letters, 85:4629–4632, 2000.
[25] Valdis E. Krebs. Mapping networks of terrorist cells. Connections,24(3):43–52, 2001.
[26] Benjamin Machta and Jonathan Machta. Parallel dynamics and com-putational complexity of network growth models. Physical Review E(Statistical, Nonlinear, and Soft Matter Physics), 71(2):026704, 2005.
[27] M. E. J. Newman, C. Moore, and D. J. Watts. Mean-field solution of thesmall-world network model. Physics Review Letters, 84(14):32013204,2000.
[28] Romualdo Pastor-Satorras and Alessandro Vespignani. Epidemicspreading in scale-free networks. Physics Review Letters, 86(14), april2001.
[29] Robert S. Renfro. Modelling and Analysis of Social Networks. PhDthesis, Department of Air Force, Air Force Institute of Technology, 2003.
[30] John Robb. Scale-free terrorist networks. Jef Allbrights Web Files; URL:www.jefallbright.net/node/view/2632, 2004.
[31] Richard Rothenberg. From whole cloth: Making up the terroristnetwrok. Connections, 24(3):36–42, 2002.
[32] M. Sageman. Understanding Terror Networks. University of Pennsylva-nia Press, 2004.
[33] Brent L. Smith and Kelly R. Damphousse. The american terrorismstudy: Indictment database, 2002.
24
[34] M. Tsvetovat and K.M. Carley. Modeling complex socio-technical sys-tems using multi-agent simulation methods. Kunstliche Intelligenz (Ar-tificial Intelligence Journal), Special Issue on Applications of IntelligentAgents(2), 2004.
[35] Maksim Tsvetovat and Kathleen M. Carley. Structural knowledge andsuccess of anti-terrorist activity: The downside of structural equivalence.Journal of Social Structure (www.joss.org), forthcoming, 2005.
[36] Maksim Tsvetovat, Kathleen M. Carley, and Katia Sycara. Specialists,generalists and emergent market segmentation: a multi-agent model.Journal of Computational and Mathematical Organizational Theory,(8):221–234, 2002.
[37] D. J. Watts and S. H. Strogatz. Collective dynamics of ’small-world’networks. Nature, (393):440–442, 1998.
25
![arXiv:1907.01481v5 [cs.CV] 12 Apr 202010 different users. In comparison, existing datasets have several limitations: The 3D objects are very simple, the interaction is not realistic,](https://img.pdfslide.us/doc/110x75/5f23e9494f22633936206734/arxiv190701481v5-cscv-12-apr-2020-10-different-users-in-comparison-existing.jpg)


![E cient Logistic Regression on Large Encrypted Data · realistic settings [GLN12,KSK+18] where only small-size training datasets over a small number of features are considered; or,](https://img.pdfslide.us/doc/110x75/5ba019dd09d3f2385c8ce730/e-cient-logistic-regression-on-large-encrypted-data-realistic-settings-gln12ksk18.jpg)

![[casos.cs.cmu.edu]casos.cs.cmu.edu/publications/papers/CMU-ISR-12-112.pdfConstruct User Guide . Kathleen M. Carley, David T. Filonuk, Kenny Joseph, Michael Kowalchuck, Michael J. Lanham,](https://img.pdfslide.us/doc/110x75/5afb3eec7f8b9ae92b8ecc64/casoscscmueducasoscscmuedupublicationspaperscmu-isr-12-112pdfconstruct.jpg)